CHAPTER 2 2 Women on Boards 2.1 MEN STILL DOMINATE BOARDS .................................................... 13 2.2 WHY SO FEW WOMEN?................................................................... 14 2.2.1 Demand Barriers ........................................................................... 14 2.2.2 Supply Barriers ............................................................................. 16 2.3 WHY WE NEED WOMEN ON BOARDS........................................... 17 2.4 GENDER DIVERSITY—ON THE MOVE ........................................... 19 2.4.1 More the Merrier .......................................................................... 24 2.5 WOMEN IN THE LEAD ..................................................................... 28 2.6 BRIDGING THE GAP ......................................................................... 28 2.7 TOWARD A BROADER BASE ........................................................... 31 NOTES........................................................................................................ 32 ABBREVIATIONS ...................................................................................... 32 REFERENCES ............................................................................................. 32 Although women have become significant contributors to the economy, there are very few women leading companies as board members. This chapter examines the reasons for the small number of women on boards and elucidates why it is important to have women as an integral part of boards. 2.1 MEN STILL DOMINATE BOARDS Women in the United States make up 47.3% [1] of the labor force and 51.4% [2] of management, professional, and related positions, yet only 15.7% [2] of board members are women. Australian women comprise 50.2% of the population, nearly 50% of the workforce, 56% of all high- er education students, and 55% of all university graduates, yet form only 12.5% of directors of Australia’s top 200 companies [3]. Globally 9.8% [4] of directors are women, with only 58.3% [4] of all companies having a female on board. Women have climbed Mt. Everest and
Transcript
CHAPTER 22Women on Boards
2.1 MEN STILL DOMINATE BOARDS.................................................... 13
2.2 WHY SO FEW WOMEN?................................................................... 14
Although women have become significant contributors to the economy,there are very few women leading companies as board members. Thischapter examines the reasons for the small number of women on boardsand elucidates why it is important to have women as an integral partof boards.
2.1 MEN STILL DOMINATE BOARDS
Women in the United States make up 47.3% [1] of the labor force and51.4% [2] of management, professional, and related positions, yet only15.7% [2] of board members are women. Australian women comprise50.2% of the population, nearly 50% of the workforce, 56% of all high-er education students, and 55% of all university graduates, yet formonly 12.5% of directors of Australia’s top 200 companies [3]. Globally9.8% [4] of directors are women, with only 58.3% [4] of all companieshaving a female on board. Women have climbed Mt. Everest and
travelled to the moon, but when it comes to boardrooms, they are fewand far between. Discrimination against women as corporate leaders,even in the most progressive of countries, is evidenced by the graph(Figure 2.1). Boards still recently were considered a “boys’ club,” withmore than 40% of companies still having an all-male board. Acrosscontinents, the representation of women on boards is far fromacceptable. Although in four European countries (Norway, Sweden,Finland, and France) women occupy more than 20% of the seats, inother countries including the United States, UK, Germany, and NewZealand, women representation on boards is only between 8% and16%. These countries are in the list of top 25 countries (Figure 2.1).The proportion of women in developed economies like Japan (0.9%),UAE (1.2%), and the BRIC nations—Brazil (5.1%), Russia (5.9%),and India (4.8%)—is minimal. Several countries such as Peru andMorocco have only all-male boards (Figure 2.2).
2.2 WHY SO FEW WOMEN?
2.2.1 Demand BarriersThe bias or prejudice against women that they cannot perform as wellas men in top-level corporate jobs is probably the single most impor-tant reason for boards still remaining male dominated. Described asthe glass ceiling effect, it constitutes an invisible barrier that womenface in the path to the top. It is “the unseen, yet unbreachable barrierthat keeps. . . women from rising to the upper rungs of the corporateladder, regardless of their qualifications or achievements” [5]. It indi-cates a gender inequality that is greater at higher levels compared tolower levels, blocking the advancement of women to positions ofpower or prestige, particularly in the corporate world. Although gen-der discrimination is unlawful in India, the United States, and mostdeveloped countries, it still occurs in different dimensions of society.Women are simply not considered for a position on the board.Exclusion from the “boys’ club” is one of the biggest issues faced bywomen. “Those individuals (men) who occupy the top positions have astake in maintaining traditional rules and procedures related to hiring,promotion, seniority, and other personnel practices, that work to theiradvantage and exclude others” [6]. This is a manifestation of “con-scious and unconscious stereotyping, prejudice, and bias related to gen-der” [7]. According to Ann Morrison [8], of all the barriers tocorporate advancement identified, it is prejudice that tops the list, the
14 Diversity and the Effective Corporate Board
prejudgment that someone “different,” such as a female executive, isless able to do the job.
Women are by and large offered lower-paying jobs. Women withequivalent or even higher qualifications, talent, and experience thantheir male competitors are generally not even regarded as a possiblechoice for senior management positions. In addition, companies per-ceive women executives to be less committed to the company and theirown career growth. Developing women for high-level positions is
Norway
Sweden
Finland
France
USA
South Africa
Isreal
UK
Denmark
Australia
Canada
Philippines
Germany
Poland
Turkey
Ireland
NewZealand
Netherlands
Spain
Greece
Thailand
Switzerland
HongKnog
Columbia
CzechRepublic 8.30%
8.50%
8.60%
8.70%
8.70%
8.80%
9.20%
9.20%
9.32%
9.5%
10.80%
10.80%
11.20%
11.60%
12.90%
13.80%
13.90%
14.20%
15%
15.80%
16.20%
20.80%
24.50%
27.30%
35.60%
Europe Asia Nort America South America Australia Africa
Fig. 2.1. Women on Boards � Top 25 countries. Source: Developed by the authors.
15Women on Boards
considered a risky investment that may be lost if they leave to meetfamily responsibilities.
2.2.2 Supply BarriersThe biggest supply barrier to female directors is a paucity of qualifiedwomen with the necessary professional knowledge and skills. Inflexibleand long work schedules and excessive travel often restrict women inthe pursuit of career advancement. The small number of women withexperience at a senior level shrinks the population from which to selectfemale board members. As women have only recently made an
7.50%
6.10%
5.90%
3.70%
2.30%
7.60%
6.90%
6.50%
4.80%
4.50%
2.70%
2.30%
1.90%
1.20%
1.00%
0.90%
0.60%
0.30%
0.10%
6.80%
5.10%
1.90%
0%
6.70%
0%
Malaysia
Austria
Singapore
Mexico
Egypt
Taiwan
Hungary
Russia
Brazil
India
Indonesia
Italy
Kuwait
Portugal
Oman
South Korea
Chile
UAE
Bahrain
Japan
Abu Dhabi
Qatar
Saudi Arabia
Peru
MoroccoAfrica
Australia
South America
North America
Asia
Europe
Fig. 2.2. Women on Boards: Bottom 25 Countries. Source: Developed by the authors.
16 Diversity and the Effective Corporate Board
appearance in senior management positions, there are hardly anywomen with the necessary experience to join boards.
Women often do not have mentors to guide them or role models toemulate. Men avoid mentoring women out of fear that their relation-ship will be considered personal, and there are simply not enoughwomen at the top to mentor female board aspirants.
2.3 WHY WE NEED WOMEN ON BOARDS
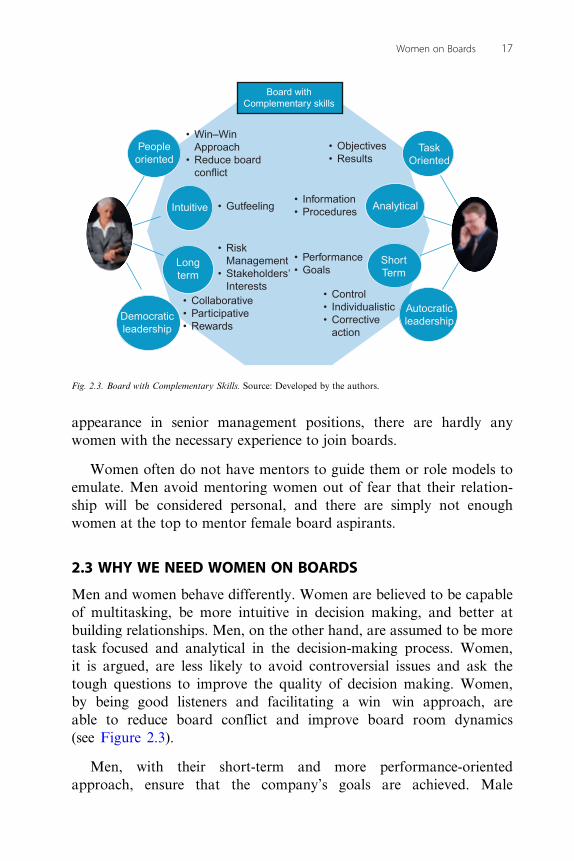
Men and women behave differently. Women are believed to be capableof multitasking, be more intuitive in decision making, and better atbuilding relationships. Men, on the other hand, are assumed to be moretask focused and analytical in the decision-making process. Women,it is argued, are less likely to avoid controversial issues and ask thetough questions to improve the quality of decision making. Women,by being good listeners and facilitating a win�win approach, areable to reduce board conflict and improve board room dynamics(see Figure 2.3).
Men, with their short-term and more performance-orientedapproach, ensure that the company’s goals are achieved. Male
Board withComplementary skills
• Win–Win Approach• Reduce board conflict
• Objectives• Results
• Information• Procedures
• Performance• Goals
• Gutfeeling
• Risk Management• Stakeholders’ Interests
• Collaborative• Participative• Rewards
• Control• Individualistic• Corrective action
Peopleoriented
TaskOriented
Analytical
ShortTerm
Autocraticleadership
Intuitive
Longterm
Democraticleadership
Fig. 2.3. Board with Complementary Skills. Source: Developed by the authors.
17Women on Boards
directors with an autocratic leadership style are able to exercise bettercontrol on management. The democratic leadership style of womenencourages multiple views from different stakeholders. By their cooper-ative approach and long-term perspective, women directors are able tobuild positive and lasting relationships with management, customers,shareholders, and other stakeholders, thereby helping boards managerisk and be socially more responsible.
Gender diversity (equal proportion of females to males) has a posi-tive effect on boards. The McKinsey report, Women Matter 2 [9],found that women are more likely to apply leadership behaviorsinvolving people development, expectations and rewards, and rolemodeling that have a positive effect on organizational performance.Men, on the other hand, adopt individualistic decision making andcontrol, and corrective action leadership behaviors.
Women are increasingly becoming a major driver of the economy,both as contributors and as customers; it is appropriate that they be apart of the team leading companies. In the United States, women arethe economic powerhouse, influencing 95% [10] of all products and ser-vices sold. Women currently drive 70% of purchasing decisions inEurope, even though they account for only 51% of population [11].Women now form 51% of the UK population and 46% of the econom-ically active workforce [12]. They are estimated to be responsible forabout 70% [12] of household purchasing decisions. Women are becom-ing influential even in traditionally male-dominated areas such as thebuying of cars. Thus, women are likely to better understand consumerbehavior, the needs of different segments, and identifying opportunitiesfor companies in satisfying these needs. Having women as board mem-bers can result in new products, a larger customer base, and highercustomer satisfaction, translating into greater market share and moreearnings.
Female directors are believed to be better at monitoring. By notbeing one of the “old boys,” they are likely to be more independent.Women board members are known to have better attendance records,forcing improved attendance by men.
Boards with more women members act as a motivator to otherwomen employees within the organization. Female directors are ableto create a more women-friendly work environment in the
18 Diversity and the Effective Corporate Board
company, reducing gender discrimination and the incidence of sexualharassment.
Evidence shows that increased participation of women on boardsenhances corporate performance. In 2004 [13] and 2007 [14], theU.S.-based business, Catalyst, reported that boards with the mostfemale representatives outperformed those with the least womenrepresentation in terms of return on equity, return on sales, andreturn on capital employed. The Reibey Institute of Australia in June2011 [15] found that over three- and five-year periods, ASX500 com-panies with women directors delivered significantly higher return onequity (ROE) than those companies without any women on theirboards.
Reputation and investor confidence may improve with the additionof women to a company’s board. Institutional investors such asCalPERS (USA) and Amazone (Europe) are giving weight to genderdiversity in their investment selections. Rating agencies such asInnovest and Vigeo are also adding gender diversity as a criterion toevaluate organizational excellence and corporate governance.
Companies are facing a huge talent crunch that goes right up to theboard level. Broadening the talent pool by including women directorswill help boards get skilled and competent members with a diversity ofperspectives and leadership styles, who can significantly contribute toboard performance.
2.4 GENDER DIVERSITY—ON THE MOVE
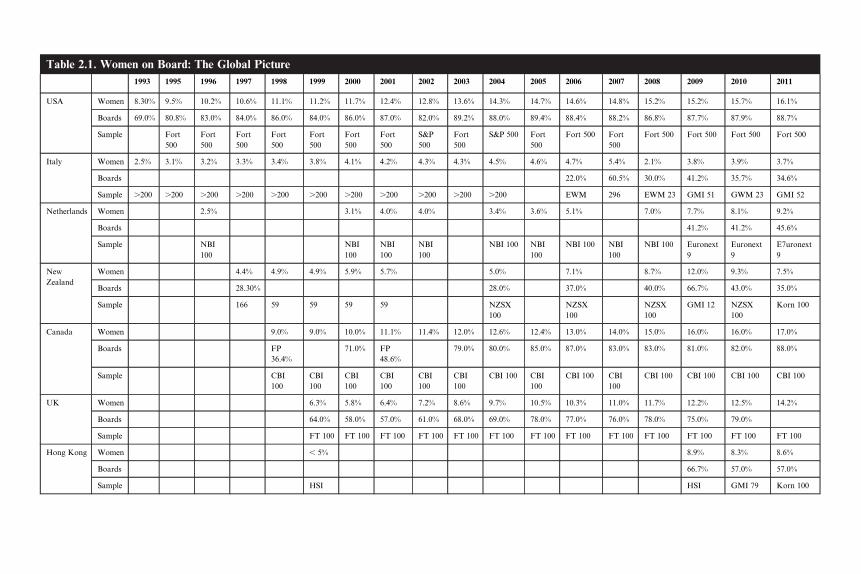
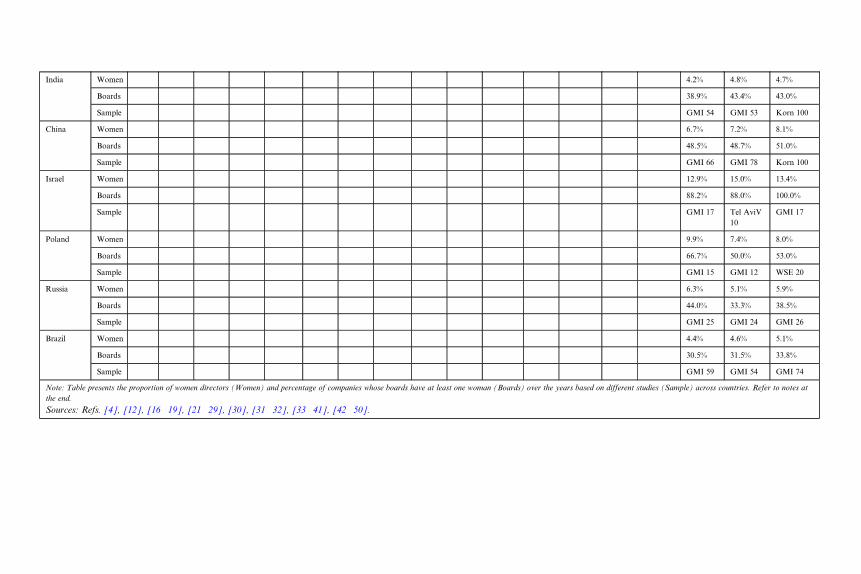
The ratio of women directors has been increasing slowly but steadily overthe years. Globally, the percentage of women on boards has increasedfrom 9.2% [16] in 2009 to 9.6% [4] in 2011, with 58% [4] of boards nowhaving at least one female director. The increase in participation ofwomen on boards has been more pronounced in Europe, from 5% in 2001[17] to 8% in 2004 [18] to 9.7% in 2008 [19] to 12% [20] in 2011. There hasbeen a steady increase in gender diversity, with participation of women onboard almost doubling in the last two decades. In countries such as theUK, United States, Canada, Norway, Finland, Sweden, and Switzerland,80�90% of boards have at least one female member. Asian countries suchas India and Singapore have yet to cross the 50% mark (see Table 2.1).
19Women on Boards
Table 2.1. Women on Board: The Global Picture1993 1995 1996 1997 1998 1999 2000 2001 2002 2003 2004 2005 2006 2007 2008 2009 2010 2011
USA Women 8.30% 9.5% 10.2% 10.6% 11.1% 11.2% 11.7% 12.4% 12.8% 13.6% 14.3% 14.7% 14.6% 14.8% 15.2% 15.2% 15.7% 16.1%
Note: Table presents the proportion of women directors (Women) and percentage of companies whose boards have at least one woman (Boards) over the years based on different studies (Sample) across countries. Refer to notes atthe end.
Scandinavian countries have become the best performers in terms offemale representation on boards, with an increase of more than 300%over the last decade. The United States and Canada have also shownan increase of 30% and 53% over the last ten years. Italy is probablythe only country with a reverse trend, where the proportion of womenon boards has actually fallen (see Table 2.2).
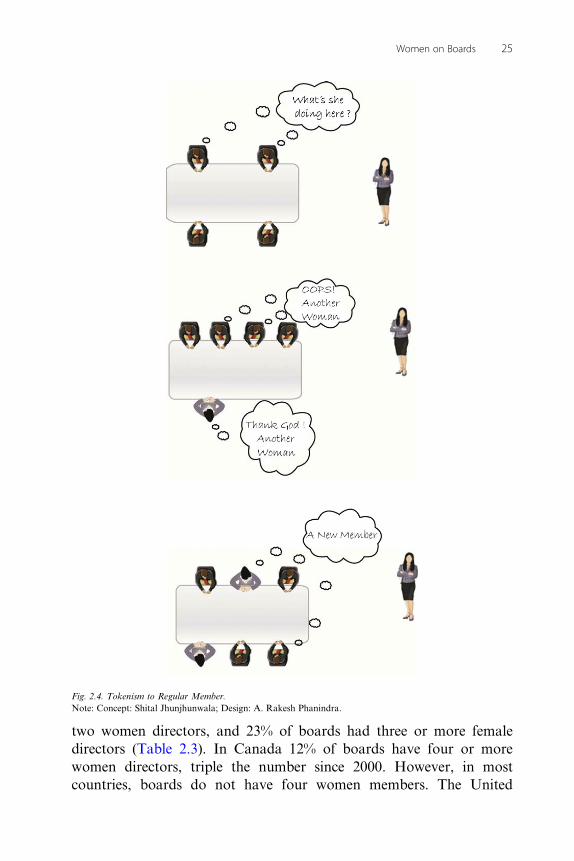
2.4.1 More the MerrierIt is not enough to appoint the “fairer sex” on boards. They shouldnot just be symbolic representatves of their gender. Qualified and com-petent women should be appointed who can actively contribute toboard effectiveness. It is important to build an open and supportiveenvironment where women members can comfortably participate andtheir views are not marginalized. While even a single female directorcan make significant contributions, it is important that she be heardand not ignored or sidelined by the majority male members. Twofemale directors on a board would strengthen their position, andtogether they may have a better chance of being heard. Three or morewomen representatives on boards, popularly known as the “criticalmass,” will have a very strong impact on board functioning, as theywill no longer represent the “women’s view” but will become a “regu-lar” board member (Figure 2.4), with a specific set of perspectives andskills.
In the global study of Fortune 200 [51] companies in 2009, 23% ofboards had no women, 26% had only one woman director, 29% had
Table 2.2. Change in Women’s Proportion on BoardsCountry 2001 2011 % Change
Finland 4.63% 24.50% 429%
Norway 8.45% 35.60% 321%
Sweden 6.71% 27.30% 307%
Netherlands 4.00% 9.20% 130%
UK 6.40% 14.20% 122%
Denmark 7.93% 13.90% 75%
Canada 11.10% 17.00% 53%
New Zealand 5.69% 7.50% 32%
USA 12.40% 16.10% 30%
Italy 4.20% 3.70% 212%
24 Diversity and the Effective Corporate Board
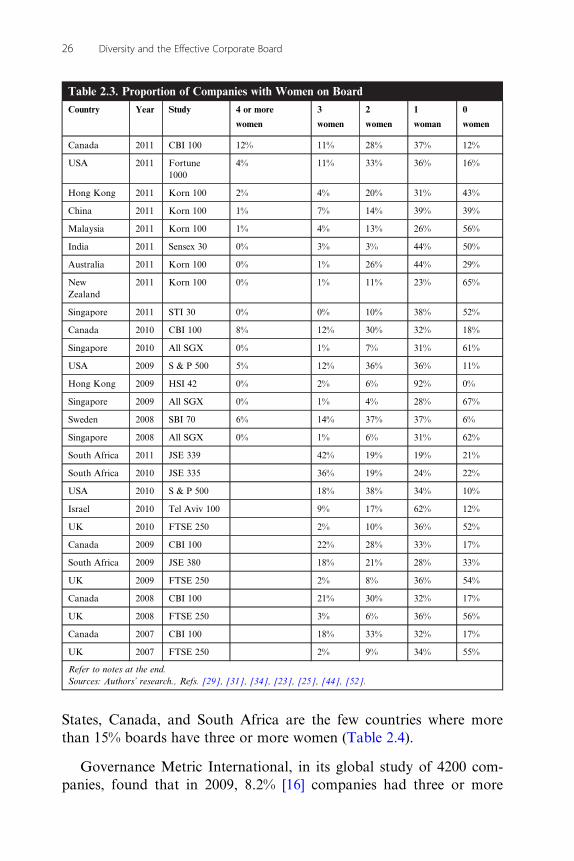
two women directors, and 23% of boards had three or more femaledirectors (Table 2.3). In Canada 12% of boards have four or morewomen directors, triple the number since 2000. However, in mostcountries, boards do not have four women members. The United
Fig. 2.4. Tokenism to Regular Member.Note: Concept: Shital Jhunjhunwala; Design: A. Rakesh Phanindra.
25Women on Boards
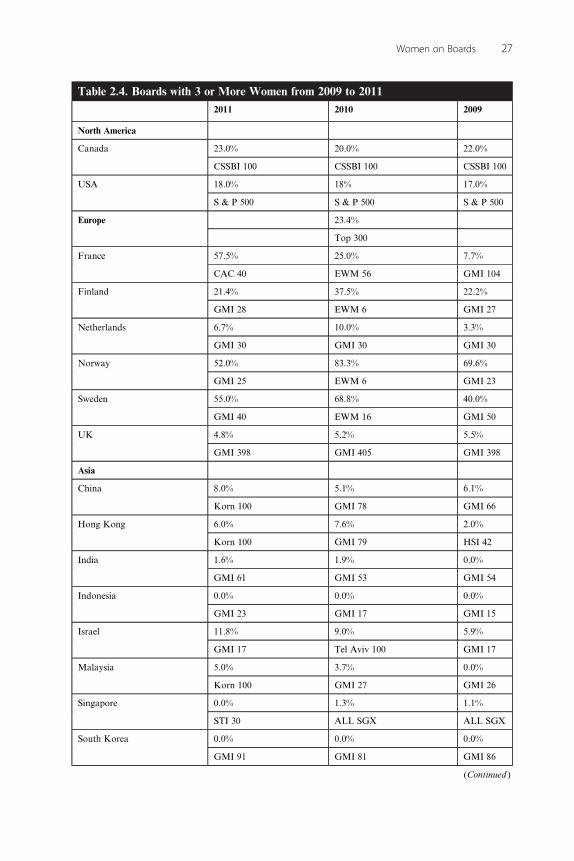
States, Canada, and South Africa are the few countries where morethan 15% boards have three or more women (Table 2.4).
Governance Metric International, in its global study of 4200 com-panies, found that in 2009, 8.2% [16] companies had three or more
Table 2.3. Proportion of Companies with Women on BoardCountry Year Study 4 or more
women
3
women
2
women
1
woman
0
women
Canada 2011 CBI 100 12% 11% 28% 37% 12%
USA 2011 Fortune1000
4% 11% 33% 36% 16%
Hong Kong 2011 Korn 100 2% 4% 20% 31% 43%
China 2011 Korn 100 1% 7% 14% 39% 39%
Malaysia 2011 Korn 100 1% 4% 13% 26% 56%
India 2011 Sensex 30 0% 3% 3% 44% 50%
Australia 2011 Korn 100 0% 1% 26% 44% 29%
NewZealand
2011 Korn 100 0% 1% 11% 23% 65%
Singapore 2011 STI 30 0% 0% 10% 38% 52%
Canada 2010 CBI 100 8% 12% 30% 32% 18%
Singapore 2010 All SGX 0% 1% 7% 31% 61%
USA 2009 S & P 500 5% 12% 36% 36% 11%
Hong Kong 2009 HSI 42 0% 2% 6% 92% 0%
Singapore 2009 All SGX 0% 1% 4% 28% 67%
Sweden 2008 SBI 70 6% 14% 37% 37% 6%
Singapore 2008 All SGX 0% 1% 6% 31% 62%
South Africa 2011 JSE 339 42% 19% 19% 21%
South Africa 2010 JSE 335 36% 19% 24% 22%
USA 2010 S & P 500 18% 38% 34% 10%
Israel 2010 Tel Aviv 100 9% 17% 62% 12%
UK 2010 FTSE 250 2% 10% 36% 52%
Canada 2009 CBI 100 22% 28% 33% 17%
South Africa 2009 JSE 380 18% 21% 28% 33%
UK 2009 FTSE 250 2% 8% 36% 54%
Canada 2008 CBI 100 21% 30% 32% 17%
UK 2008 FTSE 250 3% 6% 36% 56%
Canada 2007 CBI 100 18% 33% 32% 17%
UK 2007 FTSE 250 2% 9% 34% 55%
Refer to notes at the end.Sources: Authors’ research., Refs. [29], [31], [34], [23], [25], [44], [52].
26 Diversity and the Effective Corporate Board
Table 2.4. Boards with 3 or More Women from 2009 to 20112011 2010 2009
North America
Canada 23.0% 20.0% 22.0%
CSSBI 100 CSSBI 100 CSSBI 100
USA 18.0% 18% 17.0%
S & P 500 S & P 500 S & P 500
Europe 23.4%
Top 300
France 57.5% 25.0% 7.7%
CAC 40 EWM 56 GMI 104
Finland 21.4% 37.5% 22.2%
GMI 28 EWM 6 GMI 27
Netherlands 6.7% 10.0% 3.3%
GMI 30 GMI 30 GMI 30
Norway 52.0% 83.3% 69.6%
GMI 25 EWM 6 GMI 23
Sweden 55.0% 68.8% 40.0%
GMI 40 EWM 16 GMI 50
UK 4.8% 5.2% 5.5%
GMI 398 GMI 405 GMI 398
Asia
China 8.0% 5.1% 6.1%
Korn 100 GMI 78 GMI 66
Hong Kong 6.0% 7.6% 2.0%
Korn 100 GMI 79 HSI 42
India 1.6% 1.9% 0.0%
GMI 61 GMI 53 GMI 54
Indonesia 0.0% 0.0% 0.0%
GMI 23 GMI 17 GMI 15
Israel 11.8% 9.0% 5.9%
GMI 17 Tel Aviv 100 GMI 17
Malaysia 5.0% 3.7% 0.0%
Korn 100 GMI 27 GMI 26
Singapore 0.0% 1.3% 1.1%
STI 30 ALL SGX ALL SGX
South Korea 0.0% 0.0% 0.0%
GMI 91 GMI 81 GMI 86
(Continued)(Continued )
27Women on Boards
women on their boards. In 2011 this number had increased marginallyto 8.4% [4]. In Canada, France, South Africa, Malaysia, and China,the number of boards with three or more female directors hasincreased, but countries like South Korea and Indonesia still do nothave any boards with three female representations. While more andmore boards have at least one female member, not many boards areactually increasing the number of women directors.
2.5 WOMEN IN THE LEAD
If the presence of women on boards is far from satisfactory, the num-ber of women leading boards is even more disappointing (Table 2.5).According to Governance Metric International, only 2.2% [4] ofboards had female chairperson in 2011 (2.1% in 2010 [4] and 2.2% in2009 [16]). The Nordic Board Index 2010, covering 130 Scandinaviancompanies, reported only 3% [22] of boards having a chairwoman.Norway, Canada, and Australia have been more proactive inappointed chairwomen, showing an increasing trend since 2009. In2004 no Canadian board had a women chair; this has changed to 9%currently. There are still no women chair in large companies ofDenmark, India, and Singapore.
2.6 BRIDGING THE GAP
A balanced board with the right mix of male and female directorswould benefit from the strengths of both sexes. The governments of
Table 2.4. (Continued)2011 2010 2009
Australia
Australia 1.0% 2.0% 3.6%
Korn 100 GMI 200 GMI 111
New Zealand 1.0% 0.0% 0.0%
Korn 100 GMI 12 GMI 12
Africa
South Africa 41.6% 35.5% 17.5%
JSE 339 JSE 335 JSE 380
Refer to notes at the end.Sources: Authors’ research., Refs. [29], [31], [38], [41], [25], [4], [16], [44].
28 Diversity and the Effective Corporate Board
Table 2.5. Chairwomen on BoardsCountry 2011 2010 2009
Norway 12.0% 10.0% 4.3%
GMI 25 NBI 70 GMI 23
Canada 9.0% 5.0% 3.0%
CSSBI 100 CSSBI 100 CSSBI 100
New Zealand 4.0% 0.0% 0.0%
Korn 100 GMI 12 GMI 12
Australia 4.0% 2.5% 2.7%
Korn 100 GMI 200 GMI 111
China 4.0% 1.3% 1.5%
Korn 100 GMI 78 GMI 66
South Africa 3.5% 4.1% 4.6%
JSE 339 JSE 335 JSE 380
Hong Kong 3.0% 1.3% 1.3%
Korn 100 GMI 79 GMI 79
Sweden 2.5% 1.0% 2.0%
GMI 40 NBI 20 GMI 50
USA 2.3% 2.6% 2.0%
Fortune 1000 Fortune 500 Fortune 500
Malaysia 2.0% 0.0% 0.0%
Korn 100 GMI 27 GMI 26
Finland 0.0% 5.0% 0.0%
GMI 28 NBI 20 GMI 27
Israel 0.0% 5.0% 0.0%
GMI 17 Tel Aviv 100 GMI 17
India 0.0% 3.8% 3.7%
Sensex 30 GMI 53 GMI 54
Singapore 0.0% 2.7% 3.4%
STI 30 All SGX GMI 59
Netherlands 0.0% 0.0% 0.0%
GMI 30 GMI 30 GMI 30
Denmark 0.0% 0.0% 0.0%
GMI 24 NBI 20 GMI 26
Refer to notes at the end.Sources: Authors’ research., Refs. [29], [34], [23], [31], [38], [25], [4], [16], [44], [52], [22], [41].
29Women on Boards
several countries, particularly in Europe, have recommended and evenlegislated for quotas of women board members to improve the ratio(Table 2.6). Although this has resulted in a substantial increase inwomen directors in countries such as Norway, where it is mandatory,it may often result in appointing women for “tokenism.” Womenappointed just to fulfill a quota may be not of the desired caliber,weakening the quality of the board as a whole. As the supply ofwomen who can be considered for board membership is limited, thesame woman may be appointed as a director in many companies. Thiscould destroy the competitive edge of the boards appointing that par-ticular individual. The effective contribution of such an overburdenedboard member is also questionable.
Companies need to have a more open approach and facilitateopportunities for women to have board roles. Implementing work�lifebalance measures by allowing flexible working hours and acceptingthat women need career breaks could go a long way in encouragingwomen to aspire to senior-level positions. Organizations must strivefor gender equality at all levels of the organization and ensure equal
Table 2.6. Targets for Women on BoardsCountry Recommended Female Targets on Boards Target Year
European Union [53] 30%40%
20152020
Belgium [53] 1/3 2017
Finland [54] At least one female director 2010
France [53] 20%40%
20142017
Germany 20%40%
20182023
Iceland [55] 40% 2013
Italy [53] 1/3 Renewals after Aug 2011
Netherlands [55] 30% 2016
Norway [56] 40% 2005
Spain [53] 40% 2015
UK [55] 25%30%
20152020
Australia [57] 25% 2014
Malaysia [58] 30% 2016
30 Diversity and the Effective Corporate Board
pay for men and women in similar roles. Insisting on equal male andfemale nominees when board recruitments are done would give womena fairer chance. This is likely to necessitate actively searching forsuitable women, thereby bringing forward women who are not so visi-ble. Appropriate networking and mentoring facilities will help womenprepare for top positions. If equal growth and promotion opportunitiesare facilitated over time, there will be a good number of women atsenior positions that can be considered for board-level positions.
Women need to become more visible by attending and speaking atprofessional gatherings and networking with peers from differentindustries. To increase the current female proportion on boards to thedesired levels of 30% to 40%, companies are appointing more womento their boards (Table 2.7). The percentage of new women appoint-ments as a percentage of total new appointments over the last fewyears shows that some countries, Canada, Australia, and the UK inparticular, are making serious efforts to improve the ratio of womenon boards. Surprisingly, American companies are far behindScandinavian countries in gender diversity on their boards—only 8.3%[23] of new appointments were women.
2.7 TOWARD A BROADER BASE
Companies are facing a huge talent crunch that goes right up to theboard level. Currently there are not enough talented male directorswho can help boards face the ongoing challenges. Men currently
Table 2.7. Women Appointments on BoardsCountry Sample 2011 2010 2009 2008 2007
Canada CSSBI 100 29.0% 20.0% 13.0% 26.0% 17.0%
Australia ASX 200 28.0% 25.0% 5.0% 8.0% 8.0%
UK FTSE 100 22.5 % 13.3% 14.7% 11.0% 20.0%
Netherlands Euro Next 97 11.5% 11.0% 12.5% —
USA Fortune 1000 8.3% — — — —
Singapore All SGX — 9.0% 6.9% — —
Hong Kong HSI 10.1% 11.2% 12.7% — —
Refer to notes at the end.Sources: Refs. [27], [23], [31], [44], [46], [47], [52], [59], [60].
31Women on Boards
serving on boards are not in a position to take additional responsibil-ity. Continuing reliance on existing directors is likely to dilute the qual-ity of board members. Broadening the talent pool by including womendirectors will help boards get skilled and competent members with adiversity of perspectives and leadership styles who can significantlycontribute to board performance.
NOTES1. The sample describes the study and the sample size.2. Figures from different studies, samples, and sample size may not be comparable and may not
reflect a true trend.3. Data in tables are compiled from various sources.
ABBREVIATIONS
ASX Australian Securities ExchangeATX Austrian Traded IndexCSSBI/CBI Canadian Spenser Stuart Board IndexDAX Deutscher Aktien IndexEWM European PWN Board Women MonitorFort FortuneFP Financial PostFT FTSEGMI Governance Metric InternationalH & S Hedrick and StrugglesHIS Hang Seng IndexJSE Johannesburg Stock ExchangeKorn Korn/Ferry InstituteNBI Nordic Board IndexNZSX New Zealand Stock ExchangePSI Portuguese Stock IndexS & P Standard and PoorSBI Sweden Board IndexSGX Singapore Stock ExchangeSTI Strait Times IndexSMI Swiss Market IndexWSE Warsaw Stock Exchange
REFERENCES[1] Catalyst, Statistical Overview of Women in the Workplace, 2012.
[2] Catalyst, Statistical Overview of Women in the Workplace, Quick takes 2011.
[3] A. McIntyre,Tomorrow’s Boards: Creating Balanced and Effective Boards AustralianInstitute of Company Directors, ,http://www.companydirectors.com.au., 2011.
[4] Governance Metric International Women on Board Report 2011.
[5] Federal Glass Ceiling Commission. Solid Investments: Making Full Use of the Nation’sHuman Capital. Washington, D.C.: U.S. Department of Labor, November 1995, p. 4.
[6] S.L. Harlan, C.W. Berheide, Barriers To Workplace Advancement Experienced By WomenIn Low-Paying Occupations United States Glass Ceiling Commission January FederalPublications. Paper 122, 1994. iii, ,http://digitalcommons.ilr.cornell.edu/key_workplace/122..
[7] Glass Ceiling Commission - Good for Business: Making Full Use of the Nation’s HumanCapital U.S. Glass Ceiling Commission 3-1-1995, 8.
[8] A.M. Morrison, The New Leaders: Guidelines on Leadership Diversity in America, Wiley,1996.
[9] McKinsey report, Women Matter 2, Female Leadership, A competitive edge for the future.2008.
[10] Think Tank: Marketing to women - The gender factor Peter Crush, Marketing Direct, 31December 2004 ,http://www.brandrepublic.com/news/233078/..
[11] McKinsey report, Women Matter, A corporate Performance driver, 2007.
[12] R. Sealy, E. Doldor, V. Singh, S. Vinnicombe, Women on Boards October 2011,International Centre for Women Leaders, Cranfield School of Management.
[13] Catalyst, The Bottom Line: Connecting Corporate performance and Gender Diversity,2004.
[14] Catalyst, The Bottom Line: Corporate performance and women’s representation on boards,2007.
[15] ASX -500, Women Leaders, Research Notes, Reiby Institute, 30th June 2011.
[16] Governance Metric International Women on Board Report 2009.
[17] Hedrick and Struggles, Corporate Governance Report 2007, Raising the Bar.
[18] European PWN Board Women Monitor, 2004.
[19] European PWN Board Women Monitor, 2008.
[20] European Commission, Database on Women and Men in Decision-making in The EU cor-porate governance framework, Green Paper European Commission, Brussels, 5.4.2011.
[21] A. Gregoric, L. Oxelheim, T. Randøy, S. Thomsen, Corporate Governance as a Source ofCompetitiveness for Nordic firms, Nordic Innovation Centre, March 2009.
[22] A. Halawi, B. Davidson, Power Matters: A Survey of Gulf Cooperation Council Boards,The National Investor Market Insight, Investment Research, Regional Strategy May 13,2008.
[23] BWA South African, Women in Leadership Census 2011.
[24] Canadian Spencer Stuart Board Index 2011, 2010,2009, 2008, 2007, 2006, 2005, 2004.
[25] Catalyst Census of Women Board Directors of Canada 2001.
[26] Catalyst Census of Women Board Directors of Fortune 1000, 1999.
[33] K. Pajo, J. McGregor, J. Cleland, Profiling the Pioneers: Women Directors onNew Zealand’s Corporate Boards, Women in Manag. Rev. 12(5) (1997) 174�181. r MCBUniversity Press ISSN 0964-9425.
[34] Korn/Ferry Market Cap 100 report 2010.
[35] A. Yi, Korn/Ferry’s Asia Pacific Board Diversity Study, Mind the Gap: Half of Asia’sBoards Have Bo Women, a Risky Position for Governance and Growth, 2011.
[36] M. Dieleman, S. Lin, Singapore Board Diversity Report, Gender Diversity in SGX ListedCompanies, Centre for Governance, Institutions and Organizations of NUS BusinessSchool, Oct 2011.
[37] M. Gamba, A. Goldstein, The gender dimension of business elites: Italian women directorssince 1934 Working Paper 27 May 2008 www.econpubblica.unibocconi.it.
[38] Mijntje Lückerath-Rovers inaugurele rede, The Dutch Female Board Index 2011, NyenrodeBusiness University (Erasmus University Rotterdam).
[39] National Securities and Exchange Commission Annual Report on Corporate Governance2009.
[40] New Zealand Census of Women Participation 2010.
[41] New Zealand Census of Women Participation 2008, 2006, 2004.
[42] S. Mahtani, K. Vernon, R. Sealy, Women on Boards: Hang Seng Index 2009, CranfieldSchool of Management, November 2009.
[43] Spencer Stuart Sweden Board Index 2008.
[44] Spenser Stuart, Nordic Board Index 2010.
[45] Spencer Stuart Board Index 2011, 2010, 2009, 2007.
[46] Statistics, Directors resource centre, Australian Institute of Company Directors, ,http://www.companydirectors.com.au/Director-Resource-Centre/Governance-and-Director-Issues/Board-Diversity/Statistics..
[47] The 2010 Israeli Census Report on Women’s Representation in Tel Aviv 100 IndexCompanies, The Catalyst Research Study In Israel.
[48] The Female FTSE Board Report, 2010, 2009, 2008, 2007, 2006, 2005, 2004, 2003, 2002International Centre for Women Leaders, Cranfield School of Management.
[50] W.G. Simpson, D.A. Carter, F. D’Souza, What do we know about women on boards? J.Appl. Finance 2 (2010) 29.
[51] Corporate Women Directors International 2010 Report: Women Board Directors of the2009, Fortune Global 200.
[52] CT Partners, Women on Boards: Review & Outlook, 2012.
[53] Deloite, Women in the Boardroom, A global Perspective, November 2011.
[54] New Finnish Corporate Governance Code: Both Genders Represented on the Board,Women on Boards, 8th July 2011 ,http://www.europeanpwn.net/index.php?article_id5 713..
[55] UK Davis Report, Women on boards, February 2011.
[56] Government proposes gender quotas on company boards, June, 2003 ,http://www.euro-found.europa.eu/eiro/2003/06/feature/no0306106f.htm..
[57] Cabinet Approves 30 Per Cent Women as Decision-Makers in Corporate Sector - PM,Office of the Prime Minister of Malaysia, 27.6.2011.