Page 1
1
Dividend Policy in Turkey: Survey Evidence from Borsa Istanbul Firms
H. Kent Baker*
American University
Kogod School of Business
Department of Finance and Real Estate
4400 Massachusetts Avenue, NW.
Washington, DC, 20016 USA
[email protected]
Erhan Kilincarslan
Birkbeck University of London
School of Business, Economics and Informatics
Department of Management
Malet Street, WC1E 7HX
London, UK
[email protected]
Alper Haktan Arsal
Yildiz Technical University
Graduate School of Social Sciences
Business Administration
Barbaros Bulvari, 34349 Yildiz
Istanbul, Turkey
[email protected]
*Corresponding author
H. Kent Baker
Page 2
2
Dividend Policy in Turkey: Survey Evidence from Borsa Istanbul Firms
Abstract
This study investigates the views of managers of firms listed on the Borsa Istanbul (BIST) on
dividend policy. The survey evidence provides general support for Lintner’s partial
adjustment model, signaling theory, catering, firm life cycle, and bird-in-the-hand hypotheses
for explaining cash dividends. The results do not support the agency cost theory, substitution
model of dividends, tax-related explanations, transaction cost theory, and residual dividend
policy. The findings suggest that after implementing major economic and structural reforms
and abolishing a mandatory dividend payment requirement, BIST managers follow similar
dividend policy factors and patterns of dividend policy as managers in more developed
countries
1. Introduction
Dividend policy is a highly researched topic in corporate finance. Miller and
Modigliani (1961) demonstrate that dividend payments have no effect on firm value and no
dividend policy is superior to another under perfect capital market assumptions. Yet, in the
real world where market frictions exist such as differential tax rates, information
asymmetries, agency problems, and transaction costs, their argument becomes highly
debatable. In this respect, financial scholars have focused on various market frictions and
proposed many competing theories about why companies pay, or do not pay, dividends
(Lease et al., 2000; Baker, 2009). Hence, the dividend policy literature is vast and contains
numerous theories, hypotheses, and explanations for dividends. Despite voluminous
theorizing, empirical research, and extensive debate, no consensus exists on the actual
motivation for paying dividends.
According to Baker et al. (2006, 2008), two main reasons may lead to this lack of
consensus. First, financial economists typically focus on trying to develop a universal or
“one-size-fits-all” explanation. This tendency exists despite the well-known reality that
corporate dividend decisions are sensitive to various factors, such as firm characteristics,
corporate governance, and legal environments. Second, the proposed explanations largely
rely on economic modeling instead of obtaining direct evidence from actual policy makers.
Unfortunately, economic modeling cannot measure motivation. Given that no single theory
solves the dividend puzzle, Baker et al. (2002) and Chiang et al. (2006) state that one way to
improve our understanding of corporate dividend policy is to investigate the views of
managers who are responsible for making such decisions based on the combination of various
dividend theories, factors, and issues.
Historically, dividend studies primarily focused on developed markets but some
attention has shifted to emerging markets. The evidence generally indicates major differences
in dividend policy behavior between developed and emerging economies. Such differences
stem from such factors as political and social instability, a lack of adequate disclosure, poor
Page 3
3
laws and regulations, weaker corporate governance, and different ownership structures
(Aivazian et al., 2003a, 2003b; Faccio et al., 2001; Glen et al., 1995; La Porta et al., 2000).
Yet, researchers still tend to rely on economic modeling approaches instead of obtaining
insights directly from corporate managers (Baker and Kapoor, 2015; Baker and Powell,
2012).
The purpose of this paper is to extend previous survey-based research on dividends
into an emerging market and to contribute new evidence to the literature. In particular, we
focus on Turkey, which is one of the most important emerging economies. Turkey is
strategically located between Europe and Middle-East and is a candidate member of the
European Union (EU). More importantly, Turkey implemented major reforms starting with
the fiscal year 2003 in compliance with the International Monetary Fund (IMF) stand-by
agreement, the EU directives, and best-practice international standards for a better working of
the market economy, outward-orientation, and globalization. Also, Turkish regulators made
major changes in the regulatory framework of cash dividend policy rules during this period.
Therefore, this paper differs from past survey research in two respects. First, it studies firms
in an emerging market that has undergone major changes to integrate with world markets.
Second, the study attempts to provide insights of what perceptions these managers have about
dividend policy after such developments. Accordingly, we survey corporate managers of
dividend-paying companies listed on the Borsa Istanbul (BIST) – formerly known as the
Istanbul Stock Exchange. We study their views about various theories and explanations for
paying cash dividends, and the most important factors affecting their dividend policy
decisions.
Although survey research is by no means the standard academic approach in finance,
it can provide data unavailable from other sources, which can help bridge the gap between
theory and practice. To the best of our knowledge, this research provides the first
comprehensive study in the Turkish market using survey-based evidence from corporate
managers of dividend-paying firms listed on the BIST. The study also complements previous
empirical research on dividend policy and confirms earlier findings while exploring specific
nuances of the Turkish market. In conducting empirical research, Bruner (2002, p. 50) notes,
“The task must be to look for patterns of conformation across approaches and studies much
like one sees an image in a mosaic of stones.” As discussed later, we intentionally use the
same survey design and questionnaire as several other researchers to enable direct
comparisons. Hence, this study provides insights about dividend policy involving Turkish
firms unavailable in previous research.
The remainder of this paper has the following organization. Sections 2 and 3 review
the theoretical background and selective surveys on dividend policy, respectively. Section 4
provides an overview of the research context in Turkey and develops research hypotheses.
Section 5 discusses our research methodology. Section 6 reports and discusses the survey
results, and Section 7 concludes the paper.
Page 4
4
2. Main dividend policy theories and explanations
Although researchers have contributed numerous theories, explanations, and models
to the dividend policy literature, some have been widely discussed and extensively tested in
the hope of solving the dividend puzzle. In this section, we briefly summarize 10 theoretical
arguments some of which might be important in describing dividend decisions in the
emerging Turkish market. However, this is not the full set of possible explanations for paying
dividends.
Bird-in-the-hand theory: One of the earliest explanations in favor of dividends is that
more certainty is attached to dividend payments received today, against dividend
retention for reinvestment in projects whose future earnings are uncertain.
Signaling theory: A firm’s management has a better understanding of the firm’s
intrinsic value than outside shareholders and investors, who only have access to
public information. Because information asymmetry exists between insiders and
outsiders, managers may use dividends as a device to signal their superior information
about a firm’s future prospects to outsiders.
Agency cost theory: This theory derives from problems associated with the separation
of management and ownership, and the differences in managerial and shareholder
priorities. It further contends that dividend payments help to control these agency
problems by reducing the free cash from the managers’ control and paying it to
shareholders.
Tax-preference theory: Investors who receive favorable tax treatment on capital gains
may prefer shares with none or low dividend payouts because higher dividend
payments increase shareholders’ tax burden.
Tax clientele effect: Each investor has his own implied calculations of choosing
between high or low cash dividends and selecting dividend policies according to his
tax category circumstances. This situation leads to different clienteles for both high
and low dividend yields depending on tax positions.
Transaction cost theory: Using low cost and easily accessible internal funds to pay
dividends instead of retaining them for possible investment projects might result in
additional costs to firms because they may have to raise costly external funds to meet
their investment requirements after paying dividends.
Catering theory: Investor preferences for dividends may change over time. Therefore,
managers may recognize and cater to shifts in investor demand by distributing
dividends when investors put a premium on such stocks. Correspondingly, managers
may omit dividends when investors prefer firms that do not pay dividends.
Residual dividend theory: Firms should pay dividends only when their internally
generated earnings are not fully exhausted for investment projects. Thus, dividend
payments should ideally be the residuals of cash produced by a firm’s operations after
undertaking all positive net present value (NPV) investments.
Maturity (firm life cycle) theory: Higher dividend increases are a sign of change in a
firm’s life cycle. A firm is likely to pay higher dividends as it transits from a growth
to a more mature phase. This change occurs because a firm’s investment opportunities
Page 5
5
decrease and growth rates decline, and the firm starts generating larger amounts of
free cash flow.
Substitute model of dividends: This model posits that dividends are substitutes for
legal protection in countries with poor shareholders’ protection. Companies in such
countries need to establish a reputation treating minority investors fairly. Hence,
paying dividends helps to establish a reputation for preventing expropriation of wealth
from minority shareholders.
3. Survey-based evidence on dividend policy
Given that Baker et al. (2011) provide a detailed review of dividend surveys in both
developed and emerging markets, we focus on two recent surveys. Baker and Powell (2012)
survey dividend-paying firms listed on the Indonesian Stock Exchange (IDX). They find that
Indonesian managers perceive dividend policy as affecting firm value. These managers also
view the level of current and expected future earnings and the stability of earnings are the
most influential determinants of dividend decisions. The survey evidence reveals that
managers view the effects of dividends on share prices and the needs of current shareholders
as important. Additionally, Indonesian executives agree that the signaling, catering, and life
cycle theories primarily help to explain why their firms distribute dividends.
In a recent study, Baker and Kapoor (2015) survey managers of National Stock
Exchange (NSE) firms in India. They report that the most important factors of dividends
relate to earnings (i.e., the level of current and expected future earnings as well as the
stability of earnings) and the pattern of lagged dividends. Their evidence also shows that
Indian managers rank the dividend factors in a significantly positive way along with their
Indonesian, Canadian, and U.S. counterparts. Further, respondents from NSE firms think that
dividend policy affects firm value and view maintaining an uninterrupted record of dividend
payments as important. Finally, Indian managers highly support the signaling, firm life cycle,
and catering theories for paying cash dividends.
Overall, survey evidence shows that no single theory explains the dividend puzzle. In
fact, multiple factors, arguments, and theories exist for paying cash dividends. Nevertheless,
this study aims to extend survey-based research on dividends into the emerging Turkish
market and contribute new evidence to the literature.
4. Research context in Turkey and hypotheses
Turkish authorities strictly regulated their financial markets until the implementation
of a financial liberalization program in 1980. After adopting related regulations enacted and
launched in the subsequent years, the Istanbul Stock Exchange (ISE) emerged in December
1985 and commenced its operations on January 3, 1986 (CMB, 2003). Although the ISE
made rapid progress after being established, especially between 1990 and 2000, the ISE-listed
companies operated under a considerably different regulatory environment compared to
developed markets such as the United States, United Kingdom, Canada, and Australia during
this period. Such differences are due to the nature of Turkey’s legal system that involves the
Page 6
6
poor culture of corporate governance, lack of efficient transparency and disclosure practices,
and inconsistent and unclear accounting and tax regulations (Aksu and Kosedag, 2006; Ararat
and Ugur, 2003; La Porta et al., 1997).
The Turkish capital markets underwent major developments after the November 2002
elections, which resulted in a one-party government. In 2003, the new Turkish government
signed a standby agreement with the IMF and began to implement serious economic
programs and structural reforms for market integration (Adaoglu, 2008; Birol, 2011; CMB,
2003). Turkey’s progress in achieving full membership of the EU in this period provided the
strongest motivation for establishing new reforms, rules, and regulations in line with the EU
directives and best-practice international standards. Joining the EU also provided Turkey with
the impetus to improve corporate governance, transparency, and disclosure practices thus
integrating its economy with Europe and harmonizing its institutions with those of the EU
(Aksu and Kosedag, 2006; IIF, 2005). Accordingly, we advance our research hypotheses in
response to these major developments in the Turkish market.
Prior research reveals highly concentrated corporate ownership in Turkey, mostly
dominated by families who generally owned business groups affiliated with industrial
(businesses and subsidiaries) and financial (banks) companies organized under the legal form
of a “holding company” (Glen et al., 1995; Gursoy and Aydogan, 1999; Yurtoglu, 2003).
Moreover, the Turkish market was characterized by closely-held, bank-financed firms that
were mainly part of those bigger family-owned holding companies (Aivazian et al., 2003a,
2003b; Erturk, 2003). As a result of this infrastructure, families have control over not only
many banks belonging to their business groups but also bank lending decisions. Hence,
business groups used to obtain much of their finance from their own banks (Aksu and
Kosedag, 2006; IIF, 2005).
Until the early 2000s, Turkey experienced a poor culture of corporate governance
coupled with a lack of appropriate transparency and disclosure practices, with very poor
minority shareholders’ protection (Aksu and Kosedag, 2006; IIF, 2005; La Porta et al, 1997).
Also, the controlling families often attempted to use pyramidal corporate structures or even a
more complicated web of inter-corporate equity linkages and dual class shares to further
enhance the control on their companies at the expense of other shareholders, especially
minority owners (IIF, 2005; Yurtoglu, 2003). Hence, the Capital Markets Board (CMB) of
Turkey, as in many other emerging markets, heavily regulated dividend policies of ISE-listed
firms, when it first started to operate in 1986. According to the first regulation, the ISE-listed
firms legally had to pay at least 50% of their distributable income as a cash dividend
(Adaoglu, 1999, 2000; Kirkulak and Kurt, 2010). Thus, ISE managers lacked flexibility in
setting their firms’ dividend policies.
In this context, the nature of the ISE firms’ highly concentrated ownership structures
and their characteristic of bank-oriented financing, specifically owner-bank-firm relations,
lessened the information asymmetry and thus reduced the need to use cash dividends as a
signaling device. Further, the presence of strict mandatory dividend policy regulations also
diminished the role of dividend policy as a signaling tool. In fact, a few studies conducted in
Page 7
7
early periods in Turkey show that firms based cash dividend payments on their current year
earnings, as imposed by regulations (Adaoglu, 2000; Aivazian et al., 2003a).
Nevertheless, the CMB made many amendments to improve the transparency and
quality of the banking sector and adopted related regulations to prevent insider lending (non-
arm’s length transactions) as a source of financing in early 2000s. Since then, ISE managers
have turned to the equity market with a greater incentive for more transparent financing (IIF,
2005), which might possibly affect their financial policies, including corporate dividend
decisions. More strikingly, the CMB granted more flexible policy regulations after
implementing major reforms in 2003. Beginning in fiscal year 2009, the CMB decided not to
determine a minimum payout ratio and abolished mandatory minimum dividend payment
requirements. This action gave ISE corporate managers the freedom to make their own
dividend policy decisions. Accordingly, we conjecture that these recent developments may
affect Turkish managers’ corporate dividend policy decisions. We also expect that they might
then use cash dividends as a credible sign to convey their superior insider information about
their firms to the market. Therefore, we examine the following hypothesis:
H1: Corporate managers of BIST-listed firms now view cash dividends as a signaling
mechanism.
Our second hypothesis concerns the dividend changes relative to earnings. Glen et al.
(1995) observe that managers of firms in emerging markets whose governments dictate
mandatory dividend policy rules generally concentrate on the dividend payout ratio. Because
regulations typically imposed the dividend payout ratio, managers are not worried about
volatility in dividends. Substantial evidence across many countries, especially developed
markets, and different time periods indicates that managers often tend to pursue a traditional
Lintner (1956) style dividend smoothing policy. That is, managers prefer a stable dividend
policy. Because the volatility in dividends reflects the volatility in earnings, managers
perceive that volatile (unstable) dividend payment streams are not good indicators about their
firms’ financial performance to the market.
Applying Lintner’s (1956) model, Adaoglu (2000) and Aivazian et al. (2003a)
conducted studies during early periods in Turkey (i.e., 1985-1997 and 1983-1990,
respectively) demonstrating that ISE firms did not smooth their cash dividends. Thus, Turkish
firms had unstable cash dividend polices. The sole determinant of cash dividends was current
year earnings, as forced by the first dividend rule. The levels of current cash dividends
directly reflect any volatility in earnings of the firms. Nevertheless, Turkey’s serious efforts
to implement various financial and structural reforms to improve its market economy and
converge with the global world-markets in the post-2003 period led its stock market to a
rapid growth in market capitalization and trading volume. Not surprisingly, such changes
attracted a large amount of foreign investment (CMB, 2003, 2014). Thereby, we expect that
Turkish managers are more likely to smooth their dividend payment streams to strengthen the
credibility of stable dividends reflecting their firms’ good financial performance to both
foreign and national investors.
Page 8
8
H2: Corporate managers of BIST-listed firms now follow traditional Lintner style
managed dividend policies.
Moreover, concentrated ownership structures by large controlling shareholders are
still prevalent in Turkey, where especially families and other block holders, such as foreign
and institutional investors and the state, dominate its capital market (Al-Najjar and
Kilincarslan, 2016; Caliskan and Icke, 2011; IIF, 2005; Sevil et al., 2012). Accordingly, our
third hypothesis involves the agency cost argument. Evidence shows that large shareholders
have better incentives and ability to act as an effective monitoring mechanism on
management. Therefore, the existence of such large shareholders can mitigate the free-rider
problem of monitoring managers, which reduces agency conflicts between managers and
shareholders (Demsetz and Lehn, 1985; Grossman and Hart, 1980; Shleifer and Vishny,
1986). Especially, founding families and their direct involvement in the managements of their
firms lead to greater supervision and few owner-manager agency conflicts (La Porta et al.,
1999). Hence, we conjecture that the nature of heavily concentrated ownership structures of
Turkish firms minimizes the traditional agency cost problems (the principal-agent conflict)
and thus reduces, in general, the need for paying cash dividends as an internal disciplinary
device on corporate managers.
On the other hand, numerous studies contend that when large shareholders (especially
families) hold almost full control, they appear to implement policies that generate benefits to
themselves at the expense of minority shareholders due to the absence of efficient monitoring
(Anderson and Reeb, 2003; Johnson et al., 2000; Morck and Yeung, 2003; Shleifer and
Vishny, 1997; Villalonga and Amit, 2006). In these cases, the salient agency problem is
hence expropriation of the wealth of minority investors by the controlling shareholders (so
called the “principal-principal conflict”). Consistent with the substitute model of dividends
purposed by La Porta et al. (2000), paying dividends reduces the possibility of expropriation
of wealth from others and thus establishes good treatment of minority shareholders.
Therefore, we posit that Turkish managers may employ cash dividends as a reputation
mechanism to attract investors.
H3: Corporate managers of BIST-listed firms pay cash dividends to indicate good
treatment of minority shareholders.
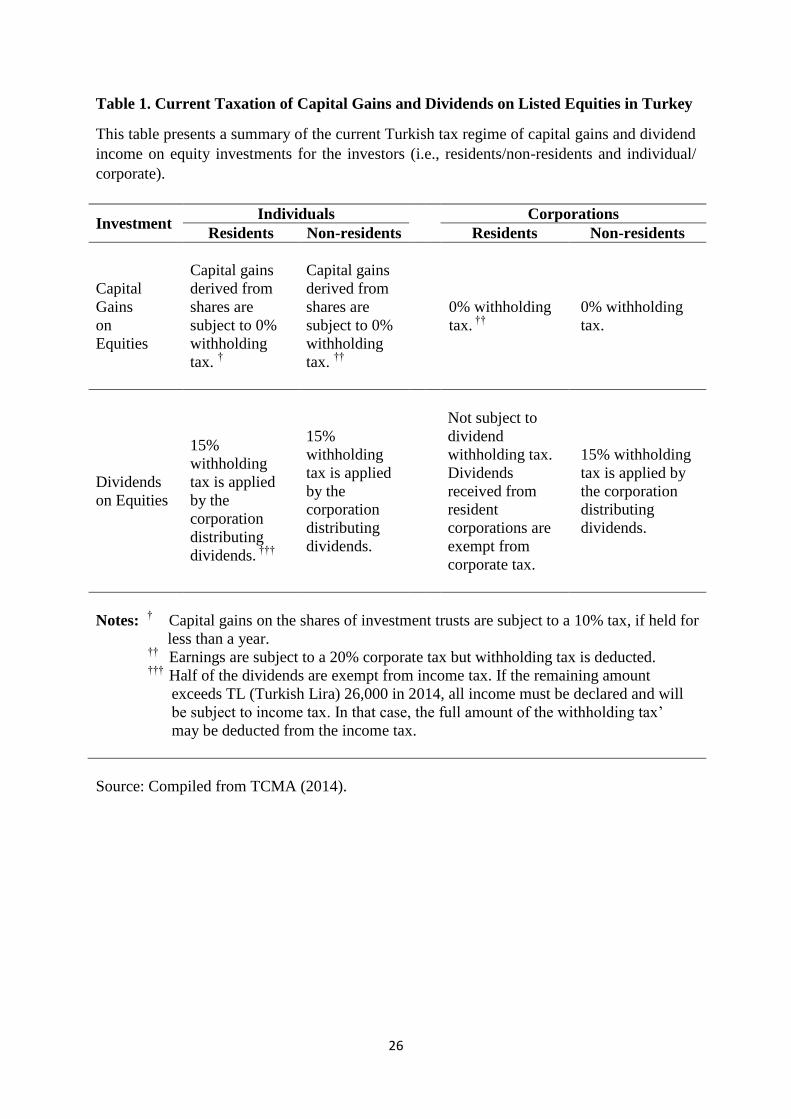
As we present a summary of the current Turkish tax regime on Table 1, differences
exist between the tax rate on capital gains and cash dividends as well as in the taxation of
dividends among investors. Hence, a tax factor may play an important role in dividend payout
decisions in Turkey. Under the current Turkish tax system, capital gains on equities are tax-
free for foreign investors (both individuals and corporations) and domestic individual
investors, whereas they must pay a 15% withholding tax for their cash dividends received on
the shares they hold. Conversely, domestic corporations are not subject to any taxes for either
capital gains or cash dividends that are derived on equities of resident incorporations (TCMA,
2014). Based on the tax-preference theory, investors generally should prefer shares that retain
cash rather than paying dividends in the Turkish market due to the tax advantage of capital
gains over cash dividends. In this scenario, we predict that Turkish managers of dividend-
Page 9
9
paying firms distribute cash dividends because they think different clienteles select dividend
policies according to their tax category circumstances. Accordingly, we hypothesize that:
H4: Corporate managers of BIST-listed firms show strong agreement in favor of the
tax clientele effect explanation.
(Insert Table 1 here)
As previously mentioned, BIST-listed firms have highly concentrated ownership
structures that are dominated by large shareholders, such as families, foreign investors,
financial institutions, and the state. Thus, expecting that the dividend preferences of these
shareholders are homogenous or stay unchanged over time is unrealistic. For instance, a
family-controlled parent company’s attitude toward dividend payments may differ based on
the cash needs of subsidiaries in the business group. Similarly, foreign investors’ sentiment
might change. For example, they may initially seek long-run growth potential, rather than
short-term dividend income. Yet, once they think their direct monitoring exercises on
management are inefficient or too costly, they may require higher cash dividends to augment
better monitoring by the capital markets. Hence, in accordance with the catering theory of
dividends, we formulate the following hypothesis:
H5: Corporate managers of BIST-listed firms base their dividend decisions on their
shareholders’ preferences.
Our sixth hypothesis relates to the transaction costs of dividends. In early periods, the
Turkish market suffered from non-transparent insider lending (non-arm’s length
transactions), especially within business groups. This lack of transparency resulted from
business group companies mostly obtaining much of their funds from their banks.
Nevertheless, after the CMB of Turkey made many amendments to improve the transparency
and quality of the banking sector and adopted related regulations to prevent insider lending as
a source of financing in 2001, listed firms have turned to the capital markets with a greater
incentive for more transparent financing. Thus, we posit that external financing may affect
cash dividend payment decisions of the Turkish managers because the external financing that
they now obtain from arm’s length parties can be more costly.
H6: Corporate managers of BIST-listed firms show strong agreement in favor of the
transaction cost theory.
Emerging markets are generally characterized by higher volatility and greater risk,
compared to the developed markets. Corporations in these markets generally have more
cyclical and impermanent earnings (Adaoglu, 2000; Glen et al. 1995). In this context, the ISE
has been highly representative of a promising but very volatile emerging market, with high
returns in some years and large losses in others (CMB, 2003, 2014; Odabasi et al., 2004).
Accordingly, we conjecture that Turkish managers of dividend-paying firms distribute cash
dividends to their shareholders as more certainty attached to dividend payments against
expected capital gains in the future.
Page 10
10
H7: Corporate managers of BIST-listed firms show strong agreement in favor of the
bird-in-the-hand theory.
Turkey had a very late start in the liberalization of its economy and the establishment
of its stock market (the ISE) whose history only dates back to 1986 (Adaoglu, 2000; Aksu
and Kosedag, 2006). Although the ISE is a relatively young stock market, compared to the
developed stock exchanges with hundreds of years of historical development, corporations
trading in the ISE vary from old and well-established family-controlled business group
companies whose roots can be traced back to the 1920s to large holding companies generally
founded in the 1970s (Bugra, 1994; Yurtoglu, 2003) or even comparatively young and
growing firms that incorporated in the 2000s. This situation implies that the ISE firm’s life
cycles differ dramatically from one another, which could affect how their managers make
corporate dividend policy decisions. Therefore, we hypothesize that:
H8: Corporate managers of BIST-listed firms show strong agreement in favor of the
maturity theory of dividends.
In the presence of real world-market frictions and investors’ preferences, Miller and
Modigliani’s (1961) irrelevance theory becomes highly arguable and dividend policy may
matter. In fact, survey evidence (Baker and Powell, 1999, 2012; Baker and Kapoor, 2015;
Baker et al., 2006; Dhanani, 2005) shows that corporate managers believe that dividend
policy affects firm value and that they tend to follow deliberate dividend policies to maximize
their share price. Accordingly, we hypothesize that, considering the recent developments in
the Turkish market, Turkish managers pay careful attention to making dividend policy
decisions, instead of adopting a residual dividend policy because they consider that their
dividend payment decisions affect common share prices and consequently, shareholder
wealth.
H9: Corporate managers of BIST-listed firms perceive that dividend policy affects
firm value.
Our final hypothesis concerns the most important factors influencing dividend policy
decisions. The ISE-listed firms were subject to mandatory dividend policy regulations in the
early periods. Hence, the compulsory dividend payout ratio imposed by the regulators shaped
dividend payments. Nevertheless, the CMB of Turkey abolished mandatory dividend
payment regulations. Thus, beginning in the fiscal year 2009, ISE corporate managers had the
freedom to make dividend policy decisions. Turkey has also made a serious effort to
implement various major economic and structural reforms to improve its market economy
and integrate with world markets. In this context, we hypothesize that factors similar to those
of their counterparts in developed markets such as the United States, Canada, and European
countries now influence Turkish managers when making their dividend policy decisions.
H10: The most important factors influencing dividend policies of corporate managers
of BIST-listed firms and their peers in other developed markets are similar.
Page 11
11
5. Research methodology
In this section, we discuss the sample, survey design, data collection and response
rate, statistical methods, and limitations of our study.
5.1 Sample
Using the Public Disclosure Platform of Borsa Istanbul (KAP) (2017), we draw our
sample according to the following criteria. First, we consider all firms listed on the BIST-All
Shares Index during 2014. Second, we exclude financial sector companies and utilities as
they are governed by different regulations and follow arguably different investment and
dividend policies. After these exclusions, we select corporations that paid at least one or more
cash dividends to common shareholders between January 1, 2010 and December 31, 2014.
The reason for restricting our sample to dividend-paying BIST-listed firms is because we
focus on why firms pay dividends, consistent with studies such as Baker et al. (2002, 2006,
2008) and Baker and Powell (2012). Finally, these selection criteria result in 126 non-
financial and non-utility dividend-paying firms listed on the BIST.
5.2 Survey design
A survey provides the primary data for this study. We design our questionnaire
mainly after those modeled by Baker and Powell (2000) and Baker et al. (2001, 2002), and
later used by Baker et al. (2006, 2007) and Baker and Powell (2012), and also employ
questions related to dividend policy from Brav et al. (2005). We make minor modifications to
adapt the questionnaire to the Turkish context. Using a similar questionnaire permits
comparing the views of corporate managers of BIST-listed firms with those reported in
previous studies thus finding cross-country differences or similarities involving the
determinants of dividend policy. The survey instrument is available from the authors on
request.
The final version of our survey consists of 55 questions consisting of three different
types. The first type contains seven closed-ended questions about the background information
of managers and their firms. The second type asks managers to express the importance level
of 21 factors that may affect their dividend policy decisions (hereafter we refer to as F1
through F21), using a five-point scale where 0 = none, 1 = low, 2 = moderate, 3 = high, and 4
= very high. The third type asks managers to indicate their level of agreement or
disagreement with each of 27 statements about dividend policy in general (hereafter we refer
to as S1 through S27), using a five-point scale where strongly disagree = −2, disagree = −1,
neutral = 0, agree = +1, and strongly agree = +2. The survey takes about 15 minutes to
complete.
5.3 Data collection and response rate
After obtaining the names, e-mail addresses, and telephone numbers of the financial
officers/directors of our initial sample from the Public Disclosure Platform of Borsa Istanbul
(2017), we emailed a cover letter with the attachment of our questionnaire to the top manager
Page 12
12
of each of these 126 firms in the first week of April 2015. We again emailed our survey to
non-respondents at the beginning of May 2015. Furthermore, we contacted the remaining
non-respondents by telephone and reminded them about our research from mid-June 2015 to
increase the response rate and to reduce potential non-response bias. By early-August 2015,
we had received 57 usable responses (16 responses from the first emailing, 18 responses from
the second emailing, and 23 responses after making telephone reminders) from 126 firms,
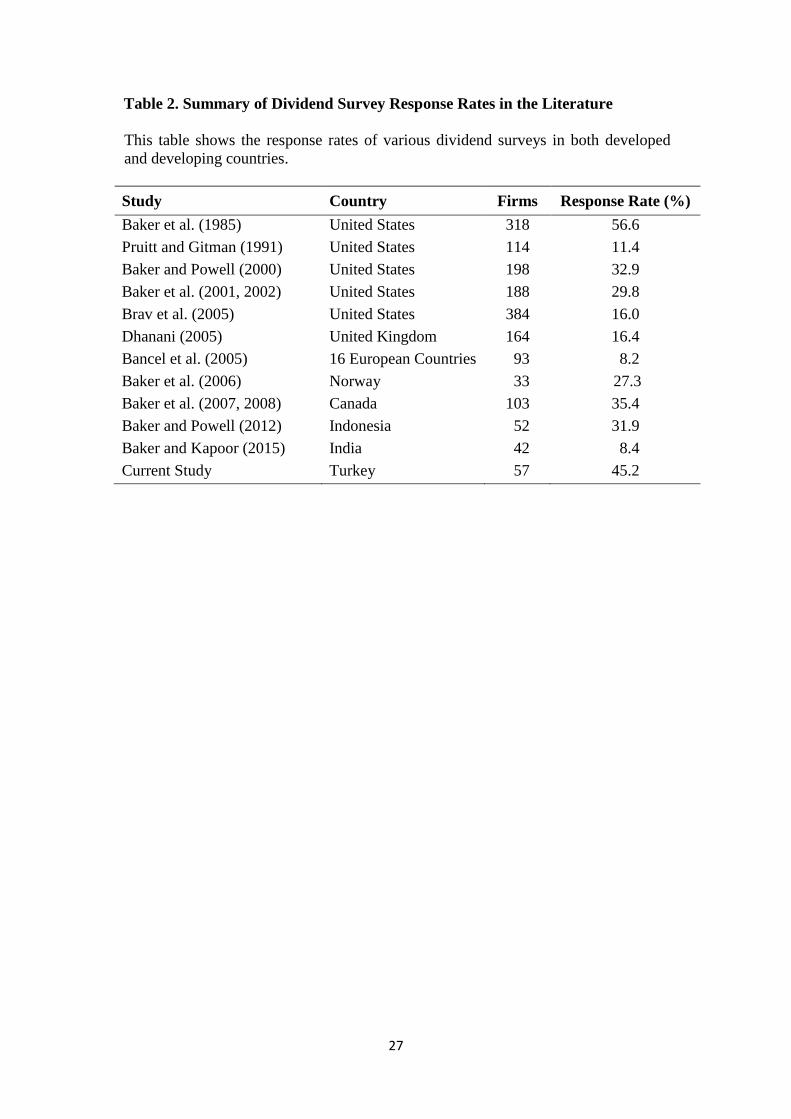
resulting in 45.2% response rate. As Table 2 shows, our response rate is relatively high
compared to rates obtained in similar studies. We also collect the secondary accounting and
financial data for our entire sample (both respondent and non-respondent firms) from
Datastream and Osiris databases to perform supplementary tests.
(Insert Table 2 here)
5.4 Statistical methods
We perform several statistical analyses to test our research hypotheses following prior
studies (Baker et al. 2006, 2008; Baker and Powell, 2012; Baker and Kapoor, 2015). First, we
employ a one-sample t-test for the null hypothesis that the mean response of the level of
agreement/disagreement for each of the 27 statements about dividend policy theories and
explanations equals 0 (neutral) on a five-point scale. Second, we again use a t-test to
determine whether the mean response for each of the 21 factors influencing dividend policy
differs significantly from 0 (no importance). Third, we estimate the Spearman rank
correlation coefficient (rs) to determine whether significant differences exist between the
rankings of these dividend factors by the corporate managers of BIST-listed firms and their
NYSE (New York Stock Exchange), NASDAQ (National Association of Securities Dealers
Automated Quotations), OSE (Oslo Stock Exchange), TSE (Toronto Stock Exchange), IDX,
and NSE counterparts. Lastly, we also conduct additional tests (i.e., Levene’s test, t-tests and
Wilcoxon test) for non-response bias.
5.5 Limitations
Our study has several possible limitations. First, despite a 45.2% response rate, non-
response bias could be present. Following Baker and Kapoor (2015), we compare
characteristics of the 57 responding firms to those of the 69 non-responding firms applying
Levene’s test for equality of variance, t-tests for equality of means (when equality of variance
is assumed and not assumed) and the non-parametric Wilcoxon test.
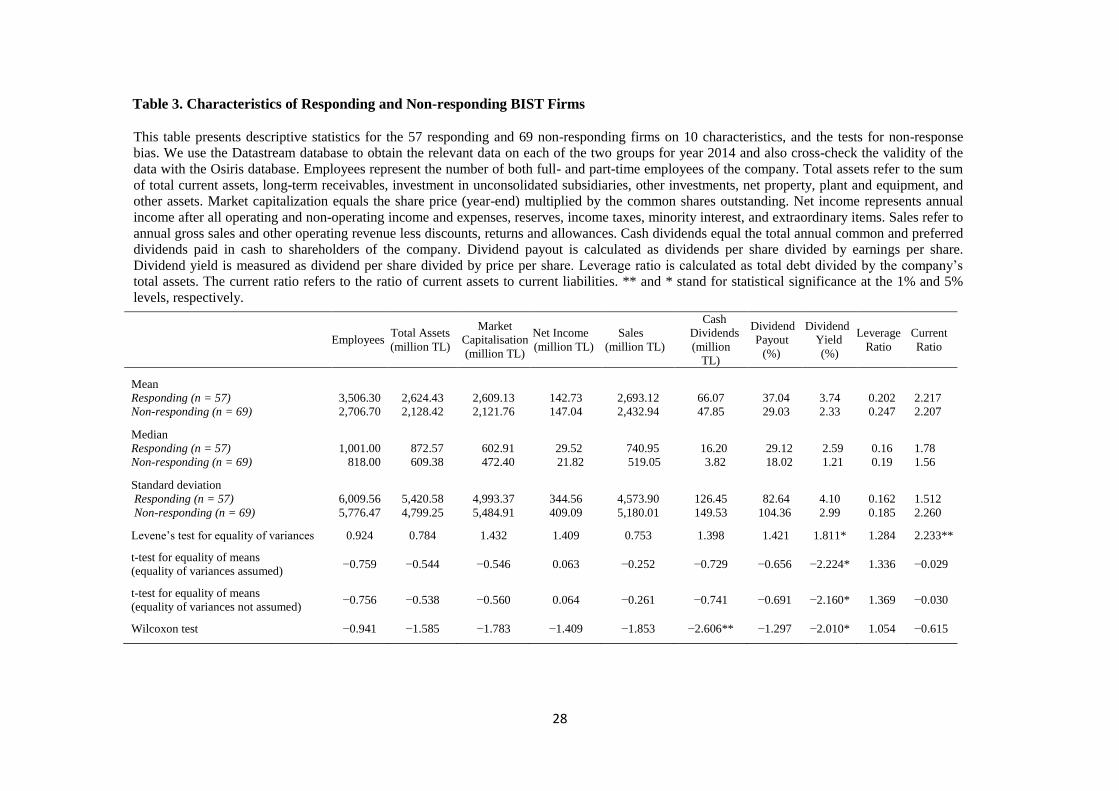
(Insert Table 3 here)
As Table 3 displays, we analyze 10 firm characteristics (number of employees, total
assets, market capitalization, net income, sales, cash dividends, dividend payout, dividend
yield, leverage, and current ratios) for responding and non-responding firms based on 2014,
to determine whether the two groups differ significantly on each characteristic. The analyses
reveal that only one of the 10 characteristics, namely dividend yield, differs significantly at
the 5% level for all tests. Specifically, the responding firms have a higher dividend yield than
Page 13
13
the non-responding firms. The Wilcoxon test for cash dividends and the Levene’s test for the
current ratio report a significant difference at the 1% level between the two groups, while
other tests find no significant difference on these characteristics. Nevertheless, the results in
Table 3 show no significant differences exist between the responding and non-responding
firms on any of the remaining seven characteristics at the 5% level. This evidence indicates
that the firm characteristics of the two groups appear statistically similar. Hence, we conclude
that non-response bias does not appear to be a major concern.
Second, we limit our sample to dividend-paying firms because we only focus on why
firms pay dividends. The topic of why companies pay no dividends or how managers of non-
dividend paying firms perceive dividends could be the subject of another research study.
Hence, generalizing our findings to firms whose characteristics differ from those of our
current sample requires caution.
6. Results and discussion
We report our survey results in four sub-sections. The first sub-section presents the
profile information about respondents and their firms. The second sub-section illustrates the
level of support given by the respondents to various theories and explanations involving cash
dividends. The third sub-section examines the importance of factors affecting dividend
policy. The fourth sub-section investigates whether responses to our survey differ based on
different firm characteristics.
6.1 Profile of respondents and firms
Of the 126 surveys, 57 responding firms represent 11 broad industries of which the
most common types are basic resources (19.3%), industrial goods and services (19.3%),
construction and materials (17.5%), and personal households and goods (10.5%), which
constitute almost 67% of all firms. Of the 57 respondents, 84.2% confirm that they are
actively involved in making their companies’ dividend policy decisions. The most common
titles of the respondents are chief financial officer (52.6%), director of finance (26.3%), and
chief executive officer (8.8%), whereas the remaining respondents hold positions such as
director of investor relations, chief accountant, and general manager (finance). Thus, survey
respondents represent top managers of the responding firms who are generally involved in the
dividend policy of their firms.
Of the responding firms, 91.2% only paid dividends during the last five years and
8.8% both paid dividends and repurchased shares. This evidence may reflect that managers of
dividend-paying BIST firms do not view share repurchases as substitutes for dividends,
unlike some U.S. counterparts suggested by Brav et al. (2005). When asked what would be
the most likely alternative use if they had not paid dividends, 52.6% of the respondents
indicated that they would invest more. The second and third most popular answers are to pay
off their own debt (22.8%) and retain the funds as cash (15.8%), followed by using for
mergers/acquisitions and repurchasing shares (5.3% and 3.5%, respectively). Most managers
(82.5%) indicate that they re-examine their firms’ dividend policies annually, compared with
Page 14
14
7.1% that reported every 3 to 5 years, 3.5% that said every six months, and 6.9% stated that
they reconsider their dividend decisions when necessary.
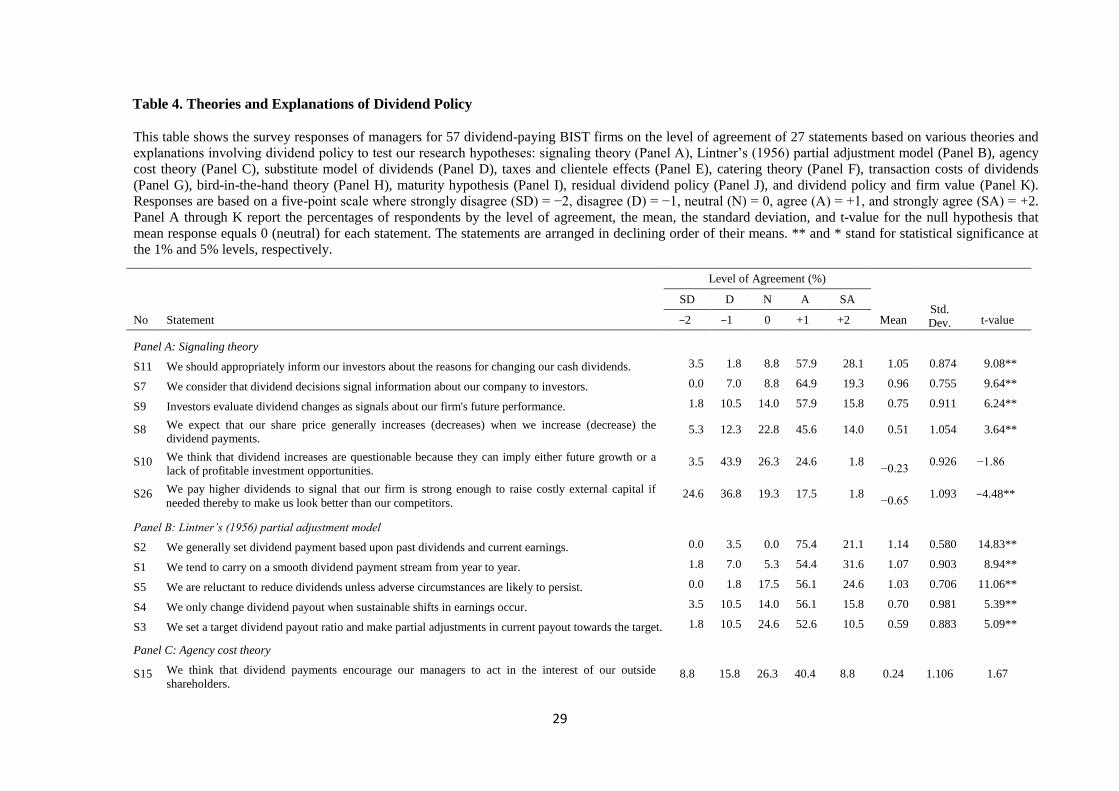
6.2 Theories and explanations involving cash dividends
We test our research hypotheses by investigating the level of support given by
corporate managers of BIST-listed firms to 27 statements based on various theories and
explanations for paying cash dividends. Table 4 presents the survey results from the
respondents, by reporting the descriptive statistics (percentages, mean, and standard
deviation) and t-value for the null hypothesis that mean response equals 0 (neutral) for each
statement.
(Insert Table 4 here)
Panel A in Table 4 shows the responses to six statements (S7, S8, S9, S10, S11, and
S26) based on signaling theory. The mean responses of four of these statements are positive
and differ significantly from 0 (neutral) at the 1% level. Of the 57 responding managers, 86%
of them agree that their firms should appropriately inform their investors about the reasons
for changing cash dividends (S11). About 84% of managers consider that their dividend
decisions signal information about their company to investors (S7). Close to 74% of
respondents believe that investors evaluate dividend changes as signals about their firm’s
future performance (S9). Similarly, nearly 60% of managers think that their share price
generally increases (decreases) when their firms increase (decrease) dividend payments (S8).
Consequently, the evidence from these four statements provides support for the signaling
explanation. Moreover, the mean of manager opinions on one of these statements also differs
significantly from 0 at the 1% level but is negative. More than 61% of managers disagree
with the statement that their firms pay higher dividends to signal that their firm is strong
enough to raise costly external capital if needed thereby making them look better than their
competitors (S26). This finding implies that corporate managers of BIST-listed firms are
more concerned with changes in dividends from one period to the next, rather than the
absolute level of dividends. Additionally, the respondents’ views vary about whether
dividend increases are questionable (S10) with a mean value that does not significantly differ
from 0 at the 5% level. In summary, our results suggest that the dividend-paying corporate
managers of BIST-listed firms are aware of signaling and agree with the notion that changes
in dividends have signaling effects. Hence, this evidence lends support to H1.
Panel B in Table 4 reports corporate managers of BIST-listed firms’ views on five
statements (S1, S2, S3, S4, and S5) based on Lintner’s (1956) behavioral model explaining
the corporate dividend setting process and patterns. The mean manager responses to all five
statements are statistically significant from 0 (neutral) at the 1% level. More than 96% of the
managers confirm that they set dividend payments based upon past dividends and current
earnings (S2). About 86% of the managers indicate that they tend to carry on a smooth
dividend payment stream from year to year (S1). Close to 81% of respondents report that they
are reluctant to reduce dividends unless adverse circumstances are likely to persist (S5).
Almost 72% of the respondents state that they only change dividend payout when sustainable
Page 15
15
shifts in earnings occur (S4). About 63% declare that they set a target dividend payout ratio
and make partial adjustments in current payout toward the target (S3). Accordingly, Panel B
shows that dividend-paying BIST-listed firms’ managers set their cash dividends in line with
Lintner’s dividend model. The responding corporate managers of BIST-listed firms make
their dividend decisions conservatively, determining dividend payouts based on sustainable
earnings, and using a target payout ratio. They pursue stable dividend policies and are
reluctant to cut dividends except in extreme cases. Therefore, the survey evidence provides
support for H2.
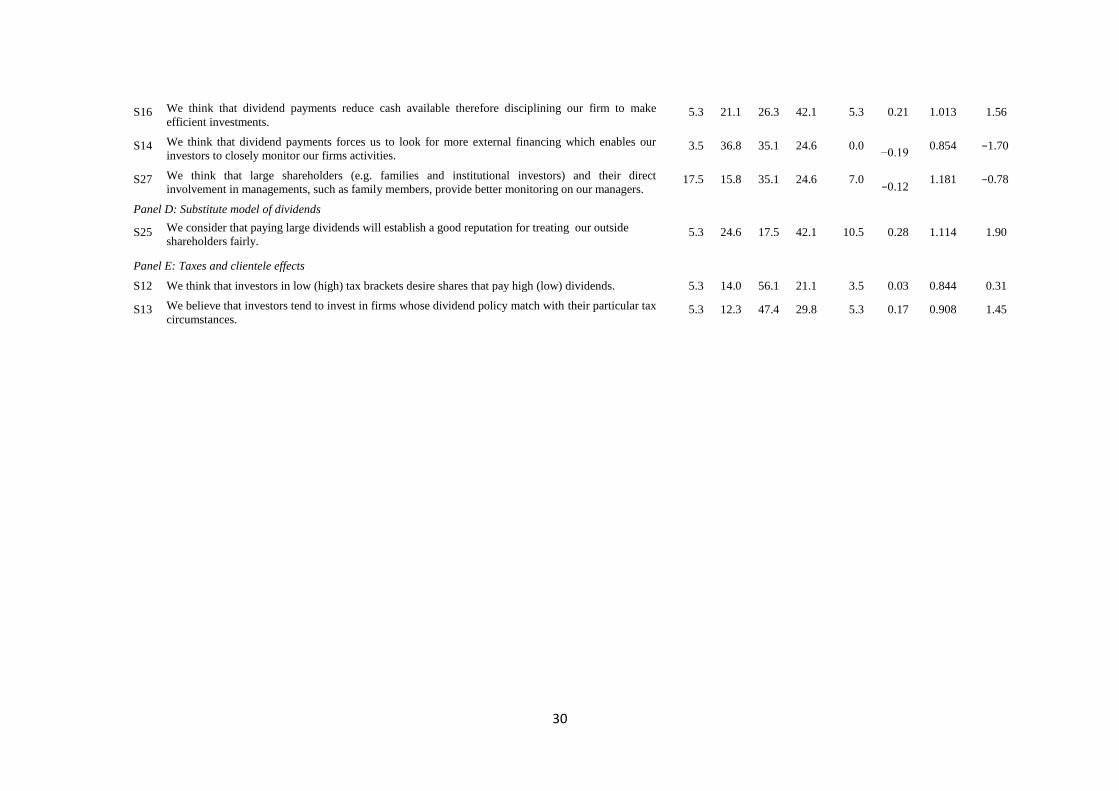
Panel C in Table 4 presents the results of managers’ responses to four statements
(S14, S15, S16, and S27) involving agency cost theory but none of them is statistically
significant from 0 (neutral). About 35% of the respondents are neutral about whether
dividends force them to look for more external financing, which subjects their firms to
scrutiny by investors (S14), and whether large shareholders and their direct involvement in
management provide better monitoring (S27). On average, they disagree with S14 and S27.
Although almost half of the responding managers think that dividends encourage them to act
in the interest of their outside shareholders (S15) and agree that dividends reduce cash
available hence disciplining them to make efficient investment (S16), the remainder has no
idea or disagree with these two statements. Accordingly, our evidence from corporate
managers of BIST-listed firms does not support the agency cost explanation for paying cash
dividends, which is consistent with previous survey studies such as Baker et al. (2007) in
Canada and Baker and Kapoor (2015) in India. This finding might reflect improvements in
corporate governance and transparency and disclosure practices implemented by the
publication of the CMB of Turkey’s Corporate Governance Principles in 2003 and greater
compliance to these principles by corporate managers of BIST-listed firms in the post-2003
period. However, it may also be the result of refusal to recognize or disclose the existence of
agency conflicts, as Baker and Kapoor (2015) suggest.
Moreover, evidence in Panel D of Table 4 reveals that more than 52% of the
respondents agree with the statement that paying large dividends will establish a good
reputation for treating their outside shareholders fairly (S25). However, the mean response to
this statement does not differ significantly from 0 (neutral) at the 5% level. Hence, the
substitute model of dividends, developed by La Porta et al. (2000), which posits that
dividends are substitutes for legal protection in the countries with poor shareholders’
protection and establish a reputation for good treatment of minority investors, receives
insufficient support in explaining cash dividend decisions of corporate managers of BIST-
listed firms. This finding means that these managers do not appear to use cash dividends as
an internal disciplinary device or as a reputation mechanism. Thus, based on the survey’s
finding, we reject H3.
Panel E in Table 4 shows the responses to two statements (S12 and S13) involving
taxes and clientele effects. The mean responses of both statements do not differ significantly
from 0 (neutral). About 56% of managers are unsure about whether investors in low (high)
tax brackets desire shares that pay high (low) dividends (S12). Almost 48% of them have no
Page 16
16
idea about whether investors tend to invest in firms whose dividend policy matches with their
particular tax circumstances (S13). These findings are consistent with Baker et al. (2002) and
Brav et al. (2005) in the United States, and Baker et al. (2006) in Norway, who report little or
no support for tax-related explanations. Accordingly, although differences exist between the
tax rate on capital gains and cash dividends as well as in the taxation of dividends among
investors in Turkey, our survey results find little evidence that corporate managers of BIST-
listed firms favor the tax-preference or clientele effects for paying dividends. Therefore, this
evidence leads us to reject H4.
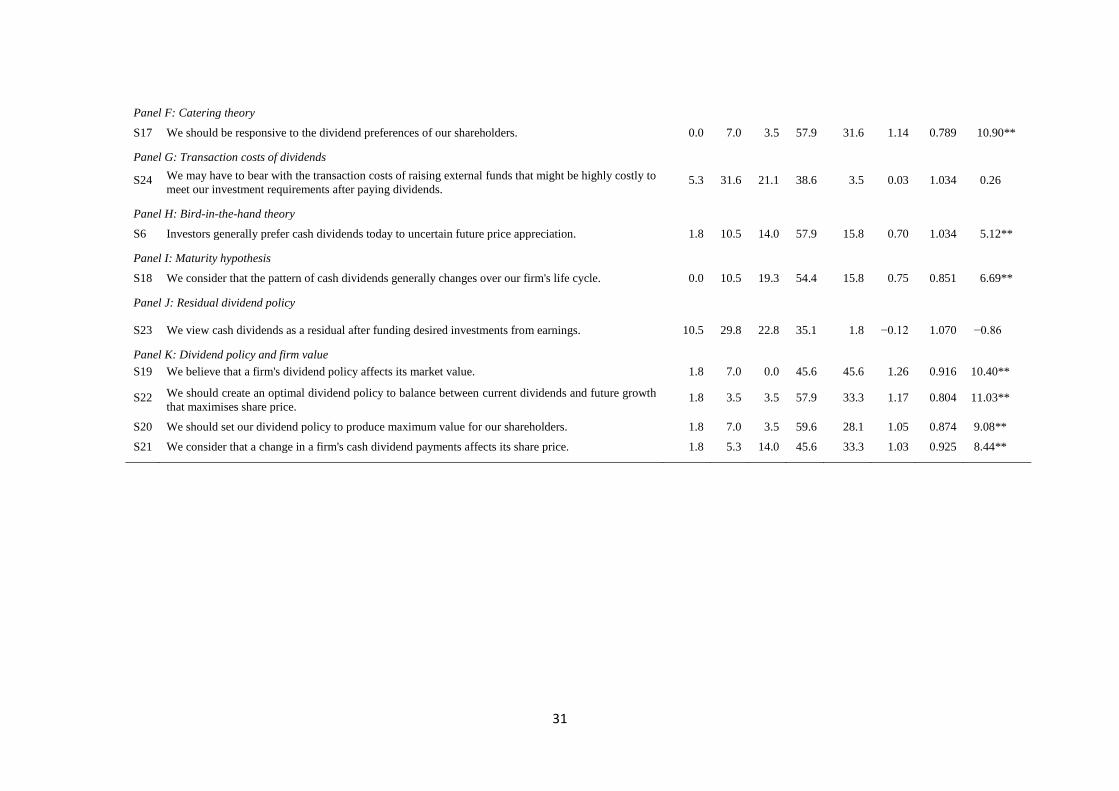
As Panel F in Table 4 presents, about 90% of respondents agree that they should be
responsive to the dividend preferences of their shareholders (S17). In fact, the mean response
is the second highest among 27 statements about theories/explanations for paying dividends
and differs significantly from 0 (neutral) at the 1% level. This evidence is consistent with the
catering theory of dividends and the survey results of Baker and Powell (2012) and Baker and
Kapoor (2015) from Indonesia and India, respectively. Consequently, Baker and Wurgler
(2004a, 2004b) suggest that investor demands determine the managers’ decisions to pay
dividends. Our evidence reveals that corporate managers of BIST-listed firms take their
shareholders’ preferences into consideration while making dividend payment decisions.
Hence, the survey evidence provides support for H5.
Panel G in Table 4 provides the responses to a statement related to the transaction
costs of dividends (S24). The survey asks corporate managers of BIST-listed firms to express
their agreement on whether they have to bear the transaction costs of raising external funds
that might be highly costly to meet their investment requirements after paying dividends. The
mean responses to this statement do not differ significantly from 0 (neutral) at the 5% level.
About 21% of the responding managers are neutral and almost 37% of them do not agree,
whereas the remaining 42% of respondents agree with the statement. Hence, our evidence
indicates that responding managers generally do not consider transaction costs of dividends
as a troubling issue when making dividend payment decisions. Therefore, we reject H6.
Panel H in Table 4 presents the managers’ responses to a statement of the bird-in-the-
hand theory (S6). These positive mean responses differ significantly from 0 (neutral) at the
1% level. Consistent with the bird-in-the-hand theory, almost 74% of the responding
managers think that investors generally prefer cash dividends today to uncertain future price
appreciation. Our evidence is contrary to the findings of surveys of Baker and Powell (2000)
and Baker et al. (2001) who report no support for this explanation for paying dividends from
NYSE and NASDAQ managers. Further, studies of Indian (Baker and Kapoor, 2015) and
Indonesian (Baker and Powell, 2012) firms find inconclusive evidence about how managers
perceive the bird-in-the-hand theory. In this respect, our survey reveals that our respondents
consider that their shareholders/investors are more conservative than their colleagues in those
markets and hence they favor the bird-in-the-hand theory. Thus, our survey evidence lends
support to H7.
Panel I in Table 4 shows mangers’ opinions about the maturity (firm life cycle) theory
of dividends. About 70% of managers state that the pattern of cash dividends generally
Page 17
17
changes over their firm’s life cycle (S18), with the mean response that is positive and
significantly different from 0 (neutral) at the 1% level. Therefore, corporate managers of
BIST-listed firms generally express agreement with the maturity theory of dividends
consistent with NSE, IDX, TSX, NASDAQ, and NYSE managers as reported by previously
mentioned surveys. This evidence provides support for H8.
Panel K in Table 4 displays the responses of corporate managers of BIST-listed firms
to four statements (S19, S20, S21, and S22) about dividend policy and firm value. The mean
responses to all four statements differ significantly from 0 (neutral) at the 1% level. The
evidence reveals that about 91% of managers believe that a firm’s dividend policy affects its
market value (S19) and they should create an optimal dividend policy to balance between
current dividends and future growth that maximizes share price (S22). Almost 88% of
managers think that they should set their dividend policy to produce maximum value for their
shareholders (S20). Close to 79% of managers express their agreement that a change in a
firm’s cash dividend payments affects its share price (S21). Subsequently, the results shown
in Panel K reveal that the responding managers perceive that dividend policy matters and
affects firm value in contrast to Miller and Modigliani’s (1961) dividend irrelevance theory.
This finding is not surprising given the perfect market conditions assumed by Miller and
Modigliani.
Panel J in Table 4 provides the managers’ responses to a statement about residual
dividend policy (S23). Around 40% of managers do not view cash dividends as a residual
after funding desired investments from earnings, whereas 23% of them are neutral about this
statement. Given that the mean responses to S23 do not differ significantly from 0 (neutral),
this means that the responding managers generally do not support a residual dividend policy.
As previously mentioned, our survey results suggest that respondents believe that dividend
policy matters and affects firm value and therefore shareholder wealth. These managers
typically attempt to follow managed dividend policies with a specific pattern of dividend
payments that involves dividend smoothing, instead of simply paying out whatever remains
after funding investments from internally generated cash flows. Thus, our survey evidence
provides support for H9.
In summary, our survey evidence from managers of dividend-paying BIST firms
provides general support for the signaling theory, Lintner’s (1956) partial adjustment model,
catering, maturity (firm life cycle), and bird-in-the-hand hypotheses for explaining cash
dividends. However, the results do not support the agency cost theory, substitution model of
dividends, tax-related explanations, transaction cost theory, and residual dividend policy.
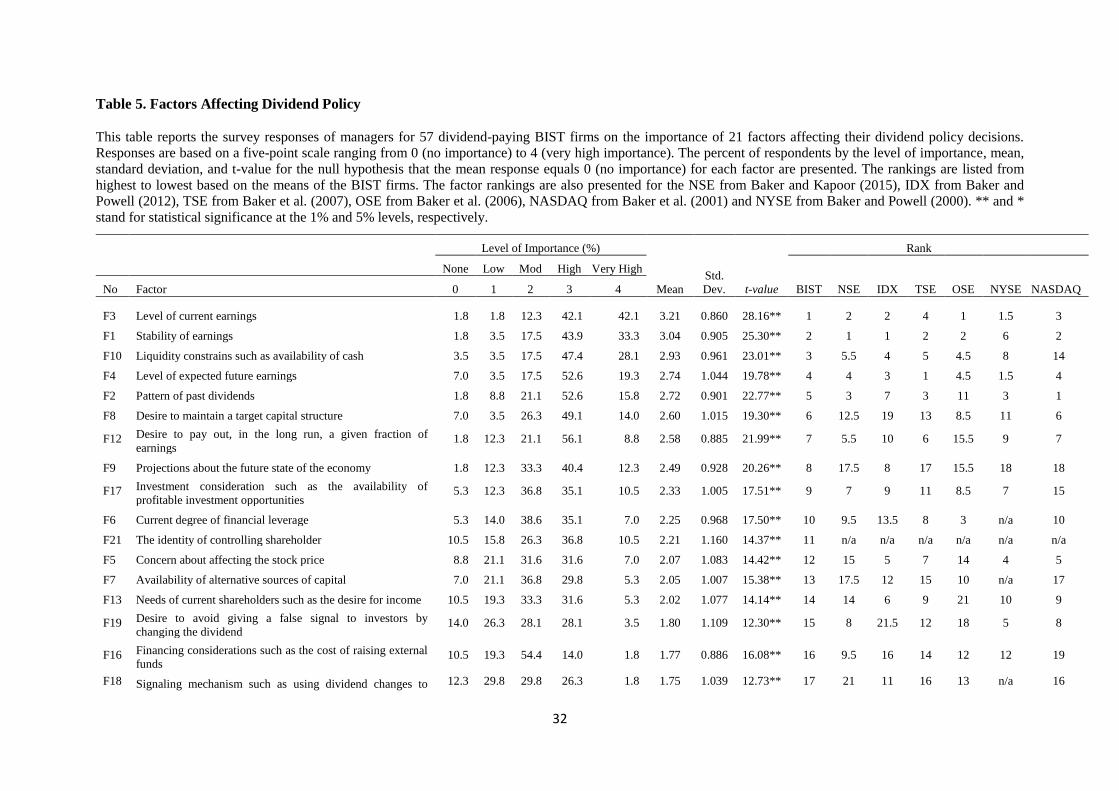
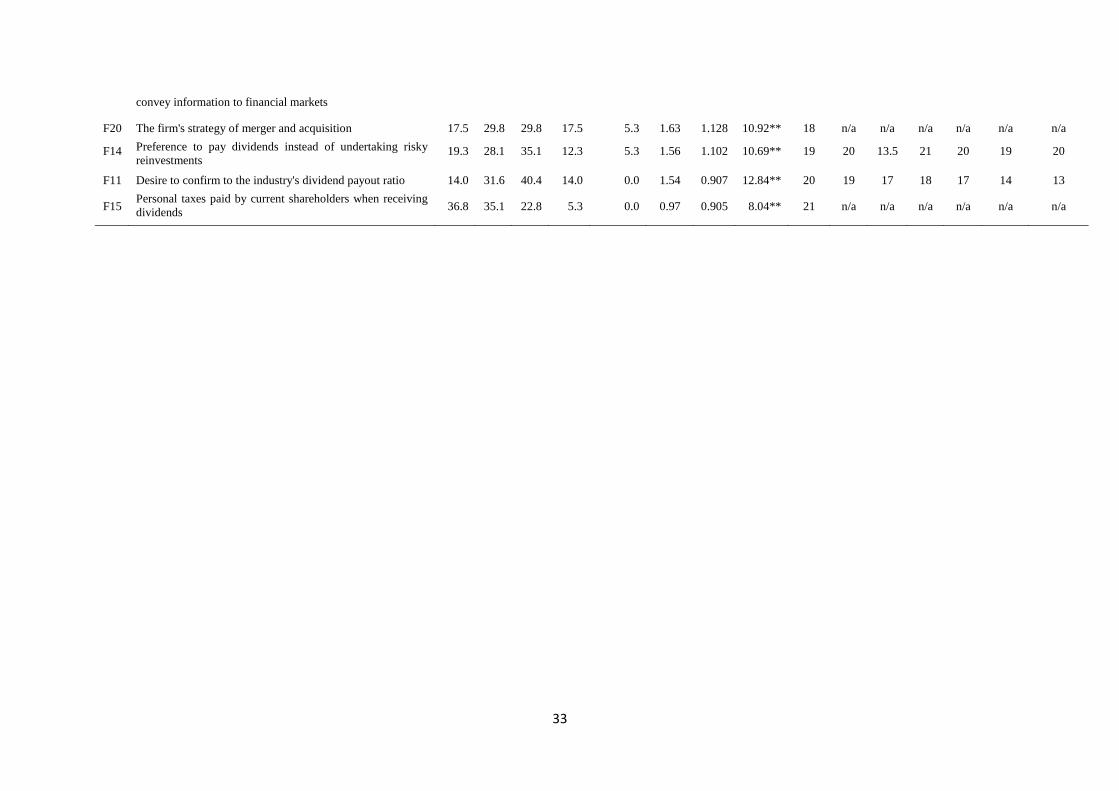
6.3 Factors affecting dividend policy
Our final hypothesis relates to the most important factors affecting dividend policy
decisions of corporate managers of BIST-listed firms. This hypothesis tests whether these
managers give similar or different overall importance to factors influencing dividend policy
compared to managers from developed markets. Table 5 shows the level of importance of 21
potential factors of the dividend policies of the responding companies, by reporting the
Page 18
18
descriptive statistics and the results for each of the 21 factors ranked by their mean score
along with their corresponding t-statistic for the null hypothesis that the mean response
equals 0 (no importance).
(Insert Table 5 here)
As Table 5 shows, the positive t-values for all 21 factors are statistically significant at
the 1% level, indicating that the mean importance level of each of these factors is
significantly greater than 0. This means that corporate managers of BIST-listed firms view all
21 factors as important to some degree in making their dividend policy decisions. The
following discussion focuses on the highest ranked factors.
The results reveal that at least half of the responding managers identify eight factors
as being of high/very high importance (F1, F2, F3, F4, F8, F9, F10, and F12). The three most
highly ranked factors are the level of current earnings (F3), the stability of earnings (F1), and
liquidity constrains such as availability of cash (F10) (84.2%, 77.2%, and 75.5%,
respectively). The fourth highest ranked factor is the level of expected future earnings (F4)
(71.9%). Given that three of four highest ranked factors relate to earnings, this implies that
respondents place high importance on earnings. A likely justification for this ranking is
because earnings are closely associated with cash flows and cash generally serves as the basis
for paying dividends. One of these four most highly ranked factors concerns the availability
of cash in terms of liquidity constraints (F10), suggesting that the availability of cash affects a
firm’s ability to distribute cash dividends. Furthermore, the pattern of past dividends (F2)
ranks as the fifth highest factor by about 68% of respondents. Hence, our results provide
strong evidence that managers of the dividend-paying BIST firms set their dividend policies
(1956) suggested more than 60 years ago. This evidence is also consistent with the responses
illustrated in Panel B of Table 4, which show that respondents report following a traditional
Lintner-style managed dividend policy. Other factors having at least half of the responding
managers view as important are the desire to maintain a target capital structure (F8), the
desire to pay out, in the long run, a given fraction of earnings (F12), and projections about the
future state of the economy (F9) (63.1%, 64.9%, and 52.7%, respectively).
The Spearman rank order correlation coefficient (rs) is the measure used to determine
whether a significant association exists between the rankings of the dividend factors given by
managers of the BIST and managers from developed markets, such as the NYSE and
NASDAQ (United States), TSE (Canada), and OSE (Norway). We also calculate the
Spearman rank correlation coefficients for NSE (Indian) and IDX (Indonesian) managers to
identify if corporate managers of BIST-listed firms give similar or different overall
importance to factors influencing dividend policy compared to their counterparts in different
emerging markets. Table 5 shows the rankings, which are provided from a number of prior
studies. More precisely, we obtain the rankings for the NSE from Baker and Kapoor (2015),
IDX from Baker and Powell (2012), TSE from Baker et al. (2007), OSE from Baker et al.
(2006), NASDAQ from Baker et al. (2001), and NYSE from Baker and Powell (2000). The
related correlation coefficients are as follows; 0.823 for BIST-NSE, 0.698 for BIST-IDX,
Page 19
19
0.810 for BIST-TSE, 0.740 for BIST-OSE, 0.653 for BIST-NASDAQ (all significant at the
1% level) and 0.620 for BIST-NYSE (significant at the 5% level). As hypothesized, these
results reveal that corporate managers of BIST-listed firms rank the factors affecting their
dividend policy decisions in a significantly positive way along with their peers of these
developed (TSE, OSE, NYSE, and NASDAQ) markets. Therefore, these results lend support
to H10. Likewise, our results indicate that respondents also rank the dividend factors
similarly to their counterparts in other emerging (NSE and IDX) markets. Finally, although
characteristics of both these firms and markets differ in many aspects (e.g. adequate
disclosure, laws and regulations, institutional environment, corporate governance practices
and ownership structures, political, social and financial stability), the rankings reveal that the
factors related to earnings (F1, F2, F3, and F4) are always among the most highly ranked by
managers of firms listed on all seven markets. Specifically, stability of earnings (F1), the
level of current and expected future earnings (F3 and F4), and the pattern of past dividends
(F2) appear to be the most important factors in making corporate dividend policy decisions.
This finding is consistent with the pioneering study of Lintner (1956) and surveys conducted
decades ago by Baker et al. (1985) and Pruitt and Gitman (1991).
6.4 Firm characteristics and survey responses
In this sub-section, we perform additional tests to investigate whether managerial
responses to our survey differ based on various firm characteristics. We also provide further
information about the distribution of our survey responses. Accordingly, we start by
partitioning our sample into (1) firms with low and high dividend distribution frequency, (2)
low and high payout firms, (3) small- and large-size firms, (4) low and high growth firms, (5)
low and high profitability firms, (6) low and high levered firms, and (7) family-controlled
firms. Following previous studies (Dhanani, 2005; Baker et al., 2012), we use Wilcoxon
rank-sum tests to identify if the responses from each pair in the sub-sample of a firm’s
characteristics differ on each of the 27 statements and 21 factors. Due to space limitations, we
summarize the results of these tests, which are available from the authors on request.
The results of the Wilcoxon rank-sum tests involving the managerial responses on the
agreement of 27 statements related to various theories and explanations of dividend policy
are generally similar across the seven sub-samples. Overall, different firm characteristics do
not change the levels of statistical significance of our research hypotheses and thus do not
affect our major findings. However, a few significant differences occur in the agreement
levels of different sub-samples’ managers. Among the explanations receiving support from
our study, we test the signaling theory using six statements (S7, S8, S9, S10, S11 and S26).
Of the seven sub-samples, only managers in the profitability group exhibit significantly
different mean responses at the 5% level for just one statement (S8). Specifically, managers
of low profitability firms express more agreement with the notion that their share price
generally increases (decreases) when their firms increase (decrease) dividend payments.
Regarding Lintner’s (1956) partial adjustment model, only managers of the leverage group
have significantly different mean responses at the 5% level for one (S2) of the five statements
(S1, S2, S3, S4, and S5). That is, managers of low-levered firms indicate more agreement
Page 20
20
with the statement that they set dividend payments based on past dividends and current
earnings.
Considering the other arguments supported by our survey findings, managers’
responses to the statements relating to catering theory (S17) and the maturity hypothesis
(S18) show no significant differences between any pairs of these seven sub-samples. By
contrast, managers in the dividend payout ratio, leverage, and family-controlled groups
display significantly different responses at the 5% level to the statement of the bird-in-the-
hand theory (S6). Specifically, managers of high payout and high levered family-controlled
companies give more weight to the idea that investors generally prefer cash dividends today
to uncertain future price appreciation, compared to the managers of low-payout and low-
levered non-family companies. Additionally, only managers of family-controlled firms
exhibit significantly different mean responses at the 5% level to two (S19 and S22) of the
four statements (S19, S20, S21, and S22) in relation to dividend policy and firm value. More
specifically, managers of family firms express higher levels of agreement with statements
that dividend policy affects market value and that they should create an optimal dividend
policy to balance current dividends and future growth to maximize share price.
The test results on firm characteristics’ sub-samples do not support the agency cost
and transaction cost theories, substitute model of dividends, tax-related and residual dividend
policy explanations, which are consistent with our main findings. Mean responses to the
statements about the substitute model (S25), transaction cost theory (S24), and residual
dividend policy (S23) provide no significant differences across any pairs of all sub-groups.
Although the results do not support the agency cost theory and tax-related explanations,
managers of high payout and smaller size firms exhibit more agreement to the idea that
dividend payments reduce excess cash and hence discipline firms to make efficient
investments (S16). Managers of non-family firms strongly disagree with the argument that
large shareholders and their direct involvement in management provide better monitoring
(S27). Additionally, managers of low-payout firms agree more strongly with the statement
that investors in low (high) tax brackets desire shares that pay high (low) dividends (S12).
Finally, we analyze the results of the Wilcoxon rank-sum tests for the managerial
responses on the importance of 21 factors affecting dividend policy based on seven different
firm-characteristic sub-samples. The evidence reveals only a few significant differences
about the perceptions of managers involving the seven groups toward these factors. For
instance, of the eight most highly ranked factors based on importance (F1, F2, F3, F4, F8, F9,
F10, and F12), only two factors (F2 and F10) have significantly different responses at the 1%
level and 5% level, respectively. Each factor differs based on only one group (i.e., the
profitability and growth sub-samples, respectively). In particular, managers of high
profitability firms attach greater importance to the pattern of past dividends (F2), whereas
managers of high growth firms exhibit more concern about liquidity constraints such as
availability of cash (F10). Although a few more significant differences exist involving other
factors, the results generally suggest that different firm characteristics are not related to
noteworthy differences in the distribution of our survey responses.
Page 21
21
7. Conclusions
This study provides new survey-based evidence on how managers of dividend-paying
BIST-listed firms view various theories/explanations for paying cash dividends and the most
important factors affecting their dividend policy decisions. This survey evidence is important
because it investigates the perceptions of managers of an emerging market after receiving
greater flexibility in making dividend payment decisions. Previously, Turkish firms had strict
mandatory dividend policy rules, which changed after Turkish authorities implemented major
economic and structural reforms for market integration and abolished the compulsory
dividend payout regulatory framework. The findings of this study lead to several conclusions
about dividend policy.
First, several studies conducted in early periods in Turkey report that Turkish-listed
firms generally concentrated on the mandatory dividend payout ratio imposed by the
regulations (Adaoglu, 2000; Aivazian et al., 2003a). Hence, managers based their cash
dividend payments on the firm’s current year earnings and the level of cash dividends
reflected any variability in earnings. Consequently, dividend smoothing or stability was not a
major consideration. Currently, however, managers of dividend-paying BIST-listed firms
appear to follow managed dividend policies with a specific pattern of dividend payments that
involves dividend smoothing. Consistent with Lintner (1956), they are conservative in
making their dividend decisions, determining dividend payouts based on sustainable earnings,
using a target payout ratio, and making partial adjustments in current payout toward the
target. Hence, these firms pursue stable dividend policies. These managers tend to cut
dividends in extreme cases.
The results further show that respondents perceive that dividend policy affects firm
value and changes in dividends influence share prices and thus shareholder wealth.
Accordingly, these managers believe that they should set their firm’s dividend policies to
maximize shareholder wealth by formulating an optimal dividend policy that balances
between current dividends and future growth. Respondents express strong support for the
signaling, catering, maturity (firm life cycle) and bird-in-the-hand theories. However, the
evidence offers little or no support for agency cost theory, substitute model of dividends, tax-
related explanations, transaction cost theory, and residual dividend policy. The survey
evidence supports multiple theories for paying cash dividends in the Turkish market, which is
inconsistent with a universal or “one-size-fits-all” explanation for paying dividends.
The survey evidence also shows that the most important factors affecting the dividend
policy of BIST-listed firms relate to earnings, specifically, the level of current and expected
future earnings as well as the stability of earnings. Liquidity constraints such as availability
of cash and the pattern of past dividends are other important factors identified by the
responding managers. Comparisons between the views of managers of BIST-listed firms and
their peers in other developed (TSE, OSE, NYSE, and NASDAQ) and emerging (NSE and
IDX) markets on the dividend factors reveal statistically significant positive correlations. This
finding suggests that after implementing major economic and structural reforms and
abolishing mandatory dividend payment requirements, corporate managers of BIST-listed
Page 22
22
firms follow similar dividend policy factors and patterns of dividend policy as managers in
more developed countries.
The factors related to earnings and past dividends appear to be the most highly ranked
determinants for all seven markets, despite differing characteristics among these markets.
These results lead to the conclusion that some factors are typically more important than
others without claiming that they are a universal set of determinants applicable equally to all
firms. However, our evidence reveals that different firm characteristics reflect few
statistically significant differences in the distribution of our survey responses.
References
Adaoglu, C. (1999). Regulation influence on the dividend policy of the Istanbul Stock
Exchange (ISE) corporations. The Istanbul Stock Exchange (ISE) Review – Quarterly
Economics and Finance Review, 3 (11), 1‒19.
Adaoglu, C. (2000). Instability in the dividend policy of the Istanbul Stock Exchange (ISE)
Corporations: Evidence from an emerging market. Emerging Markets Review, 1 (3), 252‒
270.
Adaoglu, C. (2008). Dividend policy of the ISE industrial corporations: The evidence
revisited (1986‒2007). Journal of BRSA Banking and Financial Markets, 2 (2), 113‒135.
Aivazian, V., Booth, L., & Cleary, S. (2003a). Dividend policy and the organisation of capital
markets. Journal of Multinational Financial Management, 13 (2), 101‒121.
Aivazian, V., Booth, L., & Cleary, S. (2003b). Do emerging market firms follow different
dividend policies from US firms? Journal of Financial Research, 26 (3), 371‒387.
Aksu, M., & Kosedag, A. (2006). Transparency and disclosure scores and their determinants
in the Istanbul Stock Exchange. Corporate Governance, 14 (4), 277‒296.
Al-Najjar, B., & Kilincarslan, E. (2016). The effect of ownership structure on dividend
policy: Evidence from Turkey. Corporate Governance: The International Journal of
Business in Society, 16 (1), 135‒161.
Anderson, R. C., & Reeb, D. (2003). Founding-family ownership and firm performance:
Evidence from the S&P 500. Journal of Finance, 58 (3), 301‒1328.
Ararat, M., & Ugur, M. (2003). Corporate governance in Turkey: An overview and some
policy recommendations. Corporate Governance, 3(1), 58‒75.
Baker, H. K. (ed.). (2009). Dividends and Dividend Policy. Hoboken, NJ: John Wiley & Sons
Inc.
Baker, H. K., Chang, B., Dutta, S. & Saadi, S. (2012). Why companies do not pay dividends:
The Canadian experience. Journal of Business Finance & Accounting, 39 (9-10), 1330-1356.
Page 23
23
Baker, H. K., Dutta, S., & Saadi, S. (2008). Impact of financial and multinational operations
on manager perceptions of dividends. Global Finance Journal, 19 ( 2), 171‒186.
Baker, H. K., Farrelly, G. E., & Edelman, R. B. (1985). A survey of management views on
dividend policy. Financial Management, 14 (3), 78‒84.
Baker, H. K., & Kapoor, S. (2015). Dividend policy in India: New survey evidence.
Managerial Finance, 41 (2), 182‒204.
Baker, H. K., Mukherjee, T. K., & Paskelian, O. G. (2006). How Norwegian managers view
dividend policy. Global Finance Journal, 17 (1), 155‒176.
Baker, H. K., & Powell, G. E. (1999). How corporate managers view dividend policy.
Quarterly Journal of Business and Economics, 38 (2), 17‒35.
Baker, H. K., & Powell, G. E. (2000). Determinants of corporate dividend policy: A survey
of NYSE firms. Financial Practice and Education, 10 (1), 29‒40.
Baker, H. K., & Powell, G. E. (2012). Dividend policy in Indonesia: Survey evidence from
executives. Journal of Asia Business Studies, 6 (1), 79‒92.
Baker, H. K., Powell, G. E., & Veit, E. T. (2002). Revisiting managerial perspectives on
dividend policy. Journal of Economics and Finance, 26 (2), 267‒283.
Baker, H. K., Saadi, S., Dutta, S., & Gandhi, D. (2007). The perception of dividends by
Canadian managers: New survey evidence. International Journal of Managerial Finance, 3
(1), 70‒91.
Baker, H. K., Singleton, J. C., & Veit, E. T. (2011). Survey Research in Corporate Finance:
Bridging the Gap between Theory and Practice. New York: Oxford University Press.
Baker, H. K., Veit, E. T., & Powell, G. E. (2001). Factors influencing dividend policy
decisions of Nasdaq firms. Finance Review, 38 (3), 19‒38.
Baker, M., & Wurgler, J. (2004a). A catering theory of dividends. Journal of Finance, 59 (3),
1125‒1165.
Baker, M., & Wurgler, J. (2004b). Appearing and disappearing dividends: The link to
catering incentives. Journal of Financial Economics. 73 (2), 271‒288.
Bancel, F., Bhattacharyya, N., and Mittoo, U. R. (2005). Cross-country Determinants of
Payout Policy: A Survey of European Firms. SSRN Working Paper, available at
http://papers.ssrn.com/sol3/papers.cfm?abstract_id=683111.
Birol, O. H. (2011). The effects of the global economic crisis on Turkey’s economy and the
recent tilt in her international relations. International Journal of Business and Management
Studies, 3(2), 227‒236.
Brav, A., Graham, J. R., Harvey, C. R., & Michaely, R. (2005). Payout policy in the 21st
century. Journal of Financial Economics, 77 (3), 483‒527.
Page 24
24
Bruner, R. E. (2001). Does M&A pay? A survey of evidence from the decision-maker.
Journal of Applied Finance, 12 (1), 48‒68.
Bugra, A. (1994). State and Business in Modern Turkey: A Comparative Study. Albany, NY:
State University of New York.
Caliskan, N., & Icke, T. (2011). Turkish corporate governance principles and its implications
for ISE corporate governance index companies. Journal of Accounting and Finance, 11(1),
60‒75.
Chiang, K., Frankfurter, G. M., Kosedag, A., & Wood, B. G. Jr. (2006). The perception of
dividends by professional investors. Managerial Finance, 32 (1), 60‒81.
CMB (2003). Annual Report 2003. Ankara: Capital Markets Board of Turkey.
CMB (2014). Annual Report 2014. Ankara: Capital Markets Board of Turkey.
Demsetz, H., & Lehn, K. (1985). The structure of corporate ownership: Causes and
consequences. Journal of Political Economy, 93 (6), 1155‒1177.
Dhanani, A. (2005). Corporate dividend policy: The views of British financial managers.
Journal of Business Finance & Accounting, 32 (7), 1625‒1672.
Erturk, I. (2003). Governance or financialisation: The Turkish case. Competition and Change,
7 (4), 185‒204.
Faccio, M., Lang, L. H. P., & Young, L. (2001). Dividends and expropriation. American
Economic Review, 91 (1), 54‒78.
Glen, J. D., Karmokolias, Y., Miller, R. R., & Shah, S. (1995). Dividend policy and
behaviour in emerging markets: To pay or not to pay. IFC Discussion Paper, 26.
Washington, DC: International Finance Corporation.
Grossman, S. J., & Hart, O. D. (1980). Takeover bids, the free-rider problem, and the theory
of the corporation. Bell Journal of Economics, 11 (1), 42‒64.
Grullon, G., Michaely, R., & Swaminathan, B. (2002). Are dividend changes a sing of firm
maturity. Journal of Business, 75 (3), 387‒424.
Gursoy, G., & Aydogan, K. (1999). Equity ownership structure, risk-taking and performance:
An empirical investigation in Turkish companies. Paper presented at the ERC/METU
International Conference in Economics in Ankara.
IIF. (2005). Corporate Governance in Turkey – An Investor Perspective. Task Force Report.
Washington, DC: Institute of International Finance, Inc.
Johnson, S., La Porta, R., Lopez-de-Silanes, F., & Shleifer, A. (2000). Tunnelling, American
Economic Review, 90 (1), 20‒27.
Page 25
25
Kirkulak, B., & Kurt, G. (2010). Are dividends disappearing or shrinking? Evidence from the
Istanbul Stock Exchange. Emerging Markets Finance and Trade, 46 (2), 38‒52.
La Porta, R., Lopez-de-Silanes, F., & Shleifer, A. (1999). Corporate ownership around the
world. Journal of Finance, 54 (2), 471‒517.
La Porta, R., Lopez-de-Silanes, F., Shleifer, A., & Vishny, R. W. (1997). Legal determinants
of external finance. Journal of Finance, 52 (3), 1131‒1150.
La Porta, R., Lopez-de-Silanes, F., Shleifer, A., & Vishny, R. W. (2000). Agency problems
and dividend policies around the world. Journal of Finance, 55 (1), 1‒33.
Lease, R. C., John, K., Kalay, A., Loewenstein, U., & Sarig, O. H. (2000). Dividend Policy:
Its Impact on Firm Value. Boston, MA: Harvard Business School Press.
Lintner, J. (1956). Distribution of incomes of corporations among dividends, retained
earnings and taxes. American Economic Review, 46 (2), 97‒113.
Miller, M. H., & Modigliani, F. (1961). Dividend policy, growth and the valuation of shares.
Journal of Business, 34 (4), 411‒433.
Morck, R., & Yeung, B. (2003). Agency problems in large family business groups,
Entrepreneurship Theory and Practice, 27 (4), 367‒382.
Odabasi, A., Aksu, C., & Akgiray, V. (2004). The statistical evaluation of prices on the
Istanbul Stock Exchange. European Journal of Finance, 10, 510‒525.
Pruitt, S. W., & Gitman, L. J. (1991). The interactions between the investment, financing, and
dividend decisions of major US firms. Financial Review, 26 (3), 409‒430.
Public Disclosure Platform of Borsa Istanbul (KAP). BIST Companies. (2017).
https://www.kap.org.tr/en/bist-sirketler
Sevil, G., Ozer, M., & Kulali, G. (2012). Foreign investors and noise trade in Istanbul Stock
Exchange. International Journal of Business and Social Science, 3 (4), 93‒101.
Shleifer, A., & Vishny, R. W. (1986). Large shareholders and corporate control. Journal of
Political Economy, 94 (3), 461‒488.
Shleifer, A., & Vishny, R.W. (1997). A survey of corporate governance. Journal of Finance,
52 (2), 737‒783.
TCMA. (2014). The Handbook of the Turkish Capital Markets 2014. Istanbul: Turkish
Capital Markets Association.
Villalonga, B., & Amit, R. (2006). How do family ownership, control and management affect
firm value? Journal of Financial Economics, 80 (2), 385‒417.
Yurtoglu, B. B. (2003). Corporate governance and implications for minority shareholders in
Turkey. Journal of Corporate Ownership & Control, 1 (1), 72‒86.
Page 26
26
Table 1. Current Taxation of Capital Gains and Dividends on Listed Equities in Turkey
This table presents a summary of the current Turkish tax regime of capital gains and dividend
income on equity investments for the investors (i.e., residents/non-residents and individual/
corporate).
Investment Individuals Corporations
Residents Non-residents Residents Non-residents
Capital
Gains
on
Equities
Capital gains
derived from
shares are
subject to 0%
withholding
tax. †
Capital gains
derived from
shares are
subject to 0%
withholding
tax. ††
0% withholding
tax. ††
0% withholding
tax.
Dividends
on Equities
15%
withholding
tax is applied
by the
corporation
distributing
dividends. †††
15%
withholding
tax is applied
by the
corporation
distributing
dividends.
Not subject to
dividend
withholding tax.
Dividends
received from
resident
corporations are
exempt from
corporate tax.
15% withholding
tax is applied by
the corporation
distributing
dividends.
Notes: †
Capital gains on the shares of investment trusts are subject to a 10% tax, if held for
less than a year.
††
Earnings are subject to a 20% corporate tax but withholding tax is deducted.
†††
Half of the dividends are exempt from income tax. If the remaining amount
exceeds TL (Turkish Lira) 26,000 in 2014, all income must be declared and will
be subject to income tax. In that case, the full amount of the withholding tax’
may be deducted from the income tax.
Source: Compiled from TCMA (2014).
Page 27
27
Table 2. Summary of Dividend Survey Response Rates in the Literature
This table shows the response rates of various dividend surveys in both developed
and developing countries.
Study Country Firms Response Rate (%)
Baker et al. (1985) United States 318 56.6
Pruitt and Gitman (1991) United States 114 11.4
Baker and Powell (2000) United States 198 32.9
Baker et al. (2001, 2002) United States 188 29.8
Brav et al. (2005) United States 384 16.0
Dhanani (2005) United Kingdom 164 16.4
Bancel et al. (2005) 16 European Countries 93 8.2
Baker et al. (2006) Norway 33 27.3
Baker et al. (2007, 2008) Canada 103 35.4
Baker and Powell (2012) Indonesia 52 31.9
Baker and Kapoor (2015) India 42 8.4
Current Study Turkey 57 45.2
Page 28
28
Table 3. Characteristics of Responding and Non-responding BIST Firms
This table presents descriptive statistics for the 57 responding and 69 non-responding firms on 10 characteristics, and the tests for non-response
bias. We use the Datastream database to obtain the relevant data on each of the two groups for year 2014 and also cross-check the validity of the
data with the Osiris database. Employees represent the number of both full- and part-time employees of the company. Total assets refer to the sum
of total current assets, long-term receivables, investment in unconsolidated subsidiaries, other investments, net property, plant and equipment, and
other assets. Market capitalization equals the share price (year-end) multiplied by the common shares outstanding. Net income represents annual
income after all operating and non-operating income and expenses, reserves, income taxes, minority interest, and extraordinary items. Sales refer to
annual gross sales and other operating revenue less discounts, returns and allowances. Cash dividends equal the total annual common and preferred
dividends paid in cash to shareholders of the company. Dividend payout is calculated as dividends per share divided by earnings per share.
Dividend yield is measured as dividend per share divided by price per share. Leverage ratio is calculated as total debt divided by the company’s
total assets. The current ratio refers to the ratio of current assets to current liabilities. ** and * stand for statistical significance at the 1% and 5%
levels, respectively.
Employees Total Assets
(million TL)
Market
Capitalisation
(million TL)
Net Income
(million TL)
Sales
(million TL)
Cash
Dividends
(million
TL)
Dividend
Payout
(%)
Dividend
Yield
(%)
Leverage
Ratio
Current
Ratio
Mean
Responding (n = 57) 3,506.30 2,624.43 2,609.13 142.73 2,693.12 66.07 37.04 3.74 0.202 2.217
Non-responding (n = 69) 2,706.70 2,128.42 2,121.76 147.04 2,432.94 47.85 29.03 2.33 0.247 2.207
Median
Responding (n = 57) 1,001.00 872.57 602.91 29.52 740.95 16.20 29.12 2.59 0.16 1.78
Non-responding (n = 69) 818.00 609.38 472.40 21.82 519.05 3.82 18.02 1.21 0.19 1.56
Standard deviation
Responding (n = 57) 6,009.56 5,420.58 4,993.37 344.56 4,573.90 126.45 82.64 4.10 0.162 1.512
Non-responding (n = 69) 5,776.47 4,799.25 5,484.91 409.09 5,180.01 149.53 104.36 2.99 0.185 2.260
Levene’s test for equality of variances 0.924 0.784 1.432 1.409 0.753 1.398 1.421 1.811* 1.284 2.233**
t-test for equality of means
(equality of variances assumed) −0.759 −0.544 −0.546 0.063 −0.252 −0.729 −0.656 −2.224* 1.336 −0.029
t-test for equality of means
(equality of variances not assumed) −0.756 −0.538 −0.560 0.064 −0.261 −0.741 −0.691 −2.160* 1.369 −0.030
Wilcoxon test −0.941 −1.585 −1.783 −1.409 −1.853 −2.606** −1.297 −2.010* 1.054 −0.615
Page 29
29
Table 4. Theories and Explanations of Dividend Policy
This table shows the survey responses of managers for 57 dividend-paying BIST firms on the level of agreement of 27 statements based on various theories and
explanations involving dividend policy to test our research hypotheses: signaling theory (Panel A), Lintner’s (1956) partial adjustment model (Panel B), agency
cost theory (Panel C), substitute model of dividends (Panel D), taxes and clientele effects (Panel E), catering theory (Panel F), transaction costs of dividends
(Panel G), bird-in-the-hand theory (Panel H), maturity hypothesis (Panel I), residual dividend policy (Panel J), and dividend policy and firm value (Panel K).
Responses are based on a five-point scale where strongly disagree (SD) = −2, disagree (D) = −1, neutral (N) = 0, agree (A) = +1, and strongly agree (SA) = +2.
Panel A through K report the percentages of respondents by the level of agreement, the mean, the standard deviation, and t-value for the null hypothesis that
mean response equals 0 (neutral) for each statement. The statements are arranged in declining order of their means. ** and * stand for statistical significance at
the 1% and 5% levels, respectively.
Level of Agreement (%)
SD D N A SA Std.
Dev.
No Statement −2 −1 0 +1 +2 Mean t-value
Panel A: Signaling theory
S11
We should appropriately inform our investors about the reasons for changing our cash dividends. 3.5 1.8 8.8 57.9 28.1 1.05 0.874 9.08**
S7
We consider that dividend decisions signal information about our company to investors. 0.0 7.0 8.8 64.9 19.3 0.96 0.755 9.64**
S9 Investors evaluate dividend changes as signals about our firm's future performance. 1.8 10.5 14.0 57.9 15.8 0.75 0.911 6.24**
S8
We expect that our share price generally increases (decreases) when we increase (decrease) the
dividend payments. 5.3 12.3 22.8 45.6 14.0 0.51 1.054 3.64**
S10
We think that dividend increases are questionable because they can imply either future growth or a
lack of profitable investment opportunities. 3.5 43.9 26.3 24.6 1.8
−0.23 0.926 −1.86
S26
We pay higher dividends to signal that our firm is strong enough to raise costly external capital if
needed thereby to make us look better than our competitors. 24.6 36.8 19.3 17.5 1.8
−0.65 1.093 −4.48**
Panel B: Lintner’s (1956) partial adjustment model
S2 We generally set dividend payment based upon past dividends and current earnings. 0.0 3.5 0.0 75.4 21.1 1.14 0.580 14.83**
S1 We tend to carry on a smooth dividend payment stream from year to year. 1.8 7.0 5.3 54.4 31.6 1.07 0.903 8.94**
S5 We are reluctant to reduce dividends unless adverse circumstances are likely to persist. 0.0 1.8 17.5 56.1 24.6 1.03 0.706 11.06**
S4 We only change dividend payout when sustainable shifts in earnings occur. 3.5 10.5 14.0 56.1 15.8 0.70 0.981 5.39**
S3 We set a target dividend payout ratio and make partial adjustments in current payout towards the target. 1.8 10.5 24.6 52.6 10.5 0.59 0.883 5.09**
Panel C: Agency cost theory
S15
We think that dividend payments encourage our managers to act in the interest of our outside
shareholders. 8.8 15.8 26.3 40.4 8.8 0.24 1.106 1.67
Page 30
30
S16
We think that dividend payments reduce cash available therefore disciplining our firm to make
efficient investments. 5.3 21.1 26.3 42.1 5.3 0.21 1.013 1.56
S14
We think that dividend payments forces us to look for more external financing which enables our
investors to closely monitor our firms activities. 3.5 36.8 35.1 24.6 0.0
−0.19 0.854 −1.70
S27
We think that large shareholders (e.g. families and institutional investors) and their direct
involvement in managements, such as family members, provide better monitoring on our managers. 17.5 15.8 35.1 24.6 7.0
−0.12
1.181 −0.78
Panel D: Substitute model of dividends
S25
We consider that paying large dividends will establish a good reputation for treating our outside
shareholders fairly.
5.3 24.6 17.5 42.1 10.5 0.28 1.114 1.90
Panel E: Taxes and clientele effects
S12 We think that investors in low (high) tax brackets desire shares that pay high (low) dividends. 5.3 14.0 56.1 21.1 3.5 0.03 0.844 0.31
S13
We believe that investors tend to invest in firms whose dividend policy match with their particular tax
circumstances. 5.3 12.3 47.4 29.8 5.3 0.17 0.908 1.45
Page 31
31
Panel F: Catering theory
S17 We should be responsive to the dividend preferences of our shareholders. 0.0 7.0 3.5 57.9 31.6 1.14 0.789 10.90**
Panel G: Transaction costs of dividends
S24
We may have to bear with the transaction costs of raising external funds that might be highly costly to
meet our investment requirements after paying dividends. 5.3 31.6 21.1 38.6 3.5 0.03 1.034 0.26
Panel H: Bird-in-the-hand theory
S6 Investors generally prefer cash dividends today to uncertain future price appreciation. 1.8 10.5 14.0 57.9 15.8 0.70 1.034 5.12**
Panel I: Maturity hypothesis
S18 We consider that the pattern of cash dividends generally changes over our firm's life cycle. 0.0 10.5 19.3 54.4 15.8 0.75 0.851 6.69**
Panel J: Residual dividend policy
S23
We view cash dividends as a residual after funding desired investments from earnings. 10.5 29.8 22.8 35.1 1.8
−0.12 1.070 −0.86
Panel K: Dividend policy and firm value
S19 We believe that a firm's dividend policy affects its market value. 1.8 7.0 0.0 45.6 45.6 1.26 0.916 10.40**
S22
We should create an optimal dividend policy to balance between current dividends and future growth
that maximises share price.
1.8 3.5 3.5 57.9 33.3 1.17 0.804 11.03**
S20 We should set our dividend policy to produce maximum value for our shareholders. 1.8 7.0 3.5 59.6 28.1 1.05 0.874 9.08**
S21 We consider that a change in a firm's cash dividend payments affects its share price. 1.8 5.3 14.0 45.6 33.3 1.03 0.925 8.44**
Page 32
32
Table 5. Factors Affecting Dividend Policy This table reports the survey responses of managers for 57 dividend-paying BIST firms on the importance of 21 factors affecting their dividend policy decisions.
Responses are based on a five-point scale ranging from 0 (no importance) to 4 (very high importance). The percent of respondents by the level of importance, mean,
standard deviation, and t-value for the null hypothesis that the mean response equals 0 (no importance) for each factor are presented. The rankings are listed from
highest to lowest based on the means of the BIST firms. The factor rankings are also presented for the NSE from Baker and Kapoor (2015), IDX from Baker and
Powell (2012), TSE from Baker et al. (2007), OSE from Baker et al. (2006), NASDAQ from Baker et al. (2001) and NYSE from Baker and Powell (2000). ** and *
stand for statistical significance at the 1% and 5% levels, respectively.
Level of Importance (%)
Rank
None Low Mod High Very High
Std.
Dev.
No Factor 0 1 2 3 4 Mean t-value BIST NSE IDX TSE OSE NYSE NASDAQ
F3 Level of current earnings 1.8 1.8 12.3 42.1 42.1 3.21 0.860 28.16** 1 2 2 4 1 1.5 3
F1 Stability of earnings 1.8 3.5 17.5 43.9 33.3 3.04 0.905 25.30** 2 1 1 2 2 6 2
F10 Liquidity constrains such as availability of cash 3.5 3.5 17.5 47.4 28.1 2.93 0.961 23.01** 3 5.5 4 5 4.5 8 14
F4 Level of expected future earnings 7.0 3.5 17.5 52.6 19.3 2.74 1.044 19.78** 4 4 3 1 4.5 1.5 4
F2 Pattern of past dividends 1.8 8.8 21.1 52.6 15.8 2.72 0.901 22.77** 5 3 7 3 11 3 1
F8 Desire to maintain a target capital structure 7.0 3.5 26.3 49.1 14.0 2.60 1.015 19.30** 6 12.5 19 13 8.5 11 6
F12
Desire to pay out, in the long run, a given fraction of
earnings 1.8 12.3 21.1 56.1 8.8 2.58 0.885 21.99** 7 5.5 10 6 15.5 9 7
F9 Projections about the future state of the economy 1.8 12.3 33.3 40.4 12.3 2.49 0.928 20.26** 8 17.5 8 17 15.5 18 18
F17
Investment consideration such as the availability of
profitable investment opportunities 5.3 12.3 36.8 35.1 10.5 2.33 1.005 17.51** 9 7 9 11 8.5 7 15
F6 Current degree of financial leverage 5.3 14.0 38.6 35.1 7.0 2.25 0.968 17.50** 10 9.5 13.5 8 3 n/a 10
F21 The identity of controlling shareholder 10.5 15.8 26.3 36.8 10.5 2.21 1.160 14.37** 11 n/a n/a n/a n/a n/a n/a
F5 Concern about affecting the stock price 8.8 21.1 31.6 31.6 7.0 2.07 1.083 14.42** 12 15 5 7 14 4 5
F7 Availability of alternative sources of capital 7.0 21.1 36.8 29.8 5.3 2.05 1.007 15.38** 13 17.5 12 15 10 n/a 17
F13 Needs of current shareholders such as the desire for income 10.5 19.3 33.3 31.6 5.3 2.02 1.077 14.14** 14 14 6 9 21 10 9
F19
Desire to avoid giving a false signal to investors by
changing the dividend 14.0 26.3 28.1 28.1 3.5 1.80 1.109 12.30** 15 8 21.5 12 18 5 8
F16
Financing considerations such as the cost of raising external
funds 10.5 19.3 54.4 14.0 1.8 1.77 0.886 16.08** 16 9.5 16 14 12 12 19
F18
Signaling mechanism such as using dividend changes to 12.3 29.8 29.8 26.3 1.8 1.75 1.039 12.73** 17 21 11 16 13 n/a 16
Page 33
33
convey information to financial markets
F20 The firm's strategy of merger and acquisition 17.5 29.8 29.8 17.5 5.3 1.63 1.128 10.92** 18 n/a n/a n/a n/a n/a n/a
F14
Preference to pay dividends instead of undertaking risky
reinvestments 19.3 28.1 35.1 12.3 5.3 1.56 1.102 10.69** 19 20 13.5 21 20 19 20
F11 Desire to confirm to the industry's dividend payout ratio 14.0 31.6 40.4 14.0 0.0 1.54 0.907 12.84** 20 19 17 18 17 14 13
F15
Personal taxes paid by current shareholders when receiving
dividends
36.8 35.1 22.8 5.3 0.0 0.97 0.905 8.04** 21 n/a n/a n/a n/a n/a n/a