62
Dividend Policy: Theory and Empirical Evidence Cheng-Few Lee Rutgers University
| Date post: | 21-Dec-2015 |
| Category: |
Documents |
| View: | 216 times |
| Download: | 1 times |

Dividend Policy: Theory and Empirical Evidence
Cheng-Few Lee Rutgers University


3

4

5
Announcement for Handbook of Financial Econometrics and Statistics
• The purpose of this handbook is to publish original papers that apply either econometrics or statistics methods in important topics of empirical finance research. Chapters that update or expand upon well-known empirical papers are also acceptable. In this handbook, each paper should have appendices of 5 to 15 pages to demonstrate how empirical research has been executed. The tentative outline of this handbook is as follows:
• Part I. Introduction
In this introduction, we will discuss overall application of econometrics and statistics in finance accounting research.
6
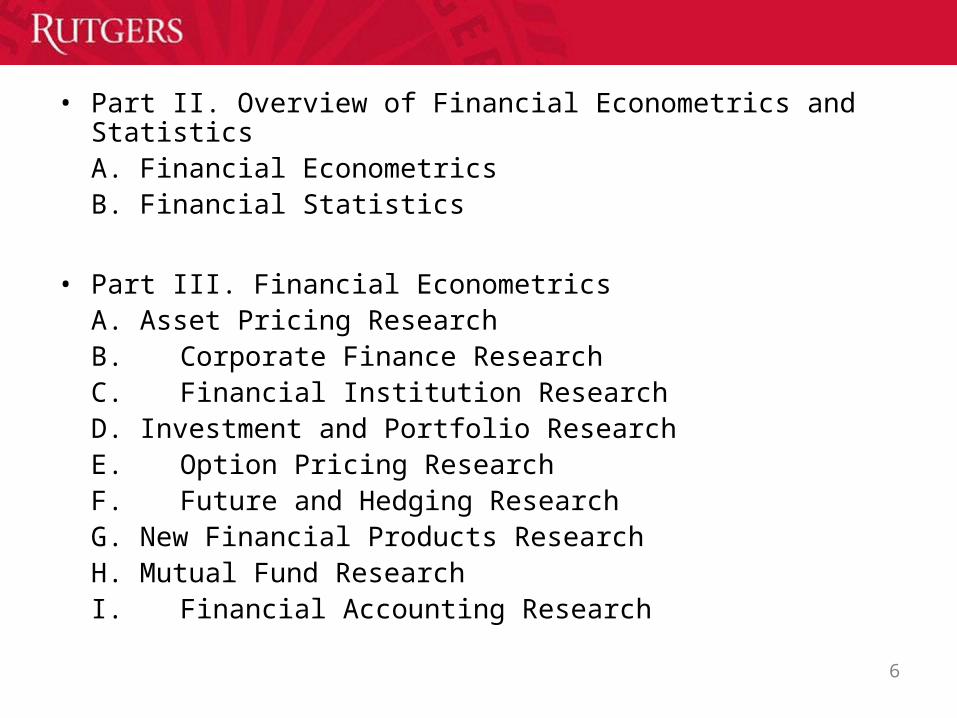
• Part II. Overview of Financial Econometrics and StatisticsA. Financial EconometricsB. Financial Statistics
• Part III. Financial EconometricsA. Asset Pricing ResearchB. Corporate Finance ResearchC. Financial Institution ResearchD. Investment and Portfolio ResearchE. Option Pricing ResearchF. Future and Hedging ResearchG. New Financial Products ResearchH. Mutual Fund ResearchI. Financial Accounting Research

7
• Part IV. Financial StatisticsA. Asset Pricing ResearchB. Investment and Portfolio ResearchC. Credit Risk Management ResearchD. Market Risk ResearchE. Operation Risk ResearchF. Option Pricing ResearchG. Mutual Fund ResearchH. Value at Risk Research
• We expect to include approximately 100 chapters in this handbook,
which will published online and in three print volumes by Springer in 2012. Anybody who wishes to contribute a chapter to this handbook please send a proposal to Professor Cheng-Few Lee at the email:

Policy Framework of Finance Research• Investment Policy
• Financing Policy
• Production Policy
• Dividend Policy
(a) Forecasting Model
(i) Partial Adjustment Model (Lintner, 1956 AER)
(ii) Mixed Partial Adjustment and Adapted Expectation (Fama & Babiak, 1968 JASA)
(iii) Generalized Dividend Forecasting Model (Lee et al., 1987, Journal of econometrics)
then8
* *
*1 1 1
* * *1 2 1
t
t t t t
t t t
D rE
D D a b D D u
E E b E E
1 2 1 2 1 2 1 2 1 2 2 11 1 1 1t t t t t t tD D ab b b D b b D rb b E b u u
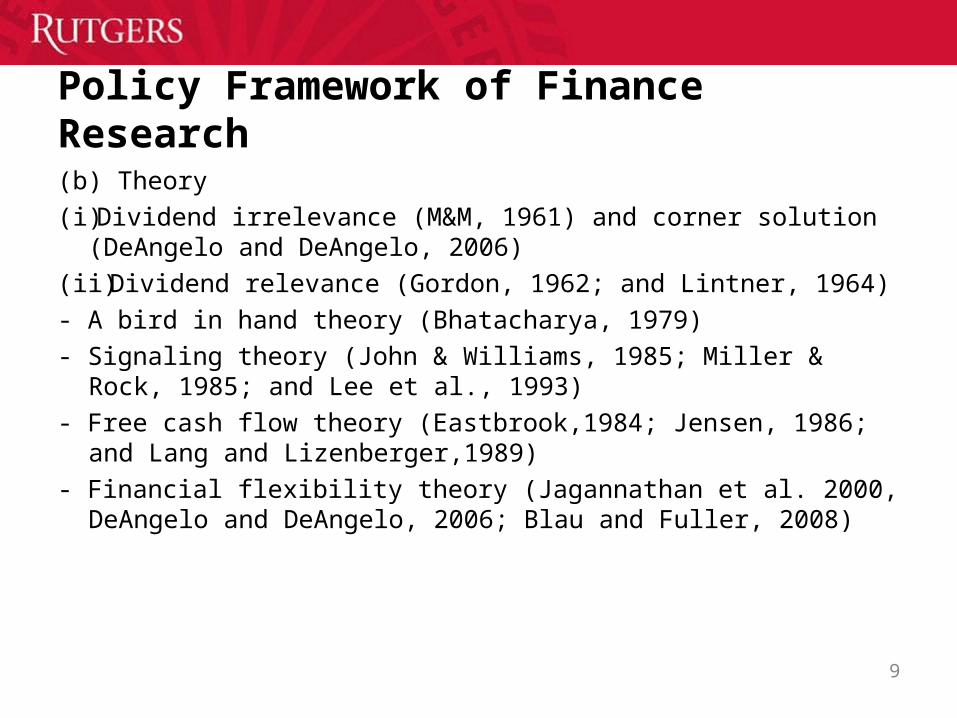
Policy Framework of Finance Research
(b) Theory
(i) Dividend irrelevance (M&M, 1961) and corner solution (DeAngelo and DeAngelo, 2006)
(ii)Dividend relevance (Gordon, 1962; and Lintner, 1964)
- A bird in hand theory (Bhatacharya, 1979)
- Signaling theory (John & Williams, 1985; Miller & Rock, 1985; and Lee et al., 1993)
- Free cash flow theory (Eastbrook,1984; Jensen, 1986; and Lang and Lizenberger,1989)
- Financial flexibility theory (Jagannathan et al. 2000, DeAngelo and DeAngelo, 2006; Blau and Fuller, 2008)
9

AbstractWe develop a theoretical model of the optimal payout ratio under perfect
markets and uncertainty. First, we theoretically derive the proposition of DeAngelo and DeAngelo's (2006) optimal payout policy when a partial payout is allowed. Second, we theoretically derive the impact of total risk, systematic risk, and growth rate on the optimal payout ratio.
Taking the time varying growth rate, the imperfect market, and debt issuing into account, we further derive a dynamic model which jointly optimizes growth rate and payout ratio. We also derive a logistic equation which was first introduced by Pierre Verhulst (1845 and 1847) to obtain the optimal growth rate.
Using the U.S. data during 1969 to 2008 to investigate the impact of total risk, systematic risk, and growth rate on the optimal payout ratio. We find that the relationship between the payout ratio and risk is negative (or positive) when the growth rate is higher (or lower) than the rate of return on assets. In addition, we also find that a company will generally reduce its payout when the growth rate increases. 10

11
Outline of Paper I1. Introduction
Policy Framework of Finance Research2. The Model3. Optimal Dividend Policy4. Implications
4.1 Case I: Total Risk4.2 Case II: Systematic Risk4.3 Total Risk and Systematic Risk4.4 No Change in Risk
5. Relationship between the Optimal Payout Ratio and the Growth Rate6. Empirical Evidence
6.1 Sample Description6.2 Multivariate Analysis6.3 Fama-MacBeth Analysis6.4 Fixed Effect Analysis
7. Summary and Concluding Remarks

12
Introduction & Motivation of Paper IDividend PolicyMiller and Modigliani (1961)- Firm Value is independent of dividend policy.- Assumptions of M&M theory
1) no tax.
2) no capital market frictions (i.e., no transaction cost, asset trade restriction,
or bankruptcy cost)
3) firms and investors can borrow or lend at the same rate.
4) firm financial policy reveals no information.
5) only consider no payout and payout all cash flow.
DeAngelo and DeAngelo (2006) > M&M (1961) irrelevance result is “irrelevant” because it only considers
payout policies that pay out all free cash flow. > Payout policy matters when partial payouts are allowed.

13
Introduction & Motivation of Paper I• Signaling Hypothesis
- The signaling hypothesis suggests managers with better information than the market will signal this private information using dividends.
- A company announcements of an increase in dividend payouts act as an indicator of the firm possessing strong future prospects.
[Bhatacharya (1979), John and Williams (1985), Miller and Rock (1985), and Nissam and Ziv (2001)]
• Free Cash Flow Hypothesis (Agency Cost)
- Dividend payment can reduce potential agency problem.
[Eastbrook (1984), Jensen (1986), Lang and Lizenberger(1989), Lie (2000), and Grullon et al. (2002)]
• Financial Flexibility
- Management trades off two aspects of Dividends. One is financial flexibility by not paying dividends. Another is deterioration on stock price if not paying dividends.
[Blau and Fuller (2008)]

Introduction & Motivation of Paper I1. Based on the DeAngelo & DeAngelo (2006) static analysis, we derive a
theoratical dynamic model and show that there exists an optimal payout ratio under perfect market.
2. We derive the relationship between firm’s optimal payout ratio and its risks.
3. We derive the relationship between firm’s optimal payout ratio and its growth.
4. We further develop a fully dynamic model for determining the time optimal growth and dividend policy under the imperfect market, the uncertainty of the investment, and the dynamic growth rate.
5. We study the effects of the time-varying horizons, the degree of market perfection, and stochastic initial conditions in determining an optimal growth and dividend policy for the firm.
6. When the stochastic growth rate is introduced, the expected return may suffer a model specification.
7. Empirical evidence of the determination of the optimal payout policy.14

Introduction & Motivation of Paper I
• Paper I:
1. We derive a theoratical dynamic model and show that there exists an optimal payout ratio under perfect market.
2. We derive the relationship between firm’s optimal payout ratio and its risks.
(depends on its growth rate relative to its ROA)
3. We derive the relationship between firm’s optimal payout ratio and its growth.
(Negative)
4. Empirical evidence on the optimal payout ratio.
(support our theoretical results)
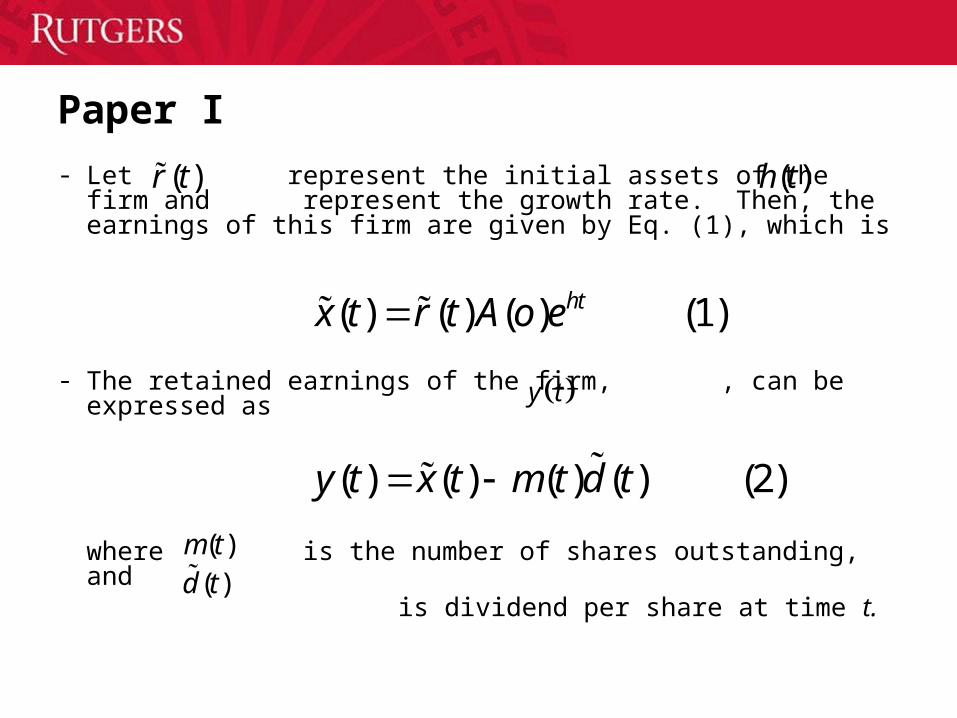
Paper I
- Let represent the initial assets of the firm and represent the growth rate. Then, the earnings of this firm are given by Eq. (1), which is
- The retained earnings of the firm, , can be expressed as
where is the number of shares outstanding, and is dividend per share at time t.
( )d t( )m t
( ) ( ) ( ) ( ) (2)y t x t m t d t
( ) ( ) ( ) (1) htx t r t A o e
( )r t ( )h t
y t

Paper I
The new equity raised by the firm at time t can be defined as
where = degree of market perfection, 0 < 1.
Therefore, the investment in period t can be written as:
Rearranging Eq.(4), we can get
( ) ( ) ( ) ( ) ( ) ( ) (5)htd t r t h A o e m t p t m t
( ) ( ) ( ) ( ) ( ) ( ) (4)hthA o e x t m t d t m t p t
( ) ( ) ( ) (3)e t p t m t

Paper I
Because ,
Postulate a exponential utility function,
We can get a certainly equivalent dividend stream
( )[ ( )] d tU d t e
2 2 2
2
( ) ( ) ( ) ( ) ( ) ( )( ) (9)
( ) ( )
th thh A o e m t p t A o t ed t
m t m t
2( ) ( , ( ) )r t t
2 2 2 2
[ ( )] ( ) ( ) ( ) / ( ) (6)
[ ( )] ( ) ( ) / ( )
ht
th
E d t h A o e m t p t m t
Var d t A o t e m t

Paper I
Under CAPM, .
is the market index, and
is the correlation coefficient between and .
: nondiversifiable risk;
: diversifiable risk.
The unsystematic risk usually can be diversified away by the investors. Therefore, Eq.(9) can be revised as
2 2 2 2
2
( ) ( ) ( ) ( ) ( ) ( ) ( )ˆ ( )( ) ( )
(12)
th tha bI h A o e m t p t A o t t ed t
m t m t
I( )r t
2 2(1 ( ) ) ( )t t
2 2( ) ( )t t
( )t
( ) ( ) ( ) (10)r t a bI t t
I
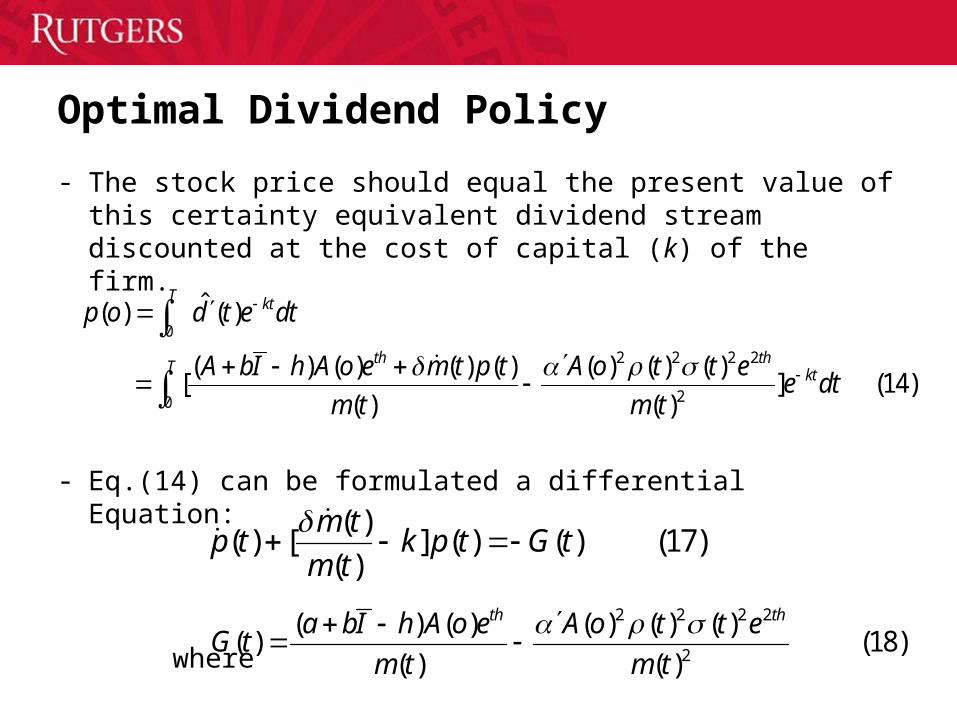
Optimal Dividend Policy
- The stock price should equal the present value of this certainty equivalent dividend stream discounted at the cost of capital (k) of the firm.
- Eq.(14) can be formulated a differential Equation:
where2 2 2 2
2
( ) ( ) ( ) ( ) ( )( ) (18)
( ) ( )
th tha bI h A o e A o t t eG t
m t m t
0
2 2 2 2
20
ˆ( ) ( )
( ) ( ) ( ) ( ) ( ) ( ) ( ) [ ] (14)
( ) ( )
T kt
th thT kt
p o d t e dt
A bI h A o e m t p t A o t t ee dt
m t m t
( )( ) [ ] ( ) ( ) (17)
( )
m tp t k p t G t
m t

Optimal Dividend Policy
- Solve the differential equation
- Optimization=>max p(0)
=>2 2(2 ) ( ) ( ) ( )
( ) (22)(1 )( )
thA o e t tm t
a bI h
1 2 2 2 2 2
0
1( ) ( ) ( ) ( ) ( ) ( ) ( ) ( )
( )
(20)
T th th ktp o a bI h A o e m t A o t t e m t e dtm o

Optimal Dividend Policy
Optimal Payout Ratio when :
If , the optimal payout ratio still exists.1
2 2 2 2 2 2 ( )( )
2 2
( )( ) 2 2
2 2
( ) ( ) ( ( ) ( ) ( ) ( ) ( ) ( ) )[ 1]1
( ) ( ) ( ) ( ) ( )
( ) [ 1] ( ) ( ) = 1
( ) ( ) ( ) ( )
h k T t
h k T t
D t a bI h h t t t t t t e
x t a bI t t h k
a bI h e t th
a bI h k t t
(26)
1
23
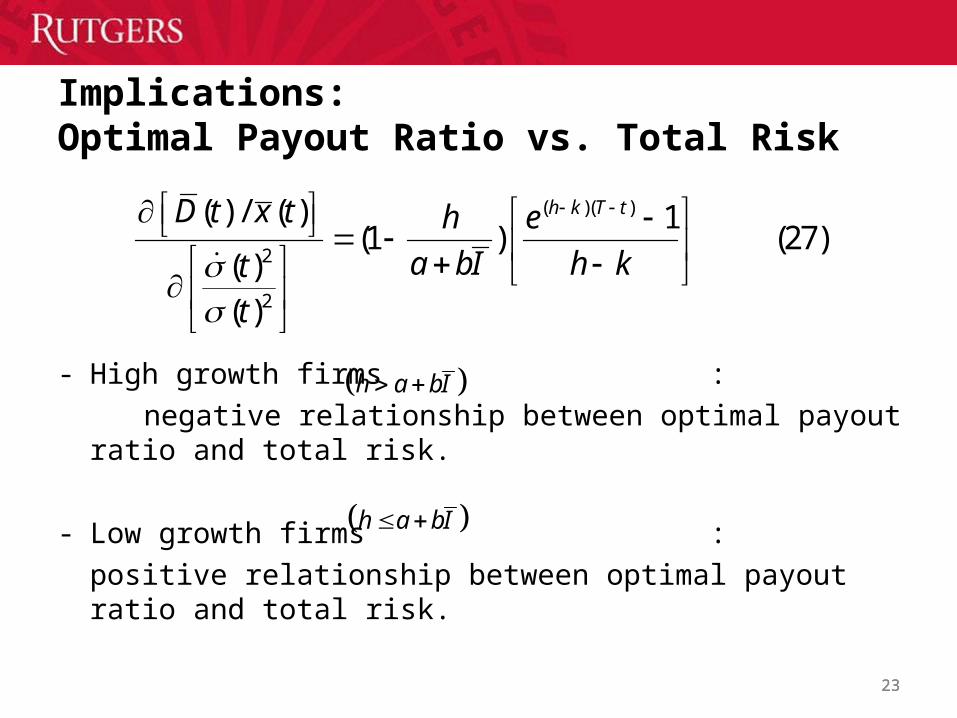
Implications:Optimal Payout Ratio vs. Total Risk
- High growth firms :
negative relationship between optimal payout ratio and total risk.
- Low growth firms :
positive relationship between optimal payout ratio and total risk.
h a bI
23
( )( )
2
2
( ) / ( ) 1(1 ) (27)
( )( )
h k T tD t x t h e
a bI h ktt
h a bI

2424
Implications: Optimal Payout Ratio vs. Systematic Risk
- High growth firms :negative relationship between optimal payout ratio and total risk.
- Low growth firms : positive relationship between optimal payout ratio and total risk.
- Financial Flexibility:Firm’s risks are related to its financial risk from financial leverage. When a firm faces higher financial risk, it will decrease its payout ratio to obtain more cash for the preparation for the interest payment in the future. [Jagannathan et al. (2000), DeAngelo and DeAngelo (2006), and Blau and Fuller (2008)]
( )( )
2
2
( ) / ( ) 1(1 ) (28)
( )( )
h k T tD t x t h e
a bI h ktt
h a bI
h a bI

25
Implications: Optimal Payout Ratio vs. Total Risk and Systematic Risk
where
- Relative effect on the optimal dividend payout ratio
25
]1
)[1())((
kh
e
bIa
h tTkh
2 2
2 2
( ) ( )[ ] [ ] (30)
( ) ( )
t td d
t t
2 2
2 2
( ) ( )[ ( ) / ( )] ( ) ( ) (29)
( ) ( )
t td D t x t d d
t t
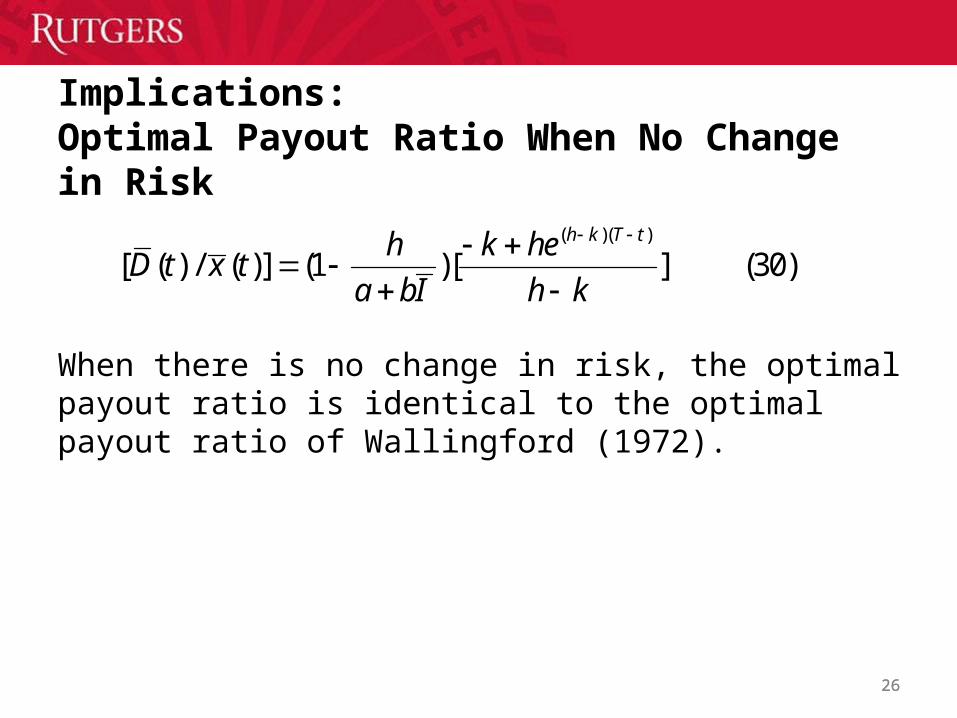
Implications: Optimal Payout Ratio When No Change in Risk
When there is no change in risk, the optimal payout ratio is identical to the optimal payout ratio of Wallingford (1972).
2626
( )( )
[ ( ) / ( )] (1 )[ ] (30)h k T th k he
D t x ta bI h k
27
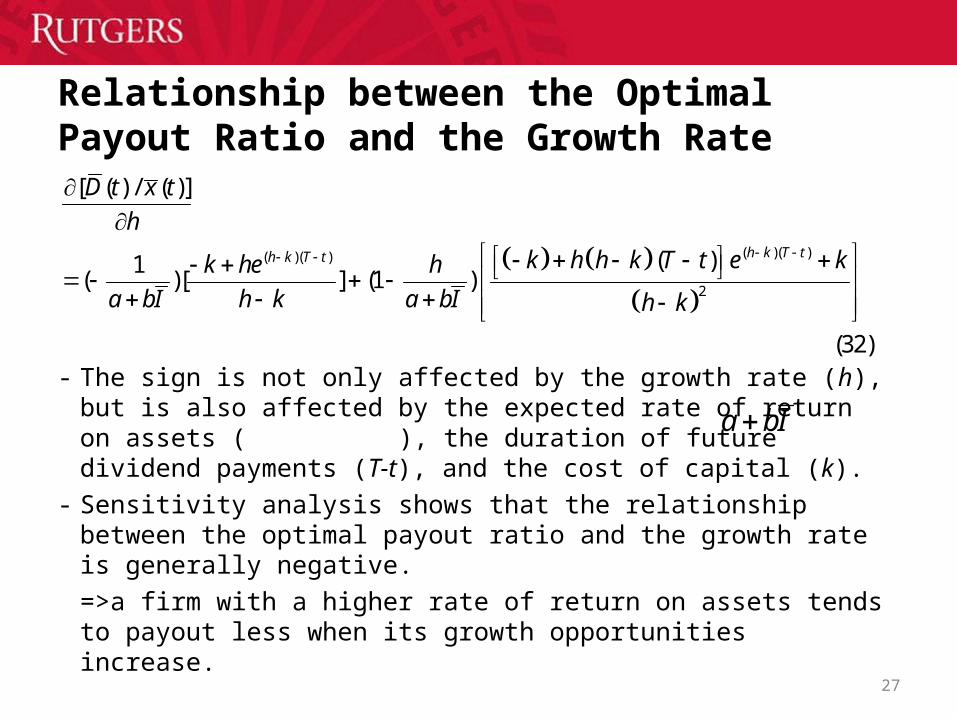
Relationship between the Optimal Payout Ratio and the Growth Rate
- The sign is not only affected by the growth rate (h), but is also affected by the expected rate of return on assets ( ), the duration of future dividend payments (T-t), and the cost of capital (k).
- Sensitivity analysis shows that the relationship between the optimal payout ratio and the growth rate is generally negative.
=>a firm with a higher rate of return on assets tends to payout less when its growth opportunities increase.
( )( )( )( )
2
[ ( ) / ( )]
( )1( )[ ] (1 )
h k T th k T t
D t x t
h
k h h k T t e kk he h
a bI h k a bI h k
(32)
a bI

28
Relationship between the Optimal Payout Ratio and the Growth Rate
- When , there is a negative
relationship between the optimal payout ratio and the growth rate.=>when a firm with a high growth rate or a low rate of return on assets faces a growth opportunity, it will decrease its dividend payout to generate more cash to meet such a new investment.
( ) ( ) ( ) 1[ ( ) / ( )] (34)
a bI h T t h T tD t x t
h a bI
1 1( )
2 ( )h a bI
T t

Sample
• Stock price, stock returns, share codes, and exchange codes are CRPS. Firm information, such as total asset, sales, net income, and dividends payout , etc., is collected from COMPUSTAT.
• The sample period is from 1969 to 2008.
• Only common stocks (SHRCD = 10, 11) and firms listed in NYSE, AMEX, or NASDAQ (EXCE = 1, 2, 3, 31, 32, 33) are included.
• Utility firms and financial institutions (SICCD = 4900-4999, 6000-6999) are excluded.
• For the purpose of estimating their betas to obtain systematic risks, firm years in our sample should have at least 60 consecutively previous monthly returns.
29
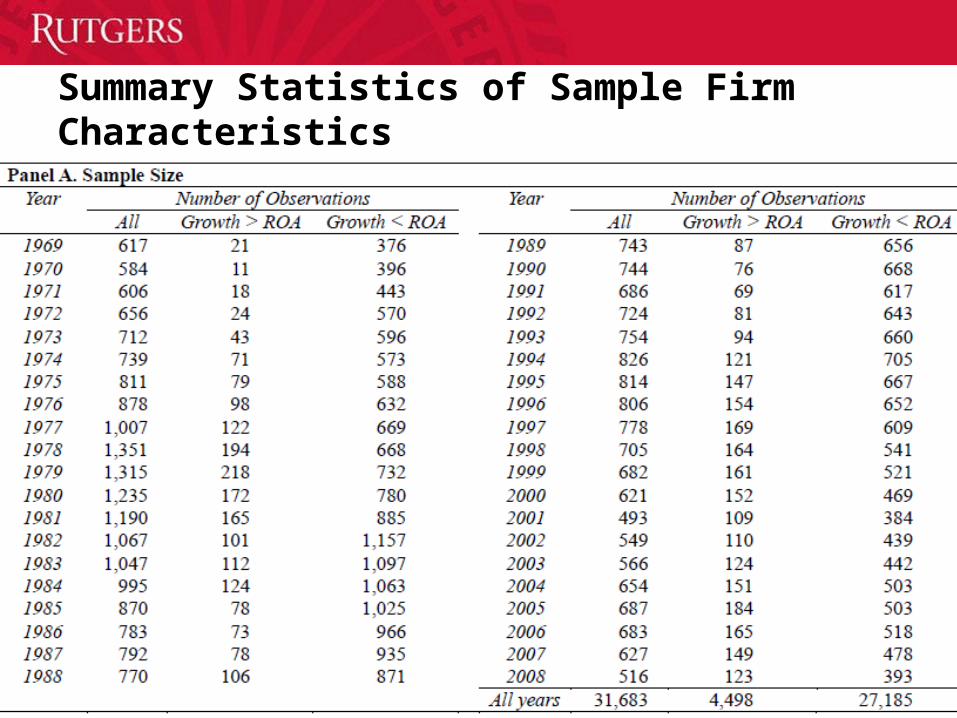
Summary Statistics of Sample Firm Characteristics
30

31
Summary Statistics of Sample Firm Characteristics

32
Multivariate Regression – Fama MacBeth Model
1 2 3
ln _ ln( )1
ii i i i
i
payout ratioBetaRisk Growth Option Size e
payout ratio

33
Multivariate Regression (with Growth Dummy)
1 2 3 4
ln _ ln( )1
ii i i i i
i
payout ratioBetaRisk D g ROA Risk Growth Option Size e
payout ratio

34
Multivariate Regression – Fixed Effect Model
34
,1 , 2 , , 3 , 4 ,
,
ln _ ln( )
1
i ti t i t i t i t i t i
i t
payout ratioRisk D g ROA Risk Growth Option Size Fixed Effect Dummies e
payout ratio

35
Outline of Paper II
• Introduction and Motivation
• Model
• Optimal Growth Rate- Optimal Growth Rate v.s. Time Horizon
- Optimal Growth Rate v.s. Degree of market Perfection
- Optimal Growth Rate v.s. ROE
- Optimal Growth Rate v.s. Initial Growth Rate
• Optimal Dividend Policy- Optimal Dvidend Policy v.s. Optimal Growth Rate
• Stochastic Growth Rate
• Conclusion
36
Introduction & Motivation of Paper II
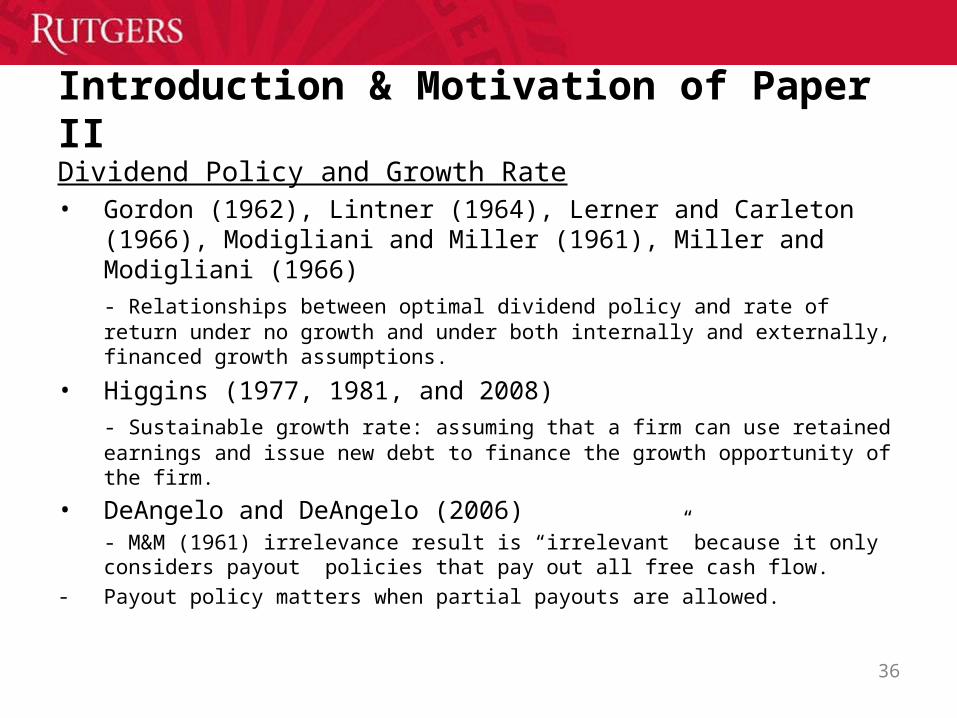
Dividend Policy and Growth Rate• Gordon (1962), Lintner (1964), Lerner and Carleton (1966),
Modigliani and Miller (1961), Miller and Modigliani (1966)
- Relationships between optimal dividend policy and rate of return under no growth and under both internally and externally, financed growth assumptions.
• Higgins (1977, 1981, and 2008)
- Sustainable growth rate: assuming that a firm can use retained earnings and issue new debt to finance the growth opportunity of the firm.
• DeAngelo and DeAngelo (2006) - M&M (1961) irrelevance result is “irrelevant” because it only considers payout policies that pay out all free cash flow.
- Payout policy matters when partial payouts are allowed.

37
Introduction & Motivation of Paper II
• Rozeff (1982)
- The optimal dividend payout is related to the fraction of insider holdings, the growth of the firm, and the firm’s beta coefficient.
• DeAngelo et al. (1996 and 2006) Grullon et al. (2002)- Increases in dividends convey information about changes in a firm’s life cycle from
a higher growth phase to a lower growth phase.
Is there an optimal dividend policy for a firm under the imperfect market, the uncertainty of the investment, and the dynamic growth rate?
Introduction & Motivation of Paper II
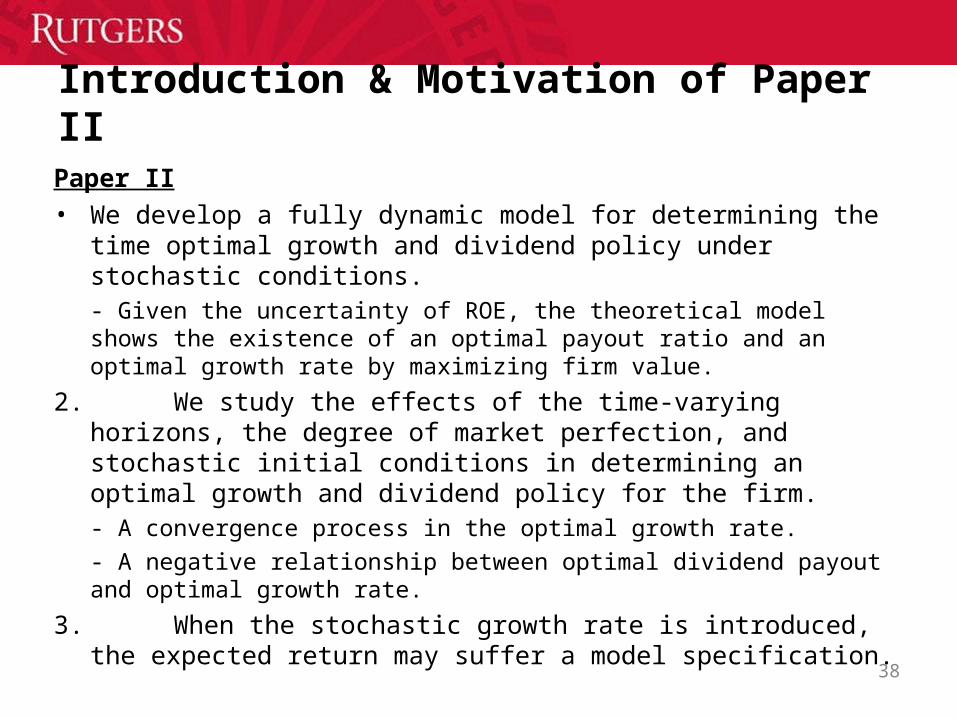
Paper II
• We develop a fully dynamic model for determining the time optimal growth and dividend policy under stochastic conditions.- Given the uncertainty of ROE, the theoretical model shows the existence of an optimal payout ratio and an optimal growth rate by maximizing firm value.
2. We study the effects of the time-varying horizons, the degree of market perfection, and stochastic initial conditions in determining an optimal growth and dividend policy for the firm.- A convergence process in the optimal growth rate.
- A negative relationship between optimal dividend payout and optimal growth rate.
3. When the stochastic growth rate is introduced, the expected return may suffer a model specification. 38

39
Paper IIThe total asset of a firm at time t
where
(1)
t
og s ds
A t A o e
the proxy of time in the integration. s
time variant growth rateg t
total assets at time A t t
initial total assetA o
Paper II
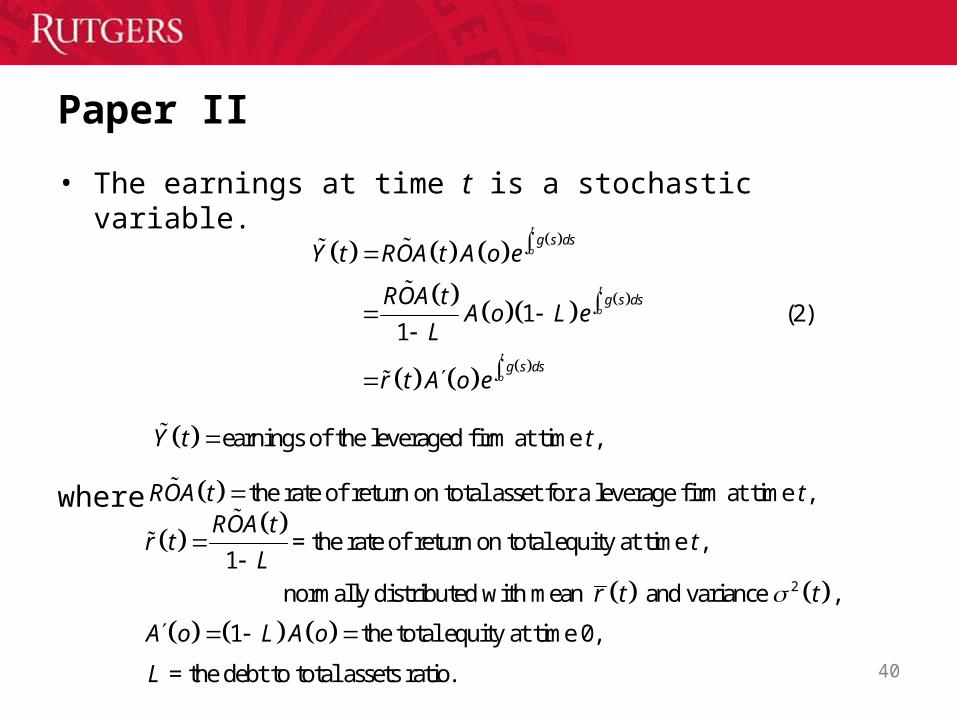
• The earnings at time t is a stochastic variable.
where
40
1 (2)1
t
o
t
o
t
o
g s ds
g s ds
g s ds
Y t ROA t A o e
ROA tA o L e
L
r t A o e
earnings of the leveraged firm at time ,Y t t
the rate of return on total asset for a leverage firm at time ,ROA t t
2
= the rate of return on total equity at time ,1
normally distributed with mean and variance ,
ROA tr t t
L
r t t
1 the total equity at time 0,A o L A o
= the debt to total assets ratio.L

41
Paper II• The new investment at time t is
where
(3)
t
og s ds
g t A o e
dA tA t
dt
( )Y t D t n t p t LA t
the total dollar dividend at time ;D t t
price per share at time ;p t t
degree of market perfections, 0 < l;
n the proceeds of new equity issued at time ;t P t t
= the debt to total assets ratioL
Retained Earnings New Equity New Debt

Paper II
• The model defined in the equation (3) is for the convenience purpose. If we want the company’s leverage ratio unchanged after the expansion of assets then we need to modify equation (3) as
we can obtain the growth rate as
which is the generalized version of Higgins’ (1977) sustainable growth rate model. Our model shows that Higgins’ (1997) sustainable growth rate is under-estimated due to the omission of the source of the growth related to new equity issue which is the second term of our model.
42
( ) 1 / ( )t
og s ds
A t g t A o e Y t D t n t p t D E Y t D t n t p t
1 /( )
1 1 1 1
ROE d n t p t Eg t
ROE d ROE d
Our Model
Higgins’ sustainable g
Paper II
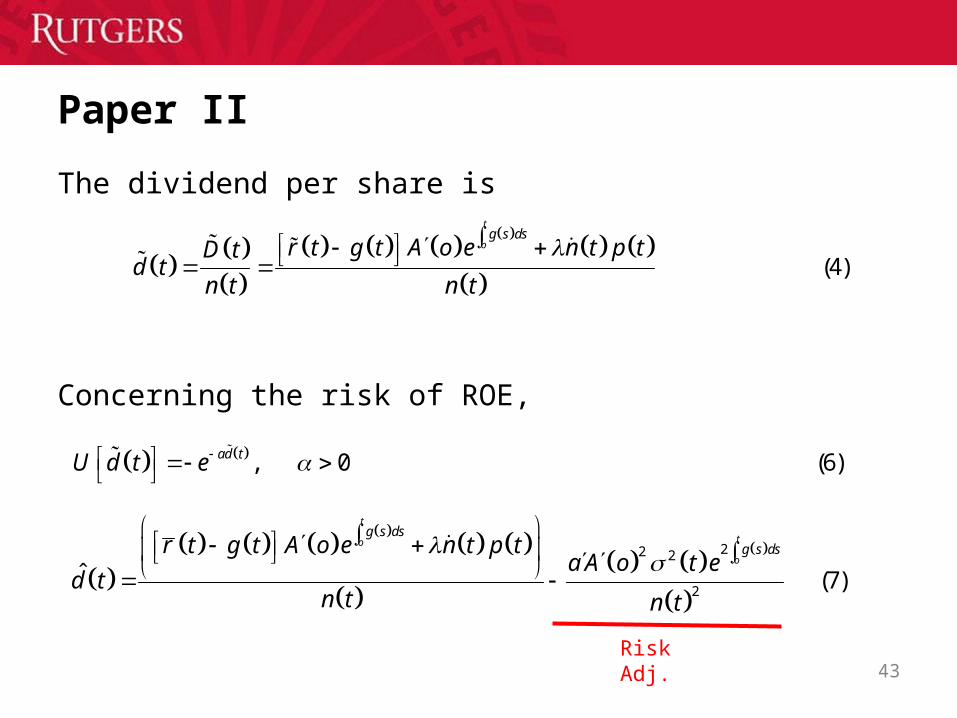
The dividend per share is
Concerning the risk of ROE,
43
(4)
t
og s ds
r t g t A o e n t p tD td t
n t n t
, 0 (6)ad tU d t e
22 2
2ˆ (7)
t
to
o
g s dsg s dsr t g t A o e n t p t
a A o t ed t
n t n t
Risk Adj.
Paper II
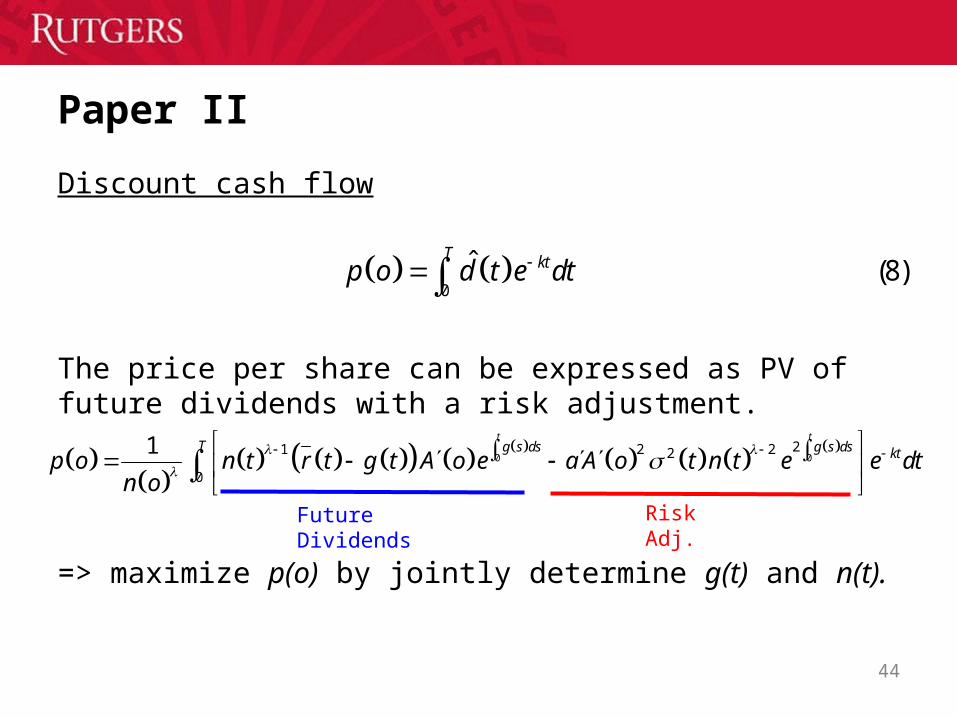
Discount cash flow
The price per share can be expressed as PV of future dividends with a risk adjustment.
=> maximize p(o) by jointly determine g(t) and n(t).
44
0
ˆ (8)T ktp o d t e dt
0 0
21 2 22
0
1t t
T g s ds g s ds ktp o n t r t g t A o e a A o t n t e e dtn o
Future Dividends Risk Adj.
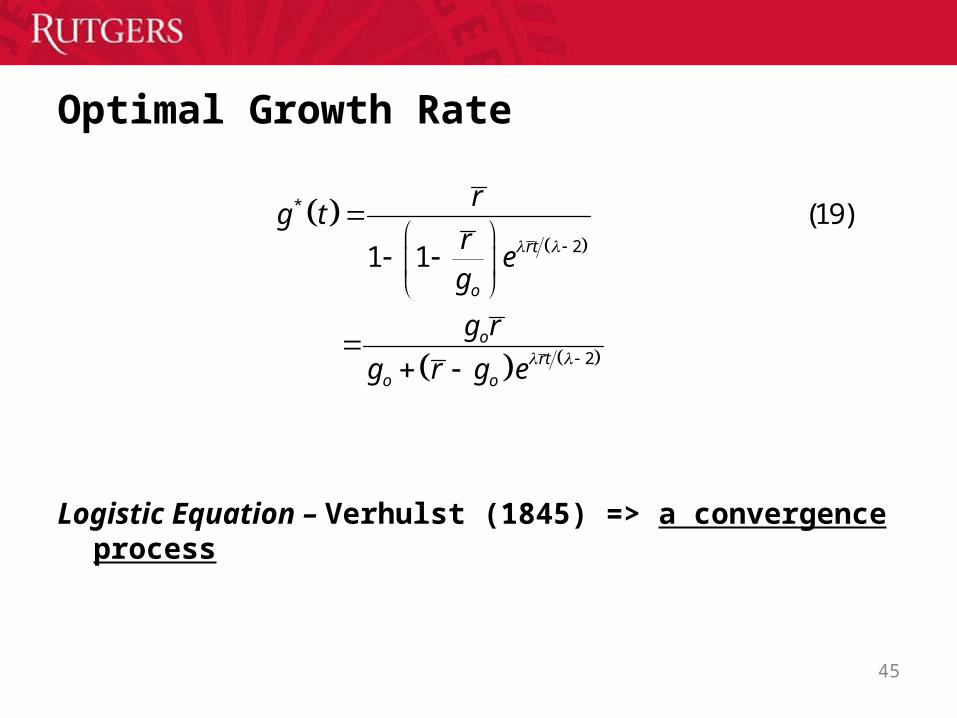
Optimal Growth Rate
Logistic Equation – Verhulst (1845) => a convergence process
45
*
2
2
(19)
1 1
rt
o
ort
o o
rg t
re
g
g r
g r g e

Case I: Optimal Growth Rate v.s. Time Horizon
46
2
**
2
2
12
(20)
1 1
r t
o
r t
o
r rr e
gg tg t
t re
g
*0
*0
*0
When , g 0.
When , g 0.
When , g 0.
g r t
g r t
g r t

47
Case I: Optimal Growth Rate v.s. Time Horizon
Convergence Process
- Firms with different initial growth rates all tend to converge to their target rates (ROE).
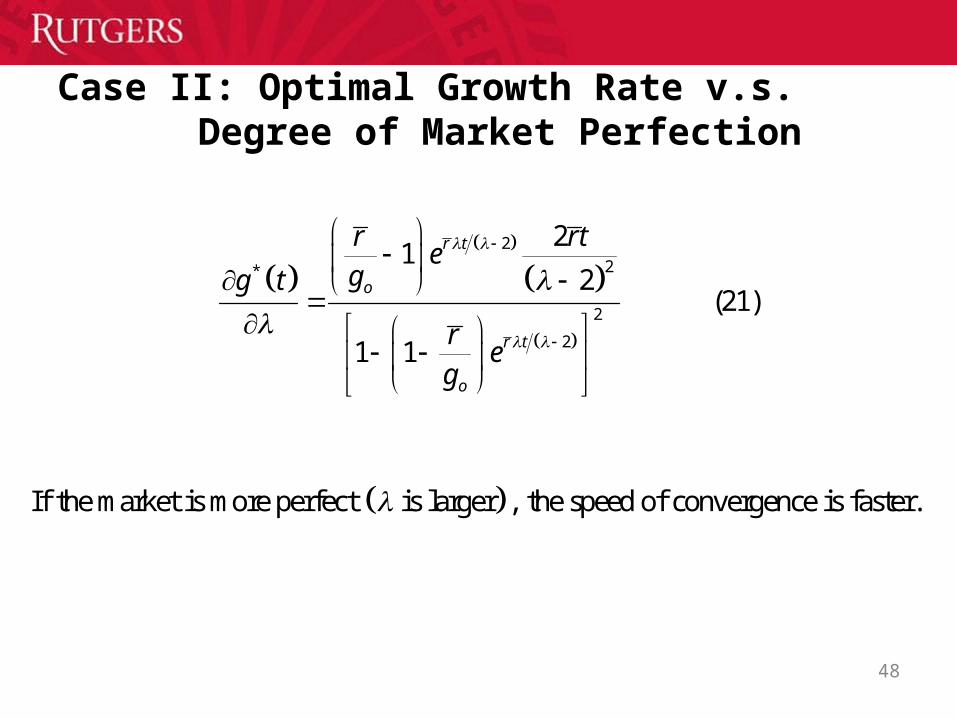
Case II: Optimal Growth Rate v.s. Degree of Market Perfection
48
2
2*
2
2
21
2 (21)
1 1
r t
o
r t
o
r rte
gg t
re
g
If the market is more perfect is larger , the speed of convergence is faster.

Case II: Optimal Growth Rate v.s. Degree of Market Perfection
49

Case III: Optimal Growth Rate v.s. ROE
When initial growth rate is lower than the target rate (ROE), eq. (22) is positive.
=> If the target rate (ROE) is higher, the adjustment process will be faster.
50
2 2
*
22
12
(22)
rt rto o o
rto o
tg g e g r re
g t
r g r g e

Case IV: Optimal Growth Rate v.s. Initial Growth Rate
Eq. (23) is always positive.
=> The higher initial growth rate is, the higher optimal growth rate at each time.
51
2
2
*
2
2
(23)
1 1
rt
o
o rt
o
re
g t g
g re
g

52

Optimal Dividend Payout Ratio
where
• Assuming ,
- Wallingford (1972), Lee et al. (2010)
53
*
0
*
2 2 * * 2 *
32 *
1
1 (29)2
tkt g s ds
D t g t
Y t r t
t t g t r g t t g te W
t r g t
*
0212 *
sT g u du ks
tW e s r g s ds
* *1 and g t g
*( )( )* 2
** 2
1 ( )1 1
( ) ( )
g k T teD t g tg
Y t r t g k t
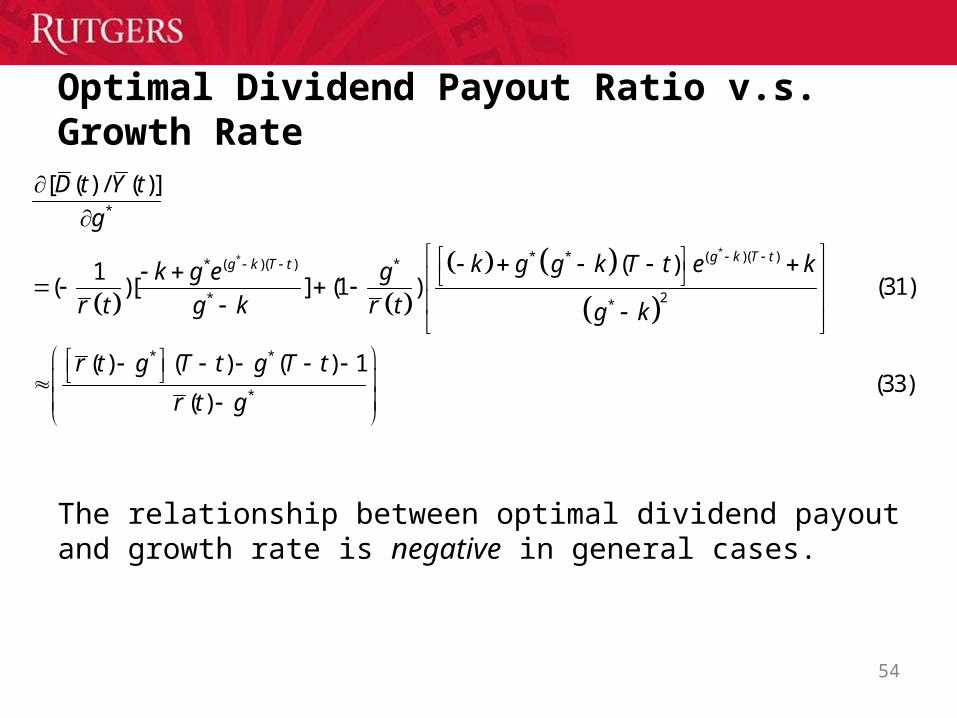
Optimal Dividend Payout Ratio v.s. Growth Rate
54
**
*
* * ( )( )* ( )( ) *
2* *
* *
*
[ ( ) / ( )]
( )1( )[ ] (1 ) (31)
( ) ( ) ( ) 1
( )
g k T tg k T t
D t Y t
g
k g g k T t e kk g e g
r t g k r t g k
r t g T t g T t
r t g
(33)
The relationship between optimal dividend payout and growth rate is negative in general cases.

Stochastic Growth Rate and Specification Error
55
( ) (3)t
og s dsdA t
A t g t A o e Y t D t n t p t LA tdt
2, gg t N g t t
Retained Earnings New Equity New Debt
When a stochastic growth rate is introduced,
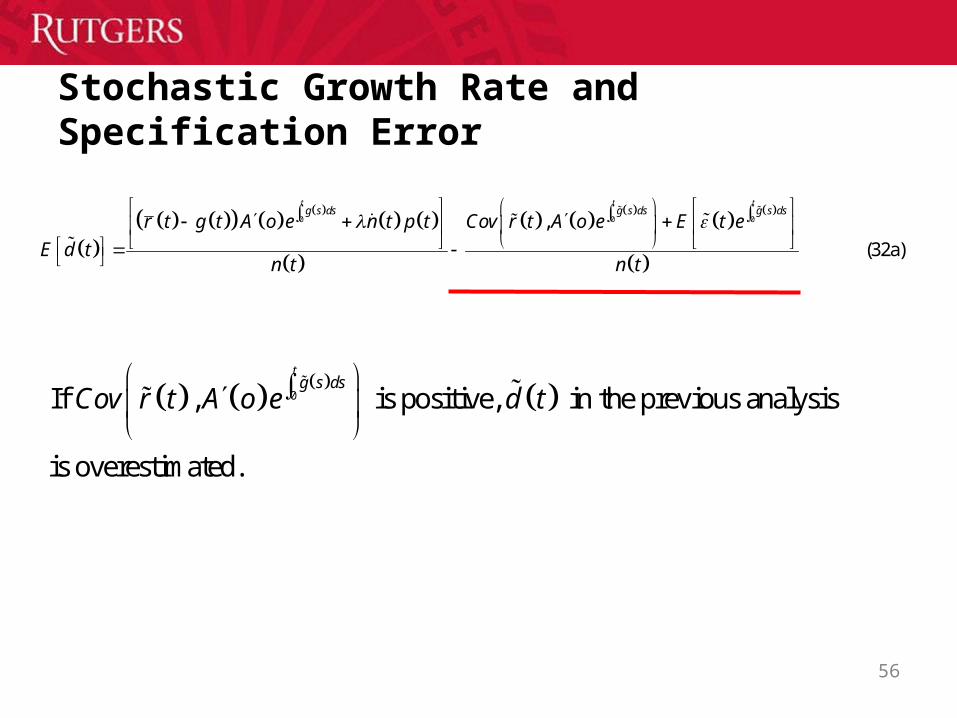
Stochastic Growth Rate and Specification Error
56
0 0 0,
(32a)
t t tg s ds g s ds g s ds
r t g t A o e n t p t Cov r t A o e E t e
E d tn t n t
0If , is positive, in the previous analysis
is overestimated.
tg s ds
Cov r t A o e d t

Conclusion
Paper I• We derive a stochastic dynamic dividend policy model under
perfect market and uncertainty.
• Different from M&M model, our model considers 1) partial payout; 2)uncertainty (risks); 3) stochastic earnings.
• The theoretical model shows that the relationship between firm's optimal payout ratio and its risks depends on its growth rate relative to its ROA.
• The theoretical model shows that the relationship between firm's optimal payout ratio and its risks is generally negative.
• The empirical results are consistent to the implications of our model.
ConclusionPaper II
• Based upon Model (I), we derive a dynamic model of optimal growth rate and payout ratio which allows a firm to finance its new assets by retained earnings, new debt, and new equity.
• The theoretical model shows the existence of an optimal payout ratio jointly determined by the number of shares outstanding and the growth rate.
• The optimal growth rate follows a convergence processes, and the target rate is firm’s expected ROE.
• The relationship between the optimal dividend payout and the optimal growth rate is negative in general.
58
References
(1) Bhattacharya, S. Imperfect information, dividend policy, and “the bird in the hand” fallacy. Bell Journal of Economics, 10, 259-270, 1979.
(2) Blau, B.M., and K.P. Fuller. Flexibility and Dividends. Journal of Corporate Finance, 14, 133-152, 2008.
(3) DeAngelo, H., L. DeAngelo, and D. J. Skinner. “Reversal of fortune: dividend signaling and the disappearance of sustained earnings growth.” Journal of Financial Economics, 40, 341–371, 1996.
(4) DeAngelo, H., and L. DeAngelo. “The irrelevance of the MM dividend irrelevance theorem.” Journal of Financial Economics, 79, 293–315, 2006.
(5) DeAngelo, H., L. DeAngelo, and R. Stulz. “Dividend policy and the earned/contributed capital mix: a test of the life-cycle theory.” Journal of Financial Economics, 81, 227-254, 2006.
(6) Easterbrook, F. H. Two agency-cost explanations of dividends. American Economic Review, 74, 650-659, 1984.
(7) Fama, E. and H. Babiak. Dividend policy: an empirical analysis. Journal of American Statistical Association, 63, 1132-1161.
References
(1) Gordon, M. J. “The savings and valuation of a corporation.” Review of Economics and Statistics, 1962.
(2) Grullon G., R. Michaely, and B. Swaminathan. “Are dividend changes a sign of firm maturity?” Journal of Business, 75, 387-424, 2002.
(3) Higgins R. C. “How much growth can a firm afford?” Financial Management, 6, 7-16, Fall 1977.
(4) Higgins R. C. “Sustainable growth under inflation.” Financial Management, 10, 36-40, Autumn 1981.
(5) Higgins R. C. Analysis for financial management, 9th ed. McGraw-Hill, Inc, NY, 2008.
(6) Jagannathan, M., C. P. Stepens, and M. S. Weisbach 2000, Financial Flexibility and the Choice Between Dividends and Stock Repurchases, Journal of Financial Economics, 57, 355-384.
(7) Jensen, M. Agency costs of free cash flow, corporate finance, and takeovers. American Economic Review, 76, 323–329, 1986.
(8) John, K. and J. Williams. Dilution, and taxes: a signaling equilibrium. Journal of Finance, 40 (4), 1053-1070, 1085.

References(16) Lang, L. H.P. and R. H. Lizenberger. Dividend announcements: cash flow signaling vs.
free cash flow hypothesis? Journal of Financial Economics, 24, 181-191, 1989.
(17) Lee, C. F., C. C. Wu, and D. Hang. Dividend policy under conditions of capital market and signaling equilibria. Review of Quantitative Finance and Accounting, 3 (1), 47-59, 1993.
(18) Lee, C. F., M. C. Gupta, H. Y. Chen, and A. C. Lee. “Dynamic model of optimal growth rate and payout ratio: theory and implications.” Working Paper, 2010a.
(19) Lee, C. F., M. C. Gupta, H. Y. Chen, and A. C. Lee. “Optimal payout ratio under perfect market and uncertainty: theory and empirical evidence.” Working Paper, 2010b.
(20) Lerner, E. M., and W. T. Carleton. “Financing decisions of the firm.” Journal of Finance, 1966.
(21) Lie, E. Excess funds and agency problems: an empirical study of incremental cash disbursements. Review of Financial Studies, 13, 219–248, 2000.
(22) Linter, J. Distribution of incomes of corporations among dividends, retained earnings and taxes. The American Economic Review, 46 (2), 97-113.
(23) Lintner, J. “Optimal dividends and corporate growth under uncertainty.” Quarterly Journal of Economics, February 1964.

References(24) Miller, M., and K. Rock. Dividend policy under asymmetric information. Journal of
Finance, 40, 1031–1051, 1985.
(25) Miller, M. H., and F. Modigliani (1966). “Some estimates of the cost of capital to the utility industry, 1954-1957.” American Economic Review, 56, 333-391.
(26) Modigliani, F. and M. H. Miller. “Dividend policy, growth, and the valuation of shares.” Journal of Business, October 1961.
(27) Nissim, D., and A. Ziv. Dividend changes and future profitability. Journal of Finance, 56, 2111–2133, 2001.
(28) Rozeff. Growth, beta, and agency costs as determinants of payout ratios. Journal of Financial Research, 5, 249–259, 1982.
(29) Verhulst, P.-F. “Recherches mathématiques sur la loi d'accroissement de la population.” Nouv. mém. de l'Academie Royale des Sci. et Belles-Lettres de Bruxelles 18, 1-41, 1845.
(30) Verhulst, P.-F. “Deuxième mémoire sur la loi d'accroissement de la population.” Mém. de l'Academie Royale des Sci., des Lettres et des Beaux-Arts de Belgique 20, 1-32, 1847.
(31) Wallingford, B. A. III. “An inter-temporal approach to the optimization of dividend policy with predetermined investments.” Journal of Finance, 27, June 1972.


