How Relevant is Dividend Policy under Low Shareholder Protection? ∗ Luc Renneboog Tilburg University and European Corporate Governance Institute Warandelaan 2, PO Box 90153, 5000LE Tilburg, The Netherlands Email: [email protected]Peter G. Szilagyi Saїd Business School - University of Oxford Park End Street, Oxford OX1 1HP, United Kingdom Email: [email protected]January 15, 2007 Abstract - This paper reopens the debate on the substitutability of dividends and shareholder control in mitigating free cash flow concerns, by examining dividend behavior when shareholder control is restricted in the firm. We consider the stakeholder-oriented governance regime of the Netherlands, where shareholdings are concentrated, but shareholder rights are often severely restricted by a legally imposed governance regime and anti-shareholder devices such as Dutch-style poison pills. We find that dividend payouts are generally low, unresponsive to earnings changes and show little relationship with size, leverage, and investment opportunities. Shareholder power restrictions affect dividend behavior to varying degrees, but those that do are used by the vast majority of Dutch listed firms. Once accounting for these, we find no evidence that strong shareholders would allow firms to relax their dividend policy, as has been proposed in the existing literature. As shareholders, institutional investors and managers actually force higher payouts. Thus, it seems that dividends often complement rather than substitute shareholders’ efforts to alleviate agency concerns. This finding is unlikely to be specific to the Netherlands, and could possibly be extended to other stakeholder-oriented governance regimes. JEL classification: G35, G32, G30. Keywords: Dividend Policy, Corporate Governance, Shareholder Power Restrictions, Ownership and Control. ∗ We are grateful for valuable suggestions to Arnoud Boot, Abe de Jong, Marina Martynova, Gerard Mertens, Enrico Perotti, Peter Roosenboom, Chendi Zhang, and seminar participants at Tilburg University, the 2006 Academy of International Business meeting in Beijing, and the Workshop of the European Corporate Governance Institute in Zurich. Luc Renneboog is grateful to the Netherlands Organization for Scientific Research for funding under the ‘Shifts in Governance’ programme and to the European Commission via the ‘New Modes of Governance’-project (NEWGOV) led by the European University Institute in Florence; contract nr. CIT1-CT-2004-506392. Peter Szilagyi is grateful for funding from the European Commission through the European Corporate Governance Training Network.
Transcript
How Relevant is Dividend Policy under Low Shareholder Protection? ∗
Luc Renneboog
Tilburg University and European Corporate Governance Institute Warandelaan 2, PO Box 90153, 5000LE Tilburg, The Netherlands
Peter G. Szilagyi Saїd Business School - University of Oxford
Park End Street, Oxford OX1 1HP, United Kingdom Email: [email protected]
January 15, 2007
Abstract - This paper reopens the debate on the substitutability of dividends and shareholder control in mitigating free cash flow concerns, by examining dividend behavior when shareholder control is restricted in the firm. We consider the stakeholder-oriented governance regime of the Netherlands, where shareholdings are concentrated, but shareholder rights are often severely restricted by a legally imposed governance regime and anti-shareholder devices such as Dutch-style poison pills. We find that dividend payouts are generally low, unresponsive to earnings changes and show little relationship with size, leverage, and investment opportunities. Shareholder power restrictions affect dividend behavior to varying degrees, but those that do are used by the vast majority of Dutch listed firms. Once accounting for these, we find no evidence that strong shareholders would allow firms to relax their dividend policy, as has been proposed in the existing literature. As shareholders, institutional investors and managers actually force higher payouts. Thus, it seems that dividends often complement rather than substitute shareholders’ efforts to alleviate agency concerns. This finding is unlikely to be specific to the Netherlands, and could possibly be extended to other stakeholder-oriented governance regimes. JEL classification: G35, G32, G30. Keywords: Dividend Policy, Corporate Governance, Shareholder Power Restrictions, Ownership and Control.
∗ We are grateful for valuable suggestions to Arnoud Boot, Abe de Jong, Marina Martynova, Gerard Mertens, Enrico Perotti, Peter Roosenboom, Chendi Zhang, and seminar participants at Tilburg University, the 2006 Academy of International Business meeting in Beijing, and the Workshop of the European Corporate Governance Institute in Zurich. Luc Renneboog is grateful to the Netherlands Organization for Scientific Research for funding under the ‘Shifts in Governance’ programme and to the European Commission via the ‘New Modes of Governance’-project (NEWGOV) led by the European University Institute in Florence; contract nr. CIT1-CT-2004-506392. Peter Szilagyi is grateful for funding from the European Commission through the European Corporate Governance Training Network.
1
1 Introduction
Black’s (1976) dividend puzzle has sparked a long-standing academic debate on why firms distribute huge sums of cash to their shareholders. Existing research has had some success in explaining dividend payouts by a variety of market imperfections such as agency problems, informational asymmetries, and taxes. Nonetheless, DeAngelo and DeAngelo (2006) argue that Miller and Modigliani’s (1961) irrelevance theorem is largely misinterpreted, as even in frictionless markets rational expectations require firms to make large payouts. The importance of shareholder control in achieving optimal payout levels cannot be sufficiently emphasized. There is evidence that strong shareholders actively pursue specific payout outcomes (Allen, Bernardo, and Welch, 2000), and to some extent make dividends redundant as a managerial control or monitoring device (La Porta et al., 2000; Goergen, Renneboog, and Correira da Silva, 2005). That dividends need not be used to contain free cash flow has been argued for stakeholder-oriented governance systems in particular, on the basis of the fact that firms in these regimes tend to have low and flexible dividend payouts as well as highly concentrated ownership structures.
This paper reopens the debate on the substitutability of dividends and shareholder control in mitigating free cash flow concerns, by examining dividend behavior when shareholder control is in fact restricted in the firm. The argument that dividends are low in stakeholder-oriented governance systems because of concentrated ownership structures is clearly incomplete. It is a well-known fact that firms in these regimes tend to adopt anti-shareholder devices that violate the one-share-one-vote rule. This may be symptomatic of the fact that they prioritize the interests of other stakeholders over the maximization of shareholder value, which may already instigate them to relax their dividend policy. If this is indeed the case, there are clearly limits to the extent that dividends can mitigate free cash flow unless shareholders are very strong. Of course, firms are unlikely to stop dividend payments completely, as long as the option of accessing capital markets remains valuable (Bulow and Rogoff, 1989).
The stakeholder-oriented governance regime of the Netherlands is a natural choice for the investigation of these issues, because most publicly listed firms impose particularly severe restrictions on shareholder control. Once Dutch firms reach a certain size, they are legally obliged to adopt an institutional form known as the structured regime, which automatically strips shareholders from most of their rights. In addition, not only do most firms adopt poison pills and golden shares (in the form of preference and priority shares), but some also withdraw voting shares and issue tradable non-voting depository receipts (certificates). The occurrence of the structured regime and the three anti-shareholder devices is extremely common; more than 90% of Dutch listed firms restrict shareholder power one way or another, and over two thirds have at least two shareholder power restrictions in place.
We use an extension of Lintner’s (1956) partial adjustment model and random-effects panel probit regressions to investigate whether these shareholder power restrictions affect dividend behavior, and whether accounting for these challenges the substitutability of dividends and shareholder control as alternative control devices. Our initial analysis already detects a number of interesting patterns in Dutch dividend behavior. Dividend payouts tend to be low and fairly smoothed, and are unrelated to reported earnings. Dutch firms formulate their dividend decisions based on operating cash flows instead, presumably to avoid unnecessary liquidity constraints. Also, dividend dynamics show no
2
statistical relationship with the severity of agency problems, to the extent that these are reflected in firm size, leverage, and investment opportunities (Fama and French, 2001). Thus, it appears that Dutch firms interpret dividend policy fairly flexibly and do not use it to mitigate free cash flow concerns. In principle, it could be that most firms are already tightly monitored by their concentrated shareholders. However, it is equally likely that shareholders are often too weak to enforce optimal payout policies.
Our further results lend more support to this latter argument. Firms that adopt the structured regime, and those multinationals that voluntarily retain it despite being exempted, pay lower dividends and smooth dividends to a lesser extent. Firms which only have to adopt a mitigated form of the regime because they are majority-owned by a foreign shareholder, show signs of being tightly monitored but do not relax their dividend behavior. Of the anti-shareholder devices, only preference shares relax dividend policy, by simultaneously diluting the voting and cash flow rights of shareholders to the benefit of management-friendly third parties. This however is a major issue, because more than two thirds of our sample firms use these securities. In fact, that dividend policy is changed in firms under the full and voluntary structured regimes is largely due to the fact that they use preference shares particularly often.
In light of these conditions, it is not surprising that we find no evidence that concentrated shareholders would allow firms to relax their dividend policy further. Rather, financial institutions and managers who efficiently mitigate agency problems as shareholders, actually force higher payouts. In other words, it seems that dividends often complement rather than substitute shareholders’ efforts to alleviate agency concerns. This finding is unlikely to be specific to the Netherlands, and could thus be extended to other stakeholder-oriented governance regimes. Without controlling for the impact of shareholder power restrictions, our analysis confirms Gugler and Yurtoglu’s (2003) result for Germany that the dividend payout ratio and the extent of dividend smoothing decrease in the equity share of the largest shareholder. Thus, it could be that accounting for shareholder power restrictions would change some of the conclusions drawn by existing studies on how ownership and control structures affect dividend policy.
The remainder of the paper is set out as follows. In Section 2 we provide an overview of the background literature, describe the Dutch governance regime, and formulate testable conjectures. A description of our sample and the methodology employed is provided in Section 3. The empirical results are discussed in Section 4. Finally, Section 5 allows for some concluding remarks.
2 Agency Problems, Payout Policy and the Implications of the Dutch Governance
System
2.1 The agency control function of payout policy
From an agency perspective, corporate payout is generally viewed as a control device that helps reduce managerial discretion, and as such is part of the firm’s optimal monitoring/bonding package (Rozeff, 1982). Easterbrook (1984) describes how regular dividend payments may force management to raise external capital for new projects, thus inflicting market discipline on the firm. Jensen (1986) adds that payout reduces free cash flow that managers may otherwise divert for personal use or to
3
fund unprofitable projects. Dividends and share repurchases are alternative mechanisms in mitigating free cash flow concerns. However, dividends impose a more permanent cash flow commitment; managers believe that markets attach a premium to consistent dividend payers and interpret dividend cuts as a negative signal (Brav et al., 2005). That managers enter into dividend smoothing has been well-documented since Lintner (1956) and Fama and Babiak (1968), and has been attributed to the private control benefits enjoyed by management (Fudenberg and Tirole, 1995). Marsh and Merton (1987) and DeAngelo and DeAngelo (1990) observe that managers avoid dividend cuts at all costs, and prefer to leave dividends unchanged if a dividend increase would likely have to be reversed in the future. Accordingly, firms with permanently high operating cash flows tend to pay dividends, while those with greater non-operating or more volatile operating cash flows resort more to share repurchases (Jagannathan, Stephens, and Weisbach, 2000).
The control function of corporate payout is evidently linked to the severity of the manager-shareholder conflict. Agency costs are assumed to be lowest in small firms with abundant growth prospects (Fama and French, 2001). In these firms, high payouts may lead to excessive reliance on external financing, which can exacerbate underinvestment risk (Myers, 1977) and harm the incumbent shareholders (Goergen, Renneboog, and Correira da Silva, 2005). Agency problems may also be alleviated by alternative mechanisms which reduce the marginal control benefits of corporate payout. Fluck (1999) develops a model where the amount of dividends depends on the effectiveness of outside shareholders in disciplining management. The control function of payout may also be substituted by leverage and managerial ownership (Jensen, Solberg, and Zorn, 1992), though the desired relationship with the latter is non-monotonic due to managerial entrenchment concerns (Schooley and Barney, 1994; Morck, Shleifer, and Vishny, 1988; Fenn and Liang, 2001).
Regarding the monitoring effectiveness of outside shareholders, several issues warrant consideration. Firstly, shareholders have better incentives and ability to monitor management when they hold large, concentrated equity blocks (Grossman and Hart, 1980). This suggests that when strong shareholders exert their power, dividends need not constitute an additional control device and may simply lead to unnecessary liquidity constraints and underinvestment risk (Goergen, Renneboog, and Correira da Silva, 2005). Country-level studies show some evidence in this regard. Rozeff (1982) and Moh’d, Perry, and Rimbey (1995) find that US firms with less dispersed ownership pay fewer dividends. The presence of strong shareholders or their coalitions also lowers payout levels in the UK and weakens the relationship between earnings and payout dynamics (Renneboog and Trojanowski, 2006). La Porta et al. (2000) provide a cross-country comparison and show that in the stakeholder-oriented governance regimes of Continental Europe where ownership structures are more likely to be concentrated, dividend payouts are generally lower and more flexible than in the market-oriented Anglo-American world.
Secondly, controlling shareholders may be efficient monitors, but like management, they may also keep payout levels low to expropriate minority shareholders. Expropriation by insider shareholders is more relevant an issue in Continental European countries where the legal protection of minority shareholders is low and firms often adopt anti-shareholder devices that violate the one-share-one-vote rule (La Porta et al., 2000). Faccio, Lang, and Young (2001) argue that rational investors may anticipate expropriation and demand higher dividends from firms that are more likely to expropriate them. Still, minority shareholders may only be able to force higher payouts if they are sufficiently powerful or if firms have reputational needs to access capital markets (Bulow and Rogoff, 1989).
4
Accordingly, Faccio, Lang, and Young (2001) find that in Continental Europe, payouts are higher when multiple large shareholders are present. For Germany, Gugler and Yurtoglu (2003) also report that payout levels decrease in the power of the largest shareholder but increase in the power of the second largest shareholder. For the UK where the protection of minority shareholders is reasonably strong, Renneboog and Trojanowski (2006) do not report such patterns.
And thirdly, payout levels are not invariant to the identity of the controlling shareholder because (i) some shareholder classes may be better monitors than others; and (ii) the payout policies they enforce can reflect their specific payout preferences. Financial institutions are often credited with having a comparative advantage in monitoring efficiency (Grossman and Hart, 1980; Shleifer and Vishny, 1986). This translates into more flexible payout policies in institutionally controlled firms both in the UK (Renneboog and Trojanowski, 2006) and in Germany (Goergen, Renneboog, and Correira da Silva, 2005)1. Still, institutional investors tend to expect at least some level of payout, either because they enjoy a preferential tax treatment or due to tax asset-liability management considerations (Allen, Bernardo, and Welch, 2000)2. Accordingly, they prefer firms to pay dividends but without actually demanding higher payouts (Grinstein and Michaely, 2005; Renneboog and Trojanowski, 2005 and 2006).
Renneboog and Trojanowski (2006) find that in the UK, payout levels are in fact lowest in firms controlled by individual investors. Gugler (2003) reports similar results for Austria, and argues that individuals are better able and incentivized to monitor firms directly3. Gugler (2003) finds that payout levels are highest and smoothed the most in government-controlled firms. He attributes this to a double principal-agent problem, whereby steady dividend flows reflect greater managerial discretion to defend incumbency rents, and the efforts of ill-monitored politicians, to whom the managers are accountable, to keep their electorate happy. Both Gugler (2003) and Renneboog and Trojanowski (2006) characterize the dividend behavior of firms controlled by other non-financial firms as relatively normal. Gugler (2003) argues that these results are consistent with the expected ‘ranking’ of shareholder types in how efficiently they mitigate informational asymmetries and managerial agency costs. It is then surprising that managerial ownership, which Jensen, Solberg, and Zorn (1992) regard as an alternative control device, does not have a meaningful impact on dividend policy either, as shown by Fenn and Liang (2001) for the US and Renneboog and Trojanowski (2006) for the UK. 2.2 Payout policy in the Netherlands: background and conjectures
The Dutch model of corporate governance, known as the ’polder model’, is a stakeholder-oriented insider system typical of Continental European countries. In stark contrast with the shareholder orientation of Anglo-American governance regimes, the essence of this model is consensus seeking
1 For Germany, Amihud and Murgia (1997) argue that if banks are also creditors to the firms they control, they may also favor lower and more flexible payouts to mitigate bankruptcy risks. 2 Elton and Gruber (1970) and Litzenberger and Ramaswamy (1982) report that investors in low tax brackets prefer high and those in high tax brackets prefer low dividends. Perez-Gonzalez (2002) later reports that tax reforms are followed by payout changes consistent with the tax-induced preferences of the largest shareholders. The tax position of major shareholders is shown to have an economically important effect in the UK and Canada by Bond, Chennels, and Devereux (1996) and Eckbo and Verma (1994), respectively. 3 The preference of retail investors for dividends, as documented by Baker and Wurgler (2004) and Graham and Kumar (2006), is unlikely to apply to wealthy individuals with concentrated shareholdings.
5
among the firm’s various stakeholders, particularly between employers and employees4. The Dutch model fully complies with Franks and Mayer’s (2001) definition of insider systems: the number of quoted firms is relatively small, share ownership is highly concentrated, and takeover activity is minimal (Cools and van Praag, 2003). Dutch firms are also allowed considerable reporting discretion; enforcement is weak and tax accounting is formally separate from financial accounting (Alford et al., 1993; Ali and Hwang, 2000).
The peculiarity of the Dutch governance regime lies in the fact that it allows for particularly severe restrictions on shareholder power even compared to other insider systems. Once Dutch firms reach a certain size, they must switch to an institutional form called the structured (or ‘structuur’) regime. The adoption of the structured regime is compulsory for limited liability firms once (i) their subscribed capital exceeds €11.4 million, and (ii) they employ at least 100 employees and have a legally installed workers’ council in place. The immediate objective of the structured regime is to give workers’ councils a role on the supervisory boards of large companies. However, it simultaneously strips shareholders of most of their tasks and responsibilities to the benefit of the supervisory board. The powers of the supervisory board are almost exhaustive, and include the approval of the annual accounts, the election of management and the election of the supervisory board itself (by way of co-optation). Shareholders may still vote on dividend policy and takeovers, but ultimately retain little role in holding management accountable. Accordingly, firms under the structured regime have been shown to smooth earnings more actively, report more conservatively and be less likely to meet or beat analyst expectations (Cuijpers, Moers, and Peek, 2005).
The current law establishes a number of exemptions from the full adoption of the structured regime. Firms that are majority-owned by foreign entities can adopt a mitigated form of the regime. This model maintains co-optation but allows shareholders to vote on the annual accounts and the appointment of management. Firms are exempted entirely if they have more than 50% of their employees abroad or if they are majority-owned by a Dutch multinational under the structured regime. Still, most exempt firms retain a weaker form of the regime voluntarily, because full elimination requires a statute amendment which the supervisory board can easily block (De Jong et al., 2005).
Typically of insider governance systems, the vast majority of Dutch firms further restrict the rights of minority shareholders by issuing securities that explicitly violate the one-share-one-vote rule. The provisions of Euronext Amsterdam allow the use of maximally two of three security types:
• Certificates are tradable depository receipts that carry cash flow rights but no voting rights.
They are issued in exchange for ordinary voting shares, which are deposited with the issuer, the administration office (Stichtingskantoor). The administration office, always friendly to management, takes over all voting rights on the withdrawn shares, and usually takes a voting majority.
4 A polder is a low-lying tract of land enclosed by dikes and often reclaimed from the sea. The term ‘polder model’ has been used to describe the (slow) decision making process in Dutch politics, where all parties have to be heard. Governance in the Netherlands is characterized by the tri-partite co-operation of employers’ organizations, labor unions and the government in the Social Economic Council. Despite criticism, this model has often helped to diffuse labor conflicts and avoid strikes.
6
• Preference shares are Dutch-style poison pills that carry full voting rights. These shares are issued under takeover threat to a friendly trust office or outside investor. The purchaser pays only 25% of the nominal capital upfront, and the issue size can be up to 50% or even 100% of the firm’s outstanding capital.
• Finally, priority shares are similar to French or British ’golden shares’. They carry special voting privileges over issues such as merger approval, public offerings, the appointment of board members, charter amendments, and liquidation. They are usually sold to a friendly foundation.
De Jong et al. (2005) report that both the full and voluntary forms of the structured regime and
each anti-shareholder device are associated with lower firm values as measured by Tobin’s Q. In most cases, these mechanisms are used cumulatively, thus shareholder power tends to be severely weakened in Dutch firms. Accordingly, annual shareholder meetings are met with a great deal of apathy in terms of attendance, and management-sponsored proposals, including recommendations on payout policy, are rarely contested5. 2.2.1 The impact of shareholder power restrictions on payout policy
We expect a great deal of variation in the extent to which the various shareholder power restrictions affect dividend behavior. An important distinction must first be made among the various forms of the structured regime. We have mentioned that the structured regime still allows shareholders to vote on dividend policy. However, management recommendations on dividend payouts are typically put to vote in conjunction with other management-sponsored proposals and are almost always passed. Overall, this dictates that under the structured regime, dividend payouts should be relatively low and unsmoothed. Still, only under the full and voluntary forms of the regime are agency problems expected to be severely amplified. Under the mitigated regime, managers remain tightly controlled because (i) shareholders maintain the right to vote on the appointment of managers and (ii) the foreign majority owner has powerful monitoring incentives. Then, dividend payouts may be low and unsmoothed, but this may simply reflect the controlling shareholder trading off free cash flow concerns against the risk of underinvestment. Overall, we conjecture that firms under the structured regime are less likely to pay dividends, and the dividends they pay are relatively low and unsmoothed. The reduction in dividends and dividend payout probability is greatest under the full and voluntary forms of the regime, and relatively smaller under the mitigated regime.
Of the anti-shareholder devices, preference shares should have the most severe impact on dividend policy. An important attribute of these securities is that they simultaneously dilute the voting and cash flow rights of common shareholders, leaving them with little power to force optimal payouts. The holders of preference shares are also unlikely to demand high dividends, both because they are management-friendly and because preference shares are cheap to acquire with only 25% of the nominal value payable upfront. We therefore conjecture that firms using preference shares are less likely to pay dividends, and the dividends they pay are relatively low and unsmoothed. Certificate
5 De Jong, Mertens, and Wasley (2004) examine 245 annual meetings between 1998 and 2002. They find that only 30% of shareholders were present at each meeting on average. Shareholders did not sponsor a single proposal, and of 1,583 management-sponsored proposals only 9 were rejected or withdrawn.
7
users have better incentives to maintain dividend payments, because these instruments only carry cash flow rights. Effectively, dividends may here be considered as compensation to the certificate holders who have given up their voting rights. We thus conjecture that firms using certificates are more likely to pay dividends, and the dividends they pay are relatively high and smoothed. Finally, we expect priority shares to have the least pronounced effect on dividend behavior. These securities may relax pressure on management to reimburse shareholders, but they otherwise obstruct shareholder control over specific issues unrelated to dividend payout. Thus, we conjecture that the use of priority shares leaves dividend behavior unchanged. 2.2.2 The impact of ownership structure on payout policy
A complementary prediction on dividend policy, already made for the mitigated structured regime, is that dividends are low and flexible provided that an incumbent shareholder with powerful monitoring incentives is present. This argument recognizes that dividends need not constitute an additional control device when alternative mechanisms are at work, and thus may simply lead to unnecessary liquidity constraints and underinvestment risk. Still, the incumbent shareholder may keep dividends low to expropriate minority shareholders. Consequently, strong minority shareholders may force higher payouts to mitigate expropriation risk. We thus conjecture that the probability of dividend payouts and the level and smoothing of dividend payments (i) decreases in the equity stake of the largest shareholder and (ii) increases in the equity stake of the second largest shareholder.
We conjecture that the identity of the major shareholders affects dividend behavior in the same way that the existing literature documents for other countries. We expect the impact of institutional ownership to be two-fold. On one hand, the marginal control benefits of dividends should be particularly low when institutional investors make use of their superior monitoring skills. On the other, financial institutions are likely to have a greater preference for systematic dividend payouts than do other shareholders, due to their preferential tax treatment and/or permanent cash flow needs. While capital gains are not taxed in the Netherlands, pension funds are also tax-exempt on dividend income. Banks and insurance funds are taxed at 35% on dividends, but they may still demand permanent cash flow streams due to tax asset-liability management considerations. Overall, we conjecture that firms controlled by financial institutions are more likely to be dividend payers, and pay unsmoothed but not lower dividends.
For other shareholders we do not expect tax clientele effects, especially as dividend income is always at a tax disadvantage relative to capital gains (expect for the government)6. Rather, we conjecture that dividend behavior is predicted simply by the relative level of agency costs under the control of each shareholder type. The marginal control benefits of dividends should be lowest in firms controlled by wealthy private individuals with strong monitoring skills and incentives, and also reduced to some extent under control by other non-financial firms. Thus, we conjecture that firms controlled by individual investors and non-financial firms are less likely to pay dividends, and the dividends they pay are relatively low and unsmoothed. Similar patterns should persist in the payout of
6 Dividend income of Dutch private individuals in the Netherlands is taxed progressively on small shareholdings, but at a flat tax rate of 25% on blockholdings of 5% or more.
8
firms controlled by managers or supervisory board members, to the extent that insider ownership helps mitigate managerial agency problems. Conversely, the double principal-agent problem dictates that government-owned firms are more likely to pay dividends, and that the dividends they pay are relatively high and smoothed over time.
3 Data and Methodology
3.1 Descriptive statistics
Our sample covers Dutch firms listed on Euronext Amsterdam and the new market NMAX over the period between 1996 and 2004. We exclude banks, insurance companies and other financial firms (SIC codes 6000-6900), because their financial reporting standards are different from those of the rest of the sample. We also exclude utilities (SIC codes 4900-4949), because their payout policies and access to external financing are regulated. Finally, we retain only those firms that are present for at least three years of the sample period in the Worldscope Disclosure dataset and the yearly stock exchange guide Handboek Nederlandse Beursfondsen. The final sample contains 150 firms with a total of 962 firm years, representing more than two thirds of Dutch listed non-financial firms and around 90% of the market capitalization of the Amsterdam Exchanges. Accounting data on each firm is gathered from the Worldscope database. To determine whether the firms operate under a particular type of the structured regime and whether they use anti-shareholder devices, we consult the Kluwer book Monitoring Corporate Governance in Nederland 1998. For those firms not included in this volume, we consult the annual reports.
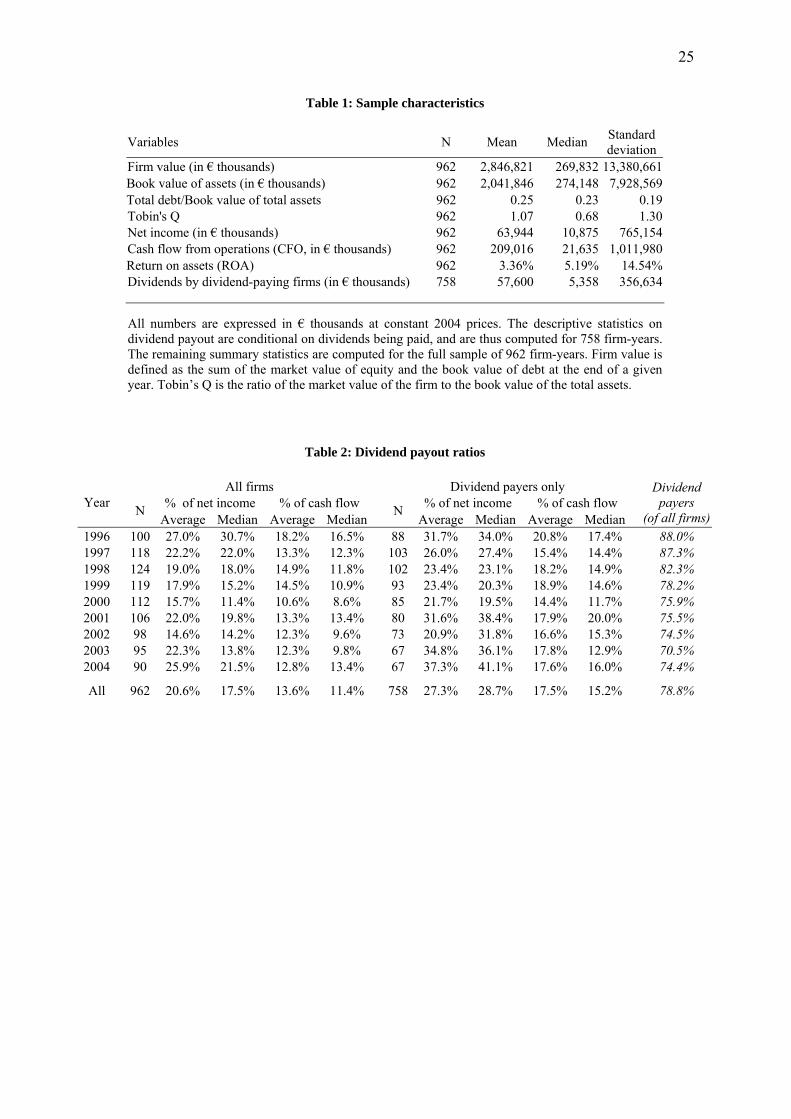
Table 1 summarizes the sample characteristics in constant 2004 prices. The results show that the market value of the median firm is relatively high at €269.8 million. There is also considerable skewness in firm size; the mean market value is much higher still at €2.8 billion, driven by multinationals such as Royal Dutch Shell, Philips Electronics and Akzo Nobel. The mean and median book values of total assets are €2.0 billion and €274.1 million, respectively. It is notable that the while the average Tobin’s Q is 1.07, the median Tobin’s Q is below unity at 0.68, largely owing to the relative underperformance of Euronext Amsterdam after March 2000. Still, the typical firm is reasonably profitable with a net income of €10.9 million and a return on assets (ROA) of 5.19%. The median level of operating cash flow is also relatively high at €21.6 million. The sample firms tend to be moderately levered, with the median debt-to-assets ratio at 0.23. Dividends are paid in 758 of the 962 firm years, and typically amount to €5.4 million.
(Insert Table 1 about here)
Table 2 examines the dividend behavior of the sample firms in greater detail. The results show that the proportion of dividend payers has been on the decline since the mid-1990s, falling from 88.0% in 1996 to 74.4% in 2004. The payout ratios of the dividend payers follow a cyclical pattern. During the stock market rally between 1996 and 2000, dividends as a percentage of net income declined continually from an average 31.7% to 21.7%. Thereafter, the payout ratios picked up again notwithstanding a temporary fall in 2002, and reached 37.3% in 2004. These patterns are not unlike those reported for the US, where dividend payouts were on the decline during the 1990s (Fama and
9
French, 2001) but rebounded after the stock market decline during the early years of the current decade (Julio and Ikenberry, 2004)7. Dividend payouts as a percentage of operating cash flows exhibit similar trends but are generally more stable. Over the whole sample period, dividend payers paid out an average 27.3% of their net income and 17.5% of their operating cash flows. For the aggregate sample of payers and non-payers, the same figures come to 20.6% and 13.6%, respectively. In their cross-country study, La Porta et al. (2000) report similar numbers for 1994, and conclude that Dutch firms generally pay lower dividends than do firms in the market-oriented governance regimes of the Anglo-American world.
(Insert Table 2 about here)
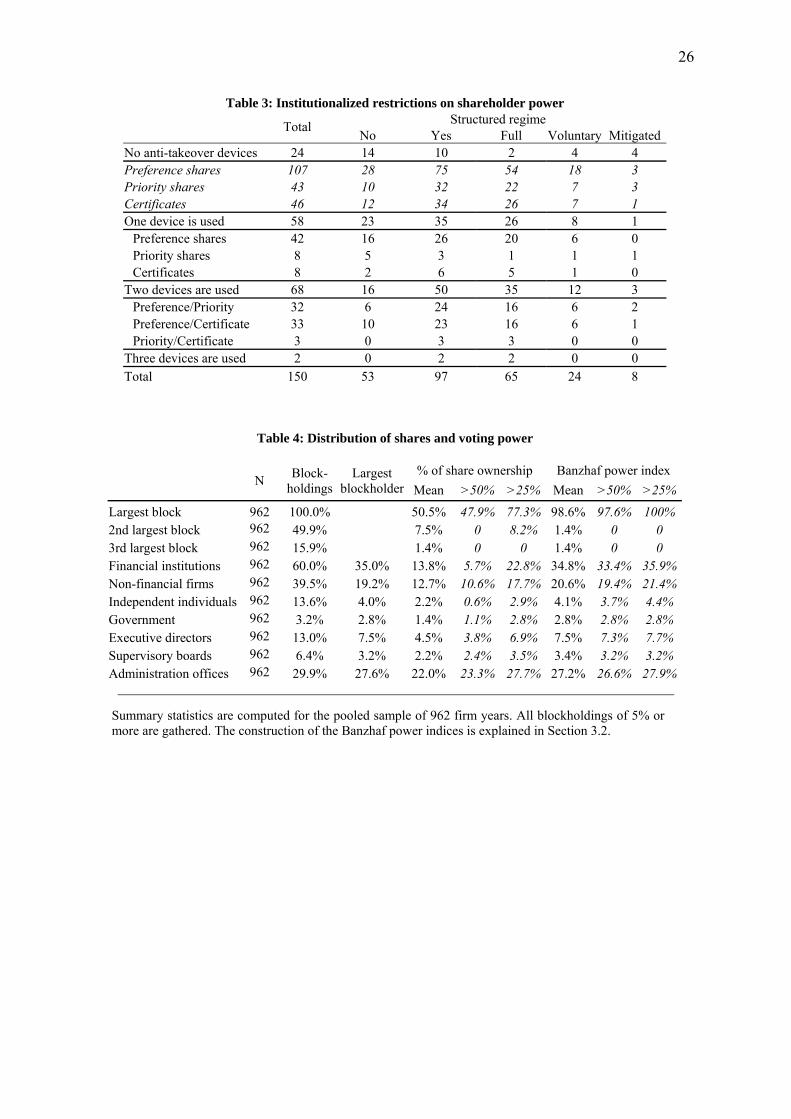
Table 3 illustrates the occurrence of shareholder power restrictions among the sample firms. The figures suggest that shareholder control tends to be severely limited in the Netherlands. Of the 150 firms, only 14 impose no limitations on shareholder rights, by neither operating under the structured regime nor using anti-shareholder devices. Nearly two thirds of the sample firms operate under the structured regime; the full and mitigated forms of the regime are legally imposed in 65 and 8 cases, respectively, while 24 firms retain the regime voluntarily. A staggering 126 firms employ anti-shareholder devices, and 70 use more than one. The use of preference shares (107) is by far the most common, followed by certificates (46) and priority shares (43)8. Firms under each form of the structured regime are more likely to use and combine these securities, imposing cumulative restrictions on shareholder control.
(Insert Table 3 about here) 3.2 Share ownership
We hand-collect data on the ownership of the sample firms from the various editions of Handboek Nederlandse Beursfondsen. As these handbooks were published bi-yearly prior to 1999, we assign ownership changes to the correct year using information from the annual reports. Equity block ownerships exceeding 5% are classified into seven mutually exclusive categories: (i) financial institutions (banks, insurance firms, investment and pension funds, venture capitalists); (ii) independent individuals; (ii) the government; (iv) non-financial firms; (v) executive directors and their families; (vi) supervisory board members and their families; and (vii) administration offices. Individual and institutional investors are classified into the various categories based on Handboek Nederlandse Beursfondsen, the Amadeus database and the annual reports.
To approximate the influence of the various shareholder types on corporate decision making, we follow Crespi and Renneboog’s (2003) approach and construct a two-stage voting game. In the first stage, all shareholders of a particular type (e.g. all financial institutions) form a coalition. In the second stage, such coalitions participate in a voting game where the payout policy is decided upon.
7 There is even evidence that the aggregate real dividends paid continued to increase even as the proportion of dividend payers was falling, much in the same way that DeAngelo, DeAngelo, and Skinner (2004) document for the US. 8 The use of the three anti-takeover devices is not correlated significantly, except a very mild negative correlation between priority shares and certificates.
10
The two-stage approach advocated here is relevant due to similarities in the payout preferences and monitoring efficiency of investors of the same type. For instance, we have mentioned that institutional investors are generally regarded as having a greater relative preference for dividends over capital gains than do other investor types.
We use two alternative measures of shareholder influence: ownership concentration and Banzhaf power indices (Banzhaf, 1965). Banzhaf indices are voting power measures obtained by modeling voting games with policy-seeking motives (I-power). Recent empirical research has often used Shapley values instead to measure shareholder power (Shapley and Shubik, 1954; Milnor and Shapley, 1978). However, Leech (2002) argues that Shapley values are inappropriate in the context of shareholder voting, because they model voting games with the prize being the power itself (P-power).9 As the shareholder voting games can be regarded as oceanic, we employ a generalization of the Banzhaf value proposed by Dubey and Shapley (1979). Under some regularity conditions, such oceanic Banzhaf indices are calculated by taking the values for a modified, finite game consisting only of the major players, and making an appropriate adjustment for the required majority threshold (Felsenthal and Machover, 1998). Throughout our later analysis, both the ownership variables and Banzhaf indices are lagged by one period. We deem this necessary to eliminate any simultaneity bias, because specific payout policies may inherently attract investor clienteles and thus lead to endogeneity problems.
The ownership structures and corresponding Banzhaf power indices of the sample firms are summarized in Table 4. The data show that ownership concentration is very high among Dutch listed firms, corresponding to similar figures reported for Germany by Correira da Silva, Goergen, and Renneboog (2004). The largest blockholder holds the majority of ordinary shares in 47.7% of the 962 observations, and controls at least 25% of the shares in 77.3% of observations. Other shareholders tend to be weak. A second largest blockholder is present in 50.2% of observations, but only in 8.4% of all cases does it hold a blocking minority of at least 25%, a regulatory threshold in the Netherlands. A third largest blockholder is present in 14.8% of all observations. The mean value of the Banzhaf power indices is 98.6% for the largest blockholder, and only 0.2% for both the second and third largest blockholders.
(Insert Table 4 about here)
The results show that financial institutions constitute the most powerful class of shareholders. Institutional investors hold equity blocks in 60.0% of observations, and their coalitions have a mean Banzhaf index of 34.8% despite holding only 13.8% of ordinary shares on average. The other powerful class of outside investors is non-financial firms, which hold equity blocks in 39.5% of all observations, and have an equity share of 12.7% and a Banzhaf index of 20.6% on average. The frequent use of certificates also lends a great deal of authority to administration offices. Certificates are issued by less than a third of Dutch firms, but those that do tend to withdraw the majority of their ordinary shares. As a result, administration offices have an average equity share of 22.0% and a mean Banzhaf index of 27.2%. The influence of other shareholder groups on corporate decision making is
9 A detailed discussion about the differences in I- and P-power and the most appropriate voting games can be found in Felsenthal and Machover (1998).
11
considerably smaller. Independent individuals tend to be minority investors; they hold equity blocks in 13.6% of observations, but have a mean equity share of just 2.2% and a mean Banzhaf index of 4.1%. Similarly, executive directors and supervisory board members hold equity blocks in 13.0% and 6.4% of all cases, respectively, but their share of ownership and the corresponding Banzhaf indices are comparatively low. The government has relatively few equity interests, though it has a blocking minority of at least 25% in most firms it holds equity in. 3.3 Methodology
We conduct a two-stage multivariate analysis to investigate how dividend behavior is affected by shareholder power restrictions, ownership structures and other firm characteristics. First, we explain the likelihood that a firm pays dividends using random-effects panel probit regressions. In these models, the dependent variable equals 1 if a firm paid dividends in a particular year and 0 otherwise. The basic model includes a fixed set of regressors to control for firm-specific characteristics that include ROA, firm value, leverage, and investment opportunities as measured by Tobin’s Q. In addition, we employ indicator variables corresponding to each shareholder power restriction and their interactions with ROA, and later include the ownership variables defined above. We also control for industry-specific and year-specific effects.
In the second stage, the actual dynamics of dividends are analyzed using an extension of Lintner’s (1956) partial adjustment model. Lintner assumes that firms maintain a target payout ratio, and adjust (‘smooth’) payout only gradually to earnings shocks over several years. For any year t the dividend payout of firm i is assumed to be related to earnings Πit by a desired payout ratio τi:
(1) . *it i itD τ= ⋅Π
In year t, firm i adjusts to the target dividend payout only partially, such that:
(2) *, 1 , 1( )it i t i i it i t itD D D Dα δ ε− −− = + ⋅ − + ,
where αi is a constant, is the actual change in dividends, , 1it i tD D −− *, 1it i tD D −− is the desired change
in dividends, δi is the speed of adjustment and εit is the error term. Rearranging (2) and substituting (1) into (2) then yields
(3) , 1(1 )it i i i t i i it itD Dα δ δ τ−= + − ⋅ + ⋅ ⋅Π +ε .
Our empirically testable model is formulated using (3) such that
(4) 1 , 1 2it i i t it itD Dα β β−= + ⋅ + ⋅Π +ε ,
where αi is the firm-specific effect, β1, and β2 are model parameters, and εit is the error term. Here,
the implicit target payout ratio is given by 2
1iβτβ1
=−
, while the speed of adjustment is 11iδ β= − , or
correspondingly the extent of dividend smoothing is β1. It is useful to point out that the target payout ratio increases in both the ’smoothing’ coefficient β1 and the ‘impact’ coefficient β2. As before, we add to the basic model a fixed set of regressors to control for firm-specific characteristics i.e. firm size, leverage and Tobin’s Q, and also control for industry and year effects. In order to test our conjectures pertaining to the impact of shareholder power restrictions and ownership structures, we later include as regressors interactions of the governance dummies and ownership variables with both
12
Di,t-1 and Πit. Then, the sums of the smoothing and impact coefficients on Di,t-1 and Πit, respectively, define the target payout ratios and smoothing levels associated with each restriction and ownership characteristic.
The above partial adjustment specification constitutes a set of dynamic panel data models with the lagged dependent variable included as a regressor. Baltagi (2001) finds that in such a framework, traditional estimators such as the fixed-effects within-estimator may lead to severe biases in those specifications in particular where the time dimension of the panel is fairly small. Several GMM-type estimators have been proposed as more suitable alternatives. Arellano and Bond (1991) suggest a simple estimator based on a first-differenced equation where the differences are instrumented by lagged levels of the regressors. Blundell and Bond (1998) later improve on this estimation technique by including lagged differences of the dependent variable as instruments for equations in levels (in addition to using levels as instruments for the differences). We estimate the models applying this so-called GMM-in-systems estimator, using Stata’s xtabond2 module.
4. Empirical Results
4.1 General patterns in dividend behavior
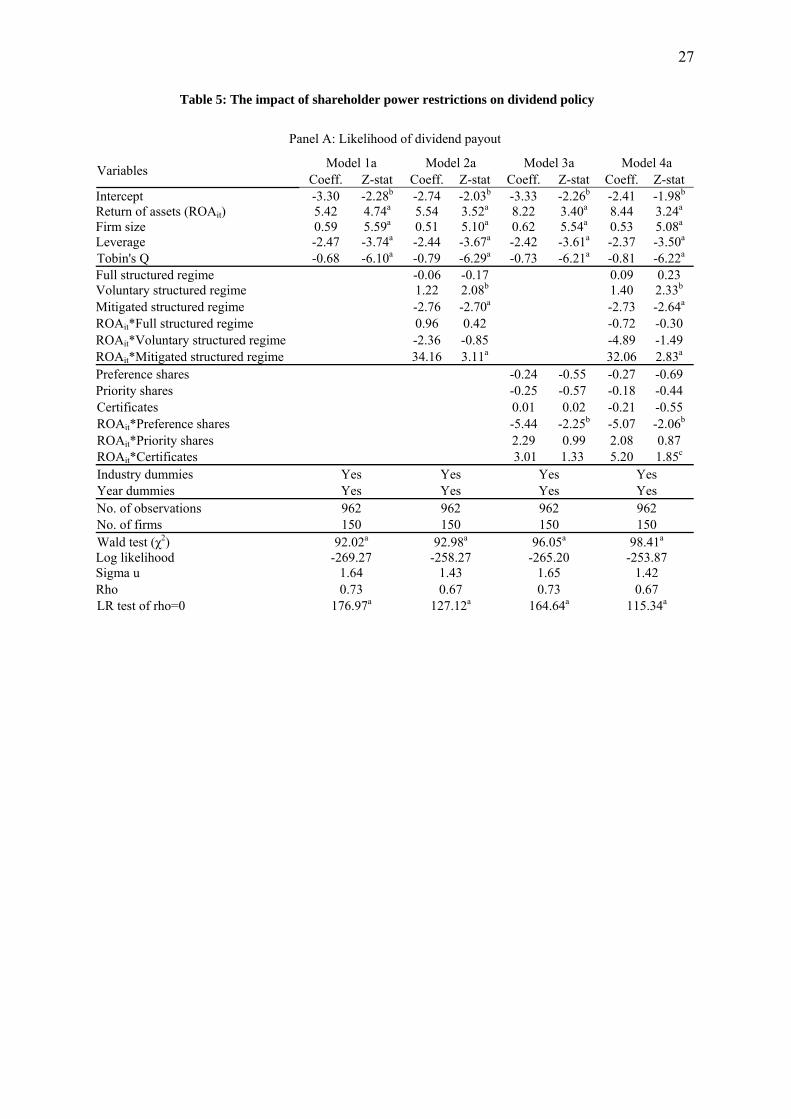
We begin our empirical analysis by observing some general patterns in Dutch dividend behavior. The probit and partial adjustment models in their basic form are depicted in Table 5 as Model 1a in Panel A and Model 1b in Panel B, respectively. The probit regression in Model 1a shows that Fama and French’s (2001) predictions on the drivers of dividend payout likelihood also hold for Dutch firms. We find that dividend payers, relative to non-payers, tend to be larger, more profitable, less levered, and have fewer growth opportunities. This suggests that the probability of a dividend payout increases in the severity of agency problems.
(Insert Table 5 about here)
However, the partial adjustment model in Model 1b shows some striking peculiarities in the actual dynamics of dividend payout. We had to specify the model using operating cash flows rather than net income, because the latter shows no statistical relationship with dividends. This is a remarkable finding which contradicts Lintner’s (1956) hypothesis that firms determine their desired payout ratios as a function of their after-tax earnings. Goergen, Renneboog, and Correira da Silva (2004) find that operating cash flows better predict dividends in Germany as well10. The authors propose two possible explanations for this result. On one hand, firms may shield their income from dividend commitments, and instead formulate their dividend decisions based on cash flows. On the other, it is possible that dividends are set as a function of earnings, but the published earnings figures are conservative and smoothed over time. For the Netherlands, the latter argument is weakened somewhat by the high earnings volatility reported in Table 1.
10 Goergen, Renneboog, and Correira da Silva (2004) find that the relationship between net income and dividends only holds when the regression simultaneously controls for cash flow. Our results are invariant to such alternative specifications.
13
Secondly, it is notable that payout levels show no statistical relationship with firm size, leverage, and investment opportunities as measured by Tobin’s Q. These results cast considerable doubt on the role of dividends in mitigating agency concerns in the Netherlands. In principle, this may support the argument that dividends need not constitute an additional control device when ownership structures are highly concentrated. However, it may equally indicate that shareholders are simply too weak to enforce payout policies that optimize shareholder value (La Porta et al., 2000). Table 3 has shown that this is not an unreasonable assumption; over 90% of our sample firms limit shareholder rights in some way and more than two thirds impose cumulative restrictions on shareholder power.
And thirdly, it is noteworthy that the implied target payout ratio predicted by the partial adjustment model is considerably higher than those observed empirically. In Model 1b of Panel B, the implied
target payout is 38.5% of operating cash flow (0.10
1 0.74iτ = −), which is a substantial departure from the
average 13.6% reported in Table 2. The dividend smoothing practices of Dutch firms are insufficient to explain this discrepancy. In the model, the level of dividend smoothing is relatively high at β1=0.74 (the speed of adjustment is correspondingly low at 1–0.74=0.26), which is comparable to that reported for Germany by Goergen, Renneboog, and Correira da Silva (2004). Still, it is likely that dividend policy in the Netherlands is largely driven by other determinants that Model 1b does not control for. This further justifies extending our analysis by investigating the impact of shareholder power restrictions and ownership structures on dividend behavior. 4.2 The impact of shareholder power restrictions on dividend behavior
4.2.1 The likelihood of dividend payout
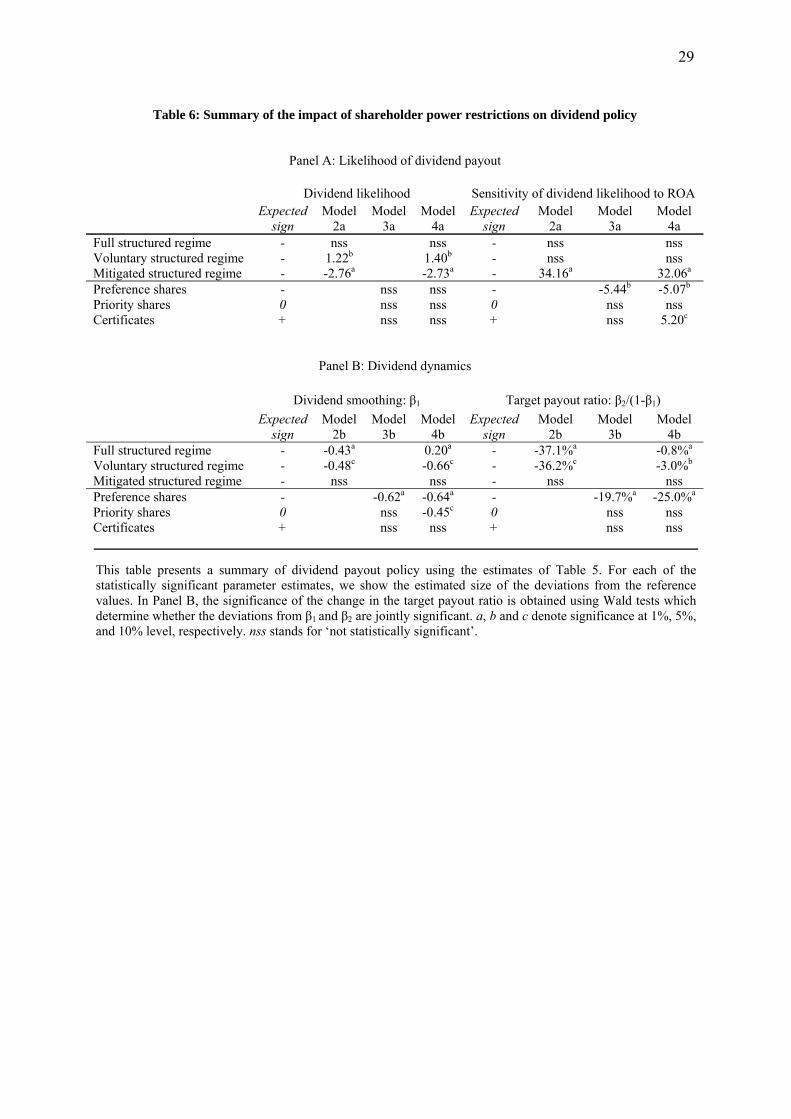
The impact of shareholder power restrictions on dividend behavior is illustrated by Models 2 to 4 in the two panels of Table 5. The economic effects and how they correspond to the conjectures formulated in Section 2.2.1 are then summarized in Table 6. In Panel A of Table 5, Model 2a shows how each form of the structured regime affects the likelihood of a dividend payout. Contrary to our prior conjecture, the imposition of the full structured regime does not significantly reduce the propensity of firms to pay dividends. Furthermore, the large, internationally diversified firms that voluntarily retain the regime are actually more likely to opt for a dividend payout. These results suggest that firms under the full and voluntary forms of the structured regime avoid expropriating shareholders entirely. This corresponds to Bulow and Rogoff’s (1989) argument that firms moderate expropriation if there is sufficient uncertainty about their future cash flows such that the option to access capital markets is always valuable. It is likely that this option is more valuable for the multinationals under the voluntary regime, because they tend to be more exposed to international capital markets. Also, these firms have relatively more dispersed ownership structures, which implies, in the spirit of Goergen, Renneboog, and Correira da Silva (2005), that they should be more inclined to uphold dividend payments.
(Insert Table 6 about here)
14
The payout propensity of firms under the mitigated structured regime exhibits different patterns that are consistent with tight control by the foreign majority owner. We confirm that these firms are less likely to pay dividends, but their payout likelihood is tied particularly strongly to profitability (the interaction term is significant at the 1% level). This suggests that the controlling shareholder rem
t the 10% level in Model 4a which controls for both the anti-shareholder devices and each rm of the structured regime. And thirdly, priority shares have no discernible impact on payout
ificant. That dividend po
icant. This suggests that tight control by the foreign ma
ains sufficiently strong to enforce payout policies that optimally balance free cash flow problems and underinvestment risk.
Model 3a shows how payout likelihood is affected by the use of preference shares, priority shares and certificates. Interestingly, none of these anti-shareholder devices reduce the propensity of firms to pay dividends. This again suggests that the need for capital market access deters firms from stopping dividend payments completely. Still, the various securities do affect the extent to which payout likelihood is driven by profitability. To that end, each of our prior conjectures is confirmed. Firstly, the payout propensity of firms using preference shares declines rather than increases in ROA, which seems to be symptomatic of agency problems. Secondly, there is some indication that firms using certificates are more likely to pay dividends at higher levels of profitability. In Model 3a, the coefficient on the interaction of the certificate dummy and ROA is insignificant. However, it becomes significant afolikelihood. 4.2.2 The dynamics of dividend payout
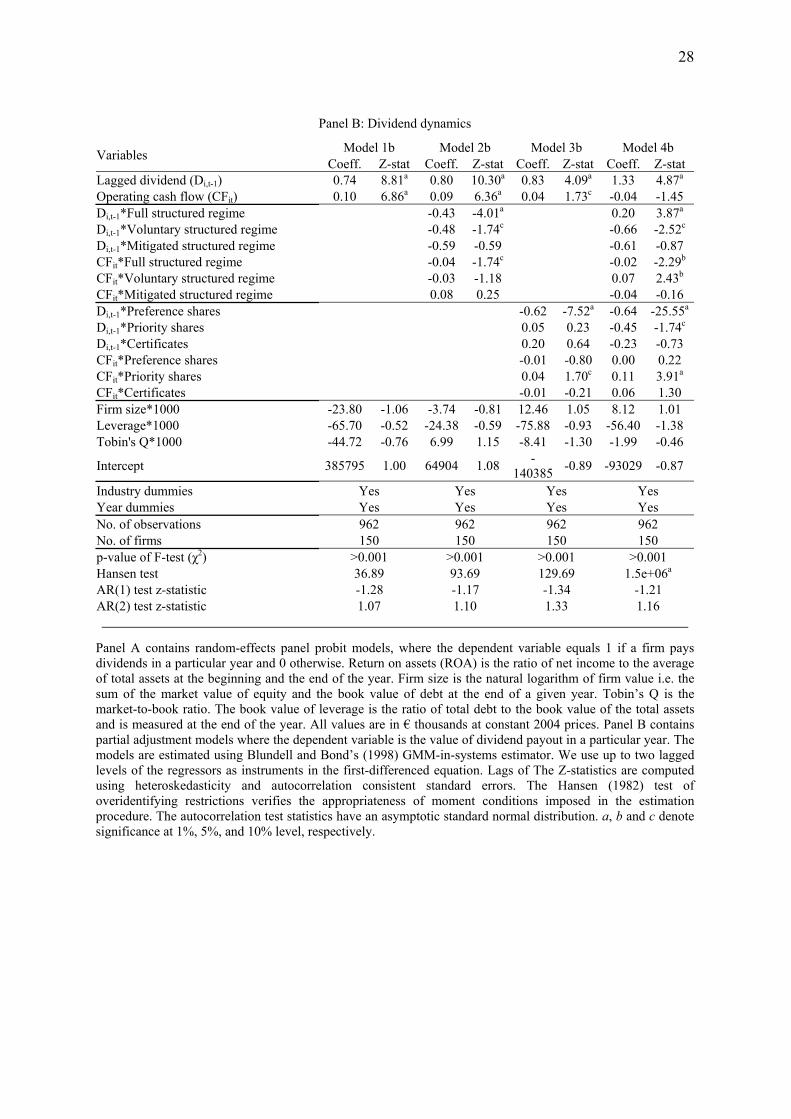
How the actual dynamics of dividend payout are affected by shareholder power restrictions is shown in Panel B of Tables 5 and 6. Model 2b first illustrates the impact of each form of the structured regime. Our prior conjectures are confirmed for firms under the full and voluntary forms of the regime. Firstly, these firms smooth their dividend payouts to a lesser extent. When the structured regime is not imposed, the smoothing coefficient on Di,t-1 is β1=0.80. Under the full and voluntary forms of the regime, this smoothing coefficient is reduced by 0.43 and 0.48, respectively. Secondly, the full and voluntary forms of the regime decrease the target payout ratio, τi= 45.0% in firms not under the regime, by 37.1% and 36.2%, respectively. When the full regime is imposed, this decrease is driven by a reduction in both the smoothing coefficient β1 and the impact coefficient β2; under the voluntary regime, the change in the impact coefficient is negative but insign
licy is overall different under the full and voluntary regimes, is confirmed by the Wald statistics on the joint significance of the changes in the smoothing and impact coefficients.
That the structured regime instigates a reduction in the target payout ratio and the extent of dividend smoothing is not confirmed statistically for the mitigated form. Model 2b shows that when the mitigated regime is imposed, the smoothing coefficient is lower by 0.59 and the target payout ratio by 23.5%, but the reductions are insignif
jority owner mitigates the exacerbation of agency problems induced by the expropriation of shareholder rights under the structured regime.
The impact of the anti-shareholder devices on dividend dynamics is illustrated by Model 3b in Tables 5 and 6. As predicted, the use of preference shares reduces the smoothing coefficient by a substantial 0.62 and the target payout ratio by 19.7%. Certificates and priority shares do not induce a significant change in dividend behavior overall, as indicated by the Wald tests, but the change in the
15
target payout ratio appears to be negative for certificates and positive for priority shares. That firms using certificates do not pay higher dividends, or indeed smooth dividends more, shows that the certificate holders deprived of their voting rights are not paid higher compensation. In the case of priority shares, the insignificant positive change in the target payout is driven by a significant increase in
, also persist. The only qualitative difference with Model 3b is that riority shares now also reduce the smoothing coefficient, but their impact on the target payout
s where agency problems are potentially the worst. Therefore, it seems that ma
the impact coefficient. This result coincides with our prior conjecture that these devices do not intensify free cash flow concerns.
The final Model 4b in Tables 5 and 6 shows that the relaxed dividend policy of firms under the full and voluntary structured regimes is actually driven by their strong preference for anti-shareholder devices. It is critical that of the firms under each regime, preferences shares are used by 83% and 75%, respectively, and the same firms are also more likely to issue certificates. When we control for these devices in Model 4b, the results still suggest that dividend policy is changed under the full and voluntary regimes, but the reduction in the target payout ratio declines to just 0.8% and 3.0%, respectively. 11 Also, we now find that the source of the change in dividend behavior is different in the two regimes. Under the full regime, the impact coefficient is reduced, moving the target payout ratio downwards. However, the smoothing coefficient is actually higher, thus all else equal, these firms smooth dividends relatively more. For firms which retain the regime voluntarily, we find the opposite results: the impact coefficient is now higher but the smoothing coefficient remains reduced. It is difficult to fully motivate these findings; we would expect that the Dutch multinationals under the voluntary regime would smooth dividends relatively more because of their greater reliance on global capital markets. Still, from the perspective of minority shareholders it is irrelevant whether the full and voluntary regimes change dividend behavior by themselves, or through the greater occurrence of the anti-shareholder devices. In Model 4b, the imposition of the mitigated structured regime still has no impact on dividend policy. The effects of the various anti-shareholder devices, and of preference shares in particularpremains insignificantly positive. 4.3 Payout policy and the allocation of share ownership
For Germany, Goergen, Renneboog, and Correira da Silva (2005) contend that in the presence of a strong shareholder, there is no need for dividends to constitute an additional control device. In the Netherlands, however, high payouts may still be necessary, exactly because two thirds of publicly listed firms fall under the structured regime and an additional 11% use two or more anti-shareholder devices. Still, the above sections have shown that dividend payouts tend to be low, and are even reduced in those firm
ny Dutch firms relax their dividend behavior voluntarily rather than because powerful shareholders allow them to do so.
In light of these conditions, it is important to see whether specific ownership and control structures still affect dividend behavior in the way that earlier studies document. For example, we have found no evidence that the argument of Goergen, Renneboog, and Correira da Silva (2005) would hold for firms under the mitigated structured regime. That the foreign majority owner tries to enforce an
11 The correlations between each form of the structured regime and the use of the anti-shareholder devices are low (in each case, they do not exceed 0.2) such that they do not induce multicollinearity in the model.
16
optimal payout policy is supported by the fact that payout probability is tied particularly closely to profitability in these firms. However, it is remarkable that the same firms neither pay lower dividends nor smooth dividends to a lesser extent. This suggests that firms without such a dominant shareholder ha
gest hareholders makes less sense. Table 4 showed that in the Netherlands, the Banzhaf index of the
other shareholders with close to no influence.
t of wnership concentration in the hands of the two largest shareholders. The two regressions are
constructed identically, except onl wer restrictions.
insignificant in each case. Thus, there is no conclusive evidence that the pa
relaxed also increases in the equity share of the second largest shareholder. Here, there is an
ve already relaxed their dividend behavior, such that allowing payouts to be relaxed further would not be optimal.
In the spirit of the conjectures formulated in Section 2.2.2, the two aspects of ownership and control structures we investigate are (i) ownership concentration in the hands of the two largest shareholders and (ii) the influence of specific shareholder classes. In the first case, shareholder influence is measured simply by the percentage of ownership. In the second, we use two alternative measures: the percentage of ownership and the Banzhaf power indices described in Section 3.2. It may be that the two measures give different results. The Banzhaf indices assume active policy seeking, but they do not account for the fact that concentrated outside shareholders may be more motivated to exert influence. This is likely to be an important consideration in the Netherlands where shareholder participation is generally low. Using ownership concentration to measure shareholder influence should control for this, assuming that the greater the equity share of the shareholders, the greater their incentives to enter into policy seeking. It will be interesting to see how the two measures compare when insider ownership by executive directors and supervisory board members is considered. Using the Banzhaf indices to quantify the relative influence of the two larslargest shareholder is almost always unity, leaving 4.3.1 The impact of ownership concentration
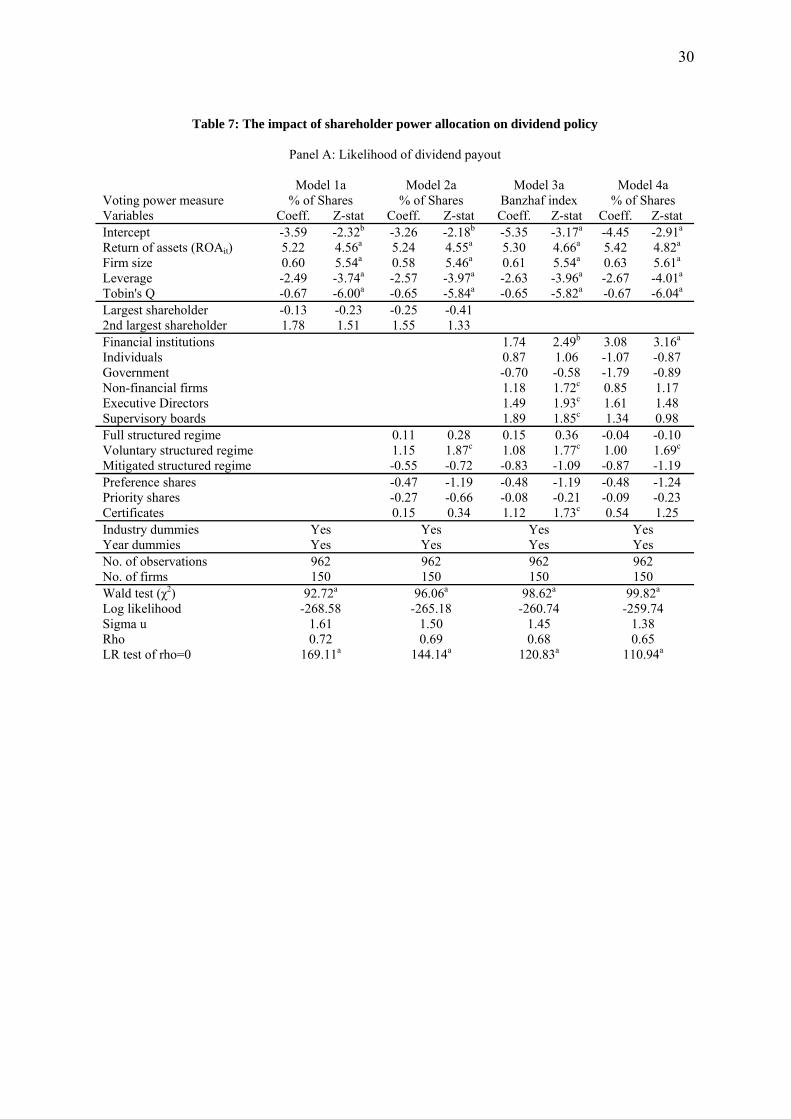
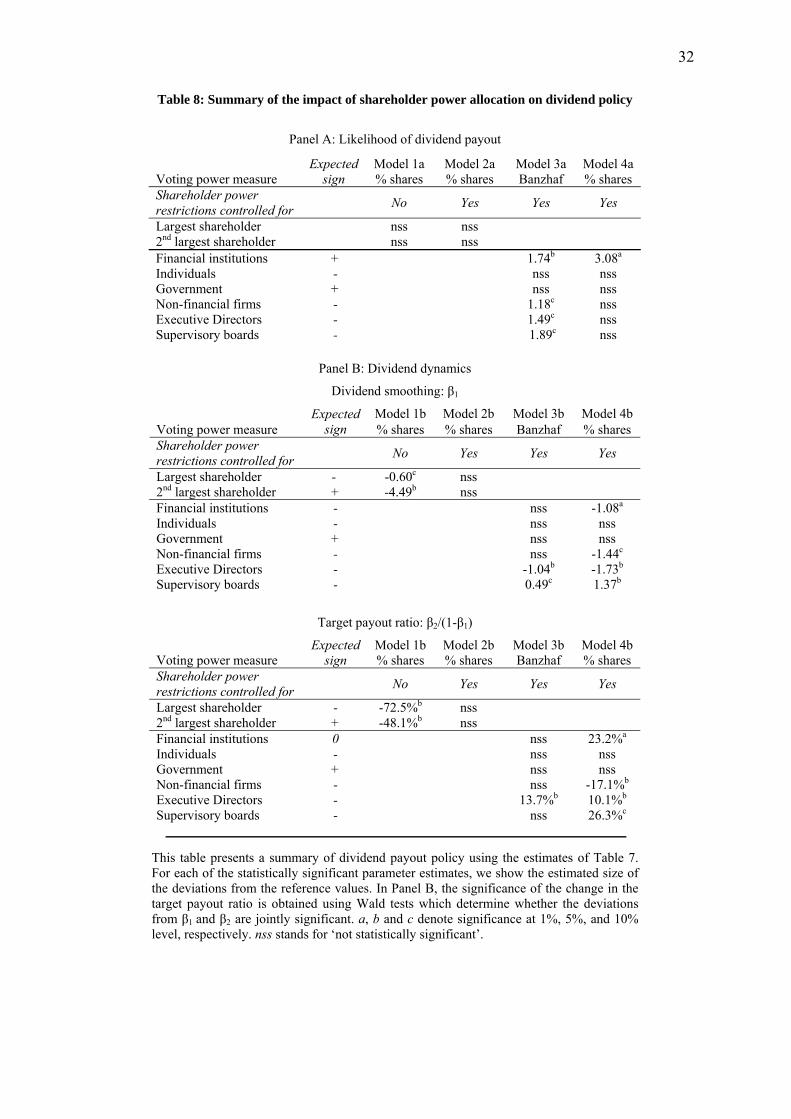
The impact of ownership and control structures on dividend policy is illustrated in Table 7 and summarized in Table 8. As before, Panels A and B consider the likelihood of a dividend payout and the actual dividend dynamics, respectively. In both panels, the first two models show the effeco
y the second model controls for shareholder po
(Insert Tables 7 and 8 about here)
A first important finding is that ownership concentration does not have a statistically significant impact on payout likelihood. In both Models 1a and 2a of Panel A, the coefficients have the predicted sign, but the z-statistics are
yout likelihood decreases in the equity share of the largest and increases in the equity share of the second largest shareholder.
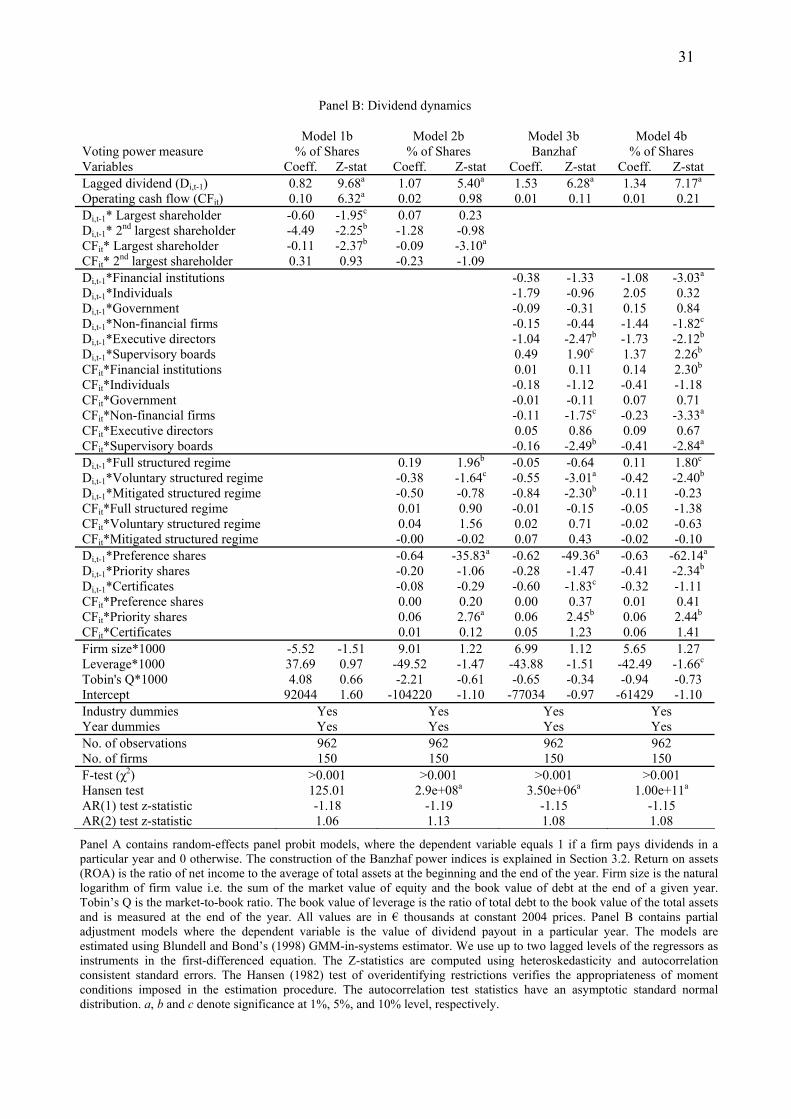
In Panel B on dividend dynamics, Models 1b and 2b produce strikingly different results. In Model 1b, both the smoothing and impact coefficients decrease in the equity share of the largest shareholder, and the coefficient changes are jointly significant at the 5% level. This suggests that both dividend smoothing and the target payout ratio are reduced when a concentrated shareholder exerts control, much in the same way that has been reported for Germany by Gugler and Yurtoglu (2003) and for the UK by Renneboog and Trojanowski (2006). Unexpectedly, the extent to which dividend behavior is
17
insignificant increase in the impact coefficient. However, both the smoothing coefficient and the target payout are reduced, and the changes in the impact and smoothing coefficients are jointly sig
preference shares, and to a lesser extent by the full and voluntary fo
t largest shareholder, because the second largest shareholder annot force higher dividend payouts.
nificant. It is remarkable that when we control for shareholder power restrictions in Model 2b, the effect of
ownership concentration on dividend dynamics virtually disappears. The equity share of the largest shareholder remains negatively related to the impact coefficient. However, there is now an insignificant increase in the smoothing coefficient, and the implied change in the target payout is insignificantly positive. The equity share of the second largest shareholder has an insignificant negative effect on both the smoothing and impact coefficients, and also fails to induce a statistically significant impact on dividend behavior. Meanwhile, the model confirms that dividend policy is strongly affected by the use of
rms of the structured regime. To summarize, these findings have very important economic implications. It seems that in the
Netherlands, dividend behavior is actually relaxed when shareholder power restrictions (and preference shares in particular) are put in place, rather than when large shareholders exert control. In other words, there is no evidence that dominant shareholders would deliberately allow firms to relax their payout levels to avoid liquidity constraints12. It is possible that this result can also be extended to other stakeholder-oriented governance systems. Existing studies have often concluded that in these regimes, dividends are low and flexible because large shareholders already mitigate free cash flow concerns. However, such payout patterns may simply be symptomatic of the use of anti-shareholder devices which ensure that the interests of other stakeholders are prioritized over the maximization of shareholder value. It is also unlikely that minority shareholders can prevent expropriation either by the other stakeholders or the incumbenc 4.3.2 The impact of the identity of large shareholders
We now examine whether the identity of the large shareholders still affects dividend behavior when shareholder power restrictions are controlled for. The results are shown by the third and fourth models in the two panels of Tables 7 and 8. It is useful to recall our prior conjectures based on Gugler (2003), Goergen, Renneboog, and Correira da Silva (2005) and Renneboog and Trojanowski (2006). Each of these studies finds that the slack afforded to firms in their dividend policy increases in the expected ‘ranking’ of the various shareholder types in terms of their ability to mitigate agency problems. Accordingly, we expect that dividends are (i) most flexible when strong institutional or individual investors are present, and when insiders hold equity blocks; and (ii) least flexible when the firm is government-held. The same ranking should also be reflected in the target payout ratios, whereby more
12 It is possible that large shareholders influence dividend behavior indirectly, by controlling the use of anti-shareholder devices. However, we only find a mild negative correlation between the equity share of the largest shareholder and the use of preference and priority shares (-0.12 and -0.17, respectively). Thus, the results in Section 3.3 are not unlikely to be driven by multicollinearity. The correlation matrix is available upon request.
18
ef
effort also appears to be largely vo
financial firms do not seem to exert much influence over the payout likelihood, though the co
coefficient changes are also jointly insignificant in each case. This co
versus stakeholder interests. Alternatively, the fu
ficient monitors allow lower payouts, though institutional investors probably dislike too low dividends.
Panels A in Tables 7 and 8 first demonstrate whether such considerations have an impact on the probability of a dividend payout. The results in Models 3a and 4a, which proxy shareholder influence using the Banzhaf indices and the percentage of ownership, respectively, can be summarized as follows. In both regressions, the payout probability strongly increases in the influence of coalitions by financial institutions. Thus, it seems that Dutch firms do try to satisfy the relative preference of institutional investors for continuous dividend payments. This
luntary, because the Banzhaf indices include those cases where the institutional investors could exercise influence, but may not have enough incentives to do so.
The remaining results show little support to our other conjectures, and in fact the coefficients tend not to have the predicted signs. Surprisingly, government-controlled firms appear to be the least likely to pay dividends, though the z-statistics are insignificant in both models. Conversely, the payout likelihood increases when managers and supervisory board members hold effective control (Model 3a), but this is not a function of the size of their equity stakes (Model 4a). Individual investors and non-
efficient on the Banzhaf index of non-financial firms is positive and weakly significant in Model 3a.
The partial adjustment models in Panels B of Tables 7 and 8 deliver some remarkable results. Model 3b constructed with the Banzhaf indices indicates that none of the outside shareholder coalitions exert influence over dividend policy. The changes in the smoothing and impact coefficients are all insignificant, except the impact coefficient is weakly reduced under the influence of non-financial firms. In Table 8, the
nfirms that the equity share of outside shareholders must be sufficiently high to induce them to enter into active policy seeking.
Conversely, when shareholder control is held by insiders, their ownership needs not be highly concentrated to affect dividend behavior. When executive directors form a controlling coalition of shareholders, there is a strong reduction in the smoothing coefficient and an insignificant increase in the impact coefficient. In Table 8, the coefficient changes are jointly significant at the 5% level, confirming that dividend behavior is changed under managerial control. What is surprising, however, is that we observe a strong increase, rather than a decrease, in the target payout ratio: relative to widely-held firms, the target payout of firms under managerial control (with the corresponding Banzhaf indices equal to unity) is 13.7% higher. When the strongest shareholders are supervisory board members, the results again imply a positive change in the target payout, but the coefficient changes are jointly insignificant. Also, we now find a significant increase in the smoothing coefficient and a significant decrease in the impact coefficient. That dividend smoothing increases under control by supervisory board members may be symptomatic of managerial agency problems. It is possible that the monitoring efficiency of the board is crippled by collision between owner and non-owner members over the prioritization of shareholder
nctioning of the board is unaffected, but the firm now pays systematic payouts due to pressure from owner members trying to avoid being expropriated.
Model 4b of Tables 7 and 8 illustrates how dividend behavior is affected when the equity share of each shareholder coalition increases. For insider shareholders, the results of Model 3b are fully
19
confirmed. In fact, when supervisory board members acquire larger stakes, the changes in the smoothing and impact coefficients become stronger and jointly significant. Thus, it appears that when bo
levels further in the
is suggests that dividend ehavior in the Netherlands does not necessarily reflect the ranking of the controlling shareholders in
s and informational asymmetries.
. To the extent that each should be
the adjustment of
ard members become concentrated owners, they instigate the firm to both pay higher dividends and smooth dividends more.
Of the outside shareholders, two types emerge as exerting control over dividend policy. The greater the equity stake of institutional investors, the lower the smoothing coefficient and the higher the impact coefficient, and the changes in the two are jointly significant at the 1% level. Importantly, Table 8 shows a strong overall increase in the implied target payout: at the median level of institutional ownership, the target payout is higher by 23.2% relative to widely-held firms. This result is likely to reflect the relative preference of institutional investors for dividends. It is also notable that the dividend policy changes induced by institutional and managerial ownership are very similar, in that dividend smoothing is reduced to avoid liquidity constraints, but otherwise greater pressure is placed on the firm to pay out cash. This finding fits in nicely with our earlier result that in the Netherlands, concentrated shareholders tend not to allow firms to relax their payout
way that existing studies predict. In fact, it appears that dividends and shareholder control are often complementary rather than substitute devices in containing free cash flow.
Interestingly, the shareholders that do allow lower target payouts are non-financial firms. In Model 4b, both the smoothing and impact coefficients decrease in the equity share of non-financial firms. The changes in the coefficients are jointly significant, and imply a 17.1% reduction in the target payout ratio at the median equity stake. It is somewhat surprising that both the extent of dividend smoothing and the target payout are virtually unchanged when ownership is concentrated in the hands of individual investors and the government. Gugler (2003) finds that in Austria, these two shareholder types induce the two most extreme changes in dividend patterns. Overall, thbhow they mitigate managerial agency cost 4.4 Robustness checks and extensions
In order to corroborate the results contained in Tables 5 to 8, we perform a number of robustness checks. Alternative measures of profitability, size and financial risk have the same impact (or the lack thereof) on dividend behavior as the original control variables, and leave the impact of shareholder power restrictions and ownership unaffected. For example, our core results are the same when we replace (i) return on assets with return on equity, (ii) the market value of assets with the book value of assets or market capitalization, and (iii) the book value of leverage with the market value of leverage or interest coverage. It is important to emphasize that none of these variables show a robust statistical relationship with dividend dynamics in the partial adjustment models
indicative of the level of agency problems in the firm, this confirms that dividends play a very limited role in mitigating free cash flow concerns in the Netherlands.
To check for the robustness of the partial adjustment model itself, Renneboog and Trojanowski (2006) propose various alternative specifications. The authors closely investigate full adjustment models (Short, Zhang, and Keasey, 2002) and Waud models (1966), as well as allow
dividends to earnings changes to be asymmetric (Gugler and Yurtoglu, 2003). In all these papers as well as in our analysis, none of these specifications yield materially different results.
20
We also try alternative specifications of shareholder control in the regressions shown in Table 7. The only interesting results are obtained when we replace the ownership percentages in Model 4b with dummy variables that equal 1 if a shareholder has a blocking minority of at least 25%, and 0 otherwise. By using these dummies, we make the implicit assumption that shareholders with a blocking minority already have sufficient incentives to enter into active policy seeking. The new results confirm our previous observations on how institutional and insider ownership affects dividend behavior. However, we now find no statistical evidence that firms controlled by other non-financial firms would either have lower target payouts or smooth dividends to a lesser extent. Also, the results now show that government-controlled firms do smooth dividends more, as has been observed by Gugler (2003) for Austria. Moreover, they actually have lower target payouts than do both widely-held firms and those controlled by other shareholders. These results lend further support to our earlier co
reater non-op
nclusion that in the Netherlands, dividends often complement rather than substitute the ability of shareholders to contain agency problems.
We finally examine whether our results on payout behavior persist when we also account for share repurchases in addition to dividends. It is possible that Dutch firms trying to avoid permanent cash flow commitments simply prefer to reimburse shareholders by repurchasing shares. However, La Porta et al. (2000) find that share repurchases are least common precisely in the stakeholder-oriented governance regimes where firms already pay low dividends. Indeed, we find no evidence that Dutch firms would compensate shareholders by stepping up repurchases. We gather data on share repurchases from the SDC and Amadeus databases, the Dutch financial dailies, and published annual reports. Of the 962 firm years, only in 54 were shares repurchased, for an average €185.4 million. Once combining these transactions with dividends in our payout models, our original results remain. It is particularly interesting that the dynamics of total payout continue to show no robust relationship with net income, firm size, leverage and Tobin’s Q. There is also little indication that Dutch firms switch smoothly between dividends and share repurchases depending on their capacity to make cash flow commitments. Random-effects tobit models13 reveal that relative to dividend payers, repurchasers are less profitable. However, there is no evidence that they would have g
erating or more volatile operating cash flows (Jagannathan, Stephens, and Weisbach, 2000), or that they would be smaller, less levered or have a higher Tobin’s Q (Fama and French, 2001).
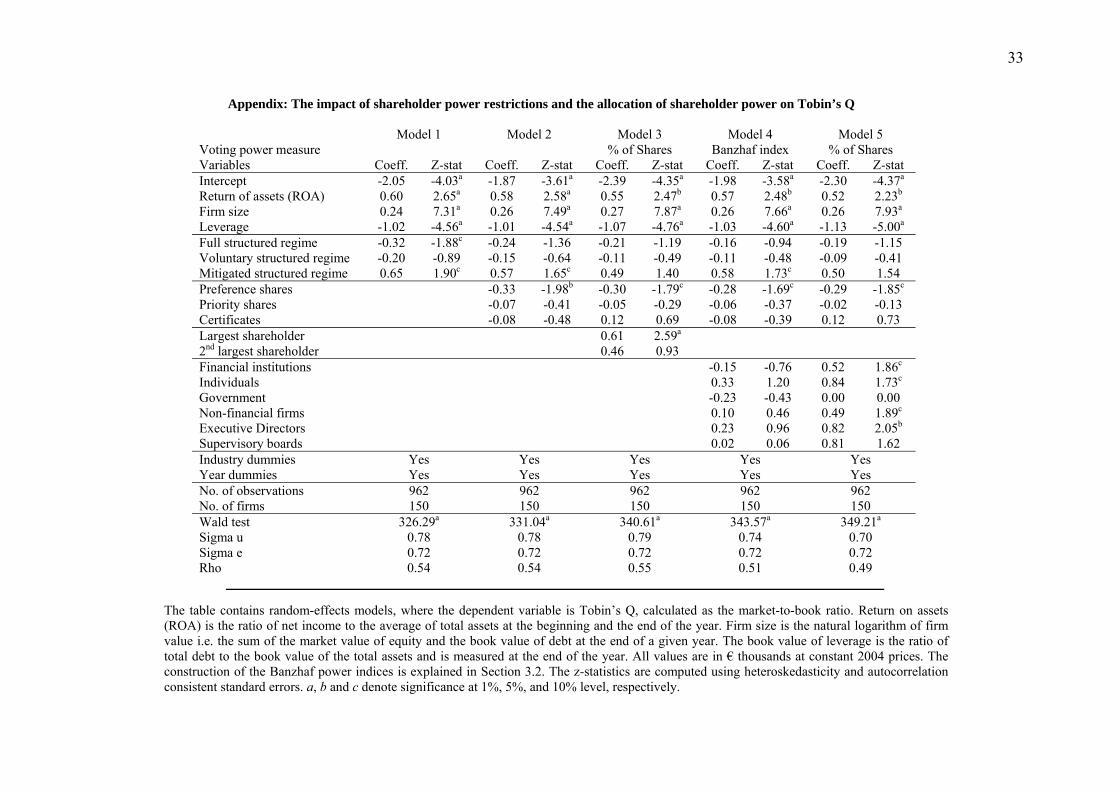
Throughout this paper, we have made some strong statements on the level of agency problems in firms based on their dividend behavior. To verify these, it is important to see whether the share prices of the same firms also reflect these agency concerns. The Appendix demonstrates how Tobin’s Q is affected by shareholder power restrictions and ownership and control structures in a random-effects framework. The results provide a welcome extension to our earlier observations and can be summarized as follows. Of the various forms of the structured regime, Tobin’s Q is reduced under the full form, unchanged under the voluntary form and increased under the mitigated form. That the voluntary regime does not reduce Tobin’s Q suggests that the reliance of Dutch multinationals on international capital markets increases their incentives for better governance. We also confirm that the structured regime does not affect firm valuation per se; the valuation effects of the full and mitigated
13 We use double-censored random-effects tobit models to examine the relative popularity of dividends and share repurchases. In these models, the dependent variable is the ratio of share repurchases to total payout, but their configuration is otherwise identical to that of the random-effects probit models. The results of the tobit models are available on request.
21
regimes disappear when we control for anti-shareholder devices and the concentration of ownership, respectively. Of the anti-shareholder devices, only preference shares lead to reduced firm valuation, co
that Gugler (2003) an
stakes may indeed be prevented from stepping up the aximization of shareholder value, if non-owner members collide with them over the prioritization of
lder interests.
er here is whether or not firms are still wi
ntrary to the results reported by De Jong et al. (2005). Our findings fit in nicely with the fact that only these instruments relax the incentives of firms to pay and smooth dividends.
The valuation effects of ownership and control structures are broadly consistent with our earlier observations. Tobin’s Q increases in the equity share of the largest shareholder but not in the equity share of the second largest shareholder. This implies that minority investors in the Netherlands are often too weak to prevent expropriation by the incumbent shareholder. Also, it appears that concentrated shareholders do have better monitoring incentives. Having observed that the target payout does not decrease in the equity share of the largest shareholder in the way
d Renneboog and Trojanowski (2006) find, this confirms that strong shareholders in the Netherlands simply avoid allowing firms to relax their dividend payouts further.
Finally, we find that some shareholders are indeed more efficient monitors than others. The ranking of the outside shareholders in the extent that Tobin’s Q is affected by the size of their equity stake is (i) individual investors, (ii) financial institutions, (iii) non-financial firms and (iv) the government. This fully matches Gugler’s (2003) ordering of shareholders in terms of their ability to mitigate agency problems and informational asymmetries. Of insider shareholders, only ownership by executive directors induces a statistically significant increase in firm valuation. This suggests that supervisory board members with equitymshareholder versus stakeho
5 Conclusion
This paper has investigated whether dividend behavior is affected by shareholder power restrictions, and whether accounting for these challenges conventional wisdom on the substitutability of dividends and shareholder control in mitigating free cash flow concerns. The corporate landscape of the Netherlands is a natural choice for the investigation of these issues, because most publicly listed firms impose severe limitations on shareholder control. In fact, many large Dutch firms are legally obliged to strip shareholders from most of their power by adopting an institutional form called the structured regime. The use of anti-shareholder devices such as preference shares, priority shares and certificates is also very common. The adoption of the structured regime only increases the occurrence of these, thereby inflicting cumulative restrictions on shareholder control. Under this system where the rights of the shareholders are largely confiscated, high dividend payouts may be a necessary monitoring device to curb potential agency costs. The question we answ
lling to pay high dividends under these conditions, and if not, whether and how shareholders exert control depending on their monitoring skills and incentives.
The analysis presented here shows some interesting patterns in Dutch dividend behavior. Firms pay low and moderately smoothed dividends, and formulate their dividend decisions based on operating cash flows rather than after-tax earnings. Also, dividend dynamics show no statistical relationship with the severity of agency problems, as proxied by firm size, leverage, and investment opportunities. Overall, this suggests that Dutch firms interpret dividend policy very flexibly, and do
22
not use it to mitigate free cash flow concerns. We argue that this is due to the fact that shareholders are often too weak to enforce optimal payout policies. Firms that must adopt the structured regime and those that voluntarily retain it pay lower dividends and smooth dividends to a lesser extent. Firms which only have to adopt a mitigated form of the regime because they are majority-owned by a foreign shareholder, show signs of being tightly monitored and do not change their target payout. Of the
t could be that accounting for shareholder power restrictions would change some of the co
se have little claim ver residual cash flows. A large shareholder with strong monitoring skills and incentives may want
r payouts, rather than allow lower ones, to avoid being expropriated.
Alfor ormativeness of Accounting
Ali, A 0, "Country-Specific Factors Related to Financial Reporting and the Value
Allen d I. Welch, 2000, "A Theory of Dividends Based on Tax Clienteles," Journal of
Amih ermany," Journal of
ta: Monte Carlo Evidence and an
Bake . Wurgler, 2004, "A Catering Theory of Dividends," Journal of Finance, 59, 1125-1165.
Blund Panel Data
Bond eux, 1996, "Taxes and Company Dividends: A Microeconometric Investigation Exploiting Cross-Section Variation in Taxes," Economic Journal, 106, 320-333.
anti-shareholder devices, only preference shares relax dividend behavior. This is a major issue, however, because more than two thirds of Dutch firms use these securities.
In light of these conditions, it is not surprising that concentrated shareholders tend not to allow firms to relax their dividend policy further. We find no evidence that dividends and shareholder control would be substitute mechanisms in containing free cash flow in the way that existing studies show. Rather, it often seems that dividends complement rather than substitute the efforts of strong shareholders to alleviate agency concerns. Importantly, this finding is unlikely to be specific to the Netherlands, and could thus be extended to other stakeholder-oriented governance regimes. In other words, i
nclusions drawn by existing studies on how ownership and control structures affect dividend policy.
Overall, the argument that dividend payouts are low in stakeholder-oriented governance systems because of concentrated ownership structures is clearly incomplete. We have provided compelling evidence that at least in the Netherlands, dividend behavior is relaxed when shareholder power restrictions are put in place, rather than when concentrated shareholders exert control. To that end, low dividend payouts may simply be symptomatic of the stakeholder orientation of the Dutch governance model. It is not unreasonable to assume that many Dutch firms restrict shareholder rights to allow management to prioritize the interests of other stakeholders. Then, shareholders are treated much like perpetual creditors, where they are offered regular dividends but otherwioto force highe References
d, A., J. Jones, R. Leftwich, and M. Zmijewski, 1993, "The Relative InfDisclosures in Different Countries," Journal of Accounting Research, 31, 183-223. ., and L.-S. Hwang, 200
Relevance of Accounting Data," Journal of Accounting Research, 38, 1-21. , F., A. E. Bernardo, anFinance, 55, 2499-2536. ud, Y., and M. Murgia, 1997, "Dividends, Taxes, and Signaling: Evidence from GFinance, 52, 397-408.
Arellano, M., and S. R. Bond, 1991, "Some Tests of Specification for Panel DaApplication to Employment Equations," Review of Economic Studies, 58, 277-297.
r, M., and JBaltagi, B. H., 2001, Econometric Analysis of Panel Data, Wiley, Chichester. Banzhaf, J. F., 1965, "Weighted Voting Doesn't Work: A Mathematical Analysis," Rutgers Law Review, 19,
317-343. Black, F., 1996, "The Dividend Puzzle," Journal of Portfolio Management, 2, 8-12.
ell, R., and S. R. Bond, 1998, "Initial Conditions and Moment Restrictions in Dynamic Models," Journal of Econometrics, 87, 115-143. , S. R., L. Chennells, and M. P. Dever
23
Brav, A., J. R. Graham, C. R. Harvey, and R. Michaely, 2005, "Payout Policy in the 21st Century," Journal of Financial Economics, 77, 483-527.
Cuijp oers, and E. Peek, 2005, "Firm-Level Reporting Incentives and Accounting Properties: cht
De Jo D. V. DeJong, G. Mertens, and C. E. Wasley, 2005, "The Role of Self-Regulation in Corporate
nance, 45, 1415-1431.
Journal of Financial Economics, 72, 425-456.
al Research, 4, 99-131.
2.
and Statistics, 52, 68-74.
nomics, 60, 3-43.
eltenham.
cial Economics, 60, 45-72.
Goerg orreira da Silva, 2004, "Dividend Policy of German Firms. A Dynamic
75-399.
rs," Journal of Finance, 61, 1305-1336.
anking and Finance, 27, 1297-1321.
Bulow, J., and K. Rogoff, 1989, "Sovereign Debt: Is to Forgive to Forget?," American Economic Review, 79, 43-50.
Cools, K., and C. M. van Praag, 2003, "The Value Relevance of Top Executive Departures," Discussion Paper 051/3, Tinbergen Institute.
Correira da Silva, L., M. Goergen, and L. Renneboog, 2004, Dividend Policy and Corporate Governance, Oxford University Press, Oxford.
Crespi, R., and L. Renneboog, 2003, "Corporate Monitoring by Shareholder Coalitions in the UK," Finance Working Paper 012/2003, European Corporate Governance Institute. ers, R., F. MStakeholder- Versus Shareholder-Oriented Governance Structures," working paper, MaastriUniversity. ng, A., Governance: Evidence and Implications from the Netherlands," Journal of Corporate Finance, 11, 473-503.
De Jong, A., G. Mertens, and P. Roosenboom, 2004, "Shareholders' Voting at General Meetings: Evidence from the Netherlands," working paper, Erasmus University.
DeAngelo, H., and L. DeAngelo, 1990, "Dividend Policy and Financial Distress: An Empirical Investigation of Troubled Nyse Firms," Journal of Fi
DeAngelo, H., and L. DeAngelo, 2006, "The Irrelevance of the Mm Dividend Irrelevance Theorem," Journal of Financial Economics, 79, 293-315.
DeAngelo, H., L. DeAngelo, and D. J. Skinner, 2004, "Are Dividends Disappearing? Dividend Concentration and the Consolidation of Earnings,"
Dubey, P., and L. S. Shapley, 1979, "Mathematical Properties of the Banzhaf Value," Mathematics of Operation
Easterbrook, F. H., 1984, "Two Agency-Cost Explanations of Dividends," American Economic Review, 74, 650-659.
Eckbo, B. E., and S. Verma, 1994, "Managerial Share Ownership, Voting Power, and Cash Dividend Policy," Journal of Corporate Finance, 1, 33-6
Elton, E. J., and M. J. Gruber, 1970, "Marginal Stockholder Tax Rates and the Clientele Effect," Review of Economics
Faccio, M., L. H. P. Lang, and L. Young, 2001, "Dividends and Expropriation," American Economic Review, 91, 54-78.
Fama, E. F., and H. Babiak, 1968, "Dividend Policy: An Empirical Analysis," Journal of the American Statistical Association, 63, 1132-1161.
Fama, E. F., and K. R. French, 2001, "Disappearing Dividends: Changing Firm Characteristics or Lower Propensity to Pay?," Journal of Financial Eco
Felsenthal, D. S., and M. Machover, 1998, The Measurement of Voting Power: Theory and Practice, Problems and Paradoxes, Edward Edgar, Ch
Fenn, G. W., and N. Liang, 2001, "Corporate Payout Policy and Managerial Stock Incentives," Journal of Finan
Fluck, Z., 1999, "The Dynamics of the Manager-Shareholder Conflict," Review of Financial Studies, 12, 379-404.
Franks, J., and C. Mayer, 2001, "Ownership and Control of German Corporations," Review of Financial Studies, 14, 943-977.
Fudenberg, D., and J. Tirole, 1995, "A Theory of Income and Dividend Smoothing Based on Incumbency Rents," Journal of Political Economy, 103, 75-93. en, M., L. Renneboog, and L. CPanel Data Analysis of Partial Adjustment Models," Finance Working Paper 045/2004, European Corporate Governance Institute.
Goergen, M., L. Renneboog, and L. Correira da Silva, 2005, "When Do German Firms Change Their Dividends?," Journal of Corporate Finance, 11, 3
Graham, J., and A. Kumar, 2006, "Do Dividend Clienteles Exist? Evidence on Dividend Preferences of Retail Investo
Grinstein, Y., and R. Michaely, 2005, "Institutional Holdings and Payout Policy," Journal of Finance, 60, 1389-1426.
Grossman, S. J., and O. D. Hart, 1980, "Takeover Bids, the Free-Rider Problem, and the Theory of the Corporation," Bell Journal of Economics, 11, 42-64.
Gugler, K., 2003, "Corporate Governance, Dividend Payout Policy, and the Interrelation between Dividends, R&D, and Capital Investment," Journal of B
24
Gugler, K., and B. B. Yurtoglu, 2003, "Corporate Governance and Dividend Pay-out Policy in Germany," European Economic Review, 47, 731-758.
nancial and Quantitative Analysis, 27, 247-263.
c Review, 76, 323-329.
Journal of Financial Economics, 58, 3-27.
n Effects?," Journal of Finance, 37, 429-443.
0, 367-385. rical
Myer f Corporate Borrowing," Journal of Financial Economics, 5, 147-175.
inance Working Paper 070/2005, European Corporate Governance Institute.
.
ical Science Review, 48, 787-792.
Stapltional Shareholders," in J. A. McCahery, P. Moerland, T. Raaijmakers and L. Renneboog (eds.),
aud, R. N., 1966, "Small Sample Bias Due to Misspecification in the 'Partial Adjustment' and 'Adapted Expectations' Models," Journal of American Statistical Association, 61, 1130-1152.
Hansen, L. P., 1982, "Large Sample Properties of Generalized Method of Moments Estimators," Econometrica, 50, 1029-1054.
Jagannathan, M., C. P. Stephens, and M. S. Weisbach, 2000, "Financial Flexibility and the Choice between Dividends and Stock Repurchases," Journal of Financial Economics, 57, 355-384.
Jensen, G. R., D. Solberg, and T. S. Zorn, 1992, "Simultaneous Determination of Insider Ownership, Debt, and Dividend Policies," Journal of Fi
Jensen, M. C., 1986, "Agency Costs of Free Cash Flow, Corporate Finance, and Takeovers," American Economi
Julio, B. R., and D. L. Ikenberry, 2004, "Reappearing Dividends," Journal of Applied Corporate Finance, 16, 89-100.
La Porta, R., F. Lopez-de-Silanes, A. Shleifer, and R. Vishny, 2000, "Investor Protection and Corporate Governance,"
Leech, D., 2002, "Shareholder Voting Power and Ownership Control of the Companies," Homo Oeconomicus, 19, 345-373.
Lintner, J., 1956, "Distribution of Incomes of Corporations among Dividends, Retained Earnings and Taxes," American Economic Review, 46, 97-113.
Litzenberger, R. H., and K. Ramaswamy, 1982, "The Effects of Dividends on Common Stock Prices: Tax Effects of Informatio
Marsh, T. A., and R. C. Merton, 1987, "Dividend Behavior for the Aggregate Stock Market," Journal of Business, 60, 1-40.
Miller, M. H., and F. Modigliani, 1961, "Dividend Policy, Growth, and the Valuation of Shares," Journal of Business, 34, 411-433.
Milnor, J. W., and L. S. Shapley, 1978, "Value of Large Games II: Oceanic Games," Mathematics of Operational Research, 3, 290-307.
Moh'd, M., L. G. Perry, and J. N. Rimbey, 1995, "An Investigation of the Dynamic Relationship between Agency Theory and Dividend Policy," Financial Review, 3
Morck, R., A. Shleifer, and R. W. Vishny, 1988, "Management Ownership and Market Valuation: An EmpiAnalysis," Journal of Financial Economics, 20, 293-315. s, S. C., 1977, "Determinants o
Perez-Gonzalez, F., 2002, "Large Shareholders and Dividends: Evidence from U. S. Tax Reforms," working paper, Columbia University.
Renneboog, L., and G. Trojanowski, 2005, "Patterns in Payout Policy and Payout Channel Choice of UK Firms in the 1990s," F
Renneboog, L., and G. Trojanowski, 2006, "Control Structures and Payout Policy," Managerial Finance, 21, forthcoming.
Rozeff, M. S., 1982, "Growth, Beta, and Agency Costs as Determinants of Dividend Payout Ratios," Journal of Financial Research, 5, 249-259.
Schooley, D. K., and L. D. Barney, Jr., 1994, "Using Dividend Policy and Managerial Ownership to Reduce Agency Costs," Journal of Financial Research, 17, 363-373
Shapley, L. S., and M. Shubik, 1954, "A Method for Evaluating the Distribution of Power in a Committee System," American Polit
Shleifer, A., and R. W. Vishny, 1986, "Large Shareholders and Corporate Control," Journal of Political Economy, 94, 461-488.
Short, H., H. Zhang, and K. Keasey, 2002, "The Link between Dividend Policy and Institutional Ownership," Journal of Corporate Finance, 8, 105-122.
edon, G., and J. Bates, 2002, "Unpacking the 'Interest-Holders' in a Share: Making Voting Easier for InstituCorporate Governance Regimes: Convergence and Diversity, Oxford University Press, Oxford, pp. 507-566.
W
25
Table 1: Sample characteristics
Variables N Mean Median Standard deviation
Firm value (in € thousands) 962 2,846,821 269,832 13,380,661Book value of assets (in € thousands) 962 2,041,846 274,148 7,928,569Total debt/Book value of total assets 962 0.25 0.23 0.19Tobin's Q 962 1.07 0.68 1.30Net income (in € thousands) 962 63,944 10,875 765,154Cash flow from operations (CFO, in € thousands) 962 209,016 21,635 1,011,980Return on assets (ROA) 962 3.36% 5.19% 14.54%Dividends by dividend-paying firms (in € thousands) 758 57,600 5,358 356,634 All numbers are expressed in € thousands at constant 2004 prices. The descriptive statistics on dividend payout are conditional on dividends being paid, and are thus computed for 758 firm-years. The remaining summary statistics are computed for the full sample of 962 firm-years. Firm value is defined as the sum of the market value of equity and the book value of debt at the end of a given year. Tobin’s Q is the ratio of the market value of the firm to the book value of the total assets.
Table 2: Dividend payout ratios
All firms Dividend payers only % of net income % of cash flow % of net income % of cash flow Year
Summary statistics are computed for the pooled sample of 962 firm years. All blockholdings of 5% or more are gathered. The construction of the Banzhaf power indices is explained in Section 3.2.
27
Table 5: The impact of shareholder power restrictions on dividend policy
Panel A: Likelihood of dividend payout
Model 1a Model 2a Model 3a Model 4a Variables Coeff. Z-stat Coeff. Z-stat Coeff. Z-stat Coeff. Z-stat
Industry dummies Yes Yes Yes Yes Year dummies Yes Yes Yes Yes No. of observations 962 962 962 962 No. of firms 150 150 150 150 p-value of F-test (χ2) >0.001 >0.001 >0.001 >0.001 Hansen test 36.89 93.69 129.69 1.5e+06a
AR(1) test z-statistic -1.28 -1.17 -1.34 -1.21 AR(2) test z-statistic 1.07 1.10 1.33 1.16
Panel A contains random-effects panel probit models, where the dependent variable equals 1 if a firm pays dividends in a particular year and 0 otherwise. Return on assets (ROA) is the ratio of net income to the average of total assets at the beginning and the end of the year. Firm size is the natural logarithm of firm value i.e. the sum of the market value of equity and the book value of debt at the end of a given year. Tobin’s Q is the market-to-book ratio. The book value of leverage is the ratio of total debt to the book value of the total assets and is measured at the end of the year. All values are in € thousands at constant 2004 prices. Panel B contains partial adjustment models where the dependent variable is the value of dividend payout in a particular year. The models are estimated using Blundell and Bond’s (1998) GMM-in-systems estimator. We use up to two lagged levels of the regressors as instruments in the first-differenced equation. Lags of The Z-statistics are computed using heteroskedasticity and autocorrelation consistent standard errors. The Hansen (1982) test of overidentifying restrictions verifies the appropriateness of moment conditions imposed in the estimation procedure. The autocorrelation test statistics have an asymptotic standard normal distribution. a, b and c denote significance at 1%, 5%, and 10% level, respectively.
29
Table 6: Summary of the impact of shareholder power restrictions on dividend policy
Panel A: Likelihood of dividend payout
Dividend likelihood Sensitivity of dividend likelihood to ROA
Priority shares 0 nss -0.45c 0 nss nss Certificates + nss nss + nss nss This table presents a summary of dividend payout policy using the estimates of Table 5. For each of the statistically significant parameter estimates, we show the estimated size of the deviations from the reference values. In Panel B, the significance of the change in the target payout ratio is obtained using Wald tests which determine whether the deviations from β1 and β2 are jointly significant. a, b and c denote significance at 1%, 5%, and 10% level, respectively. nss stands for ‘not statistically significant’.
30
Table 7: The impact of shareholder power allocation on dividend policy
Panel A: Likelihood of dividend payout
Model 1a Model 2a Model 3a Model 4a Voting power measure % of Shares % of Shares Banzhaf index % of Shares Variables Coeff. Z-stat Coeff. Z-stat Coeff. Z-stat Coeff. Z-stat Intercept -3.59 -2.32b -3.26 -2.18b -5.35 -3.17a -4.45 -2.91a
AR(1) test z-statistic -1.18 -1.19 -1.15 -1.15 AR(2) test z-statistic 1.06 1.13 1.08 1.08
Panel A contains random-effects panel probit models, where the dependent variable equals 1 if a firm pays dividends in a particular year and 0 otherwise. The construction of the Banzhaf power indices is explained in Section 3.2. Return on assets (ROA) is the ratio of net income to the average of total assets at the beginning and the end of the year. Firm size is the natural logarithm of firm value i.e. the sum of the market value of equity and the book value of debt at the end of a given year. Tobin’s Q is the market-to-book ratio. The book value of leverage is the ratio of total debt to the book value of the total assets and is measured at the end of the year. All values are in € thousands at constant 2004 prices. Panel B contains partial adjustment models where the dependent variable is the value of dividend payout in a particular year. The models are estimated using Blundell and Bond’s (1998) GMM-in-systems estimator. We use up to two lagged levels of the regressors as instruments in the first-differenced equation. The Z-statistics are computed using heteroskedasticity and autocorrelation consistent standard errors. The Hansen (1982) test of overidentifying restrictions verifies the appropriateness of moment conditions imposed in the estimation procedure. The autocorrelation test statistics have an asymptotic standard normal distribution. a, b and c denote significance at 1%, 5%, and 10% level, respectively.
32
Table 8: Summary of the impact of shareholder power allocation on dividend policy
Panel A: Likelihood of dividend payout
Model 1a Model 2a Model 3a Model 4a Voting power measure
Expected sign % shares % shares Banzhaf % shares
Shareholder power restrictions controlled for No Yes Yes Yes
Largest shareholder nss nss 2nd largest shareholder nss nss Financial institutions + 1.74b 3.08a
This table presents a summary of dividend payout policy using the estimates of Table 7. For each of the statistically significant parameter estimates, we show the estimated size of the deviations from the reference values. In Panel B, the significance of the change in the target payout ratio is obtained using Wald tests which determine whether the deviations from β1 and β2 are jointly significant. a, b and c denote significance at 1%, 5%, and 10% level, respectively. nss stands for ‘not statistically significant’.
33
Appendix: The impact of shareholder power restrictions and the allocation of shareholder power on Tobin’s Q
Model 1 Model 2 Model 3 Model 4 Model 5 Voting power measure % of Shares Banzhaf index % of Shares Variables Coeff. Z-stat Coeff. Z-stat Coeff. Z-stat Coeff. Z-stat Coeff. Z-stat Intercept -2.05 -4.03a -1.87 -3.61a -2.39 -4.35a -1.98 -3.58a -2.30 -4.37a
Supervisory boards 0.02 0.06 0.81 1.62 Industry dummies Yes Yes Yes Yes Yes Year dummies Yes Yes Yes Yes Yes No. of observations 962 962 962 962 962 No. of firms 150 150 150 150 150 Wald test 326.29a 331.04a 340.61a 343.57a 349.21a
Sigma u 0.78 0.78 0.79 0.74 0.70 Sigma e 0.72 0.72 0.72 0.72 0.72 Rho 0.54 0.54 0.55 0.51 0.49
The table contains random-effects models, where the dependent variable is Tobin’s Q, calculated as the market-to-book ratio. Return on assets (ROA) is the ratio of net income to the average of total assets at the beginning and the end of the year. Firm size is the natural logarithm of firm value i.e. the sum of the market value of equity and the book value of debt at the end of a given year. The book value of leverage is the ratio of total debt to the book value of the total assets and is measured at the end of the year. All values are in € thousands at constant 2004 prices. The construction of the Banzhaf power indices is explained in Section 3.2. The z-statistics are computed using heteroskedasticity and autocorrelation consistent standard errors. a, b and c denote significance at 1%, 5%, and 10% level, respectively.