53
1891 C A L I F O R N I A I N S T I T U T E O F T E C H N O L O G Y
DIVISION OF THE HUMANITIES AND SOCIAL SCIENCES
CALIFORNIA INSTITUTE OF TECHNOLOGY
PASADENA, CALIFORNIA 91125
THE WILLINGNESS TO PAY/WILLINGNESS TO ACCEPT GAP, THE\ENDOWMENT EFFECT," SUBJECT MISCONCEPTIONS ANDEXPERIMENTAL PROCEDURES FOR ELICITING VALUATIONS
Charles R. Plott
Kathryn Zeiler
1 8 9 1
CA
LIF
OR
NIA
I
NS T IT U T E O F T
EC
HN
OL
OG
Y
SOCIAL SCIENCE WORKING PAPER 1132R
April 2002
Revised February 2003
The Willingness to Pay/Willingness to Accept Gap, the “Endowment Effect,”Subject Misconceptions and Experimental Procedures for Eliciting Valuations
Charles R. Plott Kathryn ZeilerDepartment of the Humanities and Social Sciences
California Institute of TechnologyPasadena, California 91125
February 2, 2003
ABSTRACT
We conduct experiments to explore the possibility that subject misconceptions, asopposed to a particular theory of preferences referred to as the “endowment effect,”account for reported gaps between willingness to pay (“WTP”) and willingness to accept(“WTA”). Two facts are evident in the literature. First, there is no consensus regardingthe nature or robustness of the WTA-WTP gap. Secondly, while experimenters are veryconcerned to avoid subject misconceptions, there is no consensus about their fundamentalproperties or how they might be avoided. Instead, experimenters have revealed differentconceptions of the phenomenon through different types of experimental procedures andcontrols. Such controls involve the role of anonymity, elicitation mechanisms, practice,training and binding outcome experiences applied separately or in different combinations.The resulting pattern of research leaves open the possibility that the widely differingreports of a gap between WTP and WTA could be due to an incomplete science regardingsubject misconceptions. The lack of a theory of misconceptions is replaced by what wewill call a "revealed theory" methodology in which theories implicit in experimentalprocedures found in the literature are at the heart of the new experimental design. Thus,the approach reported here reflects an attempt to simultaneously control for alldimensions of concern found in the literature. To this end our procedures modify theBecker-DeGroot-Marschak mechanism used in previous studies to elicit values. Inaddition, our procedures supplement commonly used procedures by providing extensivetraining on the elicitation mechanism before subjects provide WTP and WTA responses.Experiments were conducted using both lotteries and mugs, goods frequently used inendowment effect experiments. Using the modified procedures, we find no support forthe hypothesis that WTA is significantly greater than WTP. In addition, we find nosupport that an observed gap can be convincingly interpreted as an endowment effect andconclude that further evidence is required before convincing interpretations of anyobserved gap can be advanced.
Do not reference withoutpermission of the authors.

1
The Willingness to Pay/Willingness to Accept Gap, the “Endowment Effect,”Subject Misconceptions and Experimental Procedures for Eliciting Valuations
Charles R. Plott and Kathryn Zeiler*
February 2, 2003
1 Introduction
A subtle controversy exists in the literature. At issue is the existence and interpretation of a
possible gap between willingness to pay (“WTP”) and willingness to accept (“WTA”).1 Such a
gap is frequently reported in the literature and many broad claims are made regarding the
robustness of the gap and its implications. For example, summarizing experimental findings about
the pervasiveness of the gap in a recent survey of the WTP-WTA gap literature, Horowitz et al.
(2000) state, “Previous authors have shown that WTA is usually substantially larger than WTP, and
almost all have remarked that the WTA/WTP ratio is much higher than their economic intuition
would predict.” Furthermore, claims about the power of a particular theory to explain the gap are
appearing with increasing frequency. Specifically, the interpretation of the gap as an "endowment
effect" rests on a special theory of the psychology of preferences associated with "prospect theory."
In particular, Knetsch, Tang and Thaler (1998) conclude, “The endowment effect... has been one of
the most robust findings of the psychology of decision making –people commonly value losses
much more than commensurate gains.” Such claims regarding the nature and robustness of the gap
have seeped into other areas of research including law and economics, and specific interpretations
of the WTP-WTA gap accompany the claims. Rachlinski and Jourden (1998) begin their discussion
* Edward S. Harkness Professor of Economics and Political Science, [email protected]; Graduate Student of Lawand Economics, California Institute of Technology and University of Southern California Law School,[email protected]. The financial support of the Laboratory of Experimental Economics and Political Science isgratefully acknowledged. We thank Colin Camerer, Daniel Klerman, Robert Sherman, Eric Talley, Richard Thaler andLeeat Yariv for helpful discussions and comments. In addition, we are grateful for comments provided duringpresentations of earlier versions of this work at the University of Southern California Law School and the CaliforniaInstitute of Technology’s Experimental Economics Workshop. All errors are ours.
1 The WTP-WTA gap refers to a tendency for an individual to state an amount for which that individual is willing to“sell” an item that is greater than the amount the same individual is willing to pay to “buy” the item. Under conditionsof sufficiently smooth preferences the two magnitudes should (theoretically) be the same. An application of prospecttheory leads to an interpretation that the loss of the item (due to the sale) is more pronounced than a gain of the item(due to a purchase) thereby producing the asymmetry. This interpretation of the phenomenon is known as the“endowment effect.”
2
of the implications of the WTP-WTA gap for legal doctrine by claiming, “Researchers in
behavioral decision theory have developed a growing line of evidence that people appear to value a
good that they own much more than an identical good that they do not own.... Researchers have
used several different procedures to demonstrate the endowment effect.” The research reported
here suggests that this broad discussion found in the literature is based on an incorrect
interpretation of experimental results.
In spite of the enthusiastic interpretations of the WTP-WTA gap as a fundamental feature of
human preferences (e.g., referring to the gap as an “endowment effect”), in fact there is no
consensus about whether the literature, considered in its entirety, supports such interpretations.
While many experimenters have observed a WTA-WTP gap, others have failed to observe it. This
variation in experimental results seriously undermines the claim that the gap is a fundamental
feature of human preferences. This observation led us to conclude that the nature of the gap
requires further examination.
A particular feature of the literature that draws our attention is the consensus about a very
complex and challenging aspect of experimental procedures. Implicitly, researchers unanimously
agree that procedures should be designed to minimize or avoid "subject misconceptions." The
problem is that, like its close cousin "confusion," the concept of "misconceptions" is not
operationally defined and certainly not quantified. The concept itself is backed by no theory. Its
meaning can change from one experimental environment to another and from experimental study to
experimental study. Our approach in the face of this difficulty is to employ a “revealed theory
methodology” to infer an operational meaning revealed by the variety of procedures adopted by
experimentalists to control for subject misconceptions. Interestingly, experimenters have
implemented a wide range of procedures in an attempt to control subject misconceptions. These
procedures implicitly reflect different ideas about the form(s) that subject misconceptions might
take. Our approach is to assume that unless all controls are exercised simultaneously, the fact of
control cannot be presumed.
This observation leads to our main research question: If we design an experiment that
completely controls for subject misconceptions as implicitly defined by the literature (i.e., an
experiment that includes every procedure used in previous experiments to control for
misconceptions), will we observe a WTA-WTP gap?

3
This question led us toward a natural experiment design. First conduct experiments in which
the gap is frequently observed. If the gap is replicated we know that there is nothing special about
the subject pools or us as experimenters that might inhibit the occurrence of a gap. Secondly,
conduct experiments in which subject misconceptions are completely controlled (in the sense of the
union of procedures for control found in the literature). If the gap is observed under both
conditions, strong support for the psychological/endowment effect theory would exist. If the gap is
not observed under both conditions then there are compelling reasons to reject the psychological
interpretation of the gap. If the gap can be turned off and on by a simple set of procedures then the
gap cannot reflect an asymmetry between gains and losses, and we would conclude that the
interpretation of the gap as an endowment effect is incorrect. That is, the gap is not a consequence
of prospect theory as the use of the terminology “endowment effect” assumes.
The paper is organized as follows. Section 2 is an outline of much of the literature focusing on
the WTA-WTP gap. This discussion documents two facts. First, there is no consensus about the
nature and robustness of the gap. Second, a wide range of different and sometimes overlapping
procedures have been employed in the experiments, primarily as controls for subject
misconceptions. Such differences in procedures could account for the lack of consensus about the
nature of a gap resulting from specific procedures controlling for some facets of misconception but
failing to control for others. More importantly, if the existence of the gap is related to a concept of
subject misconceptions, and if no definition of “misconception” exists, then the approach suggested
to us is to use the union of proposed controls on the presumption that the collection provides a set
of sufficient conditions for elimination of the gap. No doubt, subject misconceptions could be a
multi-faceted and delicate issue and, without a theory about the nature or an operational definition
of “misconceptions,” our objective is to cast a large net in hope of catching it using a revealed
theory methodology.
Section 3 discusses the role of experimental procedures in the gap measurement exercise
emphasizing the impression that emerges from the review of the literature, namely that the use of
different instructions and procedures across experiments has contributed to inconsistencies in
observations. While clever mechanisms have been developed to elicit subject valuations, our
preliminary research suggests that the nature of understanding by subjects is not constant across
subjects even with the use of the same mechanism. Procedures and language can call forth beliefs

4
and behaviors that should not be part of the measurements. Our experiments were designed to
achieve greater control through the elicitation device.
Section 4 produces a replication of an experiment reported by Kahneman, Knetsch and Thaler
(1990) (“KKT”). The gap is replicated using their procedures with roughly the same magnitudes of
statistics that they report. Interestingly, KKT attempt to give an operational definition of subject
misconception (or subject misunderstanding), and our measurements compare well to theirs. This
latter fact will lead to the hypothesis that the measure employed by KKT is not reliable.
Section 5 presents the experiment design and procedures, along with results. The procedures
reflect the conjecture that the gap is related to different understandings that subjects have about the
valuation task. Considerable space is devoted to exactly how the procedures are developed and
used. In some respects these procedures represent the central contribution of this research. The
results are striking. When a demand revealing mechanism is used and subjects are provided with
(1) a detailed explanation of the mechanism and how to arrive at valuations, (2) practice using the
mechanism, (3) binding outcome experiences and (4) anonymity, we find no support for the
hypothesis that WTA is significantly greater than WTP. A second experiment was performed
which was identical to the first except subjects were not provided binding outcome experiences.
The results reveal no significant gap. Section 6 offers concluding remarks.
2 Experimental Procedures and the Literature
Of particular interest for the research reported here are the experimental procedures that attempt to
control for subject misconceptions. Thus, our focus differs from that of much of the literature,
which seeks to understand the gap in terms of the commodity subjects consider (e.g., mugs, candy,
lotteries, money, etc.) or other contextual differences. Understanding the pattern of controls is
complicated by the fact there is no theory about subject misconceptions and, given the complexity
of the phenomenon, a general theory of misconceptions is unlikely ever to be developed. Yet, even
in the absence of theory, few would deny that subjects can harbor misconceptions about an
experimental task and few would deny that experiments related to preference testing and
measurement should control for them. This section outlines how we proceed in light of these facts.
In spite of the lack of theory, hints about effective controls can be found in the literature. While
the literature has focused on the variables over which choice is exercised, a concern for procedures
to control for misconceptions is clearly evident. In some cases the concern is explicitly stated and
5
in other cases it is implicit in the procedures used in the experiment. The strategy employed here is
to use a “revealed theory” methodology to examine the literature and use the variety of procedures
found there to help us identify possible dimensions of misconceptions, at least such dimensions that
are imagined by the research community. As will become evident, there is no single view and our
approach to control will, in the end, use them all to design experimental procedures.
Figure 1 provides a categorization by design features of WTA-WTP gap experiments. As the
endowment effect interpretation is our primary interest, the literature on which we focus is
essentially restricted to experiments studying the possible existence or nature of an “endowment
effect,” (i.e., the hypothesis that the gap is due to some feature of human preferences that leads one
to value an object more given one owns it) as opposed to the mere phenomenon of a WTA-WTP
gap. This literature also contains studies that focus on the possible influence of certain procedures
(e.g., experience, the good under choice, etc.). In addition, our analysis considers mainly
experiments involving some sort of incentive. Studies using purely hypothetical methodologies
were not included unless they were focused specifically on the issues examined in this paper.2
Appendix Section A1 provides a list of the experiments examined by number. 3
[INSERT FIGURE 1 HERE]
Each boxed number displayed in Figure 1 represents a particular experiment. If an experiment’s
box is shaded light gray then the experiment reported WTA as significantly greater than WTP. If an
experiment’s box is shaded darker gray then the experiment led to a rejection of the hypothesis that
WTA is significantly greater than WTP.
Dashed boxes represent experiments that measured the gap using actual number of trades
relative to predicted number of trades. Before reviewing the literature it is useful to make an
important point about statistical tests. If the goal of measuring the gap is to conclude whether WTA
is significantly higher than WTP, then a distinction should be made between direct and indirect
measurements. Specifically, the number of actual trades relative to the predicted number of trades
may not result in an accurate conclusion about how WTA relates to WTP. Franciosi et al. (1996)
2 Note that the list of experiments using hypothetical elicitation methods reported in Figure 1 is not all-inclusive.
3 In addition, the appendix provides some additional information about the specific treatment being cited: the issueunder investigation, the good used, attributes of the subject pool, endowment to buyers and the measurementinstrument.
6
provides a clear example demonstrating that this measure may not accurately determine whether a
significant gap between WTA and WTP exists in the data.
Each region of the figure specifies particular experimental design features. There are four such
features: elicitation mechanism, binding outcome experiences, practice and training. We will
explain these in turn. We placed the experiments into the figure according to their design features.
“PZ1” (elicitation using the Becker, DeGroot, Marschak (“BDM”) mechanism, training, practice,
binding outcome experiences and anonymity), “PZ2” (elicitation using the BDM mechanism,
training, practice and anonymity) and “PZ3” (replication of an experiment reported in Kahneman et
al. (1990)) correspond to the experiments reported in this paper.
Elicitation Mechanism
The columns separated by double lines indicate the mechanism used to elicit valuations for
commodities. For example, all experiments to the left of the first double line elicited valuations
using mechanisms that are not incentive compatible. As you move to the right, the mechanisms
generally become more (theoretically) demand revealing.
Non-incentive compatible mechanisms employ either no incentives or do not employ a
mechanism that is demand revealing. For example, experiment (1) provides the subjects with a
single price and asks how many would like to buy and how many would like to sell at that price.
Other incentive compatible mechanisms refer to incentive compatible mechanisms that are not
listed in the four remaining columns to the right. All mechanisms related to the experiments placed
in this column involved asking subjects to make a binding, binary choice.
Sealed Bid one price refers to a market mechanism which collects sealed bids from buyers and
sellers, used to create a supply and a demand curve. The intersection of the curves determines the
price at which goods will be exchanged and which bidders will participate in exchanges.
Double Auction Call Market refers to mechanism in which the seller and buyer each submit a
sealed bid. If the seller’s bid is higher than the buyer’s bid, the seller keeps the good and no
monetary transfer is made. If the buyer’s bid is higher than the seller’s bid, the buyer gets the good
and pays the seller the average of the two bids.
Vickery Auction refers to an nth-price sealed-bid auction, in which each potential buyer is
allowed to submit a sealed bid. The bids are then opened and the buyer with the highest bid gets the
good and pays the seller an amount equal to the nth-highest bid.

7
The Becker, Degroot, Marschak (“BDM”) mechanism pits each seller and buyer against a
random bid determined in advance by the experimenter. All sellers stating bids lower than the
random bid sell the good, but receive an amount of money equal to the random bid. All buyers
stating bids higher than the random bid buy the good, but pay an amount of money equal to the
random bid. Sellers who bid higher than the random bid and buyers who bid lower than the random
bid do not transact.
Binding Outcome Experiences
The horizontal double line separates experiments that provided binding outcome experiences from
those that did not. In the term “binding outcome experiences” two words are operative: “binding”
and “experiences.” Thus, by “binding outcome experiences” we mean that subjects received
incentives contingent on the decisions they made as experienced before the gap was measured. That
is, subjects were exposed to binding outcomes resulting from their own decisions with respect to
the elicitation mechanism prior to measurement of the gap. All experiments lying above the line
provided subjects with binding outcome experiences and those lying below measured the
endowment effect before subjects were exposed to binding outcome experiences. Those lying
directly on the line measured the gap using data aggregated across rounds. For instance, experiment
12 (Harless, 1989) measures the gap by aggregating data from 12 rounds before which subjects had
no binding outcomes experiences. Before the first round subjects had no binding outcome
experiences, but gained binding outcome experiences as they proceeded through the 12 rounds.
Experiments 15, 18, 20, 43 and 44 measured the gap in a similar fashion. Differentiating
experiments by mechanism and binding outcome experiences divides the figure into 12 regions.
Within each of these 12 regions, experiments are further categorized.4
Practice Using the Mechanism
Practice means that subjects participated in the use of the mechanism while tutoring was available
and were encouraged to ask questions. Subjects knew that the rounds were for practice and that the
purpose was to help gain an understanding of the mechanism. If an experiment lies inside any
region labeled ''Prac,'' the experiment provided subjects with practice prior to measuring the gap.
4 Because some studies pay only a small subset of the subjects or pay very little in terms of expected value,categorization can be difficult. For example, KKT randomly selected a certain number of the subjects to be paid at theend of the experiment. In other treatments, KKT randomly selected one of many rounds to be binding at the end of theexperiment. In this section, we made an effort to define precisely the categories and terminology used to place eachstudy into Figure 1.

8
Practice rounds could take place under conditions of either binding outcomes or non-binding
outcomes. If the outcomes were binding, practice rounds counted as providing binding outcome
experiences. It is possible, however, to provide binding outcome experiences without practice
rounds if questions by the subjects were not encouraged or allowed and experimenters did not have
an opportunity to observe and correct subject responses. In the experiments without binding
outcome experiences reported in the literature, none of the practice rounds was binding.
Training on the Mechanism
If an experiment lies inside any region labeled “Train,” the experiment provided subjects with
some level of training on the mechanism. Training entails explaining to the subjects the substantive
features or purposes of the mechanism and/or the potential benefits of employing a particular
strategy. While “training” indicates that the experimenter instructed subjects on some mechanics of
the elicitation mechanism used, the level of training varies substantially across experiments. For
example, in experiment 17 (Kahneman, Knetsch, Thaler, 1990) subjects simply were told, “It is in
your best interest to answer these questions truthfully.” In experiment 10 (Brookshire and Coursey,
1987) the experimenters explained in some detail the elicitation mechanism and used numerical
examples to illustrate the mechanics of the elicitation device. Our experiments, indexed as “PZ1”
and “PZ2,” provided a significant level of training, as discussed in Section 4.
Experiments located on the boundary between training and practice provided subject with both
training and practice. Those located outside the training and practice regions incorporated neither
training nor practice in the design.
Other experiment design features that can differ across experiments are not indexed by the
display in Figure 1. These features include: the good, attributes of the subject pool, bounds or
restrictions on bids, cash endowments to buyers, whether the seller is physically endowed with the
good, anonymity of decisions and the statistical method used to measure the gap. Clearly such
features can interact with unobserved variables such as subjects’ understanding, attention,
motivation, etc., but exactly how such interactions take place is unknown at this time. Certainly
such deep issues are not explored directing in this study.

9
3 The Nature of Controls for Misconceptions
Figure 1 clearly answers any question about consensus concerning the nature of the gap. There is
no consensus. Furthermore, the Figure suggests that the likelihood an experiment reports a gap
between WTP and WTA appears to be related to the procedures used in the experiment.
Experiments resulting in no significant WTP-WTA gap tend to be those that use a demand
revealing mechanism in eliciting evaluations. Of the 15 experiments eliciting valuations using a
non-incentive compatible mechanism, 10 (67%) reported a gap. On the other hand, 11 of the 22
experiments (50%) eliciting valuations using a Vickery auction or BDM mechanism reported a gap.
Although the data set is incomplete, this observation suggests that the incentive compatibility of the
elicitation mechanism could be important.
Other patterns that emerge from observing the effect of binding outcome experience, training
and practice on whether a gap between WTA and WTP was reported suggest that subjects’
understanding of the valuation task may be closely related to whether or not a gap is observed.
Thus, one understanding of the literature is that four types of variables are important for controlling
subject misconceptions and decisions.
1. Incentives. Lack of incentives can be associated with several features of arbitrary behavior.
Exactly why incentives might operate in such a manner is not well known. Presumably, incentives
focus behavior in the sense that attention, thought, and care in understanding instructions are
related to incentives. If earnings depend on subjects’ decisions, subjects probably are more likely to
give attention to instructions and decisions during experiments.
2. Understanding the Elicitation Device. Mechanisms used to elicit valuations may be
unfamiliar to subjects or, more importantly, may be so similar to mechanisms with which subjects
are familiar that subtle and important differences go unnoticed despite experimental controls. Many
designs, including the design reported in this paper, use demand revealing mechanisms such as the
BDM mechanism to elicit non-strategic valuations from subjects. This mechanism, however,
commonly is unfamiliar to subjects even though it might appear to be a common buying or selling
task. When confronted with an auction of any type, individuals may tend to operate under familiar
auction rules (i.e., highest bidder takes the good and pays the amount he offered). Therefore, even
if subjects are told it is in their best interest to bid their “true value,” misunderstanding about the
elicitation mechanism may trigger subjects to default to the strategies associated with familiar
auctions.

10
Our approach is based on a presumption that, to accurately measure preferences,
misconceptions about the preference elicitation mechanism must not be present. The presumption
is that subjects must have a good operational understanding of procedures including the available
alternatives and the mapping of alternatives to consequences. Decision theorists may find the
language used to describe procedures to be very clear because they are trained to give operational
meaning to technical language, e.g., “true value.” 5 To those not so schooled, however, the
language can be unclear. In many cases binding outcome experiences might be required to
understand the procedures and how choices map into consequences.
3. Strategic Behaviors. Activities in people’s daily lives automatically place them in situations
of strategic interaction. Strategic reactions developed to deal with those interactions might seep into
behavior exhibited in experiments in a manner that clouds gap measurement.6 For example, the use
of the word “sell” can automatically call forth a margin above the minimum that an individual
might accept in exchange for a good. Even if the word “sell” is not used, simply being in a situation
that calls for selling behavior might trigger the automatic reaction. Interpreting data that might
contain a mixing of motives layered over actual valuations can prove difficult because many
theories rest on assumptions that subjects in experiments understand their tasks and that observed
behavior is not a result of strategic behaviors evoked by instructions.
Likewise, if subjects mistakenly believe that outcomes might be manipulated by “proper”
responses they may behave according to a strategy the mechanism does not reward. For example, if
a subject is asked to provide a “selling price” that reflects the subject’s valuation for a good owned,
natural instincts might persuade the subject to announce an amount higher than the subject’s actual
valuation. In fact, given bargaining instincts of sellers to inflate asks and buyers to deflate bids,
those endowed with a good likely will ask for more than their non-strategic valuations while those
not endowed with a good likely will bid less than their non-strategic valuations. This behavior is
especially likely if subjects do not fully understand experimental procedures.
4. Anonymity. In addition, some (e.g., Posner and Fremling, 2001) hypothesize that if decisions
are not made anonymously, subjects may be concerned with how others view them. For example,
5 Consider another example. Economists might have a clear meaning of what a “preference” is but subjects may notclearly recognize this property within themselves or associate it with other words such as likes, dislikes, wants, wishes,etc.
6 For an evolutionary theory of this phenomenon, see Heifetz and Segev (2001).
11
talented and successful bargainers tend to sell high and buy low. Therefore, if a subject wishes to
be known by other subjects or the experimenter as a talented bargainer he may adjust his behavior
accordingly even if the elicitation device does not reward that type of behavior. While we attach no
particular weight to any number of ideas about how subjects may want to represent themselves, we
remove the opportunity and incentives for any such attempt.
4 KKT Replication Design and Results
This section discusses the experimental design reported in Kahneman, Knetsch and Thaler (1990),
which we attempt to replicate. The results, also reported in this section, indicate that the replication
attempt was a success. We are able to observe the same phenomena that KKT report.
4.1 KKT Replication Design
We conducted two identical sessions with undergraduates from the California Institute of
Technology. Each session consisted of two unpaid practice rounds using induced-value tokens and
one binding round using mugs bearing a Caltech logo purchased at the bookstore for approximately
$7.00 each. The sessions lasted approximately 15 minutes and subjects earned less than $10.
Payouts were not made anonymously. Subject instructions for buyers and sellers can be found in
the appendix at Section A2.
The instructions replicated those used by KKT to test for misrepresentations by subjects
(referred to as “Experiment 5” in their paper). One-half of the subjects were given mugs and
referred to as “sellers.” The remaining subjects were referred to as “buyers” and received no mugs.
Buyers were allowed to inspect the mug of the seller sitting next to them. Each subject was
assigned the same role in each of the three rounds (e.g., once a buyer, always a buyer).
All subjects used the list method (see Section A2 in the appendix for details) to reveal their
values for the mug. The BDM mechanism was used to determine which subjects would participate
in an exchange and the price at which the exchanges would occur. Buyers used their own money
and were told that credit and change were available before the start of the experiment.
4.2 KKT Replication Results
The data collected during the mug round of the replication of KKT is displayed in Table 1.
[INSERT TABLE 1 HERE]
12
The mean WTP response was $1.74 (median = $1.50) and the mean WTA response was $4.72
(median = $4.50). The hypothesis that WTA is significantly greater than WTP is supported by the
data gathered using the procedures designed by KKT. The Wilcoxon-Mann-Whitney test for large
samples7 is used to test the null hypothesis that WTP ≥ WTA against the alternative, WTA > WTP,
using the data from the replication. The test statistic results in a z value of -9.59 with a
corresponding p value of less than 0.0002; therefore, under α = 0.01, we reject the null hypothesis
that WTP ≥ WTA in favor of the alternative, WTA>WTP. This result demonstrates a successful
replication of the result obtained by KKT using the procedures reported in their study.
5 Plott/Zeiler Design and Results
This section discusses our experiments, which implement the controls for misconception that are
found in the literature. If the WTA and WTP gap is the reflection of an "endowment effect" then it
should be observed under the conditions of the experiments. As will be outlined in the statements
of results, no gap was observed.
5.1 Plott/Zeiler Fully Integrated Procedures
Three sets of data were collected. Two sessions of the experiment were conducted with law
students at the University of Southern California Law School in Los Angeles. One session was
conducted with undergraduate students at Pasadena City College in Pasadena. Each session
consisted of a detailed training session, two unpaid practice rounds, 14 paid rounds using lotteries
and 1 paid round using mugs. The sessions lasted approximately 90 minutes and subjects earned
approximately $32 on average, including a $5 show-up fee. Upon entering the room, every subject
chose a laminated card at random indicating the subject’s identification number. Each subject was
told to keep the identification number private to facilitate anonymous payouts at the end of the
experiment. Also, subjects were asked to avoid communicating with other subjects and verbally
reacting to events that occurred during the experiment.
7 The Wilcoxon-Mann-Whitney test is a nonparametric test designed to test whether two independent groups have beendrawn from the same population. If the sample size for either group exceeds ten, the test for large samples is performedaccording to the specifications of the test. See Mann and Whitney (1947), Whitney (1948), Wilcoxon (1945), andLehmann (1975) for discussions. This is one of the most powerful of the nonparametric tests. It is also appealingbecause it requires only that the two samples be independently drawn. The statistics reported in Table 4 include theWilcoxon-Mann-Whitney correction factor for ties when appropriate.

13
5.1.1 Overview
The instructions and procedures implemented in the experiments were designed explicitly to
control for the variables listed in Section 3. In particular, Figure 1 suggests that a gap is observed
less often when an incentive compatible mechanism is used to elicit valuations and training,
practice and binding outcome experiences are provided. Figure 1 also displays a void in the most
likely place to look for a setting in which the gap might not be observed. The analysis of the
literature shows that no one experiment designed to study the gap between WTA and WTP as
implemented full control as revealed by the literature: a demand-revealing elicitation device,
training, practice, binding outcome experiences and anonymity. We fill this void with our
experimental design.
First, using a demand-revealing elicitation device (e.g., BDM) gives subjects an incentive to
respond with their actual valuations. When faced with a demand-revealing elicitation device,
individuals have an incentive to announce their actual valuations for the good in an effort to
increase the probability of earning the maximum amount possible. Eliciting valuations in this way
decreases the likelihood that the data reflect strategies that can cause subjects to announce amounts
that differ from their actual valuations.
Second, training provides subjects with a basic understanding of the mechanism used to elicit
valuations. As part of the training process, numerical examples provide concrete illustrations,
allowing subjects to see the mechanism in terms of its purpose. In addition, subjects are provided
with specific examples to illustrate why offering amounts other than actual valuations is a
dominated strategy under the BDM mechanism.
Third, practice rounds allow subjects to learn through using the mechanism while still
educating themselves about its properties. Encouraging questions during the practice process assists
subjects in clearing up any misconceptions. In addition, the non-anonymous practice rounds give
the experimenter an opportunity to check whether subjects are displaying behavior consistent with
a clear understanding of the valuation task.
Forth, binding outcome experiences expose subjects to the consequences of their decisions
before the measurement is taken. During these binding rounds, subjects learn about the intricacies
of the mechanism and adjust non-optimal strategies to maximize their payouts. Most importantly,
this learning and adjustment process takes place before the gap is measured, minimizing the
14
possibility that the measurement of the gap includes strategic responses or responses that are
clouded by misconceptions about the mechanism.
Finally, anonymity in decisions and payouts mitigates the possibility that subjects are adjusting
actual valuations to signal some personal characteristic to other subjects or the experimenter. In
addition, when making anonymous decisions, subjects might be less inclined to ponder the
“correct” answer as viewed by others, and instead focus on choosing the amount that will reward
them the most.
5.1.2 Specific Procedures
The experiment first guided the subjects through a training session involving instructions, examples
and practice rounds (see Appendix Section A2 for details). The buying task was described to the
subjects, followed by an example illustrating how one arrives at the maximum one is willing to pay
to obtain the item from the experimenter when a BDM mechanism is used to allocate the item
(details below). Specifically, we used the following verbal example:
“Imagine that I am a buyer and Item A is up for sale. How do I know what
amount is the maximum I would be willing to pay for Item A? Start with one cent.
Would I be willing to pay one cent for the item? If so, then increase the amount to
two cents. If I am willing to pay two cents, then increase further. I keep increasing
until I come to an amount that makes me indifferent between keeping the money
and getting Item A.
Example. Would I pay $1 for A? Yes. Would I pay $2 for A? Yes. Would I pay
$5 for A? Yes. Would I pay $6 for A? No, not $6. Would I pay $5.50? No, not
that much. How about $5.25? In fact, I do not care whether I end up with $5.25 or
the item. That is the maximum I would be willing to pay for Item A. I record that
number on my information sheet.
The key to determining the maximum you would be willing to pay is
remembering that you will not pay the amount you bid. Instead, if you pay
anything, you will pay the fixed amount.
Why is my best strategy to bid the maximum I would be willing to pay? Let's go
back to the example: Say I decide that the maximum I would be willing to pay for
Item A is $5.25. What happens if I bid less than $5.25? Say I bid $5. If the fixed
amount is, say, $5.10, then I do not get the item. Had I bid $5.25, I would have

15
received the item and had to pay only $5.10 for an item that I think is worth
$5.25. I lose out. What happens if I bid higher than $5.25? Say I bid $5.50. If the
fixed amount is $5.45, then I have to pay $5.45 for an item that I really think is
worth only $5.25. I lose out.”
We then provided similar instructions and training regarding the selling task and demonstrated
how to record values and track earnings using record and information sheets.8 Finally, the
anonymous payout procedure was explained. Payoffs were made anonymously to avoid any
opportunities for signaling to other subjects or to the experimenter. As described, at the start of the
experiment, each subject received a laminated card with Caltech’s emblem (making it difficult to
duplicate in a short time) and his subject identification number. At the end of the experiment, all
subjects left the room without their payoffs. They were told to collect their payoffs from an
administrative assistant at a specified time. The subjects were informed that the experimenter
would not be able to tie any specific subject to his subject identification number, and therefore, the
experimenter would not know subject payoffs by individual. Also, the subjects were informed that
the administrative assistant would not know the amount of each subject’s payoff. The payoffs were
given to the administrative assistant in envelopes identified with subject numbers. Subjects were
required to obtain their earnings from the administrative assistant at a specific time, exchanging the
laminated identification cards for envelopes containing their earnings. This ended participation in
the experiment.
Following the training session, two practice rounds were conducted as follows:
Practice Round 1
Each subject participated as a buyer. The item for sale by the experimenter was a lottery ticket
yielding a certain return. The holder of the ticket had a 70% chance of receiving $3 and a 30%
chance of receiving $3. Thus, the lottery involved no risk; its outcome was certain. Note that in the
case of a lottery with a certain outcome there is a “correct” value for the lottery. This being the
case, mistakes by the subjects are almost certainly due to some misunderstanding. After each
subject decided on an offer, the maximum amount the subject is willing to pay to purchase the
lottery ticket, the following instruction was given:
8 Appendix Section A2 provides the exact experimental procedures in detail, including samples of the information andrecord sheets subjects used to record offers and track accumulated payouts.

16
“Remember that, to determine the maximum you would be willing to pay for the
ticket, you should start with one cent. If you would pay one cent for the ticket,
you should increase the amount. Keep increasing until you are just indifferent
between your offer and the ticket and record that amount on your record sheet.”
After this prompt, the experimenter walked around the room to observe the offers. Mistakes were
obvious to the experimenter since the options were for certain dollars and were corrected and
explained to all subjects. Questions were encouraged and answered at this point. Once all offers
were finalized and the subjects committed to their offers by recording them on slips of paper and
inserting them into a box, 9 the experimenter, in effect, conducted one auction for each subject using
the BDM mechanism.
The mechanism works as follows. Once subjects commit to their offers, a randomly generated
offer is announced. Each subject compares the recorded offer to this randomly generated offer, a
number derived from a random number table before the experiment begins. This randomly
generated offer is referred to as the “fixed offer.” During the instruction phase of the experiment,
subjects are informed about how these random fixed offers were generated, but were not told the
ranges of the fixed offers. If the subject’s offer was greater than or equal to the fixed offer, the
subject purchased the lottery ticket from the experimenter, but paid the fixed offer amount. On the
other hand, if the subject’s offer was less than the fixed offer, the subject did not purchase the
lottery ticket. In this case the subject’s round payoff was zero.
At the end of the round, the lottery outcome was determined using colored marbles. For
example, to determine the lottery specified above, seven black marbles and three white marbles
were placed into an urn. The experimenter randomly chose a single marble from the urn. If the
experimenter chose a black marble, all lottery ticket holders earned $3. If the experimenter chose a
white marble, all lottery ticket holders earned $3. Once the lottery outcome was determined, each
subject used his information and record packet to calculate his round payment. The subjects tracked
accumulated payments privately from round to round.
9 Inserting the slips into the boxes acted as a commitment device. The subjects were told that offers recorded on theirinformation and record sheets would be compared to the offers inserted into the boxes. If the offers did not match, thesubject would not be paid for that particular round. This prevented subjects from changing their offers after the fixedoffer and/or lottery result were revealed.
17
Practice Round 2
In this practice round, all subjects acted as sellers. Subjects were told that they own a lottery ticket
with a 50% chance of winning $2 and a 50% chance of winning $4. Just as in the first practice
round, the experimenter essentially conducted one auction for each subject using the BDM
mechanism.
Each subject decided on an offer, the minimum amount the subject was willing to accept to sell
the lottery ticket to the experimenter in exchange for cash. Once each subject recorded an offer the
following instruction was given:
“Remember that to determine the minimum you would be willing to accept in
exchange for the ticket, you should start with a high offer. If you would accept
this high offer to give up your ticket, you should decrease the amount. Keep
decreasing until you are just indifferent between your offer and the ticket and
record that amount on your record sheet.”
Once subjects were content with their offers, the fixed offer was announced. Subjects
compared their offers to the fixed offer. If a subject’s offer was less than or equal to the fixed offer,
the subject sold the lottery ticket to the experimenter and received the fixed offer. On the other
hand, if the subject’s offer was more than the fixed offer, the subject did not sell the lottery ticket.
In this case the subject’s round payoff was determined by the lottery outcome, a draw from the
marbles at the end of the round.
During the two practice rounds, the subjects did not earn money. Practice rounds were
conducted for several reasons. They provided instruction as to how true values were determined
and gave the subjects an opportunity to practice using the “record and information” sheets and to
ask questions. In addition, the experimenter had an opportunity to observe individual behavior and
clear up any misunderstandings (i.e., the playing of dominated strategies) noted from the
observations.
Paid Rounds
After the two practice rounds, each subject participated in 15 paid rounds: 14 rounds conducted
with lotteries and one round conducted with mugs. In the experiments including binding outcome
experiences, the mug round was conducted after the lottery rounds. In the experiment without
binding outcome experiences, the mug round was conducted before the lottery rounds. The first six
18
lottery rounds involved lotteries with expected values of less than $1. The subjects were told that
the lotteries would increase in magnitude, but the first few rounds allowed for additional (but paid)
practice. All subjects acted as sellers in the first three lottery rounds and buyers in the second three
lottery rounds. The first set of “large stakes” lottery rounds (4 in total) involved lotteries with
expected values ranging from $2 to $8. All subjects acted as sellers during these rounds. During the
second set of large stakes lottery rounds (4 in total), all subjects acted as buyers. Subjects were
allowed to view only the lottery involved in the round being conducted. Table 2 summarizes the
experiments.
[INSERT TABLE 2 HERE]
In the mug round, the item considered by the subjects was a plastic travel mug with a market
value of approximately $8.50. The subjects were not informed of the market value. Approximately
half the subjects acted as sellers and approximately half acted as buyers. All subjects were handed a
mug before the start of the round. Sellers were told that they owned the mug. Buyers were told that
they could inspect the mug but they did not own it. All subjects were prompted to record an offer
(sellers offering the minimum amount they would accept to give up their mugs, buyers offering the
maximum amount they would pay in exchange for the mug). After offers were recorded subjects
were prompted to consider whether the offer chosen was the actual non-strategic value and allowed
to change the offer before committing to it. After all committed offers were collected (i.e., slips
placed into the boxes), the predetermined fixed offer was announced. The subjects recorded their
round payoffs and accumulated payoffs for the experiment.
5.2 Plott/Zeiler Design Results
Three sets of data present themselves for analysis. We drew subjects from a pool of University of
Southern California law students for experiments 1 and 2 and from a pool of undergraduate
students enrolled at Pasadena City College for experiment 3. For purposes of this paper, we
analyzed the data from the mug rounds only. The data from the lottery rounds is available from the
authors upon request.
Each subject revealed a personal value for a mug, either from the point of view of someone
who owned the mug and is given an opportunity to sell it or from the point of view of someone
who has no mug but is given the opportunity to buy one. Thus, for each subject we have either a
WTP for the mug or a WTA but we do not have both.

19
In experiments 1 and 3 values for the mugs were collected after 14 rounds during which
subjects made decisions involving binding lotteries, which are interpreted as providing binding
outcome experiences. In experiment 2 such binding outcome experiences were absent prior to the
mug round. Table 3 contains data on subjects’ responses during the mug rounds. Data are reported
for a total of 74 subjects.
Table 3 also provides summary statistics for each experiment. In experiment 1, the mean WTP
response was $5.20 (median = $5.00) and the mean WTA response was $5.69 (median = $5.00). In
experiment 2, the mean WTP response was $7.88 (median = $6.50) and the mean WTA response
was $5.71 (median = $5.10). Finally, in experiment 3, the mean WTP response was $7.29 (median
= $8.00) and the mean WTA response was $5.06 (median = $4.25).
[INSERT TABLE 3 HERE]
5.2.1 WTA-WTP Gap Results
The main result is striking and exists across all experiments. No gap is observed. The following
statements provide support for this result.
Result 1. The data do not support the hypothesis that WTA is significantly greater than WTP
in both experiments using the BDM mechanism to elicit valuations and employing training,
practice, anonymity and binding outcome experiences.
Support. In Table 4 we report the results of statistical tests to determine whether the data
support the hypothesis that WTA is significantly greater than WTP. For all experiments, the null
hypYthesis that WTP ≥ WTA is tested against the alternative hypothesis that WTA > WTP.
[INSERT TABLE 4 HERE]
The hypothesis that WTA is significantly greater than WTP when the BDM mechanism is used
to elicit responses and practice, training, anonymity and binding outcome experiences are provided
is not substantiated by the data in either experiment 1 or experiment 3. The Wilcoxon-Mann-
Whitney test for large samples is used to test the null hypothesis that WTP ≥ WTA against the
alternative, WTA > WTP, using the data from experiment 1. The test statistic results in a z value of

20
-0.06 with a corresponding p value of 0.48; therefore, under α = 0.01, we cannot reject the null
hypothesis that WTP ≥ WTA.
In experiment 3 the sample size is small. Therefore the Wilcoxon-Mann-Whitney test for small
samples is used to test the null hypothesis, WTP ≥ WTA, against the alternative hypothesis, WTA
> WTP. The p value associated with getting a test statistic of more than 54 under the null
hypothesis is greater than 0.66. Therefore, we conclude that WTP ≥ WTA.
As explained in the section above an experiment was performed with all aspects of procedures
present with the exception of the binding outcome experiences prior to eliciting offers for the mugs.
After the instructions, training and practice the subjects made a binding offer regarding the mugs.
Here again, no gap was observed.
Result 2. The data do not support the hypothesis that WTA is significantly greater than WTP
in the experiment using the BDM mechanism to elicit valuations and employing training, practice,
anonymity (with no binding outcome experiences).
Support. The hypothesis that WTA is significantly greater than WTP when the BDM
mechanism is used to elicit responses and practice, training and anonymity are provided (without
binding outcome experiences) is not substantiated by the data in experiment 2. We use the
Wilcoxon- Mann-Whitney test for large samples to test the null hypothesis that WTP ≥ WTA
against the alternative, WTA > WTP. The test statistic results in a z value of 0.63 with a
corresponding p value of 0.74; therefore, under α =0.01, we cannot reject the null hypothesis that
WTP ≥ WTA. The hypothesis that a significant difference exists between WTP and WTA is not
substantiated by the data.10
Clearly the extensive instruction, training and practice may have removed misconceptions
without a need for binding outcome experiences to do so. In this regard, as can be seen in Figure 1,
other researchers have conducted experiments with no binding outcome experiences and have
observed the gap. It should be noted that the other aspects of instructions differed from ours. This
fact may account for the observed differences. However, it is important to note that, in the presence
of other procedures, binding outcome experiences are not necessary for the elimination of the gap.
10 The individual data from experiment 2 suggests that the buyer who offered $23.00 for the mug may be driving theresult. Evaluating the data without this high offer, however, produces the same result: the null hypothesis, WTP ≥WTA, cannot be rejected.

21
It should be noted that while we observe a WTP that is on average greater than a WTA the
difference is not statistically significant. Of course, without statistical significance one could just
as readily observe WTP>WTA as WTP<WTA as long as proper controls were implemented.
We have not reported the details of the lottery sessions since they add no conclusions to those
reported above. However, since KKT did conduct induced value token rounds and used those data
as evidence that their subjects had no misconceptions, it is useful to add a word about our data.
When viewing our data for the lottery rounds with a certain dollar outcome we observe correct
reporting of values similar to the accuracy for induced value rounds that were reported by KKT.
The proportion of subjects that gave the correct response was the same in our experiments as
reported by KKT. Yet, when the lotteries for certain outcomes are followed by additional
procedures designed to remove misconceptions, as was done in the experiments we report, the
behavior substantially changes as is evident from a comparison between our replication of the KKT
procedures and the data reported in this section. From these facts we conclude that one cannot use
data from induced value rounds or data from rounds of lotteries for certain outcomes as a broad and
reliable test for the existence of (or absence of) misconceptions.
5.2.2 Income Effect Conjecture
The dramatic difference between measurements taken under a full set of controls for
misconceptions and the measurements taken under the KKT procedures motivates questions about
how particular procedural features might contribute to the differences. In particular, an immediate
“income effect” hypothesis is related to the fact that our subjects earn money or have the prospect
of earning money during the experiment. One could imagine that an income effect might elevate
WTP in a manner that eliminates the gap.11 More precisely, the hypothesis is that an income effect
acts asymmetrically, increasing WTP and reducing the difference between WTP and WTA. 12 The
following result addresses that possibility.
Result 3. The data do not support the income effect hypothesis. That is, there is no support
for the hypothesis that money earned during the practice and training sessions accounts for the fact
that WTA for the mugs is not greater than WTP.
11 This phenomenon has been referred to in the literature as the “house money effect.” The idea is that subjects mightbe more willing to spend money earned during the experiment than money taken from their own pockets.
12 We are indebted to Colin Camerer, Richard Thaler and Leeat Yariv for drawing our attention to this hypothesis.

22
Support. The support for this result originates from two sources. First, in experiment 2 bids
for the mugs are revealed before money is earned during the lottery rounds. In that experiment
there could not have been an income effect because the money had not been earned before the
subjects bid on the mugs. Yet in that experiment WTA did not exceed WTP. Thus, this experiment
incorporated a direct control and provided no support for the income effect hypothesis.
The second source of support is the mug bids themselves. The hypothesis implies that there is
some relationship between money earned in the practice and training sessions and the final
expressed values for the mug. As a test for this relationship individual WTP and WTA were
regressed against the income earned during the practice and training sessions. The following
measurements resulted:
WTPi = 5.77 + 0.0108 Yi
(t = 3.816) (t = 0.155)
WTAi = 5.11 + 0.0183 Yi
(t = 2.890) (t = 0.225)
where Yi represents subject i’s income prior to the mug round. The regressions strongly imply that
none of the variation in mug bids can be explained by variation in the income variable, Yi. Not only
are the coefficients close to zero, they are not significantly different from zero. These results allow
us to reject strongly the hypothesis that the income earned during practice and training had a
substantial effect on either WTP or WTA.
6 Discussion and Conclusions
The issue explored here is not whether a WTP-WTA gap can be observed. Clearly, the experiments
of KKT and others show that not only can such a gap be observed, but also that it is replicable. Our
interest lies in the interpretation of the observed phenomenon. The primary conclusion that one
derives from the data reported here is that any observed WTP-WTA gap is not a reflection of a
fundamental feature of human preferences. That is, the common reference to any observed gap as
an endowment effect is not supported, and the extent to which a gap is observed cannot be
interpreted as support for prospect theory.

23
The literature demonstrates that a gap is not reliably observed across experimental designs.
That fact prompted us to conduct specially developed procedures to test for the robustness of the
phenomenon. The fact that the gap is not reliably observed suggests that differences in
experimenters or experimental procedures might account for differences in experimental
observations.
Comparative experiments were conducted using procedures commonly used by those papers
that report a gap. We also conducted experiments consisting of the union of procedures used by
experimentalists to control for subject misconceptions. We discovered these procedures using what
we call a “revealed theory” methodology. The comparative experiments demonstrate that the
existence of the phenomenon is indeed sensitive to the experimental procedures. By proper choice
of procedures the phenomenon can be turned on and off. When procedures used by papers that
report the gap are employed, the gap is readily observed. When a full set of controls is
implemented, the gap is not observed.
The fact that the gap can be turned on and off demonstrates that the endowment effect
interpretation of such data is not correct. The mere observation of the phenomenon does not
demonstrate the existence of a very special form of preferences in which gains are valued less than
losses. That is, the fact that the phenomenon can be turned on and off constitutes a clear rejection
of the theory that the phenomenon is due to the particular preferences represented by prospect
theory. Loss aversion might in some sense exist but such a theory certainly cannot account for the
data in the case of a WTA-WTP gap.
Exactly what accounts for the WTA and WTP gap when it is observed? The thesis of this
paper is that the existence of such phenomenon is symptomatic of subjects’ misconceptions about
the nature of the experimental task. An implication is that the differences reported in the literature
reflect differences in experimental controls for misconceptions.
Having said that, we hasten to add that our thesis is not especially satisfying because we have
neither a general theory of what might constitute misconceptions nor a set of operational definitions
characterizing when they might exist. A full set of procedures for controlling them, could be very
difficult to produce since misconceptions might depend on such subtle features as the speed with
which experimental instructions are delivered, the distance of subjects from the chalkboard if it is
used, the size of writing on the board, how loud the instructions are read and the nature of pauses or
24
emphasis, etc. Understanding appears to us to be a delicate matter and to fully control for it
represents a daunting task.13
Several important possible interpretations avail themselves. Each is a matter of speculation at
this point, but we list them in order to facilitate discussion. One interpretation is that the WTP and
WTA gap exists when the measurements include unwanted aspects of behavior (i.e., behavior that
motivates an individual to announce something other than a “true” valuation). When the
measurement carefully controls for such phenomena the gap goes away. Under this interpretation
the lack of robustness of the gap is due to patterns of differences in understanding by the subjects.
If such is the case, use of the label “endowment effect” reflects an inappropriate application of a
specific theory.
A second interpretation is that the procedures themselves removed attitudes that would foster
any difference between WTA and WTP. In particular, according to this conjecture, by allowing the
subjects to participate on both the buying side and the selling side of the lottery rounds, objects are
translated into commodities in which ownership or loss plays no particular part in the preference
formation process. Thus in the subsequent mug round, in which subjects were practicing on both
the buyer side of a market and on the seller side of the market, any feelings of ownership were lost,
somehow transferred from the attitude toward lotteries to the attitude toward the mug. Under this
interpretation the procedures, even prior to the actual measurement, play a role in the
transformation of preferences influenced by loss aversion to preferences not influenced by loss
aversion. Of course, prospect theory says nothing about such a dynamic development of
preferences. There is no additional evidence that might support the conjecture, and there is
evidence that works against it. In one experiment the mug round was conducted before the subjects
had experience in the lotteries and no gap was observed. Therefore, the experience with the
lotteries could not have played a crucial role in the disappearance of the gap in that instance.
A third interpretation is that the procedures themselves involve a type of demand effect in
which the subject perceives that the experimenter wants to strip from responses any special value
13 An opportunity for subject interviews presented itself when payments were made to some of the PCC subjects.These interviews revealed that some subjects’ concepts of lotteries were not what an experimenter might suppose. Inparticular, some subjects suggested that decisions were made on their “guess” about the lottery outcome and thereforewould pay more (or less) for it. The degree to which subjects naturally understand the concept of statisticalindependence seems to be an open question. This emphasizes the fact that explanation, training and experience maycontribute substantially to understanding.

25
of ownership. The conjecture is that by responding to a demand that the answers be “thoughtful”
the subject removes from the response a preference related to “ownership” that would otherwise be
reflected in choice. While the mechanism through which this transformation is supposed to take
place is not clear, the conjecture itself cannot be rejected with the data from our experiments.
A fourth conjecture is that the procedures suggested some particular value as a response and
thus our measurements recorded the suggested value as opposed to preferences. Since the same
procedures were used for all subjects the conjecture implies that the valuations elicited from the
subjects should all be similar. That the valuations are similar is clearly rejected by the variance of
each sample of data. Therefore, this conjecture can be rejected by our data. We mention here one
interesting aside. The test for understanding that KKT employed and that we use as well (in
conjunction with other procedures) could be subject to criticism under this conjecture. Specifically,
when under instruction subjects are ask for WTP and WTA values for a certain dollar value (e.g., a
lottery that pays a dollar for certain). The fact that subjects answer correctly might simply reflect
their tendency to reply with a suggested value (i.e., the certain lottery value or the induced token
value). Thus, correct answers under these conditions might not be evidence that they understood
the mechanism.
A fifth interpretation is that the WTP-WTA gap reflects features of a decision process, as
opposed to a preference. Plott (1996) advances a “discovered preference hypothesis” that responses
in experiments reflect a type of internal search process in which subjects use binding outcome
experiences along with aspects of practice and trial and error to “discover” what they want. As the
subjects gain experience and maturity with the process, preferences become understood and
reflected in behavior. The hypothesis is that stages of the process can be identified and during the
first stage, when the situation is least familiar to the subject, the process of framing becomes most
important. Under this interpretation prospect theory itself emerges as a stage of the process. Rather
than describing a feature of preferences it describes the features of one stage of a preference
discovery process. With this background prospect theory becomes part of a theory of how a process
of cognition interacts with preference formation and decision making.
We do not take a stand on which of these interpretations is valid or answerable by our
literature review and experimental results. In fact, we disagree on this point. We do agree, however,
that sorting out the conditions under which we observe a gap is a necessary precursor to
understanding the nature of the gap.
26
We close with one important point. When evaluating a theory like the endowment effect,
intuition and anecdotal field evidence naturally arise as possible support for the theory. It is
essential, however, to exercise care. Other theories exist as possible explanations of any
asymmetries between WTP and WTA observed in the field, and such theories are completely
unrelated to the shifting of a “reference point” as assumed by prospect theory. Consider the
following alternative explanation. Familiarity and the consequent reduction of uncertainty about
the characteristics of an item create value. The familiarity that accompanies ownership could help
to alleviate uncertainty and in doing so elevate WTA. Thus, under the discovered preference
hypothesis, ownership can be viewed as one useful tool during the discovery and uncertainty
reduction process. In these ways ownership could well create value and in doing so elevate WTA
through the evolution of preference. The existence of increased WTA due to ownership, however,
would support the hypothesis that value is created through search and learning (by doing) just as
much as it would support the shifting reference point process assumed by prospect theory. Thus, in
using field data to understand various forms of value that might be created by ownership one
should weigh all competing theories and not accept one of them simply because others have not
been considered.
27
References
Arlen, J., M. Spitzer and E. Talley. 2002. Endowment Effects within Corporate AgencyRelationships. Journal of Legal Studies 31(1):1.
Bateman, I., D. Kahneman, A. Munro, C. Starmer and R. Sugden. Working Paper. Is There LossAversion in Buying?: An adversarial collaboration. 2001.
_________, A. Munro, B. Rhodes, C. Starmer and R. Sugden. May 1997. A Test of the Theory ofReference-Dependent Preferences. Quarterly Journal of Economics 112:479.
Becker, G.M., M.H. DeGroot, and J. Marschak. 1964. Measuring Utility by a Single-responseSequential Method. Behavioral Science 8:306.
Boyce, R.R., T.C. Brown, G.H. McClelland, G. L. Peterson and W.D. Schulze. December 1992. AnExperimental Examination of Intrinsic Values as a Source of WTA-WTP Disparity. AmericanEconomic Review 82(5):1366.
Brookshire, D.S. and D.L. Coursey. September 1987. Measuring the Value of a Public Good: Anempirical comparison of elicitation procedures. American Economic Review 77(4):554.
Coursey, D.L., J.L. Hovis and W.D. Schulze. August 1987. The Disparity Between Willingness toAccept and Willingness to Pay Measures of Value. Quarterly Journal of Economics 102:679.
Dubourg, W.R., M.W. Jones-Lee and G. Loomes. 1994. Imprecise Preferences and the WTP-WTADisparity. Journal of Risk and Uncertainty 9:115.
Franciosi, R., P. Kujal, R. Michelitsch, V. Smith and G. Deng. 1996. Experimental Tests of theEndowment Effect. Journal of Economic Behavior & Organization 30(1996):213.
Harless, D.W. 1989. More Laboratory Evidence on the Disparity Between Willingness to Pay andCompensation Demanded. Journal of Economic Behavior and Organization 11(1989):359.
Heifetz, A. and E. Segev. Working Paper. The Evolutionary Role of Toughness in Bargaining.2001.
Horowitz J.K. and K.E. McConnell. Working Paper. A Review of WTA/WTP Studies. 2000.
Kahneman, D., J.L. Knetsch and R.H. Thaler. 1990. Experimental Tests of the Endowment Effectand the Coase Theorem. Journal of Political Economy 98(6):1325.
Knetsch, J.L. December 1989. The Endowment Effect and Evidence of Nonreversible IndifferenceCurves. American Economic Review 79(5):1277.
__________ and J.A. Sinden. August 1984. Willingness to Pay and Compensation Demanded:Experimental evidence of an unexpected disparity in measures of value. Quarterly Journal ofEconomics August 1984:508.
28
__________, F.F. Tang and R.H. Thaler. 2001. The Endowment Effect and Repeated MarketTrials: Is the Vickrey auction demand revealing? Experimental Economics 4(3):257.
Knez, P., V.L. Smith and A.W. Williams. May 1985. Individual Rationality, Market Rationality,and Value Estimation. AEA Papers and Proceedings 75(2):397.
Lehmann, E.L. 1975. Nonparametrics: Statistical Methods Based on Ranks. San Francisco: HoldenDay.
List, J.A. and J.F. Shogren. November 1999. Price Information and Bidding Behavior in RepeatedSecond-Price Auctions. American Journal of Agricultural Economics 81(November 1999):942.
Loewenstein, G. and S. Issacharoff. 1994. Source Dependence in the Valuation of Objects. Journalof Behavioral Decision Making 7(3):157.
Mann, H.B. and D.R. Whitney. 1947. On a Test of Whether One of Two Random Variables isStochastically Larger than the Other. Annals of Mathematical Statistics 18:50.
Morrison, G.C. 1997. Willingness to Pay and Willingness to Accept: Some evidence of anendowment effect. Applied Economics 29:411.
Ortona, G. and F. Scacciati. 1992. New Experiments on the Endowment Effect. Journal ofEconomic Psychology 13(1992):277.
Plott, Charles R. 1996. Rational Individual Behaviour in Markets and Social Choice Processes: theDiscovered Preference Hypothesis. In The Rational Foundations of Economic Behavior, ed. K.Arrow, E. Colombatto, M. Perlaman and C. Schmidt. London: Macmillian and NY: St. Martin'sPress, 225-50.
Posner, R.A. and G.M. Fremling. Working Paper. Market Signaling of Personal Characteristics.John M. Olin Law & Economics Working Paper No. 87 (2d Series).
Rachlinski, J.J. and F. Jourden. 1998. Remedies and the Psychology of Ownership. Vanderbilt LawReview 51:1541.
Shogren, J.F., S.Y. Shin, D.J. Hayes and J.B. Kliebenstein. March 1994. Resolving Differences inWillingness to Pay and Willingness to Accept. American Economic Review 84(1):255.
__________, S. Cho, C. Koo, J. List, C. Park, P. Polo and R. Wilhelmi. 2001. Auction Mechanismsand the Measurement of WTP and WTA. Resource and Energy Economics 23(2001):97.
Singh, H. 1991. The Disparity Between Willingness to Pay and Compensation Demanded: Anotherlook at laboratory evidence. Economic Letters 35(1991):263.

29
Whitney D.R. 1948. A Comparison of the Power of Non-Parametric Tests and Tests Based on theNormal Distribution Under Non-Normal Alternatives (Unpublished doctoral dissertation, OhioState University).
Wilcoxon, F. 1945. Individual Comparisons by Ranking Methods. Biometrics 1:80.

30
AppendixA1 Figure 1 Studies
Table 5 lists all studies appearing in Figure 1. The experiments appearing in bold print are those
that reported a WTP-WTA gap. The others reported no gap.
[INSERT TABLE 5 HERE]
A2 Instructions Viewed by Subjects for KKT Replication
Note that the seller instructions are identical except for the obvious adjustments. Also, thesecond hypothetical round was identical to the first hypothetical round except that that tokenvalue changed.
INSTRUCTIONS
This is an experiment in individual decision making. Our purpose is to study technical issuesinvolved in decision making. Various research foundations have provided funds for this research.We will conduct two hypothetical rounds and one paid round.
ROUND 1 (hypothetical)
In this market the objects being traded are tokens. You are a buyer, so you have an opportunity tobuy a token which has a value to you of $_________. It has this value to you because theexperimenter will give you this much money for it. The value of the token is different for differentindividuals.
For each of the prices listed below, please indicate whether you prefer to: (1) Buy a token at thisprice and cash it in for the sum of money indicated above, or (2) Not buy a token at this price.
After you have finished, one of the prices listed below will be selected at random and anyexchanges will take place at that price. If you have indicated you will buy at this price you willreceive a token and will pay this amount of money; if you have indicated that you will not buy atoken at this price then no exchange will be made and you do not pay anything.
Notice the following two things:(1) Your decision can have no effect on the price actually used because the price will be selected atrandom.(2) It is in your interest to indicate your true preferences at each of the possible prices listed below.

31
For each price indicate your decision by marking an X in the appropriate column.
I Will Buy I Will Not BuyThe Token The Token
If the price is $0.00 _______ _______If the price is $0.50 _______ _______If the price is $1.00 _______ _______If the price is $1.50 _______ _______If the price is $2.00 _______ _______If the price is $2.50 _______ _______If the price is $3.00 _______ _______If the price is $3.50 _______ _______If the price is $4.00 _______ _______If the price is $4.50 _______ _______If the price is $5.00 _______ _______If the price is $5.50 _______ _______If the price is $6.00 _______ _______If the price is $6.50 _______ _______If the price is $7.00 _______ _______If the price is $7.50 _______ _______If the price is $8.00 _______ _______If the price is $8.50 _______ _______If the price is $9.00 _______ _______If the price is $9.50 _______ _______
WAIT FOR INSTRUCTIONS
ROUND 3
You now do not own a mug. You have the option of buying one to take home by paying money forit.
For each of the possible prices listed below, please indicate whether you wish to: (1) Pay thatamount of money and buy a mug, or (2) Not buy a mug at this price.
After you have finished, one of the prices listed below will be selected at random and anyexchanges will take place at that price. If you have indicated you will buy at this price you willreceive a mug and will pay this amount of money; if you have indicated that you will not buy amug at this price then no exchange will be made and you do not pay anything.
Notice the following two things:

32
(1) Your decision can have no effect on the price actually used because the price will be selected atrandom.(2) It is in your interest to indicate your true preferences at each of the possible prices listed below.
For each price indicate your decision by marking an X in the appropriate column.
I Will Buy I Will Not Buy The Mug The Mug
If the price is $0.00 _______ _______If the price is $0.50 _______ _______If the price is $1.00 _______ _______If the price is $1.50 _______ _______If the price is $2.00 _______ _______If the price is $2.50 _______ _______If the price is $3.00 _______ _______If the price is $3.50 _______ _______If the price is $4.00 _______ _______If the price is $4.50 _______ _______If the price is $5.00 _______ _______If the price is $5.50 _______ _______If the price is $6.00 _______ _______If the price is $6.50 _______ _______If the price is $7.00 _______ _______If the price is $7.50 _______ _______If the price is $8.00 _______ _______If the price is $8.50 _______ _______If the price is $9.00 _______ _______If the price is $9.50 _______ _______
WAIT FOR INSTRUCTIONS

33
A3 Instructions for Plott/Zeiler
A3.1 Set Up
Prior to the beginning of the experiment, the experimenter placed an example of a buyer
information sheet and a seller information sheet on the board. The subject’s offer, fixed offer,
lottery outcome and payout calculation were left blank. In addition, a table indicating the frequency
of digits (0-9) appearing in the random number table used to generate the fixed offers was placed
on the board. For example,
0 1 2 3 4 5 6 7 8 9 Total
# of observations 22 21 21 19 12 23 16 22 19 25 200
frequency 11% 10.5% 10.5% 9.5% 6% 11.5% 8% 11% 9.5% 12.5% 100%
This table shows the breakdown of the first 200 digits of the random number table used to generate
fixed offers. If the table is indeed random each digit should be observed 10% of the time. The table
is used to provide evidence to the subjects that the fixed offers are truly random.
Table 6 indicates the lotteries by round (for experiments with binding outcome experiences)
and the range of the fixed offers. To reduce the variance in expected payouts, two different sets of
lotteries were used. Subjects were split into two equally sized groups, Type A and Type B, as
indicated below. For the experiment without binding outcome experiences, the mug round occurred
before any of the lottery rounds, so the lotteries were used in rounds 2-15 rather than 1-14. The
order of the lotteries was the same as in the experiments with binding outcome experiences.
[INSERT TABLE 6 HERE]
In addition to receiving a show-up fee, subjects were given written instructions, which were
read aloud at the beginning of the experiment. The instructions reported below are for the
experiments with binding outcomes experiences. Modifications made for the instructions for the
experiments without binding outcome experiences are shown in square brackets. The instructions
were read aloud to the subjects. The information presented in the footnotes is explanatory for
purposes of this paper and was not included in the written instructions.

34
A3.2 Instructions Viewed By Subjects
Instructions
This is an experiment in individual decision-making. Our purpose is to study technical issues
involved in decision-making. Various research foundations have provided funds for this research.
The instructions are simple, and if you follow them carefully and make good decisions, you
might earn a considerable amount of money or other things. What you earn will depend on the
decisions you make. You will perform a series of buying tasks and a series of selling tasks.
You have received a record and information packet.14 This is your own private information. Do
not share it with anyone. We ask that you do not communicate with other people during the
experiment. Please refrain from verbally reacting to events that occur during the experiment. This
is very important.
Buying Task:
The buying task works as follows. The experimenter will offer an item for sale. Your task is to
make an offer for the item and record it on your information sheet. You will also record your offer
on a slip of paper and insert it into a box. 15
As you will see, your best strategy is to determine the maximum you would be willing to pay
for the item and offer that amount. It will not be to your advantage to offer more than this
maximum, and it will not be to your advantage to offer less. Simply determine the maximum you
would be willing to pay and make that amount your offer.
Your offer will be compared to a fixed offer. The fixed offer will be completely unrelated to
your offer and to the offers of all other persons in the room.
If your offer is more than or the same as the fixed offer then you buy the item. You had the
high offer, so you are the buyer. But, here’s the interesting part. You do not pay the amount you
offered. Instead, you pay the fixed offer, an amount equal to or less than your offer.
14 See Sections A2.3 and A2.4 of the Appendix for examples of the record and information sheets.
15 At this point the experimenter explained how the slips would be used in determining the payoffs at the end of theexperiment. For each round, the offer recorded on the slip would be compared to the offer recorded in the informationand record packet. If the two offers differed, the subject would not be paid for that round. This mechanism prevents thesubjects from revising their offers after the experimenter announces the fixed offer and lottery outcome.

35
Example: if you offer 1,000 and the fixed offer is 950, you have the high offer. You buy the
item but pay only 950.
If your offer is less than the fixed offer then you do not buy the item. Instead, you keep your
money.
Example: if you offer 1,000 and the fixed offer is 1,020, you do not have the high offer.
Therefore, you do not buy the item. You keep your money.
As a buyer, you should offer exactly the maximum amount you would be willing to pay in
exchange for the item being sold.
Remember, there are no advantages to strategic behavior. Your best strategy is to determine
your personal value for the item and record that value as your offer. There is not necessarily a
“correct” value. Personal values can differ from individual to individual.16
16 At this point, the experimenter drew the subjects’ attention away from the printed instructions to explain how toarrive at their actual WTP amounts and why responding with actual WTP is the best strategy. The experimenterprovided the following example and explanation:
“Imagine that I am a buyer and Item A is up for sale. How do I know what amount is the maximum I’d be willingto pay for Item A?
Start with 1 cent. Would I be willing to pay 1 cent for the item? If so, then increase the amount to 2 cents. IfI’m willing to pay 2 cents, then increase further. I keep increasing until I come to an amount that makes meindifferent between keeping the money and getting Item A.
Example. Would I pay $1 for A? Yes. Would I pay $2 for A? Yes. Would I pay $5 for A? Yes.Would I pay $6 for A? No, not $6. So I need to decrease. Would I pay $5.50? No, not that much.How about $5.25? I don’t care whether I end up with $5.25 or the item. Then that is the maximum I’dbe willing to pay for Item A. I’ll record that number on my information sheet.
The key to determining the maximum you’d be willing to pay is remembering that you will not pay theamount you bid. Instead, if you pay anything, you will pay the fixed amount.
Why is my best strategy to bid the maximum I’d be willing to pay? Let’s go back to the example:
Say that I decide that the maximum I’d be willing to pay for Item A is $5.25.
What happens if I bid less than $5.25? Say I bid $5.
If the fixed offer is, say, $5.10, then I don’t get the item. Had I bid $5.25, I would have received theitem and had to pay only $5.10 for an item that I think is worth $5.25. I lose out.
What happens if I bid higher than $5.25? Say I bid $5.50.
If the fixed amount is $5.45, then I have to pay $5.45 for an item that I really think is worth only $5.25.I lose out.
After discussing the example, the experimenter encouraged and addressed questions from subjects. After answeringquestions, the experimenter drew the subjects’ attention back to the instructions.
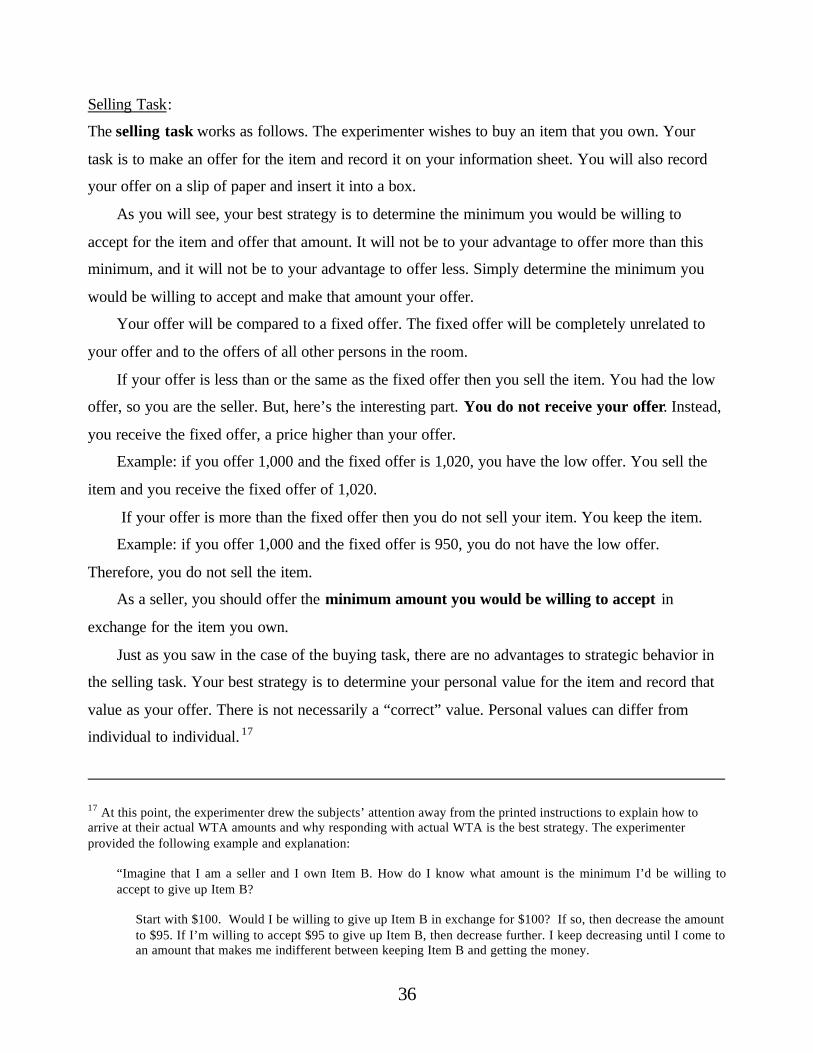
36
Selling Task:
The selling task works as follows. The experimenter wishes to buy an item that you own. Your
task is to make an offer for the item and record it on your information sheet. You will also record
your offer on a slip of paper and insert it into a box.
As you will see, your best strategy is to determine the minimum you would be willing to
accept for the item and offer that amount. It will not be to your advantage to offer more than this
minimum, and it will not be to your advantage to offer less. Simply determine the minimum you
would be willing to accept and make that amount your offer.
Your offer will be compared to a fixed offer. The fixed offer will be completely unrelated to
your offer and to the offers of all other persons in the room.
If your offer is less than or the same as the fixed offer then you sell the item. You had the low
offer, so you are the seller. But, here’s the interesting part. You do not receive your offer. Instead,
you receive the fixed offer, a price higher than your offer.
Example: if you offer 1,000 and the fixed offer is 1,020, you have the low offer. You sell the
item and you receive the fixed offer of 1,020.
If your offer is more than the fixed offer then you do not sell your item. You keep the item.
Example: if you offer 1,000 and the fixed offer is 950, you do not have the low offer.
Therefore, you do not sell the item.
As a seller, you should offer the minimum amount you would be willing to accept in
exchange for the item you own.
Just as you saw in the case of the buying task, there are no advantages to strategic behavior in
the selling task. Your best strategy is to determine your personal value for the item and record that
value as your offer. There is not necessarily a “correct” value. Personal values can differ from
individual to individual. 17
17 At this point, the experimenter drew the subjects’ attention away from the printed instructions to explain how toarrive at their actual WTA amounts and why responding with actual WTA is the best strategy. The experimenterprovided the following example and explanation:
“Imagine that I am a seller and I own Item B. How do I know what amount is the minimum I’d be willing toaccept to give up Item B?
Start with $100. Would I be willing to give up Item B in exchange for $100? If so, then decrease the amountto $95. If I’m willing to accept $95 to give up Item B, then decrease further. I keep decreasing until I come toan amount that makes me indifferent between keeping Item B and getting the money.
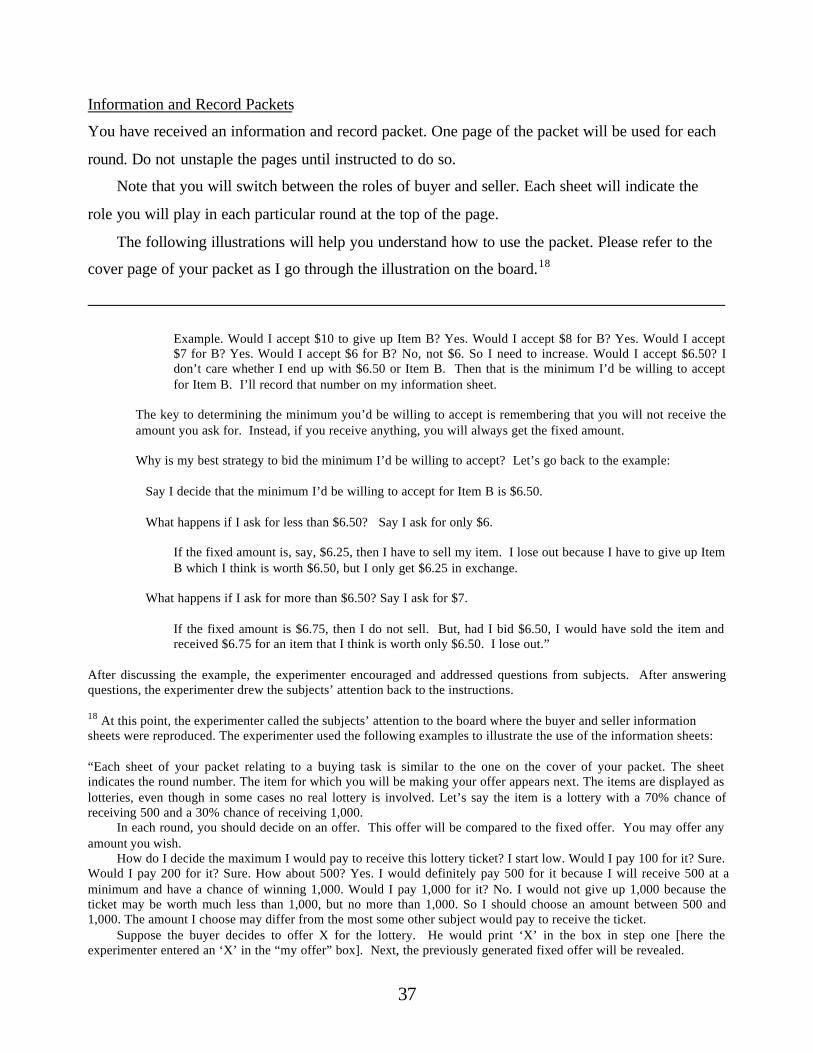
37
Information and Record Packets
You have received an information and record packet. One page of the packet will be used for each
round. Do not unstaple the pages until instructed to do so.
Note that you will switch between the roles of buyer and seller. Each sheet will indicate the
role you will play in each particular round at the top of the page.
The following illustrations will help you understand how to use the packet. Please refer to the
cover page of your packet as I go through the illustration on the board.18
Example. Would I accept $10 to give up Item B? Yes. Would I accept $8 for B? Yes. Would I accept$7 for B? Yes. Would I accept $6 for B? No, not $6. So I need to increase. Would I accept $6.50? Idon’t care whether I end up with $6.50 or Item B. Then that is the minimum I’d be willing to acceptfor Item B. I’ll record that number on my information sheet.
The key to determining the minimum you’d be willing to accept is remembering that you will not receive theamount you ask for. Instead, if you receive anything, you will always get the fixed amount.
Why is my best strategy to bid the minimum I’d be willing to accept? Let’s go back to the example:
Say I decide that the minimum I’d be willing to accept for Item B is $6.50.
What happens if I ask for less than $6.50? Say I ask for only $6.
If the fixed amount is, say, $6.25, then I have to sell my item. I lose out because I have to give up ItemB which I think is worth $6.50, but I only get $6.25 in exchange.
What happens if I ask for more than $6.50? Say I ask for $7.
If the fixed amount is $6.75, then I do not sell. But, had I bid $6.50, I would have sold the item andreceived $6.75 for an item that I think is worth only $6.50. I lose out.”
After discussing the example, the experimenter encouraged and addressed questions from subjects. After answeringquestions, the experimenter drew the subjects’ attention back to the instructions.
18 At this point, the experimenter called the subjects’ attention to the board where the buyer and seller informationsheets were reproduced. The experimenter used the following examples to illustrate the use of the information sheets:
“Each sheet of your packet relating to a buying task is similar to the one on the cover of your packet. The sheetindicates the round number. The item for which you will be making your offer appears next. The items are displayed aslotteries, even though in some cases no real lottery is involved. Let’s say the item is a lottery with a 70% chance ofreceiving 500 and a 30% chance of receiving 1,000.
In each round, you should decide on an offer. This offer will be compared to the fixed offer. You may offer anyamount you wish.
How do I decide the maximum I would pay to receive this lottery ticket? I start low. Would I pay 100 for it? Sure.Would I pay 200 for it? Sure. How about 500? Yes. I would definitely pay 500 for it because I will receive 500 at aminimum and have a chance of winning 1,000. Would I pay 1,000 for it? No. I would not give up 1,000 because theticket may be worth much less than 1,000, but no more than 1,000. So I should choose an amount between 500 and1,000. The amount I choose may differ from the most some other subject would pay to receive the ticket.
Suppose the buyer decides to offer X for the lottery. He would print ‘X’ in the box in step one [here theexperimenter entered an ‘X’ in the “my offer” box]. Next, the previously generated fixed offer will be revealed.

38
You should keep track of your accumulated payments at the bottom of the sheet. Your
earnings, which are yours to keep, are all accumulated payments from rounds 1 through 14 and the
outcome from round 15. These will be paid to you in cash after the experiment. [Your earnings,
which are yours to keep, will be paid to you in cash after the experiment.] To receive your
earnings, please take the laminated card you received at the beginning of the experiment to Maria
in Room 416 of the Law School. There you will be able to exchange your identification card for an
envelope containing your earnings. Note that the experimenter will not be able to link any specific
subject to a subject identification number. Therefore the experimenter will not know subject
The fixed offers are in no way connected to your offer or the value of the item. It is literally as if dice were rolled
to determine the fixed offer. In order to assure you that the fixed offers are completely unrelated to your offers or yourpersonal value of the item, the fixed offers were generated before the start of the experiment using a random numbertable. Such a table is designed to ensure that the results are unpredictable. If anyone is interested, on the board you canfind the frequency chart for the first 200 digits of the random number table used to generate fixed offers [experimenterexplained the table to the subjects]. Also, if anyone is interested in how we generated the fixed offers, please see meafter the experiment is complete, and I will explain the process to you in detail.
Now, back to the example. Suppose the fixed offer is 501. The buyer should record this value in the box in steptwo [experimenter recorded the fixed offer on the board]. Next, the lottery result will be determined [the experimenterexplained how the marbles will be used to determine the result and uses the marbles to determine the lottery resulthere].
Here the lottery result is _______. So, the buyer should circle _______ in step 3 [experimenter circled theappropriate outcome].
In step 4, each buyer will calculate his round payment. In this example, assume the offer of X is more than thefixed offer of 501. He needs to complete only the left hand column in step 4. He buys the lottery ticket. His roundpayment is equal to the lottery result from step 3 minus the fixed offer, 501. Therefore, his round payment is ________[experimenter filled in the appropriate blanks on the board].
Alternatively, suppose the buyer offers X, but the fixed offer is 975. Because his offer is less than the fixed offer,he does not buy the item. He has to fill in only the right hand column in step 4. His round payment is $0 [experimenterfilled in the appropriate blanks on the board].
Please tear the first page of your packet off the staple at the bottom of the packet and flip to page two. This is theseller information and record sheet.
Consider the seller’s task. She owns the ticket at the beginning of the round. Let’s say the lottery provides a 70%chance of receiving 1,000 and a 30% chance of receiving 1,000. She must decide the minimum she is willing to receivein exchange for the ticket. Suppose she offers 1,000 (experimenter explains why the subject should be indifferentbetween the ticket and 1,000). She should print ‘1,000’ in the box in step 1 [experimenter entered ‘1,000’ in the ‘myoffer’ box]. Suppose the fixed offer is 950 and the lottery result is ______[experimenter filled in the appropriate blankon the board and circled the appropriate lottery outcome]. After filling in the appropriate information for steps 2 and 3,she needs to calculate her round payment. In this example, her offer is more than the fixed offer; therefore, she does notsell. She only needs to fill in the right hand column in step 4. She receives the lottery result [experimenter filled in theappropriate blank on the board].
Alternatively, suppose the fixed offer is 1,020. Her offer is now less than the fixed offer; therefore, she sells. Sheonly needs to fill out the left hand column in step 4. Her round payment is equal to the fixed offer. [experimenter filledin the appropriate blank on the board]”
After discussing the examples, the experimenter encouraged and addressed questions from subjects. After answeringquestions, the experimenter drew the subjects’ attention back to the instructions.

39
payoffs by individual. Also, Maria will not know the amount of any subject’s payoff. The payoffs
will be given to Maria in envelopes identified with subject numbers. Obtaining your envelope will
end your participation in the experiment.
Before we begin, note that the first several rounds involve relatively small payoffs. These
rounds are intended to give you practice before you get to the rounds involving significant payoffs.

40
A3.3 Sample Buyer Record Sheet
The experimenter owns one Round 4 lottery ticket. I will offer the buy the lottery ticket for an amount equal to the
maximum I am willing to pay for the ticket.
Round 4 LOTTERY
Step 1: decide on my offer MY OFFER
Step 2: listen for fixed offer FIXED OFFER
announcement
Step 3: circle the lottery result
A B
$ 0.30 $ 0.30
Step 4: how much did you make? (FILL IN ONE SIDE ONLY)
If MY OFFER is more than FIXED OFFER If MY OFFER is less than FIXED OFFER
then, I BUY then, I DO NOT BUY
(lottery result from step 3) I get:
minus
(fixed offer from step 2)
equals
(the amount I get)
Money made in previous rounds __________
+ / - Money made (lost) in this round __________
= Total (copy to the next page) __________
50% 50%chance of chance of A B $ 0.30 $ 0.30
$ 0.00

41
A3.4 Sample Seller Record Sheet
I own one Round 1 lottery ticket. I will offer to sell the lottery ticket for an amount equal to the minimum I am willing
to accept in exchange for the ticket.
Round 1 LOTTERY
Step 1: decide on my offer MY OFFER
Step 2: listen for fixed offer FIXED OFFER
announcement
Step 3: circle the lottery result
A B
$ 0.20 $ 0.20
Step 4: how much did you make? (FILL IN ONE SIDE ONLY)
If MY OFFER is less than FIXED OFFER If MY OFFER is more than FIXED OFFER
then, I SELL then, I DO NOT SELL
I get: I get:
(fixed offer from step 2) (lottery result from step 3)
Money made in previous rounds __________
+ / - Money made (lost) in this round __________
= Total (copy to the next page) __________
50% 50%chance of chance of A B $ 0.20 $ 0.20
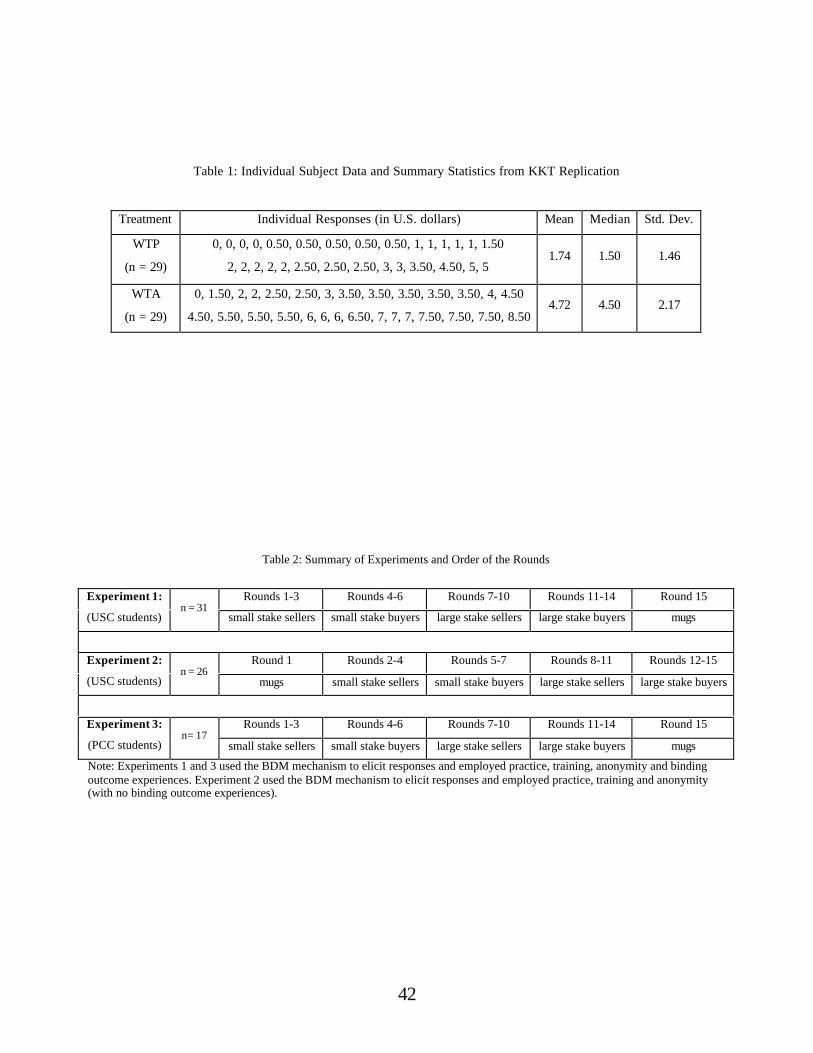
42
Table 1: Individual Subject Data and Summary Statistics from KKT Replication
Treatment Individual Responses (in U.S. dollars) Mean Median Std. Dev.
WTP
(n = 29)
0, 0, 0, 0, 0.50, 0.50, 0.50, 0.50, 0.50, 1, 1, 1, 1, 1, 1.50
2, 2, 2, 2, 2, 2.50, 2.50, 2.50, 3, 3, 3.50, 4.50, 5, 51.74 1.50 1.46
WTA
(n = 29)
0, 1.50, 2, 2, 2.50, 2.50, 3, 3.50, 3.50, 3.50, 3.50, 3.50, 4, 4.50
4.50, 5.50, 5.50, 5.50, 6, 6, 6, 6.50, 7, 7, 7, 7.50, 7.50, 7.50, 8.504.72 4.50 2.17
Table 2: Summary of Experiments and Order of the Rounds
Rounds 1-3 Rounds 4-6 Rounds 7-10 Rounds 11-14 Round 15Experiment 1:
(USC students)n = 31
small stake sellers small stake buyers large stake sellers large stake buyers mugs
Round 1 Rounds 2-4 Rounds 5-7 Rounds 8-11 Rounds 12-15Experiment 2:
(USC students)n = 26
mugs small stake sellers small stake buyers large stake sellers large stake buyers
Rounds 1-3 Rounds 4-6 Rounds 7-10 Rounds 11-14 Round 15Experiment 3:
(PCC students)n= 17
small stake sellers small stake buyers large stake sellers large stake buyers mugs
Note: Experiments 1 and 3 used the BDM mechanism to elicit responses and employed practice, training, anonymity and bindingoutcome experiences. Experiment 2 used the BDM mechanism to elicit responses and employed practice, training and anonymity(with no binding outcome experiences).
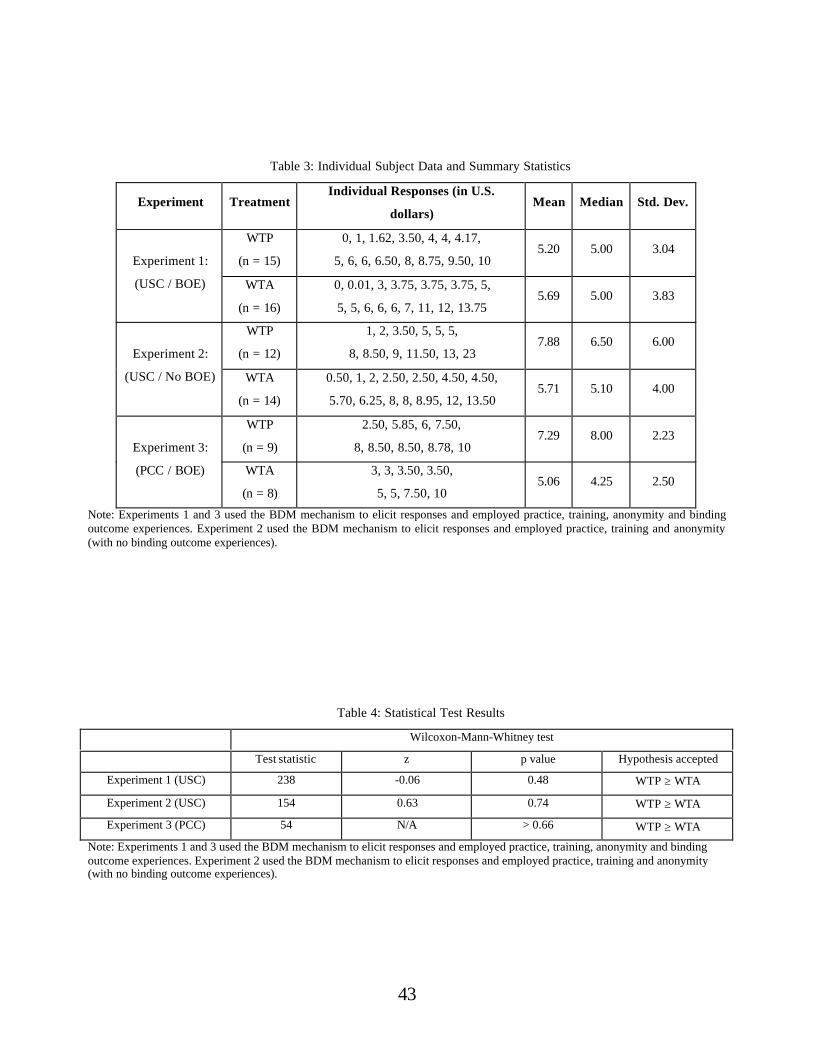
43
Table 3: Individual Subject Data and Summary Statistics
Experiment TreatmentIndividual Responses (in U.S.
dollars)Mean Median Std. Dev.
WTP
(n = 15)
0, 1, 1.62, 3.50, 4, 4, 4.17,
5, 6, 6, 6.50, 8, 8.75, 9.50, 105.20 5.00 3.04
Experiment 1:
(USC / BOE) WTA
(n = 16)
0, 0.01, 3, 3.75, 3.75, 3.75, 5,
5, 5, 6, 6, 6, 7, 11, 12, 13.755.69 5.00 3.83
WTP
(n = 12)
1, 2, 3.50, 5, 5, 5,
8, 8.50, 9, 11.50, 13, 237.88 6.50 6.00
Experiment 2:
(USC / No BOE) WTA
(n = 14)
0.50, 1, 2, 2.50, 2.50, 4.50, 4.50,
5.70, 6.25, 8, 8, 8.95, 12, 13.505.71 5.10 4.00
WTP
(n = 9)
2.50, 5.85, 6, 7.50,
8, 8.50, 8.50, 8.78, 107.29 8.00 2.23
Experiment 3:
(PCC / BOE) WTA
(n = 8)
3, 3, 3.50, 3.50,
5, 5, 7.50, 105.06 4.25 2.50
Note: Experiments 1 and 3 used the BDM mechanism to elicit responses and employed practice, training, anonymity and bindingoutcome experiences. Experiment 2 used the BDM mechanism to elicit responses and employed practice, training and anonymity(with no binding outcome experiences).
Table 4: Statistical Test Results
Wilcoxon-Mann-Whitney test
Test statistic z p value Hypothesis accepted
Experiment 1 (USC) 238 -0.06 0.48 WTP ≥ WTA
Experiment 2 (USC) 154 0.63 0.74 WTP ≥ WTA
Experiment 3 (PCC) 54 N/A > 0.66 WTP ≥ WTA
Note: Experiments 1 and 3 used the BDM mechanism to elicit responses and employed practice, training, anonymity and bindingoutcome experiences. Experiment 2 used the BDM mechanism to elicit responses and employed practice, training and anonymity(with no binding outcome experiences).

44
Table 5: All studies included in Figure 1
Experiment Issue UnderInvestigation
Commodity Subject Pool Cash tobuyers
MeasurementTechnique
1 Knetsch et al.(1984) Test 1
Does the WTP-WTA gappersist in thelab?
Lottery forgoods worth $70or $50 cash
Students No, butcreditarranged
χχ2 on # withWTP/WTA atmore/less than $2
2 Knetsch et al.(1984) Test 2
What happensif subjects areprovided withexperience?
Lottery forgoods worth $15or $10 cash
Students No, butcreditarranged
χχ2 on # withWTP/WTA atmore/less than $2
3 Knetsch et al.(1984) Test 3
Robustnesscheck:Differentsubjects
Lottery forgoods worth $70or $50 cash
Part-timeexecutiveprogramstudents
$3 χχ2 on # withWTP/WTA atmore/less than $3
4 Knetsch et al.(1984) Test 4
Robustnesscheck: Differentparameters
Lottery for goodsworth $70 or $50cash
Part-timeexecutiveprogramstudents
$2, $3 or $4 χ2 on # withWTP/WTA atmore/less than setamount
5 Coursey et al.(1987) Part 1
Effect ofelicitationmechanism onthe WTP-WTAgap
Right to avoidbitter tastingliquid
Undergradbusinessstudents
None One-tailed ranksum test
6 Coursey et al.(1987) Part 2
Effect ofelicitationmechanism onthe WTP-WTAgap
Right to avoidbitter tastingliquid (studentssampled)
Undergradbusinessstudents
None One-tailed ranksum test
7 Coursey et al.(1987) Part 3
Effect ofelicitationmechanism onthe WTP-WTAgap
Right to avoidbitter tastingliquid
Undergradbusinessstudents
$10 One-tailed ranksum test
8 Knez et al.(1985) Series II
Are individualrevealedpreferences inmarket contextsmore likely tobe “rational”than individualchoices amongalternativeprospects?
Asset whosedividendprobabilitydistribution iscommonknowledge
Unspecified Everyonereceived cashand securities
Unspecified

45
9 Brookshire etal. (1987)
Effect ofdifferentelicitationdevices
Increase in parktree density
Residentsnear park
N/A Unspecified
10 Brookshire etal. (1987)
Effect ofdifferentelicitationdevices
Increase in parktree density
Residentsnear park
N/A Unspecified
11 Brookshire etal. (1987)
Effect ofdifferentelicitationdevices
Increase in parktree density
Residentsnear park
Everyonereceived$15; inadditionsome buyersreceivedadditional$15 or $30
Unspecified
12 Harless (1989) Effect of truthfulrevelationmechanism andannouncingdominantstrategy tosubjects
Lottery tickets(some withexpected value >0, some withexpected value <0)
Unspecified Everyonereceived $10and lotterytickets
Nonparametrictest (sign test) onratio ofWTP:WTA(within subjectcomparisons)
13 Knetsch (1989)Test 1
Direct test ofreversibility ofindifferencecurves
Mugs and candy Students N/A Observation ofproportionwanting to trade
14 Knetsch (1989)Test 2
Test ofsymmetry ofexchangepreferences
1/2 given 2candy barsworth $2 each;1/2 given cash
Economicsstudents
N/A χχ2 test
15 Kahneman et al.(1990)Experiments1&2
Test for subjectunderstanding ofthe mechanism
Induced-valuetokens
Advancedundergrad lawandeconomicsstudents
No, but creditarranged
If number oftrades was lessthan ½, thenWTP-WTA gapreported
16 Kahneman etal. (1990)Experiments1&2
To establishbaseline andtest of effect ofthe commodityon results
Mugs and pens(price tagsvisible on pens)
Advancedundergradlaw andeconomicsstudents
No, butcreditarranged
If number oftrades was lessthan ½, thenWTP-WTA gapreported
17 Kahneman et al.(1990)Experiment 3
To test forsubjectunderstanding ofthe mechanism
Induced-valuetokens
Undergradeconomicsstudents
None (buyersused ownmoney tobuy)
If number oftrades was lessthan ½, thenWTP-WTA gapreported

46
18 Kahneman etal. (1990)Experiment 3
Does the listelicitationmethod affectthe result?
Pens Undergradeconomicsstudents
None(buyers usedown moneyto buy)
If number oftrades was lessthan ½, thenWTP-WTA gapreported
19 Kahneman et al.(1990)Experiment 4
Test for subjectunderstanding ofthe mechanism
Induced-valuetokens
Undergradeconomicsstudents
None (buyersused ownmoney tobuy)
If number oftrades was lessthan ½, thenWTP-WTA gapreported
20 Kahneman etal. (1990)Experiment 4
Effect ofbinding rounds
Pens Undergradeconomicsstudents
None(buyers usedown moneyto buy)
If number oftrades was lessthan ½, thenWTP-WTA gapreported
21 Kahneman et al.(1990)Experiment 5
Test for subjectunderstanding ofthe mechanism
Induced-valuetokens
Businessstatisticsstudents
None (buyersused ownmoney tobuy)
If number oftrades was lessthan ½, thenWTP-WTA gapreported
22 Kahneman etal. (1990)Experiment 5
Test whethersubjectsmisstate truepreferences inan attempt tomanipulate theclearing price
Mugs Businessstatisticsstudents
None(buyers usedown moneyto buy)
If number oftrades was lessthan ½, thenWTP-WTA gapreported
23 Kahneman etal. (1990)Experiments6&7
Exp 6: Is gapcaused byreluctance tosell orreluctance tobuy (control forwealth effects)Exp 7: Doesleaving pricetag on the goodmatter?
Mug (price tagsleft on mugs forexperiment 7)
Undergradstudents
None(buyers usedown moneyto buy)
If number oftrades was lessthan ½, thenWTP-WTA gapreported
24 Singh (1991) Does learningthrough amarket reducethe WTP-WTAgap?
Lottery ticket:(1/2, $1, 1/2 $2)
Civilservants
$3 OR 2lotterytickets OR$1.50 + 1lottery ticket
Dixon and Moodsign test(nonparametric)
25 Singh (1991) Does learningthrough amarket reducethe WTP-WTAgap?
Lottery ticket:(1/2, $1, 1/2 $2)
Grad/undergradstudents
$3 OR 2lottery ticketsOR $1.50 + 1lottery ticket
Dixon and Moodsign test(nonparametric)

47
26 Singh (1991) Does learningthrough amarket reducethe WTP-WTAgap?
Lottery ticket:(1/2, $1, 1/2 $2)
Civil servantsAND grad/undergradstudents
$3 OR 2lottery ticketsOR $1.50 + 1lottery ticket
Dixon and Moodsign test(nonparametric)
27 Boyce et al.(1992)
Why dohypotheticalenvironmentalsurvey resultsdiffer from labresults?
Norfolk Islandpine tree
Universitystaffmembers
Buyersendowedwith $40;sellers withtree + $30
Nonparametrictests (Wilcoxonrank sum)
28 Ortona et al.(1992)Experiment 2
How do timeandpsychologicalattachment fromownership affectthe WTP-WTAgap? Doesnecessitymatter?
(1) $35 credit forbookstore(necessary goodfor students)(2) militarycoffee table book(unnecessarygood)
Students Every subjectacted as seller
t test and Cochrantest for differencebetween meansand F-test
29 Dubourg et al.(1994)
What is theeffect ofimprecisepreferences onthe WTP-WTAgap?
Increased roadsafety
Randomsample ofpublic
No Observation ofannouncementsby subjects andratios ofWTA:WTP
30 Loewenstein etal. (1994)
Do people valueobjects morehighly whenthey obtainthem due toexemplaryperformance ata task?
Mugs Students inexecutiveeducationclasses
N/A t tests andANOVA
31 Loewenstein etal. (1994)
Do people valueobjects morehighly whenthey obtain themdue toexemplaryperformance at atask?
Mugs Students inexecutiveeducationclasses
N/A t tests andANOVA

48
32 Shogren et al.(1994)Experiment 1(withoutexperience)
Does degree ofsubstitutiondrive the WTP-WTA gap?
Candy bars(market good)
Undergradand gradstudentsrecruitedcampus-wide
Buyersendowedwith inferiorgood + cash
One-tailed t test;Mann-Whitney Utest(nonparametric)
33 Shogren et al.(1994)Experiment 1(withexperience)
Does degree ofsubstitutiondrive the WTP-WTA gap?
Candy bars(market good)
Undergradand gradstudentsrecruitedcampus-wide
Buyersendowedwith inferiorgood + cash
One-tailed t test;Mann-Whitney Utest(nonparametric)
34 Shogren et al.(1994)Experiment 1
Does degree ofsubstitutiondrive the WTP-WTA gap?
Safer food (non-market good)
Undergradand gradstudentsrecruitedcampus-wide
Buyersendowedwith inferiorgood + cash
One-tailed t test;Mann-Whitney Utest(nonparametric)
35 Shogren et al.(1994)Experiment 2
Does degree ofsubstitutiondrive the WTP-WTA gap?
High qualityschool mug andlow qualityplastic mug
Undergradand gradstudentsrecruitedcampus-wide
Buyersendowedwith inferiorgood + cash
One-tailed t test;Wilcoxon rank-sum test(nonparametric)
36 Shogren et al.(1994)Experiment 2
Does degree ofsubstitutiondrive the WTP-WTA gap?
High qualityschool mug andlow qualityplastic mug
Undergradand gradstudentsrecruitedcampus-wide
Buyersendowedwith inferiorgood + cash
One-tailed t test;Wilcoxon rank-sum test(nonparametric)
37 Franciosi et al.(1996)Experiment 1
Effect on WTP-WTA gap ofelimination ofbuyer/seller/price language?
Mugs (price tagremoved)
Unspecified Buyersearnedmoney fromprevious exp($8.75 to$44.50)
t test
38 Morrison (1997)Part 1
Do wealtheffects matter?
Candy (subjectstold they couldpurchase thecandy at a shopnearby for 33pence)
Experimentaleconomicsstudents
4 pounds toevery subject(show up fee)
Mann-Whitney Utest and t test
39 Morrison(1997) Part 2
Do wealtheffects matter?
Mugs (subjectstold they couldpurchase themug nearby for1.90 pounds)
Buyers fromPart 1becamesellers andsellers fromPart 1becamebuyers
Cash equalto meanWTA valuefromanotherexperiment
Mann-Whitney Utest and t test

49
40 Bateman et al.(1997)Experiment 1
Does incentivecompatibleelicitationdevice changeresults?
Coke (familiargood)
Undergradsand post-docs
All subjectsendowedwith goodsand cash
Unspecified
41 Bateman et al.(1997)Experiment 2
Does incentivecompatibleelicitationdevice changeresults?
Premiumchocolate candy(unfamiliargood)
Undergradsand post-docs
All subjectsendowedwith goodsand cash
Unspecified
42 Arlen et al.(2000)
Is the WTP-WTA gap robustto agencyrelationship?
Mugs (with pricetags)
First year lawstudents
$5 to allsubjects
random-effectslogit model
43 Shogren et al.(2001)
What is theimpact ofdifferentauctionmechanisms onthe WTP-WTAgap?
Candy bars andmugs (no pricetags)
Students $15 to allbuyers
t test and Mann-Whitney U test
44 Shogren et al.(2001)
What is theimpact ofdifferent auctionmechanisms onthe WTP-WTAgap?
Candy bars andmugs (no pricetags)
Students $15 to allbuyers
t-tests and Mann-Whitney U-test
45 Bateman et al.(2002)
Do subjects feelloss aversionwith respect topotentialmoney outlays?
Vouchers forluxurychocolates (easyto get fromstore); samplechocolates weredisplayed
Undergrads No; subjectsrequired tobring cashbut did nothave tospend it
Mann-Whitney Utest on ratio ofWTA/WTP usinggeometric means
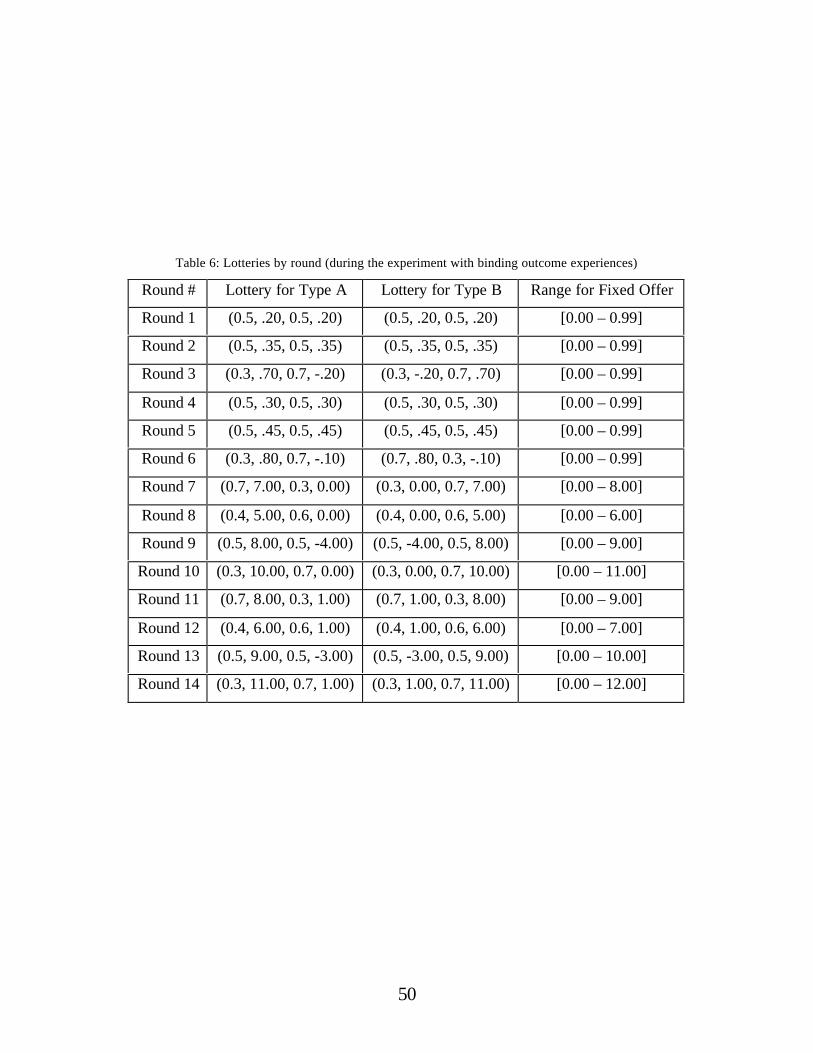
50
Table 6: Lotteries by round (during the experiment with binding outcome experiences)
Round # Lottery for Type A Lottery for Type B Range for Fixed Offer
Round 1 (0.5, .20, 0.5, .20) (0.5, .20, 0.5, .20) [0.00 – 0.99]
Round 2 (0.5, .35, 0.5, .35) (0.5, .35, 0.5, .35) [0.00 – 0.99]
Round 3 (0.3, .70, 0.7, -.20) (0.3, -.20, 0.7, .70) [0.00 – 0.99]
Round 4 (0.5, .30, 0.5, .30) (0.5, .30, 0.5, .30) [0.00 – 0.99]
Round 5 (0.5, .45, 0.5, .45) (0.5, .45, 0.5, .45) [0.00 – 0.99]
Round 6 (0.3, .80, 0.7, -.10) (0.7, .80, 0.3, -.10) [0.00 – 0.99]
Round 7 (0.7, 7.00, 0.3, 0.00) (0.3, 0.00, 0.7, 7.00) [0.00 – 8.00]
Round 8 (0.4, 5.00, 0.6, 0.00) (0.4, 0.00, 0.6, 5.00) [0.00 – 6.00]
Round 9 (0.5, 8.00, 0.5, -4.00) (0.5, -4.00, 0.5, 8.00) [0.00 – 9.00]
Round 10 (0.3, 10.00, 0.7, 0.00) (0.3, 0.00, 0.7, 10.00) [0.00 – 11.00]
Round 11 (0.7, 8.00, 0.3, 1.00) (0.7, 1.00, 0.3, 8.00) [0.00 – 9.00]
Round 12 (0.4, 6.00, 0.6, 1.00) (0.4, 1.00, 0.6, 6.00) [0.00 – 7.00]
Round 13 (0.5, 9.00, 0.5, -3.00) (0.5, -3.00, 0.5, 9.00) [0.00 – 10.00]
Round 14 (0.3, 11.00, 0.7, 1.00) (0.3, 1.00, 0.7, 11.00) [0.00 – 12.00]

Not Incentive Compatible
2 7
16
23
Other IC Mechanisms
Vickrey BDM Sealed Bid One Price Double Auction
4
17
10
34
8
33 39
38
32
13
24
9
6
5
3 1
45
37
26
36
35
19
21
42
28
30
PZ 1
PZ 3
41
27
31
40
22
14
PZ 2
Prac Train
None Prac Train
None Prac Train
None Prac Train
None Prac Train
None
29
25
11
BINDING OUTCOME EXPERIENCES
NO BINDING OUTCOME EXPERIENCES
18
20
15
44
12
43
FIGURE 1


