Recent Trends in Sturctural Integrity Assessmwk, Eds.: V.R. Ranganath, S. Tarafder, A. Bahadur, 18-19 January 2001, National Metallurgical Laboratory, Jamshedpur. India, pp.185-202. Non-Destructive Techniques for Microstructural and Structural Characterisation D.K. BHATTACHARYA National Metallurgical Laboratory, Jamshedpur-831 007 ABSTRACT The functional quality of a material or a component is influenced by (i) microstructure (ii) flaws (physical discontinuities like cracks, pores, delaminations etc.), and (iii) the presence of stress. Non-destructive evaluation (NDE) techniques are used to control and enhance the quality at various stages of the life cycle of a material or component. In this paper, various NDE techniques are discussed. The techniques mainly discussed are ultrasonics, radiography, X-ray techniques, and acoustic emission . The principles, procedures, advantages, and limitations of each technique, as well as applications in various materials are considered. INTRODUCTION Figure 1 showing the various dimensions of microstructural and structural features that may be present in a material or component in various combinations of types, sizes and shapes is well cited [ 1,2]. Figure . 2 shows the NDT techniques that are possible in various dimension domains [1,2]. Table 1 shows what are the material properties that the various features in Fig . 1 affect and what are the possible NDE techniques that can be used to determine or estimate the material properties [3]. 5 islo esfu A I C n st 1 s I n A slam a elm Cnx C k L. II I It Gl e Y - t w o e o : (.UM) to (t ) 1o (lam) i DIMENSION (m) Fig. 1: Dimensions of various microstructural and structural features 185
Transcript
Recent Trends in Sturctural Integrity Assessmwk, Eds.: V.R. Ranganath, S. Tarafder, A. Bahadur,18-19 January 2001, National Metallurgical Laboratory, Jamshedpur. India, pp.185-202.
Non-Destructive Techniques for Microstructural andStructural Characterisation
D.K. BHATTACHARYA
National Metallurgical Laboratory, Jamshedpur-831 007
ABSTRACT
The functional quality of a material or a component is influenced by (i)microstructure (ii) flaws (physical discontinuities like cracks, pores,delaminations etc.), and (iii) the presence of stress. Non-destructive evaluation(NDE) techniques are used to control and enhance the quality at various stagesof the life cycle of a material or component. In this paper, various NDEtechniques are discussed. The techniques mainly discussed are ultrasonics,radiography, X-ray techniques, and acoustic emission . The principles,procedures, advantages, and limitations of each technique, as well asapplications in various materials are considered.
INTRODUCTION
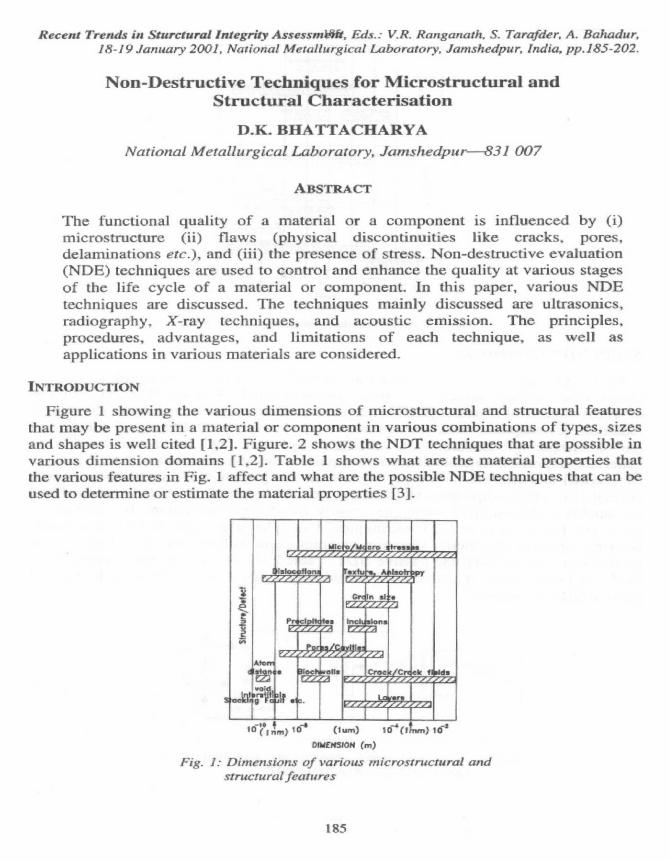
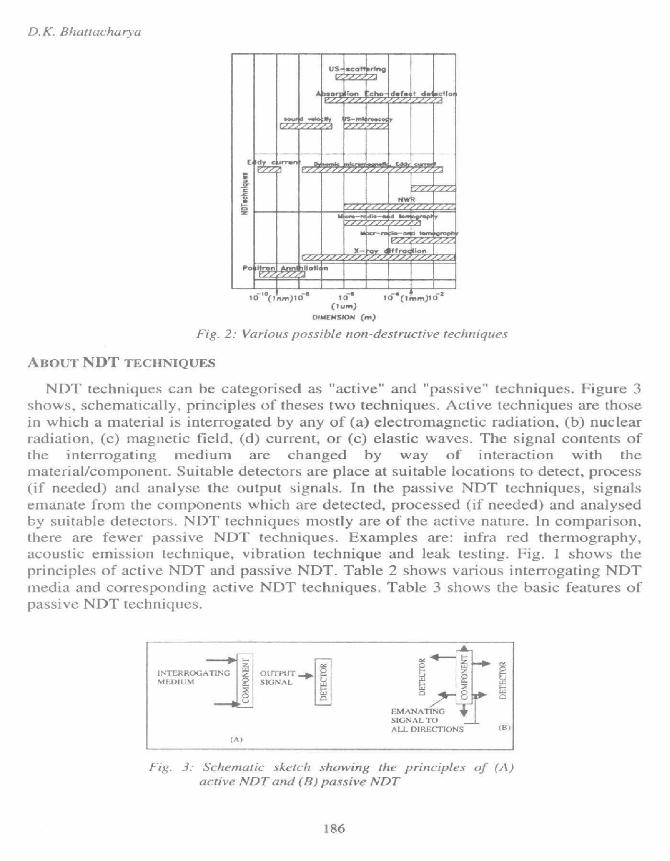
Figure 1 showing the various dimensions of microstructural and structural featuresthat may be present in a material or component in various combinations of types, sizesand shapes is well cited [ 1,2]. Figure . 2 shows the NDT techniques that are possible invarious dimension domains [1,2]. Table 1 shows what are the material properties thatthe various features in Fig . 1 affect and what are the possible NDE techniques that can beused to determine or estimate the material properties [3].
5
islo esfu A I
C n st
1 s I n
Aslam a elm Cnx C k L.
II IIt Gl eY -
t wo eo :(.UM) to (t ) 1o(lam) iDIMENSION (m)
Fig. 1: Dimensions of various microstructural andstructural features
185
D. K. Bliattacharva
US
o
se Anq
ton cho der t di cfloel
_ I
E AY rten ...k .e [aT
sM "a0
X- a it rv line '.
Po 1 11-11 nI
I
10Ia(tAm)IO-° lis, 10'a (tenm)IDz(tum)
DIMENSION (m)
Fig. 2: Various possible non-destructive techniques
ABOUT NDT TECHNIQUES
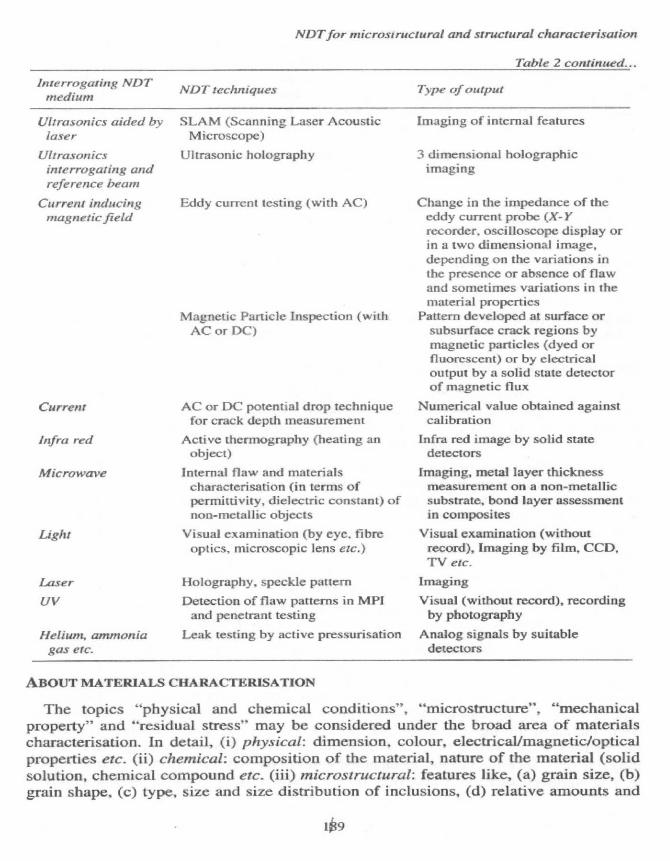
NDT techniques can be categorised as "active" and "passive" techniques. Figure 3shows, schematically, principles of theses two techniques. Active techniques are those
in which a material is interrogated by any of (a) electromagnetic radiation, (b) nuclearradiation, (c) magnetic field, (d) current, or (c) elastic waves. The signal contents ofthe interrogating medium are changed by way of interaction with the
material/component. Suitable detectors are place at suitable locations to detect, process(if needed) and analyse the output signals. In the passive NDT techniques, signals
emanate from the components which are detected, processed (if needed) and analysedby suitable detectors. NDT techniques mostly are of the active nature. In comparison,there are fewer passive NDT techniques. Examples are: infra red thermography,
acoustic emission technique, vibration technique and leak testing. Fig. 1 shows the
principles of active NDT and passive NDT. Table 2 shows various interrogating NDT
media and corresponding active NDT techniques. Table 3 shows the basic features ofpassive NDT techniques.
INTERROGATING I z, OUTPUTMEDIUM SIGNAL
IA)
r
EMANATINGSIGNAL TOAL.I. DIRECTIONS 1131
Fig. 3: Schematic sketch showing the principles of (A)active NDT and (B) passive NDT
186
NDTfor microstructural and structural characterisation
Table 1: Microstructural and substructural features affecting material properties and the possibleNDE techniques to determine and estimate the latter
Component Ultrasonic reflectionfailures through and diffraction,crack growth changes in magnetic
flux patterns,changes in electricalpaths
Changes in heat flowpatterns, localvariation of density
Through thickness Guiding of ultrasoniccrack growth waves, variation inresistance heat transfer paths,
spatial variation ofdensity
Possible NDE technique
Ultrasonic flaw detection(A-scan, B-scan and C-scan), magnetic fluxleakage technique, electricpotential drop technique,radiography, acousticemission, eddy currenttesting
Ultrasonic Raleigh waveand other surface specificwaves, ultrasonic C-scan,infrared thermography,microfocal radiography
Table 2; Various interrogating NDT media and the corresponding active NDT techniques
Detection of flaw patterns in MPIand penetrant testing
Helium, ammonia Leak testing by active pressurisationgas etc.
ABOUT MATERIALS CHARACTERISATION
Imaging of internal features
3 dimensional holographicimaging
Change in the impedance of theeddy current probe (X-Y
recorder, oscilloscope display orin a two dimensional image,depending on the variations inthe presence or absence of flawand sometimes variations in thematerial properties
Pattern developed at surface orsubsurface crack regions bymagnetic particles (dyed orfluorescent) or by electricaloutput by a solid state detectorof magnetic flux
Numerical value obtained against
cal ibraticin
Infra red image by solid statedetectors
Imaging, metal layer thicknessmeasurement on a non -metallicsubstrate , bond layer assessmentin composites
Visual examination (withoutrecord ), Imaging by film, CCD,TV etc.
Imaging
Visual ( without record), recordingby photography
Analog signals by suitabledetectors
The topics "physical and chemical conditions", "microstructure", "mechanicalproperty" and "residual stress" may be considered under the broad area of materialscharacterisation. In detail, (1) physical: dimension, colour, electrical/magnetic/opticalproperties etc. (ii) chemical: composition of the material, nature of the material (solidsolution, chemical compound etc_ (iii) microstructural: features like, (a) grain size, (b)grain shape, (c) type, size and size distribution of inclusions, (d) relative amounts and
109
D.K. Bhattacharva
morphologies of various phases, (e) dislocation substructure, (f) crystallographic andgrain orientation characteristics (texture ) ( iv) mechanical : ( a) properties like yieldstrength, toughness, fatigue, creep etc. Mechanical properties are functions ofmicrostructure and chemical characteristics , (b) Residual stress at the micro ( withinone or two grains) and macro level (over several grains).
Table 3: Basic features of passive NDT techniques
Emanating ,nediunn NUT technique Detection and output
Acoustic waves due to defect Acoustic Piezoelectric crystals, (restricted ) capacitive(crack) propagation emission- transducer and holographic interferometry(I OQkH<'.- I MHz)
Acoustic wave due to leakage Leak testing Ultrasonic/Accelerometerof fluid
Infra red waves Thermography 2 dimensional imaging
Displacement (as well as Vibration Piezoelectric accelerometer.force) Laser interferometry
NON-DESTRUCTIVE TECHNIQUES FOR MICROSTRUCTURE
It is well known that microstructure influence material properties - mechanical,chemical and physical. A component performs well, if the designed microstructure isappropriate for the service conditions and no microstructural changes take place inservice that are inadequate under the given service conditions.
Traditionally, microstructure has been characterised by optical micrography (OM),scanning electron micrography (SEM), and transmission electron microscopy (TEM)_More recently , acoustic microscopy has been introduced for certain applications inwhich knowledge of the substructures is desired. Specialised microscopy techniquessuch as scanning tunnelling microscopy , atomic force microscopy etc. are not yetrelevant for general industrial use.
OM, SEM, and TEM are normally used on small specimens and in the laboratory.
TEM often requires very involved procedures for specimen preparation and complexanalysis of data. Portable optical microscopes are available which can be used on largecomponents. However, they can give only modest magnifications.
Replica technique has been developed that can be used for obtaining microstructurefrom actual components by examining the replicas in optical and scanning electron
microscope. The replicas of the etched contour of a metallographically preparedsurface of an actual component are made into cellulose acetate films . Possibilities ofreplica technique for carbide extraction from the surface of an actual component hasbeen indicated in the literature but no actual example are available. Since themicrostructures are strong functions of thereto mechanical conditions experienced by amaterial , and since the thermo mechanical conditions may vary from region to regionof a component , there is a necessity of the availability of suitable NDT techniques
190
NDTfor microstructural and structural characterisation
which can be used to quickly cover the whole surface and volume of a componentwithout being destructive . While this is the situation which is desired , the use of NDTtechnique(s) is beset with the problem arising from an absence of well understoodrelationships with the NDT parameters on the one hand , and the microstructuralfeatures on the other.
Ultrasonic and magnetic techniques form two of the most important classes ofNDT&E techniques, which are used extensively for defect detection /assessment andare presently being developed for materials characterisations for component lifeassessment . They have high sensitivities and simplicity of operation-
Grain size and mechanical properties in metallic materials - Hall-Petcfi relationship
The Hall-Petch relation is a semi-empirical relation concerning the yield stress, 6y,and the grain size, d, of polycrystalline materials. It was discovered by Hall [4] andPetch [5] that the yield stress of steel is enhanced by a decrease in grain size and thatthis enhancement is characterised by a scaling law,
cry =ao+Kd-'r2 ...(l)
where K is a constant of proportionality, d is the average measured grain diameter and
M is a constant offset of the scaling law often called a friction stress. point (or loweryield stress vs. averaged grain diameter to the -1/2 power. Hall demonstrated therelationship for mild steel [4]. Petch demonstrated the relationship for ingot iron, mildsteel and spectrographic iron [5]. Since then, the Hall-Petch relation has been very
successful and has been found to hold for many different materials. The most common
explanation of the Hall-Petch relation comes from the theory of dislocation pileups [6].Alternate explanation is also available [6]. Apart from yield strength, similar
relationships have also been found with impact toughness, tensile strength and
hardness. Sometimes, Hall Petch relationship has been found to be valid fordislocation cell size also. No report is available validating the relationship in ceramicsand non-metallic composites.
Ultrasonic parametersfor grain size and other material parameters
There are two broad classes of ultrasonic parameters, which are useful for NDT formaterials characterisation, namely (i) Ultrasonic attenuation and (ii) Ultrasonicvelocity [7].
Ultrasonic velocity
The velocity v of an elastic wave like ultrasonic wave can be expressed in thefollowing manner. v = (M/p)"12 where p is the density and M is an appropriatecombination of elastic moduli for the type of wave being propagated- For longitudinalwave in an isotropic body M can be expressed as:
ML = E(1- ICAO + €)(1!-2€)^„ where E is Young's modulus and € is the Poisson's ratio.
For shear waves, we have M5 = Ell 2(l + €) ]' = G, wfrere G ia. i shear modulus.
191
D.K. Bhattachan.'a
It is then clear that whatever microstructural features affect the modulus of a
material would affect the ultrasonic velocity. Examples are residual stress, presence ofsecond phase particles particularly cavities and porosities [8].
Ultrasonic attenuation
Elastic waves propagating through an unbounded medium can be expressed as planewaves as follows:
A = A0 exp [i (kx - alt)]exp where A is the amplitude , A0 is an initial amplitude
at x = 0 and t = 0, a is the attenuation coefficient , k is the propagation constant which
can be expressed as k = 271/A = 27cf/v where the term 27if is the angular frequency w. A.
is the wavelength , f is the frequency , and v is the velocity.
The attenuation of ultrasonic waves when it passes through a polycrystalline
material is mainly due to two effects , namely ( i) absorption and (ii ) scattering. Both
take the energy out of the beam thus resulting in the exponential decay exp (-(Xx). Themain contribution to scattering comes from the grain boundaries . The following
equations are available relating scattering coefficient , grain size and the test frequency.
Raleigh region : For A, >> 27t D, where D is the average grain diameter, the following
equation is applicable
a = Bj Tu2 , where B1 is a coefficient involving the longitudinal and shear wave
velocities , ,u is the elastic anisotropy of a single grain, T is the appropriate weightedaverage volume of the grains in the specimen , and f is the test frequency.
Stochastic region : For A < 27cD but still not reaching the condition A <<D, theattenuation can be expressed as follows.
a = B2D Y ...(2)
Diffusion region : For A << D, the attenuation is independent of frequency and can
be expressed as
a=Bj/D ...(3)
There are several reports on the success of the use of ultrasonic attenuation toestimate the grain size and other mechanical properties.[16-19J
Ultrasonic resonance
Resonance is governed by standing waves where some effective dimension L of the
specimen is an integral number of half-wave lengths L = n..VZ. Since the velocity is
related to the frequency and wavelength by v/f, the resonance frequency can be
written asfR = nv/2L
In complicated bodies, the successive resonances are not harmonically related. One
can then think of L as being some characteristic length corresponding to that
resonance . Since .JR is related to the velocity, it is also related to the moduli . Therefore,
192
NDT for microstructural and structural characterisation
like in the case of velocity the resonance value could be used to characterise amicrostructure where porosity and cavities are important features-
Important points in the use of ultrasonics
There are some important points that should be understood before an ultrasonictechnique is used for materials characterisation. For attenuation measurement, if acontact probe method is used, then corrections due to the couplant should be known
with a desired degree of accuracy if the attenuation coefficient is to be related to the
microstructure. One solution is the use of immersion technique in which thecomponent is immersed in a fluid like water and there is a known distance between the
probe and the entry point of the ultrasonic wave in the component (Fig. 4). Theimmersion technique can be used for both flaw detection and materials
characterisation. A-scan uses one probe at either ends of the components. On the other
hand, C-scan uses two probes at both the ends of the component moving in tandem in a
raster fashion
Probe Component
TANK FILLED WITH WATER
Fig. 4: Sketch showing immersion A-scan and C-scan ultrasonic set up
Another alternative is the use of non-contact methods [8] such as by EMAT(Electromagnetic Acoustic Transducer). EMAT however has a problem that a highfrequency more than 5MHz cannot be achieved. For the measurement of grain size,this limitation may perhaps not play a very important role. But for investigation ontoughness, this limitation may be important. Another important non-contact mode ofgeneration of ultrasonic waves is by laser excitation [8]_ The ultrasonic wave in thiscase may be detected in a non-contact manner by either an EMAT or by laserinterferometry [8].
When ultrasonic velocity is measured, one common difficulty is the knowledge ofthe thickness of the component through which the ultrasonic wave is propagating. Anaccepted method to overcome this problem is to use perpendicularly polarised twolongitudinal waves and taking the ratio of the velocities. Of course, when surfacewaves are used, this problem does not exist. Another difficulty in the measurement ofultrasonic velocity is the measurement of ultrasonic transit time of the order of nanoseconds. This problem is overcome by the use of digital signal processing by whichtwo chosen ultrasonic back reflection peaks are (in the A-scan mode) are accuratelymerged by very small shifts in the horizontal time axis and thereby knowing the transittime [9,10]. In the case of ceramics, an added problem comes because of the muchhigher velocity of ultrasonic waves in ceramic materials. This is overcome by the useof delay blocks. High temperature velocity measurement is often a necessity on
193
D. K. Bhauacharya
ceramics when such components are in the stage of processing. A quartz acoustic rodbetween the component and the transducer carries out the measurement [ 1 1 ].
MAGNETIC TECHNIQUES FOR MEASUREMENT OF GRAIN SIZE AND OTHER
MECHANICAL PROPERTIES
Magnetic hysteresis loop parameters
Magnetic hysteresis behaviour in a ferromagnetic (and ferromagnetic ) material is awell-known phenomenon , which has been extensively discussed in several treatises[12-14]. Figure 5 shows the schematic representation of the magnetisation processes
taking place during a hysteresis sweep . The arrow indicates the direction ofmagnetisation around the loop. Two basic equations are as follows.
B=M+po.H& l3=u.H ...(4)
where po = permeability of vacuum, p = permeability of the material, B = Induction, M= Intensity of magnetisation , and H = the applied magnetic field strength.
Fig_ S_ Schematic sketch showing magnetisation through hysteresis loops
Terms Meaning
Table 4 : Explanations of the terms given in Fig_ S
Effects and possibilities
U Region of reversible rotation ofmagnetic moments
V Domain nucleation region
W Irreversible domain wall Gives rise to magnetic Barkhausen noise signal . Its peakdisplacements mainly of the intensity and temporal intensity variation during180° type magnetisation sweep are important parameters for
materials characterisation
X Irreversible domain rotation Gives rise to acoustic Barkhausen noise signal. Has aand annihilation mainly of the potential for application in materials characterisation for90° type stress measurement
Y Approach to saturation -
The occurrence of the magnetic hysteresis is a consequence of the existence ofmagnetic domains within a ferromagnetic material . The domains are regions in whichthe atomic magnetic spins are oriented in the same directions (direction of spontaneous
194
NDT for microstructural and structural characterisation
magnetisation ). The domain walls can be classified into 180° walls, in which the spinsrotate by 180° from one domain to the other , and 90° walls in which the spin rotates by90° or so. The various parameters that can be derived from a magnetic hysterisis loopare shown in Fig. 6.
Fig. 6: Parameters that can be derived from hysteresis loopwhich can be used for characterising nticrostructuralfeatures and mechanical behaviour of materials
The terminology referred to in the above figure are : B, = retentivity ; H^ = coercivity,µ, = initial permeability ; p,., = Maximum permeability ; dK = incremental permeability.Besides these, it is possible to use maximum differential permeability, (dB/dH,,,.)which is the maximum slope of B-H hysteresis loop.
Barkhausen noise signal
There are two types of Barkhausen noise signals : (a) magnetic and (b) acoustic.
Magnetic Barkhausen Noise (MBN)
MBN signals are generated when a ferromagnetic or a ferromagnetic material ismagnetised through a hysteresis loop. The source mechanism of this type of signals ismainly the motion of 180° domain walls from one pinning point to another, whichchanges the local magnetic moment. A sensor coil or an audio head can sense thesesignals.
MBN discovered by Barkhausen in Germany in 1919 [ 15] was the first experimentalproof of the existence of domain walls . The term " noise " was coined because theexistence of signal was discovered in the form of a crackling noise in a telephonespeaker . Important observations made by Barkhausen are given below together withcomments based on the understanding on MBN signals that we have today . The latterare given within brackets.
195
D. K. Rhattacharya
a. The noise was audible. It was audible only after amplification. So arrangementsare needed to pre-amplify and amplify the signals before analysing them.
b. When the magnetic field was varied, the noise was found to be absent in certainrange of the variation. (Noise is mainly emitted when the ratio dBldH ismaximum i.e., at the point of coercivity),
c. Thicker core gave weaker noise. (Due to eddy current damping. So, MBN issurface specific; on the other hand, coercivity is not).
d. Stronger noise was heard when the steel was milder. Hardened steel did not give
any noise at all. (Less MBN signals in hardened steel due to the presence ofinternal stress. In other words due to the inability of the domain walls to move)
Barkhausen predicted that this phenomenon had a potential for use as an inspectiontechnique. Indeed, it is now a very important non-destructive tool for thecharacterisation of microstructure and residual stress.
Figure 7 shows an rrtts voltage plot of MBN signals from a 17-4PH steel [16]. Theinset shows how the "smooth " boundary of a hysteresis loop would look like ifmagnified suitably. The step nature of the contour signifies "jerky " motion of domainwalls from one pinning point to another. Figure 8 shows a schematic sketch with itsessential modules.
Russ VOL TAGSPLOT OF MBN
MA0NETIC 40,000FIELDSTRENGTH CHIA/m
N.,i 1}^^4\1111±11 I: N
p^7^ pf^')fI+
e =_J
GW£EPOI£CTION
-40,000 -20.000 He
K
Fig. 7: Plot of rms voltage of MBN signals
for half of the hysteresis sweep
Fig. 8: Block diagram of a typical MBN set up
Acoustic Barkhausen noise
Acoustic Barkhausen noise signals are generated at the knee region of hysteresis
loop (point `K' in Fig. 7). It has not found-as much use as MBN, though there arereports of success in using this signal to measure stress as well as grain size.
Coercivity and grain size
Coercivity is normally an inverse function of grain size. Larger grain size meanssmaller grain boundary areas and less number of domains specially the closuredomains of the 900 types which are formed at the grain boundaries and therefore lessnumber of domain walls to move against less number of impeding barriers (includinggrain boundaries and the domains nucleated from the grain boundaries), and hence
196
NDTfor microstructural and structural characterisation
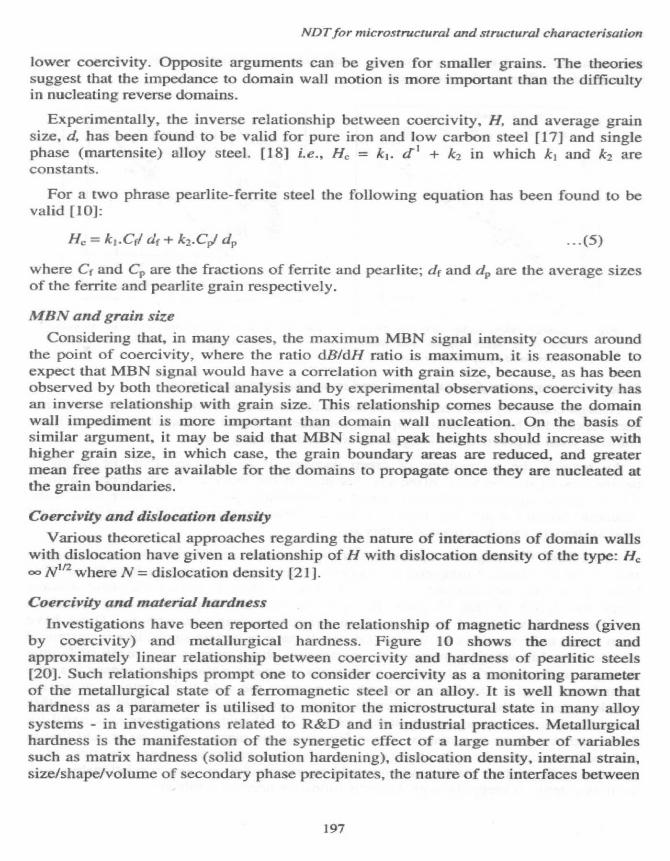
lower coercivity . Opposite arguments can be given for smaller grains. The theoriessuggest that the impedance to domain wall motion is more important than the difficultyin nucleating reverse domains.
Experimentally , the inverse relationship between coercivity, H, and average grainsize , d, has been found to be valid for pure iron and low carbon steel [17 ] and singlephase ( martensite ) alloy steel . [ 18] i.e ., H,^ = k,. d' + k2 in which k1 and k2 areconstants.
For a two phrase pearlite-ferrite steel the following equation has been found to bevalid P01:
H°=k,.C1/dt+k2.Cpldp ---(5)
where Cf and Cp are the fractions of ferrite and pearlite; dF and dp are the average sizesof the ferrite and pearlite grain respectively.
MBN and grain size
Considering that, in many cases, the maximum MBN signal intensity occurs aroundthe point of coercivity, where the ratio dBldH ratio is maximum, it is reasonable toexpect that MBN signal would have a correlation with grain size, because, as has beenobserved by both theoretical analysis and by experimental observations, coercivity hasan inverse relationship with grain size. This relationship comes because the domainwall impediment is more important than domain wall nucleation. On the basis ofsimilar argument, it may be said that MBN signal peak heights should increase withhigher grain size, in which case, the grain boundary areas are reduced, and greatermean free paths are available for the domains to propagate once they are nucleated atthe grain boundaries.
Coercivity and dislocation density
Various theoretical approaches regarding the nature of interactions of domain wallswith dislocation have given a relationship of H with dislocation density of the type: HH- N'12 where N = dislocation density [21 ].
Coercivity and material hardness
Investigations have been reported on the relationship of magnetic hardness (givenby coercivity) and metallurgical hardness. Figure 10 shows the direct andapproximately linear relationship between coercivity and hardness of pearlitic steels[20]. Such relationships prompt one to consider coercivity as a monitoring parameterof the metallurgical state of a ferromagnetic steel or an alloy. It is well known thathardness as a parameter is utilised to monitor the microstructural state in many alloysystems - in investigations related to R&D and in industrial practices. Metallurgicalhardness is the manifestation of the synergetic effect of a large number of variablessuch as matrix hardness (solid solution hardening), dislocation density, internal strain,size/shape/volume of secondary phase precipitates, the nature of the interfaces between
197
D_K. Bhattacharva
the precipitates and matrix, porosities, grain size, etc. Most of these microstructural
features also influence the coercivity.
OPTICAL GRAIN SIZE (µm1
10 30 50 IGOI ----T--r-T-= I I
r
Ic @ 5 L 2
OPTICAL GRAIN SIZE ( ASTM NUMBER(
Fig. 9: Linear relationship between grain Fig. 10: Linear relationship between magnetic
size from MBN signal and those hardness and coercivity) [201determined by optical method [191
Magnetic parameters for toughness and creep damage assessment
Though coercivity has been used to assess the hardness of metallic alloys, it has not
been reported to have a relationship with toughness ( impact or fracture toughness) that
could be used i n practice . Investigations are needed in this regard.
As regards the assessment of creep damage , it is expected that the magneticparameters should be well influenced because of the presence of the creep cavities,which like second phase particles should act as pinning points to the movement of themagnetic domain walls. The results so far are however mixed [21] . Definitely, more( and systematic ) work is needed in this area.
Apart from the magnetic hysteresis loop parameters and Barkhausen noise signal,there is another kind of magnetic test system , which has been recently introduced. Thiskind of systems uses magnetic sensors ( highly sensitive to detect magnetic leakageflux ), like. GMR (Giant Magneto Resistance), SQUID (Superconducting Quantum
Interference Device ) and those based on amorphous magnetic ribbons. These havebeen found to be sensitive to monitor fatigue damage in certain steels , like in austeniticstainless steel in which ferromagnetic martensitic phase appears as a result of fatiguedamage. In the author ' s laboratory, amorphous magnetic ribbon based sensor has alsobeen found to give excellent sensitivity to monitor the cold work level in austeniticstainless steel in which again, martensitic phase appears as a result of cold work withina matrix of non-ferromagnetic austenite phase [22 ]. If such systems are successful for
ferromagnetic phase in a matrix of non - ferromagnetic matrix, it can be argued that inthe reverse case , i.e., in presence of non- ferromagnetic creep cavities in a
ferromagnetic matrix , such sensors would be successful to have a relationship withvarious extents of creep damage . Investigations are needed in this area.
198
NDTfor rnicrostructural and structural characterisation
RESIDUAL STRESS MEASUREMENT
Residual stress (also known as locked in stress ) is always present in a materialbecause no materials or component can be treated in practice without introducing tosome extent or other a differential strain at some location of the materials or thecomponent . The knowledge of residual stress (RS) is important because it affects the
fatigue (behaviour under cyclic loading ) and stress corrosion cracking properties - the
two most important modes of failures of industrial components . Another problem withthe presence of residual stress is the distortion that takes place in a component during
fabrication and/or service . The knowledge of progressive changes in residual stress isalso important to understand the progression of fatigue damage because the changes in
the dislocation density and morphology are affected by the progression of the fatigue
damage, and the patterns of micro -stress are changed by the former. RS can becategorised as macrostress and microstress . Macrostress is uniform over a large
arealvolume (say for example several grains). On the other hand , micro-stress is
uniform within a smaller area /volume (say within one or two grains).
Residual macro stress measurement by X-ray diffraction [23, 24]
The basic equation in the measurement of RS by X-ray diffraction is the Bragg'slaw: nA = 2D. sinO, where n = the order of diffraction, A = the wavelength of X-raysused for diffraction, D = the distance of separation between chosen parallelcrystallographic planes, and B = the angle of diffraction.
RS introduces lattice strains, E. By differentiating the Bragg's law, we get
€ = dD/da = -cotO0.dO ... (6)
The strain can be measured along a chosen direction by controlling the direction of
incidence of the X-rays . For example, if the angle of incidence of the X-rays with
respect to the normal to the component surface is 'V, then the strain would be 'rF,vy,,.
This parameter can be expressed as per the equation given below
where, v = Poisson's ratio, E = elastic modulus, o', = stress along the direction as
shown in Fig. 11(a). If an experimental plot is done based on this equation (as shown
schematically in Fig. 11(b)), the slope would give the value of 'cr,'. The nature of the
slope (positive or negative) also would give an idea of the nature of the stress (tensile
or compressive).
Residual micro Stress measurement by X-ray diffraction
The FWHM (full width at half maximum) of XRD peaks are strongly affected bythe presence of micro-stress, and is an important parameter in this regard [25, 26]
199
D.K. Bhattacharya
6;
TENSILE
COMPRESSIVE
Sin2W
(b)
Fig. 11: (a) Geometrical configuration used in the measurement of residualstress by X-ray diffraction technique (b) Typical plot obtained by multi
'y r' technique, where 'v' = the angle of incidence of X-rays with thenormal to the component surface.
Residual stress measurement by magnetic methods
The discussion earlier in the paper on the relationship between various magnetic
parameter and the various microstructural and substructural parameter (likedislocations) is relevant for a discussion on the possibility of the use of magnetic
techniques for the measurement of residual stress. The effect of stress on the magnetic
hysteresis loop and the difference in the effect from tensile and compressive stress has
been known for a long time [131. Both magnetic and acoustic Barkhausen effect
signals have been found often to be suitable for the estimation of residual stress [27]
CONCLUD ING REMARKS
An attempt has been made in this paper to discuss some important basic aspects ofnon-destructive techniques for microstructural and structural characterisation. It hasnot been possible to discuss in details all the techniques that are possible- Instead,attention has been given to the more important techniques like ultrasonics, magneticsand X-Ray diffraction techniques. However, to the extent possible, mention has beenmade almost of all the techniques and where they would be important.
200
NDTfor Ynicrostructural and structural cliaracterisation
REFERENCES
1. Preface of book Non -destructive Characterisation of Materials , Eds. P . Holler eral. Springer Verlag . ( 1989)
2. Kim Jeongguk , Liaw K . Peter , The Non -destructive Evaluation of AdvancedCeramics and Ceramic -Matrix Composites , JOM-e , 50 (1998)
3. D.K.Bhattacharya, NDT & E for Microstructural Characterisation , MechanicalProperty Evaluation and Creep Damage, Proc . Workshop on NDT & E in relationto Life Management of Industrial Plants" . October 102, (2000)
4. E.O.Hall, Proc. Phys. Soc. London. 643 (1951), 747
5. N.J.Petch, J. Iron Steel Inst. London. 173 (1953), 25
6. G.E.Dieter , Mechanical Metallurgy , McGraw Hill Book Company . ( 1986). 189
7. E.P.Papadakis , International Metals Reviews, 29 (1984) 1
8. M.G.Silk, Ultrasonic Transducers for Non-destructive Testing, Adam Hilger Ltd.,Bristol . (1984)
9. R.Ambardkar, S.D.Pathak, T.Jayakumar, and O.Prabhakar, "Ultrasonic VelocityMeasurement to Assess Casting Quality ". Insight 38 (7), 502
10. K.Fuji Kawashima , Review of Progress in Quantitative Non-destructiveEvaluation , 14A (1995). 203
11. L.P.Martin , D.Daton, M.Rosen , In-situ measurement of ultrasonic sound wavevelocity during sintering of ceramic powders, NDE of ceramics (Eds.C.H.Schilling and J .N.Gray ), Ceramic Transactions 89 Am. Ceram . Soc. 1998
12. B.D.Cullity , Introduction to Magnetic Materials , Addison Wesley publishing Co.,Reading , Massachusetts , USA. (1972)
13. R.M . Bozorth , Ferromagnetism , D. Van Nostrand Co. Inc . ( 1951)
14. S.Chikazumi, Physics ofMagnetism , John Wiley & Sons . New York (1964)
15. H.Barkhausen , Physik Zeitschr, 20 (1919) 401
16. D.K.Bhattacharya , Unpublished result (1991)
17. M.N . Mikheev and E . S. Gorkunov. Soviet J. NDT, 17 ( 1982), 579
18. D.K . Bhattacharya, Characterisation of Microstructures in Steels by Magnetic andUltrasonic Techniques , Ph.D Thesis . Indian Institute of Science , Bangalore(1995)
19. M.Otala. and Saynajakanagas. J. Phys. E, Sci Instr. 5 (1972) 669
20. J.B . Bussiere , Review of Progress in Quantitative Non-Destructive Evaluation 6B(Eds) D .O.Thompson . and D . E.Chimenti , Plenum Press , New York (1987)
21. Hildebrandt U.W and Schneider K., Determination of Residual Life of TurbineComponents , Report COST 501-D29, ASEA Brown Boveri , Switzerland. June1988
201
U.X. &hattaeltar,'a
22. A_Mitra, National Metallurgical Laboratory, Private Comunication. (2001)
23. "Residual Stress Measurement by X-Ray Diffraction", Report SAE J784a, Societyof Automotive Engineers, USA (1971)
24. I.C.Nyan and J.B.Cohen, Residual Stress Measurement by Diffraction andInterpretation, Springer Verlag, (1987)
25_ Baldev Raj, B.K.Chaudhury, T.Jayakumar, K.B.S.Rao, "Characterisation of low
cycle fatigue in 9Cr-1 Mo ferritic steel using X-ray diffraction technique", Int_ J_Pressure Vessels & Piping, 76 (5), (1999), pp.275-281
26. Olchini, H.Steamm, F.Marques dos Santos, "Fatigue damage monitoring of lasertreated Steel by X-ray diffraction methods". Surface Engineering, 14(5), (1998),pp.386-390
27. D.K.Bhattacharya, "Characterisation of microstructure in steels by magnetictechniques: an overview", Trans. TIM, 48, (1995) pp-495-509-