64
Design of Earthworks Drainage, Network Drainage, Attenuation & Pollution Control DN-DNG-03066 March 2015

Design of Earthworks Drainage, Network Drainage, Attenuation & Pollution Control
DN-DNG-03066 March 2015

TRANSPORT INFRASTRUCTURE IRELAND (TII) PUBLICATIONS
About TII Transport Infrastructure Ireland (TII) is responsible for managing and improving the country’s national road and light rail networks.
About TII Publications TII maintains an online suite of technical publications, which is managed through the TII Publications website. The contents of TII Publications is clearly split into ‘Standards’ and ‘Technical’ documentation. All documentation for implementation on TII schemes is collectively referred to as TII Publications (Standards), and all other documentation within the system is collectively referred to as TII Publications (Technical).
Document Attributes Each document within TII Publications has a range of attributes associated with it, which allows for efficient access and retrieval of the document from the website. These attributes are also contained on the inside cover of each current document, for reference.
TII Publication Title Design of Earthworks Drainage, Network Drainage, Attenuation & Pollution Control
TII Publication Number DN-DNG-03066
Activity Design (DN) Document Set Standards
Stream Drainage (DNG) Publication Date March 2015
Document Number
03066 Historical Reference
TII Publications Website This document is part of the TII publications system all of which is available free of charge at http://www.tiipublications.ie. For more information on the TII Publications system or to access further TII Publications documentation, please refer to the TII Publications website.
TII Authorisation and Contact Details This document has been authorised by the Director of Professional Services, Transport Infrastructure Ireland. For any further guidance on the TII Publications system, please contact the following:
Contact: Standards and Research Section, Transport Infrastructure Ireland Postal Address: Parkgate Business Centre, Parkgate Street, Dublin 8, D08 DK10 Telephone: +353 1 646 3600Email: [email protected]
NRA HA 33

TII Publications DN-DNG-03066 Design of Earthworks Drainage, Network Drainage, Attenuation & Pollution Control March 2015
Page i
Updates to TII Publications resulting in changes to Design of Earthworks Drainage, Network Drainage, Attenuation & Pollution Control DN-DNG-
03066
Date: August 2018
Amendment Details:
The following minor amendment has been incorporated into the June 2015 version of this Standard:
a) The units within the Tables for the hydraulic design of pipes, sewers andchannels have been corrected from m3/s to l/s.

Design of Earthworks Drainage, Network Drainage, Attenuation & Pollution Control
Volume 4 Section 2 Part 3
NRA HA 33/15
March 2015
St. Martin’s House, Waterloo Road, Dublin 4 Tel: +353 1 660 2511 Fax +353 1 668 0009 Email: [email protected] Web: www.nra.ie

Summary:
This Advice Note provides design guidance on the design of earthworks drainage, road network drainage, attenuation and pollution control.
Published by National Roads Authority, Dublin 2015

NRA DESIGN MANUAL FOR ROADS AND BRIDGES
March 2015 i
VOLUME 4 GEOTECHNICS AND DRAINAGE
SECTION 2 DRAINAGE
PART 3
NRA HA 33/15
Design of Earthworks Drainage, Network Drainage, Attenuation & Pollution Control
Contents
Chapter
1. Introduction
2. Methodology
3. Earthworks Drainage
4. Network Drainage
5. Attenuation
6. Pollution Control
7. Glossary
8. References
9. Enquiries

National Roads Authority Volume 4 Section 2 Design Manual for Roads and Bridges Part 3 NRA HA 33/15
March 2015 1
1. INTRODUCTION General
This Advice Note gives guidance on the design of earthworks drainage, road network drainage, attenuation and road runoff pollution control for National Roads projects. It is based on best practice design methods as outlined in the NRA DRMB and The SUDS Manual (CIRIA C697). It should be read in conjunction with the following standards:
a) NRA HD 33 Drainage Systems for National Roads
b) NRA HD 45 Road Drainage and the Water Environment
c) NRA HD 83 Safety Aspects of Road Edge Drainage Features
d) NRA HD 78 Design of Outfalls for Surface Water Channels
e) NRA HD 102 Spacing of Road Gullies
f) NRA HD 103 Vegetated Drainage Systems for Road Runoff
g) NRA HD 106 Drainage of Runoff from Natural Catchments
h) NRA HD 107 Design of Culvert and Outfall Details
i) NRA HD 118 Design of Soakaways
j) NRA HD 119 Grassed Surface Water Channels for Road Runoff
k) NRA HD 137 Hydraulic Design of Road Edge Surface Water Channels
l) NRA HD 139 Edge of Pavement Details
m) NRA HD 140 Determination of Pipe and Bedding Combinations for Drainage Works
The 2015 revision of the NRA’s drainage standards was precipitated by post-doctoral research carried out under the NRA’s Research Fellowship Programme and mentored by the NRA’s Environment Unit. This research looked at the impacts of national road drainage systems on both surface and groundwater. The research concluded that the NRA’s drainage standards needed to be expanded to promote the use of sustainable drainage systems and to maximise environmental benefits. A report entitled Drainage Design for National Road Schemes – Sustainable Drainage Options (NRA, 2014) documents this research and provides useful background reading to the NRA’s drainage standards. This document is available at: nrastandards.nra.ie/latest/other-nra-documents.
This document deals with four specific surface water and groundwater drainage aspects and is split into
the following sub-sections:
a) Earthworks drainage
b) Network drainage
c) Attenuation
d) Pollution Control
The hydrological and hydraulic design of culvert or bridge crossings for watercourses, that fall under the requirements of the Office of Public Works (OPW), are outside the scope of this document. In Ireland, consent is required from the Office of Public Works (OPW), under the Arterial Drainage Acts, 1945 and 1995, for the creation and modification of watercourses, embankments, weirs and bridges. Reference should be made to www.opw.ie/en/floodriskmanagement/ for information regarding flood

National Roads Authority Volume 4 Section 2 Design Manual for Roads and Bridges Part 3 NRA HA 33/15
March 2015 2
risk management and construction or alteration of watercourse infrastructure. Refer to www.floodmaps.ie and www.cfram.ie/pfra for information regarding flood risk.
Scope
The principles outlined in this Advice Note shall apply to all National Roads projects.
Implementation
This Advice Note should be used forthwith for all schemes for the construction and/or improvements of National Roads. The Advice Note should be applied to the design of schemes already being prepared unless, in the opinion of the National Roads Authority, application would result in significant additional expense or delay progress. In such cases, Design Organisations should confirm the application of this Standard to particular schemes with the National Roads Authority.
Standards Map
Figure 1/1 depicts the NRA DRMB drainage standards map. This shows the interaction between the various standards. It is recommended that all of these standards are consulted before commencing a drainage design. The designer should be fully aware of the various interactions between each element and can make informed decisions on the overall design.

National Roads Authority Volume 4 Section 2 Design Manual for Roads and Bridges Part 3 NRA HA 33/15
March 2015 3
Figure 1/1 Standards Map

National Roads Authority Volume 4 Section 2 Design Manual for Roads and Bridges Part 3 NRA HA 33/15
March 2015 4
2. METHODOLOGY The objectives of drainage for National Roads projects are:
a) The speedy removal of surface water;
b) The provision of effective sub-surface drainage of pavement and earthworks;
c) To minimise the impact of runoff on the receiving environment.
The National Roads Authority 2010 Project Management Guidelines outline the different project phases from scheme feasibility to construction. This document details the different requirements at each stage of the road scheme. The designer should take cognisance of this when determining the drainage design requirements for the different project phases of the road scheme.
There has been a move in recent years towards the use of sustainable drainage systems (SuDs). SuDs can mitigate many of the adverse effects of storm water runoff on the environment. This has led to a shift towards the use of grassed surface water channels, ponds, filter trenches and wetlands in lieu of conventional systems such as concrete pipes and surface water channels, kerb and gully and pre-formed petrol/oil separators. The benefits of SuDs versus a more conventional drainage system can include:
a) Reduced runoff rates and risk of flooding downstream;
b) Reduced runoff volumes;
c) Reduced pollutant concentrations;
d) Control of accidental spillages;
e) Natural groundwater recharge;
f) Enhanced aesthetics of developed sites;
g) Creation of habitats for wildlife.
The choice of drainage system depends on site characteristics, catchment characteristics, quantity and quality requirements and environmental requirements. Figures 3.1 and 3.2 in NRA HD 33 outline the types of permissible system for drainage of National Roads projects. As noted in NRA HD 33 SuDs should be considered in the first instance, where appropriate. There will be scenarios, such as improvements to existing road schemes, where this may not be possible. It should be noted that if an impermeable drainage system is required, in accordance with the groundwater protection response assessment in NRA HD 45, the choice of system is not necessarily limited to conventional drainage systems such as concrete surface water channel and kerb and gully. Some form of SuDs should still be used in the design.
In line with the objective to minimise the impact of drainage for National Roads projects on the environment, it is recommended that a surface water management train is used to mimic the natural catchment processes as closely as possible. The concept employs use of drainage treatment measures in series that incrementally reduce pollutants, runoff rates and volumes of runoff so that the need for large scale attenuation facilities, adjacent to watercourses, is reduced. For example this may consist of road runoff being collected in a grassed surface water channel, that is discharged into a linear ditch and then into a wetland system, before final outfall to the receiving watercourse.

National Roads Authority Volume 4 Section 2 Design Manual for Roads and Bridges Part 3 NRA HA 33/15
March 2015 5
It is important to note the interaction between each of the drainage sub-sections highlighted in Chapter 1. For example the earthworks drainage may have an impact on the culvert locations; the choice of network drainage system may impact the attenuation or pollution control design. Designers should take cognisance of each of the subsections when designing elements of the drainage system.
Attenuation and pollution control should be considered early in the design process as this may influence the choice of network drainage system, and will also affect the land take. Particular emphasis should be placed on using SuDs, for collection, conveyance and treatment of road runoff. Too often designers leave this aspect until after the earthworks and network drainage is finalised which can in some cases lead to the requirement for large attenuation and pollution control facilities at the outfall location, adjacent to watercourses. This can lead to the following issues:
a) The design will not closely replicate the greenfield scenario. This will reduce flood impacts for higher return period events but will have an adverse impact for lower return periods;
b) The design will not be in accordance with SuDs surface water management train and philosophy to incrementally reduce pollutants, runoff rates and volumes in series;
c) A point source discharge rather than a linear discharge is created;
d) Groundwater recharge to aquifers and the base flows in watercourses are affected, potentially affecting ecology, sediment transport etc.
Consultation with Inland Fisheries Ireland (IFI), the Office of Public Works (OPW), National Parks and Wildlife Services (NPWS), the Environmental Protection Agency (EPA) and local authorities should be carried out during the early phases of road schemes to establish the environmental quality standards, thresholds, regional or site specific requirements. This should continue right through to the construction phase, as required by the relevant statutory body.
Designers shall comply with the Water Framework Directive (2000/60/EC) and the Groundwater Directive (2006/118/EC), as well as other relevant Irish legislation as outlined in NRA HD 45 in the design of drainage systems for National Roads projects.
Figure 2/1 outlines a methodology for the design of drainage systems for National Roads projects.

National Roads Authority Volume 4 Section 2 Design Manual for Roads and Bridges Part 3 NRA HA 33/15
March 2015 6
Figure 2/1 Design of Drainage for National Roads projects

National Roads Authority Volume 4 Section 2 Design Manual for Roads and Bridges Part 3 NRA HA 33/15
March 2015 7
3. EARTHWORKS DRAINAGE General
This chapter of the Advice Note gives guidance on the hydraulic design of earthworks drainage. This deals with surface water runoff from natural catchments draining towards National Roads. It deals solely with drainage of rural (natural) catchments. It does not deal with urbanised or a combination of urban and rural catchments.
Guidance for earthworks drainage is given in NRA HD 33. It recommends that cut-off drains are constructed at the top of cuttings and at toes of embankments where water from adjoining land may flow towards the road. The designer needs to consider the interaction with the lands made available (LMA) and the minimum maintenance strip required when designing earthworks drainage. NRA HD 106 provides standard requirements for hydraulic design of earthworks drainage and NRA HD 107 provides guidance on the design of culvert crossings and outfalls.
The guidance contained in this document is for information only and should be treated as such in the design of new schemes. This Advice Note should be read in conjunction with the NRA Specification for Road Works (NRA SRW), the NRA Road Construction Details (RCD) and the following documents in the NRA DMRB and the NRA SRW:
a) NRA HD 83 Safety Aspects of Road-edge Drainage Features
b) NRA HD 139 Edge of Pavement Details
c) NRA HD 33 Drainage Systems for National Roads
d) NRA HD 45 Road Drainage and the Water Environment
e) NRA HD 106 Drainage of Runoff from Natural Catchments
f) NRA HD 107 Design of Outfall and Culvert Details
g) NRA HD 103 Vegetated Drainage Systems for Road Run-off
h) NRA HD 140 Determination of Pipe and Bedding Combinations for Drainage Works
i) NRA HD 137 Hydraulic Design of Road-Edge Surface Water Channels
j) NRA HD 119 Grassed Surface Water Channels for Road Runoff
k) NRA HD 78 Design of Outlets for Surface Water Channels
l) NRA HD 102 Spacing of Road Gullies
m) NRA HD 118 Design of Soakaways
The flow chart in Figure 3/1 outlines a methodology for designing earthworks drainage.

National Roads Authority Volume 4 Section 2 Design Manual for Roads and Bridges Part 3 NRA HA 33/15
March 2015 8
Figure 3/1 – Methodology Flowchart for Earthworks Drainage

National Roads Authority Volume 4 Section 2 Design Manual for Roads and Bridges Part 3 NRA HA 33/15
March 2015 9
The following examples demonstrate the calculation of runoff from a natural road side catchment and how to size a ditch to convey this runoff.
Example 3/1 Estimation of Runoff from a Natural Road Side Catchment
Determine the runoff from a natural roadside catchment with the following catchment characteristics:
Catchment area: 1km2
Catchment slope: S = 1/103 = 0.0097 Soil type: Type 3
The IH 124 method will be applied to this catchment, as the catchment area is greater than 0.4km2 (based on NRA HD 106 guidance).
The value of the SOIL index for the catchment can be calculated from Equation (2) in NRA HD 106:
SOIL = (0.15S1 +0.3S2+0.4S3+0.45S4+0.5S5)S1 +S2+S3+S4+S5
S1, 2….denote the proportions of catchment covered by each of the soil classes 1 to 5. Soil class 1 has a low runoff potential and soil class 5 has a high runoff potential. The parameter SOIL for a natural catchment can vary between 0.15 (very low runoff) to 0.5 (very high runoff). This parameter can be estimated from 1:625,000 scale soil maps in the Flood Studies Report or, for a simplified approach, through consultation of Table 5/1 in NRA HD 106.
It can be assumed that the catchment is uniform in terms of soil characteristics and from the soil maps in the Flood Studies Report the soil class can be taken as S3. The proportions of the catchment with soil classes S1 to S2 and S4 to S5 are nil, so:
SOIL = 0.4
The mean annual flood is then calculated from Equation (1) in NRA HD 106 to be:
Qbar = 0.00108 x AREA0.89 x SAAR1.17x SOIL2.17
= 0.00108 x (1.0)0.89 x (960)1.17 x (0.4)2.17 = 0.456m3/s
where:
Qbar is the mean annual flow (m3/s)
AREA is the catchment plan area (km2)
SAAR is the standard average rainfall for the particular location (obtained from Met Éireann) (mm)
For the design return period (75 years – Refer to NRA HD 33 and NRA HD 106) the mean annual flow is scaled up by a factor of 1.865 (Flood Studies Report Regional Growth Curve for Ireland). If a catchment is gauged and there is a suitable record available, a site specific growth curve can be established and used in lieu of the Flood Studies Report Growth Curve. A standard factorial error (SFE) of 1.65 is required for the IH 124 method and 20% uplift for climate change is also applied in accordance with NRA HD 33. The design flow can then be calculated as:
Qdesign flow = F x SFE x CC x Qbar
Q75 = 1.865 x 1.65 x 1.2 x 0.456 = 1.68m3/s

National Roads Authority Volume 4 Section 2 Design Manual for Roads and Bridges Part 3 NRA HA 33/15
March 2015 10
Example 3/2 Estimation of Earthworks Drainage Ditch Size
Determine a suitable trapezoidal ditch size for the catchment in example 3/1 above. Manning’s equation is used to size the earthworks drainage ditch.
Manning’s roughness coefficient, n: 0.05 (NRA HD 106)
Longitudinal gradient of the ditch, S: 0.0097
R is the hydraulic radius defined by AP
, where P is the wetted perimeter and A is the cross sectional area of flow in the ditch.
For a trapezoidal shape with equal side slopes, base width B, side slopes 1:b (vertical : horizontal) and flow depth y, the hydraulic radius is given by:
R = yB + y2b
B + 2(y2b2 + y2)12
where:
A = yB + y2b
P = B + 2(y2b2 + y2)12
Assume 1m base width (B) with 1 in 1 side slopes (1 in b), in accordance with the unlined ditch detail on RCD/600/2.
Assume an initial estimate of the water depth, y of 0.75m:
This equates to a flow rate of:
Q = A S
12R
23
n
= 1.31 x 0.0097
120.42
23
0.05
= 1.451 m3/s
Increase the depth of y to obtain Q equal to 1.68m3/s.
Try y = 0.809m.
This equates to Q = 1.68m3/s. Therefore the depth of water for a 1in 75 year return period event in a channel that has a base width of 1m with 1 in 1 side slopes is 0.809m. The assumed ditch size is sufficient to cater for the estimated surface water overland flow.
There are also a number of other earthworks solutions that can be used such as swales and infiltration trenches. Swales are designed in a similar manner to ditches, but have shallower side-slopes to encourage filtration. Note that groundwater ingress also needs to be considered. Refer to Chapter 4 for design guidance on drain spacing to lower groundwater.

National Roads Authority Volume 4 Section 2 Design Manual for Roads and Bridges Part 3 NRA HA 33/15
March 2015 11
Specification
Refer to RCD/600/2 for a typical earthworks drainage ditch detail.
For guidance on design of culverts to convey earthworks drainage under National Roads, refer to NRA HD 106 and NRA HD 107.
The associated headwalls should be in accordance with Series 500 of NRA SRW and Series 500 of NRA RCD.
Energy dissipation measures should be considered where velocities are high in accordance with NRA HD 107. Refer to NRA HD 107 for scour protection guidance.
Pipe bedding and surround should be in accordance with NRA HD 140 and Series 500 of NRA SRW. Examples are provided in NRA HD 140 to guide the designer in the design of bedding and surround details. Pipe materials should be in accordance with NRA HD 140 and Series 500 of NRA SRW.

National Roads Authority Volume 4 Section 2 Design Manual for Roads and Bridges Part 3 NRA HA 33/15
March 2015 12
4. NETWORK DRAINAGE General
This chapter of the Advice Note gives guidance on the design of network drainage systems to manage runoff from National Roads projects. It also gives guidance on sub-surface drainage.
The guidance contained in this document is for information only and should be treated as such in the design of new schemes. This Advice Note should be read in conjunction with the NRA SRW, NRA RCD and the following documents in the NRA DMRB:
a) NRA HD 33 Drainage Systems for National Roads
b) NRA HD 45 Road Drainage and the Water Environment
c) NRA HD 83 Safety Aspects of Road Edge Drainage Features
d) NRA HD 78 Design of Outfalls for Surface Water Channels
e) NRA HD 102 Spacing of Road Gullies
f) NRA HD 103 Vegetated Drainage Systems for Road Runoff
g) NRA HD 107 Design of Culvert and Outfall Details
h) NRA HD 118 Design of Soakaways
i) NRA HD 119 Grassed Surface Water Channels for Road Runoff
j) NRA HD 137 Hydraulic Design of Road Edge Surface Water Channels
k) NRA HD 139 Edge of Pavement Details
l) NRA HD 140 Determination of Pipe and Bedding Combinations for Drainage Works
Figure 4/1 outlines the general procedure for design of network drainage.

National Roads Authority Volume 4 Section 2 Design Manual for Roads and Bridges Part 3 NRA HA 33/15
March 2015 13
Figure 4/1 – Methodology Flowchart for Network Drainage
Note 1 Review of OPW flood maps, Preliminary Flood Risk Assessment Maps, Catchment Flood Risk Assessment and Management (CFRAM) maps.

National Roads Authority Volume 4 Section 2 Design Manual for Roads and Bridges Part 3 NRA HA 33/15
March 2015 14
Figure 3.1 and 3.2 in NRA HD 33 outline the types of permissible system for drainage of National Roads projects. SuDs should be considered in the first instance where suitable. Refer to NRA HD 45 for the groundwater protection response to assess the requirement for impermeable drainage systems.
Channel Design
The design method for channel design is based on kinematic wave theory where the time-varying flow conditions in the channel can be determined to calculate the capacity of a given cross section of channel. The length of road that can be drained by a channel is then calculated (note that an initial estimate of the size and shape of the channel is required) for the design return period (as indicated in NRA HD 33). The outfall type and number of gratings is then calculated and efficiencies checked. The design of concrete surface water channels and grassed surface channels shall be in accordance with NRA HD 137 and NRA HD 119 respectively. Outfalls from surface water channels shall be designed in accordance with NRA HD 78. Design examples are provided in the aforementioned NRA DMRB standards and will not be reproduced here.
Pipe Design for Road Surface Runoff
NRA HD 33 outlines the required design parameters (design return periods, surcharge conditions etc) for pipe design.
Sections 4.8 to 4.16 provide information on initial estimates of pipe sizes.
Hydraulic Capacity Tables
HR Wallingford developed hydraulic capacity tables to allow initial sizing of pipes. The Tables for the hydraulic design of pipes, sewers and channels are available for purchase from www.hrwallingford.com.
These consist of tables of discharge, velocity, gradient and pipe size. They are based on a friction loss equation known as the Colebrook-White equation.
V = −2 �2gDS log[ Ks3.7D
+ 2.5lvD�2gDS
]
where:
V= velocity
g = gravitational gradient
S = hydraulic gradient (governed by pipe slope)
D = pipe diameter
V = kinematic viscosity of fluid. This is the ratio of fluids viscosity and density; viscosity is independent of pressure and depends on temperature only, therefore, values vary according to the type of fluid and its ambient temperature. For design purposes 1.4.1 x 10-6 m2/s may be used (water at 15oC).
Ks = effective roughness for the Colebrook-White equation. Certain codes of practice stipulate a minimum pipe roughness, Ks for design of surface water sewers irrespective of the pipe type as 0.6mm for carrier drains and 1.5mm for filter drains. Further guidance on roughness is given in Tables for the hydraulic design of pipes, sewers and channels.

National Roads Authority Volume 4 Section 2 Design Manual for Roads and Bridges Part 3 NRA HA 33/15
March 2015 15
If the gradient, effective roughness and flow are known a pipe diameter can be estimated. The tables are based on full bore unpressurised flow conditions. The Tables for the hydraulic design of pipes, sewers and channels also provides guidance on obtaining results for half bore pipes also or variations in temperature.
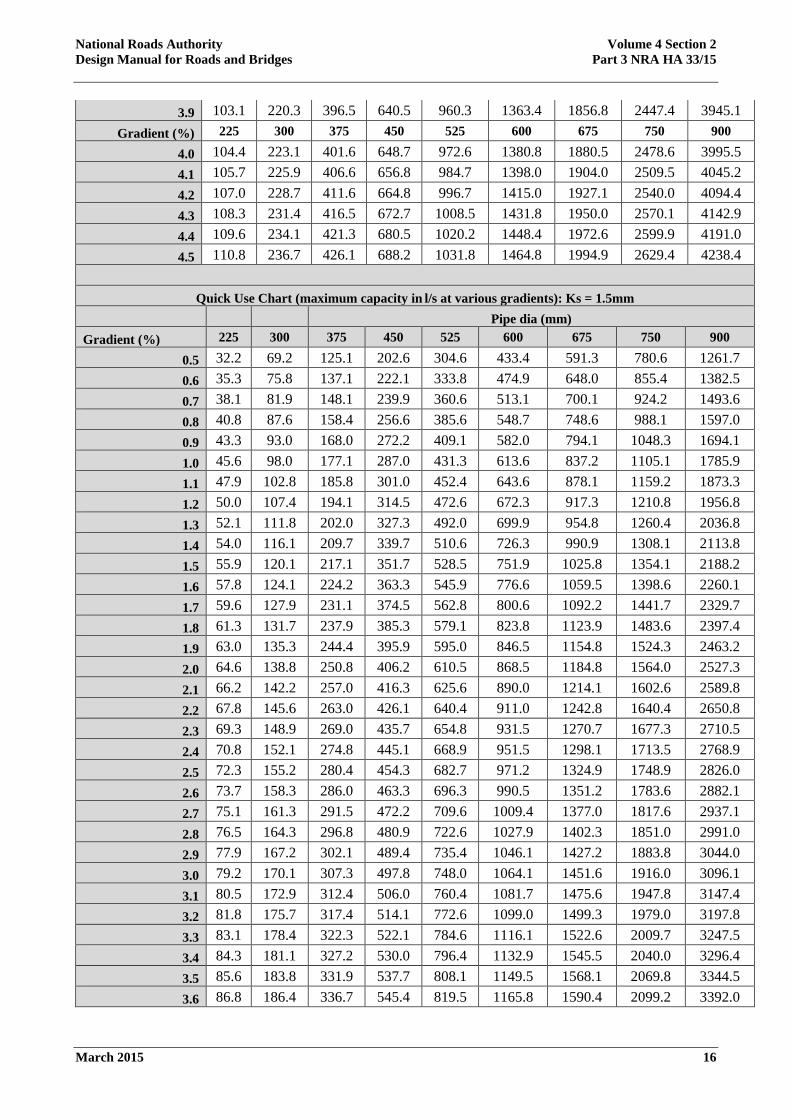
These tables are for preliminary sizing only. Simulation of networks should be carried out as part of the detailed design to account for tail water conditions and hydraulic losses throughout the network. Quick use charts using the Colebrook-White equation are provided below:
Quick Use Chart (maximum capacity in l/s at various gradients): Ks = 0.6mm Pipe dia (mm) Gradient (%) 225 300 375 450 525 600 675 750 900
0.5 36.6 78.2 141.0 227.9 341.8 485.5 661.5 872.1 1406.5 0.6 40.1 85.8 154.6 249.8 374.7 532.2 725.1 956.0 1541.7 0.7 43.4 92.7 167.1 270.0 405.0 575.2 783.6 1033.1 1665.9 0.8 46.4 99.2 178.7 288.8 433.2 615.2 838.1 1104.9 1781.6 0.9 49.2 105.3 189.6 306.5 459.7 652.8 889.2 1172.3 1890.2 1.0 51.9 111.1 200.0 323.2 484.7 688.3 937.6 1236.0 1993.0 1.1 54.5 116.5 209.8 339.1 508.5 722.1 983.6 1296.7 2090.7 1.2 56.9 121.7 219.2 354.2 531.2 754.4 1027.6 1354.6 2184.1 1.3 59.3 126.8 228.3 368.8 553.1 785.4 1069.8 1410.2 2273.7 1.4 61.6 131.6 236.9 382.8 574.1 815.2 1110.4 1463.7 2359.9 1.5 63.7 136.2 245.3 396.3 594.3 843.9 1149.5 1515.3 2443.0 1.6 65.8 140.7 253.4 409.4 613.9 871.7 1187.4 1565.2 2523.5 1.7 67.9 145.1 261.2 422.1 632.9 898.7 1224.1 1613.6 2601.4 1.8 69.9 149.3 268.9 434.4 651.4 924.9 1259.8 1660.5 2677.1 1.9 71.8 153.5 276.3 446.4 669.3 950.3 1294.4 1706.2 2750.7 2.0 73.7 157.5 283.5 458.0 686.8 975.1 1328.2 1750.7 2822.4 2.1 75.5 161.4 290.5 469.4 703.8 999.3 1361.1 1794.1 2892.4 2.2 77.3 165.2 297.4 480.5 720.4 1022.9 1393.3 1836.5 2960.7 2.3 79.1 168.9 304.1 491.3 736.7 1046.0 1424.7 1877.9 3027.4 2.4 80.8 172.6 310.7 501.9 752.6 1068.6 1455.5 1918.4 3092.7 2.5 82.4 176.2 317.2 512.3 768.2 1090.7 1485.6 1958.1 3156.7 2.6 84.1 179.7 323.5 522.5 783.5 1112.4 1515.1 1997.0 3219.4 2.7 85.7 183.1 329.7 532.5 798.5 1133.7 1544.1 2035.2 3280.9 2.8 87.3 186.5 335.7 542.4 813.2 1154.6 1572.5 2072.7 3341.3 2.9 88.8 189.8 341.7 552.0 827.6 1175.1 1600.4 2109.5 3400.6 3.0 90.4 193.1 347.6 561.5 841.8 1195.2 1627.9 2145.7 3458.9 3.1 91.9 196.3 353.4 570.8 855.8 1215.1 1654.9 2181.2 3516.2 3.2 93.4 199.5 359.0 580.0 869.5 1234.6 1681.4 2216.2 3572.6 3.3 94.8 202.6 364.6 589.0 883.1 1253.8 1707.6 2250.7 3628.2 3.4 96.2 205.6 370.1 597.9 896.4 1272.7 1733.4 2284.7 3682.9 3.5 97.7 208.7 375.6 606.7 909.5 1291.3 1758.7 2318.1 3736.8 3.6 99.1 211.6 380.9 615.3 922.5 1309.7 1783.8 2351.1 3789.9 3.7 100.4 214.6 386.2 623.8 935.3 1327.8 1808.4 2383.6 3842.4 3.8 101.8 217.5 391.4 632.2 947.9 1345.7 1832.8 2415.7 3894.1
National Roads Authority Volume 4 Section 2 Design Manual for Roads and Bridges Part 3 NRA HA 33/15
March 2015 16
3.9 103.1 220.3 396.5 640.5 960.3 1363.4 1856.8 2447.4 3945.1 Gradient (%) 225 300 375 450 525 600 675 750 900
4.0 104.4 223.1 401.6 648.7 972.6 1380.8 1880.5 2478.6 3995.5 4.1 105.7 225.9 406.6 656.8 984.7 1398.0 1904.0 2509.5 4045.2 4.2 107.0 228.7 411.6 664.8 996.7 1415.0 1927.1 2540.0 4094.4 4.3 108.3 231.4 416.5 672.7 1008.5 1431.8 1950.0 2570.1 4142.9 4.4 109.6 234.1 421.3 680.5 1020.2 1448.4 1972.6 2599.9 4191.0 4.5 110.8 236.7 426.1 688.2 1031.8 1464.8 1994.9 2629.4 4238.4
Quick Use Chart (maximum capacity in l/s at various gradients): Ks = 1.5mm
Pipe dia (mm) Gradient (%) 225 300 375 450 525 600 675 750 900
0.5 32.2 69.2 125.1 202.6 304.6 433.4 591.3 780.6 1261.7 0.6 35.3 75.8 137.1 222.1 333.8 474.9 648.0 855.4 1382.5 0.7 38.1 81.9 148.1 239.9 360.6 513.1 700.1 924.2 1493.6 0.8 40.8 87.6 158.4 256.6 385.6 548.7 748.6 988.1 1597.0 0.9 43.3 93.0 168.0 272.2 409.1 582.0 794.1 1048.3 1694.1 1.0 45.6 98.0 177.1 287.0 431.3 613.6 837.2 1105.1 1785.9 1.1 47.9 102.8 185.8 301.0 452.4 643.6 878.1 1159.2 1873.3 1.2 50.0 107.4 194.1 314.5 472.6 672.3 917.3 1210.8 1956.8 1.3 52.1 111.8 202.0 327.3 492.0 699.9 954.8 1260.4 2036.8 1.4 54.0 116.1 209.7 339.7 510.6 726.3 990.9 1308.1 2113.8 1.5 55.9 120.1 217.1 351.7 528.5 751.9 1025.8 1354.1 2188.2 1.6 57.8 124.1 224.2 363.3 545.9 776.6 1059.5 1398.6 2260.1 1.7 59.6 127.9 231.1 374.5 562.8 800.6 1092.2 1441.7 2329.7 1.8 61.3 131.7 237.9 385.3 579.1 823.8 1123.9 1483.6 2397.4 1.9 63.0 135.3 244.4 395.9 595.0 846.5 1154.8 1524.3 2463.2 2.0 64.6 138.8 250.8 406.2 610.5 868.5 1184.8 1564.0 2527.3 2.1 66.2 142.2 257.0 416.3 625.6 890.0 1214.1 1602.6 2589.8 2.2 67.8 145.6 263.0 426.1 640.4 911.0 1242.8 1640.4 2650.8 2.3 69.3 148.9 269.0 435.7 654.8 931.5 1270.7 1677.3 2710.5 2.4 70.8 152.1 274.8 445.1 668.9 951.5 1298.1 1713.5 2768.9 2.5 72.3 155.2 280.4 454.3 682.7 971.2 1324.9 1748.9 2826.0 2.6 73.7 158.3 286.0 463.3 696.3 990.5 1351.2 1783.6 2882.1 2.7 75.1 161.3 291.5 472.2 709.6 1009.4 1377.0 1817.6 2937.1 2.8 76.5 164.3 296.8 480.9 722.6 1027.9 1402.3 1851.0 2991.0 2.9 77.9 167.2 302.1 489.4 735.4 1046.1 1427.2 1883.8 3044.0 3.0 79.2 170.1 307.3 497.8 748.0 1064.1 1451.6 1916.0 3096.1 3.1 80.5 172.9 312.4 506.0 760.4 1081.7 1475.6 1947.8 3147.4 3.2 81.8 175.7 317.4 514.1 772.6 1099.0 1499.3 1979.0 3197.8 3.3 83.1 178.4 322.3 522.1 784.6 1116.1 1522.6 2009.7 3247.5 3.4 84.3 181.1 327.2 530.0 796.4 1132.9 1545.5 2040.0 3296.4 3.5 85.6 183.8 331.9 537.7 808.1 1149.5 1568.1 2069.8 3344.5 3.6 86.8 186.4 336.7 545.4 819.5 1165.8 1590.4 2099.2 3392.0

National Roads Authority Volume 4 Section 2 Design Manual for Roads and Bridges Part 3 NRA HA 33/15
March 2015 17
3.7 88.0 188.9 341.3 552.9 830.9 1181.9 1612.3 2128.2 3438.9 Gradient (%) 225 300 375 450 525 600 675 750 900
3.8 89.2 191.5 345.9 560.3 842.0 1197.8 1634.0 2156.8 3485.1 3.9 90.3 194.0 350.4 567.7 853.1 1213.5 1655.4 2185.0 3530.7 4.0 91.5 196.5 354.9 574.9 863.9 1228.9 1676.5 2212.9 3575.7 4.1 92.6 198.9 359.3 582.1 874.7 1244.2 1697.4 2240.4 3620.2 4.2 93.8 201.3 363.7 589.1 885.3 1259.3 1718.0 2267.6 3664.1 4.3 94.9 203.7 368.0 596.1 895.8 1274.3 1738.3 2294.5 3707.5 4.4 96.0 206.1 372.3 603.0 906.2 1289.0 1758.4 2321.0 3750.4 4.5 97.1 208.4 376.5 609.8 916.4 1303.6 1778.3 2347.3 3792.9
Backwater Calculation
The detailed hydraulic grade line (HGL) is recommended for the analysis of surface water drainage systems. Analysis is progressed from downstream to upstream through the system and is consistent with the concept of backwater analysis. It allows prediction of the HGL and water surface level. The HGL (effective water level) is governed by the pipe slope and the water depth at the upstream and downstream manholes. This represents the pressure head in the pipe and is the level to which water will rise if unconstrained. The total energy line (TEL) (velocity head plus elevation head plus pressure head) under steady flow conditions is above the HGL by a distance equal to the velocity head (v2/2g). If the velocities are negligible, for example in a pond, the hydraulic grade line and total energy line correspond.
There are three models that are generally applied:
a) In bore pipe conditions: This represents simple steady flow conditions. The calculated HGL upstream of each pipe is equal to or lower than the upstream pipe soffit.
b) Surcharged pipe conditions: This represents steady pressured flow conditions. This is where the HGL is above the pipe soffits and pressure flow occurs.
c) As water levels rise during a storm event (varying with time) complex unsteady flow modelling is required. This is usually carried out with computer simulation software.
The velocity in a pipe should be maintained within acceptable limits to ensure self-cleansing of the pipe occurs but also to prevent scour and erosion of the pipe materials. The minimum velocity to achieve self-cleansing conditions is 0.75m/s as outlined in NRA HD 33. The maximum velocity at outfall should be 2.5m/s. Scour protection should be provided in accordance with NRA HD 107.
Tailwater Level:
In order to carry out a backwater analysis the tailwater level (TWL) (water level at downstream end of the network) is required. In subcritical flow the HGL depends on the TWL in the receiving watercourse, the critical depth (dc) in the outfall pipe and the soffit level of the outfall pipe.
If TWL > pipe soffit, then start HGL = TWL
If TWL ≤ pipe soffit and TWL≥ dc, HGL = pipe soffit
If TWL < dc, HGL = normal depth in the outfall pipe
As per NRA HD 33, the outfall pipe shall be above the 1 in 5 year level of the watercourse it is outfalling to.

National Roads Authority Volume 4 Section 2 Design Manual for Roads and Bridges Part 3 NRA HA 33/15
March 2015 18
The flow to pipelines is generally calculated by the Rational or Modified Rational method. The pipe sizing can be undertaken by Manning’s equation or Colebrook White.
Manning’s Equation:
V = R23S
12
n
where:
V = velocity (m/s)
S = energy slope (m/m)
n = Manning’s roughness coefficient (can be obtained from many standard textbooks and hydraulic simulation software)
R- hydraulic radius (m) = 𝐴𝐴𝑃𝑃
where:
A = cross section areas of flow (m2)
P = wetted perimeter (m)
The discharge flow, Q (m3/s) is given by Q = VA
The Colebrook-White equation is shown in section 4.8.
Pipe and Structure Losses:
Pipe Loss
Losses due to friction in pipes is given by:
Hf = �f(LV2)
2gD�
Where
Hf = head loss (m)
L = Pipe length (m)
D = pipe diameter (m)
V = average velocity (m/s) assuming pipe flow is full
g = acceleration due to gravity (9.81 m/s2)
f = Friction factor from Moody diagram (Figure 4/3)
To calculate f, the following is required:

National Roads Authority Volume 4 Section 2 Design Manual for Roads and Bridges Part 3 NRA HA 33/15
March 2015 19
e = Ks
D
and Reynolds number
Re = VDv
where:
e = relative roughness (m/m)
Ks = Roughness value (m)
D = Pipe diameter (m)
Re = Reynolds number
V = Average velocity of flow (m/s) assuming pipe flow is full
v = kinematic viscosity of the fluid
Figure 4/3 – Moody Diagram (Davis, 2005)

National Roads Authority Volume 4 Section 2 Design Manual for Roads and Bridges Part 3 NRA HA 33/15
March 2015 20
Structure Losses:
Losses due to obstructions, bends or junctions in pipelines can be expressed as a function of the velocity of flow in the pipe immediately upstream of the obstruction, bend or junction:
hs =K x Vo2
2 x g
where:
Hs = head loss at obstruction, bend or junction (m)
K = pressure change coefficient (dimensionless)
Vo = velocity of flow in the downstream pipe (m/s)
g = acceleration due to gravity (9.81 m/s2)
Vo2
2 x g = velocity head (m)
The pressure change coefficient depends on junction geometry, pipe diameters, bend radius, angle of change direction and size of obstructions.
Losses at Pipe Bends:
Given by:
Kb = 0.0033 ∆ V2
2g
∆ = angle of curvature in degrees
V = velocity of pipe flow (m/s)
g = acceleration due to gravity (9.81m/s2)
Chamber losses
Hw = kw �Vo2
2g�
where:
Vo = average velocity of flow (m/s)
g = acceleration due to gravity (9.81 m/s2)
kw = head loss coefficient
Exit losses:
The exit loss is function of the change in velocity at the outlet of the pipe. For a sudden expansion such as at an end wall, the exit loss is given by:

National Roads Authority Volume 4 Section 2 Design Manual for Roads and Bridges Part 3 NRA HA 33/15
March 2015 21
Ho = ko �Vo2
2g−
Vd2
2g�
where:
Vo = average outlet velocity (m/s)
Vd = channel velocity downstream of outlet in the direction of the pipe flow (m/s)
g = acceleration due to gravity (9.81 m/s2)
ko = head loss coefficient
It is unlikely the designer will analyse a network without the use of appropriate drainage design software however it is critical that these first principles of hydraulic design are fundamentally understood for the adequate auditing of a designed network to verify the model.
Software
The design flow for pipe networks is determined using the Rational or Modified Rational Methods. These calculate a peak discharge from a drainage catchment. Networks are typically designed using an appropriately design software suite capable of modelling steady state and dynamic flows and take account of pressure flow, pipe, chamber and inlet losses, chamber bypass and inlet and outlet losses. It is recommended that hydraulic design software is used to simulate drainage networks to check surcharge conditions within the network. This allows various duration and design return period events to be checked at once and can deal with drainage networks that have various pipe branches and flow conditions.
Sub-Surface Drainage
Sub-surface drainage is required to control the moisture content of the road pavement and the underlying material in order to maximise pavement strength and longevity. The main mechanisms by which moisture can enter a road subgrade and/or pavement are as follows (non - exhaustive): seepage from groundwater (aquifer/springs); movement of a water table beneath a road, rainfall infiltration through the road surfacing, lateral movement of moisture from the road shoulder/drains and capillary moisture from the verges/ water table. Sub-surface drainage systems comprise cut-off/interceptor drains that intercept moisture before it reaches the road subgrade and/or pavement.
Commonly used sub-surface drainage systems include fin or narrow filter drains and combined filter drains. The extension of the capping layer on embankment is another permitted sub-surface option. For further guidance on sub-surface drainage refer to NRA HD 33.
Managing sub-surface/groundwater issues require appropriately specialist knowledge, the following section has been provided for information and general guidance only. Section 4.22 provides a sample method for calculating the spacing of cut-off drains to cater for lowering the groundwater table.
Sample Method for Lowering the Groundwater Table
A system of cut-off drains below the pavement can lower the static water table.
The energy balance method or Darcy method are commonly used to calculate drain spacing for cut-off drains.

National Roads Authority Volume 4 Section 2 Design Manual for Roads and Bridges Part 3 NRA HA 33/15
March 2015 22
Van Schilfgaarde’s method can be used to determine drain spacing and is outlined below:
L = 3j [ k(de + mo)(de + m)t
2f(mo − m)]1/2
where:
L = spacing between drains (m)
j = geometrical factor (determined from Figure 4/6) (unitless)
k= saturated permeability (m/s)
mo = depth of drain below original water table (m)
m = depth of drain below the lowered water table (m)
m0 – m = distance water table is lowered (m)
de = equivalent depth of drain to impervious barrier (m). Differs from ‘d’ because of convergence of the flow lines
f = drainable pore surface, expressed as a fraction of total volume drained at 600mm tension
t = time to lower water table (sec)
An initial estimate of L is required with known values for d, mo, m, k, t and f. de can be estimated from figure 4/5. Then a convergence factor can be calculated from
Convergence factor = 𝑑𝑑𝑒𝑒𝑑𝑑𝑒𝑒+𝑚𝑚𝑜𝑜
and figure 4/6. This will allow estimation of j. Iteration of L is required to get conveyance with the initial estimate.
Figure 4/3 Diagram of Parameters for Schilfgaarde Method (Austroads)

National Roads Authority Volume 4 Section 2 Design Manual for Roads and Bridges Part 3 NRA HA 33/15
March 2015 23
Figure 4/5 Equivalent Depth for Convergence Correction (Austroads)
Figure 4/6 Dependence of Factor j on Depth to Impervious Layer (Austroads)

National Roads Authority Volume 4 Section 2 Design Manual for Roads and Bridges Part 3 NRA HA 33/15
March 2015 24
Software
Sub-surface drainage is not normally modelled with software unless there are groundwater issues. Where modelling of the sub-surface drainage is necessary the appropriate design software suite should be utilised.
Specification
The detailing of chambers should be in accordance with Series 500 of NRA RCD.
Pipe bedding and surround should be in accordance with NRA HD 140 and Series 500 of NRA SRW. Examples are provided in NRA HD 140 to guide the designer in the design of bedding and surround details.
Pipe materials should be in accordance with NRA HD 140 and Series 500 of NRA SRW.
Headwalls should be in accordance with Series 500 of NRA SRW and Series 500 of NRA RCD.
Scour protection should be in accordance with NRA HD 107.

National Roads Authority Volume 4 Section 2 Design Manual for Roads and Bridges Part 3 NRA HA 33/15
March 2015 25
5. ATTENUATION General
This chapter of the Advice Note gives guidance on the design of attenuation facilities to deal with surface water runoff from National Roads projects.
General recommendations on attenuation are given in NRA HD 33. Reference should be made to www.opw.ie/en/floodriskmanagement/ for information regarding flood risk management. Refer to www.floodmaps.ie and www.cfram.ie/pfra for information regarding flooding. NRA HD 45 provides guidance on flooding.
The guidance contained in this document is for information only and should be treated as such in the design of new schemes. This Advice Note should be read in conjunction with the following documents in the NRA DMRB:
a) NRA HD 83 Safety Aspects of Road-edge Drainage Features
b) NRA HD 139 Edge of Pavement Details
c) NRA HD 33 Drainage Systems for National Roads
d) NRA HD 45 Road Drainage and the Water Environment
e) NRA HD 106 Drainage of Runoff from Natural Catchments
f) NRA HD 107 Design of Outfall and Culvert Details
g) NRA HD 103 Vegetated Drainage Systems for Road Run-off
h) NRA HD 140 Determination of Pipe and Bedding Combinations for Drainage Works
i) NRA HD 137 Hydraulic Design of Road-Edge Surface Water Channels
j) NRA HD 119 Grassed Surface Water Channels for Road Runoff
k) NRA HD 78 Design of Outlets for Surface Water Channels
l) NRA HD 102 Spacing of Road Gullies
m) NRA HD 118 Design of Soakaways
SuDs employed on a scheme can collectively mitigate many of the adverse effects of storm water runoff created by the development on the environment. SuDs can reduce runoff rates, volumes, frequencies, encourage groundwater recharge, reduce pollutants, act as a buffer to accidental spillage and provide habitats in some cases. The choice of systems is discussed in more detail in NRA HD 33 and NRA HD 103.
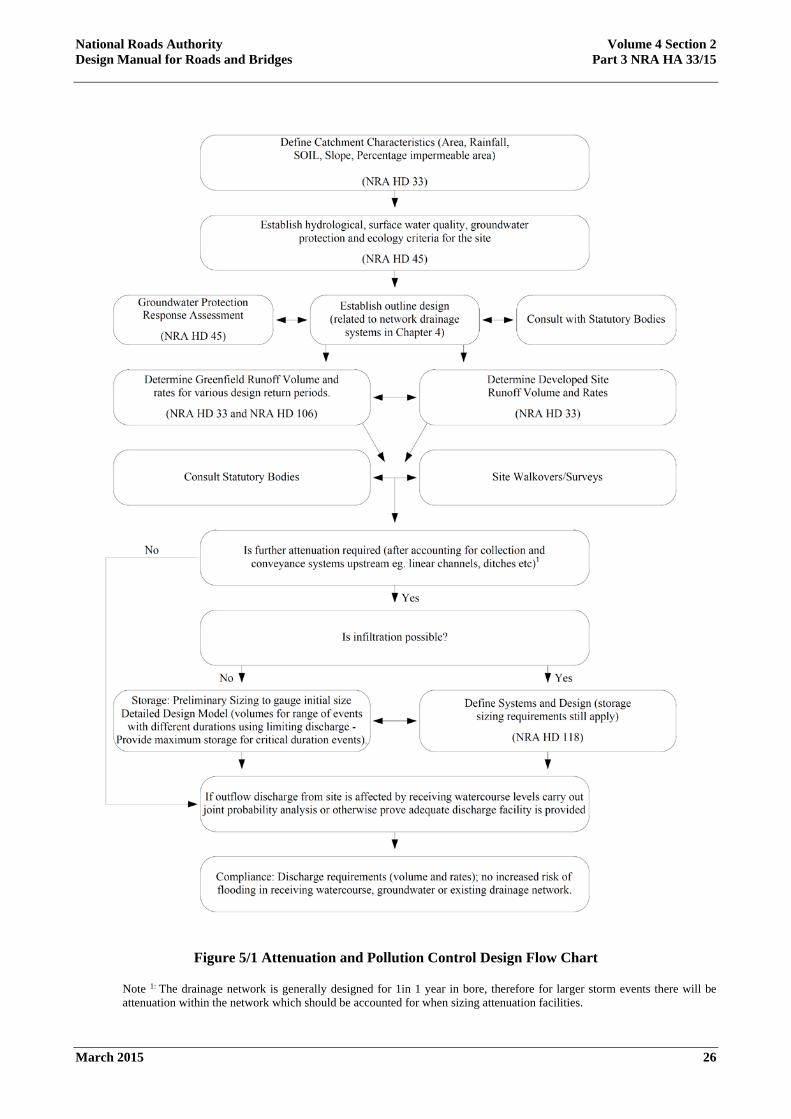
Figure 5/1 outlines the general procedure for design of attenuation facilities.
Refer to NRA HD 33 and NRA HD 103 for guidance on the choice of system.
National Roads Authority Volume 4 Section 2 Design Manual for Roads and Bridges Part 3 NRA HA 33/15
March 2015 26
Figure 5/1 Attenuation and Pollution Control Design Flow Chart
Note 1: The drainage network is generally designed for 1in 1 year in bore, therefore for larger storm events there will be attenuation within the network which should be accounted for when sizing attenuation facilities.

National Roads Authority Volume 4 Section 2 Design Manual for Roads and Bridges Part 3 NRA HA 33/15
March 2015 27
Figure 5/2 captures the different characteristics of a developed site versus a pre-development site. The development may reduce the permeability of the land surface by replacing free draining ground with impermeable areas. The natural vegetation that would have naturally attenuated the runoff in the pre-development site and allowed a certain element of rainfall to infiltrate and evaporate is replaced with compacted subsoil. This reduces the amount of infiltration and increases the rate at which water runs off the surface. Therefore the volume of runoff and rate of runoff increase for the developed site from the pre-development site.
Figure 5/2 Illustration of Pre-Development versus Post Development Hydrographs (Austroads)
Runoff from paved areas is effectively instantaneous when compared to greenfield runoff. If allowed to flow unrestricted, it will discharge into receiving waters at orders of magnitude greater than the undeveloped site. This can lead to flooding and flashy runoff from the catchment that could cause scour and erosion. It can also lower groundwater recharge.
The development or alteration of greenfield and brownfield sites may lead to flooding and channel erosion downstream of the development. The reduction in infiltration to soil can lead to low base flows in watercourses and reduce aquifer recharge and also damage habitats.
In general for small rainfall events, there is no measurable runoff taking place from greenfield areas into receiving watercourses. In contrast, runoff from road schemes takes place for the majority of rainfall events. Runoff from larger rainfall events can cause a large increase in the total volume of runoff.
In order to try to replicate the natural response of an undeveloped catchment, runoff rates from the site are restricted to closely match those of the pre-developed site. In doing so, attenuation storage is required to store the volumes of water occurring during storm events. The principle is that runoff for events of equivalent frequency of occurrence to the same peak rate of runoff that would have occurred pre-development. This is generally the greenfield rate (or other agreed rate in the case of brownfield sites). This slows down the response time to storm events and reduces the peak runoff rate. It does not greatly reduce the increase in runoff volume caused by developments. Infiltration systems can work well in achieving runoff volume reduction.
The objective of storm water management is to mimic the natural greenfield runoff characteristics of the site. In the case of brownfield site, this may be estimated pre-development rate and agreed with the relevant statutory body.

National Roads Authority Volume 4 Section 2 Design Manual for Roads and Bridges Part 3 NRA HA 33/15
March 2015 28
Determining the required attenuation storage volume involves estimating the greenfield runoff rate or brownfield runoff rate for various return periods and the post development runoff at different return periods to determine the volume required to reduce the post development peak flow rate to peak greenfield runoff rate for the critical storm duration up to a 1 in 100 year return period.
NRA HD 33 outlines the design return period requirements for runoff rates and associated attenuation facilities. There should be no increased risk of flooding in the receiving watercourse due to construction of the road up to the 100 year return period.
Greenfield Runoff Rate
For the purposes of this document rural catchments are assumed and greenfield runoff rates will be used for attenuation design purposes.
Typically IH 124 or ADAS methods are used to estimate greenfield runoff rates. Both equations should be used with caution. ‘Comment on Estimation of Greenfield Runoff Rate’ notes some of the issues with using various flow estimation methods. It notes that ‘ungauged flood estimation is considerably more difficult on small catchments as the variability in runoff characteristics become more pronounced and have a more significant effect’. The report lists some of the issues with using IH 124 for small catchments as the equation was developed based predominantly on data from very large watercourse catchments (>25km2). It also notes that soil types 1 and 2 were not well represented in the smaller catchments studied. To overcome some of the difficulties with these methods, the design should adopt ‘the average greenfield runoff rate (l/s per ha) at the local drainage area scale as it is generally at this scale that the impact reduction or urbanisation is required and at which the available estimation methods are more valid’.
Example 5/1
Determine the greenfield runoff rate for a site with the following characteristics.
Catchment Area of watercourse at outfall point: 0.189 km2 =18.9ha
Area of road footprint: 1.8ha
Area of impermeable road footprint: 1.22ha
SAAR (mm) =1251
M5-60 (mm) = 19.2
R (rainfall ratio) = 0.278
Catchment width, W = 350m
Catchment height, Z = 12m
The mean annual flood flow rate is calculated from Equation (1) in NRA HD 106:
𝑄𝑄𝑏𝑏𝑏𝑏𝑏𝑏 = 0.00108 𝑥𝑥 𝐴𝐴𝐴𝐴𝐴𝐴𝐴𝐴0.89 𝑥𝑥 𝑆𝑆𝐴𝐴𝐴𝐴𝐴𝐴1.17𝑥𝑥 𝑆𝑆𝑆𝑆𝑆𝑆𝑆𝑆2.17
National Roads Authority Volume 4 Section 2 Design Manual for Roads and Bridges Part 3 NRA HA 33/15
March 2015 29
where:
Qbar = catchment mean annual peak flow (approximately 2.3 years return period) (m3/s)
AREA = Catchment Area (km2)
SAAR = Standard average annual rainfall (mm)
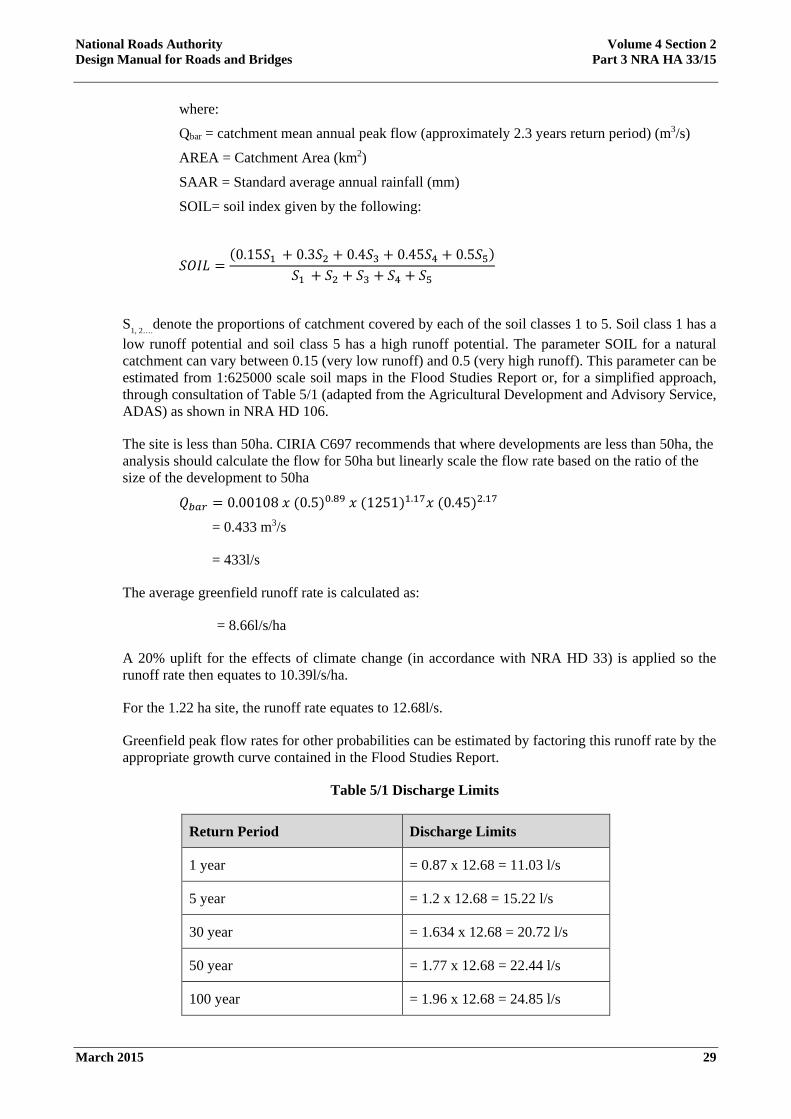
SOIL= soil index given by the following:
𝑆𝑆𝑆𝑆𝑆𝑆𝑆𝑆 =(0.15𝑆𝑆1 + 0.3𝑆𝑆2 + 0.4𝑆𝑆3 + 0.45𝑆𝑆4 + 0.5𝑆𝑆5)
𝑆𝑆1 + 𝑆𝑆2 + 𝑆𝑆3 + 𝑆𝑆4 + 𝑆𝑆5
S1, 2….denote the proportions of catchment covered by each of the soil classes 1 to 5. Soil class 1 has a low runoff potential and soil class 5 has a high runoff potential. The parameter SOIL for a natural catchment can vary between 0.15 (very low runoff) and 0.5 (very high runoff). This parameter can be estimated from 1:625000 scale soil maps in the Flood Studies Report or, for a simplified approach, through consultation of Table 5/1 (adapted from the Agricultural Development and Advisory Service, ADAS) as shown in NRA HD 106.
The site is less than 50ha. CIRIA C697 recommends that where developments are less than 50ha, the analysis should calculate the flow for 50ha but linearly scale the flow rate based on the ratio of the size of the development to 50ha
𝑄𝑄𝑏𝑏𝑏𝑏𝑏𝑏 = 0.00108 𝑥𝑥 (0.5)0.89 𝑥𝑥 (1251)1.17𝑥𝑥 (0.45)2.17
= 0.433 m3/s
= 433l/s
The average greenfield runoff rate is calculated as:
= 8.66l/s/ha
A 20% uplift for the effects of climate change (in accordance with NRA HD 33) is applied so the runoff rate then equates to 10.39l/s/ha.
For the 1.22 ha site, the runoff rate equates to 12.68l/s.
Greenfield peak flow rates for other probabilities can be estimated by factoring this runoff rate by the appropriate growth curve contained in the Flood Studies Report.
Table 5/1 Discharge Limits
Return Period Discharge Limits
1 year = 0.87 x 12.68 = 11.03 l/s
5 year = 1.2 x 12.68 = 15.22 l/s
30 year = 1.634 x 12.68 = 20.72 l/s
50 year = 1.77 x 12.68 = 22.44 l/s
100 year = 1.96 x 12.68 = 24.85 l/s

National Roads Authority Volume 4 Section 2 Design Manual for Roads and Bridges Part 3 NRA HA 33/15
March 2015 30
It should be noted that a standard factorial error (as per Chapter 3 and NRA HD 106) has not been applied as a conservative approach is considered appropriate for discharge limits. This is because the consequences of estimating a higher discharge could lead to flooding. A 20% uplift for climate change is applied to rainfall when estimating development runoff rates and volumes so the greenfield rate should also apply this factor when limiting the discharge.
Greenfield Runoff Volume
Greenfield runoff volumes are calculated to determine the maximum volume that should ideally be discharged from the road scheme.
Runoff Volume = Percentage Runoff x Catchment Area x Rainfall Depth.
There are a various methods for estimating the runoff volumes from greenfield sites. A hydrograph could be generated describing the flow against time for the catchment. The Flood Studies Report provides guidance on developing this.
Figure 5/3 Hydrograph
Other methods include the fixed percentage runoff method and variable percentage runoff method.
The fixed percentage runoff can be applied to individual surface types and is suitable for all catchments where a good estimate of runoff percentages can be established. The variable percentage runoff method only applies to impermeable surfaces and must be applied to all the impermeable surfaces. This is suitable for urban catchments (CIRIA C697).
The fixed percentage runoff was derived from the Flood Studies Report and is given by the following equation:
PRRURAL = SPR + DPRCWI + DPRRAIN
where:

National Roads Authority Volume 4 Section 2 Design Manual for Roads and Bridges Part 3 NRA HA 33/15
March 2015 31
PRRURUAL = total percentage runoff for the greenfield catchment for a particular event
SPR = standard percentage runoff, which is the fixed component of the percentage runoff and is a function of the five soil class fractions defined by: SPR=10S1+30S2 +37S3+47S4+53S5
DPRCWI = the dynamic component of the percentage runoff. This parameter reflects the increase in percentage runoff with increasing wetness. The catchment wetness index is a function of the average annual rainfall, shown in Figure 5/4 and is given by DPRCWI= 0.25 (CWI-125)
The DPRRAIN is the second dynamic component that increases the percentage runoff from large rainfall events and is given by: DPRRAIN = 0.45(P-40)0.7 for P>40mm (where P is rainfall depth)
Figure 5/4 Catchment Wetness Index (CWI) versus Standard Average Annual Rainfall (SAAR) (CIRIA C697)
The variable percentage runoff relates percentage runoff to increasing catchment wetness and is given by:
CWI = 125 + API5 – SMD
Where
API5 = 5-day antecedent moisture precipitation index, mm
SMD = pre-event soil moisture deficit (mm). This is a function of soil type, antecedent rainfall and evaporation.
API5 can be calculated by the following procedure:
First determine the rainfall depths (mm) for the 5 days prior to the event. The API5 value at 09.00 am on the day of the event is then defined by:

National Roads Authority Volume 4 Section 2 Design Manual for Roads and Bridges Part 3 NRA HA 33/15
March 2015 32
API59 = �0.512� [Pd−1 + (0.52)Pd−3 + (0.53)Pd−4 + (0.54)Pd−5]
where Pd-1 refers to the rainfall total 1 day prior to the event
Finally, the API5 at the time of the event is given by:
API5 = API59 x 0.5t−924 + Pt−9 x 0.5
t−948
where t is the time (hours) of the beginning of the event
Pt-9 = rainfall depth between time t and 09.00am.
For rural catchments the fixed percentage runoff method is typically used.
Development Runoff Rates
Initial estimates of development runoff rates from a developed site can be made using the Wallingford Procedure’s ‘Modified Rational’ approach.
The Rational Method is given by:
Q = C x I x A
Where:
Q is the flow
C is the coefficient of runoff
I is the average rainfall intensity for the design return period for a duration equal to the time of concentration
A is the contributing area
If Q is in litres/second, I in mm/hr and A in hectares then the formula may be expressed as:
Q = 2.78 x C x I x A
For the Modified Rational method, this is extended to:
Q = 2.78 x Cv x Cr x I x A
Where:
Cv is the Volumetric Runoff Coefficient,
Cr is a routing coefficient.
Cr is taken as 1.3, as recommended by the Wallingford Procedure
The equation then becomes:
Q = 1.3 x 2.78 x Cv x I x Ai

National Roads Authority Volume 4 Section 2 Design Manual for Roads and Bridges Part 3 NRA HA 33/15
March 2015 33
= 3.61 x Cv x I x Ai
where
Q = design peak runoff (l/s)
Cv = non-dimensional runoff coefficient which is dependent on the catchment characteristics. This can be taken as the mean value 0.75 for the summer profile and 0.84 for the winter profile as stated in the Flood Studies Report.
Alternatively this can be calculated by the following formula:
Cv = PR
PIMP
where:
PR is calculated using the Fixed Wallingford Procedure UK Runoff model or Variable Wallingford Procedure UK Runoff Model as outlined below.
PIMP =Ai
Ax 100
where:
Ai = impervious area (ha) and A = total area draining (ha)
I = rainfall intensity for the design return period (mm/hr) and for a duration equal to the time of concentration of the catchment. This method assumes that the rainfall intensity is constant during the time of concentration and that all the rainfall falling over the catchment contributes to flow.
The Fixed Wallingford Procedure UK runoff model is based on statistical analysis of catchments in the UK. It is given by the following equation:
PR=0.829PIMP + 25 SOIL + 0.078UCWI -20.7
where:
PR = percentage runoff
PIMP = percentage imperviousness (0 to 100) obtained by dividing the total directly connected impervious area by the total contributing area
SOIL = an index of the water holding capacity of the soil (Refer to chapter 3 for equation)
UCWI = urban catchment wetness index
= 125 + 8API5 – SMD
Where API5 = 5day antecedent precipitation index (mm)
SMD = SOIL moisture deficit (mm)

National Roads Authority Volume 4 Section 2 Design Manual for Roads and Bridges Part 3 NRA HA 33/15
March 2015 34
Design values are alternatively available in Figure 5/5 for winter and summer profiles.
Figure 5/5 Seasonal UCWI relationship with Standard Average Annual Rainfall (SAAR) (CIRIA C697)
The value for PR is then apportioned to the paved areas.
The Variable Wallingford Procedure UK Runoff model was derived to replace the fixed model due to difficulties experienced in its practical application.
It is given by the following:
𝑃𝑃𝐴𝐴 = 𝑆𝑆𝐼𝐼 𝑥𝑥 𝑃𝑃𝑆𝑆𝑃𝑃𝑃𝑃 + �100 − 𝑆𝑆𝐼𝐼(𝑃𝑃𝑆𝑆𝑃𝑃𝑃𝑃)�𝑁𝑁𝐴𝐴𝑃𝑃𝑆𝑆𝑃𝑃𝐼𝐼
where:
PR= percentage runoff
IF = effective paved area factor. Table 5/2 includes recommended values. Losses are given a constant fraction of rainfall volume.
Table 5/2 Recommended Values of IF (CIRIA C697)
Surface condition Effective Impervious Area Factor, IF
Poor 0.45
Fair 0.6
Good 0.75
PF = soil moisture depth (mm). This can be taken as 200mm.

National Roads Authority Volume 4 Section 2 Design Manual for Roads and Bridges Part 3 NRA HA 33/15
March 2015 35
PIMP = percentage impermeability (0 to 100)
NAPI = 30 day antecedent precipitation index (depends on the soil type). It is obtained by similar method to API5 in clause 5.1
API30 = �d−1,30
P−dCPn−0.5
where:
C is a decay coefficient related to soil type as shown in Table 5/3. Note that C is 0.5 in the API5 equation in clause 5.1.
Table 5/3 Relationship between SOIL Types and Decay Coefficient C (CIRIA C697)
Soil Types C
1 0.1
2 0.5
3 0.7
4 0.9
5 0.99
Development Runoff Volumes
Hydrograph methods can be used to define the volume of runoff for a developed site. These measure flow against time as shown in Figure 5/6 and are site specific. This can be obtained from hydraulic software for various durations and return periods, once the network drainage is modelled.

National Roads Authority Volume 4 Section 2 Design Manual for Roads and Bridges Part 3 NRA HA 33/15
March 2015 36
Figure 5/6 Hydrograph
Storage
Attenuation is provided to store development runoff volumes, by limiting the discharge from National Roads to receiving watercourses to a pre-development rate. The methods outlined in this section can be used to determine approximate values for storm water storage volumes. It should be noted that hydraulic simulation of different storm durations and return periods should be carried out as part of the detailed design of the attenuation facilities. This is typically carried out using hydraulic simulation software. The interaction with the upstream pipe drainage networks will also need to be checked to ensure that the attenuation facility doesn’t cause surcharging for the required pipe design return periods.
A flow hydrograph of the pre-developed catchment can be compared with the post developed catchment to determine the required storage volumes. The difference between the volumes is the volume to be stored. A simple method for estimating initial volumes (without simulation of network catchments) is outlined below.

National Roads Authority Volume 4 Section 2 Design Manual for Roads and Bridges Part 3 NRA HA 33/15
March 2015 37
Example 5/2
For the catchment described in example 5/1 determine the storage requirements.
Table 5/4 Attenuation Storage Volume
Impervious Area (Ai) =1.22 ha
Duration (hours) 0.5 1 2 4 6 12
Rainfall with Return Period of 30 years (mm) x 20%note 1 25.8 32.28 40.44 50.64 57.84 72.36
Intensity for 30 year event (I) (mm/hr) 51.6 32.28 20.22 12.66 9.64 6.03
Volume of Runoff (m3) = Rainfall x Area 314.8 393.8 493.4 617.8 705.6 882.79
Inflow (l/s) note 2 174.8 109.4 65.5 42.9 32.7 20.4
Greenfield Runoff (l/s)note 3 20.72 20.72 20.72 20.72 20.72 20.72
Flow to be Stored=Inflow - Greenfield (l/s) 154.1 88.7 47.8 22.2 11.9 -0.285
Storage Volume (m3) =Flow to be stored x Time x Area 277.5 319 344.2 319.4 258.1 -12.3
Max Volume Required in 30 year return period event 344.2m3
Note 1: Met Éireann provide rainfall profiles for specific sites. However design rainfall characteristics are complex and generic profiles are included within software such as the FSR and FEH within Microdrainage Windes to represent design storms. These are modified for different probabilities and durations and then used to establish greenfield and development drainage models. These should be factored up for climate change in accordance with NRA HD 33.
Note 2: The inflow was derived from the Modifed Rational Method given by:
Q = 3.61 x Cv x I x Ai. Cv is taken as 0.84 for the purposes of this example.
Note 3: The greenfield runoff rate is taken from example 5/1.
Stage Storage Relationship
A stage storage curve defines the relationship between the depth of water and the storage volume in a storage facility. The storage volumes for natural basins can be determined from topographic mapping and integrating the depth-area relationship of the basin. An initial plan area is assumed for the pond and then the storage can be determined from:
𝑉𝑉1 𝑡𝑡𝑡𝑡 2 = [ 𝐴𝐴1+ 𝐴𝐴22
] d
where:
V1 to 2 = storage volume (m3) between elevations 1 and 2

National Roads Authority Volume 4 Section 2 Design Manual for Roads and Bridges Part 3 NRA HA 33/15
March 2015 38
A1 = storage area at elevation 1 (m2)
A2 = surface area at elevation 2 (m2)
D = change in elevation between points 1 and 2 (m)
Figure 5/7 Stage Storage Curve (CIRIA C697)
Stage (head) – Discharge Relationship
A stage (head) – discharge relationship defines the relationship between the depth of water and the discharge from the storage facility.
The primary outlet usually consists of a pipe, weir, orifice plate or similar. An emergency outlet is typically provided also to provide bypass for floodwater during an event that exceeds the capacity of the primary outlet or if this becomes blocked. The implications of this emergency flow on downstream watercourses needs to be considered.

National Roads Authority Volume 4 Section 2 Design Manual for Roads and Bridges Part 3 NRA HA 33/15
March 2015 39
Figure 5/8 Stage (head) - Discharge Relationship (CIRIA C697)
Flow Controls
There are many methods for controlling flow. For example weirs, sluice gates, orifices and vortex. An orifice or vortex flow control is typically used on storage facilities. The flow rate for an orifice depends on the height of the water above the opening and the size and edge treatment of the orifice. For a single orifice the discharge can be determined using the following:
𝑸𝑸 = 𝑪𝑪𝒅𝒅𝑨𝑨𝒐𝒐�𝟐𝟐𝟐𝟐𝟐𝟐
where:
Q = orifice discharge rate (m3/s)
Cd = coefficient of discharge. This varies with changes in area ratio from the pipe diameter to the orifice diameter and Reynolds number (typical vales: 0.6 if the orifice plate material on the upstream side is narrower than the orifice diameter; 0.8 if the material is thicker than the orifice diameter, 0.92 if the edges of the orifice are rounded)
Ao = area of orifice (m2)
H = hydraulic head (m)
If the orifice discharges as a free outfall, the effective head is measured from the centre of the orifice to the upstream surface elevation. If the orifice is submerged the head is the difference in elevation of the headwater and tailwater surfaces.

National Roads Authority Volume 4 Section 2 Design Manual for Roads and Bridges Part 3 NRA HA 33/15
March 2015 40
Figure 5/9 Effective Head for Orifice Discharge Calculations (CIRIA C697)
Refer to NRA HD 33 for further information on flow control devices.
Software
It is recommended that hydraulic design software is used to simulate drainage networks to check surcharge conditions within the pond and upstream network. This allows various duration and design return period events to be checked at once.
Specification
Refer to Series 500 NRA SRW and Series 500 NRA NGSRE for attenuation specification requirements. Refer to NRA HD 107 for scour protection guidance.

National Roads Authority Volume 4 Section 2 Design Manual for Roads and Bridges Part 3 NRA HA 33/15
March 2015 41
6. POLLUTION CONTROL General
This chapter of the Advice Note gives guidance on pollution control of surface water runoff from National Roads projects.
NRA HD 45 provides guidance on estimation of the expected pollutants in road runoff. NRA HD 33 provides guidance on the pollutant removal capabilities of different drainage systems.
The guidance contained in this document is only informative and should be treated as such in the design of new schemes. This Advice Note should be read in conjunction with the following documents in NRA DMRB:
a) NRA HD 83 Safety Aspects of Road-edge Drainage Features
b) NRA HD 139 Edge of Pavement Details
c) NRA HD 33 Drainage Systems for National Roads
d) NRA HD 45 Road Drainage and the Water Environment
e) NRA HD 106 Drainage of Runoff from Natural Catchments
f) NRA HD 107 Design of Outfall and Culvert Details
g) NRA HD 103 Vegetated Drainage Systems for Road Run-off
h) NRA HD 140 Determination of Pipe and Bedding Combinations for Drainage Works
i) NRA HD 137 Hydraulic Design of Road-Edge Surface Water Channels
j) NRA HD 119 Grassed Surface Water Channels for Road Runoff
k) NRA HD 78 Design of Outlets for Surface Water Channels
l) NRA HD 102 Spacing of Road Gullies
m) NRA HD 118 Design of Soakaways
Refer to NRA HD 45 for flow diagrams of the design process.
The methods outlined in this section can be used to determine estimates of pollutants from National Roads projects and the design of pollution treatment facilities. It should be noted that these are difficult to predict and monitoring at outfall locations is the only way to confirm estimations and the effectiveness of the drainage systems. Studies carried out in the UK by the Highways Agency can help inform the choice of pollution control system. These are outlined in NRA HD 33.

National Roads Authority Volume 4 Section 2 Design Manual for Roads and Bridges Part 3 NRA HA 33/15
March 2015 42
Water Framework Directive
The EU Water Framework Directive 2000/60/EC (WFD) came into force on 22 December 2000 and its primary objective is for all waters to achieve ’good’ status by 2015 (Refer to http://www.wfdireland.ie/). The WFD also promotes the sustainable use of water resources, defines a management and reporting system based on River Basin Districts (RBDs) and sets environmental objectives which take account of the full range of pressures on the aquatic environment (including pollution, abstraction, flow regulation, habitat impact etc.). Eight River Basin Districts (RBD) have been identified on the island of Ireland, three of which are shared with Northern Ireland and one of which is wholly within Northern Ireland. The extents of these districts can be seen on the Water Framework website at http://www.wfdireland.ie A Register of Protected Areas is defined under the WFD and the criteria for sites to be included on this list are:
a) Waters used for the abstraction of drinking water;
b) Areas designated to protect economically significant aquatic species;
c) Recreational waters;
d) Nutrient sensitive areas; and,
e) Areas designated for the protection of habitats or species.
The regulations obligate local authorities to act as a unified force in each different RBD with the aim of establishing environmental objectives and measuring the levels of achievement of these objectives. Other responsibilities of the local authorities, under the regulations, are to set up river basin management plans and to establish River Basin District advisory councils. In order to implement this, co-ordination and guidance must be provided at a national level by the Minister for the Environment, Community and Local Government and EPA. There is a requirement, set by the regulations, that public bodies must co-ordinate and liaise with all relevant others including those outside the Republic in order to achieve and promote the implementation of these regulations.
The Directive was transposed into Irish Law by means of 5 main Regulations:
a) European Communities (Water Policy) Regulations 2003;
b) European Communities Environmental Objectives (Surface Waters) Regulations 2009;
c) European Communities Environmental Objectives (Groundwater) Regulations 2010;
d) European Communities (Good Agricultural Practice for Protection of Waters) Regulations 2010;
e) European Communities (Technical Specifications for the Chemical Analysis and Monitoring of Water Status) Regulations 2011.
In Ireland, the Department of the Environment, Community and Local Government (DECLG) has responsibility for the economic and policy aspects of the Directive. The Environmental Protection Agency (EPA) is responsible for coordination of all technical aspects of the Water Framework Directive. To date the EPA have established a number of measures to implement Articles 5 (Water Body Characterisation), Article 8 (Monitoring and Status Assessments), Article 10 (Combined use for point and diffuse sources), Article 11 (Programme of Measures), Article 13 (River Basin Management Plans) and Article 15 (Reporting) of the WFD. These have included; helping to delineate WFD management units, establishing programmes for the monitoring of water status by creating a national data management system, amongst others.
Refer to: http://watermaps.wfdireland.ie/NsShare_Web/Viewer.aspx?Site=NsShare&ReloadKey=True for mapping of the status, risk, objectives and measures in place for the various water bodies in Ireland.

National Roads Authority Volume 4 Section 2 Design Manual for Roads and Bridges Part 3 NRA HA 33/15
March 2015 43
Estimating Pollutants in Road Runoff
The UK Highways Agency’s (HA) Highway Agency Water Risk Assessment Tool (HAWRAT) was developed for the purposes of estimating expected pollutants from road runoff to inform the decision on the level of treatment required at each outfall. The toxicity thresholds determined through a research program between HA and Environmental Agency (EA) investigated the effects of routine runoff on receiving water bodies and their ecology. The tool has been designed to prevent adverse ecological effects. In artificial or heavily modified waters thresholds have been assigned to prevent adverse effects on ecological potential. The thresholds are consistent with the requirements of the Water Framework directive and are described in more detail in NRA HD 45.
An example of estimation of pollutants are shown below. Further examples are given in NRa HD 45.
Example 6/1 Method A
A motorway is being widened from dual two to dual three lane carriageways and hard shoulders. The completed motorway cross section will be 28 m wide. A 2km length of the road drains to a reach of a small good quality stream. The stream is used for recreational fishing. The following data apply:
Data for Step 1 – Runoff quality:
AADT for two-way flow 115,000 vehicles/day (expected future flow)
Climatic region Colder-wet (from maps in the Highways Agency Water Risk Assessment Tool (HAWRAT) Help Guide)
Rainfall site/SAAR 830mm (from maps in the HAWRAT Help Guide)
Data for Step 2 – River impacts:
95%ile river flow (Q95) 0.15 m3/s
Base flow index 0.6 (from LowFlows™ software)
Impermeable road area drained 5.6ha (2,000m × 28m/10,000)
Permeable area draining to outfall 2.2ha
Is the discharge in or within 1km No upstream of a protected site for conservation?
Water hardness 230mg CaCO3/l (from water sampling)
Is there a downstream structure, No lake, pond or canal that reduces the velocity within 100 m downstream of the point of discharge?
Tier 1, Estimated river width 4m (from site measurement)
Initially a Step 1 assessment is carried out. For a Step 1 assessment to work, the 95%ile river flow (Q95) has to be set to zero. The Annual Average Daily Traffic (AADT), climatic region and rainfall site should be selected from the ranges in HAWRAT and the ‘Predict Impact’ button clicked.

National Roads Authority Volume 4 Section 2 Design Manual for Roads and Bridges Part 3 NRA HA 33/15
March 2015 44
For the example above, once the tool has completed the calculations, the user interface displays red ‘fail’ boxes for each of the soluble pollutants and sediment-bound pollutants in the runoff, i.e. the runoff concentrations exceed the toxicity thresholds. A Step 2, river impact, assessment is therefore required. The data given above is entered into HAWRAT and a step 2 assessment is carried out. The Q95 of 0.15m3/s is included and the ‘Predict Impact’ button is clicked. The user interface should appear as in Figure A2.1. The detailed results sheet should appear as in Figure A2.2. It can be seen that each of the soluble pollutants and the sediment-bound pollutants pass the Step 2 assessment. The site is non-accumulating as the low flow velocity is 0.13m/s (i.e. above the depositing threshold of 0.1m/s).
To complete the risk assessment the annual average concentrations of dissolved copper and zinc are compared with the Environmental Quality Standard (EQS) values in Table A1.1 in NRA HD 45. HAWRAT displays the annual average concentration on the user interface. In this example, at Step 2, the annual average copper and zinc concentrations are 0.07μg/l and 0.36μg/l respectively. Both are below the EQSs.
Both the HAWRAT assessment and the comparison with EQSs give a ‘pass’. Table 5.2 in NRA HD 45 shows that no further assessment is required i.e. there is not considered to be a potential for adverse ecological impacts in the receiving river. Refer to Figure 6.1 and 6.2 for an extract from the tool.

National Roads Authority Volume 4 Section 2 Design Manual for Roads and Bridges Part 3 NRA HA 33/15
March 2015 45
Figure 6.1 HA WRAT User Interface After Running Step 2, Tier 1 Calculations for Example 6/1

National Roads Authority Volume 4 Section 2 Design Manual for Roads and Bridges Part 3 NRA HA 33/15
March 2015 46
Figure 6.2 HAWRAT Detailed Results After Running Step 2, Tier 1 Calculations for Example 6/1

National Roads Authority Volume 4 Section 2 Design Manual for Roads and Bridges Part 3 NRA HA 33/15
March 2015 47
Example 6/2 Method B
An assessment of outfall from an existing motorway has predicted the annual average concentrations shown in Table 6/1. The hardness of the receiving watercourse is 15mg/l CaCO3.
Table 6/1 – Method B Worked Example 6/2
Soluble Pollutant HAWRAT predicted annual average concentration (µg/l)
EQs* (µg/l)
Copper 3.91 1
Zinc 18.85 7
*corresponding to hardness and without bioavailability correction
The results show that the predicted concentrations are above the EQSs, hence the bioavailability of the soluble pollutants should be checked using a simple Biotic Ligand Model (BLM). To obtain the parameters required to carry out the assessment, five water samples were taken from the watercourse just upstream of the outfall over a six month period. The average results from laboratory tests were:
pH 6.7
Water hardness (as Ca) 5.4mg/l
Dissolved Organic Carbon (DOC) 1.2mg/l
The data was fed into the simple BLM to determine the site-specific Probable Non-Effect Concentration (PNEC). The PNECs determined by the BLM were:
Dissolved copper 2.7μg/l
Dissolved zinc 8.0μg/l
The annual average concentrations predicted by HAWRAT are greater than the PNECs indicating that there may be an impact on ecology. For Copper (but not Zinc), a more comprehensive bioavailability check is available that considers all the mitigating factors. However, for the example above, with Zinc failing the BLM, the practitioner may need to look to alternative design and/or mitigation anyway and further consideration of the bioavailability of copper may be unnecessary. However, if there is need (or if Zinc had passed the simple BLM) then Copper should be checked using the more detailed BLM. To enable this check, the water samples taken previously were also analysed for the following parameters:
Temperature 10.4 °C
Magnesium 4.2mg/l
Sodium 44mg/l
Potassium 1.1mg/l
Sulphate 6.6 mg/l
Chloride 56mg/l
Alkalinity 55ppm CaCo3

National Roads Authority Volume 4 Section 2 Design Manual for Roads and Bridges Part 3 NRA HA 33/15
March 2015 48
These data were fed into the detailed Copper BLM to determine the site-specific PNEC. The PNEC determined by the BLM was:
Dissolved Copper 3.8μg/l
The annual average concentration predicted by HAWRAT remains greater than the PNEC indicating that there may be an impact on ecology. NRA HD 45 should be consulted as to how to proceed if the predicted annual averages fail against the EQSs.
Choice of system
The selection of a treatment system depends on site characteristics, catchment characteristics, quantity and quality requirements and environmental requirements. It also depends on the level of treatment required. Once an assessment of the expected pollutants at an outfall are determined, the designer should refer to NRA HD 33 and NRA HD 103 for selection of treatment systems based on different systems potential to remove different types of pollutants. As discussed in Chapter 2 a surface water management train should be used to treat the runoff incrementally.
Design of Pond Treatment
Where the pond is the first or only suitable treatment system for a network, a permanent pool should be designed in the pond to treat pollutants. CIRIA C697 outlines an empirical method to calculate treatment volumes. This is linked to the variable rainfall depth for the area and is approximately equivalent to 10-15mm rainfall depths.
𝑉𝑉𝑡𝑡 = 9𝐷𝐷[𝑆𝑆𝑆𝑆𝑆𝑆𝑆𝑆
2+ �1 −
𝑆𝑆𝑆𝑆𝑆𝑆𝑆𝑆2
� 𝑆𝑆]
where:
Vt = Water quality treatment volume (as a function of the total development area)
SOIL = Soil classification (from Flood Studies Report or Wallingford Procedure WRAP map) (Refer to Chapter 3 for formula)
I= Fraction of the area which is impervious
D = M5-60 minute rainfall depth
A fixed rainfall depth approach can also be applied. Typically values range from 11 to 15mm and these should be applied to the impermeable area of the catchment only. This provides a simple method for determining treatment volumes.
A factor of safety is then multiplied by the volume calculated by either of these methods. This varies depending on the level of risk or the presence of upstream treatment systems.
CIRIA C697 recommends a range of factors as shown in Table 6/2.

National Roads Authority Volume 4 Section 2 Design Manual for Roads and Bridges Part 3 NRA HA 33/15
March 2015 49
Table 6/2 Water Quality Treatment Volume Factors for Permanent Pool Sizing (CIRIA C697)
Factor Receiving Watercourse Sensitivity
Contributing Catchment Pollution Risk
Upstream Treatment Devices
Notes
<1 Low Low Yes Factor can be reduced depending on treatment volumes provided in upstream devices
1 Low Low No Minimum factor required where pond provides main treatment component and pollution risks are low.
>1 Low
High
High
Low
Possibly Where watercourse sensitivity is high and/or risks of pollution from the contributing catchment are significant. A factor of between 2 and 4 should be agreed with the environmental regulator, depending on the estimated risks. This can be reduced if upstream components are included.
Example 6/3 Pond Treatment Volume
Calculate the permanent pool volume required for runoff from a road with 1.8ha area. 80% of this area is estimated to be impermeable.
The SOIL index calculated from the Flood Studies Report is 0.45. The M5-60 is calculated from the Flood Studies Report maps as 15.5mm.
Using the fixed rainfall approach this equates to:
Vt = factor of safety x area x factor impermeable area (m2) x rainfall (m)
= 2 x 18000 x 0.8 x 0.015=432m3
In this case it was felt that the pollution risk justified having more than 1 x Vt but upstream SuDs allowed this to be limited to 2 x Vt.
Using the variable rainfall method:
𝑉𝑉𝑡𝑡 = 9(15.5) �0.45
2+ �1 −
0.452� 0.8�
= 114 m3/ha
As Vt is applied to the whole catchment area, then Vt becomes:
= 2 x 1.8 x 114 = 410m3

National Roads Authority Volume 4 Section 2 Design Manual for Roads and Bridges Part 3 NRA HA 33/15
March 2015 50
To be conservative, the treatment volume, Vt, was selected as the higher of the two methods.
Petrol/Oil Separators
There are two main types of petrol/oil separator: the full retention separator and the bypass separator. Their primary function is to remove oil from the water column, but they are less effective at removing soluble oils or other water-soluble liquids.
Full retention separators are used where all the runoff has to be treated. Their application will be very rare on roads, and their use is usually reserved for locations such as garage forecourts. Exceptionally, they may be used in maintenance depots, and where the receiving environment is especially sensitive.
Bypass oil separators typically only provide full treatment to 10% of the design maximum runoff. This recognises the greatest pollutant load carried by the ‘first flush’ of a runoff event. In Ireland, 10% of the typical peak rainfall intensity is approximately 5mm/hour. Only 1% of all rainfall events have a rainfall intensity exceeding 5mm/hour, so such separators will cater for the large majority of events.
All oil separators must have a specified storage capacity, which in most cases will reflect a minimum time of retention at design peak flow. In some cases, the ability to hold the entire capacity of a tanker (normally 25 m3) may also be required to provide containment of accidental spillage, e.g. vehicle maintenance area, goods vehicle parking or vehicle manoeuvring.
Design of Petrol/Oil Separators
The nominal size (NS) is a number, without units, approximately equivalent to the maximum effluent flow in litres per second from the separator.
The nominal size (NS) of a full retention separator that is required for a catchment area (A in m2) shall be calculated using the following formula:
NS = 0.018 ×A
The nominal size of a bypass separator that is required for a catchment area (A in m2) shall be calculated using the following formula:
NSB = 0.0018 ×A
The preferred nominal sizes of separator systems for light liquids are: 1, 3, 5, 6, 10, 15, 20, 30, 40, 50, 65, 80, 100, 125, 150, 200, 300, 400 and 500.
Capacity for silt storage (C in litres) can be calculated according to the following:
C = NS x 100
or
C = NSB x 100
Silt capacity must be provided either upstream of the separator or in the bypass weir chamber, and not in the main oil separating chamber. Separators must be designed such that when the silt chamber or silt area of the separator is full of silt, this will not affect the operation of the separator, the skim pipe or the by-pass device. Refer to IS EN858-2: 2003 for further guidance on sludge trap/silt storage design.

National Roads Authority Volume 4 Section 2 Design Manual for Roads and Bridges Part 3 NRA HA 33/15
March 2015 51
The oil storage capacity is defined as the volume of separated oil that can be stored in the separator without any of the stored oil entering the inlet or outlet of the separator. The oil storage volume (V in litres) is given by the following:
V = NS x 10
or
V = NSB x 15
Example 6/4 Sizing Calculation (Bypass Separator)
Catchment (A): 1660 m2
Nominal Size (NSB):
NSB = 0.0018 x 1660 = 3
Silt Storage Capacity (C):
C = 3 x 100 = 300 litres
Oil Storage Capacity (V):
V = 3 x 10 = 30 litres
Petrol/Oil separators should be designed to take consideration of surrounding groundwater levels and buoyancy.
Refer to NRA HD 103 for further guidance on pollution control design.
Specification
Refer to Series 500 of NRA SRW, NRA NGSRW and NRA HD 103 for specification of pollution control systems.

National Roads Authority Volume 4 Section 2 Design Manual for Roads and Bridges Part 3 NRA HA 33/15
March 2015 52
7. GLOSSARY Aquifer A sub-surface layer or layers of rock or other geological strata of
sufficient porosity and permeability to allow either a significant flow of groundwater or the abstraction of significant quantities of groundwater.
Attenuation Storage Volume used to store runoff during extreme rainfall events, Runoff rates are restricted to closely match those of the pre-development site to replicate the natural response.
Baffle A device used to restrain the flow.
Brownfield Denoting or relating to urban sites for potential development that have previous development on them.
Catchment The action of collecting water, especially the collection of rainfall over a natural drainage area.
Conventional drainage The traditional method of drainage surface water sing sub-surface pipes and tanks.
Conveyance Movement of water from one area to another.
Critical duration event The duration of rainfall events likely to cause the highest peak flows at a particular location, for a specified return period event.
Filtration The action or process of filtering. The act of removing sediment or other particles from runoff by passing it through a filter.
Flow control device Process of managing the rate of flow from one point to another
Greenfield runoff Surface water runoff regime from a site before development.
Groundwater All water which is below the surface of the ground in the saturation zone (below the water table) and in direct contact with the ground or subsoil.
Hydrograph Graph showing the rate of flow (discharge) versus time past a specific point in a river, channel etc.
Impermeable Doesn’t allow fluid to pass through
Infiltration Process by which water on the ground surface enters the soil.
Orifice Plate A device used for restricting flow.
Percentage Runoff The portion of rainfall that runs off a surface
Permeability A measure of the ease at which fluid to passes through a porous medium.
PIMP Percentage of catchment area covered by impervious surfaces
Q95 The flow rate of the watercourse that is exceeded for 95% of the time.
National Roads Authority Volume 4 Section 2 Design Manual for Roads and Bridges Part 3 NRA HA 33/15
March 2015 53
QBAR Median annual peak flow in a watercourse.
Return Period Recurrence interval: estimate of the likelihood of an event to occur (flood/river discharge flow etc)
Runoff The draining away of water from the surface.
SUDS Sustainable drainage systems: Surface water management that combines a sequence of management practices and control structures designed to drain surface water in a more sustainable fashion than some conventional techniques.
SOIL The soil index parameter: calculated to determine runoff potential
with regard to soil permeability, slope and antecedent moisture content.
Surface Water Waters including rivers, lakes, lochs, loughs, reservoirs, canals,
streams, ditches, coastal waters and estuaries.
Storm Water Surface water in abnormal quantity resulting from heavy falls of rain or snow.
Swale Wide, shallow, gently sloping depressions designed to convey water. From a treatment viewpoint their primary function is to slow the flow of water to provide filtration, and this parameter may need to be balanced with their additional attenuation functions of conveyance and water storage.
Time of concentration Time required for rain falling at the farthest point of the catchment to flow to the catchment outlet where the peak flow is being calculated.
Weir A structure built across a river/stream to raise the water upstream or regulate its flow.
Wetland Areas that are permanently saturated by surface water or groundwater so that they are able to support aquatic and/or semi-aquatic vegetation. They can be used to treat surface water runoff.

National Roads Authority Volume 4 Section 2 Design Manual for Roads and Bridges Part 3 NRA HA 33/15
March 2015 54
8. REFERENCES Manual of Contract Documents for Road Works (NRA MCDRW)
a) NRA Specification for Road Works (NRA SRW) (MCDRW 1)
b) Notes for Guidance on the Specification for Road Works (NRA NGSRW) (MCDRW 2)
c) Road Construction Details (NRA RCD) (MCDRW 4)
NRA Design Manual for Roads and Bridges (NRA DMRB)
a) NRA HD 83 Safety Aspects of Road-edge Drainage Features
b) NRA HD 139 Edge of Pavement Details
c) NRA HD 33 Drainage Systems for National Roads
d) NRA HD 45 Road Drainage and the Water Environment
e) NRA HD 106 Drainage of Runoff from Natural Catchments
f) NRA HD 107 Design of Outfall and Culvert Details
g) NRA HD 103 Vegetated Drainage Systems for Road Run-off
h) NRA HD 140 Determination of Pipe and Bedding Combinations for Drainage Works
i) NRA HD 137 Hydraulic Design of Road-Edge Surface Water Channels
j) NRA HD 119 Grassed Surface Water Channels for Road Runoff
k) NRA HD 78 Design of Outlets for Surface Water Channels
l) NRA HD 102 Spacing of Road Gullies
m) NRA HD 118 Design of Soakaways
NRA 2010 Project Management Guidelines.
Water Framework Directive (2000/60/EC).
Groundwater Directive (2006/118/EC).
Austroads (2013). Guide to Road Design Part 5A: Drainage – Road Surface, Networks, Basins and Subsurface. NSW, Australia.
CIRIA (2007). “The SUDS Manual”, by Woods-Ballard B, Kellagher R, Martin P, Jefferies C, Bray R, Shaffer P, CIRIA C697, London, ISBN 978-0-860 17-697-8.
Davis, T 2005, Moody diagram, plot, College of Engineering, University of Southern Florida, Tampa, Florida, USA, viewed 27 June 2014, (www.eng.usf.edu/~tdavis/methods/moody.si.pdf).
National Hydrology Seminar (2003). “Comment on Estimation of Greenfield Runoff Rates”, Cawley A.M and Cunnnane C, 2003.
IH Report 124 (1994). “Flood estimation for small catchments”, Marshall D.C.W. and Bayliss A.C., Report No.124, Institute of Hydrology, UK, ISBN 0 948540 62 1.

National Roads Authority Volume 4 Section 2 Design Manual for Roads and Bridges Part 3 NRA HA 33/15
March 2015 55
Agricultural Development and Advisory Service, ADAS (1980). “Pipe size design for field drainage”, Bailey A.D., Dennis C.W., Harris G.L. and Horner M.W. Report 5, Land Drainage Service, Research and Development, MAFF, December 1980.
Natural Environment Research Council (1975). “Flood Studies Report”. In five volumes.
HR Wallingford (1981). The Wallingford Procedure: Design and Analysis of Urban Storm Drainage
HR Wallingford (2006). “Tables for the Hydraulic Design of Pipes, Sewers and Channels”, 8th edition (in two volumes) by HR Wallingford, DIH Barr and Thomas Telford, ISBN 0727733850, UK, 2006.
Greater Dublin Strategic Drainage Study (GDSDS). Regional Drainage Policies, Technical Document, Volume 2, New Development, Dublin, March 2005.
National Roads Authority. Drainage Design for National Road Schemes – Sustainable Drainage Options. 2014.
I.S. EN 858 – 1: 2002. Separator systems for light liquids – Part 1. National Standards Authority of Ireland.
I.S. EN 858 – 2: 2003. Separator systems for light liquids – Part 2. National Standards Authority of Ireland.
SEPA Pollution Prevention Guidelines 3. Use and design of oil separators in surface water drainage systems. Scottish Environmental Protection Agency
European Communities (Water Policy) Regulations 2003.
European Communities (Good Agricultural Practice for Protection of Waters) Regulations 2010.
European Communities (Technical Specifications for the Chemical Analysis and Monitoring of Water Status) Regulations 2011.
European Communities Environmental Objectives (Groundwater) Regulations 2010.
European Communities Environmental Objectives (Surface Water) Regulations 2009.

National Roads Authority Volume 4 Section 2 Design Manual for Roads and Bridges Part 3 NRA HA 33/15
March 2015 56
9. ENQUIRIES All technical enquiries or comments on this document, or any of the documents listed as forming part
of the NRA DMRB, should be sent by e-mail to [email protected], addressed to the following:
Head of Network Management, Engineering Standards & Research National Roads Authority St Martin’s House Waterloo Road Dublin 4
…………………………...
Pat Maher Head of Network Management,
Engineering Standards & Research

TII Publications Design of Earthworks Drainage, Network Drainage, Attenuation & Pollution Control
DN-DNG-03066 March 2015


