Page 1
Sensors 2014, 14, 3737-3755; doi:10.3390/s140203737
sensors ISSN 1424-8220
www.mdpi.com/journal/sensors
Article
DNA-Aptamers Binding Aminoglycoside Antibiotics
Nadia Nikolaus and Beate Strehlitz *
Helmholtz Centre for Environmental Research (UFZ), Permoserstraße 15, Leipzig 04318, Germany;
E-Mail: [email protected]
* Author to whom correspondence should be addressed; E-Mail: [email protected] ;
Tel.: +49-341-235-1764; Fax: +49-341-235-451764.
Received: 29 October 2013; in revised form: 20 January 2014 / Accepted: 30 January 2014 /
Published: 21 February 2014
Abstract: Aptamers are short, single stranded DNA or RNA oligonucleotides that are able
to bind specifically and with high affinity to their non-nucleic acid target molecules. This
binding reaction enables their application as biorecognition elements in biosensors
and assays. As antibiotic residues pose a problem contributing to the emergence of
antibiotic-resistant pathogens and thereby reducing the effectiveness of the drug to fight
human infections, we selected aptamers targeted against the aminoglycoside antibiotic
kanamycin A with the aim of constructing a robust and functional assay that can be used
for water analysis. With this work we show that aptamers that were derived from a
Capture-SELEX procedure targeting against kanamycin A also display binding to related
aminoglycoside antibiotics. The binding patterns differ among all tested aptamers so that
there are highly substance specific aptamers and more group specific aptamers binding to a
different variety of aminoglycoside antibiotics. Also the region of the aminoglycoside
antibiotics responsible for aptamer binding can be estimated. Affinities of the different
aptamers for their target substance, kanamycin A, are measured with different approaches
and are in the micromolar range. Finally, the proof of principle of an assay for detection of
kanamycin A in a real water sample is given.
Keywords: aptamer; Capture-SELEX; aminoglycoside antibiotic; kanamycin
OPEN ACCESS
Page 2
Sensors 2014, 14 3738
1. Introduction
Aptamers are short, single stranded DNA or RNA oligonucleotides that are able to bind specifically
and with an affinity that is comparable to that of antibodies to their non-nucleic acid target molecules.
Compared to antibodies, aptamers, particularly DNA ones, are more stable concerning degradation or
denaturation and they are able to recognize a distinct epitope of a target molecule [1]. Binding between
aptamer and target molecule is provided by different intermolecular interactions like electrostatic
interactions between charged groups, stacking of aromatic structures contained in organic compounds
and the nucleobases, hydrogen bonds, and the complementary in three-dimensional shape. Aptamers
can be developed for a vast variety of possible targets ranging from small organic molecules over
peptides and proteins to complex structures like cells or viruses [2]. Since the first development of
aptamers in 1990 [3], these antibody rivaling structures are on their way to finding applications not
only as receptors in medical and environmental analysis or the analysis of food and pharmaceuticals,
but also for application as new drugs in medicine or for clinical diagnostics imaging and some others.
Aptamers are usually generated by an iterative in vitro process called SELEX that constricts a starting
library consisting of a multitude of random nucleic acid molecules to a small subset of strongly
binding species by successive rounds of binding to the target, elution of bound oligonucleotides and
their amplification [4]. Selection can be modified by introduction of negative or counter selection steps
in order to increase the stringency of binding conditions or to obtain aptamers binding to specific
epitopes in the target molecule or even to distinguish between chiral molecules [2,5].
In case of an enrichment of binding oligonucleotides, a pool of aptamers with unknown sequence
will be obtained. In order to get individual aptamers, this pool has to be cloned and the sequence has to
be determined. After sequencing, the now known sequences can be analyzed according to consensus
motifs or conserved regions within the sequences which indicate possible binding regions. A
consecutive step would be the testing of single aptamers in order to choose those with the best binding
characteristics for the envisaged application. Also possible modifications for specific needs, like
immobilization or detection paths, can be inserted.
The possible application of DNA aptamers in biosensors for the detection of environmental
contaminants or in materials for their enrichment or filtration is a relatively new field of application.
The pollution of waters—surface water, ground water, drinking and waste water—by pharmaceutical
residues is a serious problem. Those residues find their way into the water cycle after administration of
the drugs via human or animal excretion. They are often relatively stable, some of them are resistant to
degradation in sewage plants and are found, even though in trace concentrations, in all environmental
compartments. Antibiotic residues represent a special problem because they contribute to the
emergence of antibiotic-resistant pathogens and reduce the effectiveness of the antibiotic to combat
human infections.
Aminoglycoside antibiotics were discovered in the 1940s and are to date the most commonly
used antibiotics worldwide thanks to the combination of their high efficacy with low cost even
though they have serious side effects of renal and auditory toxicity. Aminoglycoside antibiotics are
low-molecular-weight molecules of approximately 300–600 Daltons. All natural and semisynthetic
aminoglycosides share a similar structure consisting of several, usually three, rings. These rings are
cyclitols (a saturated 6-carbon ring structure) and five or six-membered sugars that are linked via
Page 3
Sensors 2014, 14 3739
glycosidic bonds. Aminoglycoside antibiotics have a broad antibacterial spectrum and they are
effective against gram-negative bacteria. They show bactericidal properties, i.e., they are able to kill
bacteria and not only to prevent their growth [6].
Misuse or overuse of antibiotics in general both in human as in veterinary medicine as well as the
use of antibiotics as growth enhancers in livestock create selective evolutionary pressure that enables
antimicrobial resistant bacteria to survive and propagate preferentially. Injudicious subtherapeutic use
of medically important antimicrobial drugs in food-producing animals for production or growth-enhancing
purposes seriously adds to the problem of resistance formation [7]. Kallova et al. found the
dramatically increase of the aminoglycoside resistance in clinical Gram-negative bacterial isolates in
Slovakia within ten years [8]. They determined the importance and disseminations of enzymatic
mechanisms for this resistance. Molecular mechanisms for resistance formation concerning
aminoglycoside antibiotics are either the modification of the antibiotic targets, that is the bacterial
ribosomal rRNA [9] or enzymatic modification of the antibiotic drug itself, resulting in a product that
is no longer effective as antibiotic [10].
Although the European Union banned the subtherapeutic feeding of antibiotics and related drugs to
food-producing animals in 2006, the amount of antibiotics released in the environment from farms and
human’s sewage will likely stay at rather high levels in the future. This means that besides control
policies in the use of antibiotics, studies for improving their degradation are needed [11]. The
development of analytic tools for fast and easy detection and new materials to remove antibiotic drugs
from the environment would be very desirable. The aim of this study was to characterize and modify
DNA aptamers for kanamycin A that were developed beforehand by Capture-SELEX [12] regarding
specificity and affinity. Also some truncated variants of these aptamers were tested. Moreover, the
proof of principle of an assay was tested for the detection of kanamycin A in real effluent samples of a
water treatment plant.
2. Experimental Section
2.1. Chemicals
All chemicals for preparing buffers and solutions were obtained from Merck (Darmstadt,
Germany). Kanamycin A disulfate salt dihydrate, gentamicin sulfate salt hydrate, glucosamine,
N-acetyl-D-glucosamine, neomycin trisulfate hydrate, sisomicin sulfate salt, streptomycin sulfate salt,
sulfacarbamide, sulfamethoxazole, sotalol hydrochloride, and tobramycin were purchased from
Sigma-Aldrich (Seelze, Germany). Kanamycin B and netilmicin sulfate were purchased from LKT
Laboratories (St Paul, MN, USA), paromomycin sulfate was purchased from U.S. Pharmacopeia
(Rockville, MD, USA), and apramycin sulfate from Applichem (Darmstadt, Germany). For an overview
of the pharmaceuticals and their chemical structures see Figure 1. Four of the pharmaceuticals
(kanamycin A disulfate salt dihydrate, sulfacarbamide, sulfamethoxazole, and sotalol hydrochloride),
were used as aptamer selection target mixture. Individual stock solutions of the pharmaceuticals were
prepared, diluted in selection buffer and mixed to the final concentration of 1 mmol L−1
for each
substance. The pH value was adjusted to ~7.6 and the mixture was sterile-filtered using a syringe filter
with the pore size of 0.22 µm (VWR, Dresden, Germany), aliquoted and stored at −18 °C.
Page 4
Sensors 2014, 14 3740
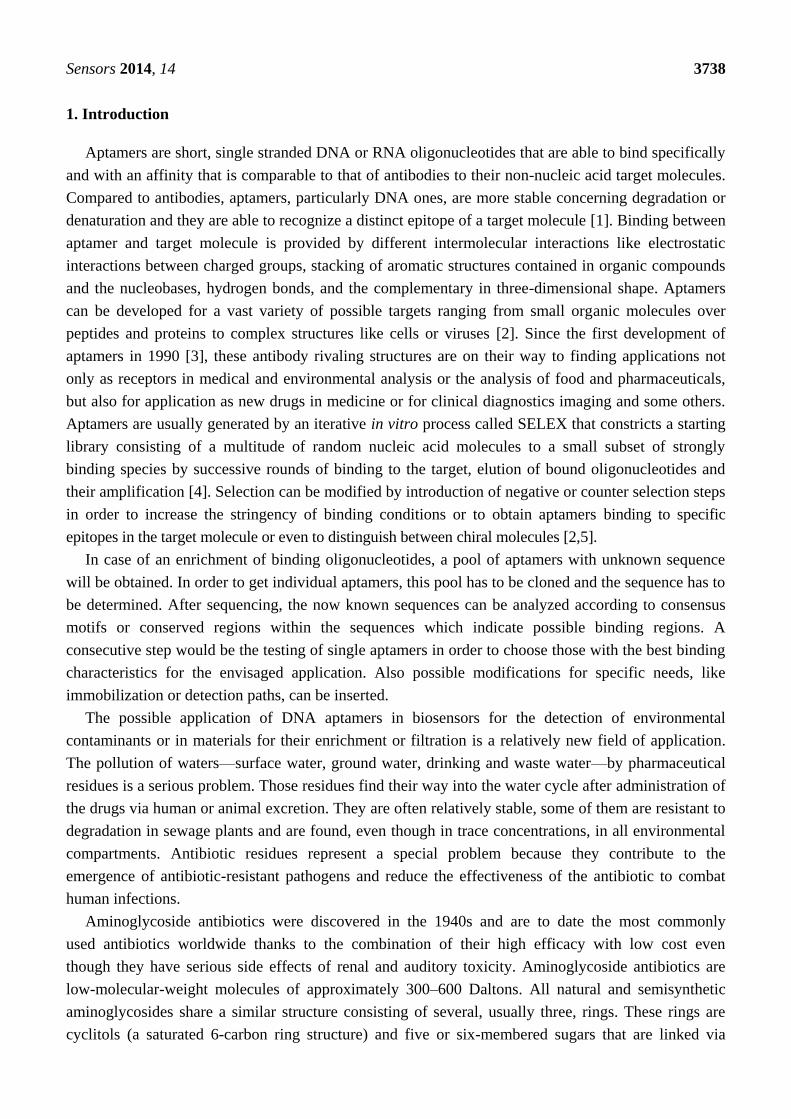
Figure 1. (a) Chemical structures of the selection targets. Numbering of the rings and pKa
values of amino groups according to [13]; (b) Chemical structures of aminoglycoside
antibiotics other than kanamycin A. Differences in the structure compared to kanamycin A are
marked in yellow. Numbering of the rings and pKa values of amino groups according to [13];
(c) Chemical structures of amino sugars. Differences in the structure compared to
kanamycin A are marked in yellow.
(a):
Kanamycin A (aminoglycoside antibiotic) Sulfacarbamide (sulfonamide antibiotic)
Sulfamethoxazole (sulfonamide antibiotic) Sotalol (β-adrenergic receptor blocker)
(b):
Kanamycin B Tobramycin
Gentamicin
Neomycin
Apramycin Netilmicin
Sisomicin Streptomycin
Page 5
Sensors 2014, 14 3741
Figure 1. Cont.
Paromomycin
(c):
Glucosamine N-acetyl-D-glucosamine
2.2. Selection and Truncation of Aptamers
The aptamers used here were obtained by the Capture-SELEX procedure. The method as well as
the development of the aptamers was described in detail earlier [12]. The peculiarity of the
Capture-SELEX is that the oligonucleotides of the random library are immobilized on magnetic beads,
whereas the target molecules can be used in solution. By this way, aptamer selection is possible for
small molecules which are not immobilizable. Briefly, the oligonucleotides of the random library
contain a modified randomized region including 12 nucleotides with fixed sequence, the docking
sequence (TGAGGCTCGATC) and two random regions of different length (N10 and N40), and
the primer binding sites at both ends (5' primer: ATACCAGCTTATTCAATT, 3' primer:
AGATAGTAAGTGCAATCT). The complete sequence of the oligonucleotides of the random library
(BANK-S4) looks as follows: 5' ATACCAGCTTATTCAATT—N10—TGAGGCTCGATC—N40
—AGATAGTAAGTGCAATCT 3'. The 18 nt-sequences at the 5' and 3' ends, respectively, are primer
binding sites that serve for the amplification of the obtained oligonucleotides in a PCR. The capture
oligo iODN2Sp (5' Bio-GTC-HEGL-GATCGAGCCTCA 3') contains the complementary sequence of
the docking sequence and a hexaethylene glycol spacer (HEGL) near the 5'-end. This capture sequence
is immobilized via its 5' biotin label on superparamagnetic beads (Superparamagnetic Dynabeads®
M-270 Streptavidin, diameter: 2.8 µm). The library oligonucleotides were anchored to the beads by
hybridization of the docking sequence with the capture sequence. After several wash steps and steps to
eliminate loosely attached sequences, the selection target mixture was added to the solution. In order to
bind to specific target molecules, the oligonucleotides have to undergo a structure switch from
hybridization with the capture oligo to the three-dimensional structure that allows them to connect with
its target. Those target binding oligonucleotides were multiplied and fluorescein (FAM) labeled at
their 5' ends in a PCR reaction and then used as the starting set of sequences for the next round of
Capture-SELEX.
Page 6
Sensors 2014, 14 3742
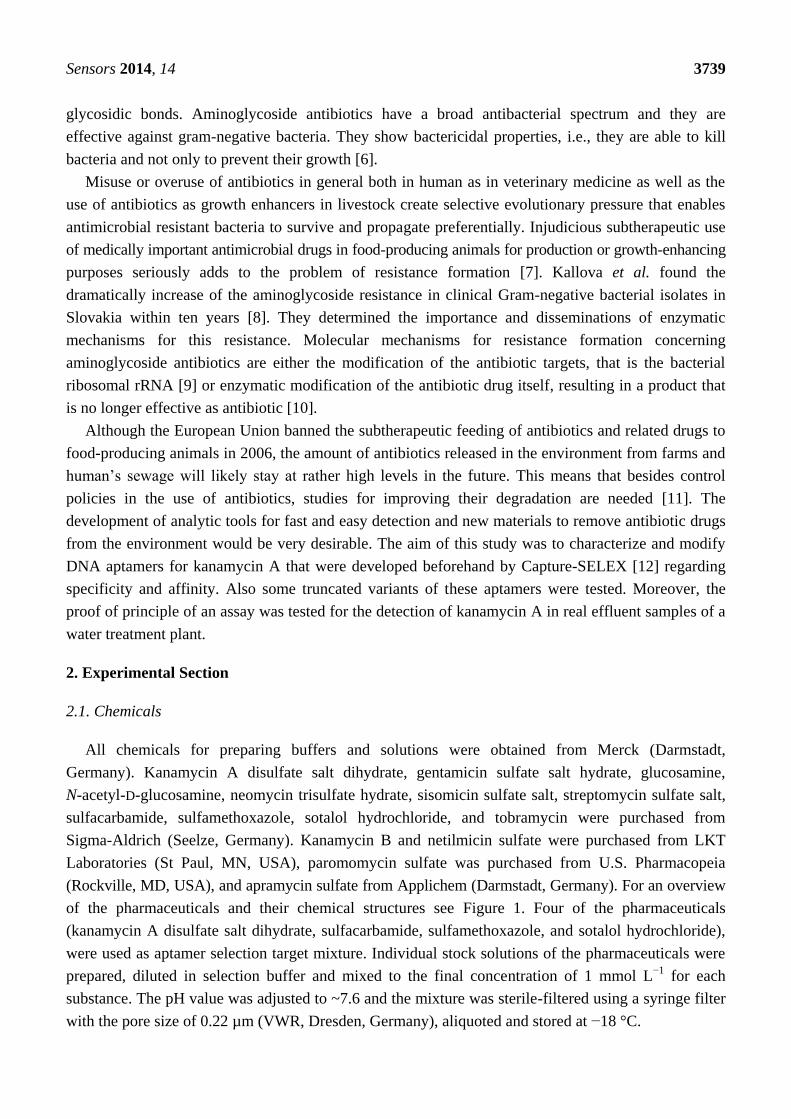
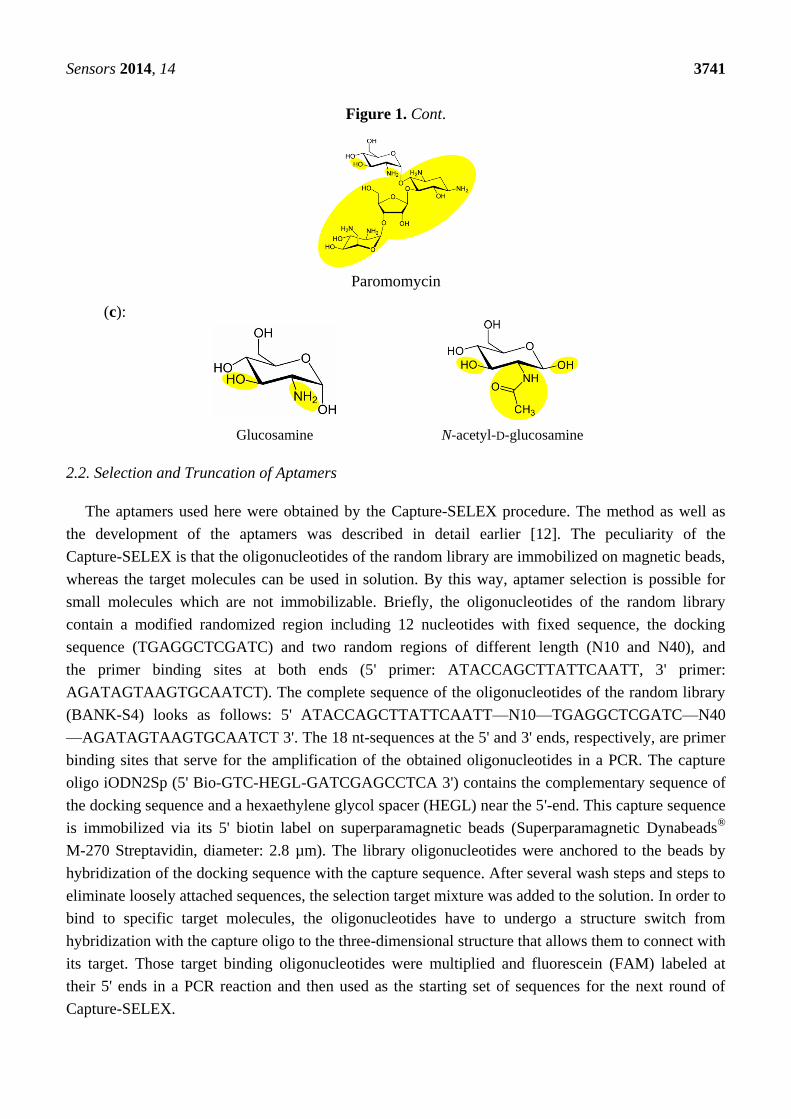
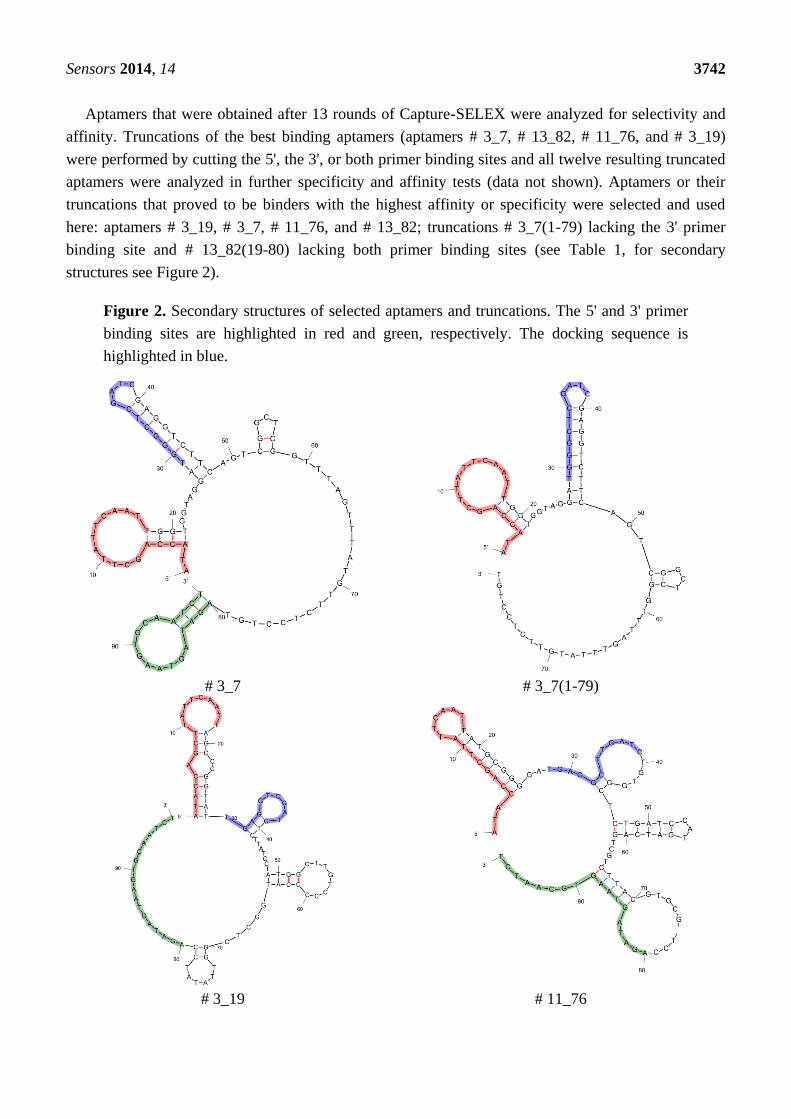
Aptamers that were obtained after 13 rounds of Capture-SELEX were analyzed for selectivity and
affinity. Truncations of the best binding aptamers (aptamers # 3_7, # 13_82, # 11_76, and # 3_19)
were performed by cutting the 5', the 3', or both primer binding sites and all twelve resulting truncated
aptamers were analyzed in further specificity and affinity tests (data not shown). Aptamers or their
truncations that proved to be binders with the highest affinity or specificity were selected and used
here: aptamers # 3_19, # 3_7, # 11_76, and # 13_82; truncations # 3_7(1-79) lacking the 3' primer
binding site and # 13_82(19-80) lacking both primer binding sites (see Table 1, for secondary
structures see Figure 2).
Figure 2. Secondary structures of selected aptamers and truncations. The 5' and 3' primer
binding sites are highlighted in red and green, respectively. The docking sequence is
highlighted in blue.
# 3_7 # 3_7(1-79)
# 3_19 # 11_76
Page 7
Sensors 2014, 14 3743
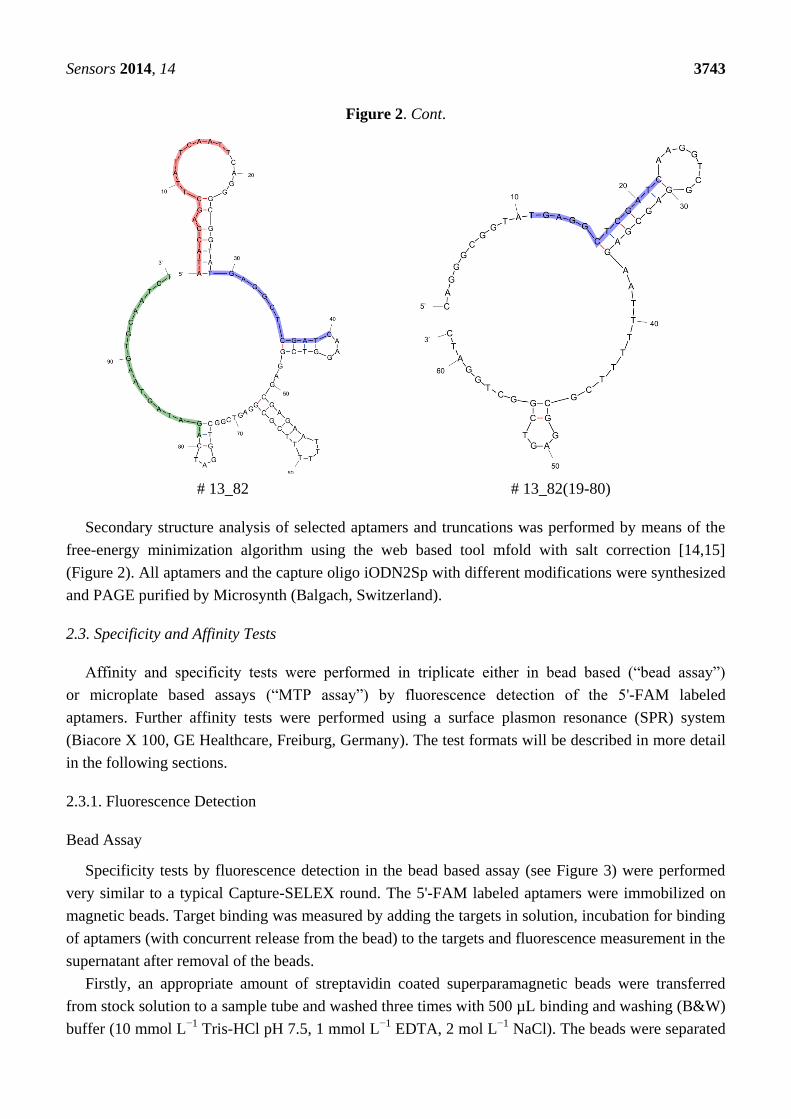
Figure 2. Cont.
# 13_82 # 13_82(19-80)
Secondary structure analysis of selected aptamers and truncations was performed by means of the
free-energy minimization algorithm using the web based tool mfold with salt correction [14,15]
(Figure 2). All aptamers and the capture oligo iODN2Sp with different modifications were synthesized
and PAGE purified by Microsynth (Balgach, Switzerland).
2.3. Specificity and Affinity Tests
Affinity and specificity tests were performed in triplicate either in bead based (―bead assay‖)
or microplate based assays (―MTP assay‖) by fluorescence detection of the 5'-FAM labeled
aptamers. Further affinity tests were performed using a surface plasmon resonance (SPR) system
(Biacore X 100, GE Healthcare, Freiburg, Germany). The test formats will be described in more detail
in the following sections.
2.3.1. Fluorescence Detection
Bead Assay
Specificity tests by fluorescence detection in the bead based assay (see Figure 3) were performed
very similar to a typical Capture-SELEX round. The 5'-FAM labeled aptamers were immobilized on
magnetic beads. Target binding was measured by adding the targets in solution, incubation for binding
of aptamers (with concurrent release from the bead) to the targets and fluorescence measurement in the
supernatant after removal of the beads.
Firstly, an appropriate amount of streptavidin coated superparamagnetic beads were transferred
from stock solution to a sample tube and washed three times with 500 µL binding and washing (B&W)
buffer (10 mmol L−1
Tris-HCl pH 7.5, 1 mmol L−1
EDTA, 2 mol L−1
NaCl). The beads were separated
Page 8
Sensors 2014, 14 3744
from the solution by placing the tube into a magnet stand. The beads were washed and resuspended in
B&W buffer to a concentration of 2 × 10⁹ beads mL
−1. For immobilization of the capture oligonucleotides,
an equal volume of the biotinylated capture oligo iODN2Sp was added (600 pmol biotinylated oligo
per 1 × 10⁸ beads). This mixture was incubated at room temperature for 1 h with gentle rotation using
an overhead shaker (Intelli-Mixer RM-2, neoLab, Berlin, Germany). After that, the supernatant was
discarded and the beads were washed three times with 500 µL B&W buffer and afterwards three times
with 500 µL selection buffer (100 mmol L−1
NaCl, 20 mmol L−1
Tris-HCl pH 7.6, 2 mmol L−1
MgCl2,
5 mmol L−1
KCl, 1 mmol L−1
CaCl2). After resuspension in selection buffer to a final concentration of
1 × 10⁹ beads mL
−1, the streptavidin coated magnetic beads, now modified with the streptavidin-biotin
bound biotinylated capture oligo iODN2Sp, were ready for use. The bead concentration could be
determined more exactly by microscopic counting (microscope Olympus BX60, Olympus Europa
Holding GmbH, Hamburg, Germany) using a Neubauer improved counting chamber.
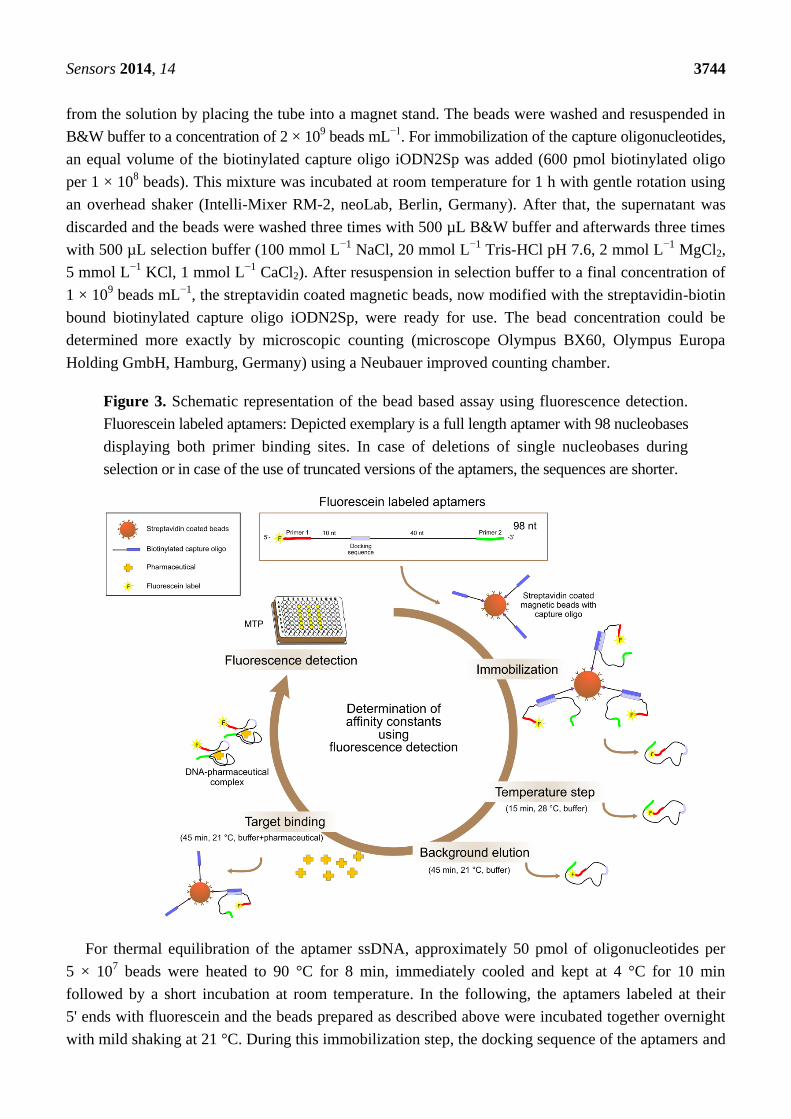
Figure 3. Schematic representation of the bead based assay using fluorescence detection.
Fluorescein labeled aptamers: Depicted exemplary is a full length aptamer with 98 nucleobases
displaying both primer binding sites. In case of deletions of single nucleobases during
selection or in case of the use of truncated versions of the aptamers, the sequences are shorter.
For thermal equilibration of the aptamer ssDNA, approximately 50 pmol of oligonucleotides per
5 × 10⁷ beads were heated to 90 °C for 8 min, immediately cooled and kept at 4 °C for 10 min
followed by a short incubation at room temperature. In the following, the aptamers labeled at their
5' ends with fluorescein and the beads prepared as described above were incubated together overnight
with mild shaking at 21 °C. During this immobilization step, the docking sequence of the aptamers and
Page 9
Sensors 2014, 14 3745
the complementary sequence of the capture oligos hybridized and thereby the aptamers were fixed to
the beads.
Unbound oligonucleotides were removed by washing the beads nine times with 500 µL selection
buffer. In the temperature step all of the remaining unhybridized oligonucleotides or weakened DNA
duplex structures were eliminated by incubation of the DNA-bead-complexes in 500 µL selection
buffer at 28 °C for 15 min with mild shaking and subsequently washing seven times with 500 µL
selection buffer. The following incubation of the DNA-bead-complexes in 300 µL selection buffer at
21 °C for 45 min with mild shaking served as control for background elution of hybridized
oligonucleotides from the beads caused by the incubation procedure. After seven additional wash steps
in 500 µL selection buffer, the DNA-bead-complexes were incubated at 21 °C for 45 min with mild
shaking in 300 µL solution of the respective pharmaceutical to be tested with a concentration of
1 mmol L−1
in selection buffer. During this target binding step, oligonucleotides (aptamers) were
released from the DNA bead complexes due to an affinity induced structure switch into a specific
three-dimensional structure allowing binding of the aptamer to the target molecule. They could be
collected in the supernatant after magnetic separation of the beads.
Fluorescence readings of the fluorescein labeled oligonucleotides were performed in black 96-well
microtiter plates (NUNC) using a Wallac Multilabel Counter 1420 Victor2V (PerkinElmer Life
Sciences, Freiburg, Germany) under the following conditions: prompt fluorometry, excitation filter
485 nm, emission filter 535 nm, time 1 s, CW-lamp energy 15,000. The sample volume was 100 µL
per well. Calibration curves ranging from 1.9 ng mL−1
to 1.9 µg mL−1
were prepared using fluorescein
labeled ssDNA of the corresponding aptamer and were subjected to the same thermal pretreatments as
in the specificity tests.
MTP Assay
Nunc Immobilizer™ Streptavidin plates (Thermo Scientific, Roskilde, Denmark) were used for the
second assay format based on fluorescence detection. Biotinylated capture oligos iODN2Sp were
immobilized at an amount of 150 pmol per well on the wells of a 96 microwell plate according to the
manufacturer’s protocol. After washing three times with selection buffer, an amount of 10–15 pmol of
thermally equilibrated aptamers labeled at their 5' ends with fluorescein was added to each well and
incubated overnight at 21 °C and light agitation. After washing three times with selection buffer,
different concentrations of kanamycin A in selection buffer or in a mixture of real sample and selection
buffer were added to the wells and incubated 45 min at 21 °C. For the six-fold determination of one
sample of distinct concentration of kanamycin A, six wells of the microplate were used. During this
step the target binding takes place where the aptamers that are able to bind to the target molecule
undergo a conformational change and leave the duplex with the capture oligo in order to bind to the
target. Afterwards, the plate was again washed three times with selection buffer and the amount of the
remaining aptamer ssDNA in the wells of the microplate was detected by fluorescence reading.
Fluorescence readings of the fluorescein labeled oligonucleotides were performed as described above
and data of the multiple determinations were averaged. The amount of eluted aptamers could be
calculated as difference between the fluorescence counts before and after target binding by referring it
to a calibration curve. The plate can be regenerated by washing it twice with 100 µL of selection buffer
per well for 10 min at 50 °C with mild shaking to remove all aptamers.
Page 10
Sensors 2014, 14 3746
2.3.2. SPR Detection
In addition to specificity tests using fluorescence detection, affinity tests were performed using a
surface plasmon resonance (SPR) system (Biacore X 100, GE Healthcare), see Figure 4. The surface
plasmon resonance measurement is a very sensitive label free detection method which allows real time
and quantitative monitoring of binding events at a sensor surface. In our case, aptamers were
immobilized via capture oligo at the sensor surface and the release of the aptamers caused by binding
to the target added was measured.
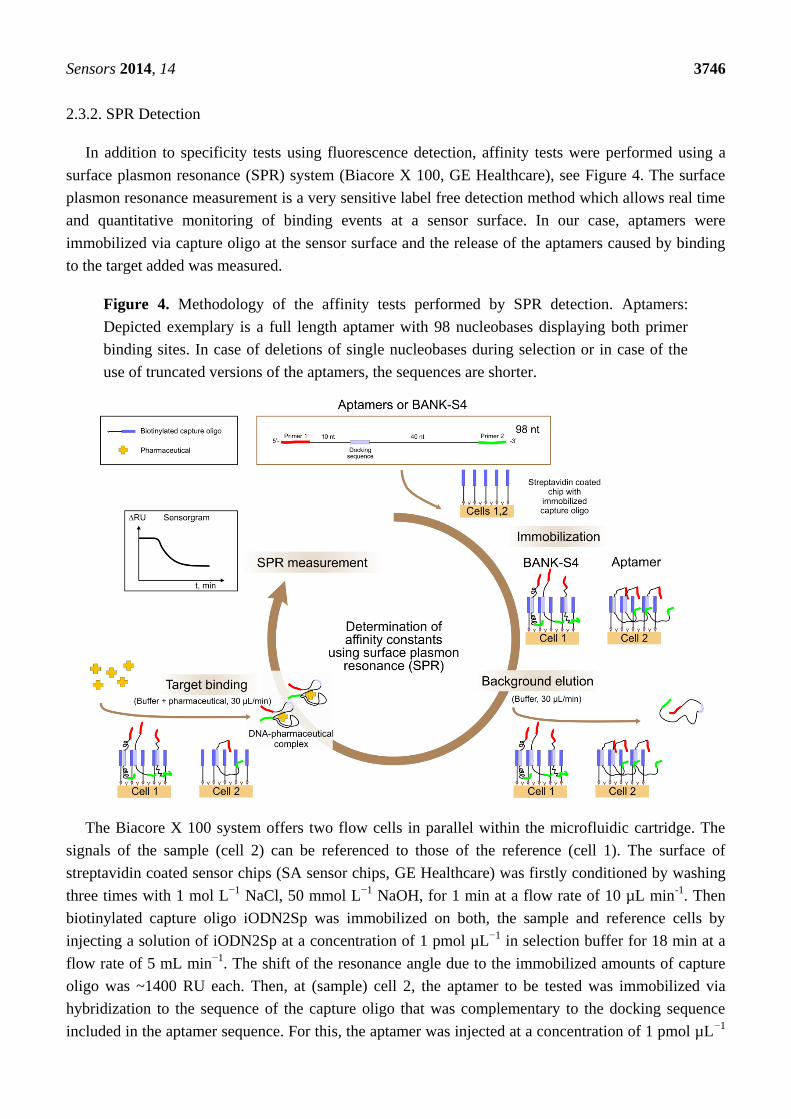
Figure 4. Methodology of the affinity tests performed by SPR detection. Aptamers:
Depicted exemplary is a full length aptamer with 98 nucleobases displaying both primer
binding sites. In case of deletions of single nucleobases during selection or in case of the
use of truncated versions of the aptamers, the sequences are shorter.
The Biacore X 100 system offers two flow cells in parallel within the microfluidic cartridge. The
signals of the sample (cell 2) can be referenced to those of the reference (cell 1). The surface of
streptavidin coated sensor chips (SA sensor chips, GE Healthcare) was firstly conditioned by washing
three times with 1 mol L−1
NaCl, 50 mmol L−1
NaOH, for 1 min at a flow rate of 10 µL min-1
. Then
biotinylated capture oligo iODN2Sp was immobilized on both, the sample and reference cells by
injecting a solution of iODN2Sp at a concentration of 1 pmol µL−1
in selection buffer for 18 min at a
flow rate of 5 mL min−1
. The shift of the resonance angle due to the immobilized amounts of capture
oligo was ~1400 RU each. Then, at (sample) cell 2, the aptamer to be tested was immobilized via
hybridization to the sequence of the capture oligo that was complementary to the docking sequence
included in the aptamer sequence. For this, the aptamer was injected at a concentration of 1 pmol µL−1
Page 11
Sensors 2014, 14 3747
and at a flow rate of 5 µL min−1
for 15 min. This led to a shift in resonance angle of 440 RU on
average. In the same way, sequences of the random library BANK-S4 were immobilized on the
reference cell (cell 1) which led to a shift in resonance angle of 270 RU on average. Both cells were
washed with selection buffer at a flow rate of 30 µL min−1
for 3 min in order to remove loosely bound
sequences. After that, target in increasing concentrations was injected into both cells at a flow rate of
30 µL min−1
for 3 min. Measured is the difference signal (cell 2–cell 1) which gives a concentration
dependent negative saturation curve, caused by the target molecule binding to the aptamers by
conformational change and de-hybridization of their binding to the capture oligos. In contrast, the
control, BANK-S4, was hardly released and remained at the surface. Each injection of target was
directly followed by an injection of selection buffer into both cells at a flow rate of 30 µL min−1
for
3 min. 20 s after the beginning of this second injection the current RU value was recorded, the so-called
―stability‖ report point. The ―stability‖ report points for each concentration were used for the
calculation of the affinity constants and were fitted by the model of one site direct binding using a
rectangular hyperbola for the saturation curve (OriginPro 8G SR2, OriginLab Corporation,
Northampton, MA, USA).
2.4. Kanamycin A Detection in Real Samples
For the detection of kanamycin A in cleaned waste water, a water sample was taken in January
2013 at the drain of a vertical flow type of constructed wetlands and was experimentally spiked with
the pharmaceutical. The real water was filtered by using a vacuum filtration unit (0.22 µm, Sartorius,
Göttingen, Germany) and subsequently mixed in equal parts with selection buffer that was beforehand
spiked with different amounts of kanamycin A. The pH of the resulting solution was about 7.6. This
solution was the measuring sample added in the MTP assay (see description in Section 2.4.1) to the
wells. All other steps, like washing steps and fluorescence detection, were performed in selection buffer.
3. Results and Discussion
3.1. Primary and Secondary Structures of Aptamers and Their Truncations
Considering the primary sequences in Table 1 it should be noted that the original docking sequence
(TGAGGCTCGATC, highlighted in blue) of aptamers # 3_19 and # 3_7 is altered during the
Capture-SELEX process compared to the originally designed sequence. This is most likely a
concession to the design of the SELEX procedure as there is a selection pressure towards docking
sequences that are less stably attached to the capture oligos as described in detail in [12]. For the
analysis of the secondary structures of the six aptamers chosen from [12] and the secondary structures
of their truncations the free-energy minimization algorithm using the web based tool mfold was used
(Figure 2).
Page 12
Sensors 2014, 14 3748
Table 1. Sequences of the oligonucleotides in the random library, of the capture oligo, aptamers for kanamycin A, derived from
Capture-SELEX [12], and truncations thereof. The 5' and 3' primer binding sites are highlighted in red and green, respectively. The docking
sequence is highlighted in blue and its complementary part in the capture oligo is highlighted in yellow. Deletions in the sequence compared
to the starting random library are denoted as a dot. Direction is 5'→3' if not stated otherwise.
Oligonucleotides in the random library (BANK-S4):
ATACCAGCTTATTCAATTNNNNNNNNNNTGAGGCTCGATCNNNNNNNNNNNNNNNNNNNNNNNNNNNNNNNNNNNNNNNNAGATAGTAAGTGCAATCT
Capture oligo:
3' ACTCCGAGCTAG-Hexaethylene glycol spacer-CTG-Biotin label 5′
Aptamer # 3_19:
ATACCAGCTTATTCAATTAGCCCGGTATTGAGG·TCGATCTCTTATCCTATGGCTTGTCCCCCATGGCTCGGTTATATCCAGATAGTAAGTGCAATCT
Nonbinding sequence # 3_19(1-79), truncation of aptamer # 3_19:
ATACCAGCTTATTCAATTAGCCCGGTATTGAGG·TCGATCTCTTATCCTATGGCTTGTCCCCCATGGCTCGGTTATATCC
Aptamer # 3_7:
ATACCAGCTTATTCAATTGGTGGTAGGATG·GGCTCGATCGAGGTCTTCAGTCGGCTCGGTTTAGTTTATGTTCTCCTGTAGATAGTAAGTGCAATCT
Aptamer # 3_7(1-79), truncation of aptamer # 3_7:
ATACCAGCTTATTCAATTGGTGGTAGGATG·GGCTCGATCGAGGTCTTCAGTCGGCTCGGTTTAGTTTATGTTCTCCTGT
Aptamer # 11_76:
ATACCAGCTTATTCAATT ATGCGGGGATGAGGCTTGATCTGTGGCTCTGATCCATGATCAGTCGTCTTACGTGCGGTCCAGATAGTAAGTGCAATCT
Aptamer # 13_82:
ATACCAGCTTATTCAATTCAGGGCGGTATGAGGCTCGATCAAGGTCGGAGCGAGAATTTTTTCGCGGAGTCGGCTGGATCAGATAGTAAGTGCAATCT
Aptamer # 13_82(19-80), truncation of aptamer # 13_82:
CAGGGCGGTATGAGGCTCGATCAAGGTCGGAGCGAGAATTTTTTCGCGGAGTCGGCTGGATC
Page 13
Sensors 2014, 14 3749
All aptamers and truncations display secondary structures that show stem-loop structures separated
by unstructured regions. In case of the full length aptamers, they have four stem-loops, the truncated
version # 3_7(1-79) has three stem-loops and # 13_82(19-80) has two stem-loops. One feature that all
aptamers derived from this Capture-SELEX process have in common is that the docking sequence, i.e.,
the region complementary to the capture sequence of the capture oligo, is incorporated in a stem-loop
structure. The aptamer takes on this secondary structure when free in solution. Nutiu and Li [16] firstly
proposed the concept of switching of the aptamer from an oligonucleotide binding partner to the target
molecule by alteration of its structure as the presence of the target causes adaptive folding of the
aptamer [17]. In the end, the formation of the aptamer target complex has to be energetically more
stable than the complex of aptamer and capture oligo as only then the addition of the target to a
solution containing the duplex of aptamer and oligonucleotide binding partner will force the release of
the aptamer from its oligonucleotide binding partner [18]. This means that structure switching
aptamers only rearrange into an active target-bound structure upon binding to their target. In the
absence of the target, however, they are in a less ordered state and are able to partially hybridize with a
complementary oligonucleotide [17].
When looking at the truncated versions where the 3' or 5' or both primer binding sites of the tested
aptamers # 3_7, # 13_82, # 11_76, and # 3_19 were cut, it can be seen that some of these truncated
versions still show binding activity.
For some aptamers the primer binding sites, even as they displayed fixed sequences and were
designed beforehand, are necessary for binding. This is the case for aptamer # 3_19, where not one of
the truncated versions of the aptamer were able to bind to the target kanamycin A and for aptamer
# 11_76, where only the version with truncated 5' primer binding site (# 11_76(1-79)) displayed
binding to kanamycin A, but to a much lesser extent than the parental aptamer (80 percent of the value
of the parental aptamer). In contrast, truncation of the aptamers # 3_7 and # 13_82 influences the
binding to kanamycin A not (# 13_82) or even leads to an enhancement of the binding (# 3_7(1-79),
enhancement by 225 percent of the value of the parental aptamer).
The therapeutic mode of action of aminoglycoside antibiotics is that they bind to RNA, namely the
16 S RNA of ribosomes, and thereby hinder translation. The binding motif at the RNA side is a stem-loop
structure [19–21]. It was shown that artificial RNA aptamers for aminoglycoside antibiotics also
display a stem-loop structure as binding site forming pockets for the aminoglycoside antibiotics [22].
Although RNA and DNA are different in their binding behaviour, also in our case of DNA aptamers,
there is a strong possibility that the binding region is a strem-loop structure as this conformation is
adopted by the aptamers when not hybridized to the capture oligo. However, for some aptamers the
other nucleobases also play an important role in target binding as even the primer binding sites are
necessary for successful recognition of the target molecule, as was stated above. More detailed
analysis will be necessary in order to determine the exact binding motif.
3.2. Specificities of the Derived Aptamers to Different Aminoglycoside Antibiotics
Specificities of the derived aptamers to different aminoglycoside antibiotics (see Figure 1b) were
determined by use of the bead assay which was performed similar to the SELEX-procedure.
Additionally binding of the aptamers to the amino sugars glucosamine and N-acetyl-D-glucosamine
Page 14
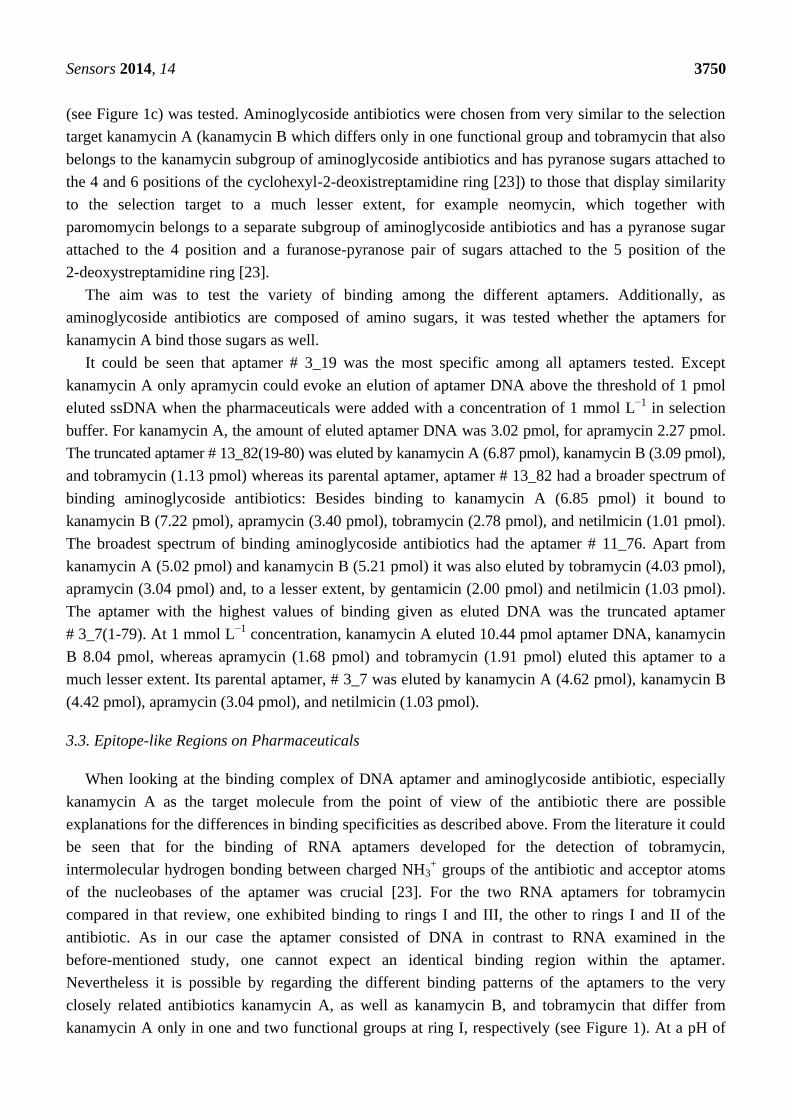
Sensors 2014, 14 3750
(see Figure 1c) was tested. Aminoglycoside antibiotics were chosen from very similar to the selection
target kanamycin A (kanamycin B which differs only in one functional group and tobramycin that also
belongs to the kanamycin subgroup of aminoglycoside antibiotics and has pyranose sugars attached to
the 4 and 6 positions of the cyclohexyl-2-deoxistreptamidine ring [23]) to those that display similarity
to the selection target to a much lesser extent, for example neomycin, which together with
paromomycin belongs to a separate subgroup of aminoglycoside antibiotics and has a pyranose sugar
attached to the 4 position and a furanose-pyranose pair of sugars attached to the 5 position of the
2-deoxystreptamidine ring [23].
The aim was to test the variety of binding among the different aptamers. Additionally, as
aminoglycoside antibiotics are composed of amino sugars, it was tested whether the aptamers for
kanamycin A bind those sugars as well.
It could be seen that aptamer # 3_19 was the most specific among all aptamers tested. Except
kanamycin A only apramycin could evoke an elution of aptamer DNA above the threshold of 1 pmol
eluted ssDNA when the pharmaceuticals were added with a concentration of 1 mmol L−1
in selection
buffer. For kanamycin A, the amount of eluted aptamer DNA was 3.02 pmol, for apramycin 2.27 pmol.
The truncated aptamer # 13_82(19-80) was eluted by kanamycin A (6.87 pmol), kanamycin B (3.09 pmol),
and tobramycin (1.13 pmol) whereas its parental aptamer, aptamer # 13_82 had a broader spectrum of
binding aminoglycoside antibiotics: Besides binding to kanamycin A (6.85 pmol) it bound to
kanamycin B (7.22 pmol), apramycin (3.40 pmol), tobramycin (2.78 pmol), and netilmicin (1.01 pmol).
The broadest spectrum of binding aminoglycoside antibiotics had the aptamer # 11_76. Apart from
kanamycin A (5.02 pmol) and kanamycin B (5.21 pmol) it was also eluted by tobramycin (4.03 pmol),
apramycin (3.04 pmol) and, to a lesser extent, by gentamicin (2.00 pmol) and netilmicin (1.03 pmol).
The aptamer with the highest values of binding given as eluted DNA was the truncated aptamer
# 3_7(1-79). At 1 mmol L−1
concentration, kanamycin A eluted 10.44 pmol aptamer DNA, kanamycin
B 8.04 pmol, whereas apramycin (1.68 pmol) and tobramycin (1.91 pmol) eluted this aptamer to a
much lesser extent. Its parental aptamer, # 3_7 was eluted by kanamycin A (4.62 pmol), kanamycin B
(4.42 pmol), apramycin (3.04 pmol), and netilmicin (1.03 pmol).
3.3. Epitope-like Regions on Pharmaceuticals
When looking at the binding complex of DNA aptamer and aminoglycoside antibiotic, especially
kanamycin A as the target molecule from the point of view of the antibiotic there are possible
explanations for the differences in binding specificities as described above. From the literature it could
be seen that for the binding of RNA aptamers developed for the detection of tobramycin,
intermolecular hydrogen bonding between charged NH3+ groups of the antibiotic and acceptor atoms
of the nucleobases of the aptamer was crucial [23]. For the two RNA aptamers for tobramycin
compared in that review, one exhibited binding to rings I and III, the other to rings I and II of the
antibiotic. As in our case the aptamer consisted of DNA in contrast to RNA examined in the
before-mentioned study, one cannot expect an identical binding region within the aptamer.
Nevertheless it is possible by regarding the different binding patterns of the aptamers to the very
closely related antibiotics kanamycin A, as well as kanamycin B, and tobramycin that differ from
kanamycin A only in one and two functional groups at ring I, respectively (see Figure 1). At a pH of
Page 15
Sensors 2014, 14 3751
about 7.6 that was used throughout in our studies, only the amino groups at the 5 position of ring I of
kanamycin A and at the 2 position of ring I of kanamycin B and tobramycin were present in the
charged form of NH3+ [13]. As aptamer # 3_19 only binds to kanamycin A when comparing these
closely related compounds it is very probable that binding involves ring I of the pharmaceutical. In
contrast, regarding aptamer # 11_76 that binds all three antibiotics nearly to the same degree, ring I
will probably not play such a crucial role. For aptamers # 3_7, # 3_7(1-79) and # 13_82 binding to
kanamycin A and B are nearly identical, whereas binding to tobramycin is less strong. Therefore one
could assume that the presence of the hydroxyl group at the 3 position of ring I here is crucial for
binding. Regarding aptamer # 13_82(19-80) that shows binding to kanamycin A, B and tobramycin in
decreasing ranges both functional groups that differ seem to be involved in binding. For a more
detailed view into the binding mechanisms it would be desirable to perform high resolution studies,
like NMR.
3.4. Dissociation Constants Obtained by Fluorescence and SPR Detections for Aptamers and
Their Truncations
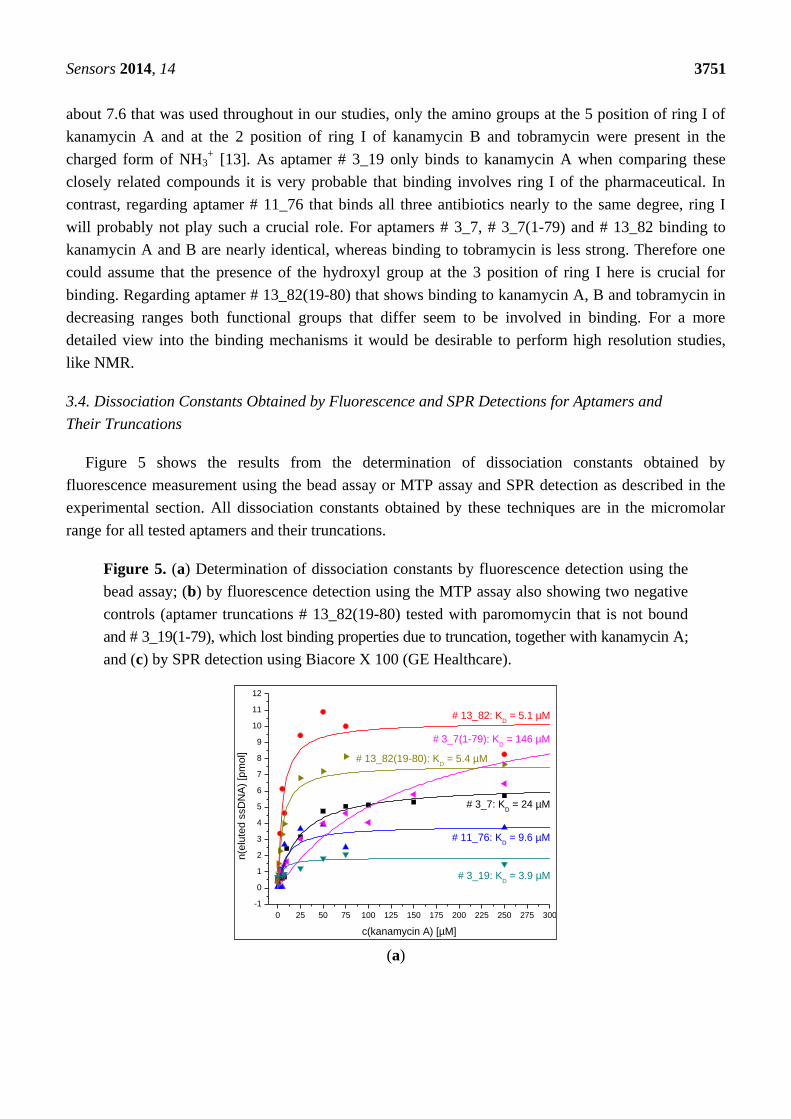
Figure 5 shows the results from the determination of dissociation constants obtained by
fluorescence measurement using the bead assay or MTP assay and SPR detection as described in the
experimental section. All dissociation constants obtained by these techniques are in the micromolar
range for all tested aptamers and their truncations.
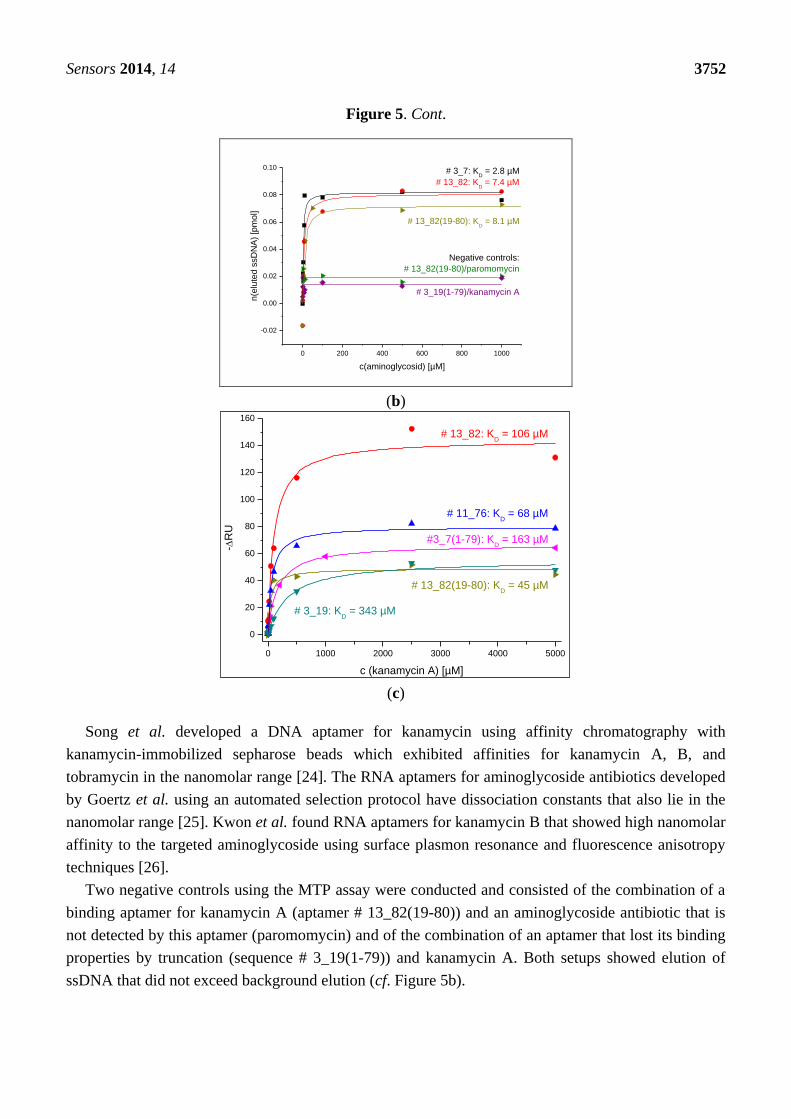
Figure 5. (a) Determination of dissociation constants by fluorescence detection using the
bead assay; (b) by fluorescence detection using the MTP assay also showing two negative
controls (aptamer truncations # 13_82(19-80) tested with paromomycin that is not bound
and # 3_19(1-79), which lost binding properties due to truncation, together with kanamycin A;
and (c) by SPR detection using Biacore X 100 (GE Healthcare).
(a)
0 25 50 75 100 125 150 175 200 225 250 275 300
-1
0
1
2
3
4
5
6
7
8
9
10
11
12
# 3_7(1-79): KD = 146 µM
# 13_82(19-80): KD = 5.4 µM
# 3_19: KD = 3.9 µM
# 11_76: KD = 9.6 µM
# 3_7: KD = 24 µM
# 13_82: KD = 5.1 µM
n(e
lute
d s
sD
NA
) [p
mol]
c(kanamycin A) [µM]
Page 16
Sensors 2014, 14 3752
Figure 5. Cont.
0 200 400 600 800 1000
-0.02
0.00
0.02
0.04
0.06
0.08
0.10
# 3_19(1-79)/kanamycin A
# 13_82(19-80)/paromomycin
Negative controls:
# 13_82(19-80): KD = 8.1 µM
# 13_82: KD = 7.4 µM
n(e
lute
d s
sD
NA
) [p
mol]
c(aminoglycosid) [µM]
# 3_7: KD = 2.8 µM
(b)
(c)
Song et al. developed a DNA aptamer for kanamycin using affinity chromatography with
kanamycin-immobilized sepharose beads which exhibited affinities for kanamycin A, B, and
tobramycin in the nanomolar range [24]. The RNA aptamers for aminoglycoside antibiotics developed
by Goertz et al. using an automated selection protocol have dissociation constants that also lie in the
nanomolar range [25]. Kwon et al. found RNA aptamers for kanamycin B that showed high nanomolar
affinity to the targeted aminoglycoside using surface plasmon resonance and fluorescence anisotropy
techniques [26].
Two negative controls using the MTP assay were conducted and consisted of the combination of a
binding aptamer for kanamycin A (aptamer # 13_82(19-80)) and an aminoglycoside antibiotic that is
not detected by this aptamer (paromomycin) and of the combination of an aptamer that lost its binding
properties by truncation (sequence # 3_19(1-79)) and kanamycin A. Both setups showed elution of
ssDNA that did not exceed background elution (cf. Figure 5b).
0 1000 2000 3000 4000 5000
0
20
40
60
80
100
120
140
160
# 3_19: KD = 343 µM
# 11_76: KD = 68 µM
# 13_82: KD = 106 µM
# 13_82(19-80): KD = 45 µM
-R
U
c (kanamycin A) [µM]
#3_7(1-79): KD = 163 µM
Page 17
Sensors 2014, 14 3753
3.5. Kanamycin A Detection in Real Waste Water Sample
The aim of this part of the work was to detect kanamycin A in a real water sample on the way to a
robust and functional assay that can be used for water analysis. For that purpose, an experimentally
spiked water sample of treated sewage effluent from a vertical flow type of constructed wetlands was
analysed using the MTP assay as described in section 2.4.1—MTP Assay and section 2.5. Aptamer
# 3_7 and kanamycin A in different concentrations ranging from 0 to 500 µmol L−1
in the solution that
consisted of the real sample mixed with selection buffer in equal parts were used. The detection limit,
defined as a signal-to-noise ratio of 3, was 5 µmol L−1
kanamycin A and the measuring range was 0 to
50 µmol L−1
kanamycin A in the measuring solution.
4. Conclusions/Outlook
With this work we could show that aptamers (and some truncations thereof) that were derived from
a Capture-SELEX procedure which targeted against kanamycin A displayed binding to other
aminoglycoside antibiotics as well. The binding patterns differed among all tested aptamers so that
there were highly substance specific aptamers (such as aptamer # 3_19, binding only to kanamycin A
and apramycin) and more group specific aptamers binding to a different variety of aminoglycoside
antibiotics. The epitope-like region of the aminoglycoside antibiotics responsible for aptamer binding
could be defined. Affinities of the different aptamers for their target substance, kanamycin A, could be
measured with different approaches and were in the micromolar range. Finally, the proof of principle
of an aptamer based assay allowed the detection of kanamycin A in a real water sample could be given.
Future work will comprise a further isolation of the epitope-like region in the aminoglycoside
antibiotics or even the visualization with imaging methods. The aptamer based assay for the detection
of kanamycin A or other aminoglycoside antibiotics in environmental samples will be modified in
order to get higher output values or the detection principle will be altered in order to achieve that goal.
Aptamers that show group specificity to aminoglycoside antibiotics can be used as novel filter material
for the elimination of those pharmaceutical or their residues from environment samples.
Acknowledgments
This work was funded by the Federal Ministry of Education and Research, Germany (BMBF)
within the Program BIONA (01RB0805B). Thanks to Anja Prange and Carina Flores de Looß for
technical assistance and Katy Bernhard and Christine Reinemann for providing the water sample from
the sewage effluent of a vertical flow type of constructed wetlands.
Author Contributions
The work presented in this paper is a collaborative development by both authors. Nadia Nikolaus
performed the experiments analyzed data. Beate Strehlitz defined the research line. Nadia Nikolaus
and Beate Strehlitz wrote the paper. Both of them have contributed to, seen and approved the manuscript.
Page 18
Sensors 2014, 14 3754
Conflicts of Interest
The authors declare no conflicts of interest.
References
1. Jenison, R.D.; Gill, S.C.; Pardi, A.; Polisky, B. High-resolution molecular discrimination by
RNA. Science 1994, 263, 1425–1429.
2. Stoltenburg, R.; Reinemann, C.; Strehlitz, B. Development of Aptamers as New Receptors for
Environmental Biosensors. In Environmental biotechnology; Mishra, C.S.K., Juwarkar, A.A.,
Eds.; APH Publishing Corporation: New Delhi, India, 2007; pp 83–112.
3. Ellington, A.D.; Szostak, J.W. In vitro selection of RNA molecules that bind specific ligands.
Nature 1990, 346, 818–822.
4. Tuerk, C.; Gold, L. Systematic evolution of ligands by exponential enrichment: RNA ligands to
bacteriophage T4 DNA polymerase. Science 1990, 249, 505–510.
5. Michaud, M.; Jourdan, E.; Villet, A.; Ravel, A.; Grosset, C.; Peyrin, E. A DNA aptamer as a new
target-specific chiral selector for HPLC. J. Am. Chem. Soc. 2003, 125, 8672–8679.
6. Forge, A.; Schacht, J. Aminoglycoside antibiotics. Audiol. Neurootol. 2000, 5, 3–22.
7. Flynn, W.T. The Judicious Use of Medically Important Antimicrobial Drugs in Food-Producing
Animals. Available online: http://www.regulations.gov/#!documentDetail;D=FDA-2010-D-0094–
1071 (accessed on 28 October 2013).
8. Kallova, J.; Kettner, M.; Macickova, T.; Milosovic, P.; Langsadl, L. Aminoglycoside resistance.
Enzymatic mechanisms in clinical bacterial strains in Slovakia during the last decade.
FEMS Immunol. Med. Microbiol. 1997, 19, 89–94.
9. Musser, J.M. Antimicrobial agent resistance in mycobacteria: Molecular genetic insights. Clin.
Microbiol. Rev. 1995, 8, 496–514.
10. Wright, G.D. Aminoglycoside-modifying enzymes. Curr. Opin. Microbiol. 1999, 2, 499–503.
11. Martinez, J.L. Environmental pollution by antibiotics and by antibiotic resistance determinants.
Environ. Pollut. 2009, 157, 2893–2902.
12. Stoltenburg, R.; Nikolaus, N.; Strehlitz, B. Capture-SELEX: Selection of DNA aptamers for
aminoglycoside antibiotics. J. Anal. Methods Chem. 2012, 2012, doi:10.1155/2012/415697.
13. Walter, F.; Vicens, Q.; Westhof, E. Aminoglycoside-RNA interactions. Curr. Opin. Chem. Biol.
1999, 3, 694–704.
14. Zuker, M. Mfold web server for nucleic acid folding and hybridization prediction. Nucleic Acids
Res. 2003, 31, 3406–3415.
15. Peyret, N. Prediction of Nucleic Acid Hybridization: Parameters and Algorithms. Ph.D. Thesis,
Wayne State University, Detroit, MI, USA, 2000.
16. Nutiu, R.; Li, Y.F. Structure-switching signaling aptamers. J. Am. Chem. Soc. 2003, 125,
4771–4778.
17. Achenbach, J.C.; Nutiu, R.; Li, Y. Structure-switching allosteric deoxyribozymes. Anal. Chim.
Acta 2005, 534, 41–51.
18. Nutiu, R.; Li, Y. Aptamers with fluorescence-signaling properties. Methods 2005, 37, 16–25.
Page 19
Sensors 2014, 14 3755
19. Fourmy, D.; Recht, M.I.; Puglisi, J.D. Binding of neomycin-class aminoglycoside antibiotics to
the A-site of 16 S rRNA. J. Mol. Biol. 1998, 277, 347–362.
20. Kirk, S.R.; Tor, Y. tRNAPhe binds aminoglycoside antibiotics. Bioorg. Med. Chem. 1999, 7,
1979–1991.
21. Jin, E.; Katritch, V.; Olson, W.K.; Kharatisvili, M.; Abagyan, R.; Pilch, D.S. Aminoglycoside
binding in the major groove of duplex RNA: The thermodynamic and electrostatic forces that
govern recognition. J. Mol. Biol. 2000, 298, 95–110.
22. Wang, Y.; Rando, R.R. Specific binding of aminoglycoside antibiotics to RNA. Chem. Biol. 1995,
2, 281–290.
23. Patel, D.J.; Suri, A.K. Structure, recognition and discrimination in RNA aptamer complexes with
cofactors, amino acids, drugs and aminoglycoside antibiotics. Rev. Mol. Biotechnol. 2000, 74,
39–60.
24. Song, K.-M.; Cho, M.; Jo, H.; Min, K.; Jeon, S.H.; Kim, T.; Han, M.S.; Ku, J.K.; Ban, C. Gold
nanoparticle-based colorimetric detection of kanamycin using a DNA aptamer. Anal. Biochem.
2011, 415, 175–181.
25. Goertz, P.W.; Colin Cox, J.; Ellington, A.D. Automated selection of aminoglycoside aptamers.
J. Assoc. Lab. Autom. 2004, 9, 150–154.
26. Kwon, M.; Chun, S.-M.; Jeong, S.; Yu, J. In vitro selection of RNA against kanamycin B.
Mol. Cells 2001, 11, 303–311.
© 2014 by the authors; licensee MDPI, Basel, Switzerland. This article is an open access article
distributed under the terms and conditions of the Creative Commons Attribution license
(http://creativecommons.org/licenses/by/3.0/).