28
DNO INTERNATIONAL ASA PRESENTATION FIRST QUARTER 2009

DNO INterNatIONal aSa
Presentation First Quarter 2009

Agenda Introduction & Operational Review • Ivar Brandvold, COO
Financial Review • Haakon Sandborg, CFO
Q&A
First Quarter 2009 | 2
Making positive change Strategy • During the last years DNO’s strategy has been focused on low cost projects in high potential areas -
avoiding long term capital commitments • This strategy made the company well prepared to adapt to recent oil price levels
Shift in focus • Shift in focus to production and near term developments, with exploration activity to be undertaken on a
more selective basis • This will reduce the overall investment level for this year significantly compared to 2008
Ready for full scale production • Tie-in of the Tawke pipeline to Iraq’s Northern pipeline system was completed by the end of Q1’09 • On 10 May, DNO received formal notice by KRG to commence crude oil export from the Tawke field
First Quarter 2009 | 3
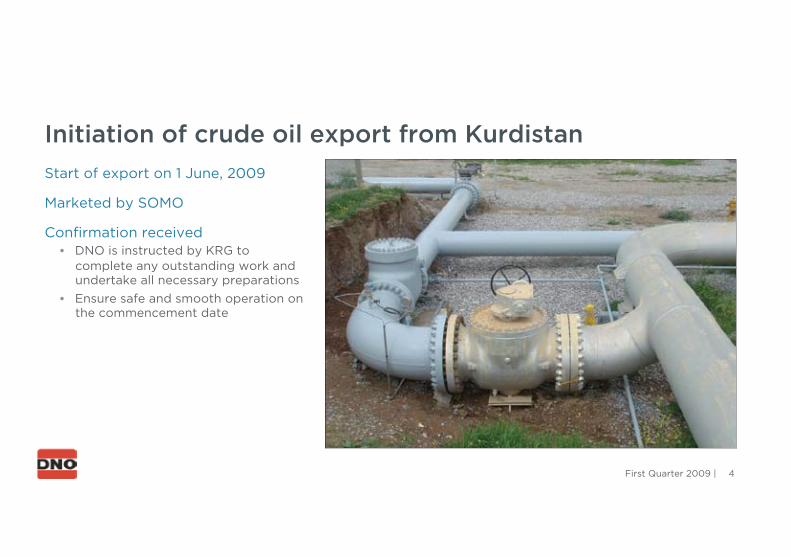
Initiation of crude oil export from Kurdistan Start of export on 1 June, 2009
Marketed by SOMO
Confirmation received • DNO is instructed by KRG to
complete any outstanding work and undertake all necessary preparations
• Ensure safe and smooth operation on the commencement date
First Quarter 2009 | 4

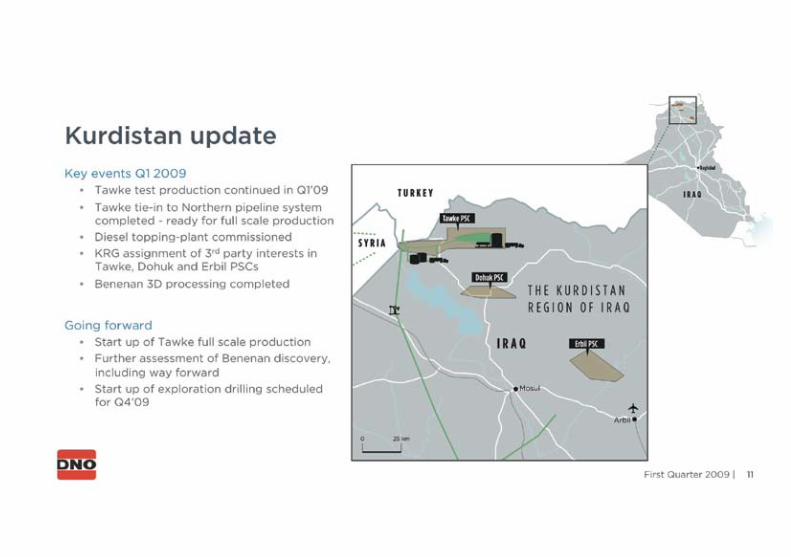
Key events in the First Quarter 2009 • The tie-in of the Tawke pipeline to Iraq’s Northern pipeline system was completed by the
end of first quarter 2009
• The Annual Statement of Reserves shows an increase to 163 mboe (P50)
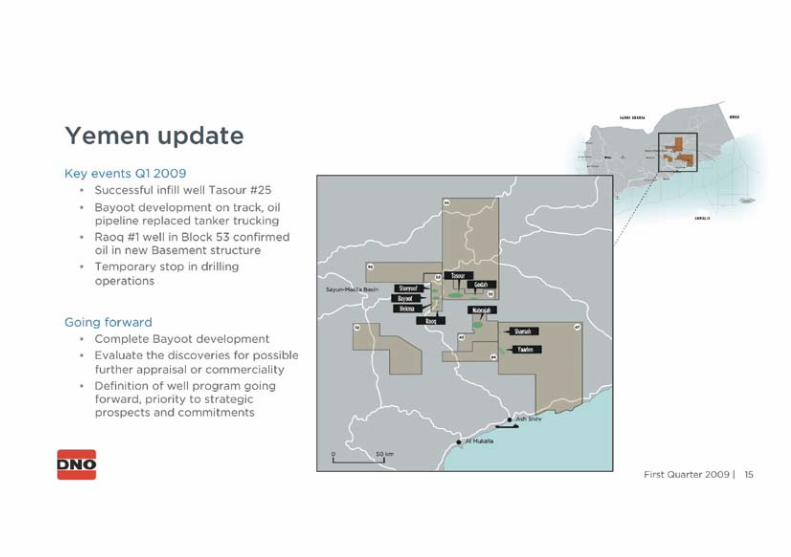
• Exploration drilling has temporarily been suspended in Yemen and Kurdistan with prospects being matured to define the drilling program going forward
• DNO divested 11.9 per cent of DETNOR in January, bringing the total ownership to 25 per cent
• Netback in the first quarter was negative with NOK 6 million while the net profit in the first quarter was NOK 138 million due to a partial impairment reversal on the DETNOR investment
First Quarter 2009 | 5

OPERATIONS

Block 32, 43, 44, 47, 52, 53, 72 and 84
Business Overview
First Quarter 2009 | 7
Det norske oljeselskap ASA
PL1067
Tawke Benenan (Hawler)
Dohuk
Sharyoof Tasour Nabrajah
Bayoot
Inhaminga
Block P

HSE summary DNO’s approach
• Based on continuous improvement processes aimed to create and maintain a good environment for employees, contractors and for the communities in which the Company operates
• Application of acknowledged risk reduction principles shall eliminate or minimize any exposure
• Maintain, as far as practically possible, zero discharge of emissions or pollutions to the environment.
• With DNO operating on land, reducing the risk exposure related to driving and logistics is a primary focus to the company
HSE performance trends
First Quarter 2009 | 8
0
1
2
3
4
5
6
7
8
9
Ap
ril 0
8
Mai
08
June
08
July
08
Aug
ust
08
Sep
tem
ber
08
Oct
ob
er 0
8
Nov
emb
er 0
8
Dec
emb
er 0
8
Janu
ary
09
Feb
ruar
y 0
9
Mar
ch 0
9
Fre
que
ncy
YTD Lost Time Incident Frequency
YTD Vehicle Incident Frequency
YTD Total Recordable Incident Frequency

2009 Annual statement of reserves Reserves & resources (1-7)*
0
20
40
60
80
100
120
140
160
180
200
31-12-07 Discoveries Revisions Production 31-12-08
MB
BL
156,8
-5,7
24.3
2.8 178.3
Classification 1-7*
First Quarter 2009 | 9
162.6
2.5 13.1
178.3
0
20
40
60
80
100
120
140
160
180
200
Class 1-3 Class 4 Class 5 Class 7 Class 1-7 M
BB
L
*Does not include associated reserves (P50) and resources in Det norske oljeselskap ASA (36,9%) of 40,1 mbbl

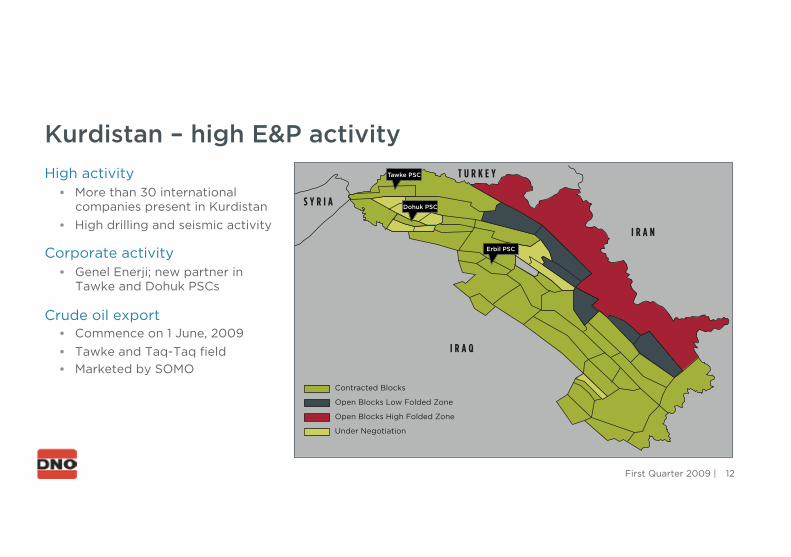
Kurdistan – high E&P activity High activity • More than 30 international
companies present in Kurdistan • High drilling and seismic activity
Corporate activity • Genel Enerji; new partner in
Tawke and Dohuk PSCs
Crude oil export • Commence on 1 June, 2009 • Tawke and Taq-Taq field • Marketed by SOMO
12 First Quarter 2009 |
DNO
T U R K E Y
I R A N
S Y R I A
I R A Q
Contracted Blocks
Open Blocks Low Folded Zone
Open Blocks High Folded Zone
Under Negotiation
Tawke PSC
Dohuk PSC
Erbil PSC
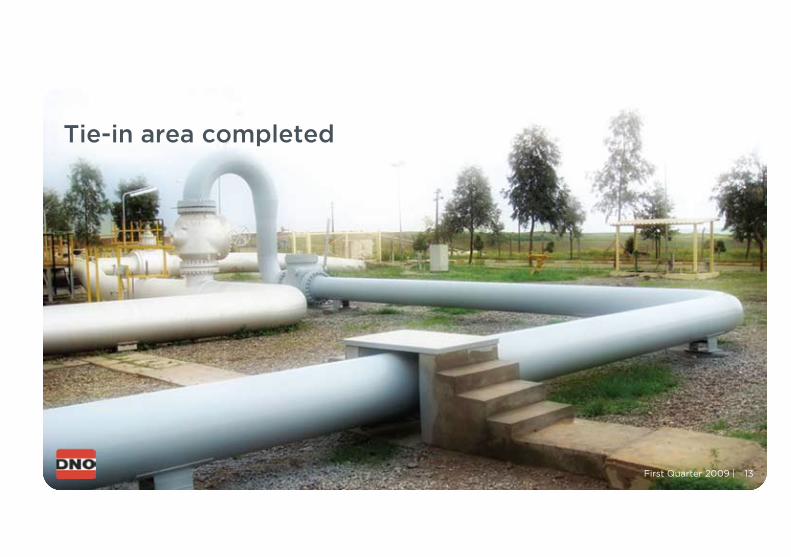
Tie-in area completed
First Quarter 2009 | 13
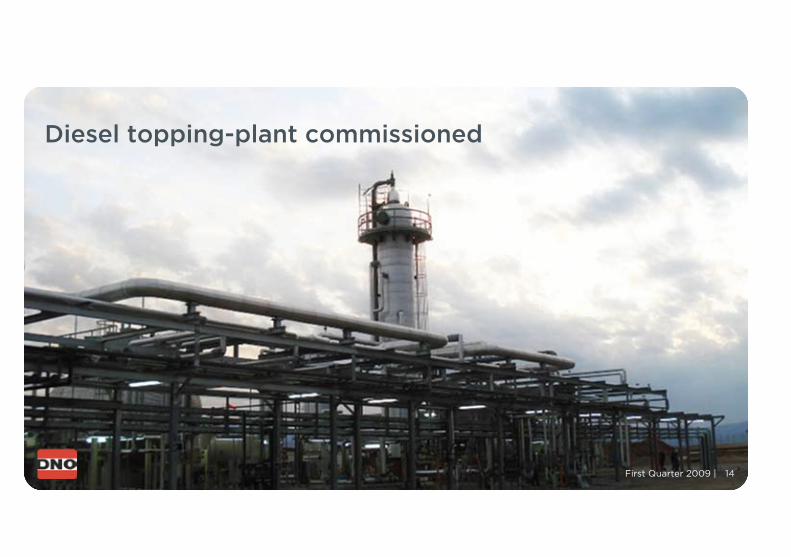
Diesel topping-plant commissioned
First Quarter 2009 | 14
FINANCIALS
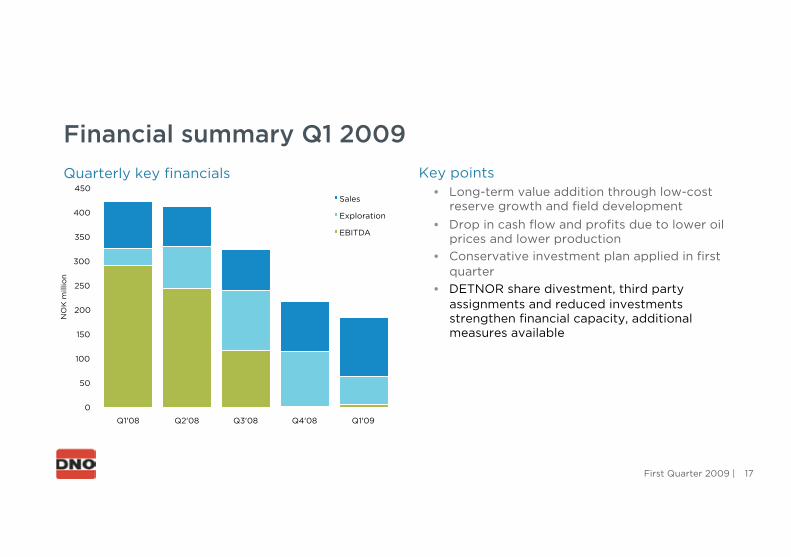
Financial summary Q1 2009 Quarterly key financials Key points
• Long-term value addition through low-cost reserve growth and field development
• Drop in cash flow and profits due to lower oil prices and lower production
• Conservative investment plan applied in first quarter
• DETNOR share divestment, third party assignments and reduced investments strengthen financial capacity, additional measures available
First Quarter 2009 | 17
0
50
100
150
200
250
300
350
400
450
Q1'08 Q2'08 Q3'08 Q4'08 Q1'09
NO
K m
illio
n
Sales
Exploration
EBITDA
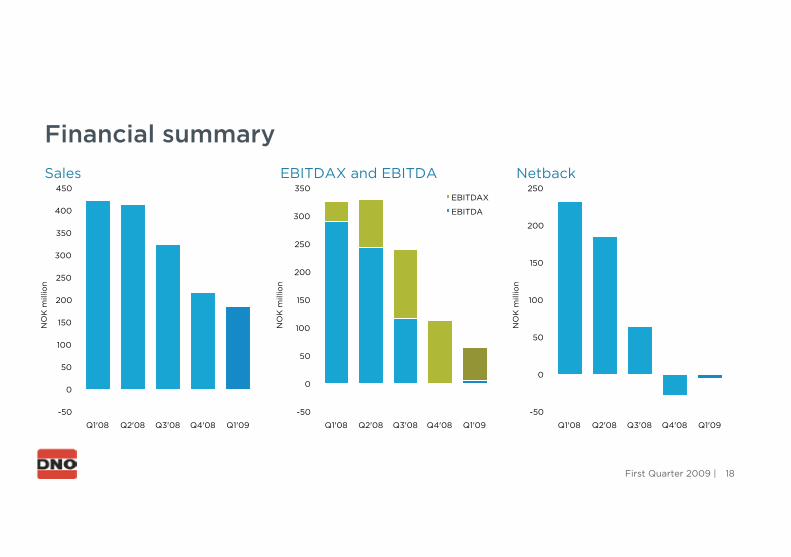
EBITDAX and EBITDA
Financial summary
Sales Netback
First Quarter 2009 | 18
-50
0
50
100
150
200
250
300
350
400
450
Q1'08 Q2'08 Q3'08 Q4'08 Q1'09
NO
K m
illio
n
-50
0
50
100
150
200
250
300
350
Q1'08 Q2'08 Q3'08 Q4'08 Q1'09
NO
K m
illio
n
EBITDAX
EBITDA
-50
0
50
100
150
200
250
Q1'08 Q2'08 Q3'08 Q4'08 Q1'09
NO
K m
illio
n

Condensed income statement NOK Million Q1 2009 Q4 2008 Q1 2008 2008
Sales 183.8 217.3 421.9 1,376.2
Cost of goods sold -190.2 -198.7 -212.8 -745.5
Gross profit -6.4 18.6 209.1 630.7
Dry well cost expensed -8.9 -73,5 -4.1 -158,3
Seismic and other exploration expensed -49.3 -39,3 -30.0 -198,6
Other -12.5 -203,4 -20.9 -265,1
Profit/(loss) from operating activities -77.1 -297,5 154.1 8,8
Share of profit/(loss) associates 1.8 87.0 -3.3 83.3
Net finance 204.5 -702.1 -35.7 -782.0
Profit/(loss) before income tax 129.2 -912,7 115.0 -689,9
Income tax expense 8.7 -64,6 -52.6 -214.0
Net profit/(loss) 137.9 -977,3 62.4 -903,9
First Quarter 2009 | 19

Key points Q1’09 • Gain of NOK 23.8 million from sale of DETNOR shares in January 2009 • NOK 239 million non-cash reversal in Q1’09 of impairment on DETNOR investment • Interest costs down on lower interest rates • Improved FX balance following conversion of bond debt to USD in Q4’08
Net finance
First Quarter 2009 | 20
NOK Million Q1 2009 Q4 2008 Q1 2008 2008
Other financial income 23.8 1.2 - 13.9
Impairment/reversal of impairment of financial assets 229.9 -738.4 - -765.4
Net interest cost -32.4 -52.1 -31.6 -158.3
Exchange rate gain (loss), unrealized items -7.9 65.4 1.4 114.1
Other financial items -7.1 108.9 -8.9 97.1
Net finance 206.3 -615.2 -39.1 -698.6

Exploration expenditure Exploration expensed
-20
0
20
40
60
80
100
120
140
Q1 2008 Q2 2008 Q3 2008 Q4 2008 Q1 2009
NO
K m
illio
n
Yemen
Kurdistan
Africa
Q1 2009 exploration expenses • Reduced exploration activity, maturing of
prospects for later drilling • NOK 58 million in expensed exploration in the
quarter, including NOK 29 million in Yemen seismic survey
First Quarter 2009 | 21

Capital expenditure CAPEX per segment
-50
0
50
100
150
200
250
300
350
400
Q1 2008 Q2 2008 Q3 2008 Q4 2008 Q1 2009
NO
K m
illio
n
Yemen
Kurdistan
Africa
Q1 2009 CAPEX • Overall investment levels significantly down
from previous quarters • NOK 77 million in Capex in the quarter:
• NOK 50 million on pipeline tie-in, diesel-topping plant and other development on the Tawke field
• NOK 11 million on Bayoot development • NOK 8 million production wells on Bl 32
First Quarter 2009 | 22
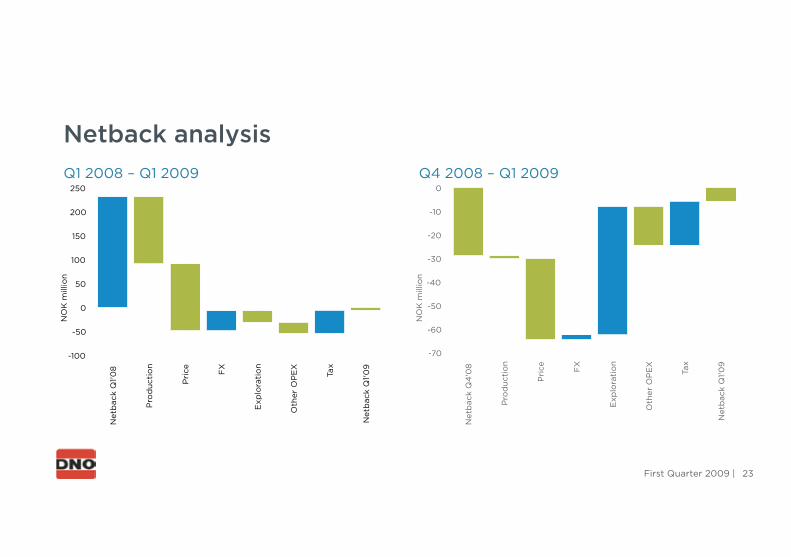
Netback analysis Q1 2008 – Q1 2009 Q4 2008 – Q1 2009
First Quarter 2009 | 23
-70
-60
-50
-40
-30
-20
-10
0
Net
bac
k Q
4'0
8
Pro
duc
tio
n
Pri
ce
FX
Exp
lora
tio
n
Oth
er O
PE
X
Tax
Net
bac
k Q
1'09
NO
K m
illio
n
-100
-50
0
50
100
150
200
250
Net
bac
k Q
1'08
Pro
duc
tio
n
Pri
ce
FX
Exp
lora
tio
n
Oth
er O
PE
X
Tax
Net
bac
k Q
1'09
NO
K m
illio
n
0
50
100
150
200
250
300
Sources Uses
NO
K M
illio
n
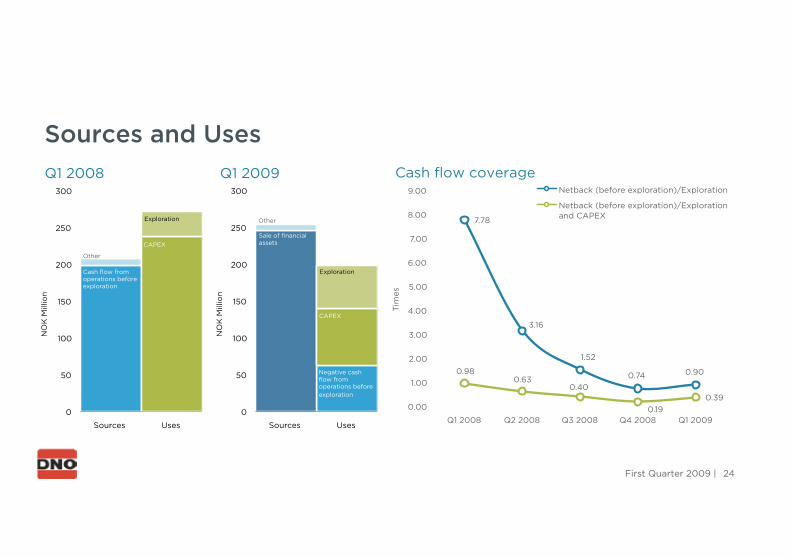
Sources and Uses Q1 2008 Q1 2009
7.78
3.16
1.52
0.74 0.90 0.98 0.63
0.40
0.19 0.39
0.00
1.00
2.00
3.00
4.00
5.00
6.00
7.00
8.00
9.00
Q1 2008 Q2 2008 Q3 2008 Q4 2008 Q1 2009
Tim
es
Netback (before exploration)/Exploration
Netback (before exploration)/Exploration and CAPEX
First Quarter 2009 | 24
Cash flow coverage
0
50
100
150
200
250
300
Sources Uses
NO
K M
illio
n
Cash flow from operations before exploration
Other
CAPEX
Exploration
Negative cash flow from operations before exploration
Sale of financial assets
CAPEX
Exploration
Other
0
1000
2000
3000
4000
5000
6000
31.03.08 31.03.09
NO
K M
illio
n
Other non-current assets Other current assets Financial assets Cash and mm funds
2.62
1.4
1.97
0
0.5
1
1.5
2
2.5
3
2006 2007 2008
US
D/b
bl
Equity and liabilities
0
1000
2000
3000
4000
5000
6000
31.03.08 31.03.09
NO
K M
illio
n
Shareholders equity Non-current liabilities Current liabilities
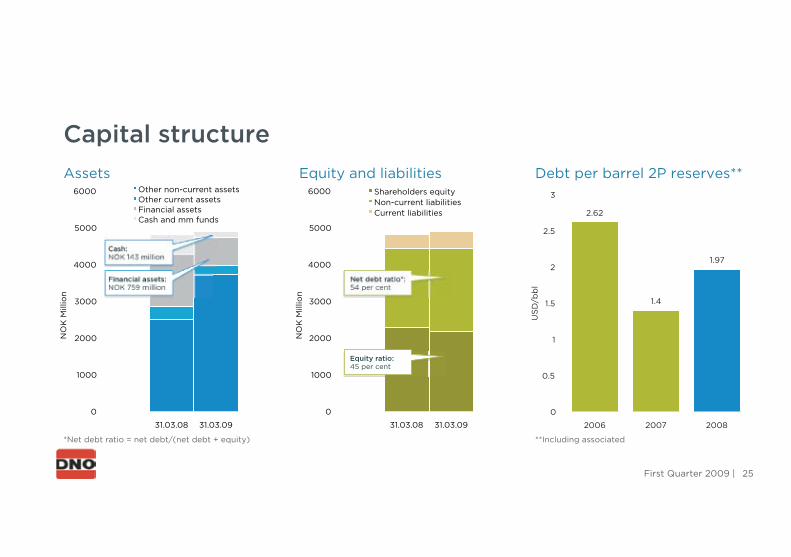
Capital structure Assets Debt per barrel 2P reserves**
First Quarter 2009 | 25
Cash: NOK 143 million
Financial assets: NOK 759 million
Net debt ratio*: 54 per cent
Equity ratio: 45 per cent
*Net debt ratio = net debt/(net debt + equity) **Including associated
Summary and closing remarks • Through successful technical completion and pipeline tie-in, the Tawke field is ready for
increased production from a strong proved and developed reserve base
• Preparations for commencement of crude oil export from Tawke on 1 June
• First quarter results affected by lower oil prices and production
• Several measures taken to maintain financial capacity, additional funding options are available
• Limited long-term capital commitments, significantly lower investment levels in 2009
First Quarter 2009 | 26
DISCLAIMER This Presentation includes and is based, inter alia, on forward-looking information and statements that are subject to risks and uncertainties that could cause actual results to differ. These statements and this Presentation are based on current expectations, estimates and projections about global economic conditions, the economic conditions of the regions and industries that are major markets for DNO International ASA and DNO International ASA’s (including subsidiaries and affiliates) lines of business. These expectations, estimates and projections are generally identifiable by statements containing words such as ”expects”, ”believes”, ”estimates” or similar expressions. Important factors that could cause actual results to differ materially from those expectations include, among others, economic and market conditions in the geographic areas and industries that are or will be major markets for DNO’s businesses, oil prices, market acceptance of new products and services, changes in governmental regulations, interest rates, fluctuations in currency exchange rates and such other factors as may be discussed from time to time in the Presentation. Although DNO International ASA believes that its expectations and the Presentation are based upon reasonable assumptions, it can give no assurance that those expectations will be achieved or that the actual results will be as set out in the Presentation. DNO International ASA is making no representation or warranty, expressed or implied, as to the accuracy, reliability or completeness of the Presentation, and neither DNO International ASA nor any of its directors, officers or employees will have any liability to you or any other persons resulting from your use.
This presentation was prepared for the presentation at the First Quarter 2009 results presentation, May 13, 2009. Information contained within will not be updated. The following slides should be read and considered in connection with the information given orally during the presentation.
First Quarter 2009 | 28

SeCOND QUarter 2009: 19 aUGUSt 2009
WeLCoMe BaCK
Dno internationaL asa, stranDen 1, aKer Brygge, 0250 osLo, norWay, Phone: (+47) 23 23 84 80, Fax: (+47) 23 23 84 81


