Do Banks Aid and Abet Asset Concealment: Evidence from the Panama Papers * Jim Omartian † Kenan-Flagler Business School University of North Carolina at Chapel Hill First Draft: September 2, 2016 Current Draft: October 23, 2017 * I thank my dissertation committee members Eva Labro (chair), Robert Bushman, John Graham, Jeff Hoopes, Mark Lang, and Ed Maydew for their guidance and feedback. I also thank Jeff Abarbanell, Andrew Belnap, Alex Edwards, John Gallemore, Michelle Hanlon, Niels Johannesen (discussant), Andrew Karolyi (editor), Yanju Liu (discussant), Tom Neubig, Jedson Pinto, two anonymous referees, UNC Brownbag partic- ipants, members of the WHU Tax Reading Group, attendees of 2017 UNC Tax Symposium, session attendees at the 2017 AAA annual meeting, and 2017 Carnegie Mellon University Accounting Mini-conference atten- dees for comments. An earlier version of this paper circulated under the title “Tax Information Exchange and Offshore Entities: Evidence from the Panama Papers.” † McColl Building, CB# 3490, Chapel Hill, NC 27599. [email protected]
Transcript
Do Banks Aid and Abet Asset Concealment:
Evidence from the Panama Papers ∗
Jim Omartian†
Kenan-Flagler Business School
University of North Carolina at Chapel Hill
First Draft: September 2, 2016
Current Draft: October 23, 2017
∗I thank my dissertation committee members Eva Labro (chair), Robert Bushman, John Graham, JeffHoopes, Mark Lang, and Ed Maydew for their guidance and feedback. I also thank Jeff Abarbanell, AndrewBelnap, Alex Edwards, John Gallemore, Michelle Hanlon, Niels Johannesen (discussant), Andrew Karolyi(editor), Yanju Liu (discussant), Tom Neubig, Jedson Pinto, two anonymous referees, UNC Brownbag partic-ipants, members of the WHU Tax Reading Group, attendees of 2017 UNC Tax Symposium, session attendeesat the 2017 AAA annual meeting, and 2017 Carnegie Mellon University Accounting Mini-conference atten-dees for comments. An earlier version of this paper circulated under the title “Tax Information Exchangeand Offshore Entities: Evidence from the Panama Papers.”†McColl Building, CB# 3490, Chapel Hill, NC 27599. [email protected]
Using new data from the Panama Papers, I find investors and banks undermine regulation
clamping down on foreign tax evasion by establishing opaque legal structures in tax havens.
However, this concealment strategy is only effective when investors view their offshore bank
as a reliable evasion partner. When they believe offshore banks will violate their trust and
cooperate with the tax authorities, investors make fewer incorporations and increase closures
of offshore entities. My study provides a rare direct look at investors’ and banks’ actions
taken to increase opacity and informs debate on international cooperation to combat offshore
tax evasion.
Cash-strapped governments have been vocal about the problem of offshore tax evasion.
For example, a 2008 US Senate staff report estimates that “offshore tax abuses” result in
an annual loss to the US Treasury of $100 billion in tax revenue (United States Senate
Permanent Subcommittee on Investigations, 2008). While the size of this estimate is in
dispute, most agree that the true loss is quite large, and that the US is not the only country
to lose revenue. However, despite the economic importance, academic research has struggled
to advance our understanding of the shadowy dynamics of the offshore financial industry.
This dearth of evidence is particularly problematic given the cost and reach of regulatory
reforms enacted to target offshore evasion. By its very nature, tax evasion is a secretive
activity, and data availability is the chief obstacle to empirical research in the area. However,
the recent “Panama Papers” leak, detailing over 200,000 offshore entities created by the
Panamanian law firm Mossack Fonseca, provides a fresh opportunity to observe investors
interacting with the offshore financial industry. Using these new data and exploiting a
series of regulatory reforms as quasi-natural experiments, this paper explores the influence
of financial institutions on investors’ efforts to conceal offshore financial activity from tax
authorities.
The seminal theoretical paper on tax evasion, Allingham and Sandmo (1972) characterizes
tax evasion as a gamble against possible detection by the tax authority. This model is
an extension of the Becker (1968) economic model of crime—investors will under-report
income if the expected benefits of evasion (lower tax) outweigh the expected cost (probability-
adjusted penalty for getting caught). However, because many assets (e.g. securities, real
estate, bank accounts) have a recorded owner, tax authorities can fairly readily track down
egregiously underreported income. Cremer and Gahvari (1994) introduces the concept of
“concealment technology,” where for a cost, investors can reduce the probability of detection.
My paper focuses on the use of one type of concealment technology: offshore entities.
The strategy works as follows. An investor contracts with a service provider like Mossack
Fonseca to incorporate a legal entity, and interposes the entity between him- or herself and
1
the assets, creating an ownership chain. Provided the entity is incorporated in an offshore
financial center jurisdiction, this chain can be particularly opaque. These jurisdictions—often
called tax havens because they impose few to no taxes—generally do not require disclosure
of shareholder identities, making the asset’s ultimate economic owner virtually undetectable
to an outside observer. While the use of an offshore entity is legal, failing to report income
earned by the offshore entity to the investor’s home country typically constitutes evasion.
As a concealment technology, offshore entities do have a weak point—to be of any use
they typically need a bank account. Banks are required to conduct due diligence on the
source of funds to make sure the account is not used for money laundering or sponsoring
terrorist activity. As a result, even though an account may held in the entity’s name,
the financial institution will often know the identity of the beneficial owner, and so the
probability of detection depends on the bank not sharing this identity information with the
tax authorities. When making their evasion and concealment decisions, investors must factor
in their expectations that the bank will maintain this secret going forward.
Maintaining secrecy and facilitating evasion provides the banks with a revenue stream,
but organizations like the OECD and European Union have begun to apply pressure on
banks to cooperate with the international tax authorities. This pressure prompts investors
to downwardly revise their beliefs about the bank’s willingness to protect the investor’s
identity going forward. Assuming the offshore banking business is competitive, pressured
banks will need to compensate their depositors for the added risk of detection. I test for this
effect empirically using the EU Savings Directive (EUSD) as a source of pressure.
Under the EUSD, banks must cooperate with the tax authorities in other EU member
states by either exchanging account information or withholding tax on interest income that
the account holder can recoup through self-disclosure. However, a significant loophole exists:
corporate accounts are not subject to the EUSD’s information exchange and withholding tax
provisions. Thus, using an offshore entity is an ideal method to defang this additional risk.
After showing in the data that the EUSD prompts affected investors to incorporate offshore
2
entities, I test for a bank response. I predict and find that to lower the investors’ risk of
detection and to stave off loss of market share to banks not covered by the EUSD, EUSD-area
banks push investors into using offshore entities.
So long as the pressure on the bank is sufficiently low (e.g. there is minimal risk of
government reprisals), the revenue stream from the offshore business can serve as a bonding
mechanism, credibly communicating the bank’s commitment to maintaining secrecy (Kon-
rad and Stolper, 2016). However, competition in the offshore banking industry limits the
available rents, prompting the bonding mechanism to break down under sufficiently strong
pressure.1 Thus, I predict when the pressure on banks is high, investors no longer trust
the bank will keep their identity secret, prompting the abandonment of offshore entities as
concealment.
I test this hypothesis using three settings. First, I exploit a revision to the EUSD which
broadened the EUSD’s scope beyond individual accounts and required banks to identify and
report EU beneficial owners of corporate accounts. Unlike the first iteration of the EUSD
where banks could resist cooperation with the tax authorities by taking advantage of a
weakness in the law, to continue shielding the investor’s identity under the new rule EU-area
banks would need to directly violate the law. I predict that EU investors anticipate that
under the stronger law, banks will not be able to withstand the pressure to cooperate with the
tax authorities, and as a result, the investors close their offshore entities. Second, I look at the
effect of the US’s Foreign Account Tax Compliance Act (FATCA). I expect FATCA, which
requires foreign financial institutions to comb through accounts for potential US investor
ownership, depresses the effectiveness of offshore entities as a concealment technology. As a
result, I predict that US investors create fewer offshore entities in response. Third, I predict
that when Swiss banking secrecy is undermined, investors that use Swiss bank accounts as
1Key to this explanation is that pressure is applied to some, but not all banks, resulting in a subset ofbanks able to maintain secrecy at lower cost. Elsayyad and Konrad (2012) notes that in sequentially forcingproviders out of the offshore business, the remaining participants face lower competition and earn higherprofits, making it harder to drive them out of business. As a result, a piecemeal approach can be moreexpensive than a coordinated worldwide attack and potentially counterproductive.
3
part of their offshore concealment schemes are more likely to close down their entities.
There are a few reasons why my predictions may not hold. First, the use of offshore
entities for nefarious purposes may be limited and investors may simply have nothing to hide
from their home governments. If that is the case, investors may derive no tax benefits from
them, and hence disclosure may have minimal effect. Second, I hypothesize investors modify
their behavior in response to changes in their beliefs about banks’ willingness to cooperate;
investors may believe the regulatory changes will have no bite on banks. Lastly, given the
sheer quantity of information to be exchanged and complexity of the international banking
industry, governments, especially smaller, less-developed ones, may be ill-equipped to make
meaningful use of their new information channels, resulting in no appreciable increase in the
probability of detection and hence no increase in the expected costs of evasion.
I find that investors in affected countries increase the number of offshore entity incorpo-
rations by 73% just prior to the roll-out of the EUSD. Furthermore, I find that this activity
is not just investor-driven; banks actively coordinate the creation of entities on behalf of
their clients with a 3-1/2 fold increase in the rate of entity incorporations driven by banks.
Once the EUSD is strengthened, investors curtail their use of offshore entities; entities cre-
ated specifically to circumvent disclosure to the government are two to five times more likely
to close than benchmark entities after the draft amendment was issued strengthening the
EUSD. Along the same vein, I find that FATCA results in a roughly 30% reduction in in-
corporation activity US investors. I also find that the closure rates for entities that likely
use Swiss bank accounts increase by 33% and 49% in response to the UBS deferred prosecu-
tion agreement and the introduction of the US Department of Justice’s Swiss bank program
respectively. Together, these empirical results suggest that expectations of bank behavior
heavily influence investors’ use of offshore entities as a concealment technology.
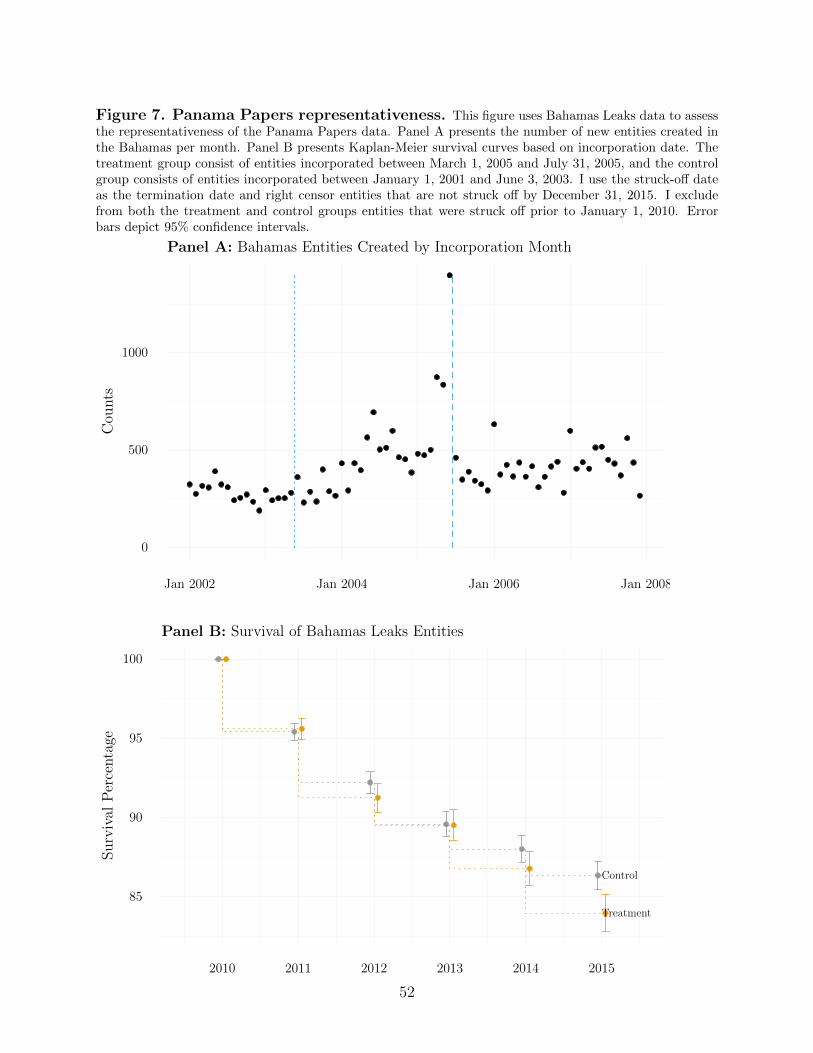
A threat to the validity of my inferences is that given the incorporations in the Panama
Papers were all executed by Mossack Fonseca, the data may not representative of the industry
as a whole. To rule out this possibility, I repeat variants of my tests using another recent
4
leak of offshore entities: the Bahamas Leaks. This dataset contains all entities—regardless
of the service provider—created in the Bahamas. Adapting some of my tests to this new
dataset, I observe consistent results, suggesting that my findings are not limited to Mossack
Fonseca.
My study contributes on a number of fronts. First, I bring new data to bear on the
question of offshore tax evasion. Zucman (2013) estimates that 8% of worldwide household
wealth is held in tax havens. Despite this massive accumulation, our understanding of how
investors interact with the offshore industry is thin. Hanlon and Heitzman (2010) notes that
tax planning strategies fall on a continuum of legality—benign, clearly legal actions like the
use of municipal bonds on one end to illegal actions such as evasion and non-compliance on
the other—and argues that the aggressive end of the spectrum is most interesting to aca-
demics and policymakers. However, data availability is a major obstacle to making progress
in this area. What prevents detection from tax authorities also typically makes evasion
unobservable to the researcher. The Panama Papers offers a unique opportunity to view
the decisions to form and dissolve offshore entities at the individual investor level, provid-
ing a rare glimpse into actions taken primarily for anonymity reasons. I employ these data
to detect “traces of non-compliance” (Slemrod and Weber, 2012), similar in spirit to Han-
lon, Maydew, and Thornock (2015). Other studies in finance have used leaked confidential
datasets to observe questionable activity (Mironov, 2013; Griffin, Kruger, and Maturana,
2016; Grieser, Kapadia, Li, and Simonov, 2016).2 To the best of my knowledge, my study
provides the first academic look at the Panama Papers entity data.3
Second, my paper brings to the fore the role banks play in facilitating or fighting offshore
tax evasion. The regulations I explore conscript financial institutions into policing investors
2In 2013, the International Consortium of Investigative Journalists released a much smaller leak of offshoreentity data from different entity providers. To the best of my knowledge, Caruana-Galizia and Caruana-Galizia (2016) is the only study to explore this precursor dataset. Given its coverage period only covers oneof the regulatory changes I explore, this dataset is ill-suited to my study.
3In concurrent work, O’Donovan, Wagner, and Zeume (2016) links 397 Orbis firms to the Panama Papersfiles to determine the price effects of the data release. That study finds that firms with connections to thePanama Papers experience negative returns concurrent with the release.
5
on behalf of the tax authorities. However, banks have strong business incentives to provide
lax monitoring on this front (Picard and Pieretti, 2011). Thus, it is unclear how banks will
respond. On the heels of the financial meltdown, there is a growing interest in the culture
of dishonesty in banks (e.g. Cohn, Fehr, and Marechal (2014)). While other streams of
research in finance explore the complicity of financial institutions in other illegal behaviors
such as mortgage fraud (Piskorski, Seru, and Witkin, 2015; Griffin and Maturana, 2016),
little empirical evidence exists documenting the extent to which financial institutions help
or hinder tax evasion. Chernykh and Mityakov (2017) is an exception, which using leaked
data from the Russian Central bank, finds that Russian banks with heavy transactional flows
to offshore financial centers are more likely to have employees and client firms that evade
taxes. Gallemore, Gipper, and Maydew (2016) looks at the role of banks in corporate tax
planning, but it studies tax planning in general—not offshore evasion.
Third, my findings inform the debate on regulatory efforts to control offshore tax evasion.
The regulatory changes I explore are non-trivial, and hence an ex-post evaluation of their
outcomes is important in weighing the costs and benefits. For example, in 2014, Canada’s
top five banks estimated they had spent nearly $700 million in initial costs to comply with
FATCA, despite the fact that FATCA is a US law (Trichur, 2014). There has been some work
evaluating the the EUSD (Johannesen, 2014; Klautke and Weichenrieder, 2010; Hemmelgarn
and Nicodeme, 2009), but those papers look at the initial implementation alone and do not
explore bank reactions. To the best of my knowledge, no study has documented the joint
bank and investor reactions to the amended EUSD or the US clamp down on Swiss banks.
One concurrent study explores FATCA, inferring effects from changes in Foreign Direct
Investment in US securities (De Simone, Lester, and Markle, 2017).
Fourth, while the setting is tax, my study contributes to the disclosure literature. Leuz
and Wysocki (2016) notes the importance of mandated disclosure for shaping behaviors,
and calls for additional research on the incentive role of disclosure regulation, particularly
outside of a capital markets setting. The regulatory changes I explore do not change the
6
legality of the investor activity. Rather, they seek to discourage tax evasion through increased
disclosures from financial institutions.4
1 Institutional Context
For corporations, most countries impose a territorial taxation system such that only local
income is subject to tax in the home country. Thus, for companies in territorial countries,
shifting income to low tax jurisdictions—either through locating real activities there or mov-
ing profits on paper—can reduce tax expense. The US is one of the few remaining countries
that have a worldwide taxation system, which taxes US corporations’ income regardless of
where it is earned. However, shifting income to low tax jurisdictions does allow US corpora-
tions to defer their tax expense until they repatriate the profits to the US, potentially creating
savings if the US implements a repatriation tax holiday. Tax havens provide corporations
with a low- or no-tax jurisdiction to locate some of their profits.
International taxation for individuals operates differently. Most countries tax residents
on their worldwide income and do not allow for deferral.5 As a result, simply shifting income
to a low- or no-tax foreign jurisdiction does not provide de jure income tax relief. However,
tax havens can be very useful for investors that wish to under-report income to their home
country’s tax authority. One method is for investors to relocate assets to low- or no-tax
jurisdictions and earn profits on their investment there. So long as information about the
investment does not get reported back to the investor’s home country tax authority, the
investor can evade taxation at home.
A related way that tax havens allow individuals to under-report their income is through
disguising asset ownership. A number of tax haven jurisdictions let foreign investors create le-
4While combating tax evasion is their express purpose, the regulations I explore may have spillover effectsto curbing other unsavory activity. In my setting, I am unable to distinguish if investors shun disclosure tothe government to conceal tax evasion in particular or some other illicit behavior.
5The United States is an exception, taxing all US residents and all US citizens regardless of domicile.Thus, retiring to a tax haven does not eliminate US tax liability for wealthy American investors unless theyrenounce their US citizenship.
7
gal entities6—sometimes called “shell corporations” or more pejoratively “sham corporations”—
catered to investing anonymously. These offshore entities have minimal legal restrictions.
Typically no more than one shareholder is required, and if maintained, share registers are
kept with the entity’s registered agent (e.g. Mossack Fonseca) and not disclosed to the gov-
ernment. Paperwork requirements are also designed with opacity in mind. Annual reports
are typically not required, and entities generally do not file tax returns in their incorporation
jurisdiction. There are no requirements that economic activity happens in the offshore ju-
risdiction, and in fact many jurisdictions require it to occur outside their borders to receive
tax-free treatment. Typically, the only requirement is that the registered agent has an office
in the jurisdiction.
As the beneficial owner of an offshore entity, an investor can conduct anonymous invest-
ment activity worldwide—even in the investor’s home country—using the offshore entity’s
name. This anonymity in and of itself is not illegal and can have value for the investor
for a myriad of reasons. For investors residing in countries with weak property rights, us-
ing an offshore entity may prevent government expropriation. Investors buying property or
acquiring a firm may want to conceal their identity from the counterparty for an edge in
negotiations. Assets in the entity’s name are harder to discover through the legal process,
potentially shielding them from seizure in litigation. Of course, the anonymity also allows
investors to simply not report taxable income that was earned by the offshore entity. While
the use of an entity is legal, for most investor countries failing to report an offshore entity’s
income to the investor’s home country constitutes illegal evasion.7
6Depending on the jurisdiction, these entities can be corporations, partnerships, foundations, and trusts.While each of these have different requirements and structures, the Panama Papers data do not distinguishamong them. Given this data limitation, and since these entities can be used to serve similar purposes,I also make no distinction between them in this study and for expositional ease refer to them collectivelyas offshore entities. Pooling these entity types may add noise to my tests and likely biases against findingresults.
7Controlled Foreign Corporation (CFC) rules, which are widely prevalent, essentially treat foreign incomefrom shell companies as if it were domestic income.
8
2 Data
2.1 Mossack Fonseca and the Leak
Mossack Fonseca resulted from the 1986 merger of two Panamanian law firms run by Jurgen
Mossack and Ramon Fonseca. The practice has since grown to over 500 employees with offices
in every continent. The firm provides a broad array of services designed to set up and manage
legal entities such as corporations, trusts, and foundations in tax haven jurisdictions. For
the majority of entities created, Mossack Fonseca works with intermediaries rather than the
clients directly. These intermediaries, such as other law firms, banks, financial institutions,
and accountants, advise the client and conduct much of the administration involved with
operating an offshore entity, with Mossack Fonseca’s role limited to incorporating the entity
and maintaining its registration with the relevant authority. In other cases Mossack Fonseca
provides full service directly to clients.
In early 2015, an anonymous source began leaking what would become 11.5 million
Mossack Fonseca internal files to the German newspaper Suddeutsche Zeitung. Faced with
the sheer size of the leak and the challenges making sense of this data, Suddeutsche Zeitung
turned to the International Consortium of Investigative Journalists (ICIJ) to process the
2.6 terabytes worth of data, much of which was contained in image-based files. After a
year of data processing and investigative work, ICIJ member newspapers began publishing
investigative articles on April 3, 2016.
The leak contains records dating back to the 1970s documenting the creation of over
200,000 offshore entities. The data implicate over 140 politicians and public officials in
schemes to hide assets overseas, including associates of Russian President Vladimir Putin,
the brother-in-law of Chinese President Xi Jinping, the family of Pakistani Prime Minister
Nawaz Sharif, and UK Prime Minister David Cameron’s father. Under immense pressure,
Prime Minister of Iceland Sigmundur David Gunnlaugsson resigned when the Panama Pa-
9
pers revealed his holdings of an offshore company that held Icelandic bank debt during the
country’s banking crisis. Politicians are not the only names mentioned in the leak; FIFA
officials, professional athletes, and actors featured prominently.
2.2 Organization of the Data
The data leaked to Suddeutsche Zeitung include details like bank account information and
client communication records. However, ICIJ has not publicly released data beyond the
entity database. The database released8 consists of three main data files: one for entities,
one for officers, and one for intermediaries. In the entity file, each record corresponds with an
offshore entity created by Mossack Fonseca. Included in these entity records are the entity’s
name, incorporation date, and a legal jurisdiction (incorporation country). The officer file
consists of a list of persons (natural and legal) that have a stake in an entity along with
a country and in many cases an address. Each record in the intermediary file contains the
name, address, and country of a firm that interfaces with the ultimate investor.9 The data
do not categorize officers (e.g. person, company, etc.) or intermediaries (e.g. bank, law firm,
etc.), but this information is often apparent from the names. Thus, when necessary I classify
officers and intermediaries using text filters. The power of the Panama Papers data is the
connections the database makes between the three files.
Consider the following hypothetical example. Assume in February 2005 “Joe Bloggs,” a
UK resident approaches “Omega Investment Services” a Luxembourg wealth management
firm for help managing his portfolio and perhaps reducing his UK tax exposure. Together
they decide it would be advantageous to deposit funds in “Lambda Bank” in Luxembourg.10
Because the UK government has no authority over Lambda, the bank does not share Joe’s
8Available on the ICIJ website at https://offshoreleaks.icij.org/pages/database9Entities also frequently have a physical address listed, but this address is typically the same as the linked
intermediary and not the location of real economic activity.10For ease of exposition I describe the portfolio as a simple cash bank account. In actuality, the portfolio
likely contains securities and other financial instruments. In such a case, the Luxembourg bank would act asa fiduciary—maintaining custody of the assets while Joe remains the beneficial owner. Such a relationshipis analogous to a brokerage account.
account information with HM Customs, the UK tax authority. So long as Joe does not
self-report, HM Customs has little ability to tax profits on this portfolio. However, to
further conceal his wealth, Joe and Omega decide to create an offshore entity called Alpha
Enterprises—a company that is solely owned by Joe but conducts no real economic activity.
Joe can transfer title of his assets to Alpha while maintaining beneficial control, and have
Alpha in turn deposit the assets with Lambda. Omega Investment Services contracts with
Mossack Fonseca to create Alpha Enterprises in the British Virgin Islands (BVI) on behalf
of Joe.
Now assume in April 2006, Joe and his American business partner “Jane Doe” again
approach Omega Investment Services for help managing their partnership’s assets. They
decide to create an entity called “Beta Inc.” with Joe and Jane each as shareholders. Omega
again turns to Mossack Fonseca for incorporation services, but this time they incorporate
Beta in Anguilla. Joe and Jane transfer title of their partnerships assets to Beta and have
Beta open up an account with “Mu Bank,” also in Luxembourg, to deposit the assets.
Figure 1 illustrates how these structures would appear in the data. The black-and-white
portions appear in the data, whereas the gray elements are not captured. I observe both
Joe and Jane, their respective countries, and their “shareholder of” relationships with Alpha
and Beta. I can see the incorporation dates (and closing dates if applicable) for Alpha and
Beta along with their jurisdictions (BVI and Anguilla). I also observe the involvement of
Omega Investment Services as an intermediary in the creation of both Alpha and Beta. The
data do not however contain the bank information.
[Place Figure 1 about here]
My hypotheses concern the offshore incorporation activity driven by investors in par-
ticular countries. As in my hypothetical example, one entity can have multiple investors,
sometimes spanning multiple countries. As a result, for most of my tests I cannot use the
entities themselves as the unit of analysis. Thus, my measure of incorporation activity is the
11
count of new investor-entity pairs created in a given month. For the example in Figure 1, I
would count three pairs. The first would be a UK-BVI pair created in February 2005. The
second and third would be a UK-Anguilla and a US-Anguilla pair each created in April 2006.
For ease of exposition, I refer to the creation of these pairs as incorporations.
2.3 Descriptive Statistics
Table 1 lists the number of entities in the sample, broken down by the number of investors.
The “All Investors” columns present entities by number of linked shareholders in the entire
Panama Papers database. Most entities have a only a handful of investors. In many in-
stances the shareholders themselves are from a tax haven country; in these cases the listed
shareholder is typically not the beneficial owner and the entity may be part of a multilayer
structure. Additionally, the investor’s country is often not populated. Typically, this oc-
curs because the entity is set up with bearer shares. Bearer share entities are owned by
whoever holds the physical stock certificate; no official share register is maintained. In the
data, bearer shares appear with the investor having the name “The Bearer” or similar and
no country information. In the “Non-Haven, Non-Missing Country Investors” columns I
exclude shareholder links where the shareholder’s country is a haven per Gravelle (2009) or
missing, as these links don’t provide investor location information. Excluding these links
results in 79,037 entities with no shareholders with valid country information.
[Place Table 1 about here]
Panel A of Table 2 breaks down incorporation activity since 2000 by investor country.
While the OECD has been leading the charge in combating offshore tax evasion, many
non-OECD countries rank highly. Panel A also lists the percentage of shareholders by
country that are individual people. To determine if the shareholder is a natural person
or another entity, I apply a text filter on the name to search for a list of company terms
(e.g. “Inc.”, “S.A.”, etc.) based on the name standardization algorithms used by the NBER
12
patent project.11 While there is some heterogeneity from country to country, the majority
of shareholders in the data appear to be individual investors.
[Place Table 2 about here]
Offshore jurisdictions are quick to point out there are many legitimate reasons for in-
vestors to use an offshore entity aside from tax avoidance. For instance, tax haven jurisdic-
tions typically have strong governance and legal institutions (Dharmapala and Hines, 2009),
potentially offering a more stable or less restrictive environment in which to conduct busi-
ness than some investors’ home countries. Also, investors may be shielding their identities
for reasons unrelated to taxes—holding assets in a legal name may help companies shield
expansion plans and property acquisitions from the prying eyes of competitors. On the flip
side, doing so can also facilitate expropriation and tunneling (Chernykh, 2008). Looking at
the data in Table 2, Panel A, it appears that tax evasion is not the only reason for setting
up an offshore entity. For instance, the United Arab Emirates imposes no tax on individual
income and hence UAE investors would not derive a tax benefit from their use. However,
the country ranks sixth in terms of incorporation activity, suggesting that in all likelihood,
UAE investors are using offshore entities for reasons unrelated to investor-level tax evasion.
Because little real economic activity takes place in the entity’s jurisdiction location, in-
vestors face a choice in where to incorporate. Panel B of Table 2 list incorporation activity by
jurisdiction. I tabulate activity for all incorporations and incorporations where the investor
is known to be located in a non-haven country. For Mossack Fonseca’s entities, the most
common jurisdiction is the British Virgin Islands, but sizable incorporation activity occurs
in 5 additional jurisdictions: Panama, Seychelles, Samoa, the Bahamas, and Anguilla. The
data suggest that certain jurisdictions may be optimized for specific structures. For example,
Panama dominates the bearer share incorporation activity.
11I base my filters on Jim Bessen’s adaptation of the Derwent Standardization, whichcan be downloaded at https://sites.google.com/site/patentdataproject/Home/posts/
namestandardizationroutinesuploaded. If any of the standardized terms are found in the name, Icategorize the officer as a non-person.
Taxpayers are more likely to evade taxes when income is self-reported (Kleven, Knudsen,
Kreiner, Pedersen, and Saez, 2011). However, when a third party reports income information
to the tax authority, taxpayers have far less opportunity to avoid detection of underreported
income. To target the estimated $2 trillion in European wealth hidden in tax havens where
it has influence (Alstadsæter, Johannesen, and Zucman, 2017), the European Union in June
2003 enacted the EU Savings Directive (EUSD). The EUSD requires banks in participating
states12 to identify individual (non-corporate) accounts held by EU residents and report ac-
count information to the account holder’s home country. States with strong bank secrecy
regimes—the jurisdictions standing to lose the most with successful third-party bank re-
porting across country lines—understandably objected, so the EU allowed for an alternate
compliance method. Instead of exchanging account information, participating states can opt
to withhold a tax on interest income for account holders residing in an EUSD country.13
To avoid the withholding tax, on an individual basis depositors could elect to report their
identity and interest income information to their home country’s tax authority.
I explore two responses to the EUSD: investor response and bank response. I predict and
find that EU investors increase their use of offshore entities to circumvent the information
sharing and withholding tax provisions of the EUSD. I also predict and find that EUSD-
12In addition to the EU member states, the EUSD applied to Andorra, Anguilla, Aruba, British VirginIslands, Cayman Islands, Curacao, Guernsey, Isle of Man, Jersey, Liechtenstein, Monaco, Montserrat, SanMarino, St Maarten, Switzerland, and the Turks and Caicos. The EUSD took effect on July 1, 2005 exceptin Bulgaria and Romania where the effective date was January 1, 2007.
13EU member states Austria, Belgium, and Luxembourg opted to apply a withholding tax, along withAndorra, Liechtenstein, Monaco, San Marino, Switzerland, Jersey, Guernsey, Isle of Man, the British VirginIslands, the Turks and Caicos, Curacao and St Maarten. The remaining EU member states along withAnguilla, Aruba, the Cayman Islands, and Montserrat opted for bank disclosure. Beginning in 2005, thewithholding rate was 15%, which increased to 20% in 2008 and 35% in 2011. As a compliance incentive, thejurisdiction where the account was located shares the proceeds of the tax: 75% flows to the depositor’s homecountry and 25% stays with the jurisdiction where the account is located. Although the investor’s homecountry receives proceeds from the tax, no information identifying account holders accompanies the funds.
14
area banks in jurisdictions with strong bank secrecy laws respond to the EUSD by actively
orchestrating the creation of offshore entities for their customers’ benefit.
3.1.1 Investor Response. The EUSD has a number loopholes that motivated investors
can employ to avoid its provisions.14 Pertinent to my study, investors can shift the account
to being held by a corporate entity. By creating a legal entity (anywhere in the world)
and deposit funds in the legal entity’s name, the investor can circumvent the disclosure or
withholding tax provisions (Commission of the European Communities, 2008). Because of
their flexibility, secrecy, and lack of income taxation, offshore entities are aptly suited for
this concealment purpose. Employing country-level bilateral deposit data from the Bank of
International Settlements, Johannesen (2014) finds concurrent with the EUSD a reduction in
Swiss bank deposits from EU depositors and a corresponding increase in Swiss bank deposits
from Panamanian depositors. This evidence is consistent with investors transferring title of
deposits to offshore entities in Panama and keeping the funds in Switzerland.
I use investor response to the EUSD to validate my measure of offshore incorporation
activity against prior research. I predict that in the months leading up to the July 1, 2005
EUSD effective date, investors in countries facing the automatic reporting of interest income
or withholding tax take steps to protect themselves and scramble to incorporate offshore
entities. Once the roll-out occurs, I predict the flurry of activity subsides, but that the level
of incorporation activity after the effective date remains somewhat higher than before the
EUSD run-up. While the pre-July 1 activity likely reflects steps taken to protect existing
deposits, a post-July 1 increase likely accounts for effort shielding new foreign deposits. I
employ the following model:
Incorporations it = α1MarJul2005EU it + α2PostJul2005EU it + βi + γt + εit (1)
14Both the disclosure and any withholding tax apply only to individual interest income. As a result,investors can shift to non-interest-based investments or change holdings to grandfathered assets that werenot subject to the directive’s provisions. However, prior research finds that investors do not pursue thesemethods. Klautke and Weichenrieder (2010) finds no increase in the demand for grandfathered assets, andHemmelgarn and Nicodeme (2009) does not observe a shift away from interest-bearing assets.
15
where i indexes investor country and t indexes the month and year. MarJul2005EU it takes
a value of 1 if country i is subject to the EUSD15 and t = March, April, May, June, or
July 2005, and 0 otherwise. I include the first month of the EUSD effective period (July
2005) to account for stragglers, or if there is measurement error in the incorporation date.
PostJul2005EU it takes a value of 1 if i is subject to the EUSD and t is August 2005 or
later. βi is a country fixed effect and γt is a month-year fixed effect. εit is an error term.
Because the distribution of incorporations is highly skewed, I estimate Equation (1) using
two operationalizations of Incorporations it. I use an indicator variable equaling 1 if investors
from country i incorporated any new entities in month t, and 0 otherwise. I also employ
a logarithmic transformation where I take the natural log of one plus the number of new
incorporations from the country i in month t. I employ OLS to avoid the incidental variables
problem inherent with estimating non-linear models using fixed effects. I cluster the standard
errors by country-jurisdiction pairs and month.
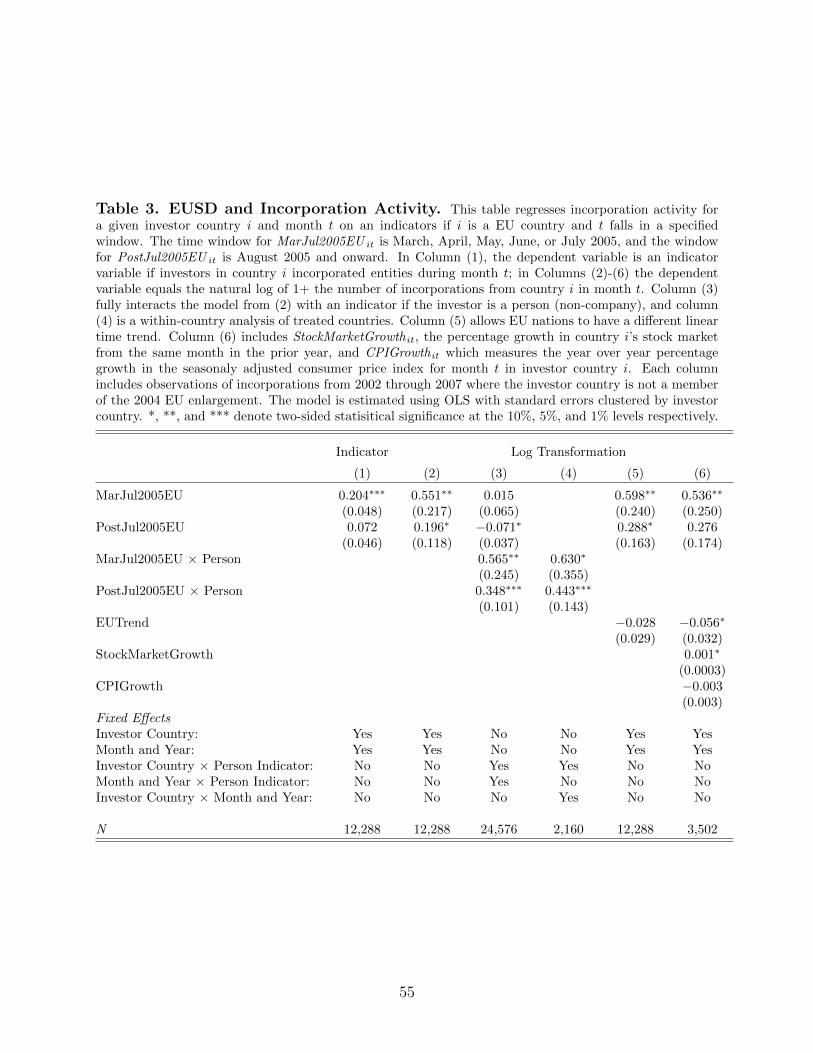
If incorporation activity increases in anticipation of the EUSD effective date, α1 should
be positive. I estimate the model using investor country-month observations of incorporation
activity from 2002 through 2007. Table 3 presents the results. As predicted, the estimates
in Columns (1) and (2) suggest an increase in incorporation activity from EUSD investor
countries. I observe an increase of 20 percentage points in the probability of there being
offshore incorporation activity from an EUSD country in the months prior to the EUSD
taking effect. Similarly, I observe a roughly 73% increase in the quantity of incorporations
(e0.551 = 1.73). Once the EUSD comes into force, the incorporation activity indeed subsides
relative to the pre-July 1 rush, but remains higher than the early period.
[Place Table 3 about here]
Given the EUSD affected individual accounts, I should only detect an effect when the
shareholder is a person. In Columns (3) and (4) I split the dependent variable into incorpo-
15Consistent with Johannesen (2014), I consider treated only those countries that were EU members priorto the 2004 EU enlargement. New accessions undergo structural changes that may confound my estimationof the EUSD effect. My results are robust to including 2004 accession countries in the sample.
16
rations based on whether or not the shareholder listed in the data is a personal name. In
Column (3) I interact the covariates, investor country fixed effects, and time fixed effects
with an indicator if the investor is a person. This specification allows me to determine both
if treated countries increase relative to control countries and if the increase was concentrated
in the non-corporate investors. I find no significant increase for the non-person investors in
EU countries during the run-up period; the entire effect is concentrated in the person-held
entities. In Column (4) I conduct a within-investor country analysis, using each investor
country’s person-held incorporations as the treatment groups and the corresponding non-
person-held incorporations as control groups. I do so by limiting the sample to EU countries,
including investor country × time fixed effects along with investor country × person fixed
effects, and including the interacted covariates. The advantage of this specification is that
it rules out my results being driven by country-level, time-varying differences between the
treatment and control groups. Again, I find an increase for the run-up period, which falls in
the post-implementation period but remains higher than the pre-period.
While investor country fixed effects account for time-invariant differences across investor
countries, and time fixed effects allow for monthly differences in the average country’s in-
corporation activity, the model does not account for divergent changes at the country-level
over time. To guard against this possibility producing spurious results, I estimate two ad-
ditional specifications. I employ the approach outlined in Angrist and Pischke (2014) and
in column (5) I allow the treatment group to have its own linear time trend, relaxing the
parallel trends assumption somewhat. In Column (6) I control for changes in the market
and economic conditions in the investor country directly using monthly data from the World
Bank’s Global Economic Monitor dataset. I include StockMarketGrowth it, growth in the in-
vestor country’s stock market from the same month in the prior year, which controls for the
effects of changes in investor wealth driving incorporation activity. I also add CPIGrowth it,
year-over-year growth in country i’s seasonally-adjusted consumer price index for month t,
to control for inflationary pressures. During periods of high inflation at home, investors may
17
increase their use of tax havens as a safe location to preserve the value of their wealth. My
findings are robust in both specifications.
Lastly, I probe the parallel trends assumption more directly by looking at intertemporal
dynamics. In Figure 2 I plot coefficient estimates and associated 90% confidence intervals
where QX 200Y EU is an indicator that turns on for treated countries in the X th quarter
of year 200Y . Thus each point on the graph represents the difference-in-difference estimate
for a particular quarter, using January 2002-March 2003 as the reference period. Consistent
with the parallel trends assumption, there is no difference between treated and control ob-
servations until the last quarter before the EUSD implementation. Then, I observe a large
spike as investors rush to conceal their foreign assets, followed by a post-implementation
equilibrium with a significantly higher level of incorporation activity from treated countries’
investors. The precision of the spike before implementation makes it highly unlikely that the
behavior I observe is caused by something other than the EUSD rollout.
[Place Figure 2 about here]
3.1.2 Bank Response to EUSD. Another method for investors to circumvent the bank
information exchange or withholding provisions of the EUSD would be for investors to close
their EUSD-area foreign bank accounts and open accounts in a non-EUSD jurisdiction such
as Singapore. This possibility is particularly harmful to banks in the EUSD area on two
levels. First, a rash of withdrawals could undermine the banks’ solvency and prompt a run
(Diamond and Dybvig, 1983; Goldstein and Pauzner, 2005). Second, the loss of EU investors
could result in non-EU investors losing trust that the EUSD tax havens will remain non-
18
cooperative with non-haven governments going forward. Konrad and Stolper (2016) presents
a model of tax havens where investors obtain strategic complementarities by investing in the
same tax haven. Because high profits on tax haven business serve as a commitment device for
the haven country to withstand political pressure to cooperate with non-haven governments,
investors derive benefit from coordinating tax haven use. Without profits from the EU
investors, the amount of political pressure it takes to compel the EUSD-area tax havens to
cooperate decreases, making their use riskier for non-EU investors. Thus, the EUSD-area
banks, and by extension their respective governments have a strong incentive to help their
clients circumvent the EUSD’s provisions.
I predict that to stave off EUSD-induced depositor flight, affected banks take steps to
signal to EU account holders that their accounts will remain anonymous. One way they
can do so is by making the transition to an offshore entity seamless for their account hold-
ers, taking on the logistical efforts and thus bearing some of the costs of the concealment
technology. Thus, I test if affected banks take an active role in facilitating tax evasion by
orchestrating the creation of offshore entities. The intermediary data of the Panama Papers
allows identification of which entities were created under the direction of a bank.
I categorize intermediaries as banks if their names include any of the substrings “BANK”,
“BANC”, “BANQU”, “CREDIT”, or “CREDIT”. This classification results in 256 bank
intermediaries, though many represent multiple branches of a parent bank. For instance,
there are separate intermediary entries for HSBC Private Bank in Switzerland, Monaco,
Luxembourg, Guernsey, Jersey, and the United States. The vast majority of the time when
the bank serves as the intermediary, it creates a bearer share entity. This arrangement
affords a high level of anonymity for the investor because whoever holds the physical share
certificates is the owner of the company; no ownership registry is maintained by Mossack
Fonseca or the incorporation jurisdiction. It also allows banks to orchestrate the process
of setting up an offshore entity on behalf of a high-value depositor without violating bank
secrecy and sharing the depositor’s information with Mossack Fonseca. However, it in turn
19
means the bearer’s identity (and hence home country) is not observable in the Panama
Papers data. This gap in investor country information limits the strength of my tests of
bank complicity in circumventing the EUSD.
To detect a bank response to the EUSD, I analyze intertemporal changes in the rate of
bank involvement in offshore incorporations. Figure 3, Panel A presents the monthly counts
of incorporations with bank intermediaries. After enactment of the EUSD (depicted by the
left dotted vertical line), the number of bank-facilitated incorporations per month increases
dramatically up to the effective date (depicted by the right dashed vertical line). After the
effective date, the number of incorporations falls but remains higher than before the EUSD
was enacted. While this spike in Panel A is dramatic, it does not reveal if the increase in
bank-facilitated incorporations is a result of a numerator effect (banks representing a dis-
proportionately large share of the activity) or a denominator effect (overall incorporations
increasing). Panel B tracks the monthly percentage of incorporations with a bank interme-
diary. The similar plot pattern to Panel A suggests that the increase is not driven solely by
a denominator effect; banks facilitated a disproportionately large number of incorporations
in the lead-up to the EUSD’s effective date.
Table 4 tests for statistical differences in the proportion of incorporations facilitated by a
bank. I partition incorporations into 4 periods: Pre-enactment (January 2002 - May 2003),
Early Run-up (June 2003 - February 2005), Late Run-up (March 2005 - July 2005), and
Post-implementation (August 2005 - December 2007). Panel A presents the counts and
proportions by time period. Prior to the EUSD’s enactment, bank facilitated incorporations
represent 6% of the overall activity. However between the enactment and effective dates,
bank involvement grows steadily to nearly 21% of incorporation activity. After the effective
date passes, bank involvement falls to just under 12%. Panel B breaks down the bank-
driven incorporations by bank country and time period. The primary bank countries are all
locations where the bank would be subject to the EUSD’s withholding regime and at risk
for depositor flight. The increase being concentrated in EUSD-area banks is comforting, as
20
I predict the effect is limited to these banks.16 Panel C presents the results of χ2 tests of
equal proportions using the data from Panel A. The changes in bank involvement are all
highly statistically significant, as is a test of an increasing linear trend in bank involvement
between the enactment and effective dates.
[Place Table 4 about here]
Identification of an EUSD effect on bank involvement using the χ2 tests assumes that
in the absence the EUSD, the proportion of incorporations with bank involvement would
not have changed intertemporally. This is an admittedly strong assumption. However, for
another force to be causing this intertemporal pattern, it would need to be absent prior to
June 2003, increase progressively until July 2005 and then sharply fall. I know of no other
reasonable explanation that explains this distinctive intertemporal signature.
Additionally, the time patterns of the incorporations bolster my story that these incor-
porations are indeed bank-driven and not investor-demanded. While the narrow spike in
incorporations around the EUSD effective date in Figure 2 suggests investors waited until
the last minute to take action, Figure 3 shows that banks—most likely better aware of the
impending regulation—acted sooner to preempt depositor flight. Additionally, clustering of
bank activity (not tabulated) is consistent with bank-driven behavior. For instance, 187 of
the 204 incorporations from Andorra banks during the early run-up period came from one
bank during a 4-day window (November 30, 2004-December 3, 2004); it is highly unlikely for
so many depositors to request an offshore entity in such a short window. Overall, the results
suggest that EUSD-area banks catering to offshore tax evasion were complicit in helping
investors circumvent the EUSD, presumably in response to their EUSD-driven competitive
disadvantage.
16However, the low involvement from non-EUSD banks precludes my using them as a control group in adifference-in-difference design.
21
3.2 Individual and Corporate Account Information Exchange
The evidence reported thus far suggests investors and banks employ offshore entities to
circumvent the exchange of individual account information. However, the response to ex-
changing corporate account information as well is an open question. To test the response, I
exploit an amendment to the EUSD and the Foreign Account Tax Compliance Act (FATCA).
3.2.1 Amended EUSD. In May 2013 the EU issued a draft amendment to the EUSD
that would close the loophole for corporate accounts. The amendment would force EUSD-
area financial institutions to look back through pass-through entities to identify beneficial
owners of accounts, and use those identities as the basis for withholding tax or exchanging
information with the investor’s home tax authority. Assuming banks have the information
and are compliant, such a change would make offshore entities an ineffective concealment
technology for EU investors that use financial institutions in the EUSD coverage area. While
the amendment was not passed until December 2014, given the concurrent developments
with FATCA, practitioner articles at the time covering the amendment predicted that its
eventual passage and implementation was inevitable. As a result, I consider that in May
2013, investors anticipated that the amendment would eventually be passed, and I predict
that after that point in time affected investors are more likely to close down their offshore
entities.
As mentioned earlier, investors may use offshore entities for variety of purposes—some of
which have nothing to do with tax evasion—and the Panama Papers data do not explicitly
state why the entity was created. However, I can take advantage of the introduction of
the original EUSD as a source of plausibly exogenous variation in the reason. Given the
results in Section 3.1.1, many of the entities incorporated by EU investors around the July
1, 2005 roll-out date are likely created specifically for evading information exchange with the
investor’s tax authority. From a research design standpoint, this shock creates differences in
the intended usage of entities along two dimensions—cross-country and intertemporally—
22
which allows for multiple control groups in a difference-in-difference framework. By showing
using two different benchmarks that concealment-motivated entities are more likely to close
in response to the move to exchanging both individual and corporate account information,
I am able to rule out potential confounds along investor country and time dimensions.
I conduct a hazard-model adaptation of the standard difference-in-difference design. I
categorize entities created by EU investors between March 1, 2005 (four months before the
effective date) and July 31, 2005 (one month after the effective date) as evasion-driven, and
thus highly-sensitive to the effects of additional corporate account information exchange. I
refer to this group as the treatment group. I then employ three reference groups. The first
group consists of entities created by non-EU investors over the March-July 2005 period. The
second group is entities from EU investors incorporated between January 1, 2002 and June
3, 2003—before the EUSD was enacted. The third is from non-EU, OECD investors over
the same pre-enactment period. As entities in these three reference groups were either not
affected by the EUSD or were created before the EUSD was enacted, the incidence of entities
created primarily for tax evasion purposes should be lower than the treatment group.
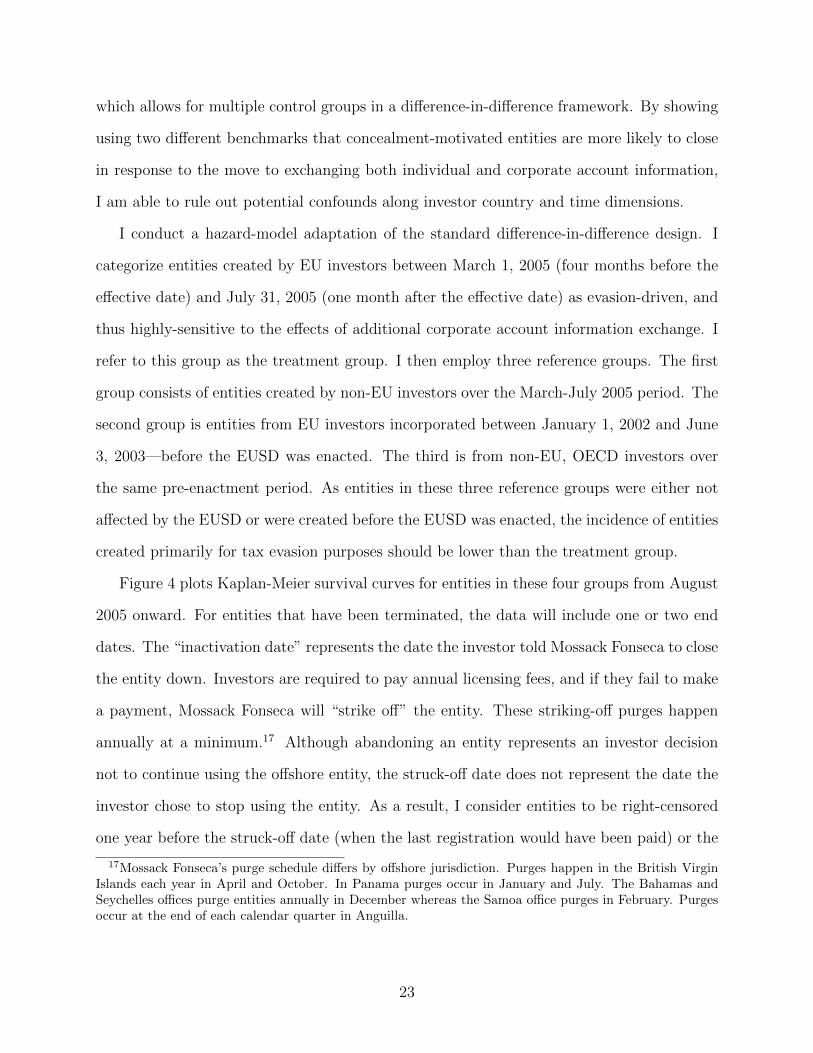
Figure 4 plots Kaplan-Meier survival curves for entities in these four groups from August
2005 onward. For entities that have been terminated, the data will include one or two end
dates. The “inactivation date” represents the date the investor told Mossack Fonseca to close
the entity down. Investors are required to pay annual licensing fees, and if they fail to make
a payment, Mossack Fonseca will “strike off” the entity. These striking-off purges happen
annually at a minimum.17 Although abandoning an entity represents an investor decision
not to continue using the offshore entity, the struck-off date does not represent the date the
investor chose to stop using the entity. As a result, I consider entities to be right-censored
one year before the struck-off date (when the last registration would have been paid) or the
17Mossack Fonseca’s purge schedule differs by offshore jurisdiction. Purges happen in the British VirginIslands each year in April and October. In Panama purges occur in January and July. The Bahamas andSeychelles offices purge entities annually in December whereas the Samoa office purges in February. Purgesoccur at the end of each calendar quarter in Anguilla.
23
end of the sample (December 31, 2015) if there is no inactivation date.18
[Place Figure 4 about here]
The dashed blue line indicates when the EU issued the draft amendment closing the
EUSD loophole. Panel A overlays survival curves from the treatment group and the three
control groups. Panels B through D present comparisons between curve pairs for clarity. I
first look to see if the closure rate of entities in the treatment group responds to the issuance
of the draft amendment. Prior to the draft amendment, entities in the treatment group
exhibit a low closure rate, depicted by a shallow curve. This pattern is consistent with the
idea that these entities serve a tax evasion purpose—investors would need to maintain these
entities so long as they were concealing assets. After the draft amendment the curve becomes
substantially steeper, reflecting a much faster closure rate.
Panel B compares the behavior of the treatment group to control group 1: entities con-
temporaneously incorporated by non-EU OECD investors. This comparison suggests that
the increase in closure rate is in response to enhanced information exchange eroding the con-
cealment benefits of entities. Control group 1’s curve is initially steeper, possibly reflective of
a greater proportion of the entities being used for more “transactional” purposes. Unlike the
treatment group curve, there is no discernible change in slope around the draft amendment,
and by March 2014 the two curves cross, indicating that on a proportional basis, at this
point more treatment group entities have been closed than those in control group 1. Thus,
the increase in the closure rate around May 2013 for the treatment group seems to be unique
to entities incorporated by EU investors.
It is possible that non-EU OECD investors are different from EU investors, and the
entities created by them are different along dimensions unrelated to their use as a tax evasion
tool. If that were the case, control group 1 would be an unsuitable benchmark. To rule out
this possibility, I take advantage of intertemporal differences within the investor country
18If I consider struck-off dates to be valid closure dates along with inactivation dates, the curves lookvirtually identical (figure not included for brevity).
24
and use control group 2—entities created by EU investors in 2002 and early 2003 (prior
to the enactment of the EUSD)—as an alternate benchmark. Comparing control group 2’s
curve to the treatment group’s in Panel C, the story is the same as in Panel B. Thus, it
appears that the change in closure rate for the treatment group in 2013 is not a result of
differences between EU and non-EU OECD countries unrelated to the tax evasion difference.
For added comfort, in Panel D I compare control group 2 and control group 3 (entities from
non-EU OECD investors incorporated in the pre-enactment period). These two curves move
in lockstep, suggesting that in the absence of the EUSD, EU and non-EU OECD investors
use offshore entities for similar reasons.
I more formally evaluate these comparisons using a Cox proportional hazard model:
where i subscripts entity-investor pairs and t subscripts time (year and month). TreatmentGroupi
is an indicator if the entity-investor pair is from the treatment group, and PostAmendment t
is an indicator if t is after May 2013. h0(t) is an unspecified, time-dependent baseline hazard
function representing closures in the control group. Intuitively, the baseline hazard function
can have an arbitrary shape, allowing for time-varying differences in the closure rate; the
treatment curve has the same overall “shape,” but has the freedom to pivot at the origin
and again at the May 2013 date. I cluster standard errors at the investor country level.
Table 5 presents the results. Columns (1) and (2) compare the treatment group to
control group 1 (contemporaneous incorporations from non-EU OECD country investors)
and control group 2 (2002 and early 2003 incorporations from EU investors), respectively.
Both columns show that initially the likelihood of closure is lower for treatment observations
by about 54%, consistent with these entities needing to be maintained so long as the assets
were being concealed from the investor’s home country tax authority. After the May 2013
date, the hazard rate increases precipitously for treatment group entities relative to both
25
control groups. Compared to control group 1, the hazard rate increases by 411% after the
May 2013 date to a rate 2.26 times that of the control group (0.548 × 4.115). Relative to
control group 2, the change is even more dramatic—increasing by 9.21 times after May 2013
to be 5 times that of the control group (0.544× 9.210)
[Place Table 5 about here]
Column (3) compares control groups 2 and 3 as a placebo test. If EU and non-EU
investors use offshore entities for similar reasons, I should observe no differences. Similar to
Panel D of Figure 4, I detect no statistically significant differences when employing the same
style Cox model as in columns (1) and (2).
The sharpness of the inflection point and its precise alignment with the issuance of the
EUSD draft amendment make a strong case that the effect is a result of the regulatory
change. However regulatory changes do not occur in isolation, and contaminating forces
are potentially at play. One such force is the Common Reporting Standard (CRS), which
institutes mandates information sharing like the strengthened EUSD but on a worldwide
basis (it was modeled on the US’s FATCA program and operates similarly). Countries,
however, did not begin committing to CRS implementation until 2014, so while CRS may
have contributed to the continued high closure rate late in the analysis period, it cannot
explain the inflection point in 2013.
Similarly, over this time period, many of the EU countries had in place voluntary disclo-
sure/tax amnesty programs. Langenmayr (2015) shows that ceteris paribus, the existence
of such programs increases the incidence of evasion because they provide evaders with the
option to come clean if the perceived probability of detection increases. Hence, at the sunset
of such a program, investors may be more apt to close their entities while they still can
obtain amnesty. If an amnesty program was drawing to a close when the EU issued the draft
amendment, the observed increase in entity closures may be a result of the end of amnesty
rather than the strengthened EUSD. To rule out this possibility, I identify the EUSD-area
26
countries that became less forgiving in their voluntary disclosure/amnesty programs during
2013 or 2014, exclude those countries and estimate the model comparing this subsample to
control group 1.19 Column (4) presents the results; the estimates are virtually identical,
ruling out terminations of voluntary disclosure programs driving my results.
3.2.2 FATCA. One of the major limitations of the EUSD is its scope: while the EU
can compel banks in EU countries and their overseas territories to comply, it has no legal
authority to force financial institutions in other areas to take part in the scheme. In enacting
the Foreign Account Tax Compliance Act (FATCA), the United States took a different
approach to pressure offshore banking institutions. Targeting the estimated $1 trillion in
US offshore wealth (Alstadsæter et al., 2017), FATCA requires registered Foreign Financial
Institutions (FFIs) to identify US account holders and provide identity (e.g. name and
taxpayer ID number) and asset information to the IRS on an annual basis. FATCA’s bite
comes from how it leverages the size and scale of the US financial sector to compel foreign
financial institutions to comply. FATCA mandates that US institutions and other compliant
FFIs withhold a 30% tax on US-sourced payments to non-compliant FFIs. This tax virtually
locks non-compliant FFIs out of the US financial system, and because the US financial system
is so integral to the worldwide financial system, remaining non-compliant is not a feasible
option. The incentive to comply only grows stronger as more foreign institutions register.
Like the amended EUSD, information exchange under FATCA is not limited to individual
accounts. FFIs must identify US-owned foreign corporations, defined as entities with over
10% indirect or direct US ownership. As a result, for an account held in the name of
an offshore entity, the bank must trace back ownership to test against the 10% threshold.
FATCA explicitly states what criteria should flag an account as potentially US-investor
19I obtain the EUSD-area countries that ended voluntary disclosure programs from a survey by the Organi-sation for Economic Cooperation and Development (2015). Austria, Belgium, Denmark, and the Netherlandshad voluntary disclosure programs that ended or became less forgiving in 2013 or 2014. Throughout theEUSD-area, the United Kingdom was the only country to expand a voluntary disclosure program during2013 or 2014. I also estimate the model excluding UK investors (untabulated) and find no change in myresults, suggesting that my results are not driven by the launch of a voluntary disclosure/amnesty program.
27
owned. If there are any “indicia” of US ownership, such as a US phone number, a US
address, or a standing order to transfer funds to a US bank, the FFI must suspect US
ownership.
A necessary condition for the FFI to be able to report accounts owned by US investors
is that the bank has knowledge of the beneficial owners. If the bank has no knowledge of an
entity’s shareholders, it cannot report this information to the IRS. While banks historically
have been willing and able to open accounts without knowing the ultimate customer, the
introduction of “know your customer” (KYC) and “anti-money laundering” (AML) laws
in virtually every country restricted their ability to do so. Enacted and/or strengthened
throughout the 2000s primarily to fight terrorist funding and other illegal activity, KYC
and AML laws compel financial institutions to conduct due diligence on who is opening
the account. This diligence typically includes obtaining passports of the beneficial owners
and learning the source of funds. As a result, provided they conduct the requisite due
diligence, financial institutions cannot claim ignorance when performing FATCA searches
for US beneficial owners.
To test for an effect of FATCA on offshore entity usage, I conduct a difference-in-difference
analysis of incorporations with US investors as the treatment group and non-US investors as
the control group. One of the main challenges in such an approach is determining an appro-
priate treatment date. While FATCA was enacted in 2010, at first it was highly uncertain
if the US government would be able to actually implement it. Financial institutions—both
in the US and abroad—objected to becoming de facto IRS agents, and foreign countries—
particularly in the EU—voiced concerns about privacy. In many jurisdictions, complying
with FATCA and exchanging information with the IRS would cause foreign financial institu-
tions to violate local law. As a result, in the second half of 2012, the US government began to
develop intergovernmental agreements (IGAs) with foreign governments to iron out some of
the implementation details. While these agreements brought FATCA implementation closer
to reality, the countries signing IGAs early on did not have a reputation for facilitating off-
28
shore tax evasion.20 As a result, investor expectations likely did not shift substantially in
response to these agreements.
While anticipation of FATCA may have increased somewhat prior to 2013, two events
at the beginning of 2013 likely shifted investor expectations considerably. On January 17,
2013 the IRS developed implementation rules and released final regulations. In February 14,
2013 Switzerland signed an IGA with the US government, effectively ending Swiss banking
secrecy for US clients and allowing for FATCA exchanges. Given Swiss banks’ prominence
in the offshore financial industry, that Switzerland was forced to comply likely sent a strong
signal to investors that other bank secrecy jurisdictions would not be able to withstand
pressure. Since then, the total number of countries having signed IGAs has exceeded 80
with an additional 30 countries reaching “agreements in substance,” covering virtually all of
the developed world.
I use January 17, 2013—the date the IRS published the final regulations—as the date
when investor expectations changed. Both the finality of the regulations and announce-
ments of key signed (and pending) IGAs around this period eliminated any remaining doubt
that the regulation would actually be carried out. Conversations with a practitioner spe-
cializing in FATCA compliance confirm that prior to January 2013, clients were typically
either unaware of the pending roll-out or hoped the complexities of international relations
would undermine the US’s ability to execute FATCA. Partial anticipation before this date
or investors remaining uncertain of FATCA’s inevitability after this date will dampen the
treatment effect in my difference-in-difference tests.
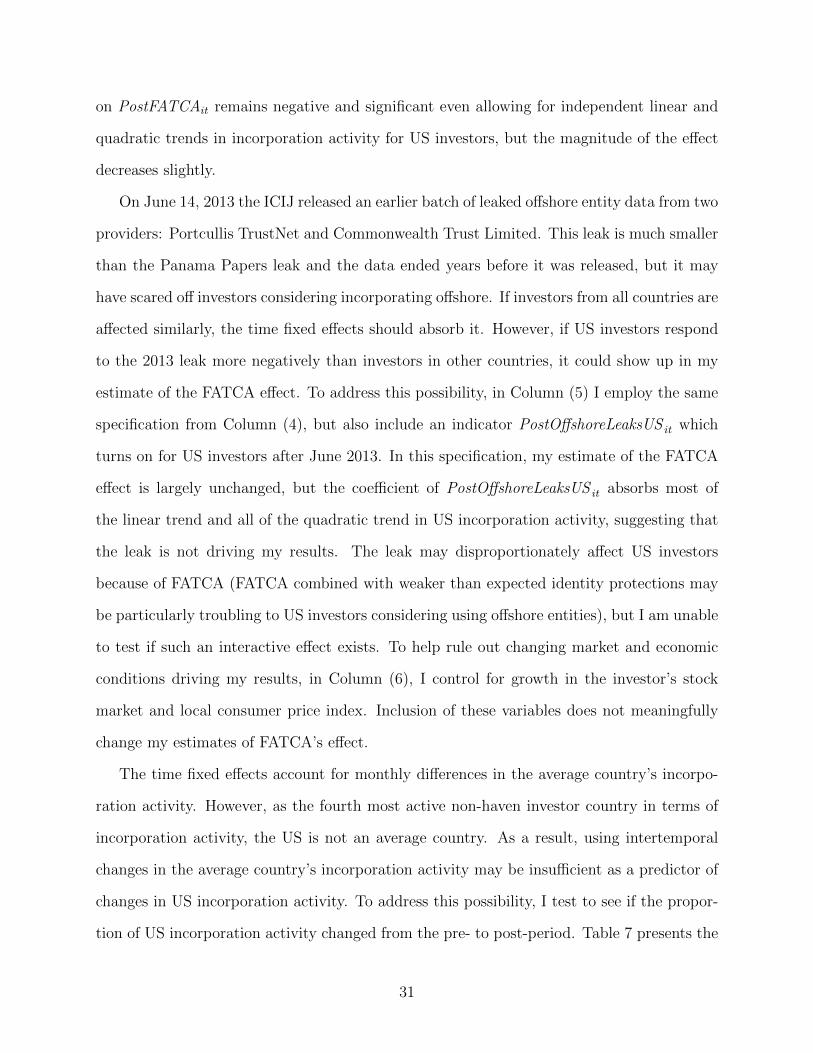
In figure 5 I plot monthly incorporation activity from US investors. The dashed blue
line represents January 17, 2013; after this date, US investors’ incorporation activity falls
20France, Germany, Italy, Spain, the UK and the US developed a model intergovernmental agreement(IGA) that cleared the way for FATCA exchanges from those countries. Released July 2012, this “Model1” IGA stipulated that FFIs would collect the required information on US taxpayers and submit it to theirlocal government. In turn, the foreign government would then forward on the information to the IRS. Afterthe release of the Model 1 IGA, the UK signed in September, Denmark and Mexico signed in November, andIreland signed in December. While Ireland is included in a number of tax haven lists (e.g. Gravelle (2009)),it primarily serves as a corporate tax haven and is not a major locale for individual offshore evasion.
29
substantially, consistent with offshore entities losing value as a tax evasion tool for US
investors.21
To test for an effect more formally, I employ the following model:
where PostFATCAit takes a value of 1 if country i is the United states and t is after January
2013. βi and γt are investor country and time (month and year) fixed effects, leaving α as the
estimate of the change in incorporation activity for US investors around the January 2013
date. I estimate the regression using observations from January 2010 (just before FATCA’s
March 2010 enactment date) through December 2014. Table 6 presents the results.
[Place Table 6 about here]
Column (1) shows that after January 2013, Offshore incorporation activity from US
investors declined by roughly one-third (e−0.390 = 0.68). On April 9, 2013, France, Germany,
Italy, Spain, and the UK announced they would conduct FATCA-style exchanges among
themselves and the US, likely signaling to investors in these countries that their offshore
entities are no longer safe. Thus, in Column (2) I include an indicator PostEU5Announce it
that turns on if i is one of these 5 countries and t ≥ April 2013. Similar to FATCA, I find
a roughly 16% reduction in the number of incorporations per month from these countries
(e−0.169 = 0.84).
To verify that intertemporal differences between developed and emerging economies are
not driving the result, in Column (3) I re-estimate the model using observations from OECD
countries only. The result is robust to this alternate specification. In Column (4) I relax
the parallel trend assumption by allowing incorporation activity from US investors to have a
different linear and quadratic trend from other countries’ investors over time. The coefficient
21The outlier point in February 2012 is driven by one entity with nearly 1000 investor links. To guardagainst overestimation of the effect size because of this one outlier, I exclude February 2012 from all of myFATCA regressions.
30
on PostFATCAit remains negative and significant even allowing for independent linear and
quadratic trends in incorporation activity for US investors, but the magnitude of the effect
decreases slightly.
On June 14, 2013 the ICIJ released an earlier batch of leaked offshore entity data from two
providers: Portcullis TrustNet and Commonwealth Trust Limited. This leak is much smaller
than the Panama Papers leak and the data ended years before it was released, but it may
have scared off investors considering incorporating offshore. If investors from all countries are
affected similarly, the time fixed effects should absorb it. However, if US investors respond
to the 2013 leak more negatively than investors in other countries, it could show up in my
estimate of the FATCA effect. To address this possibility, in Column (5) I employ the same
specification from Column (4), but also include an indicator PostOffshoreLeaksUS it which
turns on for US investors after June 2013. In this specification, my estimate of the FATCA
effect is largely unchanged, but the coefficient of PostOffshoreLeaksUS it absorbs most of
the linear trend and all of the quadratic trend in US incorporation activity, suggesting that
the leak is not driving my results. The leak may disproportionately affect US investors
because of FATCA (FATCA combined with weaker than expected identity protections may
be particularly troubling to US investors considering using offshore entities), but I am unable
to test if such an interactive effect exists. To help rule out changing market and economic
conditions driving my results, in Column (6), I control for growth in the investor’s stock
market and local consumer price index. Inclusion of these variables does not meaningfully
change my estimates of FATCA’s effect.
The time fixed effects account for monthly differences in the average country’s incorpo-
ration activity. However, as the fourth most active non-haven investor country in terms of
incorporation activity, the US is not an average country. As a result, using intertemporal
changes in the average country’s incorporation activity may be insufficient as a predictor of
changes in US incorporation activity. To address this possibility, I test to see if the propor-
tion of US incorporation activity changed from the pre- to post-period. Table 7 presents the
31
results of a χ2 test of equal proportions. In the year prior to the January 17, 2013 date when
the IRS released the final FATCA rules, US investors represented 4.7% of incorporation ac-
tivity worldwide, excluding haven country investors and instances where the investor country
is unknown (i.e. bearer share entities). In the subsequent year, US activity falls to 2.8%,
and this difference in proportions is significant with a P-value of better than 0.001. When
I further constrain the comparison group to OECD investors only over the same periods, I
observe a decline from 23.4% to 16.8%, which is again significant with a P-value of better
than 0.001.22
[Place Table 7 about here]
Across these specifications, my estimates of the effect size are large. In a concurrent
working paper, De Simone et al. (2017) use changes in Foreign Direct Investment from IGA-
signing tax havens to infer a similarly sized effect (22-31% decline in aggregate outbound FPI
depending on the specification). These large magnitudes raise the possibility that investors
continue to evade but simply change their concealment tactics.23 Without tax receipts
I cannot definitively rule out such a substitution effect, however, presumably any second
choice concealment strategy entails greater risk or higher costs.
3.3 Ending bank secrecy
Critical to the amended EUSD and FATCA having bite in curbing the use of offshore entities
for evasion purposes, financial institutions must actually comply with the regulations. How-
22I also compare the year prior to the period between January 18, 2013 through June 14, 2013 (when theICIJ released the earlier leak). When I compare changes in the proportion of US-investor activity relative toworldwide activity, I observe a highly significant decline. However, I do not detect a statistically significantchange relative to the OECD countries over this short window.
23Some recent tax evasion studies find a substitution effect when one method of evasion becomes difficult.For example, Slemrod, Collins, Hoopes, Reck, and Sebastiani (2017) find that after an enforcement change,small businesses report an increase in their taxable receipts by 24%, but they also increase their reportedexpenses by a similar amount, suggesting the evaders changed tactics and tax revenue changed little. Car-rillo, Pomeranz, and Singha (2017) find a similar response in an Ecuadorian setting. On the other hand,using IRS data Johannesen, Langetieg, Reck, Risch, and Slemrod (2017) find that first time Foreign BankAccount Report (FBAR) filers responding to stepped-up enforcement increase their reported taxable incomesubstantially (64% more interest income, 24% more dividends, and 13% more capital gains).
32
ever, financial institutions that benefit from the offshore tax evasion business have a strong
business incentive not to comply with information exchange programs, and the evidence in
Section 3.1.2 shows that banks actively help clients to circumvent reporting. Thus, to confirm
that the observed effects are indeed a result of financial institutions’ exchange of corporate
account information, I test for an investor response to increases in bank cooperation with
foreign tax authorities. To do so, I exploit two shocks to the Swiss banking sector: UBS’s
deferred prosecution with the US Department of Justice and the launch of the Department
of Justice’s Swiss bank program.
As the historic leading location for locating offshore wealth with over $5 trillion in 2007
(Alstadsæter et al., 2017), Switzerland is an ideal testbed. In February 2009, the US De-
partment of Justice announced that it had struck a deferred prosecution agreement with the
Swiss bank UBS for UBS’s role in facilitating US tax evasion. Under the terms of the agree-
ment, UBS would turn over its records of accounts held by US investors (including those
employing offshore entities) and cooperate with any criminal investigations and prosecutions.
On the heels of a June 2008 guilty plea from former UBS banker Bradley Birkenfeld and
the November 2008 indictment of UBS executive Raoul Weil for their roles in facilitating
evasion, this deferred prosecution agreement credibly communicated that UBS would not
stonewall.
I predict that this agreement undermined investor credibility in the anonymity of Swiss
bank accounts held by offshore entities. While the UBS deferred prosecution agreement
only established the release of account information from one bank, UBS, to one country, the
United States, the event likely undermined worldwide faith in the secrecy of the entire Swiss
banking system. As a result, I hypothesize that investors whose entities used Swiss banks
expected an increase in the probability of detection. The continued use of these entities
may also increase the penalty upon getting caught if governments interpret the entities as
evidence of intent to defraud the tax authority. Thus the expected cost of evasion increases,
potentially from both the increase in probability of detection and the increase in penalty
33
upon detection.
Similar in effect to the 2009 shock, in August 2013 the Swiss and US governments es-
tablished a program where Swiss banks could cooperate with US government investigations
into tax evasion in exchange for non-prosecution agreements. The Swiss Federal Depart-
ment of Finance encouraged banks to take part in the program and 78 banks participated,
representing a sizable portion of the Swiss banking sector. I hypothesize that this program
further increased investor expectations of Swiss banks’ willingness to cooperate with foreign
governments.
I test if investors respond to increases in the likelihood of bank cooperation by conduct-
ing a difference-in-difference analysis on closure rates of corporate entities with Swiss bank
exposure around the two shocks. However, the released Panama Papers data do not specify
the financial institution used by the entities. Thus, as a proxy for having a Swiss bank
account, I assume that entities set up with a Swiss intermediary likely use a Swiss bank. It
seems unlikely that a non-Swiss investor would seek assistance from a Swiss law, accounting,
or wealth management firm but not use a Swiss financial institution.
Figure 6 presents Kaplan-Meier survival curves based on the entities being set up with
a Swiss intermediary. The sample consists of entities incorporated over a five year window,
2001-2006, that were still active as of January 1, 2007. Like the prior survival analyses, I
define the close date as the inactivation date in the data, and right censor observations at the
earlier of one year before the struck-off date or December 31, 2015. Because of the potential
confounds of the amended EUSD with the 2013 shock, I exclude incorporations with EU
investors.24 Since Section 3.1.2 shows that many bearer share entities were created with
direct involvement from banks, I exclude them as well. I also exclude instances where the
investor is listed as in a tax haven country, to make sure I capture entities held directly by
investors. The dashed blue line depicts the UBS shock whereas the dotted blue line portrays
24The coincidental timing brings up the possibility that the results in Section 3.2.1 are driven by devel-opments in the Swiss banking industry and not the amended EUSD. To rule out this possibility I re-runthe results from Section 3.2.1, excluding entities where the intermediary is Swiss, and the results remain thesame.
34
the announcement of the Department of Justice’s Swiss bank program.
The curves show that prior to the first shock, the decay rate of entities is the same
regardless of whether or not the entity has a Swiss intermediary. However, around the UBS
shock roughly 4-5% of entities with Swiss intermediaries are abruptly closed and the closure
rate is higher (steeper downward curve) for the subsequent year. From early 2011 onward,
the curves again move in parallel until the August 2013 shock where again the closure rate
for entities with Swiss intermediaries increases relative to other entities.
To evaluate the effect formally, I estimate a Cox proportional hazard model in a difference-
in-difference style analysis:
hi(t) = h0(t) exp(α1SwissIntermediary i + α2(SwissIntermediary i × PostEvent t)) (5)
where i subscripts entity-investor pairs and t subscripts time (year and month). SwissIntermediary i
is an indicator if the entity-investor pair has a Swiss intermediary, and PostEvent t is an in-
dicator if t is after the event date. I employ two event dates: February 2009 for the UBS
agreement and August 2013 for the launch of the Department of Justice’s Swiss bank pro-
gram. Columns (1) and (2) test the first event, whereas (3) and (4) test the second.
In column (1), I use entities that were incorporated between January 1, 2001 and De-
cember 31, 2006 where the investor country is not a haven country and the entity is not set
up with bearer shares. I find no difference between entities likely using Swiss bank accounts
and the control group prior to the UBS agreement. After the agreement, the closure rate
for entities with likely Swiss bank accounts increases by 33.8%. Despite the UBS agreement
only explicitly affecting US investors, it shook faith in the continued secrecy of the Swiss
banking sector for investors worldwide. In column (2), I repeat the estimation but exclude
US investors, and find nearly identical results to column (1). In column (3) I use a broader
incorporation window, 2001 through 2010, but I exclude EU investors to make sure I am not
picking up an effect from the Amended EUSD. I find a 48.5% increase in the closure rate for
35
entities likely using Swiss banks after the Swiss bank program launch. This result is virtually
identical when I exclude US investors in column (4), ruling out the potentially confound-
ing influence of FATCA and reinforcing that investor beliefs about Swiss banks’ willingness
to cooperate changed worldwide. Together these results suggest that investors use offshore
entities less when their confidence in banks’ maintaining secrecy is shaken. This finding is
consistent with bank cooperation increasing the probability of detection and reducing the
benefits of offshore entities as a concealment technology.25
3.4 Additional Analyses
3.4.1 Tests of Sample Representativeness. One potential threat to the validity of
my inferences is the representativeness of Mossack Fonseca’s activity compared with other
incorporation service providers. To help rule out this possibility, I exploit a new leak from
the International Consortium of Investigative Journalists: the Bahamas Leaks. On Septem-
ber 21, 2016, the ICIJ appended the Panama Papers database with a leaked copy of the
Bahamian government’s corporate registry. The leak includes all of the offshore entities cre-
ated in the Bahamas from 1990 to the beginning of 2016, resulting in approximately 175,000
entities. In contrast to the Panama Papers which has entities created by one law firm in
many jurisdictions, the Bahamas Leaks have entities created by all service providers, but
only the entities incorporated in the Bahamas. If my results hold in the Bahamas Leaks
sample, I can rule out that Mossack Fonseca’s activity is not representative of the industry
as a whole.
The basic structure of the Bahamas Leaks data is quite similar to the Panama Papers,
25It is possible that the distribution of incorporation dates across the Swiss intermediary and non-Swissintermediary subsamples is different. For instance if entities have a consistent half life regardless of theintermediary, but the incorporation dates of the Swiss-intermediary entities are clustered to the start of thesample, I could observe a spurious result. To rule out the possibility, I re-estimate the four specificationsbut use separate strata for each year of incorporation. This approach allows each year of incorporation tohave a unique unspecified baseline hazard function. The estimated coefficients and statistical significance arevirtually identical (untabulated for brevity), eliminating the possibility of heterogeneity in the incorporationdate driving the results.
36
but there are a few key differences. Because the data source is the Bahamian government’s
corporate registry, the data contain only the information that was reported to the government
by the service provider. As a result, some of the elements in the Panama Papers are missing
in the Bahamas Leaks. Most importantly, because the Bahamian corporate registry does not
maintain shareholder lists, the Bahamas Leaks do not contain the investor identities. There
is sometimes a named officer in the data, but it is unclear if this officer is an actual investor
or a nominee director, and the officer does not have address or country information. Hence,
I am unable to determine the investor’s home country. Additionally, the “intermediaries”
captured in the data are different than those in the Panama Papers; while in the Panama
Papers the intermediary is the party that interfaces with the actual investor, an intermediary
in the Bahamas Leak is the service provider that actually executed the incorporation (e.g.
Mossack Fonseca is an intermediary in the Bahamas Leaks). The Bahamas Leaks data also
do not have inactivation dates reflecting when the investor decided to dissolve the entity.
Rather, the only indication of a dissolved entity is a populated struck-off date: the date where
the government struck the entity off the corporate registry because the recurring service fees
were not paid. All of the struck off dates in the Bahamas Leaks happen in the last few
days of January or the first few days of February, suggesting that the Bahamian government
conducts annual purges at this time of the year.
Because of these data differences, I cannot replicate my tests from the Panama Papers
directly using the Bahamas Leaks data. However, I am able to conduct less powerful variants
of two of them: the increase in activity around the EUSD roll-out, and the differential closure
rate when the EU adds corporate accounts to th EUSD’s information exchange. Rather than
conduct a difference-in-difference test comparing EU investor activity to non-EU investor
activity, I determine if the overall number of new entities incorporated in the Bahamas
spikes around the EUSD. Because I am unable to pull out the non-EU investor entities,
this analysis is necessarily noisier than my tests using the Panama Papers data. I adopt a
similar modification for evaluating the closure rates: I look to see if entities created around
37
the EUSD roll-out are more likely to close after the move to complete information exchange
than entities created before the EUSD was enacted. Again, this test is noisy because I cannot
exclude non-EU investor entities from the sample.
Nevertheless, Figure 7 presents the results. Panel A plots the number of new entities
in the Bahamas Leaks by incorporation month. Unlike Figure 2, this plot counts entities,
not entity-investor pairs. I detect the same spike around the July 1, 2005 roll-out date,
suggesting that the observed investor behavior is not specific to Mossack Fonseca.
Panel B presents survival curves analogous to Panel C of Figure 4. Here, the treatment
group are Bahamas Leaks entities created between March 1, 2005 and July 31, 2005. The
control group are entities created between January 1, 2001 and June 3, 2003.26 Because I
only observe the annual purges, my estimate of when the investor chooses to abandon the
entity is necessarily noisy. For instance, an entity struck off in the January/February 2015
purge was presumably struck off because the investors did not pay the 2014 registration
fees to the Bahamian government. As a result, the last fee was likely paid at some point
in 2013, meaning that the investor abandoned the entity either in 2013 after paying the
fee or in 2014. Thus, the sharp drop from the treatment group after May 2013 in Panel C
of Figure 4, would show up in Panel B of Figure 7 as starting in 2014 and accelerating in
2015. Indeed, I observe this pattern. The curves depict the survival rates for entities in
each group that have not been struck-off before January 1, 2010. I start the at-risk period
later for this analysis to allow purges to begin in the treatment group, given the lag between
investor abandonment and the struck off date. The 95% confidence intervals overlap up
to 2014, where the treatment group begins to exhibit a higher closure rate. By 2015 the
confidence intervals of the survival rates no longer overlap; the treatment group exhibits
higher attrition. This result is consistent with the pattern in Figure 4, suggesting that the
Panama Papers data is indeed a representative sample of investors.
26For this Bahamas Leaks analysis I extend this control group window a year earlier than the PanamaPapers analysis to boost power, counteracting the noisiness resulting from the inclusion of non-EU investorsand the imprecision of the closure dates.
38
3.4.2 Additional Potential Contaminating Forces. With any difference in difference
analysis, contamination from concurrent events may result in spurious inferences. In my
analyses I explicitly address a number of potential threats (e.g. Offshore Leaks disclosure,
changes in amnesty programs, and the introduction of the Common Reporting Standard).
While it is impossible to completely rule out all other possibilities, I consider two of the most
probable ones here.
Tax Information Exchange Agreements (TIEAs) are bilateral agreements that allow tax
authorities to request information from tax haven governments about specific suspected
evaders. While these agreements are weak by design, other studies have detected effects.27
The bulk of these agreements were signed in late 2009 and 2010 just after the OECD threat-
ened sanctions on any haven that did not sign a minimum of 12 agreements. Thus, the timing
poses a potential problem primarily for my first Swiss bank shock. However, Switzerland
signed its first TIEA in 2013, and even then, the TIEAs were only with fellow tax havens,
making it unlikely that TIEAs could be driving my results.
The Multilateral Convention on Mutual Administrative Assistance in Tax Matters (MCAA)
builds on the TIEA concept. Championed by the OECD, this convention provides a similar
mechanism for information exchanges as TIEAs, but has the added benefit of pertaining to a
fully connected network of countries as opposed to country pairs. Out of Mossack Fonseca’s
major havens, Seychelles signed in 2015, Samoa and Panama signed in 2016, and Bahamas
has not signed as of 2017. Thus, the timing of these jurisdictions’ participation could not
have induced my results. In November 2013, the UK extended its ratification to cover its
protectorates (including the British Virgin Islands and Anguilla) effective March 2014. To
rule out this extension driving my strengthened EUSD or my FATCA results, I rerun these
analyses excluding entities created in either of these jurisdictions. My results are robust to
this sample change (not tabulated for brevity). Switzerland signed in October 2013, raising
27Johannesen and Zucman (2014), Hanlon et al. (2015) and Bennedsen and Zeume (2015) explore theeffect of these TIEAs and find results on bank deposit flows, foreign direct investment, and firm governancerespectively.
39
the possibility that the MCAA and not the US DoJ’s Swiss Bank Program induced the 2013
increase in closures of entities with Swiss bank accounts.28 While I cannot rule out this
possibility for my second shock to Swiss banking, the timing cannot explain the increased
closures around the 2009 deferred prosecution agreement.
4 Conclusion
The recent release of the Panama Papers brought the use of offshore entities to the forefront
of public attention. Policymakers are calling for additional tools to clamp down on tax
evasion. Thus, understanding how prior regulatory efforts affected this industry is key for
making informed policy decisions going forward. This paper provides a first-look at recently
released Panama Papers data on offshore entities and presents evidence about the effect of
a series of regulatory attempts designed to bring transparency to foreign asset ownership.
My results showcase investors attempting to hide their assets from their home govern-
ments. Perhaps more surprising than investors’ desire to conceal is the active role played by
financial institutions in these schemes. Bank secrecy is a key ingredient to the ability of an
offshore entity to provide meaningful concealment from the tax authorities. I find that when
investors lose confidence in their bank as a supportive partner in crime, they are less likely
to use offshore entities—as evidenced by fewer incorporations and increased closures.
However, reluctant to cede their role in the lucrative offshore asset business, banks take
an active role in thwarting government efforts to promote transparency. In the case of the
EUSD, I find banks taking the lead in setting up legal structures in tax havens to circumvent
disclosure of their clients’ assets to the government. While these high-net-worth investors
can hardly be considered unwitting victims of cunning banks that push them deeper into
illicit activity, my results do point to supply-side forces driving some of the use of tax haven
shell companies.
28Switzerland signed the agreement on October 15, 2013, but the Swiss Parliament did not ratify it untilDecember 2015.
40
My results have policy implications. First and foremost, it appears that applying pressure
to banks is a powerful way to shape investor behavior. The large elasticities across all of
the regulatory changes suggest that investors view the disclosure of their asset holdings to
the government as a real threat and shift their concealment behavior in response. Second,
it appears that competitive pressures among banks is an important force on offshore asset
concealment. Provided the pressure applied to banks is not uniform, pressured banks will
be concerned with losing market share and will seek out ways to skirt the spirit of the
regulations. These findings lend empirical support for the theory laid out in Elsayyad and
Konrad (2012), suggesting that a sequential approach to clamping down on tax havens
may be counterproductive. Third, governments with powerful financial systems can effect
change even if they do not have direct legal authority over offshore banks. While smaller
governments may not have the same leverage, the spillover effects I find suggest that bank
reputation matters, raising the possibility that small countries may benefit in reduced evasion
by piggybacking on the efforts of larger economies.
While I provide robust evidence that carefully crafted exchange programs and pressure
on financial institutions to comply can be an effective deterrent to the use of offshore entities
for concealment purposes, I am unable to determine conclusively if they reduce tax evasion.
Investors may turn to other concealment technologies that are either riskier or more expen-
sive. For instance, investors may move investments to anonymous currencies like Bitcoin or
enlist the help of even less scrupulous financial institutions that are more willing to commit
fraud on behalf of their clients. Unfortunately, given the scope of the Panama Papers data,
I am unable to test these possibilities. I leave these questions to future research.
References
Allingham, M. G., and A. Sandmo. 1972. Income Tax Evasion: A Theoretical Analysis.
Journal of Public Economics 1:323–338.
41
Alstadsæter, A., N. Johannesen, and G. Zucman. 2017. Who Owns the Wealth in Tax
Havens? Macro Evidence and Implications for Global Inequality. Working Paper.
Angrist, J. D., and J.-S. Pischke. 2014. Mastering ’metrics: The path from cause to effect.
Princeton University Press.
Becker, G. S. 1968. Crime and Punishment: An Economic Approach. Journal of Political
Economy 76:169–217.
Bennedsen, M., and S. Zeume. 2015. Corporate Tax Havens and Shareholder Value. Working
Paper.
Carrillo, P., D. Pomeranz, and M. Singha. 2017. Dodging the taxman: Firm misreporting and
limits to tax enforcement. American Economic Journal: Applied Economics 9:144–164.
Caruana-Galizia, P., and M. Caruana-Galizia. 2016. Offshore financial activity and tax
policy: Evidence from a leaked data set. Journal of Public Policy 36:457–488.
Chernykh, L. 2008. Ultimate ownership and control in Russia. Journal of Financial Eco-
nomics 88:169–192.
Chernykh, L., and S. Mityakov. 2017. Offshore Schemes and Tax Evasion: The Role of
Banks. Journal of Financial Economics .
Cohn, A., E. Fehr, and M. A. Marechal. 2014. Business culture and dishonesty in the banking
industry. Nature 516:86–89.
Commission of the European Communities. 2008. Report from the Commission to the Coun-
cil in Accordance with Artice 18 of Council Directive 2003/48/EC on Taxation of Savings
Income in the form of Interest Payments, COM(2008) 552 final.
Cremer, H., and F. Gahvari. 1994. Tax Evasion, Concealment and the Optimal Linear
Income Tax. The Scandinavian Journal of Economics 96:219–239.
42
De Simone, L., R. Lester, and K. Markle. 2017. Transparency and Tax Evasion: Evidence
from the Foreign Account Tax Compliance Act (FATCA). Working Paper.
Dharmapala, D., and J. R. Hines. 2009. Which countries become tax havens? Journal of
Public Economics 93:1058–1068.
Diamond, D. W., and P. H. Dybvig. 1983. Bank Runs, Deposit Insurance, and Liquidity.
Journal of Political Economy 91:401–419.
Elsayyad, M., and K. A. Konrad. 2012. Fighting multiple tax havens. Journal of Interna-
tional Economics 86:295–305.
Gallemore, J., B. Gipper, and E. Maydew. 2016. Banks as Tax Planning Intermediaries
Banks as Tax Planning Intermediaries. Working Paper.
Goldstein, I., and A. Pauzner. 2005. Demand-Deposit Contracts and the Probability of Bank
Runs. Journal of Finance LX:1293–1327.
Gravelle, J. G. 2009. Tax Havens: International Tax Avoidance and Evasion. National Tax
Journal 62:727–753.
Grieser, W., N. Kapadia, Q. Li, and A. Simonov. 2016. Fifty Shades of Corporate Culture.
Working Paper.
Griffin, J. M., S. A. Kruger, and G. Maturana. 2016. Do Personal Ethics Influence Corporate
Ethics? Working Paper.
Griffin, J. M., and G. Maturana. 2016. Who facilitated misreporting in securitized loans?
Review of Financial Studies 29:384–419.
Hanlon, M., and S. Heitzman. 2010. A review of tax research. Journal of Accounting and
Economics 50:127–178.
43
Hanlon, M., E. L. Maydew, and J. R. Thornock. 2015. Taking the long way home: U.S.
tax evasion and offshore investments in U.S. equity and debt markets. Journal of Finance
70:257–287.
Hemmelgarn, T., and G. Nicodeme. 2009. Tax Co-Ordination in Europe: Assessing the First
Years of the EU-Savings Taxation Directive. Working Paper.
Johannesen, N. 2014. Tax evasion and Swiss bank deposits. Journal of Public Economics
111:46–62.
Johannesen, N., P. Langetieg, D. Reck, M. Risch, and J. Slemrod. 2017. Taxing Hidden
Wealth: The Consequences of U.S. Enforcement Initiatives on Evasive Foreign Accounts.
Working Paper.
Johannesen, N., and G. Zucman. 2014. The end of bank secrecy? An evaluation of the G20
tax haven crackdown. American Economic Journal: Economic Policy 6:65–91.
Klautke, T., and A. J. Weichenrieder. 2010. Interest income tax evasion, the EU savings
directive and capital market effects. Fiscal Studies 31:151–170.
Kleven, H. J., M. B. Knudsen, C. T. Kreiner, S. S. Pedersen, and E. Saez. 2011. Unwilling
or Unable to Cheat? Evidence From a Tax Audit Experiment in Denmark. Econometrica
79:651–692.
Konrad, K. A., and T. B. M. Stolper. 2016. Coordination and the fight against tax havens.
Journal of International Economics 103:96–107.
Langenmayr, D. 2015. Voluntary disclosure of evaded taxes - Increasing revenue, or increasing
incentives to evade? Journal of Public Economics .
Leuz, C., and P. D. Wysocki. 2016. The Economics of Disclosure and Financial Report-
ing Regulation: Evidence and Suggestions for Future Research. Journal of Accounting
Research 54:525–622.
44
Mironov, M. 2013. Taxes, theft, and firm performance. Journal of Finance 68:1441–1472.
O’Donovan, J., H. Wagner, and S. Zeume. 2016. The Value of Offshore Secrets Evidence
from the Panama Papers. Working Paper.
Organisation for Economic Cooperation and Development. 2015. Update on
Voluntary Disclosure Programmes: A pathway to tax compliance. Tech.
Figure 1. Example of the Panama Papers data structure. This figure depicts twohypothetical investors and two hypothetical entities—one which is held by a single investor and one heldby both investors—along with the intermediary that worked with Mossack Fonseca to set up the entities.I consider the creation of the three “shareholder of” links as three “incorporations.” The data do notcapture the grayed out elements (financial institutions when the financial institution is distinct from theintermediary).
Joe BloggsUK
Jane DoeUS
Alpha EnterprisesBritish Virgin Islands
February 2005
Beta Inc.AnguillaApril 2006
Lambda BankLuxembourg
Mu BankLuxembourg
Omega Investment ServicesLuxembourg
Shareholder of
Shareholderof
Shareholder of
Intermediary
of
Inte
rmed
iary
of
46
Figure 2. Quarterly differences in incorporation activity. This graph depicts co-efficient estimates and associated 90% confidence intervals from estimating: ln(1 + Incorporationsit) =α1Q2 2002 Treatedit + α2Q3 2002 Treatedit + . . . + α19Q4 2006 Treatedit + βi + γt + εit where i denotesinvestor country and t denotes month and year. Q2 2002 Treatedit is an indicator if i is an EU treatedcountry and t is April, May, or June 2002. The other quarterly indicators are created similarly. The modelis estimated on monthly incorporation counts from January 2001 through December 2006. January 2001through March 2002 is the reference period. For the analysis, I exclude 2004 EU accession countries andthose on the Gravelle (2009) tax haven list from those implementing the EU Savings Directive (the finalEUSD country list is: Austria, Belgium, Denmark, Finland, France, Germany, Greece, Italy, the Nether-lands, Portugal, Spain, Sweden, and the United Kingdom). June 3, 2003 (depicted by the dotted blue line)is the EUSD enactment date and July 1, 2005 (depicted by the dashed blue line) is the effective date forinformation exchange or withholding tax for applicable account holders.
EUSD Enacted EUSD Effective
-0.5
0.0
0.5
1.0
2002 2003 2004 2005 2006
Incorporation Quarter
Qu
arte
rly
Diff
eren
cein
Diff
eren
ceE
stim
ator
47
Figure 3. Bank-orchestrated incorporation activity. Panel A depicts the monthly incorpo-ration counts where the linked intermediary has a bank term in its name (“BANK”, “BANC”, “BANQU”,“CREDIT”, or “CREDIT”). Panel B presents the counts from Panel A scaled by the overall monthly incor-poration counts, expressed as a percentage. June 3, 2003 (depicted by the dotted blue line) is the EUSDenactment date and July 1, 2005 (depicted by the dashed blue line) is the effective date for informationexchange or withholding tax for applicable account holders.
0
200
400
600
Jan 2002 Jan 2004 Jan 2006 Jan 2008
Cou
nts
Panel A: Bank-orchestrated incorporation counts by month
0
10
20
30
Jan 2002 Jan 2004 Jan 2006 Jan 2008
Incorporation Month and Year
Per
cent
Panel B: Percent of incorporations that are bank-orchestrated by month
48
Figure 4. Closure response to increased information exchange. This graph plotsKaplan-Meier survival curves based on the investor country and incorporation date. I consider entities tobe closed on the “inactivation date” in the data, or right-censored at the minimum of the “struck-off date”or December 31, 2015. The treatment group consists of entities incorporated by EU investors betweenMarch 1, 2005 and July 31, 2005. Control group 1 consists of entities incorporated by non-EU, OECDinvestors contemporaneous with the treatment group. Control group 2 represents entities incorporated byEU investors between January 1, 2002 and June 3, 2003. Control group 3 is entities incorporated by non-EU,OECD investors contemporaneous with control group 2. The error bars depict 95% confidence intervals.
Ctrl 1
Ctrl 2
Ctrl 3
Treat40
60
80
100
Jan06 Jan09 Jan12 Jan15
Su
rviv
alR
ate
Panel A
Ctrl 1
Treat
Jan06 Jan09 Jan12 Jan15
Panel B
Ctrl 2
Treat40
60
80
100
Jan06 Jan09 Jan12 Jan15
Su
rviv
alR
ate
Panel C
Ctrl 2
Ctrl 3
Jan06 Jan09 Jan12 Jan15
Panel D
49
Figure 5. Incorporations around FATCA. Points depict the average number of incorporationsper month from US investors. The dashed blue line indicates January 2013—the point in time I considerinvestor expectations of FATCA actually being implemented to have changed.
0
20
40
60
Jan 2010 Jan 2012 Jan 2014
Incorporation Month and Year
Ave
rage
Inco
rpor
atio
ns
per
Cou
ntr
y
50
Figure 6. Closures of entities likely using Swiss banks. This graph plots Kaplan-Meiersurvival curves based on the incorporation having a Swiss intermediary. The sample include all entity-officerpairs incorporated between January 1, 2001 and December 31, 2006, excluding instances where the investorcountry is in the EU or is Tax Haven Country per Gravelle (2009), and omitting Bearer Share incorporations.I consider entities to be closed on the “inactivation date” the data, or right-censored at the minimum of the“struck-off date” or December 31, 2015. I consider observations at risk from January 1, 2007 onward. Thedashed blue line indicates when UBS and the US government entered a deferred prosecution agreement. Thedotted blue line depicts the start of the US Department of Justice’s Swiss Bank Program. Error bars depict95% confidence intervals.
Other
Swiss
40
60
80
100
2007 2009 2011 2013 2015
Su
rviv
alP
erce
nta
ge
51
Figure 7. Panama Papers representativeness. This figure uses Bahamas Leaks data to assessthe representativeness of the Panama Papers data. Panel A presents the number of new entities created inthe Bahamas per month. Panel B presents Kaplan-Meier survival curves based on incorporation date. Thetreatment group consist of entities incorporated between March 1, 2005 and July 31, 2005, and the controlgroup consists of entities incorporated between January 1, 2001 and June 3, 2003. I use the struck-off dateas the termination date and right censor entities that are not struck off by December 31, 2015. I excludefrom both the treatment and control groups entities that were struck off prior to January 1, 2010. Errorbars depict 95% confidence intervals.
0
500
1000
Jan 2002 Jan 2004 Jan 2006 Jan 2008
Cou
nts
Panel A: Bahamas Entities Created by Incorporation Month
Control
Treatment
85
90
95
100
2010 2011 2012 2013 2014 2015
Su
rviv
alP
erce
nta
ge
Panel B: Survival of Bahamas Leaks Entities
52
Table 1. Multiple investor entities. This table lists the frequency of entitis with various numbersof shareholder investors. The “All Investors” columns consider all of the investor-entity links in the PanamaPapers Data. The “Non-Haven, Non-Missing Country Investors” columns consider investor links where theinvestor’s country is populated and not a tax haven country per Gravelle (2009). Missing investor countryinformation typically denotes an entity with bearer shares.
All Investors Non-Haven, Non-Missing Country InvestorsInvestors Entities Percent Cumulative Entities Percent Cumulative
Table 2. Country descriptive statistics. Panel A lists the most active investor countries(excluding investors located in haven countries per Gravelle (2009)) by incorporations since 2000. The“Percent Individual” columns denote the percentage of that country’s incorporations where the investorname does not have a company word in it using the name standardization process used in the NBER patentdata project. Panel B breaks down incorporation activity by offshore jurisdiction since 2000 for all investorsand non-haven, non-missing country investors.
Panel A: Incorporation activity by investor country
Table 3. EUSD and Incorporation Activity. This table regresses incorporation activity fora given investor country i and month t on an indicators if i is a EU country and t falls in a specifiedwindow. The time window for MarJul2005EU it is March, April, May, June, or July 2005, and the windowfor PostJul2005EU it is August 2005 and onward. In Column (1), the dependent variable is an indicatorvariable if investors in country i incorporated entities during month t; in Columns (2)-(6) the dependentvariable equals the natural log of 1+ the number of incorporations from country i in month t. Column (3)fully interacts the model from (2) with an indicator if the investor is a person (non-company), and column(4) is a within-country analysis of treated countries. Column (5) allows EU nations to have a different lineartime trend. Column (6) includes StockMarketGrowthit, the percentage growth in country i’s stock marketfrom the same month in the prior year, and CPIGrowthit which measures the year over year percentagegrowth in the seasonaly adjusted consumer price index for month t in investor country i. Each columnincludes observations of incorporations from 2002 through 2007 where the investor country is not a memberof the 2004 EU enlargement. The model is estimated using OLS with standard errors clustered by investorcountry. *, **, and *** denote two-sided statisitical significance at the 10%, 5%, and 1% levels respectively.
(0.046) (0.118) (0.037) (0.163) (0.174)MarJul2005EU × Person 0.565∗∗ 0.630∗
(0.245) (0.355)PostJul2005EU × Person 0.348∗∗∗ 0.443∗∗∗
(0.101) (0.143)EUTrend −0.028 −0.056∗
(0.029) (0.032)StockMarketGrowth 0.001∗
(0.0003)CPIGrowth −0.003
(0.003)Fixed EffectsInvestor Country: Yes Yes No No Yes YesMonth and Year: Yes Yes No No Yes YesInvestor Country × Person Indicator: No No Yes Yes No NoMonth and Year × Person Indicator: No No Yes No No NoInvestor Country × Month and Year: No No No Yes No No
N 12,288 12,288 24,576 2,160 12,288 3,502
55
Table 4. Bank orchestration of offshore entity creation. This table presents incorporationactivity when the name of the intermediary linked to the offshore entity contains a bank term (“BANK”,“BANC”, “BANQU”, “CREDIT”, or “CREDIT”). The sample is all Panama Papers Officer-Entity pairswith an incorporation date between January 1, 2002 and December 31, 2007.
Panel A: Bank involvement by time period
Period Dates Bank Non-bank ProportionPre-enactment Jan 2002 - May 2003 590 9,204 0.06Early Run-up Jun 2003 - Feb 2005 2,852 18,894 0.13Late Run-up Mar 2005 - Jul 2005 1,643 6,304 0.21Post-implementation Aug 2005 - Dec 2007 3,519 26,642 0.12
Panel B: Bank involvement by bank country
Country Counts PercentagesPre Early Late Post Pre Early Late Post
Comparison χ2 Test Statistic P-ValuePre-enactment to Early Run-up 348.5 0.000Pre-enactment to Late Run-up 854.5 0.000Pre-enactment to Post-implementation 254.6 0.000Early Run-up to Late Run-up 258.3 0.000Linear Trend during entire Run-up (Jun 2003-Jul 2005) 576.8 0.000
56
Table 5. Closures of evasion-motivated entities. Columns (1) and (2) estimate the model:hi(t) = h0(t) exp(α1TreatmentGroupi + α2(TreatmentGroupi × PostAmendment t)). i subscripts entity-investor pairs and t subscripts time (Month and Year). TreatmentGroupi is an indicator equaling 1 ifthe entity is a member of the treatment group, and PostAmendement t is an indicator equaling 1 if t >May 2013. Column (1) estimates the model for the treatment group (entities incorporated by EU investorsbetween March 1, 2005 and July 31, 2005) and control group 1 (entities incorporated by non-EU, OECDcountry investors between March 1, 2005 and July 31, 2005). Column (2) estimates the model for the treat-ment group and control group 2 (entities incorporated by EU investors between January 1, 2002 and June 3,2003). Column (3) is a placebo test comparing control group 2 with control group 3 (entities incorporatedby non-EU, OECD country investors between January 1, 2002 and June 3, 2003). Column (4) excludes fromthe sample EUSD-area countries that ended a voluntary disclosure/amnesty program during 2013 or 2014.Observations are at risk from August 1, 2005 onwards. I consider an entity to be closed on the “inactivationdate” or right-censored one year before the “struck-off date” or December 31, 2015, whichever is earlier.Reported coefficients are in unexponentiated form, with exponentiated hazard ratios at the bottom of thetable. Standard errors are clustered at the investor country level. *, **, and *** denote two-sided statisiticalsignificance at the 10%, 5%, and 1% levels respectively.
(1) (2) (3) (4)
TreatmentGroup −0.602∗∗ −0.608∗∗ −0.626∗∗
(0.275) (0.275) (0.281)
Treatment Group × PostAmendment 1.415∗∗∗ 2.220∗∗∗ 1.413∗∗∗
(0.398) (0.404) (0.420)
ControlGroup2 −0.234(0.156)
ControlGroup2 × PostAmendment 0.065(0.257)
Sample CompositionTreatment Group: Yes Yes No YesControl Group 1: Yes No No YesControl Group 2: No Yes Yes NoControl Group 3: No No Yes NoExclude EUSD Countries with Ending Amnesty: No No No Yes
Number of Entity-Investor Pairs 1134 1343 884 1097Number of Closure Events 554 581 282 529
Exponentiated Coefficients
TreatmentGroup 0.548 0.544 0.535
Treatment Group × PostAmendment 4.115 9.210 4.108
ControlGroup2 0.792
ControlGroup2 × PostAmendment 1.067
57
Table 6. Regression Evidence of FATCA and Incorporation Activity. Column (1)estimates the model: ln(1 + Incorporationsit) = αPostFATCAit + βi + γt + εit. i subscripts investor countryand t subscripts time (Month and Year). PostFATCAit is an indicator equaling 1 if t > January 2013 andi is the United States. Column (2) adds an indicator PostEU5Announceit which equals 1 if t ≥ April 2013and i is France, Germany, Italy, Spain, or the UK. Column (4) adds two additional variables to the modelfrom column (1). UStrend it is the number of months after December 2009 if i is the United States and 0otherwise. UStrend2 it is the square of UStrend it. Column (5) adds one variable to the model from column(1); PostOffshoreLeaksUS it is an indicator equaling 1 if t > June 2013 and i is the United States. Column(6) adds StockMarketGrowthit, the percentage growth in country i’s stock market from the same month inthe prior year, and CPIGrowthit, which measures the year over year percentage growth in the seasonallyadjusted consumer price index for month t in investor country i. Each column is estimated on incorporationactivity between January 2010 and December 2014 from non-haven investor countries. Column (3) furtherrestricts the sample to investors from OECD countries. The model is estimated using OLS with standarderrors clustered by investor country and time. *, **, and *** denote two-sided statistical significance at the10%, 5%, and 1% levels respectively.
Table 7. Proportionality of US incorporation activity around FATCA. This tablepresents comparisons of the Proportion of incorporation activity coming from US investors during variousperiods around FATCA. The non-haven comparison group represents incorporation activity from non-USinvestors known to be from a non-haven country per Gravelle (2009). The OECD comparison group addsthe further restriction that the investor must hail from an OECD country.
Comparison GroupsNon-Haven OECD
Period Dates US Count Count Proportion Count ProportionFull pre-period Jan 1, 2010 - Jan 17, 2013 664 16181 0.039 2717 0.1961-year Prior Jan 17, 2012 - Jan 17, 2013 262 5320 0.047 860 0.2341-year Post Jan 18, 2013 - Jan 17, 2014 137 4777 0.028 677 0.168Post, Pre-Leaks Jan 18, 2013 - Jun 14, 2013 71 2359 0.029 280 0.202
Non-Haven Countries Non-Haven OECD CountriesComparison χ2 Test Statistic P-Value χ2 Test Statistic P-ValueFull pre-period to 1-year Post 13.961 0.000 3.171 0.0751-year Prior to 1-year Post 25.435 0.000 11.864 0.0011-year Prior to Post, Pre-Offshore Leaks 12.902 0.000 1.317 0.251
59
Table 8. Closures of entities with probable Swiss bank accounts. Columns (1) and(2) estimate the model: hi(t) = h0(t) exp(α1SwissIntermediary i + α2(SwissIntermediary i × PostUBS t)). isubscripts entity-investor pairs and t subscripts time (Month and Year). SwissIntermediary i is an indicatorequaling 1 if the entity has a Swiss intermediary, and PostUBS t is an indicator equaling 1 if t > February2009. Columns (1) and (2) include entities with an incorporation date from January 1, 2001 throughDecember 31, 2006; columns (3) and (4) extend this window through December 31, 2010. Observations areat risk from January 2007 onwards for columns (1) and (2), and from August 2011 onward for columns (3)and (4). The sample excludes instances where the investor is from a Tax Haven Country per Gravelle (2009)and when the entity is set up with bearer shares. Columns (2) and (4) exclude US investors; Columns (3)and (4) exclude EU Investors. I consider an entity to be closed on the “inactivation date” or right-censoredone year before the “struck-off date” or December 31, 2015, whichever is earlier. Reported coefficients arein unexponentiated form, with exponentiated hazard ratios at the bottom of the table. Standard errors areclustered at the investor country level. *, **, and *** denote two-sided statisitical significance at the 10%,5%, and 1% levels respectively.