Do Changes in Customer Satisfaction Lead to Changes in Sales Performance in Food Retailing? Miguel I. Gómez Research Associate Food Industry Management Program Department of Applied Economics and Management Cornell University 149 Warren Hall Ithaca, NY 14850 Phone: (607) 255-8472 E-mail: [email protected]Edward W. McLaughlin Robert G. Tobin Professor of Marketing Department of Applied Economics and Management Cornell University 111 Warren Hall Ithaca, NY 14850 Phone: (607) 255-3169 E-mail: [email protected]Dick R. Wittink General George Rogers Clark Professor of Management and Marketing Yale School of Management Yale University 135 Prospect Street New Haven, CT 06520 Phone: (203) 432-5979 E-mail: [email protected]Paper prepared for presentation at the American Agricultural Economics Association Annual Meeting, Montreal, Canada, July 27-30, 2003 Copyright 2003 by Miguel I. Gómez, Edward W. McLaughlin and Dick R. Wittink. All rights reserved. Readers may make verbatim copies of this document for non-commercial purposes by any means, provided that this copyright notice appears on all such copies.
Transcript
Do Changes in Customer Satisfaction Lead to Changes in Sales Performance in Food Retailing?
Miguel I. Gómez Research Associate
Food Industry Management Program Department of Applied Economics and Management
Cornell University 149 Warren Hall Ithaca, NY 14850
Paper prepared for presentation at the American Agricultural Economics Association Annual Meeting, Montreal, Canada, July 27-30, 2003
Copyright 2003 by Miguel I. Gómez, Edward W. McLaughlin and Dick R. Wittink. All rights reserved. Readers may make verbatim copies of this document for non-commercial purposes by any means, provided that this copyright notice appears on all such copies.
1
Do Changes in Customer Satisfaction Lead to Changes in Sales Performance in Food Retailing?
ABSTRACT We measure the links between store attribute perceptions and customer satisfaction, and between
customer satisfaction and sales performance, in the food retail sector. Our data set consists of six
waves of customer satisfaction and sales information for about 250 stores over the period 1998-
2001 for a publicly held supermarket company. We construct a statistical model to address
nonlinearities and asymmetries in the satisfaction-sales performance links, and we illustrate how
food retailers can affect store revenues by managing customer satisfaction. Contributions of our
study include the analysis of behavioral consequences of customer satisfaction in the food retail
sector, the measurement of complexities of the satisfaction-sales performance links based on an
empirical model of first differences, and a discussion of how managers can use such results for
customer satisfaction policies.
2
INTRODUCTION
Food retailers recognize that customer satisfaction (CS) plays a key role in a successful
business strategy. What is unclear is the exact nature of that role, how precisely satisfaction
should be managed, and whether managerial efforts aimed at increasing satisfaction lead to
higher store sales. Today, managers in the food retail sector undertake substantial efforts to
conduct CS surveys. Yet it appears that in most cases the data are used to simply monitor
specific store attributes, and especially overall satisfaction, over time. Unless the impact of
customer satisfaction on store revenues is assessed, managers have little basis for allocation of
resources. In general, the linkages between drivers of customer satisfaction and sales
performance have not been firmly established in the food industry. For the estimation of these
linkages, recent research indicates that several issues must be addressed. These include possible
multicollinearity among attribute ratings, asymmetries and nonlinearities in the links, and time
lags. Models and managerial tools that ignore these issues might lead to inappropriate
managerial decisions.
We measure the links between attribute perceptions and customer satisfaction, and
between customer satisfaction and sales performance, in the food retail sector. The study relies
upon an extensive data set comprised of six waves of customer satisfaction and sales information
for approximately 250 stores over the period 1998-2001 for a publicly held supermarket
company operating in the Eastern US. We construct a statistical model in first differences that
addresses the inherent nonlinearities and asymmetries in these links. We also provide an example
of how firms can use the estimated linkages to develop satisfaction policies that are predicted to
increase store revenues.
3
Our study makes three contributions to the literature, one methodological and two
substantive. First, we examine nonlinearities and asymmetries in the satisfaction-sales
performance links based on an empirical model expressed in first differences. Second, the study
advances the measurement of behavioral links between customer satisfaction and performance in
the food retail sector with firm-specific data. Third, our study shows how firms can employ such
results to develop appropriate customer satisfaction policies. This paper is organized as follows:
in the next section, we discuss customer satisfaction in food retailing. We then provide a review
of the relevant literature, we describe the data, and we elaborate the statistical model. We
conclude with the presentation of results and a discussion of possible extensions for future
research.
IMPORTANCE OF CUSTOMER SATISFACTION TO FOOD RETAILERS
The food and beverage market is often the largest industrial sector in developed
economies. In the US, expenditures on food in both retail stores and food service establishments
account for nearly 30 percent of all retail spending (US Department of Commerce 2002). Food
retailing alone is among the largest of all retailing sectors in most countries. In 1997, the most
recent industrial census year in the US, grocery stores accounted for about seventeen percent of
total retail trade revenues, and the industry employed about eighteen percent of all workers in
retail establishments (US Department of Commerce 2002). This represents the second largest
share among all retail census categories in the US, surpassed only by automotive.
Current sector trends of increased competition, enhanced retailer ability to analyze
markets and greater shopper expectations make satisfying customers especially critical to food
retailers. Furthermore, food retailing has unique characteristics that make it different from other
4
retail sectors with regard to customer satisfaction. Food retailers offer a variety of goods and
services simultaneously, as opposed to other sectors that frequently specialize in offering either
goods or services. Indeed, for the customer there is more to visiting a supermarket than the mere
acquisition of consumption goods. Differences in the “shopping experience” between food retail
outlets (e.g. store ambience, disposition of associates, store services) are often as important to the
customer as differences in the physical characteristics of the goods they buy (price, quality, etc).
Another factor that differentiates the food retail sector from other retail industries is
high and frequent customer traffic. According to the Food Marketing Institute, customer traffic
in supermarkets is roughly two times per person per week, the second highest among all
establishments in the retail channel after only convenience stores (Progressive Grocer 2001).
However, customer counts in the convenient store industry are only a fraction of those in the
supermarket industry. Thus it is not surprising that Anderson and Sullivan (1993) report that the
elasticity of repurchase intentions with respect to customer satisfaction in the supermarket
industry is one of the highest among all retail sectors. Because of high customer frequency and
presumed low switching costs due to the proliferation of supermarkets and competing retailers
with similar product offerings, unsatisfied customers are unlikely to remain loyal. After an
unsatisfactory experience in a given supermarket, the customer decision to shift stores might
follow almost immediately, thus affecting store sales performance in a short period. Conversely,
food retailers who understand the linkages between customer satisfaction drivers and sales
performance may be able to avoid creating the unsatisfactory experience in the first place. Thus,
by making the right decisions to satisfy their customers, informed retailers may enjoy greater
sales payoffs relative to their competitors.
5
The food retailing industry is aware of the increasing importance of having satisfied
customers. For example, a national study conducted by Progressive Grocer and the NPD Group
found small but significant decreases in the general level of customer satisfaction in the
supermarket industry from 1995 to 1996 (Mathews 1997). Such customer dissatisfaction, the
study suggests, could drive customers out of the supermarket channel--to competing channels--if
managers are unable to redress these levels of dissatisfaction. Decision makers in food retailing
firms now appear to agree on the vital importance of customer satisfaction (cf., Bannister 2001).
For example, two of the most consulted trade sources in the food industry, Progressive Grocer
and Supermarket Business, together have produced more than a hundred articles addressing
customer satisfaction in the last decade.
While food retailers recognize that customer satisfaction is vital to the creation of a
successful business strategy, what is unclear is the exact nature of that role, how to manage
satisfaction, and whether investing in customer satisfaction leads to higher sales. The linkages
between drivers of customer satisfaction and sales performance in the food industry have not
been firmly established. Earlier research helped retailers understand that investments in customer
satisfaction must be financially justified. A key component of this thinking is that management
requires information that accurately describes the linkages between satisfaction and sales
performance to guide customer satisfaction policies.
LITERATURE REVIEW
Our study focuses on the relations between attribute perceptions, overall customer
satisfaction and store sales performance. Such links are part of a broader conceptual framework
proposed by Heskett et al. (1994), namely the Service-Profit Chain. Anderson and Mittal (2000)
6
strengthened this framework by accommodating nonlinearities and asymmetries in the links, and
they renamed it the Satisfaction-Profit Chain. Hereafter we use the acronym CSSP, Customer
Satisfaction-Sales Performance, to refer to the links of interest. We show the elements of the
CSSP chain in Figure 1. First, we identify specific and measurable attributes that are expected to
influence overall satisfaction. The attributes are summarized into factors to accommodate
commonality and to minimize multicollinearity. These satisfaction factors, in turn, capture
product and service variables that lead to overall satisfaction. It follows that improvements in
these satisfaction factors, in turn, should increase overall customer satisfaction. And increased
customer satisfaction should lead to greater store sales, via increased likelihood of repurchase
and favorable word of mouth. We discuss extant findings on these linkages next.
[Figure 1 About Here]
Attribute Perceptions and Customer Satisfaction
To capture the relationship between attribute perceptions and overall customer
satisfaction, we must identify how customers interpret and respond to the products and services
they buy and experience. Here it is essential to distinguish between specific attributes of a
product or a service and the satisfaction factor they represent. In food retailing, for instance,
consumers may put high value on a factor that might be called “customer service” provided by
the supermarket. This is an example of an abstract or subjective benefit. This abstract benefit
depends on a set of related measurable attributes such as the disposition of the cashiers and sales
associates, speed and accuracy of checkout, and availability of everyday grocery items and store
cleanliness, among others. In addition to customer service, other relevant factors affecting
overall customer satisfaction in grocery stores include the store ambiance, the perceived product
quality of (growing) perishables departments--now 50 percent or more of store sales in some
7
stores--such as fresh produce, deli/bakery, seafood, fresh meat and floral, as well as the
perceived value of products relative to their price.
These links have been the subject of intense scrutiny by marketing researchers. Since the
seminal behavior-oriented research by Oliver (1981), several articles have focused on the
antecedents of customer satisfaction in a wide variety of contexts, ranging from firm-specific
studies to nation-wide assessments. Although satisfaction factors vary according to the type of
products, services and business sectors considered, empirical studies provide vast evidence of
their impact on overall satisfaction (e.g. Szymansky and Henard 2001). Most studies on
antecedents of customer satisfaction utilize models reviewed by Johnson (1998) and show
significant correlation between various satisfaction factors and overall satisfaction (Szymansky
and Henard 2001; Bernhardt, Donthu and Kennett 2000; Mittal, Ross and Baldasare 1998;
Wittink and Bayer 1994). In general, these studies tend to collect information on consumer
ratings of specific attributes. Often, multivariate statistical models are constructed to identify
latent variables representing satisfaction factors (e.g. Johnson and Gustafsson 2000; Johnson
1998; Fornell et al. 1996; Bolton and Drew 1991). In the majority of past research, overall
customer satisfaction is then modeled as a linear function of these latent variables. Much recent
research, however, is critical of the incomplete treatment of the CSSP links, and researchers call
for more elaborate analysis (e.g., Anderson and Mittal 2000).
Addressing the Consequences of Customer Satisfaction
Unlike the antecedents of satisfied customers, the consequences of satisfied (or
dissatisfied) customers have received little attention from researchers (Szymanski and Henard
2001). Perhaps the first study was the pioneering research conducted by Zahorik and Rust (1992)
on the consequences of customer satisfaction. Their work included a mathematical framework to
8
evaluate the financial value of satisfaction (Rust and Zahorik 1993) based on the effect of
satisfaction on customer retention, and the subsequent impact on market share. Anderson and
Sullivan (1993) addressed the simultaneous estimation of the antecedents to and consequences of
customer satisfaction, with data from more than twenty thousand Swedish consumers patronizing
a hundred or so Swedish companies. Their model identifies factors that determine customer
satisfaction, which in turn have a positive association with financial performance. Perhaps the
most important contribution of this work is the identification of asymmetries in the linkages
between disconfirmation of expectations and customer satisfaction. After Anderson and Sullivan
(1993), several studies have examined the relationships in the Satisfaction-Profit (or Service-
Profit) Chain with data from a variety of channels (c.f., Kamakura et al., 2002; Scharitzer and
Kollarits 2000; Soteriou and Zenios, 1999; Johnson 1998; Loveman 1998; Anderson, Fornell and
Lehmann 1994).
Mittal, Ross and Baldasare (1998) and Anderson and Mittal (2000) point out that, for the
most part, earlier research ignored nonlinearities and asymmetries in the links of the CSSP chain.
They maintain that the relationships in the CSSP chain are far more complex than originally
postulated and, specifically, that linear models are insufficient. To illustrate the asymmetry
concept, consider the quality of the produce department and the friendliness of cashiers in a
supermarket. Stronger consumer evaluations of the quality of the produce department might not
imply strongly positive effects on customer satisfaction, while weaker quality might be quite
damaging. Or, improvements in customer-oriented dispositions of cashiers and associates could
have a large positive impact on customer satisfaction while reductions in cashier performance
may be only mildly negative.
9
Now consider the potential role of nonlinearity in the link between customer satisfaction
and sales performance. A retail store with low current levels of customer satisfaction may
require only small investments in satisfaction drivers to improve sales performance. In contrast,
a store with high current levels of satisfaction is likely to need a much larger investment in
drivers to produce impacts on performance of a similar magnitude. Ignoring relevant
nonlinearities and asymmetries inevitably leads to incorrect estimates of the linkages in the
CSSP chain. Furthermore, if the results of CSSP chain research are to be adopted by retail
managers, incorrect measures are certain to lead to incorrect strategy formulation thus dooming
further strategic use of satisfaction data.
Bernhardt, Donthu and Kennett (2000) suggest that another pitfall of many satisfaction
studies is the tendency to rely on cross sectional analysis for statistical inference (Anderson,
Fornell and Lehmann 1994, provides an exception). Bernhardt, Donthu and Kennett argue that a
proper analysis of the links between satisfaction and performance requires a dynamic approach.
This argument echoes Rust and Zahorik’s (1993) contention that efforts to improve customer
satisfaction must be financially accountable over time. Bernhardt, Donthu and Kennett (2000)
study customer satisfaction in a fast-food chain based on monthly data. Although based on
simple correlations, the study shows that a dynamic model outperforms a cross-sectional model
in the examination of the CSSP links.
Extant research has focused primarily on the CSSP links at the aggregate level and for
selected sectors such as telecommunications, banking, healthcare, automobile and
pharmaceuticals, among others (cf., Anderson and Fornell 2000; Scharitzer and Kollarits 2000;
Mittal, Ross and Baldasare 1998; Bryant and Cha 1996; Anderson, Fornell and Lehmann 1994).
Conversely, only a few firm-specific CSSP assessments have been conducted. Examples include
10
fast-food restaurants (Bernhardt, Donthu and Kennett 2000) and department stores (Rucci, Kirn
and Quinn 1998). Anderson and Mittal (2000) discuss several examples where the incorporation
of non-linearities and asymmetries added significant value to a firm's understanding of the CSSP
links. It is especially desirable to use firm-specific data so the linkages between satisfaction and
performance are examined in the context of a firm’s strategy.
We note that academic research on the CSSP linkages in the food retail sector is scarce.
Practically all empirical investigations on food retailing, in the U.S. as well as internationally,
address the drivers of customer satisfaction but do not address their ultimate impact on store
revenues. Among the drivers often identified are: perceived value of products relative to their
prices, staff friendliness and willingness to help, quality and freshness of products, store
appearance, and the degree of customer service (cf., Jin and Jai-Ok 2001; Hackl, Scharitzer and
Zuba 2000; Gail and Scott 1995). However, while the drivers of satisfaction are known
qualitatively, and managers believe that satisfaction affects performance, it is necessary to
measure explicitly the impact of satisfaction on store sales in order to prioritize strategies to
manage the drivers of satisfaction.
This study advances the measurement of the behavioral links in the CSSP Chain in the
food retail sector. We link attribute perceptions, overall satisfaction, and store sales, and we
allow for nonlinear and asymmetric effects. We specify the model in first differences and we
allow for time lags between changes in satisfaction and changes in store sales performance. We
also provide an example to show how managers can use the results to develop appropriate
customer satisfaction policies.
MODEL AND DATA
11
Model
The model is a system of equations linking attribute performance, customer satisfaction,
and store sales over time, where stores are the unit of analysis. Consider a store with satisfaction-
related attributes perceived by consumers at time t. Consumers rate the store on each of these
attributes at each time t (CA1,t, CA2,t, …, CAK,t). To reduce the overlap in interrelated variables, it
is convenient to reduce the number of variables based on their observed correlations.
Consequently, a vector of M latent variables is used to represent satisfaction factors, (SF1,t, SF2,t,
..., SFM,t), with M<K. To capture the dynamic properties of the CSSP chain over time, we define
changes in latent variable m (∆SFm,t) as a function of the changes in specific store attributes
(∆CA1,t,…, tkmCA ,∆ ). As a result, there are M equations for the changes in satisfaction factors:
MmforCACACAFSF tkttmtm m,...,1)...,,,( ,,2,1, 1
=∆∆∆=∆ . (1)
We propose that changes in the satisfaction factors, (∆SF1,t, ∆SF2,t, ..., ∆SFM,t), affect the
evolution of overall satisfaction at time t, or CSt. Next, changes in overall customer satisfaction
∆CSt may produce changes in the store sales performance at time t, ∆SPt. Therefore, in addition
to the M equations in (1), the system also includes:
)...,,,( ,,2,1 tMttt SFSFSFGCS ∆∆∆=∆ , (2)
),,,( GEODEMSTRCSHSP tt ∆=∆ , (3)
where STR, DEM and GEO represent multiple store, demographic and geographic characteristics
respectively.
We argue that it is more appropriate to model the CSSP links in changes than in levels.
For example, the parameter estimates in levels may be confounded by various cross-sectional
12
differences that are difficult or impossible to consider. By focusing on changes, we remove
unobserved cross-sectional differences from the data. Further, we define percentage change in
sales performance (%∆SPt) to accommodate the dependence of sales performance on store size.
Customer satisfaction scores, however, are not ratio scaled so that it is inappropriate to use
percentage change for satisfaction. However, we do include the level of lagged satisfaction, CSt-
1, to account for hypothesized nonlinearities in the links between customer satisfaction and sales
performance, as is explained below. We estimate the relationships in equations (2) and (3) to
estimate how changes in satisfaction factors affect changes in sales performance via changes in
overall satisfaction, and to determine the relevance of nonlinear and asymmetric effects in the
relations between satisfaction factors and overall satisfaction, and between overall satisfaction
and store sales performance.
Data
We use an extensive data set consisting of customer satisfaction information, store sales,
market demographics and store characteristics for more than 250 stores over the period 1998-
2001 for a publicly held supermarket company operating in the Eastern US. At each store,
customer satisfaction data are collected semiannually by mail (February and August) from
approximately one hundred of the top 40 percent customers, based on a random sample from the
company’s loyalty card data base (responses are anonymous). Thus, the data do not represent the
entire customer base. We note, however, that the top 40 percent of customers represent
approximately 82 percent of total store sales. By working with a sample of the highest revenue
customers, we actually have data that pertain closely to storewide activity.
In the survey instrument, customers rate the store, from 1 (poor) to 6 (excellent), on 21
questions pertaining to attribute perceptions and customer satisfaction. The last question pertains
13
to overall satisfaction (CSt), while questions 1-20 measure attribute perceptions (CAt).
Additionally, the survey collects demographic information, such as respondent’s age and
household size. These variables serve as controls in the statistical model that follows. Random
samples are drawn independently each semiannual period, thus the relevant unit of observation is
the store, not the individual customer. By averaging the customer responses for each store, we
create store-level panel data with time series on differences of length six on more than 250
units.1
We employ sales per square foot as the measure of store sales performance (SP). This is
preferred over alternative performance measures such as profits for the following reasons. First,
any profit measure is necessarily subject to accounting conventions, and these conventions may
change over time. Second, given the behavioral focus of our study we expect sales per square
foot to increase with customer satisfaction, but such a link is less obvious for profits. Finally, and
related to the previous point, profits depend on other store-specific variables that affect economic
efficiency such as labor and operational costs that are related to customer satisfaction.
To capture the dynamics, we consider the time lag between change in overall customer
satisfaction (∆CSt) and percent change in store sales performance (%∆SPt). We propose that
changes in overall satisfaction result in changes in sales per square foot in the three months after
the satisfaction survey is conducted. Since sales per square foot is available on a monthly basis,
the measure of sales performance, SPt, is the monthly average of sales per square foot
corresponding to the three months after customer satisfaction wave t is conducted. Thus the
measure of change in store sales performance expressed as a percent is:2
100*1
1
−=∆
−
−
t
ttt SP
SPSPSP% . (4)
14
To illustrate, consider the customer satisfaction surveys corresponding to February, 2000
(t-1) and August, 2000 (t). Here ∆CSt is the change in overall satisfaction of the store’s
customers between these two survey waves. Accordingly, change in store sales performance is
measured as the percent change in sales per square foot between the monthly average of March,
April, May 2000 (the three months following the February survey) and the monthly average of
September, October, November 2000 (the three months following the August survey). All dollar
figures represent real values deflated by the US consumer price index. Finally, additional data
were gathered from the cooperating company regarding store age, store size, and whether major
or minor remodeling had been done during the period of analysis.
We show descriptive statistics of the percent change in store sales performance (%∆SPt)
and change in customer satisfaction (∆CSt) between waves for the seven periods February 1998 –
February 2001 in Table 1. The data show that sales per square foot on average declined during
the study period while customer satisfaction changed very little. The dispersion of both
measures, ∆CSt and %∆SPt, evidenced by the standard deviation, is relatively stable over the
period of analysis. Although customers rate satisfaction from 1 to 6, the range of variation at the
store level is far smaller because we average individual responses per store (the minimum and
maximum average values are 3.5 and 5.3, respectively). We also show the means and standard
deviations of the levels. The average monthly sales per square foot across waves varies between
$13.04 and $14.70 (in 1996 dollars). The average customer satisfaction (across the stores) shows
a low of 4.69 and a high of 4.81. Finally, the number of stores increased from 236 to 262 during
the period 1998-2001, indicating a substantial expansion of operations of approximately 11
percent in number.
[Table 1 About Here]
15
Factor Analysis
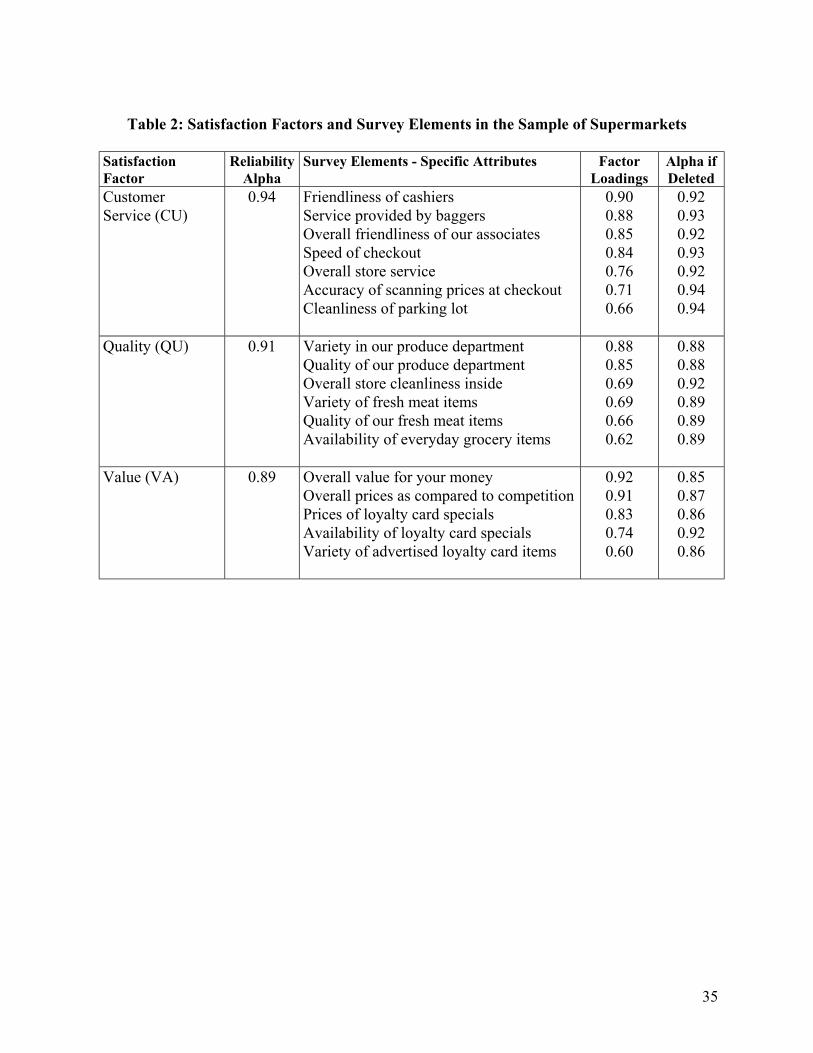
Respondents to the customer satisfaction survey rated twenty store attributes relevant to
their shopping experience. We show eighteen survey elements in Table 2 (two are absent
because those attributes apply to a subset of the stores). However, inclusion of all eighteen
attributes separately in the model weakens statistical analysis and makes it difficult to identify
managerial implications of the CSSP chain in food retailing. Consequently, we conducted a
principal components factor analysis, employing a Varimax factor rotation, to reduce the store
attribute measures to a smaller set of factors, each of which is a linear combination of a subset of
the attributes. We considered all factors with eigenvalues exceeding one. To be consistent with
the dynamic model specified in terms of changes, the factor analysis was also conducted on
changes in specific attributes (∆CAm,t) so as to group variables that move together over time.
[Table 2 About Here]
We show the factor loadings for the three-factor solution in Table 2. These three factors
account for 76 percent of the variation in the eighteen attributes. To facilitate interpretation and
use of subsequent results, we do not use the factor scores but instead use simple averages of the
attributes loading highly on a factor (0.6 or more). This implies that we allow for a modest
amount of correlation between the three factors. We define the three satisfaction factors as
follows: “customer service (CU)”, referring largely to the overall attitude of the employees
toward customers, including service levels; “quality (QU)”, relating to quality and variety of
meats and produce, availability of everyday grocery items as well as cleanliness inside the store;
and “value (VA)”, referring to the price-performance ratio of the items purchased and the
benefits of being loyal to the store.
Empirical model
16
The model consists of two parts. The first presents an unrestricted specification of
equations (2)-(3) that allows for all possible nonlinearities and asymmetries. The second part
discusses nonlinearity and asymmetry in CSSP. Our empirical specification of equation (2)
expresses changes in customer satisfaction as a function of a vector of changes in the three
factors (customer service, quality, value). Separating negative from positive changes in the three
factors allows us to control for asymmetry, while we capture nonlinearity by squaring the
changes in satisfaction factors.
Next, we allow changes in store sales to be explained by changes in customer
satisfaction, store characteristics and customer characteristics. Following Mittal, Kumar and
Tsiros (1999), the level of customer satisfaction at t-1 may affect the relation between changes in
store sales and changes in customer satisfaction. Consequently, the model includes the store
satisfaction score at time t-1 (CSt-1), and its product with ∆CSt. We also allow for separate
positive and negative ∆CSt effects to account for asymmetries, and we use the interaction
between CSt-1 and subsequent changes on overall satisfaction to measure nonlinearities.
Demographic and store-specific variables such as average customer age, average household size,
store location (urban or rural) and real estate information are included as control variables. Since
changes in store sales vary over time, we also use time dummies to accommodate wave-specific
effects.
With all possible asymmetries and nonlinearities, the empirical specification yields:
itititit
ititititititit
eVAVAVA
QUQUQUCUCUCUCS
,12,9,8,7
2,6,5,4
2,3,2,10,
+∆+∆+∆+
∆+∆+∆+∆+∆+∆+=∆−
−−
ααα
ααααααα (5)
itiiiiit
ititititititititit
eEXPMRNWMEHSZAGECSCSCSCSCSCSCSSP
,2111098,7
,6,1,5,1,4,13,2,10,%+++++++∆+
∆+∆+∆++∆+∆+=∆ −−
−−−
REGγWDδβββββ
βββββββ (6)
17
where,
itCU ,∆ is change in customer service factor score in store i at wave t, −∆ itCU , equals itCU ,∆ if its value is negative; zero otherwise, 2,itCU∆ is change squared in customer service factor score in store i at wave t,
itQU ,∆ is change in quality factor score in store i at wave t, −∆ itQU , is itQU ,∆ if its value is negative; zero otherwise, 2,itQU∆ is change squared in quality factor score in store i at wave t,
itVA ,∆ is change in value factor score in store i at wave t, −∆ itVA , is itVA ,∆ if its value is negative; zero otherwise, 2,itVA∆ is change squared in value factor score in store i at wave t,
itCS ,∆ is change in overall customer satisfaction score in store i at wave t, −∆ itCS , equals itCS ,∆ if itCS ,∆ is negative; zero otherwise,
itSP ,%∆ is monthly percentage change in sales per square foot in the three months after the satisfaction survey is conducted,
itCS ,1− is average customer satisfaction score in store i at wave t-1,
itAGE ,∆ is change in average age of survey respondents in store i at wave t,
itHSZ ,∆ is change in average household size of survey respondents in store i at wave t,
iME is one if store i is located in a metropolitan area; zero otherwise, EXPi is one if store was expanded, for all periods since expansion; zero otherwise,
iNW is one if store is new for all periods since opening; zero otherwise,
iMR is one if store was remodeled, for all periods since remodeling; zero otherwise, REG is a vector of dimension four of (0,1) dummy variables representing regional
locations of the stores, and WD is a vector of (0,1) dummy variables corresponding to customer satisfaction
waves.
We summarize the test results of nonlinearity and asymmetry between ∆CSt and the
vector of satisfaction factors (∆CUt, ∆QUt, ∆VAt) in Table 3. We compare three models to the
unrestricted version (asymmetric-nonlinear), namely (1) linear-symmetric, (2) linear-asymmetric
and (3) nonlinear-symmetric, constraining the same effects to apply to all three factors. We
therefore use F tests to determine which specification fits the data best. The linear-symmetric
model is rejected, indicating the presence of asymmetries and/or nonlinearities (p<0.01). Test
18
statistics also suggest that a linear-asymmetric model is preferred over its nonlinear-symmetric
counterpart (p-values are 0.12 and 0.80 respectively). Given that there is very little evidence for
nonlinearity, we next impose linearity on the otherwise unrestricted version, and test for
asymmetry once more. This test is highly significant, suggesting that asymmetries matter
especially for a linear model (p<0.01). These test results favor a linear-asymmetric specification
in the three factors. Thus, it appears that positive changes in the factors have different effect
magnitudes than negative changes do on overall satisfaction.
We employ a different approach to address nonlinearity and asymmetry in the link
between overall satisfaction and sales. Contrary to equation (5), in which we explore the
simultaneous influences of the three satisfaction factors on overall satisfaction, in equation (6)
we examine nonlinear-asymmetric effects of only a single variable, CS, on store sales. We use
the results for the parameters β1-β5 to discuss the nature and magnitudes of these asymmetries
and nonlinearities. In equation (6), these links are nonlinear if the parameter corresponding to the
interaction between the level of satisfaction at t-1and the subsequent change in overall
satisfaction, β4, differs from zero. Asymmetry exists if β2, the parameter capturing the difference
between positive and negative changes in CS, differs from zero. The parameter β5 captures the
combined effect of nonlinearity and asymmetry.
[Table 3 About Here]
The test results show that all five parameter estimates pertaining to the effects of overall
satisfaction on sales are statistically significant (Table 4). This is a strong result, given that some
of the predictor variables are correlated to a considerable degree (the five predictor variables
capture main- and interaction effects). Indeed, three of the five effects are only significant at the
10 percent level, two-tailed.
19
We note that Ordinary Least Squares estimates (OLS) are biased and inconsistent if
current-period endogenous variables appear as regressors in other equations in the system.
However, OLS is appropriate in the case of simultaneous equations when the models are
recursive with lagged endogenous variables as in equations (5)-(6), as long as the disturbances
e1t and e2t are uncorrelated. If these disturbances are correlated, seemingly unrelated regression
(SUR) yields consistent and unbiased estimates. In our application, statistical tests fail to reject
the null hypothesis of zero contemporaneous correlation between these disturbances. We
therefore use OLS to obtain unbiased and efficient estimates.
FINDINGS
We show OLS estimates of the linear, asymmetric specification of equation (5) and the
nonlinear, asymmetric specification of equation (6) in Table 4. Changes in the three customer
satisfaction factors explain nearly three quarters of the variation in the changes in customer
satisfaction. This is a high degree of explanatory power given that the factors and overall
satisfaction represent changes over time as opposed to levels. Mittal and Kamakura (2000)
suggest that a high R-square may be the consequence of a common method bias, resulting from
measuring satisfaction attributes and overall satisfaction in the same survey instrument. A
common method bias also applies to changes but the focus on changes nevertheless reduces R-
square. We note that this common method bias is also a compelling reason for managers to go
beyond the links between attribute perceptions and overall satisfaction, and address the ultimate
impact of satisfaction on store revenues.
The factor analysis of the perceptual attributes allows us to identify the distinct
components in the instrument, and it is of interest to determine differences in the effects of
20
changes in the three factors on overall satisfaction. These effects vary dramatically across
factors. We use the results in Table 4a to classify the factors into what have elsewhere been
described as “satisfaction-enhancing and satisfaction-maintaining” drivers (Anderson and Mittal
2000). Our results suggest that a one point negative change in quality decreases overall
satisfaction by 0.35 (α4+α5), which is seven times larger than the impact of a one point positive
change in quality (α4=0.05).3 This asymmetry suggests that quality is a satisfaction-maintaining
factor in food retailing. That is, improvements in quality ratings produce far smaller beneficial
impacts on customer satisfaction than the damaging effects created by negative changes in
quality perception of the same magnitude. However, a one point increase in the value factor has
a somewhat larger impact on overall satisfaction (α7 = 0.36) than does a negative change of the
same magnitude (α7+α8 = 0.25). Thus, value appears to be primarily a satisfaction-enhancing
factor. The estimates indicate that customer service is the most important determinant of overall
satisfaction, and that it is also primarily a satisfaction-enhancing factor. That is, both effects are
quite large, and the positive effect (α1=0.69) is larger than its negative counterpart (α1+α2 =
0.55).
In Table 4b we show that the second equation explains thirteen percent of the variability
in %∆SPt. The parameter estimates and the associated standard errors indicate that changes in
customer satisfaction and in some demographic and store characteristics are relevant predictors
of changes in store sales. In particular, the coefficients of the five customer satisfaction variables
are all significant at least at the 10 percent level, confirming that nonlinearities and asymmetries
matter. The parameter estimates of tCS∆ and −∆ tCS indicate that sales performance is more
sensitive to negative (-136.96) than to positive changes (+52.30) in overall satisfaction. The
nonlinear effects, represented by the coefficients of CSt-1 and its interaction with ∆CS, are
21
stronger for lower values of CSt-1. To illustrate, the effect of a one-point increase in CS in a store
with CSt-1= 4 is larger than the effect of the same increase in a store with CSt-1= 5 (27.8 and 22.8,
respectively).4 These differences suggest that the effect of positive ∆CS on sales is decreasing
with the level of customer satisfaction.
[Table 4 About Here]
To illustrate the nonlinearities and asymmetries in the links between customer
satisfaction and store sales, we show %∆SPt as a function of tCS∆ in Figure 2 under alternative
levels of customer satisfaction at time t-1 (CSt-1): the bottom 10% of stores (CS ≤ 4.26); the top
10% of stores (CS ≥ 5.05), and an average store (CS = 4.74), keeping everything else constant.
Since the empirical model is specified in changes over time, the functions in Figure 2 represent
the estimated partial derivative ∆SP/∆CS conditioned on CSt-1. Note that the magnitudes of the
estimated derivatives depend on CSt-1 and on whether the change is positive or negative. For the
top 10% of the stores, for instance, positive ∆CSt has much smaller impacts on sales performance
relative to negative changes of the same magnitude. This asymmetric result suggests that once a
high level of customer satisfaction is achieved maintaining it is critical.
[Figure 2 About Here]
Figure 2 also shows the nonlinearities between customer satisfaction and store sales
performance. Given a positive ∆CSt of a specific magnitude, the slope corresponding to stores in
the top 10% is smaller than the slope associated with average stores, which is in turn smaller
than the slope of stores in the bottom 10%. Thus the slope ∆E/∆CS tends to decrease as the level
of customer satisfaction increases, i.e. the function linking overall satisfaction to sales
performance is positive at a decreasing rate. Similarly, the link between satisfaction and sales
performance is nonlinear with respect to negative ∆CSt. As the level of overall satisfaction at
22
time t-1 decreases, the impact of negative ∆CSt on sales performance tends to decrease. Hence
the satisfaction-performance function decreases at a decreasing rate for negative changes in CS.
The other variables in the model serve as controls to the CSSP chain. The demographic variables
∆AGEti and ∆HSZti help control for differences in the samples of customers responding the CS
survey, both between stores and over time. For example, on average stores that started operations
(NWi) or were remodeled (MRi) during the period 1998-2001 show higher changes in sales
performance. Also, stores in metropolitan areas (MEi) have higher sales performance changes
than their rural counterparts, as do stores located in Region 4 (REG4), holding other variables
constant.
We conduct tests of the parameter estimates on a holdout sample, employing customer
satisfaction data corresponding to an additional wave (August 2001). Considering the links
between satisfaction factors and overall satisfaction, the correlation between predicted and actual
∆CS is 0.85, which is in the line with expected decreases from the estimation sample for a valid
model. To examine the links between satisfaction and store revenues, we employ the following
three alternative specifications: (1) without CS variables, (2) the nonlinear-asymmetric
specification of CS, and (3) the parsimonious specification of CS (i.e., with a linear effect of
CS). The Mean Squared Errors between predicted and actual values indicate that both the
nonlinear-asymmetric specification and the parsimonious specification of CS marginally
outperform the model without CS.5 However, the parsimonious (linear-symmetric) specification
performs better than the nonlinear-asymmetric one. This suggests that the significant nonlinear
and asymmetric complexities may reduce the forecasting accuracy of CS. These complexities are
nevertheless relevant as indicated by the statistical significance of each of the five terms.
23
We also investigate the presence of seasonality in our sales data, conduct
heteroskedasticity tests, and verify that multicollinearity does not affect the model estimates. The
only sign of seasonality observable in the data is that sales exhibit a peak in December; however,
our analysis does not include sales in this month. Nevertheless, to ensure that our model does not
suffer from omitting seasonality, we employed an alternative specification in which changes
were calculated with respect to the previous year (instead of with respect to the previous wave).
Parameter estimates of this alternative specification are similar to the estimates presented in
Table 4. We also calculate White’s test statistics for both equations in Table 4, and conclude that
the null hypothesis of homoscedasticity cannot be rejected. Additionally, Variance Inflation
Factors and correlation coefficients indicate that satisfaction factors in equation (5) are only
modestly correlated, as is the case for the customer satisfaction constructs relative to the control
variables in equation (6).6
The estimates in Table 4 also allow us to estimate the ultimate impact of changes in
satisfaction factors on changes in store sales performance. For instance, a one point decrease in
quality (QU) in a store in the “top 10% group”, ceteris paribus, is likely to produce a negative
change in CS of about 0.34 points. This decrease in CS, in turn, results in a reduction of monthly
sales per square foot of about 2.2 percent. In contrast, a positive change in quality QU of the
same magnitude has a very small effect on ∆CSt (only 0.05 points), producing a much smaller
increase in store sales performance (0.4 percent). Such asymmetries have to be considered in
managerial actions. Our results suggest that improvements in satisfaction-maintaining factors
such as quality are not expected to increase sales performance dramatically; however,
disregarding quality as a satisfaction factor might reduce store sales performance considerably.
Changes in customer service (CU), both positive and negative, have the greatest impacts on store
24
sales performance among the satisfaction factors. Specifically, a one point increase (decrease) in
customer service (CU) in a store in the “Average group”, produces a 0.63 increase (0.55
decrease) in CS, which in turn results in a 1.95 percent increase (2.5 percent decrease) in
monthly sales per square foot. Finally, positive changes in value (VA) also can substantially
improve sales per square foot. However, the impact of changes in this factor on profits is less
clear, in particular if the tactics involve, say, aggressive price reductions and promotions.
In summary, a first-differences approach provides valuable insights into the behavior of
the CSSP chain. The results indicate the relevance of nonlinearities and asymmetries in the
linkages between satisfaction factors and store revenues. Since customer satisfaction is indeed
critical to store sales performance, retail firms must understand these complex relationships in
order to make appropriate satisfaction-related decisions.
IMPLICATIONS FOR MANAGERS: THE IMPACT OF CUSTOMER SATISFACTION ON
STORE SALES
We simulate how alternative customer satisfaction policies lead to changes in store sales
performance.7 Information on alternative satisfaction policies and store characteristics can be
combined with the parameter estimates in Table 4 to determine the relative impact of changes in
CS on changes in store revenues. We illustrate this by means of simulations to show how
managers can make practical use of the findings of this study.
A system to monitor the links between customer satisfaction and sales performance
Suppose management of the retail company contemplates how to allocate managerial
efforts among the three satisfaction factors, customer service (CU), quality (QU) and value (VA)
for a particular store in year t. Assume this store is 45,000 square feet in size and its average
25
sales per square foot is $25 per month. Both size and sales are our sample averages. Assume
further that, based on historical data, management determines that a given level of effort
produces a net increase across satisfaction factors of 0.3 points (for example, one combination
that produces this result is ∆CUt=0.5, ∆QUt=-0.1, ∆VAt=-0.1). This amount of managerial effort
might be considered the “marginal cost” of customer satisfaction (MCCS) in terms of managerial
effort. One expects that MCCS is not constant; instead, it is likely to increase at an increasing
rate as the scores of each factor increase. However, for illustrative purposes and to facilitate the
discussion, we assume that MCCS is constant and equal across satisfaction factors.
We show simulations under alternative satisfaction policies for a store in the top 10%,
average, and bottom 10% tier CS scores in Table 5. Alternative A consists of management
focusing exclusively on the customer service factor (CU). The result of this particular
satisfaction policy is ∆CUt=0.5 but ∆QUt=-0.1 and ∆VAt=-0.1. Alternative B consists of
allocating equal amounts of effort among all the three factors. In this case, each factor score
increases by a tenth of a point (∆CUt=∆QUt=∆VAt=0.1). Finally, alternative C consists of zero
managerial effort on customer satisfaction. Based on historical data, we identified that no effort
in a satisfaction factor decreases that factor’s score by 0.1 points each year (see explanation in
footnote of Table 5). Using these inputs and applying the parameter estimates of equations (5)
and (6), we show in Table 5 that alternative managerial decisions can produce substantially
different store revenue outcomes, depending on the level of CS. For instance, as expected, CS
managerial efforts exhibit decreasing marginal returns on store sales as the level of customer
satisfaction increases under various resource allocation alternatives. Additionally, the negative
impacts of not making any effort are much larger for stores in the top 10% tier than for stores in
the bottom 10% group, suggesting that the opportunity cost of customer satisfaction varies across
26
stores. We emphasize that the proper comparison of a particular level of effort that results in the
simulated CS changes and revenue impact is not “no change in revenues” but the negative
impact on revenues associated with a zero level of effort (alternative C).
[Table 5 About Here]
A comparison of the outcomes of alternatives A and B illustrates the benefits of
measuring the CSSP links. Alternative A produces larger positive impacts on annual revenues
than alternative B. However, both of these resource allocation alternatives produce the same
decreasing marginal returns discussed above, especially when the level of satisfaction is already
high (stores in the top 10% tier). Although the simulations in Table 5 consider a relatively simple
situation -- all satisfaction factors having the same score and the same unknown constant
“marginal costs” in terms of managerial effort – these results illustrate how a quantitative model
of the CSSP chain can guide policies regarding customer satisfaction. In the application
considered here, the model results indicate that a policy focusing on customer service (CU) is
superior to a policy distributing managerial efforts equally across factors. In alternative C, with
no managerial effort at all, we show that the negative effect of ignoring customer satisfaction
increases with the level of CS.
Managerial implications
This study demonstrates that the degree of customer satisfaction influences store sales
performance in the supermarket sector. Managers must regard their satisfaction surveys not
simply as a mechanism to learn to what extent their stores are satisfying customer needs and
expectations. Instead, customer satisfaction monitoring should be viewed as a timely managerial
tool that can help increase store sales. Even if real-world managers in food retailing understand
from their experience that customer satisfaction influences sales, the linkages are not intuitive
27
and cannot be determined from observation, simple logic and descriptive statistics alone. Thus a
quantitative model that converts raw customer satisfaction data into useable information to
support management decisions provides value for the supermarket business and can justify
efforts to compile and analyze satisfaction data continuously. This is especially critical in
today’s era of major structural and competitive changes in food retailing in which companies are
seeking more aggressive strategies simply to survive.
In the case of the cooperating retail company in this study, our results suggest that
managers must focus on customer service, quality and value to affect overall customer
satisfaction and its ultimate impact on sales. Our results also allow us to discuss more subtle
managerial implications of the CSSP chain. Our parameter estimates, on the one hand, indicate
that changes in overall customer satisfaction are particularly sensitive to changes in customer
service. On the other hand, customers may consider quality as a pre-condition to satisfaction:
positive changes in quality have modest effects on sales performance but negative changes in
quality result in substantially reduced sales per square foot.
The cooperating company is taking the initial steps towards implementing a system to
monitor the CSSP links. In the past, it employed CS data in the same way that characterizes
many other supermarket companies. That is, analysis was limited to descriptive statistics of the
CS data set and, subsequently, to a comparison of stores that differ in satisfaction scores
according to various demographic and geographic variables. Additionally, the analysis included
a comparison of individual stores to the companywide average for the various attributes. In
certain instances, the satisfaction results were also used as a crude metric to determine store
management bonuses. Although management was aware that customer satisfaction should affect
performance, responses from CS data were not linked to store revenues prior to this study.
28
The company is now facing unprecedented competition from other channels, in particular
from large mass merchandisers. In the past, the company emphasized low prices as the primary
means to increase customer satisfaction -- equivalent to an emphasis on the value factor (VA) in
our model. However, because it is extremely difficult to compete with mass merchandisers
strictly on price, the management team recognizes the urgent need to adjust its strategies aimed
at increasing customer satisfaction and at more effective monitoring of the CSSP links.
Therefore, our results contribute to their planned strategy focusing on customer service rather
than one of emphasizing low prices.
Directions for future research
This investigation can be extended to several areas of the CSSP chain in the food retail
sector. First, future empirical studies may incorporate customer retention and loyalty since these
are essential components of the links between satisfaction and performance. Similarly, they
should address mediating and moderating factors that might affect the CSSP links. Second,
future research should include data on market structure (e.g. number of competitors in relevant
market) to accommodate the effects of competition on customer satisfaction. Adding information
on competition will improve the validity of model results and would further enhance the
potential utilization of the CSSP chain as a managerial tool. Third, future research could address
the sensitivity of satisfaction factors to investment levels in specific underlying physical
components. Fourth, longer time series of satisfaction data would facilitate the utilization of
more sophisticated statistical techniques applied to panel data, thus producing superior parameter
estimates and therefore making the CSSP system a more reliable managerial tool. Fifth, longer-
term assessments of the impact of satisfaction on sales performance are desirable to identify how
changes in industry structure and changes in customer preferences affect the parameters in the
29
model. For example, the data could be utilized to anticipate customer satisfaction trends. Sixth,
future research on the CSSP links in food retailing could focus on the customer as the unit of
observation. Having data for the same individual customers over time will facilitate the
incorporation of heterogeneous customer behavior into the CSSP chain framework. Seventh, it
will be useful, especially in service-oriented industries such as retailing, to examine the
interdependence of customer and employee satisfaction and their joint impact on loyalty,
retention and other performance measures. Finally, more industry-specific research will be
useful to explore unique characteristics of different retail segments, and even individual
companies, with regard to the drivers of customer satisfaction.
CONCLUDING REMARKS
Our empirical investigation demonstrates that it is possible to identify important linkages
between customer satisfaction and store sales performance in the food retail sector. This study
contributes to the literature by using firm-specific data and by advancing the measurement
accuracy in the links between attribute perception, overall satisfaction, and store sales. Our work
includes an illustration of how food retailers can use these links to develop appropriate customer
satisfaction policies leading to increased store sales.
30
REFERENCES
Anderson Eugene W., and Claes Fornell (2000). “Foundations of the American Customer
Satisfaction Index,” Total Quality Management, 11 (7), 869-882.
Anderson, Eugene W., Claes Fornell and Donald R. Lehmann (1994).“Customer Satisfaction,
Market Share and Profitability: Findings from Sweden,” Journal of Marketing, 58 (2), 53-
66.
Anderson, Eugene W. and Vikas Mittal (2000). “Strengthening the Satisfaction-Profit Chain,”
Journal of Service Research, 3 (2), 107-120.
Anderson, Eugene W. and Mary W. Sullivan (1993). “The Antecedents and Consequences of
Customer Satisfaction for Firms,” Marketing Science, 12 (2), 125-143.
Bannister, Christine (2001). “Face to Face with Roger Morgan,” Retail World, 54 (14), 12-13.
Bernhardt, Kenneth L., Naveen Donthu and Pamela A. Kennett (2000). “A Longitudinal
Analysis of Satisfaction and Profitability,” Journal of Business Research, 47, 161-171.
Bolton, Ruth N. and James H. Drew (1991). “A Longitudinal Analysis of the Impact of Service
Changes on Customer Attitude,” Journal of Marketing, 55 (1), 1-9.
Bryant, Barbara E. and Jaesung Cha (1996). “Crossing the Threshold,” Marketing Research, 8
(4), 20-28.
Fornell, Claes, Michael D. Johnson, Eugene W. Anderson, Jaesung Cha and Barbara E. Bryant
(1996). “The American Customer Satisfaction Index: Nature, Purpose, and Findings,”
Journal of Marketing, 60 (4), 7-18.
Gail, Tom and Lucey Scott (1995). “Waiting Time Delays and Customer Satisfaction in
Supermarkets,” Journal of Services Marketing, 9 (5), 10-19.
31
Hackl, Peter, Dieter Scharitzer and Reinhard Zuba (2000). “Customer Satisfaction in the
Austrian Food Retail Market,” Total Quality Management, 11 (7), 999-1006.
Heskett, James L., Thomas O. Jones, Gary W. Loveman, W. Earl Sasser and Leonard A.
Schlesinger (1994). “Putting the Service-Profit Chain to Work,” Harvard Business Review,
72 (2), 164-174.
Jin, Byoungho, and Kim Jai-Ok (2001). “Discount Store retailing in Korea: Shopping
Excitement, Shopping Motives, and Store Attributes,” Journal of Global Marketing, 15 (2),
81-107.
Johnson, Michael D. (1998). Customer Orientation and Market Action, Upper Saddle River, NJ:
Prentice Hall.
Johnson, Michael D., and Anders Gustafsson (2000). Improving Customer Satisfaction, Loyalty,
and Profits, San Francisco, CA: Jossey-Bass Inc., a Wiley Company.
Kamakura, Wagner A., Vikas Mittal, Fernando de Rosa, and José Afonso (2002). “Assessing the
Table 2: Satisfaction Factors and Survey Elements in the Sample of Supermarkets
Satisfaction Factor
Reliability Alpha
Survey Elements - Specific Attributes Factor Loadings
Alpha if Deleted
Customer Service (CU)
0.94 Friendliness of cashiers Service provided by baggers Overall friendliness of our associates Speed of checkout Overall store service Accuracy of scanning prices at checkout Cleanliness of parking lot
0.90 0.88 0.85 0.84 0.76 0.71 0.66
0.92 0.93 0.92 0.93 0.92 0.94 0.94
Quality (QU) 0.91 Variety in our produce department Quality of our produce department Overall store cleanliness inside Variety of fresh meat items Quality of our fresh meat items Availability of everyday grocery items
0.88 0.85 0.69 0.69 0.66 0.62
0.88 0.88 0.92 0.89 0.89 0.89
Value (VA) 0.89 Overall value for your money Overall prices as compared to competition Prices of loyalty card specials Availability of loyalty card specials Variety of advertised loyalty card items
0.92 0.91 0.83 0.74 0.60
0.85 0.87 0.86 0.92 0.86
36
Table 3: Asymmetry and Nonlinearity Tests between Attribute Perceptions and Customer Satisfaction
Restrictions Null Hypothesisa F- Statistic P-Value Unrestricted model is nonlinear, asymmetric
Customer Satisfaction Variables Change in Customer Satisfaction ∆CSt 52.30** (27.55) + ∆CSt if ∆CSt<0; zero otherwise ∆CSt
- -84.66* (52.26) +/- Customer satisfaction at wave t-1 CSt-1 4.56*** (1.32) + Interaction term ∆CSt * CSt-1 -10.38* (6.03) - Interaction term ∆CSt
- * CSt-1 18.15* (11.08) +/- Control Variables Change in average age ∆AGEt -3.25*** (0.87) +/- Change in average household size ∆HSZt -0.81 (0.78) +/- One if Region 2; zero otherwise REG2 0.67 (0.53) +/- One if Region 3; zero otherwise REG3 0.66 (0.53) +/- One if Region 4; zero otherwise REG4 1.05** (0.54) +/- One if metro area; zero otherwise ME 0.81** (0.39) + One if new store; zero otherwise NW 4.05*** (0.76) + One if major remodel; zero otherwise MR 1.18 (0.75) + One if expanded; zero otherwise EXP -1.03 (0.77) +/- One if wave 1; zero otherwise WD1 2.77*** (0.73) +/- One if wave 2; zero otherwise WD2 2.62** (1.03) +/- One if wave 3; zero otherwise WD3 3.29*** (1.02) +/- One if wave 4; zero otherwise WD4 -1.42** (0.75) +/- One if wave 5; zero otherwise WD5 3.22*** (0.89) +/- Constant -19.61*** (4.16) R2-adjusted 0.13 Degrees of freedom 1,490
a Standard errors in parentheses *** p-value<0.01; ** p-value<0.05; * p-value<0.10
38
Table 5: Simulation of Alternative Effort Allocations in Customer Satisfaction: Additional Annual Store Revenues (in 1996 dollars) a, b
Effort Allocation Alternatives
CS Level A: All in CU Factor
B: Equally Across Factors
C: Zero CS Investmentc
Bottom 10% (CSt≤4.26)
211,000
79,000
-21,000
Average (CSt=4.74)
113,000
43,000
-56,000
Top 10% (CSt≥5.05)
15,000
6,000
-105,000
a Store size is 45,000 square feet and average sales per square foot are $25 per month; simulation
assumes that alternative A yields ∆CUt=0.5, ∆QUt=-0.1, ∆VAt=-0.1; alternative B yields
∆CUt=0.1, ∆QUt=0.1, ∆VAt=0.1; and alternative C yields ∆CUt=-0.1, ∆QUt=-0.1, ∆VAt=-0.1.
b Two equations were employed to estimate additional annual store revenues. They correspond to
equations (5) and (6) using the parameter estimates in Table 4. We estimate the impact of the
changes in satisfaction factors on overall satisfaction as well as the effect of changes in overall
satisfaction on percentage change in sales performance, ceteris paribus. The equations are:
−−− ∆−∆+∆+∆+∆−∆=∆ VAVAQUQUCOCOCS *11.0*36.0*30.0*05.0*14.0*69.0 , and