Do Electoral Politics Matter in MGNREGA Implementation? Evidence from Village Council Elections in West Bengal Subhasish Dey, University of Manchester Kunal Sen, University of Manchester 4 th West Bengal Growth Workshop, Indian Statistical Institute, Kolkata 27 th December 2014
Transcript
Do Electoral Politics Matter in MGNREGA Implementation?
Evidence from Village Council Elections in West Bengal
Subhasish Dey, University of Manchester
Kunal Sen, University of Manchester
4th West Bengal Growth Workshop,
Indian Statistical Institute, Kolkata
27th December 2014
Outline
• Motivation
• Research Objectives & question(s)
• The specific context
• Data
• Empirical Methodology
• Results
• Conclusion
Motivation
• Political economy of redistributive politics
(Bardhan and Mookherjee 2010a, 2010b; Benhabib and
Przeworski 2006; Dixit 1996; Dixit and Londregan 1996)
• Feedback effect of politics of redistribution on electoral outcome.
(Finan and Schechter 2012; Litschig and Morrison 2012; Werker
et al. 2012)
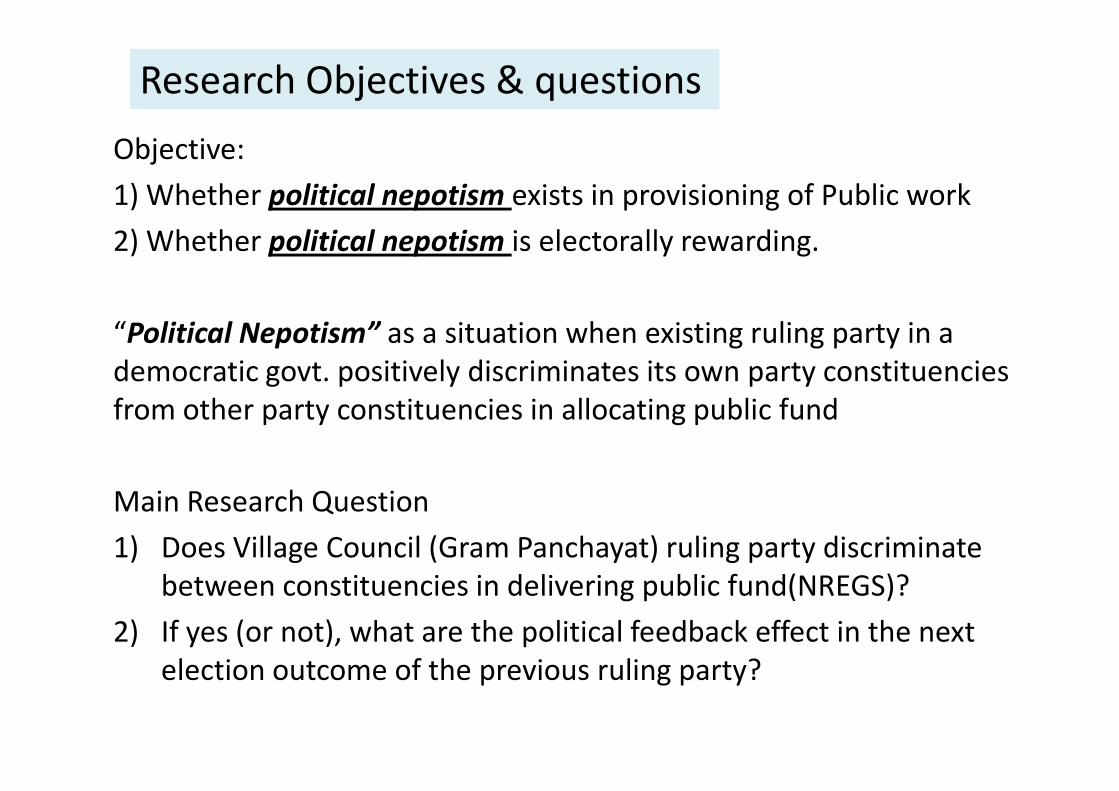
Research Objectives & questions
Objective:
1) Whether political nepotism exists in provisioning of Public work
2) Whether political nepotism is electorally rewarding.
“Political Nepotism” as a situation when existing ruling party in a
democratic govt. positively discriminates its own party constituencies
from other party constituencies in allocating public fundfrom other party constituencies in allocating public fund
Main Research Question
1) Does Village Council (Gram Panchayat) ruling party discriminate
between constituencies in delivering public fund(NREGS)?
2) If yes (or not), what are the political feedback effect in the next
election outcome of the previous ruling party?
The specific context
• Village Council Election (Gram Panchayat election) in India
Village Council
(Gram Panchayat-GP)
Village Council Chairman
Ruling party: Right Populist
4 out 6
4
2
Village Council spends annually
£250K-£300K on developmental
programme. NREGS constitutes
85-90% of that spending.
Ward-1
(Gram Sansad-GSWard-6
Ward-2 Ward-3 Ward-4 Ward-5
Right-Populist Right-Populist Left Right-Populist Right-PopulistLeft
Ward level Winning party
• Self-Selected
Programme
• Budget $ 7 billion (0.6%
of GDP, India) per year
• Covering 50 million
households per year
What is MG-NREGS?
Covering 50 million
households per year
• Village council/GP is the
PIA
• Village Chairman is the
key person in
implementation
• Social Audit
INDIAWhere I did my
survey
Year Purulia South 24 Parganas Jalpaiguri
2008 Left Right Populist Left
2013 Right Populist Right Populist Marginal Left
Data• Detailed Village Council election results:2008 and 2013
• Total 569 wards (or village/gram sansad) over 49 Village councils from 24
Blocks under 3 districts in West Bengal, India.
• Ward level NREGS info (expenditure, no. of schemes, no. of household
participated) and other detail info on other developmental schemes for
Expenditure and NREGS days availed by a household)
Assignment/forcing variable(X): Village wise GP level ruling
party’s vote share after 2008 Panchayat Election.
Empirical Methodology
• We used Fuzzy Regression Discontinuity Design (FRDD).
• Our base line specification
eTXfY ++= σ)(
Where
= Local average treatment effect (LATE) on outcome variable Yσ = Local average treatment effect (LATE) on outcome variable Y
(shows the effect of being ruling-party winning-member on
sansad wise NREGS expenditure)
e = other unobserved error
We are concerned to find sign, magnitude and statistical significance of T.
But ‘T’ is endogenous. Unobserved local factors explaining T can explain Y
directly i.e. E(T,e)≠0 and hence is not idenRfied.σ
Empirical Methodology
We would like to see whether there is any discontinuity in outcome variable
following the discontinuity in probability of Treatment.
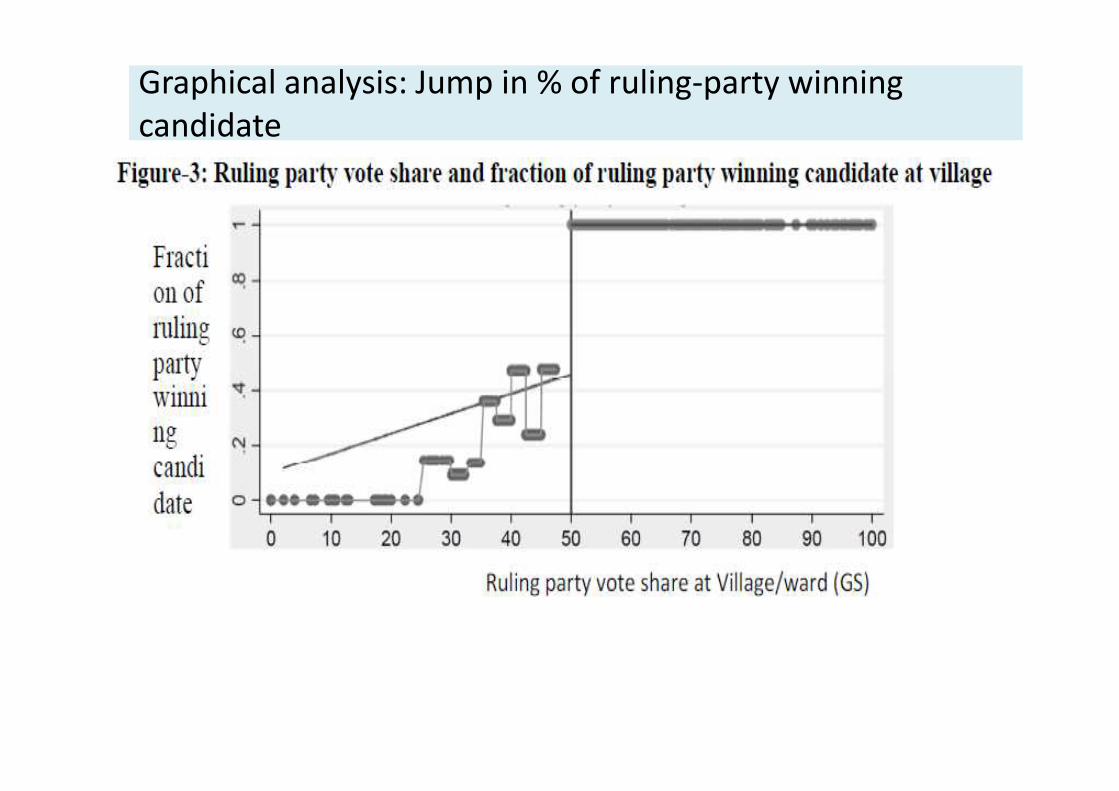
If >0 => there will be a upward jump in the E(Y|X) at the X=50 meaning
Village Council Ruling party wards systematically have higher NREGS
expenditure compare to opponent party wards.
σ
Control variables
Since NREGS is a demand driven programme, we control for
demand side factors and we also control ward level winning
member’s characteristics.
Controls on demand side factors at the ward/village:
average monsoon rain fall, total voters in ward, total number of
households, number of BPL households, worker-to non-worker households, number of BPL households, worker-to non-worker
ratio, no. of minority households.
Controls on ward level winning member character:
Sex, Caste,
District dummy, year dummy
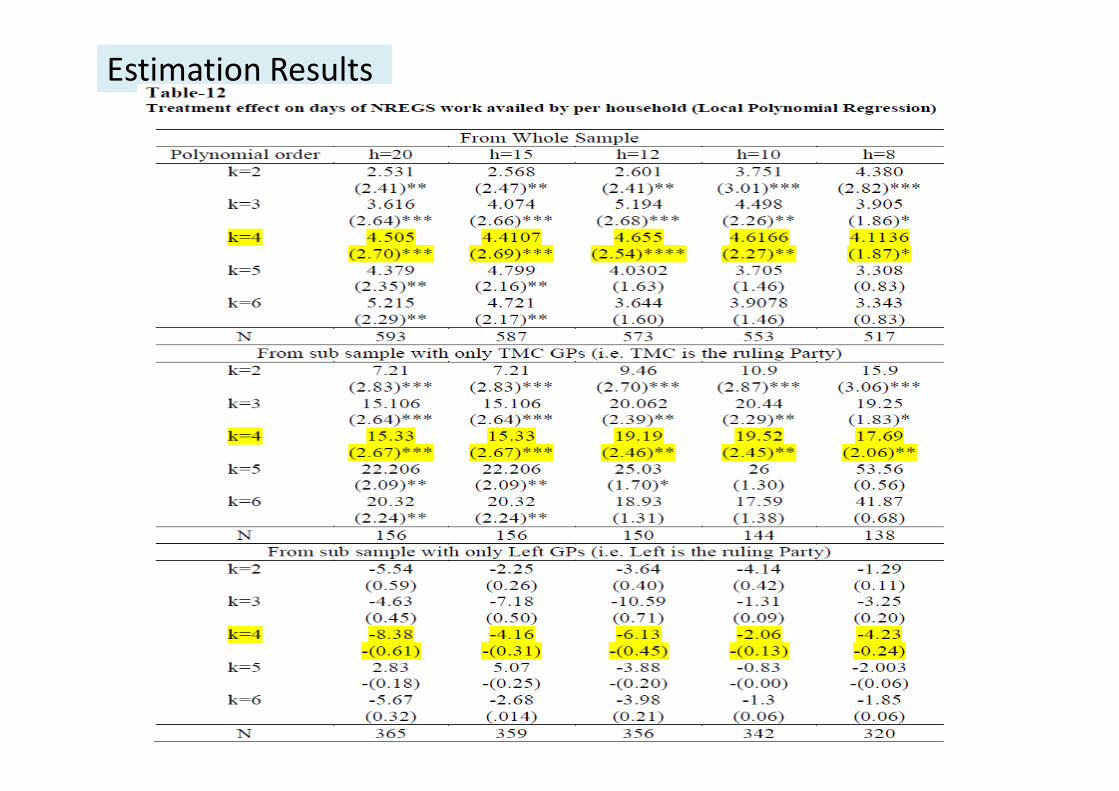
Estimation Results
Estimation Results
Estimation Results
Estimation Results
Test for Validity of FRD
• Sensitivity analysis with different bandwidth and different
order of Polynomial.
• Sensitivity of Treatment effect with the inclusion of all
covariates
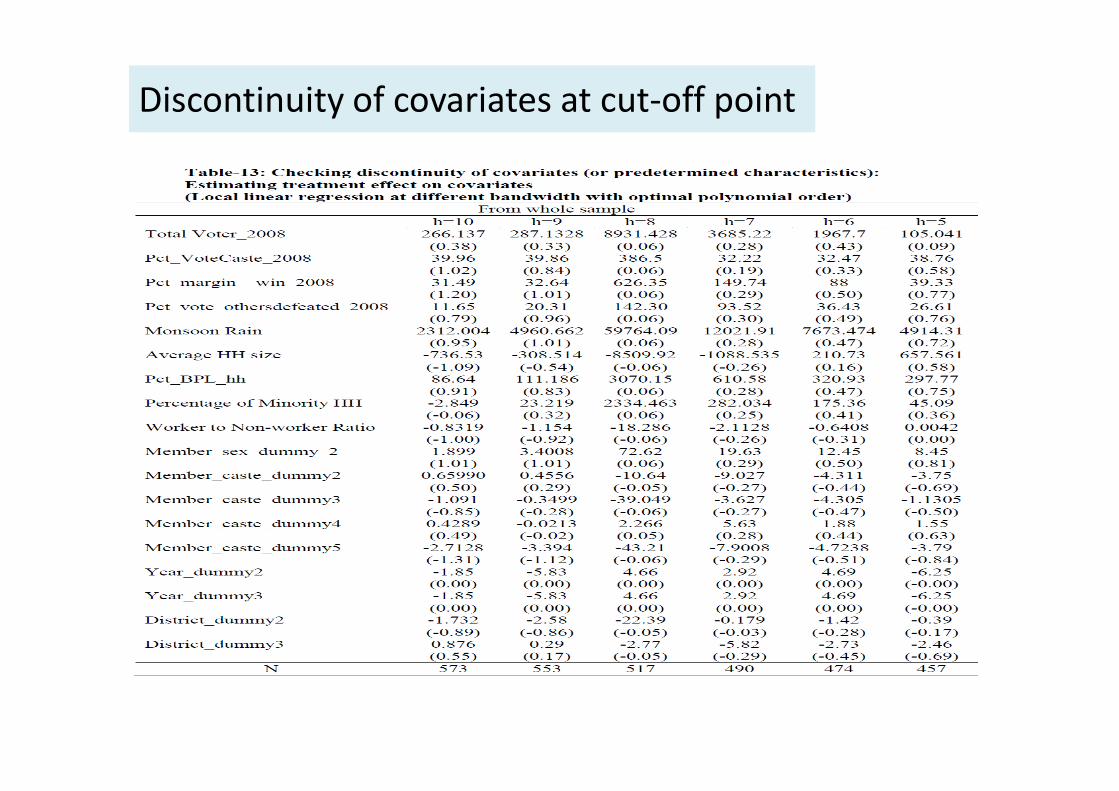
• Checking discontinuity of covariates at cut-off point. • Checking discontinuity of covariates at cut-off point.
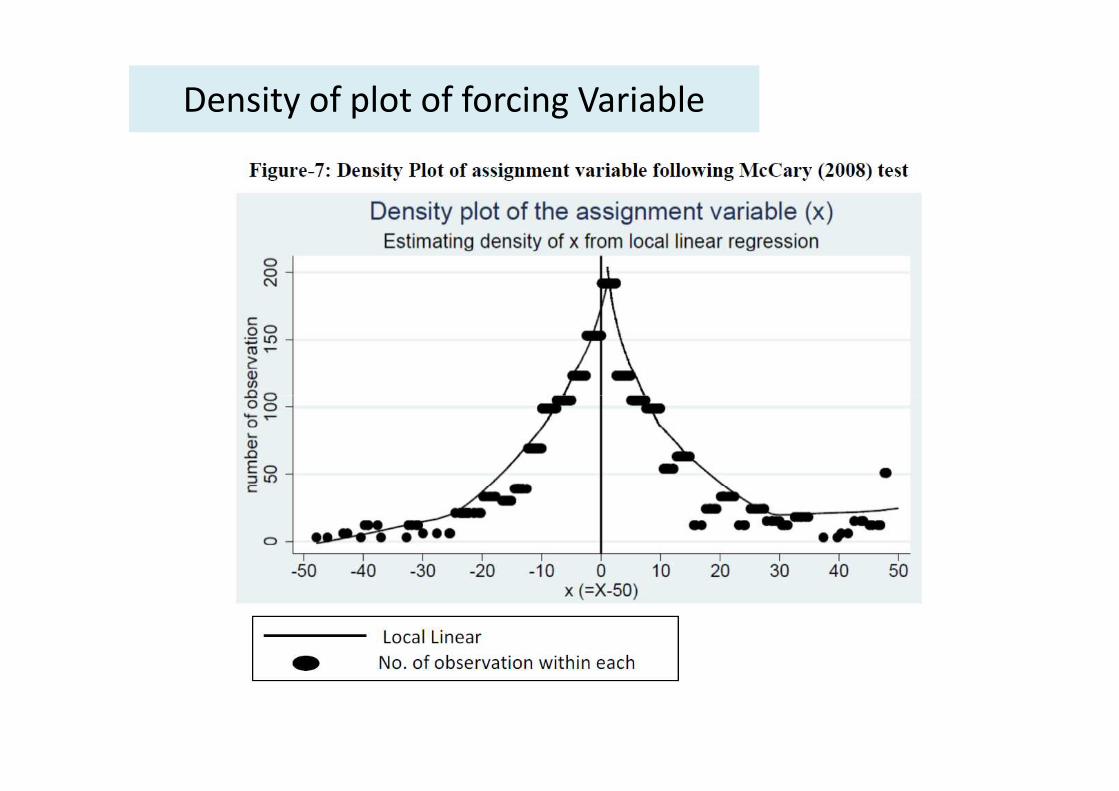
• Density plot of forcing Variable
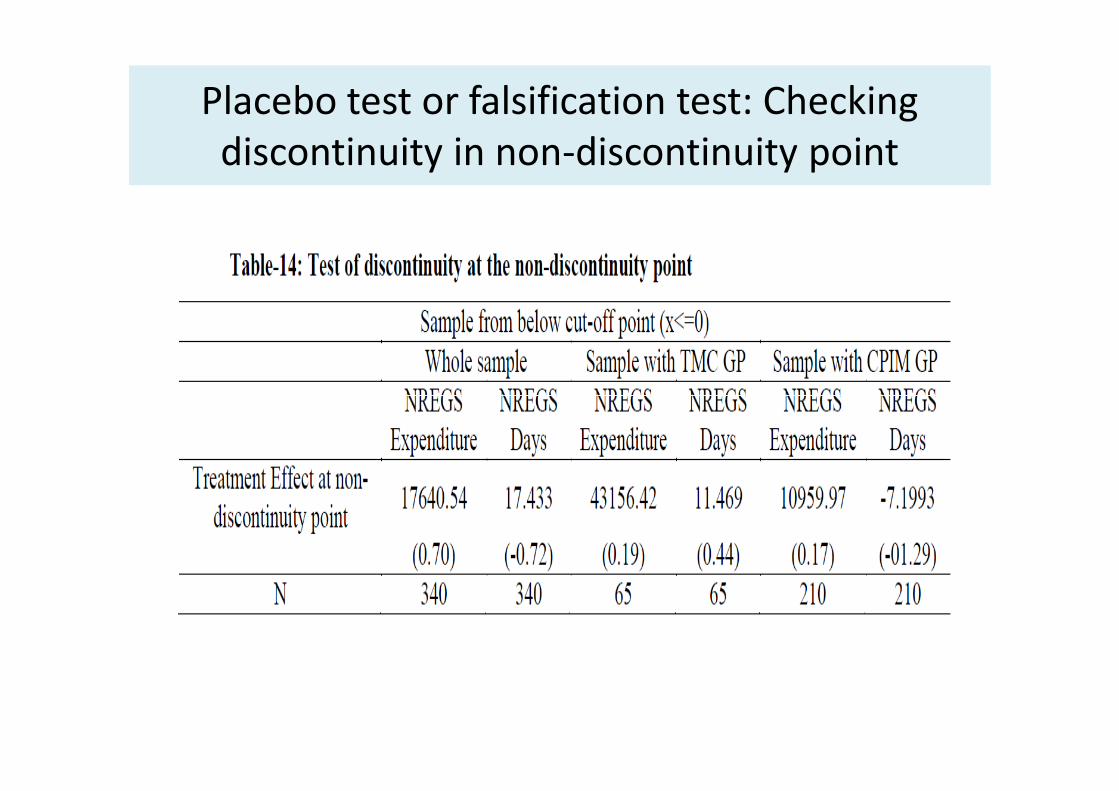
• Placebo test or falsification test: Checking discontinuity in
non-discontinuity point.
Discontinuity of covariates at cut-off point
Density of plot of forcing Variable
Placebo test or falsification test: Checking
discontinuity in non-discontinuity point
Findings on Causal effect of Treatment on Outcome
• Ruling party spends around INR 40K-50K more NREGS funds in their own village compare to opponents village.
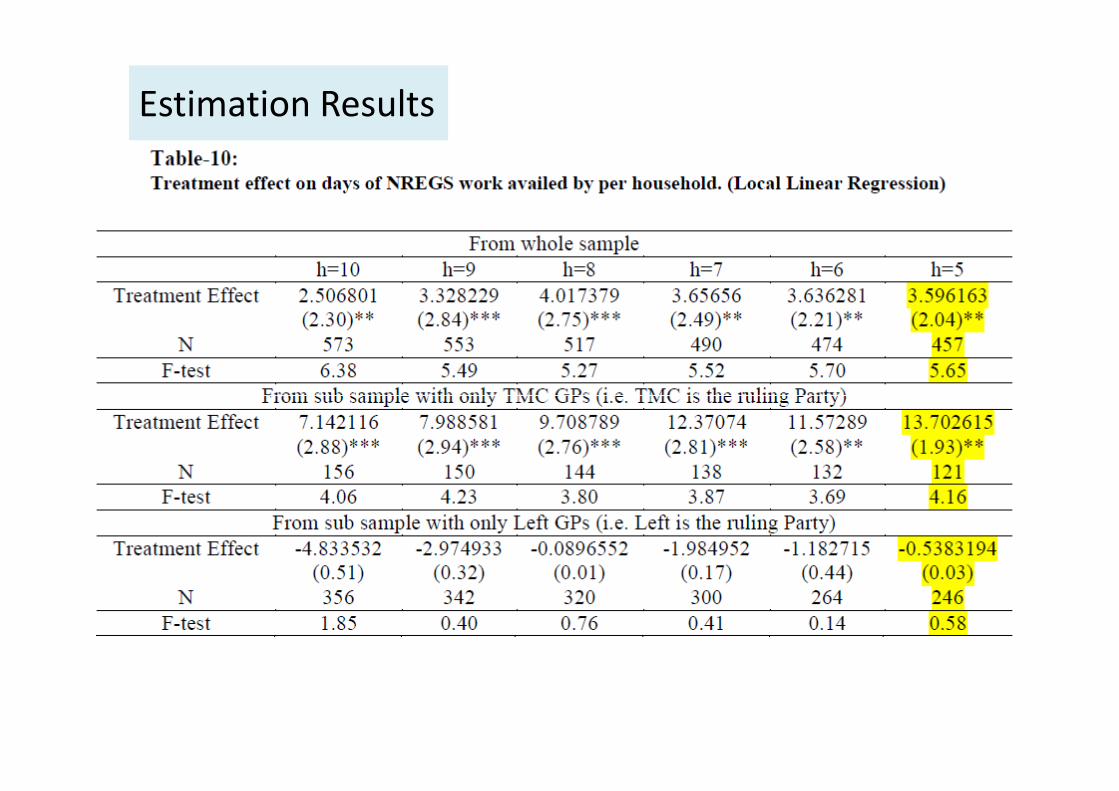
• Household in the ruling party’s village gets 4 to 4.5 days more NREGS work compare to non-ruling party village.
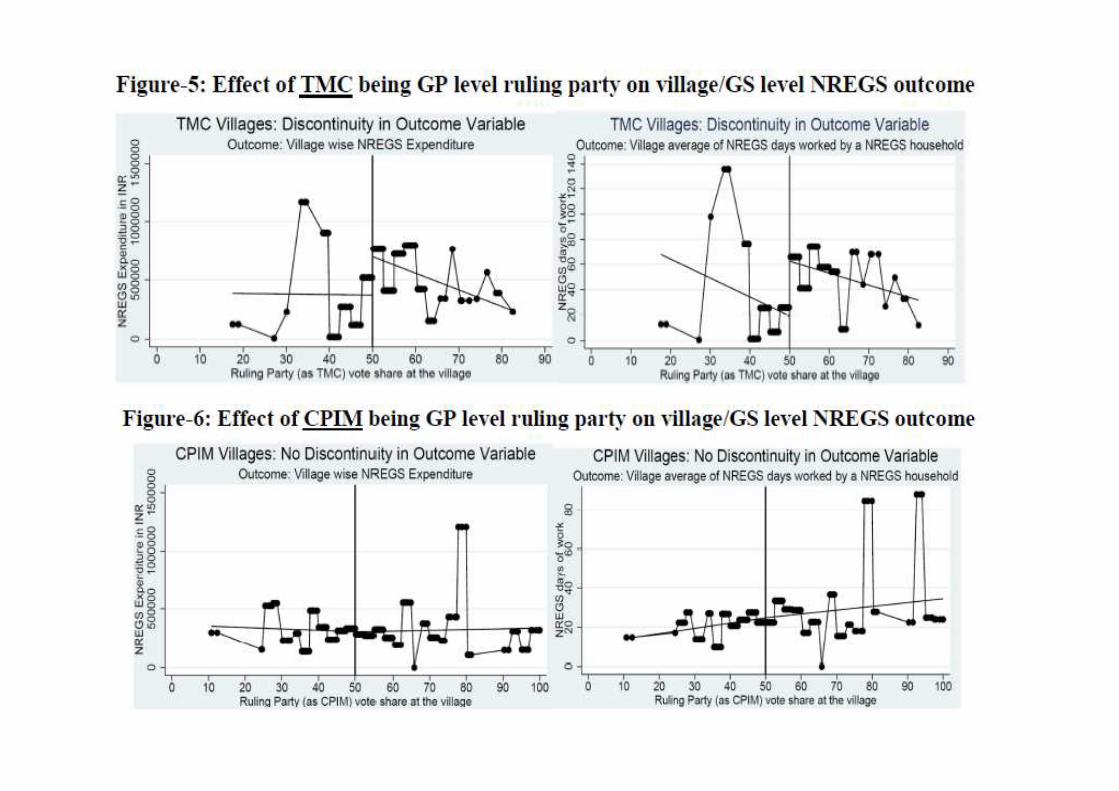
• When TMC is the ruling party they spends 125K to 150K more NREGS funds in their own village compare to opponents village
• When TMC is the ruling party, household in the ruling party village gets 13 to 17 days more NREGS work compare to household in a non-ruling 13 to 17 days more NREGS work compare to household in a non-ruling party’s village.
• When CPIM is the ruling party they spends around 20K less NREGS funds in their own party village but these results are statistically insignificant.
• When CPIM is the ruling party, household in the ruling party village gets 2 to 3 days less NREGS work compare to household in a non-ruling party’s village.
Results on Reciprocity or feedback effect
Results on Reciprocity or feedback effect
Empirical strategy for the feedback effect on 2013 election
Outcome:
)8.......()()(0 exTExfY ++= σ
• This was our treatment effect Equation. We use predicted value of Y for T=1 from the above equation as our main explanatory variable to get causal effect of discrimination on following election outcome.
• Then we run following regression with OLS.
ii KhatYV εγαα +++= _102013_
• Where is the 2008 ruling party’s vote share in 2013 panchayat
election at village i,
• is the predicted value of Y from equation 8 above
• K is vector of other village level controls including margin of win in the
2008 election .
• Essentially this is also a IV estimation where treatment (T) is the
instrument
2013_iV
hatY _
Results on Feedback Effect
Results on Feedback Effect
Conclusion
• We tried to look whether Political Nepotism operates at the local
govt. level and if so then what is its feedback effect on the
following election outcome.
• We find overall evidence of discrimination in village wise
expenditure on Public Good (NREGS).
• Village Council level Ruling party spends more in own party • Village Council level Ruling party spends more in own party
constituency. However, results differ between specific parties
• Right Populist Party reaping out significant benefit in 2013
election through this behaviour of Political Nepotism .
• Left does not came to behave in this way for which they pay in
loosing vote share and lower probability of re-elected 2013
Contribution to the literature:
“……..this study tries contribute an alternative explanation of re-
election motive of the incumbent ruling party and this
explanation is certainly a deviation from the existing theory that
given the predictions of standard voting models, which says
political leaders who are concerned with re-election would focus
on delivering benefits to ‘swing voters’ and not the loyalists..”
Thank You
on delivering benefits to ‘swing voters’ and not the loyalists..”
But why do ‘Left’ and ‘TMC’ behave differently in allocating