Do Financial Market Developments Influence Accounting Practices? Credit Default Swaps and Borrowers’ Reporting Conservatism Presented by Dr Sugata Roychowdhury Associate Professor of Accounting Boston College # 2014/15-04 The views and opinions expressed in this working paper are those of the author(s) and not necessarily those of the School of Accountancy, Singapore Management University.
The views and opinions expressed in this working paper are those of the author(s) and not necessarily those of the School of Accountancy, Singapore Management University.
Do Financial Market Developments Influence Accounting Practices? Credit Default Swaps and Borrowers’ Reporting Conservatism
Abstract This paper investigates whether the initiation of trading in credit default swaps (CDSs) on a borrowing firm’s outstanding debt is associated with a decline in that firm’s reporting conservatism. Contracting theory predicts that lenders’ asymmetric payoffs generate a demand for conservatism, in particular the asymmetric timeliness of loss recognition. CDS investments can modify lenders’ payoffs on their loan portfolios by providing insurance on negative credit outcomes. We examine the possibility that the onset of CDS trading reduces lenders’ demand for conservatism from borrowing firms. Empirical results obtained using a differences-in-differences research design show a reduction in borrowing firms’ reporting conservatism after CDS trade initiation. Furthermore, the decline in conservatism after CDS trade initiation is more pronounced in instances when reputation costs lenders face from reducing monitoring of financial statements are likely to be lower, when debt contracts outstanding at the time of CDS trade initiation have more financial covenants, and when lenders are more likely to have entered into CDS contracts on underlying borrowers.
Corresponding author This paper has benefited immensely from comments by Guojin Gong. This paper has also benefited from comments by Richard Frankel, Ewa Sletten, Ross L. Watts, J. P. Weber, Regina Wittenberg-Moerman, Jerry Zimmerman, workshop participants at London Business School, George Mason University, Georgia State University, Washington University at St. Louis, University of Missouri at St. Louis, and participants at the American Accounting Association conference, the Nick Dopuch conference at Washington University, the University of Minnesota Empirical Accounting Research Conference, Harvard University, and Yale School of Management Conference on Accounting and the Financial Crisis. All remaining errors are ours.
Do Financial Market Developments Influence Accounting Practices? Credit Default Swaps and Borrowers’ Reporting Conservatism
Abstract This paper investigates whether the initiation of trading in credit default swaps (CDSs) on a borrowing firm’s outstanding debt is associated with a decline in that firm’s reporting conservatism. Contracting theory predicts that lenders’ asymmetric payoffs generate a demand for conservatism, in particular the asymmetric timeliness of loss recognition. CDS investments can modify lenders’ payoffs on their loan portfolios by providing insurance on negative credit outcomes. We examine the possibility that the onset of CDS trading reduces lenders’ demand for conservatism from borrowing firms. Empirical results obtained using a differences-in-differences research design show a reduction in borrowing firms’ reporting conservatism after CDS trade initiation. Furthermore, the decline in conservatism after CDS trade initiation is more pronounced in instances when reputation costs lenders face from reducing monitoring of financial statements are likely to be lower, when debt contracts outstanding at the time of CDS trade initiation have more financial covenants, and when lenders are more likely to have entered into CDS contracts on underlying borrowers. Keywords: credit default swaps, timely loss recognition, conservatism, financial market developments, lender monitoring JEL codes: G1, G2, G21, G30, M40, M41, M44
1
1. Introduction
This paper investigates the influence of financial developments in the capital markets on
accounting practices. Financial market developments can affect the payoffs and incentives of
existing contractual parties to the firm. Since contractual considerations can influence accounting
practices (Watts and Zimmerman 1986), an altered contractual environment can potentially
induce changes in these practices. The financial market innovation we focus on is credit default
swaps (CDSs), widely used in recent times to manage lenders’ credit risk exposures and their
regulatory capital. The accounting practice we study is conservatism, in the context of the
borrower-lender relationship. Our primary interest is in examining whether the advent of CDS
trade initiation on a firm’s outstanding debt is associated with a change in that firm’s reporting
conservatism.
The credit default swap is a contract in which the buyer, generally called the protection
buyer, makes a series of payments to the seller, generally called the protection seller. In
exchange, the protection buyer receives a payoff from the protection seller if a credit instrument
(such as a loan or a bond) goes into default or experiences any other “credit event” specified in
the CDS contract (such as restructuring, bankruptcy, or credit-rating downgrade). By acquiring a
CDS contract, the protection buyer transfers the credit risk associated with its investment (such
as a loan or a bond) to the protection seller, while retaining legal ownership of the investment.
Buying protection against credit risk exposures can benefit banks with respect to
regulatory requirements. BASEL II states that by entering into CDS contracts, a bank can
substitute the credit risk of the borrower by the credit risk of the CDS seller in computing risk-
weighted assets (BASEL II, page 49, Article 141). CDS purchases can therefore facilitate a
reduction in a bank’s credit risk exposure and allow for lower commitment of regulatory capital
2
to the loan, which in turn frees funds for alternative productive investments. As an example, AIG
reveals in its Annual Report that $150 billion of its notional CDSs outstanding at the end of 2009
reflected contracts it wrote to provide regulatory capital relief to financial institutions for their
corporate loans (Saretto and Tookes 2013). The overall CDS market has grown tremendously in
recent years, with the notional amount increasing from $180 billion in 1998 to $57 trillion at the
end of June 2008 (Stulz 2010). 1 In 2006, banks entering into CDS contracts related to their loan
portfolios constituted 20% of the market for CDS purchases. By comparison, banks writing CDS
contracts on their loan portfolios constituted only 9% of total CDS selling, implying that banks in
general maintain net purchase positions, reflecting their incentives to use CDSs for hedging and
managing regulatory capital (BBA 2006, please also see Appendix I).
Investments in CDS contracts by banks can potentially have an influence on the reporting
practices of those clients. Upon granting a loan, lenders generally face an asymmetric payoff on
their investment: if the borrowing firm remains solvent, lenders receive their principal and
earned interest, while bankruptcy entitles them to the orderly liquidation value of the borrower.
The literature argues that this asymmetric payoff underlies lenders’ demand for conservatism in
the financial statements of the borrower (Watts and Zimmerman 1986, Watts 2003). Under
conservative reporting, which requires stricter verification standards for recognizing good news
in earnings relative to bad news, the book value of a firm provides lenders with a lower-bound
estimate for the firm’s orderly liquidation value.
The conceptual link between lenders’ asymmetric payoffs and conservatism is
significantly more complex when CDS contracts are available on the underlying borrowers’
outstanding debt. If lenders enter into CDS contracts, their “downside” payoffs are crucially
1 The size of the CDS market fell sharply in the second half of 2008 in the wake of the financial crisis, but was still high at $41 trillion at the end of 2008. The Bank for International Settlements (BIS) has statistics on the CDS market since the end of 2004 based on survey data. See http://www.bis.org/statistics/derstats.htm.
3
altered. In the event of borrower insolvency (in practice, any pre-specified credit event in the
CDS contract), lenders are now entitled to settlement payouts from CDS sellers. To the extent
that lenders’ claims are less asymmetric as a consequence of their CDS investments, their
demand for conservatism is possibly diminished. A reduction in the demand for conservatism
from lenders, if any, is unlikely to be replaced by an offsetting demand for conservatism from
CDS sellers because CDS sellers do not own control rights with respect to the underlying loan
and typically eschew any direct contractual involvement with borrowers. On the other hand, it is
also possible that lenders maintain their demand for conservatism, to avoid reputation costs
arising from any negative credit event that can be attributed to their reduced monitoring of
financial statements. Further, even if there is a decline in the demand for conservatism from
lenders newly protected by CDSs, it may be difficult for borrowers to deviate from past
conservatism for the sake of maintaining reporting consistency. In particular, other stakeholders
to the firm, such as shareholders and lenders not protected by CDS investments can have
offsetting demands for conservatism. We allow for these possible scenarios in investigating
whether there is a decline in borrowers’ reporting conservatism upon CDS trade initiation on
their outstanding debt. Additionally we test whether that decline (if any) is contingent on the
borrowers’ economic circumstances, to allow for the possibility that conservatism does not
necessarily respond uniformly to lenders’ modified incentives upon the acquisition of CDS
contracts.
We identify a sample of 529 firms who experience CDS trade initiation between 2002
and 2009. The empirical exercise essentially involves the identification of an event, CDS trade
initiation, and an examination of whether there is a change in conservatism around this event. To
control for selection bias and endogeneity, we follow a propensity score matching approach, as
4
in Ashcraft and Santos (2009). This involves constructing a model for predicting CDS trade
initiation as the first step. The first stage model indicates that CDS contracts are more likely to
become available for firms with better credit rating, higher leverage, higher profit margin, larger
size, and lower return volatility. These results suggest that adverse selection concerns in the CDS
market create a bias towards firms that have better credit quality and are more transparent. The
second stage analysis involves the computation of propensity scores from the first stage
predictive model to construct a sample of 525 unique matched firms from the same industry that
have no CDS trading throughout the sample period, and the estimation of a difference-in-
difference regression. Specifically, we compute the change in conservatism from the two years
prior to CDS-trade-initiation year (the event year) to the two years after the event year for firms
with CDS trading on their debt, and compare that change to the corresponding change for
matched firms.
We define conservatism as the asymmetric requirement of weaker verification standards
for recognizing losses than for recognizing gains. We measure conservatism as the greater
timeliness of earnings with respect to negative returns relative to positive returns (Basu, 1997).
Our results indicate that the initiation of CDS trading is on average associated with a decline in
the financial reporting conservatism of underlying borrowers. The specific coefficients imply
that asymmetric timeliness of loss recognition declines by around 20 percent after the onset of
CDS trading.2 The decline seems economically significant and is statistically significant at the 5
percent level. Thus, the modified incentives of lenders hedged via CDS contracts appear to have
a net-dominant effect, on average, on the reporting conservatism of borrowers.
2 This decline of 20.3% represents a net amount, inclusive of a 21.2% decline in the conservatism of CDS firms around CDS trade initiation. The propensity-score-matched non-CDS firms exhibit a (statistically insignificant) decline of 0.09% in their conservatism around the pseudo-CDS-trade-initiation dates assigned to them. For a comparison of magnitudes, Ettredge, Huang and Zhang’s (2012) findings imply a 46 percent increase in asymmetric timeliness of earnings following earnings restatements.
5
In cross-sectional analyses, we allow for the possibility that the decline in conservatism
upon CDS trade initiation is not uniform across all firms. We reason that a decline in reporting
conservatism should be more prominent when the underlying borrowers are ex ante more
informationally opaque and riskier. Among such borrowers, lenders are likely to face lower
reputation costs from the potentially adverse consequences of lowering their demand for
conservatism. Theoretical work by Parlour and Winton (2013) and empirical evidence in
Ashcraft and Santos (2009) suggest that reputation costs to lenders from reducing monitoring of
borrowers after acquiring CDSs are lower when the underlying borrowers already have poorer
information environments and are riskier. Further, if lenders reduce their lower monitoring,
particularly with respect to conservatism in financial statements, then borrowers with poorer ex
ante credit quality are expected to be more responsive to such a reduction. The evidence
indicates that the decline in conservatism is more pronounced when borrowers are smaller and
carry speculative-grade credit ratings prior to CDS trade initiation. We do not observe any
evidence of a decline in conservatism among larger firms with higher credit ratings, suggesting
either lenders do not reduce their demand for conservatism among such firms or borrowers
maintain their consistency with respect to conservative accounting practices (presumably to
satisfy the demands of other stakeholders).
Our cross-sectional tests also indicate a greater decline in conservatism at the time of
CDS trade initiation when borrowers’ outstanding private debt at that time includes more
financial covenants. Thus, borrowers are more responsive to any reduction in lenders’ demand
for conservatism when existing debt contracts are more reliant on financial covenants, an
intuitive finding given that conservative reporting is generally thought to accelerate covenant
violation (Zhang 2008). This is particularly interesting in the light of existing literature
6
suggesting that in the presence of lender monitoring, the inclusion of covenants in debt contracts
and reporting conservatism generally act as complements (Nikolaev 2010). Our results indicate
that if lenders’ monitoring incentives are weakened because of their access to CDS contracts,
borrowers have a greater tendency to report with lower conservatism when existing debt
contracts have more covenants.
CDS trade initiation is observable for a wide sample of firms, but we do not observe the
actual acquisition of CDS contacts by lenders. To address this issue, we identify in cross-
sectional tests situations with a greater likelihood of lenders entering into CDS contracts on their
clients. We focus on banks with private debt contracts with borrowers. Banks are often regarded
as “delegated monitors”, with sophisticated and timelier private insights into various aspects of a
firm’s managerial practices, including their reporting choices.
In a two-step procedure, we first identify banks lending to the CDS firms in our sample,
and then partition our sample based on whether these banks exhibit (a) an increase in the
proportion of their assets bearing lower than 100% risk weights or (b) an increase in their CDS
holdings, in the same year as CDS trade initiation on the underlying borrower.3 An increase in
the proportion of a bank’s assets bearing lower risk weights or its overall CDS holdings in the
same year as CDS trade initiation on an underlying borrower is an indication that the banks
likely hedged its exposure to that borrower. We find that a decline in conservatism after CDS
trade initiation is more pronounced when either of the two conditions is satisfied. This finding
implies that other stakeholders to a firm, such as the board of directors or public debt-holders,
either find it difficult or are unable to substitute for any reduction in the monitoring of financial
statements by banks that have acquired CDS contracts. Interestingly, we observe a significant
3According to Basel II, a risk weight of 150% is assigned to loans rated below BB-, 100% to loans rated above BB- but below AA-, and 20% for loans with CDS protection where CDS sellers are rating above AA-.
7
increase in conservatism among borrowers whose banks do not enter into CDS contracts. In
other words, the phenomenon of banks not investing in CDS contracts when such contracts
become available is associated with an increase in their demand for conservatism.
Additional tests examine the possibility that the observed association between CDS trade
initiation and a decline in conservatism is endogenous, in the sense that lenders are motivated to
enter into CDS contracts when they anticipate a decline in reporting conservatism at the
borrower. Our empirical analysis indicates that the decline in borrower conservatism we observe
is unlikely to be driven by any change in conservatism anticipated at the time of CDS trade
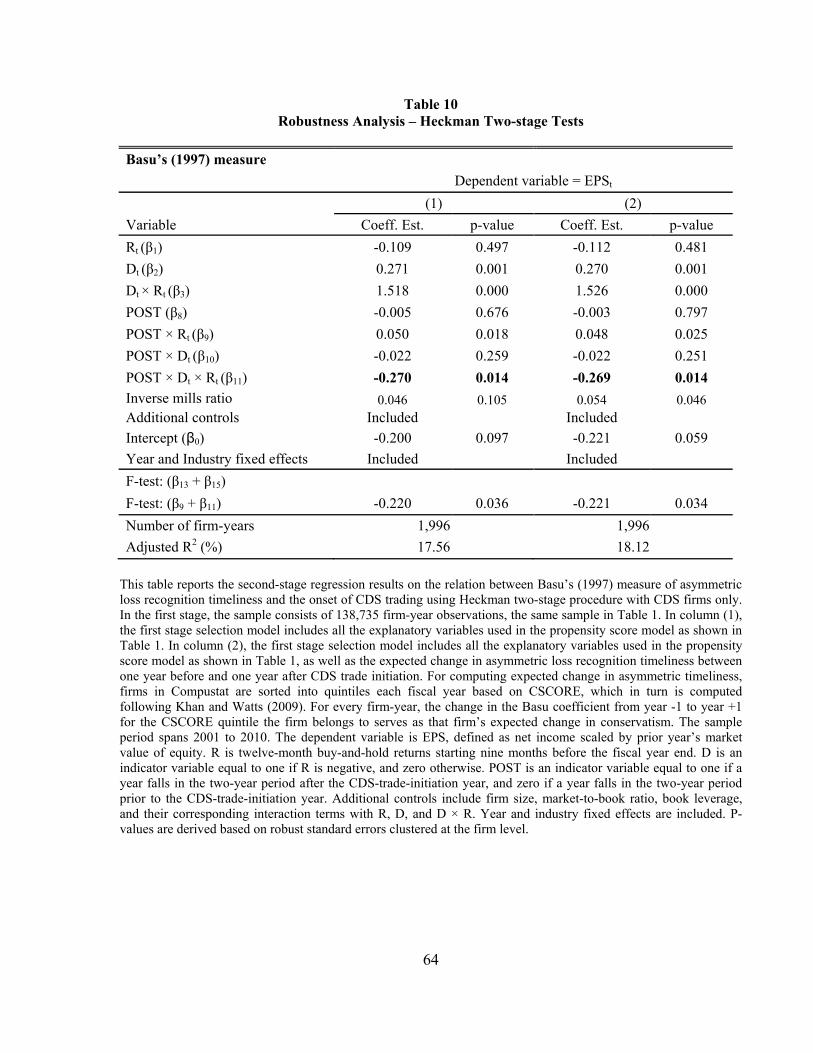
initiation. Indeed this result is confirmed again when we substitute the propensity-score-
matching with a Heckman two-stage procedure to control for selection bias. Finally, our results
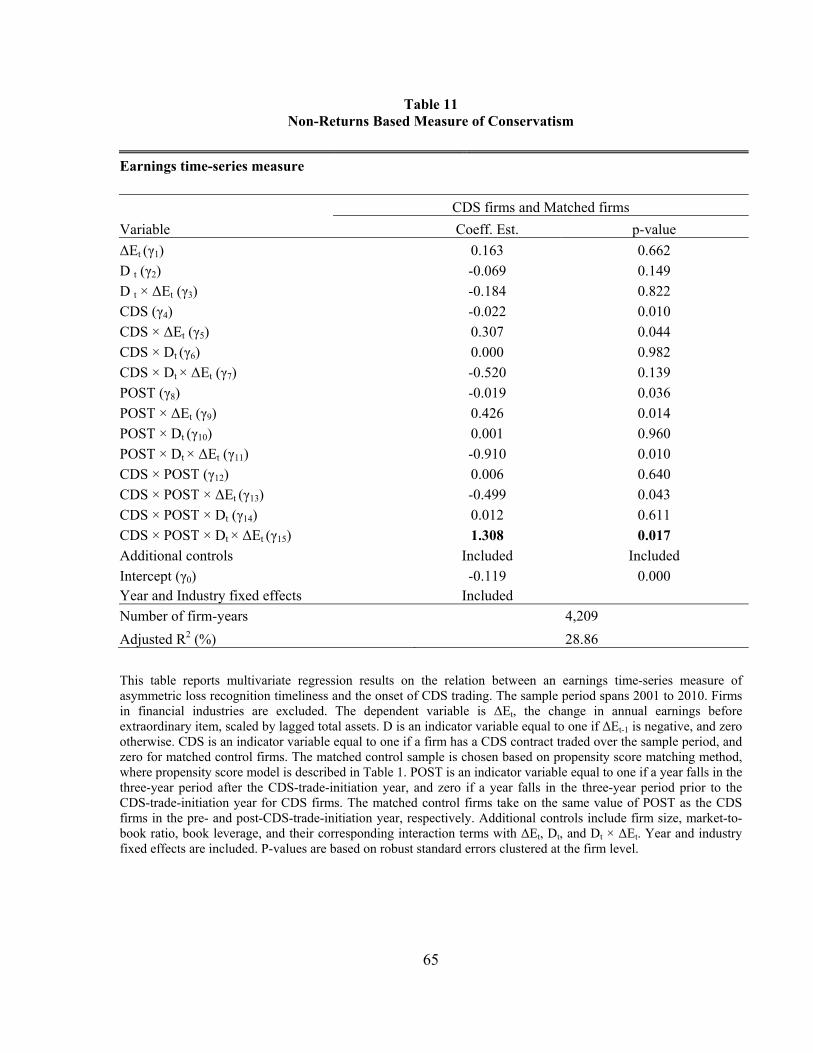
are robust to using a measure of conservatism that relies on earnings time-series properties (Basu
1997) and not on equity returns.
In summary we find that CDS trade initiation is associated with a decline in the reporting
conservatism of underlying borrowers when the latter have poorer information environments and
are riskier ex ante, when their private debt is likely to include more financial covenants and when
their banks are likely to have acquired CDS contracts. The primary contribution of our study is in
providing evidence that developments in financial markets, by altering the payoffs to contractual
parties, can influence financial reporting practices. Specifically, the development of a CDS
market in a firm’s outstanding debt can, in certain situations, be associated with a decline in that
firm’s reporting conservatism, presumably reflecting a decline in lender monitoring of financial
statements.
The rest of the paper proceeds as follows. Section 2 discusses related literature and
CDSs are typically written on specific securities issued by firms, for example public
bonds outstanding. They provide a convenient channel for hedging to lenders, even when the
financial instruments (i.e., loans) responsible for lenders’ credit risk exposures to the underlying
borrowers are distinct from the specific securities (i.e., bonds) the CDS contracts are written on.
Lenders usually make payments to CDS sellers in the form of insurance premiums expressed as
an annualized percentage of the notional value of the transaction. For example, if the CDS spread
of the underlying firm is 0.5 percent, a bank buying $10 million worth of protection from the
CDS seller must pay the seller $50,000 per year. These payments continue until either the CDS
contract expires or until the occurrence of a pre-specified credit event (e.g., default, bankruptcy,
credit-rating downgrade or restructuring). Please see Appendix II for a sample CDS contract.
CDS contracts are typically available to lenders from two types of CDS sellers: (a)
monoline insurers such as AIG and Ambac who primarily operate on the sell-side and (b)
financial institutions and hedge funds including J.P. Morgan and Goldman Sachs who serve as
market-makers. Both types of CDS sellers hedge their open risk exposures on CDSs across
various derivative instruments and across numerous investors in each instrument (Weistroffer
2009). To the extent that lenders possess private information on their borrowers’ credit-
worthiness, CDS sellers can take into account their own information disadvantage when pricing
CDS contracts (Fink 2004). Lenders pay the premium (arising out of information asymmetry) in
exchange for three potential benefits. First, CDS contracts allow lenders to transfer the credit risk
9
of the borrowing firm to the CDS seller in the event of default. For example, JP Morgan Chase
reports $48 billion in notional CDS purchases to hedge the credit risk of its loan portfolio in its
2009 Annual Report (Saretto and Tookes 2013). Second, the risk-shifting via CDS contracts
allows lenders, particularly banks, to better manage their regulatory capital since the risk weight
assigned to a loan can be based on the credit rating of the counter-party in the CDS contract
rather than the original borrower.4 Crucially, banks enjoy this benefit even in the absence of a
default by the borrowing firm. Third, unlike loan sales, CDSs allow originating lenders to
maintain lending relationships with their borrowers while reducing the risk profile of their loan
portfolios (Venokur, Magidson and Singe 2008, Saretto and Tookes 2013).
Generally CDSs are regarded as a positive financial market development, particularly for
banks. By allowing lenders to shift credit risk exposures to a third party, CDS contracts are often
viewed as facilitating better risk-sharing with the rest of the economy and economizing on
regulatory capital (Deutsche Bank Research 2009). However, a key concern has been that the
development of the CDS market can weaken lenders’ incentives to monitor borrowers, which
traditionally has been an important role of lending institutions such as banks. Similar issues exist
with other credit-risk-transfer mechanisms such as loan sales in the secondary market (Pennacchi
1988, Gorton and Pennacchi 1995, Ball, Bushman and Vasvari 2008, Bushman and Wittenberg-
Moerman 2012). The CDS market, however, differs from the loan sale market in some important
respects. In a loan sale, both the risk exposure on the loan and control rights, including the right
to monitor and administer the loans, are typically transferred to the loan buyer.5 In contrast, in a
CDS contract, the credit risk transfers to the CDS seller, but control rights remain with the
original lender. Even in cases that loan sales are partial, as when lead arrangers bring in
4 BASEL II states that guarantees issued by or protection provided by entities with a lower risk weight than the counterparty exposure is assigned the risk weight of the guarantor or protection provider. 5 Loan sales without recourse constitute the vast majority of transactions (see Gupta, Singh and Zebedee2008).
10
syndicate participants, the latter are in a better position to detect any shirking in monitoring by
the originating lender than CDS sellers, who do not have any direct access to the borrower. Thus,
the moral hazard issues are potentially more severe with CDS contracts.
2.2 Related literature
The literature on credit default swaps has centered on two predominant themes. One
stream of literature investigates whether CDS investments generate cost savings for lenders that
manifest in benefits passed on to their clients. Ashcraft and Santos (2009) examine whether CDS
trade initiation is associated negatively with interest spreads that lenders demand from their
corporate borrowers but fail to find evidence of a significant relation between the two. Saretto
and Tookes (2013) mention the following supply market frictions that CDS contracts can help
alleviate: lenders’ ability to ease regulatory capital requirements, the separation of those who are
willing to bear credit risk (CDS sellers) and those who have capital to lend (banks), the ability of
banks to maintain client relationships while simultaneously offloading portfolio risk and finally,
access to a loan resale market even for lenders who currently do not have CDS investments.
They question whether the loan spreads examined by Ashcraft and Santos (2009) are the only
dials that lenders turn when supply frictions are mitigated. Their tests reveal that S&P 500 firms
with CDS contracts trading on their debt are able to maintain higher leverage ratios and longer
debt maturities, consistent with such firms experiencing fewer supply-side frictions in obtaining
loans.
A second theme explored in the literature is the possibility that, upon acquisition of CDS
contracts, lenders ex post reduce the extent to which they monitor their borrowers (Duffee and
Zhou 2001, Ashcraft and Santos 2009, Marsh 2009, Stulz 2010, Parlour and Winton 2013). An
extreme manifestation of moral hazard in lender monitoring after CDS trade initiation is referred
11
to as the “empty creditor” problem: lenders over-insured via CDS contracts become highly
intransigent in debt renegotiations, with the objective of forcing bankruptcy or other negative
credit events that would trigger CDS payments.6
Systematic empirical evidence regarding a decline in lender monitoring upon CDS trade
initiation is limited. Marsh (2009) documents a less positive stock return reaction to borrowers
announcing new loans from banks known to transfer credit risk via collateralized loan
obligations (CLOs), consistent with the market anticipating weaker monitoring by such banks.
He does not observe the same evidence with banks known to transfer risk via CDSs, but cautions
that his sample is not well-suited to test the effect of CDSs on bank monitoring, since it excludes
firms actively traded in the CDS market. Ashcraft and Santos (2009) find that debt financing
costs are higher for risky and informationally opaque firms after the onset of CDS trading, which
they interpret as evidence of a reduction in lender monitoring among this subset of firms.
Comparing new debt agreements from the pre-CDS trade initiation period to the post-
CDS period, Sustersic (2012) finds that the latter are more likely to include financial covenants;
additionally the covenants tend to carry less “slack”, which she interprets as a bonding
mechanism that counters lenders’ incentives to decrease monitoring post-CDS-trade-initiation.
Interestingly, Sustersic (2012) finds no evidence of increased covenant violation probability in
the post-CDS period in spite of the more numerous and tighter covenants. Since these covenants
are based on numbers reported in the financial statements, Sustersic’s (2012) results raise the
possibility that borrowers are able to report less conservatively after CDS trade initiation, and
thus avoid an otherwise higher level of covenant violation. To our knowledge, the specific issue
of whether lenders reduce their scrutiny of their borrowers’ financial statements upon acquiring
6 Bolton and Oehmke (2010) and Weistroffer (2009) report specific instances of firm bankruptcy in which the empty-creditor phenomenon played a major role. Stulz (2010) recognizes this “empty creditor” problem, but calls for more research on whether credit derivatives reduce social welfare in less extreme situations.
12
CDS contracts, or whether borrowers exhibit any change in their reporting practices, is
unaddressed in the literature.
2.3 CDS contracts and underlying borrowers’ conservatism: primary hypothesis
If the onset of CDS trading indeed reduces lenders’ incentives to monitor financial
statements, we expect lenders to lower their demand for conservatism from such firms. Positive
accounting theory points to the role of accounting conservatism in facilitating debt contracting
by providing an efficient means for debt-holders to monitor their credit risk (Watts and
Ahmed et al. 2002, Gormley, Kim and Martin 2012, Tan 2013). Theoretically, since lenders face
downside risk without capturing any upside potential, conservative financial reporting can
mitigate lenders’ risks by recognizing economic losses in a timelier manner than economic gains.
Such asymmetric loss recognition timeliness ensures that borrowers’ net asset values are not
overstated and thus are more informative about borrowers’ ability to repay future debt claims
(Watts 2003). Ex post, asymmetric loss recognition timeliness can accelerate debt covenant
violations (Zhang 2008, Nikolaev 2010) and constrain dividend overpayment (Ahmed et al.
2002), thus facilitating efficient debt contracting in the presence of agency costs. Accordingly,
lenders’ exposure to downside credit risk with a capped upside payoff is expected to generate a
demand for asymmetric loss recognition timeliness (Watts and Zimmerman 1986).
When lenders acquire CDSs on firms that they have extended credit to, the asymmetric
claims arising out of their loans are modified, because of the protection the CDS contract offers
on the downside. A reasonable question that arises then is whether the mitigated loss upon
borrower default weakens lenders’ incentives to ensure that borrowers maintain conservative
reporting practices by being asymmetrically timely in recognizing losses relative to gains.
13
Lenders’ weakened incentives to monitor the conservatism in borrowers’ financial statements
can manifest in several ways, including fewer requests for timely financial statements, fewer
clarification requests regarding those statements and less frequent on-site visits to verify reported
numbers.7 Managers will likely respond to a lower lender demand for conservatism by reporting
less conservatively.
Several factors motivate managers at borrowing firms to be responsive to a perceived
reduction in lender demand for reporting conservatism. Managerial compensation is often linked
to earnings, for example via bonus plans. Conservative reporting, by delaying the recognition in
earnings of gains relative to losses, introduces a deferred component to managers’ compensation
(see for example Watts 2003, Leone, Wu and Zimmerman 2006). It is also argued that reporting
conservatism restricts managers’ ability to operate or invest in projects that are potentially
detrimental to the firm’s health but generate private benefits for managers (Ball and Shivakumar
2005, Francis and Martin 2010). In addition, Roychowdhury (2010) points to the possibility that
conservative reporting can weaken managers’ incentives to invest in risky projects. Finally,
conservative reporting can accelerate the pace of covenant violation (Zhang 2008), facilitating
earlier transfer of control to lenders. Thus, if lenders indeed reduce their demand for
conservatism, managers have incentives to respond by reporting less conservatively, either to
reduce the deferred component of their compensation or to be less constrained in their
investment decisions or to avoid covenant violation.
There are possibly other factors that influence banks’ demand for conservatism in the
context of CDS trade initiation; but the net effects of these factors are generally ambiguous. For
example, on the one hand, CDS contractual provisions can specify that the bank’s claim on the
7 As Arping (2012) argues, managers at borrowing firms can typically detect any weakening of monitoring intensity in general.
14
underlying firm is junior to those of other parties, motivating banks to retain their demand for
conservatism (Sufi 2007). On the other, such modifications in practice tend to be rare; CDS
counterparties typically rely on the International Swaps and Derivatives Association Master
Agreement to draw up contracts (see Deutsche Bank Research 2009, and the discussion of
standard CDS contracts in Appendix II). Another factor with an ambiguous implication is
reputation costs. If lead arrangers reduce their demand for conservatism after acquiring CDSs,
they may face reputation costs with current non-lead loan syndicate participants if the loans
subsequently perform poorly. On the other hand, non-lead arrangers also have easy access to
CDS contracts upon trade initiation, and subsequent poor performance is not always attributable
to lack of lender monitoring (we exploit this latter aspect of the argument in formulating cross-
sectional hypotheses in Section 2.4.1). Even if lenders protected by CDSs were to reduce their
demand for conservatism, it is possible that an offsetting demand for conservatism arises from
other parties to the firm. This is however not necessarily a foregone conclusion. Consider, for
example, CDS sellers. In practice, CDS sellers rarely are in a position to make informed
decisions regarding the effectiveness of lender monitoring of financial statements, which is
unobservable. Further, the absence of private contractual agreements between CDS sellers and
underlying borrowers limits the ability of the former to monitor borrowers on an ongoing basis
after CDS trade initiation. Rather, CDS sellers, the largest of whom are monoline insurers,
typically establish diversified portfolios of credit risk in which losses generated by one contract
are compensated by premiums earned from other contracts. In particular, CDS sellers typically
write protection policies for both lenders seeking to manage their credit exposures and
speculators. Thus, even though CDS sellers are likely to charge premiums that are high enough
to price-protect against informed CDS buyers and also against any moral hazard issues in
15
monitoring on the part of lenders seeking to hedge, the price-protection is shared by both
speculators and informed CDS buyers (such as lenders). In stark contrast to risk-diversified CDS
sellers, bank loan portfolios are typically concentrated, for example, within business sectors and
geographic regions (Duffee and Zhou 2001, Morrison 2005). Moreover, credit risk exposure to
individual borrowers reduces bank regulatory capital not necessarily true of insurance
companies. Thus, CDS sellers have a greater tolerance for credit risk than lenders (particularly
lenders facing regulatory capital constraints), with the consequence that any price protection by
the former is unlikely to be too severe to deter the latter from entering into CDS contracts. This
creates a plausible situation where lenders acquire CDS contracts, reduce their demand for
conservatism ex post, and the reduced demand is not offset by CDS sellers.
Given the institutions-driven nature of the CDS market, the class of lenders most likely to
invest in CDSs for hedging comprises banks with private loan exposures (see Appendix 1). Such
banks are also typically the most specialized monitors of accounting practices of borrowers, and
are widely thought of a primary source of demand for conservatism (Zhang 2008, Tan 2013).
Our study focuses on CDS trade initiation with the objective of isolating any changes in the
demand for conservatism on the part of lenders newly protected by CDS contracts. It is possible
that the demand for conservatism arising from parties other than banks is also altered with the
availability of CDS contracts and the possibility of banks investing in such contracts; such
parties include shareholders (with the board of directors and auditors as their fiduciary agents)
and public debt-holders not invested in CDSs. An empirical observation of no change in
conservatism upon CDS trade initiation would indicate that even if there was a decline in the
demand for conservatism by banks, it was substituted for by an offsetting demand for
conservatism from other stakeholders to the firm. If, however, we were to observe a decline in
16
conservatism upon CDS trade initiation, two interpretations are possible. One is that banks
reduce monitoring after acquiring CDS contracts and bank monitoring is not replicable by other
stakeholders to the firm. The other interpretation is the following: in the presence of asymmetric
payoffs on their loans, it is possible that banks require a level of conservatism that is higher than
the equilibrium level that would be demanded by other stakeholders to the firm. As a
consequence when lenders’ asymmetric payoffs and their demand for conservatism are mitigated
by the acquisition of CDS contracts, conservatism declines.
In the presence of these multiple possibilities, we treat the change in borrower
conservatism after CDS trade initiation as an open empirical question. Accordingly, we test the
following null hypothesis:
H1 (null): The onset of CDS trading in a firm is not associated with a reduction in the firm’s reporting conservatism.
2.4 CDS contracts and underlying borrowers’ conservatism: cross-sectional hypotheses
2.4.1 The role of reputation costs
Conservatism is hypothesized to constrain activities that can reduce debt-holders’ wealth,
for example, asset substitution, excessive dividend payments and overinvestment. Lowering the
demand for conservatism can thereby increase credit default risk. Even if lenders are at least
partially protected against the financial consequences of such defaults by virtue of the CDS
contracts, they can face reputation costs upon borrower default or any other negative credit
event.
We expect that lenders’ incentives to lower monitoring of financial statements after
entering into CDS contracts are greater when reputation effects that would discourage them from
reducing monitoring are weaker. To identify situations in which concerns regarding loss of
17
reputation are less effective in providing lenders the impetus to maintain monitoring even after
hedging their loan exposures, we rely on existing literature. In their theoretical work, Parlour and
Winton (2013) argue that reputation effects in the CDS market will be weaker when riskier
borrowers are involved. The intuition is as follows: if borrowers already deemed to be riskier
were to default or experience any other credit event, it is more difficult for external parties to
attribute this negative outcome to a lack of lender monitoring. Consequently, lenders are more
likely to reduce monitoring of riskier borrowers after shifting the credit risk. The evidence in
Ashcraft and Santos (2009) suggesting a more pronounced decline in lender monitoring among
riskier borrowers post CDS-trade initiation is consistent with Parlour and Winton (2013). These
arguments appear to apply in the loan syndication market as well. Gopalan, Nanda and
Yerramilli (2011) find that reputation loss suffered by lead arrangers of syndicate loans in the
event of borrower bankruptcies is lower when outstanding loans to the insolvent borrowers
already have high yields (consistent with these loans already being deemed as high-risk). They
reason that in such cases, bankruptcies are less attributable ex post to inadequate monitoring on
the part of lead arrangers.
Given the evidence in both the CDS and loan syndication markets, we expect any decline
in conservatism after CDS-trade initiation to be more pronounced for riskier borrowers with
more opaque information environments. Firms that are respectively smaller in size and have
credit ratings below investment grade are likely to be riskier firms with lower-quality
information environments. Thus, we test the following prediction on cross-sectional variation in
the post-CDS decline in borrower conservatism:
H2 (null): Change in borrower conservatism after the onset of CDS trading is not any more pronounced for smaller borrowers and borrowers with credit rating below investment grade.
18
2.4.2 The role of covenants
Existing studies argue that conservatism in financial statements and financial covenants
in debt contracts play a joint role in lender monitoring. Zhang (2008) documents that firm who
report more conservatively are timelier in violating covenants upon the realization of a negative
event, proxied for by a negative price shock. Ex ante, firms reporting with greater conservatism
appear to enjoy lower interest rates from their lenders, suggesting that lenders consider
conservatism as a desirable trait in financial statements. Nikolaev (2010) documents a positive
association between financial reporting conservatism and the presence of financial covenants in
public debt contracts, interpreting this evidence as indicative of the complimentary role they play
in facilitating timely transfer of control to lenders.
If CDS trade initiation is associated with reduced lender-scrutiny of borrowers’ reporting
practices, then borrowers are expected to be more responsive to this reduced scrutiny when the
expected costs of maintaining those practices are higher. Since conservatism is more likely to
facilitate transfer of control to lenders in the presence of financial covenants, we expect
borrowers to have the greatest incentives to lower conservatism when their existing debt
contracts at the time of CDS trade initiation include more financial covenants. In formulating our
hypothesis, we focus on the number of financial covenants in private debt contracts with banks.
Private debt contracts are much more likely to include financial covenants than public debt
(Begley and Freedman 2004, Chava and Roberts 2008), and banks/financial institutions are also
more likely to hedge their underlying exposures via sophisticated derivative instruments such as
CDSs (Acharya and Johnson 2007).
H3 (null): Change in borrower conservatism after the onset of CDS trading is not any more pronounced for borrowers with a larger number of financial covenants in their existing private debt contracts at the time of CDS trade initiation.
19
3. Sample Selection
3.1 Firms with traded CDS contracts
CDS contracts are traded in the over-the-counter (OTC) market, almost entirely
populated by institutional investors. Unlike an organized exchange such as the NYSE, the
information on CDS trading must be gathered from market participants on the basis of their
voluntary participation in periodic surveys. We collect information on CDS contracts from
Datastream. Datastream covers approximately 13,000 single-name CDS contracts for firms
domiciled in 70 countries. Among U.S. firms, there are 8,041 single-name CDS contracts with
either senior debt (93%) or subordinated debt (7%) as the underlying securities.8 Datastream
collects CDS data from two main sources: CMA Datavision CDS series and Thomson Reuters
CDS series. We only focus on the CMA CDS series because Mayordomo, Pena and Schwartz
(2011) find that CMA database quotes lead the price discovery process relative to quotes
provided by other databases including Markit, GFI, Reuters EOD and JP Morgan. CMA in turn
collects data directly from the trading desks of buy-side CDS market participants. Note that the
CMA series are no longer offered through Datastream after the 3rd quarter of 2010. This change
does not affect our empirical analysis, as our sample period ends in 2009.
We identify 1,193 U.S. firms that have single-name CDS contracts traded between
January 2002 and December 2009. The CDS sample ends in 2009 to facilitate computation of
asymmetric timeliness of loss recognition for at least one year after CDS trade initiation for all
firms in the sample. For each of these firms, we identify the first fiscal year that the firm trades at
8 Single-name CDS contract is one where there is just one reference entity. The reference entity can be any borrower, but is most often one of a few hundred widely traded companies (corporate or financials) or a handful of governments (sovereigns). The CDS contract that we are interested in is the single-name one where the reference entity is a corporation. In addition to the single-name CDSs, there are basket default swaps (BDSs), index CDSs, and funded CDSs (also called a credit-linked notes) etc.
20
least one US-dollar-denominated CDS contract. We merge these 1,193 firms with Compustat and
CRSP to collect financial variables used in the subsequent empirical analyses.9 After deleting
financial firms and requiring all firms to have at least one observation during both pre- and post-
CDS trade-initiation periods, we are left with 529 unique U.S. non-financial firms with required
financial variables.
3.2 Matched control firms
The initiation of CDS contracts balances credit risk preferences between the protection
seller and the protection buyer. In particular, firms’ credit risk and growth opportunities
potentially influence the demand and supply of CDS contracts (Ashcraft and Santos 2009). To
address this sample selection issue, we follow Aschcraft and Santos (2009) and implement the
propensity score matching methodology developed in the literature. Specifically, we augment the
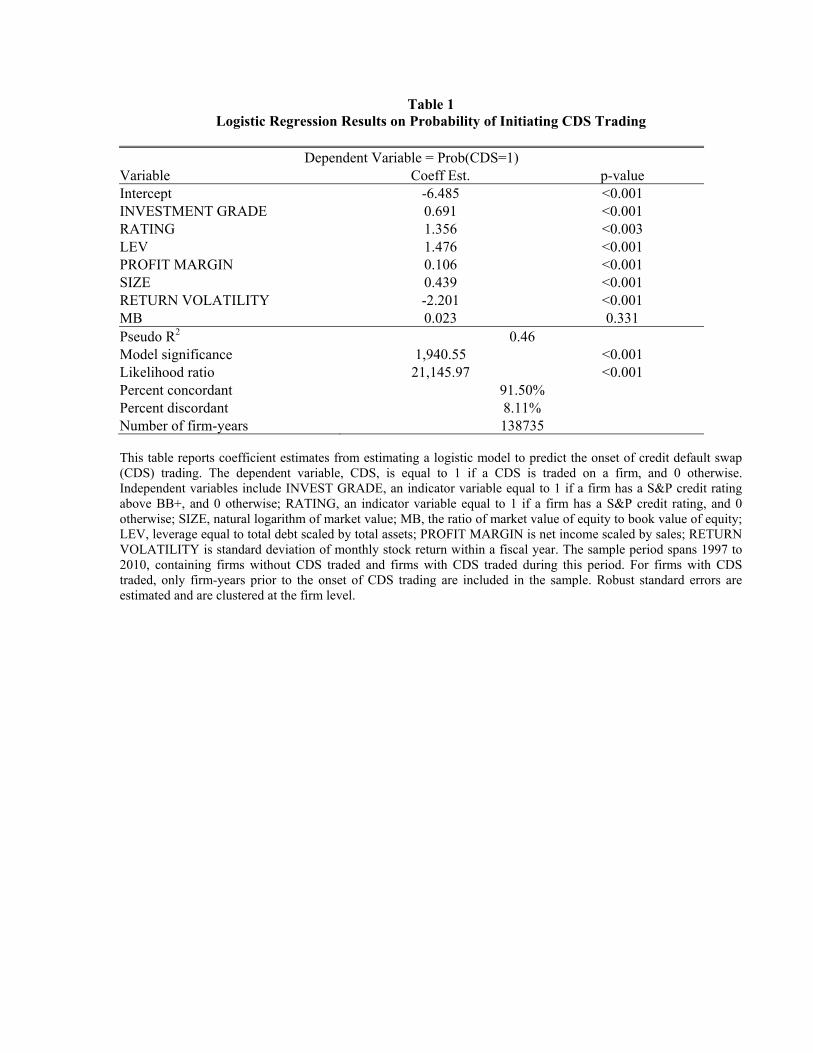
model in Ashcraft and Santos (2009) and estimate the following logistic model to predict the
initiation of CDS trading (firm subscripts are suppressed for brevity):
where CDS is an indicator variable equal to one for firms with CDSs traded between 2002 and
2009, and zero otherwise. We include INVESTMENT GRADE, RATING, LEV, and
PROFITMARGIN to account for firms’ credit risk. INVESTMENT GRADE is an indicator
variable equal to one if a firm has an S&P credit rating above BB+, and zero otherwise.
RATING is an indicator variable equal to one if a firm has an S&P credit rating, and zero
otherwise. We have tested robustness to using an ordinal variable capturing the credit rating of
9 The 1,193 firms include multiple subsidiaries for the same parent holding firms. For such firms, we collect financial variables for the parent holding firms only when merging with the Compustat and CRSP databases.
21
the firm, in lieu of the indicator variables INVESTMENT GRADE and RATING. All our
subsequent results are robust to this alternative specification of the first stage model.
LEV is book leverage, equal to a firm’s total debt (short-term debt plus long-term debt)
scaled by total assets. PROFIT MARGIN is net income scaled by sales. We also include firm
size (SIZE), return volatility (RETURN VOLATILITY), and market-to-book ratio (MB) to
consider the effect of overall information environment and growth opportunities on the demand
and supply of CDS contracts. SIZE is the natural logarithm of market value of equity. RETURN
VOLATILITY is standard deviation of monthly stock return within a fiscal year, and MB is the
ratio of market value of equity to total assets. For the sake of stable estimation, we use all
Compustat firms with available information during the period 1997-2009. Specifically, for firms
that do not have CDS traded by the end of 2009, we utilize all firm years from 1997 to 2008
when estimating Equation (1). For firms with CDS trading initiated during 2002-2009, we
include observations from 1997 up to the last fiscal year prior to the CDS-trade-initiation year in
estimating Equation (1).
Table 1 reports regression results of estimating Equation (1). As shown, the model
specified in Equation (1) predicts the onset of CDS trading well, as evidenced by good model fit,
high proportion of concordant pairs (91.5%) and low proportion of discordant pair (8.1%). The
results indicate that firms with higher credit rating, leverage, profit margin and market cap, along
with lower stock return volatility are more likely to have CDS trade initiation during the sample
period. These findings are generally in line with an adverse selection explanation: given banks
(potential protection buyers) possess superior private information about the debt instruments that
they originated, the protection seller is more likely to offer CDS contracts for firms with lower
credit risk (that is, firms with higher credit rating and higher profit margin) and a more
22
transparent information environment (such as that of larger firms). The positive relation between
leverage and the likelihood of CDS trade initiation suggests greater market demand of credit risk
protection (via CDS contracts) for high leverage firms.
Next, we utilize a propensity score matching procedure to construct a control sample of
non-CDS firms (i.e., firms with no CDSs trade during the sample period). Specifically, based on
the estimation results of Equation (1), we obtain the estimated likelihood of CDS trade initiation
for all Compustat firms. For each CDS firm (i.e., firms with a CDS trade during the sample
period), we identify three non-CDS firms within the CDS firm’s two-digit SIC industry that have
the closest estimated likelihood to the CDS firm. The comparison of estimated likelihoods is
made in the fiscal year prior to the year of CDS-trade-initiation.10 We allow the same non-CDS
firm to be matched to multiple CDS firms to minimize the distance in their propensity score.11
The propensity score matching procedure generates 525 unique non-CDS-firm matches for the
529 CDS firms.
3.3. Descriptive statistics
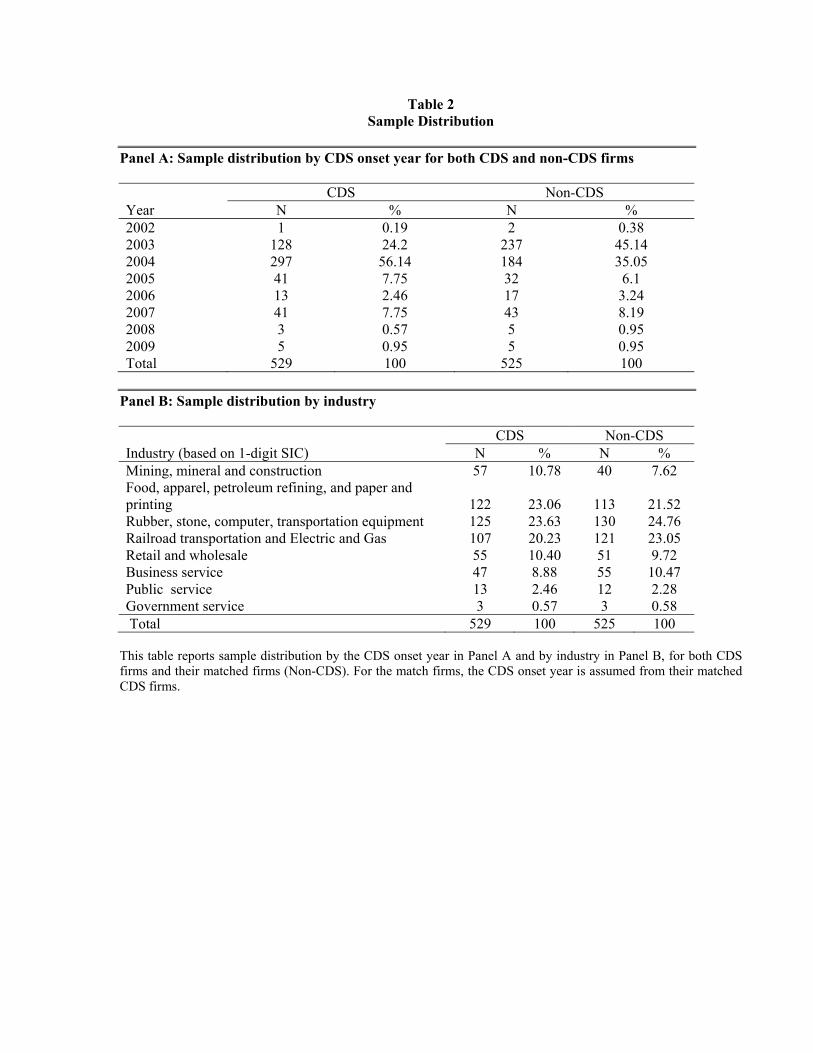
Table 2 Panel A presents the sample distribution based on the CDS-trade-initiation year
for the CDS sample and the matched non-CDS sample. The year 2004 witnessed the largest
number of firms with CDS trade initiation (297 firms, or 56.1% of the CDS sample). The number
of CDS trade initiations quickly declined afterwards for two reasons. First, since we select only
the first traded CDS contract for each underlying firm, by construction we will observe a decline
in the number of CDS trade initiation over time. Second, the drastic decline may also foreshadow
the looming financial crisis — by the end of 2008, CDS trades were initiated on only 3 new
10 Our process of identifying more than one matching non-CDS firm for every CDS firm is similar to that in Lee (1997) and Chen and Martin (2011). 11 We limit the distance in their propensity score within 20%. As a result, some CDS firms may have fewer than three matching non-CDS firms.
23
firms (0.6% of the CDS sample). By construction, we observe similar distribution for non-CDS
firms. Table 2 Panel B reports the sample distribution by industry. As shown, CDS firms are
primarily concentrated in the rubber, stone, computer, and transportation equipment industries
(23.6% of the CDS sample). In addition, 23.1% of all CDS firms belong to the food, apparel,
petroleum refining, and paper and printing industries, while 20.2% belong to the railroad
transportation and electric and gas industries.
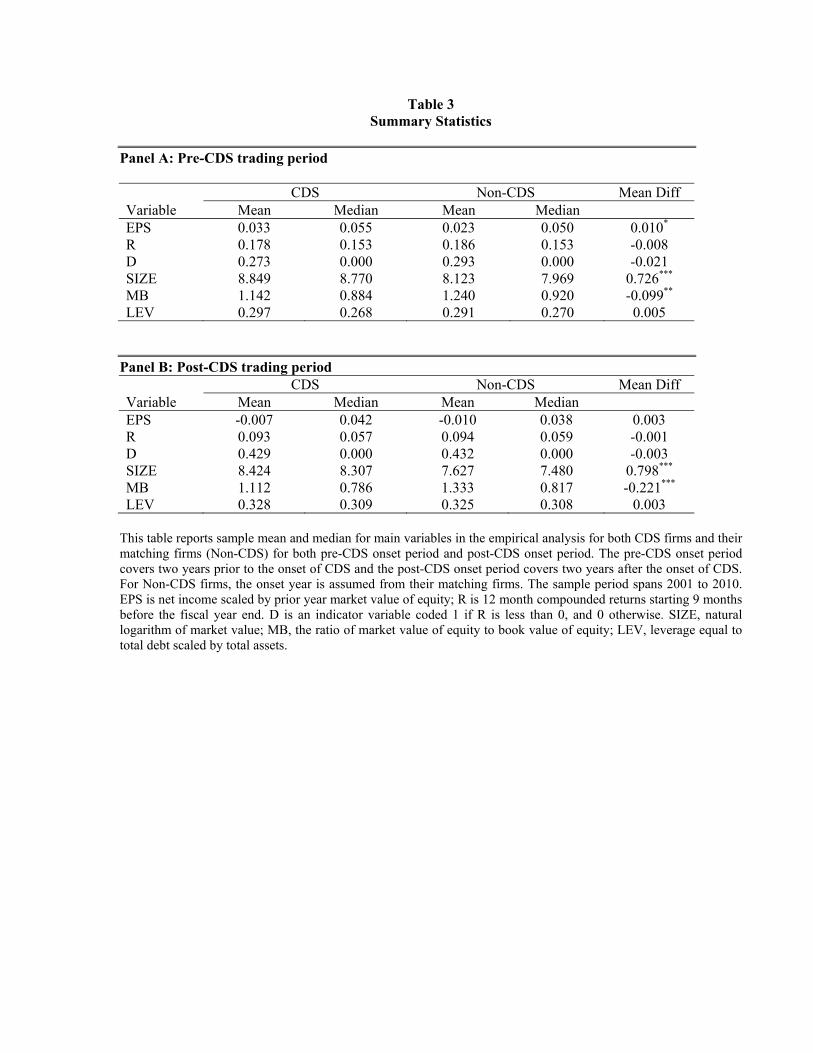
Table 3 reports descriptive statistics of variables used in subsequent analyses across the
CDS sample and the matched non-CDS sample. The two samples exhibit characteristics that are
generally similar in economic magnitudes. However, there are a few statistically significant
differences between the two samples. During the two-year period prior to CDS trading, CDS
firms have slightly better earnings performance. In addition, CDS firms are significantly larger in
market capitalization and exhibit lower growth potential (lower MB).12 The differences in firm
size and growth between CDS firms and non-CDS firms are similar during the two-year period
after the onset of CDS trading, although earnings performance becomes statistically similar
between these two groups of firms. The similar magnitudes of differences between firm
characteristics across CDS and non-CDS firms in Panels A and B suggest that these
characteristics are unlikely to be driving the increasing difference in conservatism between CDS
and non-CDS firms as one moves from Panel A to Panel B.
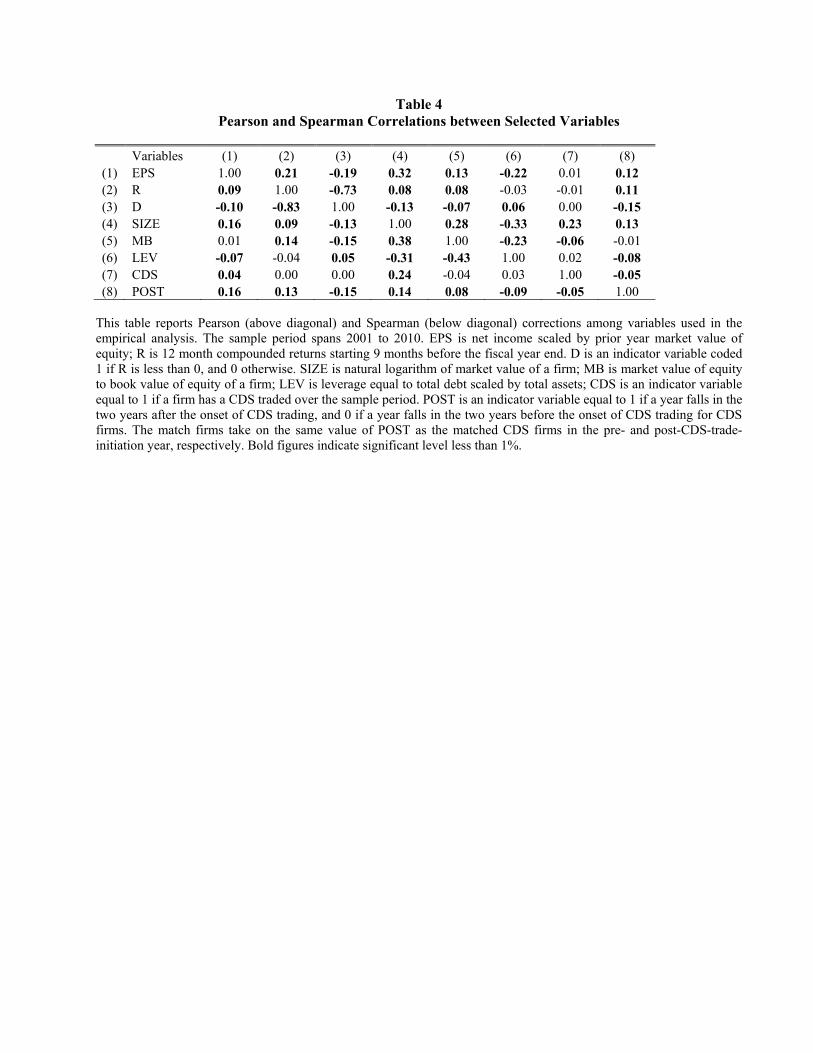
We report Pearson and Spearman correlations among variables used in our empirical tests
in Table 4. As shown in Column (7), the correlations between CDS (an indicator variable equal
to one for CDS firms, and zero for non-CDS firms) and earnings performance, firm size, growth,
and leverage confirm the univariate patterns observed in Table 3.
12 Note that the propensity score match controls for the extent to which a combination of these firm characteristics (SIZE, MB, LEV) contribute to the propensity of CDS trading initiation, rather than the individual characteristics.
24
4. Empirical Methodology
4.1 Measurement of accounting conservatism
The aspect of conservatism we are interested in is the asymmetric timeliness of earnings
in recognizing losses versus gains. We measure conservatism using the method developed in
Basu (1997), that is, the greater timeliness of earnings with respect to negative returns relative to
positive returns, which serves as our primary measure of conservatism. We follow Basu (1997)
in estimating the following pooled cross-sectional model with standard errors clustered at the
firm level (firm subscripts are suppressed for brevity):
EPSt = β0 + β1 Dt + β2 Rt + β3 Dt × Rt + t (2)
where EPS is net income for fiscal year t scaled by year-beginning market value of equity; R is
the 12-month compound stock returns ending three months after the end of fiscal year t; D is a
indicator variable equal to one if R is negative, and zero otherwise.
Basu (1997) proposes that stock returns (R) proxy for economic gains and losses. In the
above model, the sensitivity of earnings to economic gains is captured by β2 and the sensitivity of
earnings to economic losses is captured by (β2 + β3). If verification standards imposed for
recognizing losses are lower than those imposed for recognizing gains, earnings will recognize
economic losses in a timelier manner than economic gains. Hence, the association between
earnings and stock returns should be incrementally higher when stock returns are negative, i.e.,
β3 > 0 (Basu 1997). We thus use β3 to measure the extent to which earnings are reported
conservatively.
In the robustness tests, we also use Basu (1997)’s earnings time-series model to measure
asymmetric timeliness of loss recognition.
4.2 Research design
25
We use difference-in-difference method to design all empirical tests. Specifically, to
examine the influence of CDS trade initiation on accounting conservatism, we expand Basu’s
(1997) baseline model as specified in Equation (2) by including two indicator variables: the first
identifies whether a firm has at least one CDS traded over the sample period and the second
captures whether a firm-year observation falls in the two-year period after CDS trade initiation.
We estimate the following model using ordinary least square regression with standard errors
clustered at the firm level to account for serial correlation within a firm (Petersen 2009).13
EPSt = β0 + β1 Rt + β2 Dt + β3 Dt × Rt
+ β4 CDS + β5 CDS × Rt + β6 CDS × Dt + β7 CDS × Dt × Rt + β8 POST + β9 POST × Rt + β10 POST × Dt + β11 POST × Dt × Rt
+ β12 CDS × POST + β13 CDS × POST × Rt + β14 CDS × POST × Dt
+ β15 CDS × POST × Dt × Rt + λ ADDITIONALCONTROLS
+ ∑ γ INDUSTRY + ∑ δ YEAR + t (3)
where CDS is an indicator variable equal to one for firms with a CDS traded during the sample
period, and zero for matched control firms. POST is an indicator variable equal to one (zero) if
an observation falls in the two-year period following (preceding) CDS trade initiation for both
the CDS firm and its matched control firms. Industry and year fixed effects are included. All the
other variables are as defined in Equation (2). To ensure that the results are not entirely driven by
matched control firms, we also estimate Equation (3) for CDS firms only (thereby dropping all
terms relating to the indicator variable CDS).
Prior studies suggest that firm size, market-to-book ratio, and leverage may affect
accounting conservatism (e.g., Basu 1997, Basu et al. 2001a and 2001b, LaFond and
Roychowdhury 2008, LaFond and Watts 2008). Therefore, we include these firm characteristics
and their interactions with the three terms in Basu’s (1997) model in Equation (3) as additional
13 Results are quantitatively similar if we cluster the standard errors at the year and two-digit SIC industry levels.
26
control variables.
Our primary interest is the effect of CDS trade initiation on asymmetric timeliness of loss
recognition (H1). Hence, we test whether the coefficient β15, which captures the change in
accounting conservatism of CDS firms relative to their matched firms, is significantly different
from zero. Since we interact D×R with both POST and CDS, we essentially have a differences-
in-differences approach towards testing our hypotheses. In other words, we examine the change
in conservatism in response to CDS trade initiation, and compare that to changes in conservatism
in the same time period for a group of control firms matched on the propensity of CDS trade
initiation.
In testing H2a and H2b, we estimate Equation (3) across various subsamples constructed
along the dimensions as predicted in the hypothesis. For instance, to examine whether the change
in conservatism around CDS trade initiation varies with the riskiness of the underlying borrower,
we partition the sample based on whether the borrower’s credit rating is above or below
investment grade. Subsequently, we test whether the coefficient β15 is significantly different from
zero for each sub-sample of firms based on the above partition. The partitioning variables are
discussed in greater detail in the following section.
5. Empirical results
5.1 Primary hypothesis
Table 5 reports regression results on the change in asymmetric loss recognition timeliness
around the onset of CDS trading. The first two columns of Table 5 summarize results of
estimating Equation (3). As shown, the coefficient on D×R is significantly positive (coefficient =
1.216, p-value <.001), suggesting that non-CDS firms are more timely in recognizing economic
27
losses than economic gains in the two-year period prior to CDS trading. The coefficient on
CDS×D×R, which captures the difference in conservatism between CDS and non-CDS firms
prior to the initiation of CDS trading, is positive and statistically significant (coefficient = 0.231,
p-value = 0.015). Hence, prior to CDS trading, CDS firms exhibit higher levels of accounting
conservatism than their matched non-CDS firms.
Comparing the pre-trading period with the post-trading period, non-CDS firms appear to
have no change in the timeliness of recognizing economic losses in the two-year period after
CDS trading, as evidenced by the statistically insignificant coefficient on POST×D×R
(coefficient = -0.012, p-value = 0.884). Importantly, we find a significantly negative coefficient
on CDS×POST×D×R (coefficient = -0.295, p-value = 0.036), suggesting that relative to matched
control firms, CDS firms reduce asymmetric timeliness in loss recognition after the onset of CDS
trading. The combined coefficient on CDS×POST×R and CDS×POST×D×R (-0.254) is
significantly negative, indicating that CDS firms also experience a significant decline in overall
(and not just asymmetric) timeliness of loss recognition after CDS trade initiation compared to
their match firms. These findings reject the null and support the notion that CDS firms
experience a decline in accounting conservatism around the initial years of CDS trading.
Economically, the incremental decline in asymmetric timeliness for CDS firms relative to non-
CDS firms is about 20 percent of the accounting conservatism level of the CDS firms before the
onset of CDS trading (=0.295/(1.216 + 0.231)). This appears to be an economically significant
effect, even though in magnitude it is lower than the 46 percent increase in conservatism
following a restatement of earnings, implied by the findings in by Ettredge, Huang and Zhang
(2012).
28
Next, we estimate Equation (3) for CDS firms only to ensure that our findings are not
driven by the change in accounting conservatism for matched control firms. We therefore
exclude all terms related with the indicator variable CDS and control for several firm attributes
that may affect accounting conservatism. The last two columns of Panel A report the estimation
results. We find that the coefficient on POST×D×R is significantly negative, supporting the
notion that CDS firms experience a decline in accounting conservatism after the onset of CDS
trading.
Taken together, results presented in Table 5 suggest that regardless of whether CDS firms
are benchmarked with matched control firms or are used as their own controls, they become less
asymmetric timely in reporting economic losses after the onset of CDS trading. Thus, CDS trade
initiation has a net negative effect on accounting conservatism by borrowing firms.
5.2 Cross-sectional hypotheses
5.2.1 The role of reputation costs
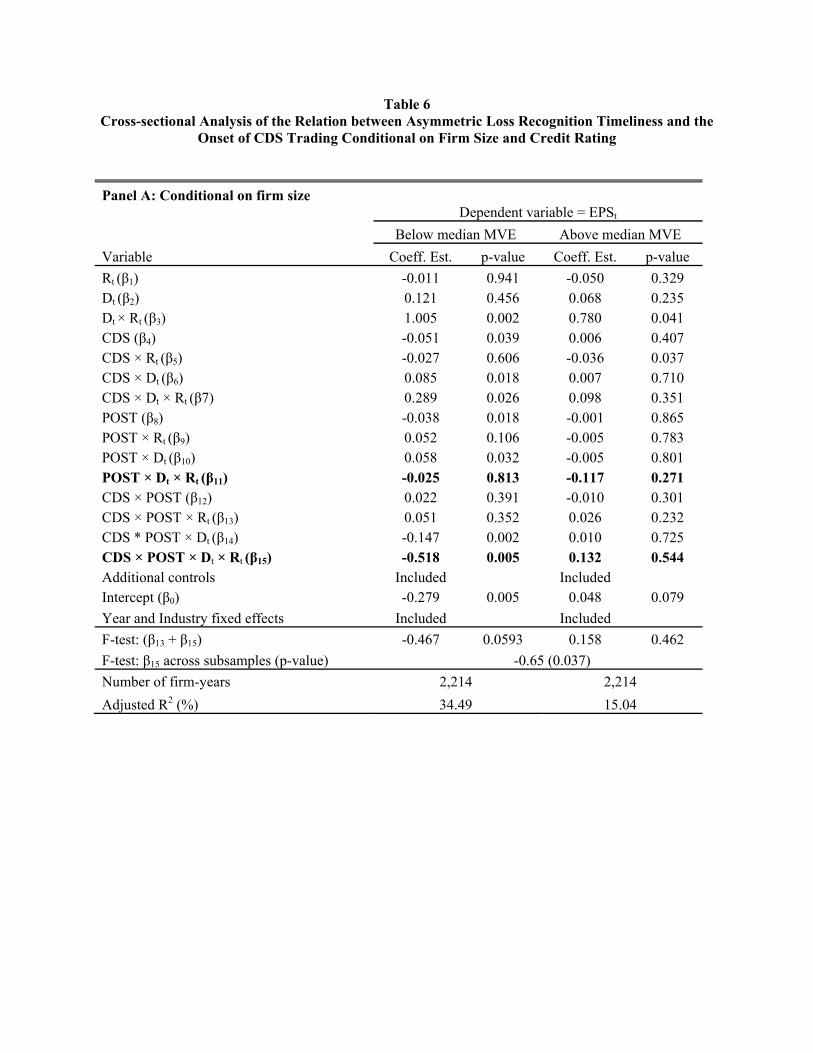
To test H2, we examine whether the change in accounting conservatism around CDS
trading initiation varies with firm size, and credit rating. We partition our sample of treatment
and control firm-years into two groups based on size and credit rating and estimate Equation (3)
within each subsample.
Table 6, Panel A presents results for two sub-samples partitioned based on size –
specifically, firms below median market value of equity and those above. As shown, the
coefficient on CDS×POST×D×R is significantly negative for firms with below median market
value (coefficient = -0.518, p-value = 0.005), but insignificant for firms with above median
market value (coefficient = 0.132, p-value = 0.544). An F-test of the statistical difference in this
coefficient estimate across these two subsamples yields a p-value of 0.037.
29
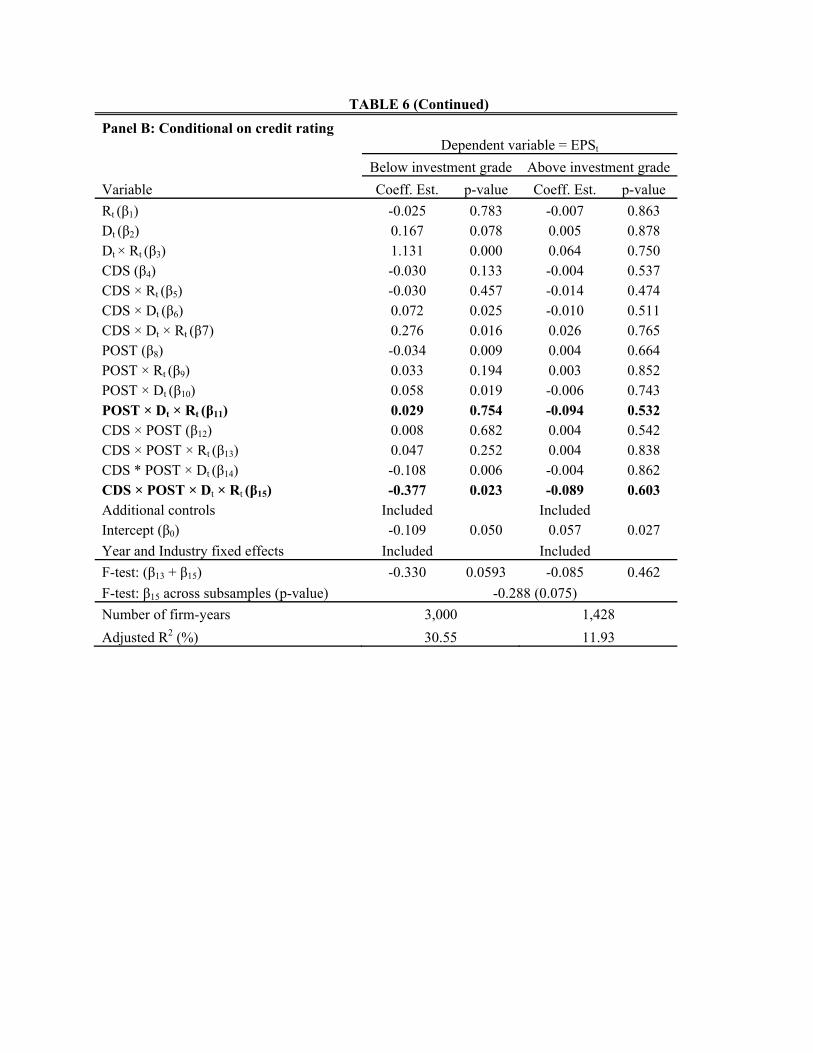
Panel B presents results for two sub-samples partitioned based on S&P long-term credit
rating – specifically, firms below investment-grade rating and those above. We find that the
coefficient on CDS×POST×D×R is significantly negative for firms with below investment grade
ratings (coefficient = -0.377, p-value = 0.023). We observe a smaller and insignificant decline in
conservatism for firms with credit rating above investment grade (coefficient = -0.089, p-value =
0.603). The difference in the decline in conservatism between the two groups is significant at the
10% level.
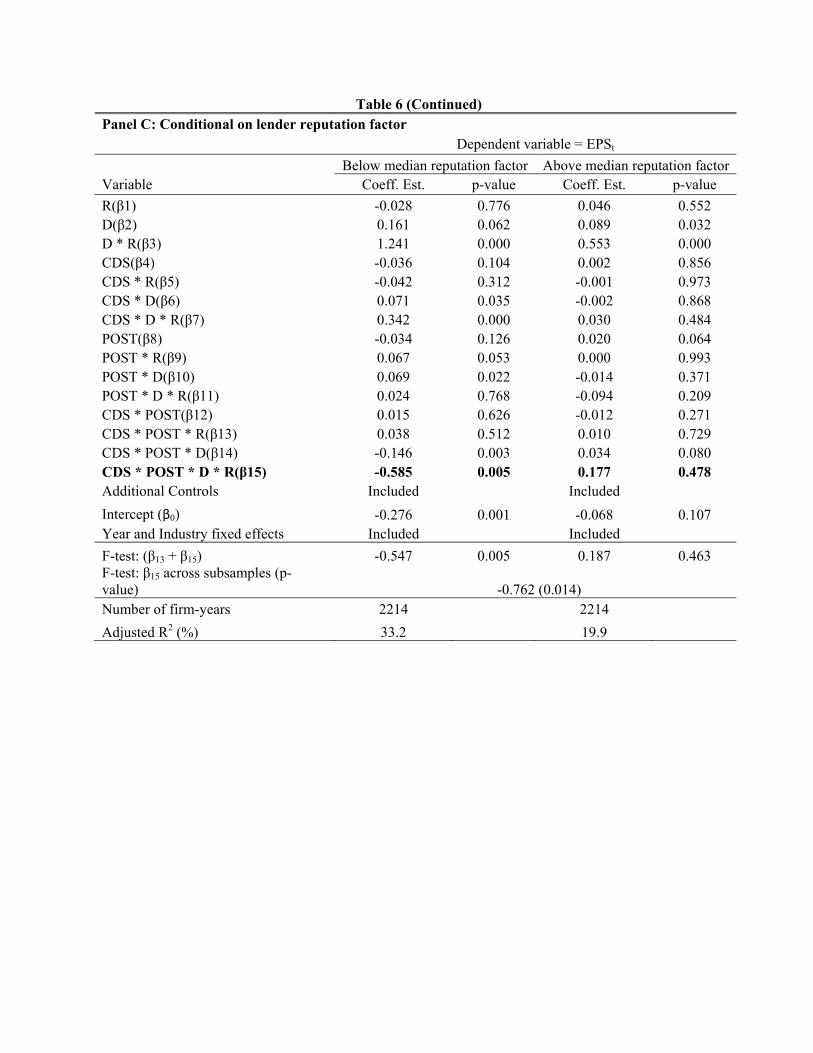
In Panel C we construct a common factor, Reputation Factor, based on both firm size and
credit rating using the principle-components analysis method. Size is defined as natural
logarithm of market value of equity. Credit rating is defined by an ordinal variable ranging
between 1 (AAA) and 19 (CCC-) for firms with S&P long term debt rating; we assign a value of
20 for firms in default stage, and 21 for firms with no debt rating. The common factor thus
captures the contribution of both size and credit rating to ex ante risk of borrower default, which
is expected to be associated negatively with lenders’ incentives to maintain post-CDS monitoring
out of concern for reputation costs. As constructed, Reputation Factor varies positively with size
and negatively with credit rating. We partition the sample based on whether the value of
Reputation Factor for a particular firm-year is above or below the median value for that year.
The results show that the coefficient on CDS×POST×D×R is significantly negative for firms
with low Reputation Factor (coefficient = -0.585, p-value < 0.005), but insignificant for firms
with high Reputation Factor (coefficient = 0.177, p-value = 0.478). An F-test of the statistical
difference in this coefficient estimate across these two subsamples yields a p-value of 0.014. The
decline in conservatism for CDS firms when their lenders are likely to bear lower reputation
30
costs is about 35% of their conservatism level in the pre-CDS period (=(-0.585 + 0.024)/(0.342
+ 1.241)).
The results in Panels A, B and C collectively indicate that the post-CDS decline in
borrower conservatism is more pronounced when banks entering into CDS contracts face lower
reputation costs (as in borrowers with smaller size and poorer credit ratings) from reducing
monitoring.
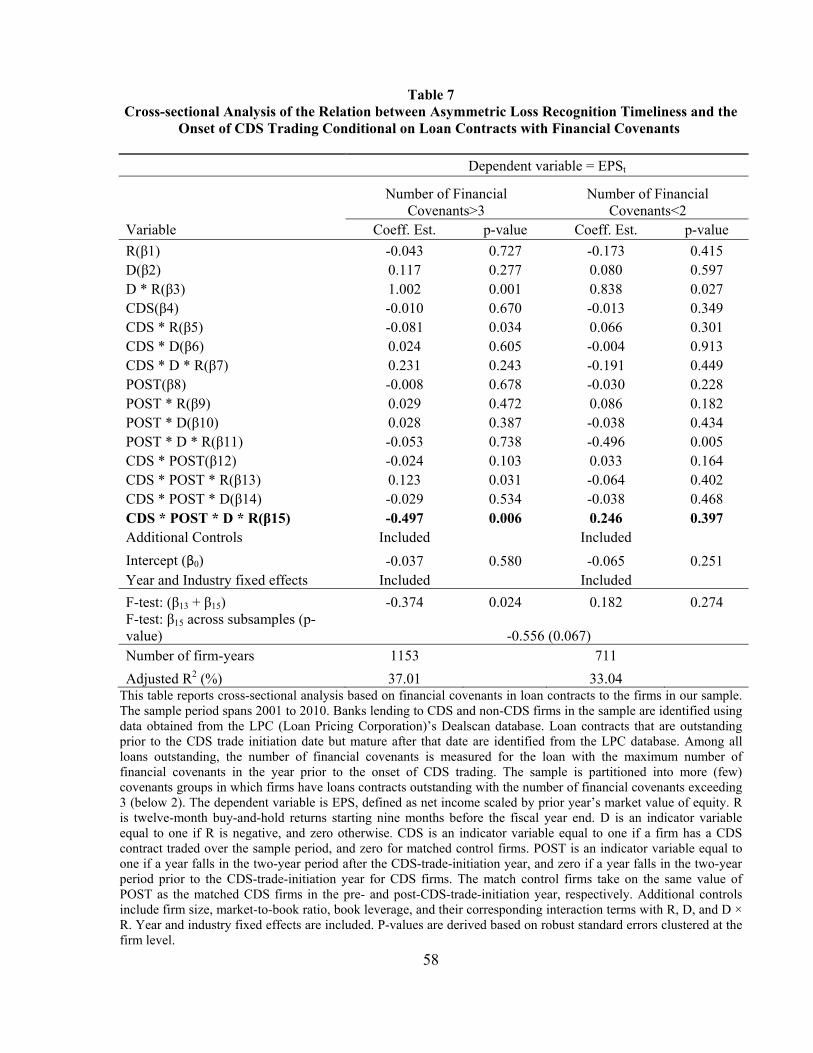
5.2.2 The role of covenants
In examining the role of covenants, we first identify the number of financial covenants in
firms’ private debt contracts from the LPC (Loan Pricing Corporation)’s Dealscan database. Due
to data availability requirements, we are left with a smaller sample size of 3,074 firm-years
containing 417 unique CDS firms and 317 unique matched non-CDS firms. For every firm with
all loan contracts outstanding in the fiscal year prior to CDS trade initiation and mature after
CDS trade initiation, we consider the loan contract with the maximum number of financial
covenants because this number likely represents the binding covenant intensity. Subsequently we
partition the sample based on whether the number of loan covenants exceeds the sample top
quartile (i.e., number of covenants >3) or whether that number is below the bottom quartile (i.e.,
number of covenants < 2). Table 8 reports results for this partition. Firms exhibit a much more
prominent decline in conservatism when the number of financial covenants in existing loan
contracts at the time of the CDS trade initiation is above the 75th percentile. From an economic
perspective, the accounting conservatism of CDS firms declines about 45% relative to their pre-
CDS trade initiation period. When the number of financial covenants in existing loan contracts at
31
the time of the CDS is below the 25th percentile, firms do not exhibit a significant decline in
conservatism.
5.3 The issue of bank identity
Although CDS contracts were initially designed to enable lenders such as banks to hedge
their credit risk exposures, they are also available for trade to speculators and indeed, to banks
for speculation (Stulz 2010, Lewis 2010). Nonetheless, there is evidence that banks are
increasingly using the CDS market to hedge the credit exposures they originate through their
lending business.14 Firms can observe CDS trade initiation on their own outstanding bonds, but
they do not necessarily observe the timing of their lending banks’ investments into specific CDS
contracts. However, any decline in lenders’ scrutiny of financial statements is probably apparent
to borrowers, as already discussed in Section 2.3. Since lenders are likely to lower their scrutiny
of financial statements only after entering into CDS contracts, we expect any decline in borrower
conservatism post CDS-trade-initiation to be more pronounced when banks hedge their credit
exposures via the newly-available CDSs.
We first identify banks with outstanding loans to the CDS firms and the matched control
firms in our sample. The partial effect for a bank of investing in a CDS contract on a borrower
would be to lower the risk weight assigned to the loan on that borrower and to increase the
bank’s CDS holdings.15 However, it is difficult to observe the effect of a CDS contract on a
single borrower on the bank’s risk-weighted assets or on its CDS portfolio. Rather we employ a
reverse approach. For each bank, we can observe whether there is a change in the proportion of
14 According to a survey by the British Bankers Association (2006) half of the protection banks bought in the CDS market in 2005 and 2006 were to cover exposures resulting from their lending activities. 15 Loans to corporate entities are assigned a risk weight between 20% and 150% under the standardized approach to credit risk. The risk weight declines if the bank is hedged on its exposure to a specific borrower via CDS contracts if the credit rating of the CDS sellers is higher than that of the borrower.
32
total assets bearing a risk weight lower than 100% in a given year, and also whether their overall
CDS holdings increases/decreases in any given year. We reason that banks for whom the
proportion of assets weighted at lower than 100% rises, or banks that exhibit an increase in
overall CDS holdings, in the same year as CDS trade initiation on an underlying borrower are
more likely to have hedged their exposure to the specific borrower via the newly available CDS
contracts.
In Table 8 Panel A we present results for two sub-samples partitioned based on whether
there was an increase in the proportion of banks’ assets risk-weighted at lower than 100% in the
same year as CDS trade initiation. We identify banks lending to CDS and non-CDS firms in our
sample using data obtained from the LPC (Loan Pricing Corporation) Dealscan database, and the
risk weights on banks’ assets from Federal Reserve’s Y-9C reports. We find that the coefficient
on CDS×POST×D×R is significantly negative for firms whose banks exhibit an increase in the
proportion of assets that bear risk weights lower than 100% (coefficient = -0.452, p-value =
0.003), but is actually positive and statistically significant for firms whose banks do not exhibit
an increase in the proportion of assets that bear risk weights lower than 100% (coefficient =
0.286, p-value = 0.028). An F-test of the statistical difference in this coefficient estimate across
these two subsamples yields a p-value of 0.003.
Table 8, Panel B presents results for two sub-samples partitioned on whether banks
exhibit an increase in CDS portfolio holdings in the same year as CDS trade initiation on
underlying borrowers. CDS portfolio holdings of banks are obtained from Federal Reserve’s Y-
9C reports. As shown, the coefficient on CDS×POST×D×R is significantly negative for firms
whose banks exhibit an increase in CDS holdings in the year of CDS trade initiation (coefficient
= -1.020, p-value = 0.000), but insignificant for firms whose banks do not exhibit an increase in
33
CDS holdings (coefficient = -0.113, p-value = 0.310). An F-test of the statistical difference in
this coefficient estimate across these two subsamples yields a p-value of 0.100.
Finally, Panel C presents results based on identifying firms whose banks exhibit either an
increase in the proportion of assets bearing risk weights below 100% or an increase in CDS
holdings. We find that the coefficient on CDS×POST×D×R is significantly negative when either
condition is satisfied (coefficient = -0.522, p-value = 0.000). Economically, the decline in
conservatism for CDS firms when their lenders are likely to enter into CDS contracts for hedging
is about 27% of their conservatism level in the pre-CDS period (=(-0.522 + 0.022)/(0.245 +
1.584)). In contrast, the conservatism level for CDS firms relative to their counterparts when
lenders unlikely enter into CDS contracts actually increases significantly in the post-CDS period
relative to matched control firms (coefficient = 0.437, p-value = 0.003). This may be evidence of
a selection bias: banks that do not hedge their exposures to underlying borrowers even when
CDS contracts are available are likely to be the ones that do not intend to lower their demand for
conservatism and/or their monitoring of financial statements. An F-test of the statistical
difference in this coefficient estimate across the two subsamples yields a p-value below 0.000
(rounded).
We repeat all our cross-sectional analyses in Section 5.2 within the sample of firms that
are likely to have hedged their credit exposures via CDSs (that is, firms whose banks exhibit
either an increase in the proportion of assets bearing risk weights below 100% or an increase in
CDS holdings). The results on cross-sectional variation obtained in Tables 6 and 7 are robust to
using this sub-sample; that is, we find a more pronounced decline in conservatism (a) when
borrowers are risky and informationally opaque ex ante, and (b) when borrowers’ debt contracts
outstanding at the time of CDS trade initiation include a larger number of financial covenants.
34
In untabulated analysis, we also modified the first stage prediction model following
Minton, Stulz & Williamson (2009), to incorporate bank propensity to invest in derivative
securities, including interest rate, foreign exchange, equity and commodity derivatives. The
findings we obtain in Tables 5, 6 and 7 with respect to both our primary and cross-sectional
hypotheses are robust to using this first stage model.
5.4 Additional analysis:
5.4.1 Endogeneity between expected change in conservatism and CDS trade initiation
In our final analysis, we examine the possibility that CDS trade initiation is more likely
when lenders anticipate a decline in borrower conservatism. While existing literature does not
raise this possibility, it has a testable empirical prediction: a negative association between
expected change in conservatism and CDS trade initiation. Note that in our primary tests, we are
interested in whether there is an actual ex post decline in conservatism after CDS trade initiation
as lenders lower monitoring of financial statements. Key to distinguishing between the two
possibilities is the measurement of, and the imposition of a control for, expected change in
conservatism. Accordingly, we modify our empirical research design to match control firms to
treatment firms based on expected change in conservatism.
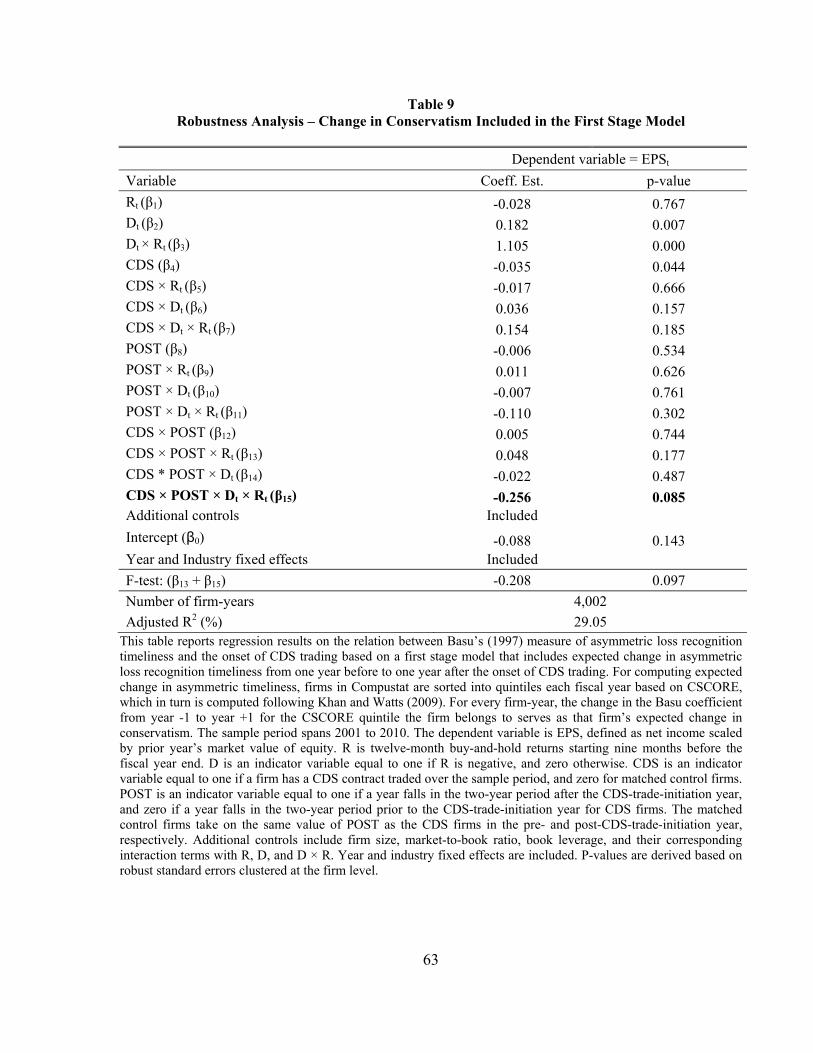
To accommodate the cross-sectional nature of our conservatism measure, we develop a
novel approach for measuring expected change in conservatism. Khan and Watts (2009)
demonstrate that the asymmetric timeliness of earnings (i.e., the Basu measure) varies
monotonically across deciles of CSCORE, a firm-specific measure of conservatism. We partition
firms in the Compustat universe into quintiles of CSCORE in the year prior to CDS trade
initiation, that is, year t-1 (where year t is the year of CDS trade initiation). We then estimate the
35
cross-sectional Basu measure within each of these quintiles and assign the corresponding
asymmetric timeliness coefficient to all firms in that quintile. Holding quintile membership
constant, we measure the cross-sectional Basu measure for year t+1, that is, the year after CDS
trade initiation. The actual change in the asymmetric timeliness coefficient for the CSCORE
quintile from year t-1 to t+1 serves as a proxy for the expected change in conservatism for every
firm within that quintile. Thereafter, we augment our first stage model with expected change in
conservatism.
The association between CDS trade initiation and expected change in conservatism is
significantly negative. Note that our measure of expected conservatism suffers from hindsight
bias, since it relies on actual change in conservatism measured ex post. Therefore, some caution
is warranted in interpreting the negative association observed in the first stage as a causal
relation between expected change in conservatism and CDS trade initiation. However, we still
retain this measure since the effect, if any, would be to reduce the power of our second-stage
regression to detect an actual change in conservatism for CDS firms. Upon matching on the
propensity score from the modified first stage model, we detect no difference in expected change
in conservatism between matched and control firms. In the second stage, we still observe an
actual decline in conservatism among CDS firms upon CDS trade initiation, with this decline
being much more pronounced relative to propensity-score-matched non-CDS firms, as shown in
Table 9.16
In untabulated tests, we confirm that the results we obtain with the modified first stage
persist after isolating instances where banks are more likely to have entered into CDS contracts.
The decline in conservatism is stronger for banks that exhibit an increase in either their CDS
16 The sample size reduces slightly due to the enhanced data requirements for estimating our first stage propensity score model, which adversely influences the extent to which we can find matches for CDS firms.
36
portfolio holdings or the proportion of assets bearing lower-risk-weights, even after controlling
for expected changes in conservatism.
5.4.2 Alternative Control for Selection Bias in CDS trade initiation
The difference-in-difference research design used in our main analysis should mitigate
the concern that our results are driven by firm characteristics that conceivably also determine
CDS trade initiation. To further test the robustness of our analysis to an alternative specification,
we use the Heckman two-stage procedure where the first stage models the probability of firms
experiencing CDS trade initiations, and the second stage model includes the inverse mills ratio
derived from the first stage to control for the selection bias. We estimate model (1) in the first
stage; the second stage results are reported in column (1) Table 10. The coefficient on the
inverse-mills ratio is positive, but statistically insignificant at conventional levels. The
coefficient on POST × Dt × Rt continues to be negative and statistically significant, with a p-value
of 0.014. In addition, we expand the first stage model by including the expected change in
accounting conservatism as discussed in the previous sub-section; the corresponding second
stage results are presented in column (2). The coefficient on the inverse-mills ratio in this
specification is significantly positive, indicating the presence of selection bias. Importantly, our
results on a significant decline in borrower conservatism upon CDS trade initiation are robust to
this alternative procedure of controlling for selection bias.
5.4.3 Robustness to using non-returns based measure of conservatism
CDS trade initiation potentially influences equity price changes (see for example
Boehmer, Chava and Tookes 2012), and in turn can conceivably influence the returns-based
37
Basu measure of conservatism. Note that the magnitude and even direction of this influence is far
from obvious, and it is unlikely that any influence of CDS trade initiation on stock prices can
generate the collective evidence we report. Nevertheless, to check robustness to a non-returns-
based measure of conservatism, we utilize an alternative measure of asymmetric loss recognition
based on an earnings time-series model (Basu 1997, Ball and Shivakumar 2005). Specifically,
we estimate the following equation using ordinary least square regression with standard errors
clustered at the firm level based on the sample consisting of both CDS firms and matched control
firms.
ΔEt = 0 + 1 ΔEt-1 + 2 Dt-1 + 3 Dt-1 × ΔEt-1
+ 4 CDS + 5 CDS × ΔEt-1 + 6 CDS × Dt-1 + 7 CDS × Dt-1 × ΔEt-1 + 8 POST + 9 POST × ΔEt-1 + 10 POST × Dt-1 + 11 POST × Dt-1 × ΔEt-1
+ 12 CDS × POST + 13 POST × CDS × ΔEt-1 + 14 CDS × POST × Dt-1
where ΔEt is current year’s earnings change, ΔEt-1 is previous year’s earnings change, D is an
indicator variable equal to one for previous earnings decline (i.e., ΔEt-1 < 0) and zero otherwise,
and the other variables are as defined in Equation (3). In the above equation, we allow earnings
persistence to differ between earnings increase and earnings declines. More timely recognition of
losses than gains implies that earnings increases are more persistent than earnings declines.
Hence, a reduction of accounting conservatism around the CDS-trade-initiation year would
require that the coefficient on CDS×POST×Dt-1×ΔEt-1, 15, be significantly positive.
Results presented in Table 11 corroborate those presented in Table 5. The coefficient on
CDS×POST×Dt-1×ΔEt-1 is significantly positive at the 5% level (coefficient = 1.308, p-value =
0.017), implying that reversals in earnings declines are less in the years following CDS trade
38
initiation. Our finding reinforces the conclusion that CDS firms experience a decline in the
asymmetric timeliness of loss recognition after the onset of CDS trading.17
In untabulated tests, we confirm that the results we obtain with earnings time-series measure
persist after isolating instances where banks are more likely to have entered into CDS contracts.
The decline in conservatism is stronger for banks that exhibit an increase in either their CDS
portfolio holdings or the proportion of assets bearing lower-risk-weights.
6. Conclusion
The primary purpose of our paper is to investigate the influence of financial market
developments on financial reporting practices. Our results indicate that the onset of CDS trading
is associated with a decline in the reporting conservatism of underlying borrowers. This result is
robust to a variety of robustness analyses. Although we observe this decline in conservatism on
average, it is not uniform across all firms. Instead it is particularly pronounced when banks enter
into CDS contracts on their borrowers for the purpose of hedging their exposures. Further, the
post-CDS decline in conservatism is more pronounced when lenders face lower reputation costs
from lowering monitoring of financial statements, that is, among borrowers that are inherently
riskier with poorer information environments. Borrowers also exhibit a greater decline in
conservatism when outstanding debt at the time of CDS trade initiation includes a larger number
of financial covenants. The results suggest that among a significant proportion of firms, lenders
(in particular, banks) reduce their demand for conservatism upon CDS trade initiation. Any
incremental demand for conservatism arising from other stakeholders to the firm does not
completely offset this decline. One interpretation of the results is that banks with incentives to
monitor their asymmetric claims possibly require a level of conservatism higher than the
17 There is a reduction in sample size, because we impose the requirement that for every year, enough data be available to compute earnings changes for the following year.
39
equilibrium demand from other stakeholders; thus, when their demand is mitigated as a result of
the modification in their payoffs due to their CDS investments, conservatism declines.
A few caveats apply to the interpretation of our results. First, as we point out, the results
in this study are more consistent with CDS trade initiation leading to a decline in borrower
conservatism, rather than expected changes in conservatism influencing CDS trade initiation.
However, it is difficult to empirically unambiguously disentangle the possibly endogenous nature
of the two. Thus, an interesting question for future research is whether lenders hedge their loan
exposures via CDSs when they anticipate declines in borrowers’ reporting conservatism, even
when these declines could have been avoided via additional monitoring effort on their part (for
example, by lenders insisting that borrowers record write-downs when cash flow losses are
expected). Second, our study is limited to the examination of any change in conservatism in the
relatively short horizon of four years surrounding the onset of CDS trading. We interpret this
finding as borrowers’ responding to a decline in lender monitoring of financial statements.
However, we are not in a position to comment on whether borrowers take actions that transfer
wealth from debt-holders to shareholders beyond financial reporting, for example via asset
substitution, underinvestment, overpayment of dividends, etc. To the extent that such actions are
facilitated by less conservative reporting, the CDS market may potentially be detrimental to a
firm’s long-term ability to access debt. In that sense, the structure of the CDS market during the
sample period examined in this study may be off-equilibrium.
The current debate about moving CDS to organized exchanges and requiring increased
transparency for CDS positions (Stulz 2010, Duffie and Zhu 2011) reflects concerns regarding
the CDS market. With respect to borrower conservatism, it bears keeping in mind that the
decline therein upon CDS trade initiation need not necessarily be sub-optimal. It is possible that
40
governance mechanisms that do not necessarily rely on conservative reporting step in to offset
the adverse effects of any reduction in lender monitoring of financial statements. For example,
Bolton and Oehmke (2010) discuss how borrowers, anticipating that lenders insured via CDS
hedge contracts will be particularly intransigent upon a negative credit event, may modify
behavior of their own accord to avoid such events. The emergence of the CDS market thus
provides an alternative or at least an additional channel via which the presence of lenders
influences borrower behavior, relative to the traditional one based on lender monitoring. A
thorough investigation into these possible scenarios following the onset of CDS trading and the
accompanying decline in conservatism is beyond the scope of this study, but can serve as a
fertile area for future research.
41
REFERENCES Acharya, V., and T. Johnson. 2007. Insider trading in credit derivatives, Journal of
Financial Economics 84: 110-141. Ahmed, A., B. Billings, R. Morton, and M. Stanford. 2002. The role of accounting conservatism
in mitigating bondholder-shareholder conflicts over dividend policy and in reducing debt costs, The Accounting Review 77: 867-890.
Arping, S. 2012. Credit protection and lending relationships. Forthcoming, Journal of Financial
Stability. Ashcraft, A., and J. Santos. 2009. Has the CDS lowered the cost of corporate debt? Journal of
Monetary Economics 56 (4): 514-523. Ball, R., L. Shivakumar. 2005. Earnings quality in UK private firms: comparative loss
recognition timeliness. Journal of Accounting and Economics 39: 83-128. Ball, R., R. Bushman, and F. Vasvari. 2008. The debt-contracting value of accounting
information and loan syndicate structure. Journal of Accounting Research 46: 247–287. Basu, S. 1997. The conservatism principle and the asymmetric timeliness of earnings, Journal of
Accounting and Economics 24: 3-37. Basu, S., L. Hwang, and C. Jan. 2001a. Auditor conservatism and quarterly earnings. Working
paper, Emory University, Chinese University of Hong Kong, and California State University - Hayward.
Basu, S., L. Hwang, and C. Jan . 2001b. Differences in conservatism between big eight and non-
big eight auditors, Working paper, Emory University, Chinese University of Hong Kong, and California State University - Hayward.
Begley, J., and R. Freedman. 2004. The changing role of accounting numbers in public lending
agreements. Accounting Horizons 18, 81–96. Bolton, P., and M. Oehmke. 2010. Credit default swaps and the empty creditor problem. Review
of Financial Studies 24: 2617-2655. British Bankers Association (BBA). 2006. BBA Credit Derivatives Report 2006. London: BBA
Enterprises Ltd. Bushman, R.M., and R. Wittenberg-Moerman. 2012. The Role of Bank Reputation in
“Certifying” Future Performance Implications of Borrowers’ Accounting Numbers. Journal of Accounting Research 50: 883–930.
42
Chava, S., and M. Roberts. 2008. How does financing impact investment? The role of debt covenants. Journal of Finance 63: 2085–2121.
Chen, T., and X. Martin. 2011. Do bank affiliated analysts benefit from information sharing?
Journal of Accounting Research 49: 633-675. Deutsche Bank Research. 2009. Credit default swaps heading towards a more stable system. Duffee, D., and C. Zhou. 2001. Credit derivatives in banking: Useful tools for managing risk?
Journal of Monetary Economics 48: 25-54. Duffie, D., and H. Zhu. 2011. Does a central clearing counterparty reduce counter-party risk?
Review of Asset Pricing Studies 1: 74-95. Ettredge, M., Y. Huang and W. Zhang. 2012. Earnings restatements and differential timeliness of
accounting conservatism. Journal of Accounting and Economics 53: 489-503. Fink, R. 2004. Credit default swaps: Who’s doing what? CFO.com, October 7, 2004. Francis, J. and X. Martin. 2010, Acquisition profitability and timely loss recognition. Journal of
accounting and economics 49: 161-178. Frankel, R., and L. Litov. 2008. Financial accounting characteristics and debt covenants.
Working paper, Washington University in St. Louis. Gopalan, R., V. Nanda, and V. Yerramilli. 2011. Does poor performance damage the reputation
of financial intermediaries? Evidence from the loan syndication market. Journal of Finance 66: 2083- 2120.
Gormley, T., B. Kim, and X. Martin. 2012. Do firms adjust their timely loss recognition in
response to changes in the banking industry. Journal of Accounting Research 50: 159-196.
Gorton, G., and G. Pennacchi. 1995. Banking and loan sales: Marketing nonmarketable assets.
Journal of Monetary Economics 35: 389-411. Gupta, A., A. Singh, and A. Zebedee. 2008. Liquidity in the pricing of syndicated loans. Journal
of Finance 11: 339-376. Khan, M., and R. Watts. 2009. Estimation and empirical properties of a firm-year measure of
accounting conservatism. Journal of Accounting and Economics 48: 132-150. LaFond, R., and S. Roychowdhury. 2008. Managerial ownership and accounting conservatism.
Journal of Accounting Research 46: 101-135.
43
LaFond, R., and R. Watts. 2008. The information role of conservative financial statements. The Accounting Review 83: 447-478.
Lee, S., and D. Mullineaux. 2004. Monitoring, financial Distress, and the Structure of
commercial lending syndicates. Financial Management 33: 107–130. Leland, H., and D. Pyle. 1977. Information asymmetries, financial structure and financial
intermediation. Journal of Finance 32: 371-387. Leone, A.J., J.S. Wu, and J.L. Zimmerman. 2006. Asymmetric sensitivity of CEO cash
compensation to stock returns. Journal of Accounting and Economics 42: 167–192. Lewis, M. 2010. The big short. W.W. Norton and Company. Marsh, I. 2009. The effect of lenders’ credit risk transfer activities on borrowing firms’ equity
returns? Working paper, City University London. Mayordomo, S. J. Pena, and E. Schwartz. 2011. Are all credit default swap databases equal?
Working paper. UCLA. Morrison, A. 2005. Credit derivatives, disintermediation, and investment decisions. Journal of
Business 78: 621-647.
Nikolaev, V., 2013. Debt Covenants and Accounting Conservatism. Journal of Accounting Research 48: 137-175.
Parlour, C., and A. Winton. 2013. Laying off credit risk: loan sales versus credit default swaps. Journal of Financial Economics 107: 25-45.
Pennacchi, G. 1988. Loan sales and the cost of bank capital. Journal of Finance 43: 375-96. Petersen, M. 2009. Estimating standard errors in finance panel data sets: comparing approaches.
Review of Financial Studies 22: 435–480. Roychowdhury, S. 2010. Discussion of acquisition profitability and timely loss recognition.
Journal of Accounting and Economics 49: 179-183. Saretto, A., and H. Tookes, 2013. Corporate leverage, debt maturity and credit default swaps:
The role of credit supply. Review of Financial Studies 26: 1190-1247. Stulz, R. 2010. Credit default swaps and the credit crisis. Journal of Economic Perspectives 24:
73-92. Sufi, A. 2007. Information asymmetry and financing arrangements: Evidence from syndicated
loans. Journal of Finance 62: 629–668.
44
Sustersic, J. 2012, Do traded credit default swaps impact lenders’ monitoring activities? Evidence from private loan agreements. Unpublished dissertation, Ohio State University.
Tan, L. 2013, Creditor control rights, state of nature verification, and financial reporting
conservatism. Journal of Accounting and Economics 55: 1–22. Venokur. S., M. Magidson, and A. Singe. 2008. Comparing credit default swaps to insurance
contracts: did the New York State Insurance Department get it right? Journal of the Law of Investment and Risk Management Products 28: 1-11.
Watts, R., and J. Zimmerman. 1986. Positive accounting theory. Englewood Cliffs, NJ, Prentice-
Hall. Watts, R. 2003. Conservatism in accounting Part I: Explanations and implications. Accounting
Horizons 17: 207-221. Weistroffer, C. 2009. Credit default swaps: heading towards a more stable system. Deutsche
Bank Research: Current Issues. Zhang, J. 2008. Efficiency gains from accounting conservatism: Benefits to lenders and
borrowers. Journal of Accounting & Economics 45: 27-54.
*Monoline insurers and reinsurers combined. This appendix shows the breakdown of CDS market participants by type of institutions. The source is from BBA (2006).
Appendix II
The Credit Default Swap Contract
Credit default swaps are generally documented using industry-standard derivative master agreements and standard CDS terms. Unlike equity shares or bonds, which are traded primarily on regulated exchanges, CDS are traded mainly over-the-counter (OTC). In principle, therefore, the contracting parties can agree upon the terms and conditions of the CDS individually – such as definitions of the credit events or settlement procedures. In practice, to facilitate documentation, avoid disputes regarding the occurrence of credit events and settle contracts, CDS contracting parties generally refer to the International Swaps and Derivatives Association (ISDA) Master Agreement. These general terms and conditions – established by ISDA, the central industry body – were introduced in 1999 and have been continuously developed since then. A revised version of the agreement was released in 2003, while the latest amendments were made in 2009 (see Deutsche Bank Research 2009).
Sample Term Sheet for a Credit Default Swap (Traded by XYZ Bank PLC)
Draft Terms – Credit Default Swap
1. General Terms
Trade Date Aug 5, 2003 Effective Date Aug 6, 2003 Scheduled Termination Date Jul 30, 2005 Floating Rate Payer (’Seller’) XYZ Bank plc, London branch Fixed Rate Payer (’Buyer’) ABC Investment Bank plc Calculation Agent Seller Calculation Agent City New York Business Day New York Business Day Convention Following Reference Entity Jackfruit Records Corporation Reference Obligation Primary Obligor: Jackfruit Records Maturity Jun 30, 2020 Coupon 0% CUSIP/ISIN xxxxx Original Issue Amount USD 100,000,000 Reference Price 100% All Guarantees Not Applicable
2. Fixed Payments
Fixed Rate Payer Calculation Amount USD 7,000,000 Fixed Rate 0.3% per annum Fixed Rate Payer Payment Date(s) Oct 30, Jan 30, Apr 30, Jul 30, starting Oct 30,
Notice of Publicly Available Information: Applicable(Public Source: Standard Public Sources. Specified Number: Two)
Credit Events Bankruptcy
Failure to Pay (Grace Period Extension: Not Applicable. Payment Requirement: $1,000,000)
Obligation(s) Borrowed Money
4. Settlement Terms
Settlement Method Physical Settlement Settlement Currency The currency in which the Floating Rate
Payer Calculation Amount is denominated
Terms Relating to Physical Settlement
Physical Settlement Period The longest of the number of business days for
settlement in accordance with the then- current market practice of any Deliverable Obligation being Delivered in the Portfolio, as determined by the Calculation Agent, after consultation with the parties, but in no event shall be more than 30 days
Portfolio Exclude Accrued Interest Deliverable Obligations Bond or Loan Deliverable Obligation Not Subordinated Characteristics Specified Currency – Standard Specified
Currencies Maximum Maturity: 30 years Not Contingent Not Bearer Transferable
Assignable Loan Consent Required Loan
Restructuring Maturity Not Applicable Limitation Partial Cash Settlement Not Applicable of Loans Partial Cash Settlement of Not Applicable Assignable Loans Escrow Applicable
5. Documentation
Confirmation to be prepared by the Seller and agreed to by the Buyer. The definitions and provisions contained in the 2003 ISDA Credit Derivatives Definitions, as published by the International Swaps and Derivatives Association, Inc., as supplemented by the May 2003 Supplement, to the 2003 ISDA Credit Derivatives Definitions (together, the ‘Credit Derivatives Definitions’), are incorporated into the Confirmation
6. Notice and Account Details
Telephone, Telex and/or Buyer: Facsimile Numbers and Phone: Contact Details for Notices Fax:
Seller: A.N. Other Phone: +1 212-xxx-xxxx Fax: +1 212-xxx-xxxx
Account Details of Seller 84-7512562-85
Risks and Characteristics
Credit Risk. An investor’s ability to collect any premium will depend on the ability of XYZ Bank plc to pay.
Non-Marketability. Swaps are not registered instruments and they do not trade on any exchange. It may be impossible for the transactor in a swap to transfer the obligations under the swap to another holder. Swaps are customised instruments and there is no central source to obtain prices from other dealers.
Table 1 Logistic Regression Results on Probability of Initiating CDS Trading
Dependent Variable = Prob(CDS=1)
Variable Coeff Est. p-value Intercept -6.485 <0.001 INVESTMENT GRADE 0.691 <0.001 RATING 1.356 <0.003 LEV 1.476 <0.001 PROFIT MARGIN 0.106 <0.001 SIZE 0.439 <0.001 RETURN VOLATILITY -2.201 <0.001 MB 0.023 0.331 Pseudo R2 0.46 Model significance 1,940.55 <0.001 Likelihood ratio 21,145.97 <0.001 Percent concordant 91.50% Percent discordant 8.11% Number of firm-years 138735 This table reports coefficient estimates from estimating a logistic model to predict the onset of credit default swap (CDS) trading. The dependent variable, CDS, is equal to 1 if a CDS is traded on a firm, and 0 otherwise. Independent variables include INVEST GRADE, an indicator variable equal to 1 if a firm has a S&P credit rating above BB+, and 0 otherwise; RATING, an indicator variable equal to 1 if a firm has a S&P credit rating, and 0 otherwise; SIZE, natural logarithm of market value; MB, the ratio of market value of equity to book value of equity; LEV, leverage equal to total debt scaled by total assets; PROFIT MARGIN is net income scaled by sales; RETURN VOLATILITY is standard deviation of monthly stock return within a fiscal year. The sample period spans 1997 to 2010, containing firms without CDS traded and firms with CDS traded during this period. For firms with CDS traded, only firm-years prior to the onset of CDS trading are included in the sample. Robust standard errors are estimated and are clustered at the firm level.
Table 2 Sample Distribution
Panel A: Sample distribution by CDS onset year for both CDS and non-CDS firms CDS Non-CDS Year N % N % 2002 1 0.19 2 0.38 2003 128 24.2 237 45.14 2004 297 56.14 184 35.05 2005 41 7.75 32 6.1 2006 13 2.46 17 3.24 2007 41 7.75 43 8.19 2008 3 0.57 5 0.95 2009 5 0.95 5 0.95 Total 529 100 525 100
Panel B: Sample distribution by industry CDS Non-CDS Industry (based on 1-digit SIC) N % N % Mining, mineral and construction 57 10.78 40 7.62 Food, apparel, petroleum refining, and paper and printing 122 23.06 113 21.52 Rubber, stone, computer, transportation equipment 125 23.63 130 24.76 Railroad transportation and Electric and Gas 107 20.23 121 23.05 Retail and wholesale 55 10.40 51 9.72 Business service 47 8.88 55 10.47 Public service 13 2.46 12 2.28 Government service 3 0.57 3 0.58 Total 529 100 525 100
This table reports sample distribution by the CDS onset year in Panel A and by industry in Panel B, for both CDS firms and their matched firms (Non-CDS). For the match firms, the CDS onset year is assumed from their matched CDS firms.
Table 3 Summary Statistics
Panel A: Pre-CDS trading period
CDS Non-CDS Mean Diff Variable Mean Median Mean Median EPS 0.033 0.055 0.023 0.050 0.010*
R 0.178 0.153 0.186 0.153 -0.008 D 0.273 0.000 0.293 0.000 -0.021 SIZE 8.849 8.770 8.123 7.969 0.726*** MB 1.142 0.884 1.240 0.920 -0.099** LEV 0.297 0.268 0.291 0.270 0.005
Panel B: Post-CDS trading period
CDS Non-CDS Mean Diff Variable Mean Median Mean Median EPS -0.007 0.042 -0.010 0.038 0.003 R 0.093 0.057 0.094 0.059 -0.001 D 0.429 0.000 0.432 0.000 -0.003 SIZE 8.424 8.307 7.627 7.480 0.798*** MB 1.112 0.786 1.333 0.817 -0.221*** LEV 0.328 0.309 0.325 0.308 0.003
This table reports sample mean and median for main variables in the empirical analysis for both CDS firms and their matching firms (Non-CDS) for both pre-CDS onset period and post-CDS onset period. The pre-CDS onset period covers two years prior to the onset of CDS and the post-CDS onset period covers two years after the onset of CDS. For Non-CDS firms, the onset year is assumed from their matching firms. The sample period spans 2001 to 2010. EPS is net income scaled by prior year market value of equity; R is 12 month compounded returns starting 9 months before the fiscal year end. D is an indicator variable coded 1 if R is less than 0, and 0 otherwise. SIZE, natural logarithm of market value; MB, the ratio of market value of equity to book value of equity; LEV, leverage equal to total debt scaled by total assets.
Table 4 Pearson and Spearman Correlations between Selected Variables
This table reports Pearson (above diagonal) and Spearman (below diagonal) corrections among variables used in the empirical analysis. The sample period spans 2001 to 2010. EPS is net income scaled by prior year market value of equity; R is 12 month compounded returns starting 9 months before the fiscal year end. D is an indicator variable coded 1 if R is less than 0, and 0 otherwise. SIZE is natural logarithm of market value of a firm; MB is market value of equity to book value of equity of a firm; LEV is leverage equal to total debt scaled by total assets; CDS is an indicator variable equal to 1 if a firm has a CDS traded over the sample period. POST is an indicator variable equal to 1 if a year falls in the two years after the onset of CDS trading, and 0 if a year falls in the two years before the onset of CDS trading for CDS firms. The match firms take on the same value of POST as the matched CDS firms in the pre- and post-CDS-trade-initiation year, respectively. Bold figures indicate significant level less than 1%.
Table 5 OLS Regression Results on the Relation between Asymmetric Loss Recognition Timeliness
This table reports multivariate regression results on the relation between Basu’s (1997) measure of asymmetric loss recognition timeliness and the onset of CDS trading. The sample period spans 2001 to 2010. Firms in financial industries are excluded. The dependent variable is EPS, defined as net income scaled by prior year’s market value of equity. R is twelve-month buy-and-hold returns starting nine months before the fiscal year end. D is an indicator variable equal to one if R is negative, and zero otherwise. CDS is an indicator variable equal to one if a firm has a CDS contract traded over the sample period, and zero for matched control firms. The matched control sample is chosen based on propensity score matching method, where propensity score model is described in Table 1. POST is an indicator variable equal to one if a year falls in the two-year period after the CDS-trade-initiation year, and zero if a year falls in the two-year period prior to the CDS-trade-initiation year for CDS firms. The match control firms take on the same value of POST as the matched CDS firms in the pre- and post-CDS-trade-initiation year, respectively. Additional controls include firm size, market-to-book ratio, book leverage, and their corresponding interaction terms with R, D, and D × R. Year and industry fixed effects are included. P-values are derived based on robust standard errors clustered at the firm level.
Table 6 Cross-sectional Analysis of the Relation between Asymmetric Loss Recognition Timeliness and the
Onset of CDS Trading Conditional on Firm Size and Credit Rating
Panel A: Conditional on firm size Dependent variable = EPSt
F-test: β15 across subsamples (p-value) -0.288 (0.075)
Number of firm-years 3,000 1,428
Adjusted R2 (%) 30.55 11.93
Table 6 (Continued) Panel C: Conditional on lender reputation factor
Dependent variable = EPSt
Below median reputation factor Above median reputation factorVariable Coeff. Est. p-value Coeff. Est. p-value
R(β1) -0.028 0.776 0.046 0.552 D(β2) 0.161 0.062 0.089 0.032 D * R(β3) 1.241 0.000 0.553 0.000 CDS(β4) -0.036 0.104 0.002 0.856 CDS * R(β5) -0.042 0.312 -0.001 0.973 CDS * D(β6) 0.071 0.035 -0.002 0.868 CDS * D * R(β7) 0.342 0.000 0.030 0.484 POST(β8) -0.034 0.126 0.020 0.064 POST * R(β9) 0.067 0.053 0.000 0.993 POST * D(β10) 0.069 0.022 -0.014 0.371 POST * D * R(β11) 0.024 0.768 -0.094 0.209 CDS * POST(β12) 0.015 0.626 -0.012 0.271 CDS * POST * R(β13) 0.038 0.512 0.010 0.729 CDS * POST * D(β14) -0.146 0.003 0.034 0.080 CDS * POST * D * R(β15) -0.585 0.005 0.177 0.478 Additional Controls Included Included
Intercept (β0) -0.276 0.001 -0.068 0.107 Year and Industry fixed effects Included Included
F-test: (β13 + β15) -0.547 0.005 0.187 0.463 F-test: β15 across subsamples (p-value) -0.762 (0.014) Number of firm-years 2214 2214
Adjusted R2 (%) 33.2 19.9
57
TABLE 6 (Continued) This table reports cross-sectional analysis of firm size, credit rating, and the common factor constructed based on the former two variables on the relation between asymmetric timely loss recognition and the onset of CDS trading. The sample period spans 2001 to 2010. Firms in financial industries are excluded. The dependent variable is EPS, defined as net income scaled by prior year’s market value of equity. In Panel A, the sample is partitioned into large firms and small firms based on the full sample median market value of equity prior to the year of CDS onset. In Panel B, the sample is partitioned into firms with investment-grade credit rating and firms without investment-grade credit rating prior to the year of CDS onset. In Panel C, the sample is partitioned into high lender reputation and low lender reputation based on the full sample median lender reputation factor. Lender reputation factor is derived from the principal component analysis based on the two variables: natural logarithm of firm market value of equity and long-term S&P credit rating. Credit rating is defined by an ordinal variable ranging between 1 (AAA) and 19 (CCC-) for firms with S&P long term debt rating; we assign a value of 20 for firms in default stage, and 21 for firms with no debt rating. R is twelve-month buy-and-hold returns starting nine months before the fiscal year end. D is an indicator variable equal to one if R is negative, and zero otherwise. CDS is an indicator variable equal to one if a firm has a CDS contract traded over the sample period, and zero for matched control firms. The matched control sample is chosen based on propensity score matching method, where propensity score model is described in Table 1. POST is an indicator variable equal to one if a year falls in the two-year period after the CDS-trade-initiation year, and zero if a year falls in the two-year period prior to the CDS-trade-initiation year for CDS firms. The match control firms take on the same value of POST as the matched CDS firms in the pre- and post-CDS-trade-initiation year, respectively. Additional controls include firm size, market-to-book ratio, book leverage, and their corresponding interaction terms with R, D, and D × R. Year and industry fixed effects are included. P-values are derived based on robust standard errors clustered at the firm level.
58
Table 7 Cross-sectional Analysis of the Relation between Asymmetric Loss Recognition Timeliness and the
Onset of CDS Trading Conditional on Loan Contracts with Financial Covenants
Dependent variable = EPSt
Number of Financial Covenants>3
Number of Financial Covenants<2
Variable Coeff. Est. p-value Coeff. Est. p-value
R(β1) -0.043 0.727 -0.173 0.415 D(β2) 0.117 0.277 0.080 0.597 D * R(β3) 1.002 0.001 0.838 0.027 CDS(β4) -0.010 0.670 -0.013 0.349 CDS * R(β5) -0.081 0.034 0.066 0.301 CDS * D(β6) 0.024 0.605 -0.004 0.913 CDS * D * R(β7) 0.231 0.243 -0.191 0.449 POST(β8) -0.008 0.678 -0.030 0.228 POST * R(β9) 0.029 0.472 0.086 0.182 POST * D(β10) 0.028 0.387 -0.038 0.434 POST * D * R(β11) -0.053 0.738 -0.496 0.005 CDS * POST(β12) -0.024 0.103 0.033 0.164 CDS * POST * R(β13) 0.123 0.031 -0.064 0.402 CDS * POST * D(β14) -0.029 0.534 -0.038 0.468 CDS * POST * D * R(β15) -0.497 0.006 0.246 0.397 Additional Controls Included Included
Intercept (β0) -0.037 0.580 -0.065 0.251 Year and Industry fixed effects Included Included
F-test: (β13 + β15) -0.374 0.024 0.182 0.274 F-test: β15 across subsamples (p-value) -0.556 (0.067) Number of firm-years 1153 711
Adjusted R2 (%) 37.01 33.04 This table reports cross-sectional analysis based on financial covenants in loan contracts to the firms in our sample. The sample period spans 2001 to 2010. Banks lending to CDS and non-CDS firms in the sample are identified using data obtained from the LPC (Loan Pricing Corporation)’s Dealscan database. Loan contracts that are outstanding prior to the CDS trade initiation date but mature after that date are identified from the LPC database. Among all loans outstanding, the number of financial covenants is measured for the loan with the maximum number of financial covenants in the year prior to the onset of CDS trading. The sample is partitioned into more (few) covenants groups in which firms have loans contracts outstanding with the number of financial covenants exceeding 3 (below 2). The dependent variable is EPS, defined as net income scaled by prior year’s market value of equity. R is twelve-month buy-and-hold returns starting nine months before the fiscal year end. D is an indicator variable equal to one if R is negative, and zero otherwise. CDS is an indicator variable equal to one if a firm has a CDS contract traded over the sample period, and zero for matched control firms. POST is an indicator variable equal to one if a year falls in the two-year period after the CDS-trade-initiation year, and zero if a year falls in the two-year period prior to the CDS-trade-initiation year for CDS firms. The match control firms take on the same value of POST as the matched CDS firms in the pre- and post-CDS-trade-initiation year, respectively. Additional controls include firm size, market-to-book ratio, book leverage, and their corresponding interaction terms with R, D, and D × R. Year and industry fixed effects are included. P-values are derived based on robust standard errors clustered at the firm level.
59
Table 8 Cross-sectional Analysis of the Relation between Asymmetric loss recognition timeliness and the
Onset of CDS Trading Conditional on bank characteristics
Panel A: The proportion of banks’ assets bearing lower risk weights Dependent variable = EPSt
Increase in proportion of
assets with lower risk-weight No increase in proportion of
assets with lower risk-weight Variable Coef. P>t Coef. P>t R(β1) -0.190 0.121 0.015 0.880 D(β2) 0.279 0.004 0.167 0.018 D * R(β3) 1.734 0.000 1.010 0.000 CDS(β4) 0.004 0.855 -0.047 0.010 CDS * R(β5) -0.091 0.054 0.086 0.035 CDS * D(β6) -0.003 0.928 0.042 0.138 CDS * D * R(β7) 0.173 0.121 -0.147 0.069 POST(β8) 0.003 0.914 -0.005 0.802 POST * R(β9) 0.011 0.804 0.045 0.254 POST * D(β10) 0.001 0.980 -0.021 0.514 POST * D * R(β11) -0.101 0.378 -0.345 0.000 CDS * POST(β12) -0.027 0.368 0.032 0.179 CDS * POST * R(β13) 0.099 0.129 -0.041 0.453 CDS * POST * D(β14) -0.042 0.422 0.000 0.998 CDS * POST * D * R(β15) -0.452 0.003 0.286 0.028 Additional Controls Included Included
Intercept (β0) 0.016 0.825 -0.069 0.192 Year and Industry fixed effects Included Included
F-test: (β13 + β15) -0.353 0.010 0.245 0.038 F-test: β15 across subsamples (p-value) -0.598 (0.003) Number of firm-years 1,135 1,651
Adjusted R2 (%) 33.13 35.01
60
Table 8 (Continued)
Panel B: Bank CDS holding change Dependent variable = EPSt
Increase in CDS holdings No increase in CDS
holdings Variable Coef. P>t Coef. P>t R(β1) -0.361 0.014 0.001 0.991 D(β2) 0.115 0.357 0.226 0.000 D * R(β3) 1.633 0.000 1.151 0.000 CDS(β4) 0.023 0.461 -0.025 0.131 CDS * R(β5) -0.248 0.001 0.036 0.312 CDS * D(β6) 0.074 0.148 0.017 0.524 CDS * D * R(β7) 0.742 0.000 -0.067 0.350 POST(β8) 0.003 0.903 -0.002 0.931 POST * R(β9) -0.046 0.370 0.064 0.075 POST * D(β10) 0.027 0.522 -0.002 0.946 POST * D * R(β11) 0.076 0.554 -0.173 0.045 CDS * POST(β12) -0.099 0.052 0.013 0.541 CDS * POST * R(β13) 0.354 0.001 -0.019 0.685 CDS * POST * D(β14) -0.118 0.158 -0.028 0.453 CDS * POST * D * R(β15) -1.020 0.000 -0.113 0.310 Additional Controls Included Included
Intercept (β0) 0.142 0.160 -0.189 0.002 Year and Industry fixed effects Included Included
F-test: (β13 + β15) -0.665 0.002 -0.133 0.188
F-test: β15 across subsamples (p-value) -0.906 (0.101) Number of firm-years 435 2,351
Adjusted R2 (%) 37.02 33.01
61
Table 8 (Continued) Panel C: Banks with an increase in either the proportion of assets bearing lower risk weights or in CDS holdings Dependent variable = EPSt
Increase in either the proportion of assets bearing
lower risk weights or in CDS holdings
No increase in either
Variable Coef. P>t Coef. P>t R(β1) 0.112 -0.393 0.026 0.803 D(β2) 0.252 0.004 0.194 0.010 D * R(β3) 1.584 0.000 1.104 0.000 CDS(β4) 0.002 0.899 -0.047 0.021 CDS * R(β5) -0.086 0.046 0.095 0.036 CDS * D(β6) 0.009 0.793 0.037 0.241 CDS * D * R(β7) 0.245 0.014 -0.240 0.007 POST(β8) 0.004 0.856 0.000 1.000 POST * R(β9) -0.005 0.895 0.073 0.102 POST * D(β10) 0.005 0.880 -0.028 0.461 POST * D * R(β11) 0.022 0.816 -0.482 0.000 CDS * POST(β12) -0.030 0.265 0.039 0.138 CDS * POST * R(β13) 0.118 0.048 -0.070 0.242 CDS * POST * D(β14) -0.047 0.320 0.012 0.795 CDS * POST * D * R(β15) -0.522 0.000 0.437 0.003 Additional Controls Included Included
Intercept (β0) -0.127 0.086 -0.082 0.315 Year and Industry fixed effects Included Included
F-test: (β13 + β15) -0.404 0.001 0.367 0.005 F-test: β15 across subsamples (p-value) -0.960 (0.000) Number of firm-years 1,296 1,490
Adjusted R2 (%) 0.311 0.369 This table reports cross-sectional analysis of characteristics of banks lending to the firms in our sample. The sample period spans 2001 to 2010. Firms in financial industries are excluded. The dependent variable is EPS, defined as net income scaled by prior year’s market value of equity. Panel A presents results for two sub-samples partitioned on whether there was an increase in the proportion of banks’ assets risk-weighted at lower than 100% relative to total bank assets in the same year as CDS trade initiation. Banks lending to CDS and non-CDS firms in the sample are identified using data obtained from the LPC (Loan Pricing Corporation)’s Dealscan database, and the risk weights on banks’ assets are from Federal Reserve’s Y-9C reports. Panel B presents results for two sub-samples partitioned based on whether banks exhibit an increase in CDS portfolio holdings in the same year as CDS trade initiation on underlying borrowers. CDS portfolio holdings of banks are obtained from Federal Reserve’s Y-9C reports. Panel C presents for situations in which either the conditions in Panel A or Panel B hold. In other words, banks exhibit an increase in either lower-risk-weighted assets or an increase in CDS portfolio holdings. R is twelve-month buy-and-hold returns starting nine months before the fiscal year end. D is an indicator variable equal to one if R is negative, and zero otherwise. CDS is an indicator variable equal to one if a firm has a CDS contract traded over the sample period, and zero for matched control firms. The matched control sample is chosen based on propensity score
62
matching method, where propensity score model is described in Table 1. POST is an indicator variable equal to one if a year falls in the two-year period after the CDS-trade-initiation year, and zero if a year falls in the two-year period prior to the CDS-trade-initiation year for CDS firms. The matched control firms take on the same value of POST as the CDS firms in the pre- and post-CDS-trade-initiation year, respectively. Additional controls include firm size, market-to-book ratio, book leverage, and their corresponding interaction terms with R, D, and D × R. Year and industry fixed effects are included. P-values are derived based on robust standard errors clustered at the firm level.
63
Table 9 Robustness Analysis – Change in Conservatism Included in the First Stage Model
Intercept (β0) -0.088 0.143 Year and Industry fixed effects Included
F-test: (β13 + β15) -0.208 0.097
Number of firm-years 4,002
Adjusted R2 (%) 29.05 This table reports regression results on the relation between Basu’s (1997) measure of asymmetric loss recognition timeliness and the onset of CDS trading based on a first stage model that includes expected change in asymmetric loss recognition timeliness from one year before to one year after the onset of CDS trading. For computing expected change in asymmetric timeliness, firms in Compustat are sorted into quintiles each fiscal year based on CSCORE, which in turn is computed following Khan and Watts (2009). For every firm-year, the change in the Basu coefficient from year -1 to year +1 for the CSCORE quintile the firm belongs to serves as that firm’s expected change in conservatism. The sample period spans 2001 to 2010. The dependent variable is EPS, defined as net income scaled by prior year’s market value of equity. R is twelve-month buy-and-hold returns starting nine months before the fiscal year end. D is an indicator variable equal to one if R is negative, and zero otherwise. CDS is an indicator variable equal to one if a firm has a CDS contract traded over the sample period, and zero for matched control firms. POST is an indicator variable equal to one if a year falls in the two-year period after the CDS-trade-initiation year, and zero if a year falls in the two-year period prior to the CDS-trade-initiation year for CDS firms. The matched control firms take on the same value of POST as the CDS firms in the pre- and post-CDS-trade-initiation year, respectively. Additional controls include firm size, market-to-book ratio, book leverage, and their corresponding interaction terms with R, D, and D × R. Year and industry fixed effects are included. P-values are derived based on robust standard errors clustered at the firm level.
Inverse mills ratio 0.046 0.105 0.054 0.046 Additional controls Included Included
Intercept (β0) -0.200 0.097 -0.221 0.059
Year and Industry fixed effects Included Included
F-test: (β13 + β15)
F-test: (β9 + β11) -0.220 0.036 -0.221 0.034
Number of firm-years 1,996 1,996
Adjusted R2 (%) 17.56 18.12
This table reports the second-stage regression results on the relation between Basu’s (1997) measure of asymmetric loss recognition timeliness and the onset of CDS trading using Heckman two-stage procedure with CDS firms only. In the first stage, the sample consists of 138,735 firm-year observations, the same sample in Table 1. In column (1), the first stage selection model includes all the explanatory variables used in the propensity score model as shown in Table 1. In column (2), the first stage selection model includes all the explanatory variables used in the propensity score model as shown in Table 1, as well as the expected change in asymmetric loss recognition timeliness between one year before and one year after CDS trade initiation. For computing expected change in asymmetric timeliness, firms in Compustat are sorted into quintiles each fiscal year based on CSCORE, which in turn is computed following Khan and Watts (2009). For every firm-year, the change in the Basu coefficient from year -1 to year +1 for the CSCORE quintile the firm belongs to serves as that firm’s expected change in conservatism. The sample period spans 2001 to 2010. The dependent variable is EPS, defined as net income scaled by prior year’s market value of equity. R is twelve-month buy-and-hold returns starting nine months before the fiscal year end. D is an indicator variable equal to one if R is negative, and zero otherwise. POST is an indicator variable equal to one if a year falls in the two-year period after the CDS-trade-initiation year, and zero if a year falls in the two-year period prior to the CDS-trade-initiation year. Additional controls include firm size, market-to-book ratio, book leverage, and their corresponding interaction terms with R, D, and D × R. Year and industry fixed effects are included. P-values are derived based on robust standard errors clustered at the firm level.
65
Table 11 Non-Returns Based Measure of Conservatism
Earnings time-series measure
CDS firms and Matched firms
Variable Coeff. Est. p-value
ΔEt (γ1) 0.163 0.662
D t (γ2) -0.069 0.149
D t × ΔEt (γ3) -0.184 0.822
CDS (γ4) -0.022 0.010
CDS × ΔEt (γ5) 0.307 0.044
CDS × Dt (γ6) 0.000 0.982
CDS × Dt × ΔEt (γ7) -0.520 0.139
POST (γ8) -0.019 0.036
POST × ΔEt (γ9) 0.426 0.014
POST × Dt (γ10) 0.001 0.960
POST × Dt × ΔEt (γ11) -0.910 0.010
CDS × POST (γ12) 0.006 0.640
CDS × POST × ΔEt (γ13) -0.499 0.043
CDS × POST × Dt (γ14) 0.012 0.611
CDS × POST × Dt × ΔEt (γ15) 1.308 0.017
Additional controls Included Included
Intercept (γ0) -0.119 0.000 Year and Industry fixed effects Included
Number of firm-years 4,209
Adjusted R2 (%) 28.86
This table reports multivariate regression results on the relation between an earnings time-series measure of asymmetric loss recognition timeliness and the onset of CDS trading. The sample period spans 2001 to 2010. Firms in financial industries are excluded. The dependent variable is ΔEt, the change in annual earnings before extraordinary item, scaled by lagged total assets. D is an indicator variable equal to one if ΔEt-1 is negative, and zero otherwise. CDS is an indicator variable equal to one if a firm has a CDS contract traded over the sample period, and zero for matched control firms. The matched control sample is chosen based on propensity score matching method, where propensity score model is described in Table 1. POST is an indicator variable equal to one if a year falls in the three-year period after the CDS-trade-initiation year, and zero if a year falls in the three-year period prior to the CDS-trade-initiation year for CDS firms. The matched control firms take on the same value of POST as the CDS firms in the pre- and post-CDS-trade-initiation year, respectively. Additional controls include firm size, market-to-book ratio, book leverage, and their corresponding interaction terms with ΔEt, Dt, and Dt × ΔEt. Year and industry fixed effects are included. P-values are based on robust standard errors clustered at the firm level.