Do Firms Decouple Corporate Governance Policy and Practice? Nasha Ananchotikul Bank of Thailand and University of California, Berkeley E-mail: [email protected]Roy Kouwenberg * * * * Erasmus University Rotterdam and Mahidol University E-mail: [email protected], [email protected]Visit Phunnarungsi Mahidol University E-mail: [email protected]This version: April 30, 2009 Abstract In this paper we use data on Thai listed firms to test whether firms with higher levels of good governance policy adoption are less likely to violate listing rules and laws put in place to protect shareholders. Our results suggest that Thai firms on average substantively, as opposed to symbolically, implement recommended governance policies, as violations occur less frequently among firms with higher levels of formal good governance policy adoption. However, we also find evidence of symbolic governance among a small group of “talk-only” firms that issue policy statements about good governance while lagging in the adoption of policies related to shareholders rights and the Board of Directors. A talk-only approach to governance is associated with a predicted increase in the probability of committing violations from 27% to 49%. Key words: Corporate governance; violations; fraud; symbolic implementation; Thailand JEL classification: G3, G38, K42 * Corresponding author: Mahidol University, College of Management, 69 Vipawadee Rangsit Road, 10400, Bangkok, Thailand. Email: [email protected]. Financial support from a CMMU faculty research grant is gratefully acknowledged. We would like to thank Barry Eichengreen, Ingolf Dittmann, Vikramaditya Khanna, Anzhela Knyazeva, Michael Lemmon, Nareerat Taechapiroontong, Thanaphol Virasa, Kelvin Willoughby for their comments, as well as participants at the European Financial Management Association 2008 meeting, the Asian Finance Association 2008 meeting and the EFM Symposium 2009 on Corporate Governance and Control. All errors are ours.
Transcript
Do Firms Decouple Corporate Governance Policy and Practice?
Nasha Ananchotikul Bank of Thailand and University of California, Berkeley
∗ Corresponding author: Mahidol University, College of Management, 69 Vipawadee Rangsit Road, 10400, Bangkok, Thailand. Email: [email protected]. Financial support from a CMMU faculty research grant is gratefully acknowledged. We would like to thank Barry Eichengreen, Ingolf Dittmann, Vikramaditya Khanna, Anzhela Knyazeva, Michael Lemmon, Nareerat Taechapiroontong, Thanaphol Virasa, Kelvin Willoughby for their comments, as well as participants at the European Financial Management Association 2008 meeting, the Asian Finance Association 2008 meeting and the EFM Symposium 2009 on Corporate Governance and Control. All errors are ours.
1
1. Introduction
In the last decades most developed and many developing countries have issued an official
corporate governance code or good governance guidelines.1 Listed firms in these countries are
generally required to disclose their voluntary compliance with the good governance principles.
Outsiders —including minority shareholders and regulators— have to rely mostly on this
disclosed information and annual reports to assess a firm’s corporate governance quality and
typically face a severe asymmetric information problem. This raises an interesting question: is
adoption of formal good governance policies always associated with substantive good governance
practices? In other words, is the adoption of formal good governance policies more than window-
dressing to improve the firm’s external image? A series of corporate meltdowns due to
governance misconducts such as in the cases of Enron, WorldCom and Tyco provides notorious
examples of firms that adopted formal good corporate governance policies while failing to live up
to the intent of these policies.
Some might argue against symbolic implementation of governance policies on the ground
that many empirical studies have found a positive relationship between corporate governance
mechanisms and firm value.2 The most straightforward explanation is that implementation of
good governance principles by the firm helps to create more value for shareholders, leading to a
higher value of the firm. However, managers may also adopt good governance policies only as a
signal to shareholders that they will not expropriate the firm’s assets, and it might be this signal to
investors, not the substantive implementation of good governance practices, that leads to an
increase in the market value of the firm. Investors might process all available information
efficiently, but this does not resolve the fundamental asymmetric information problem regarding
1 The European Corporate Governance Institute (ECGI) provides on its website comprehensive and up-to-date database on official corporate governance codes from 59 countries, including 29 developing countries. See: http://www.ecgi.org/index.htm. 2 See, amongst others: Gompers, Ishii and Metrick (2003), Bauer, Guenster and Otten (2004), Drobetz, Schillhofer and Zimmermann (2004), Klapper and Love (2004), Durnev and Kim (2005), Black, Jang and Kim (2006), Bhagat and Bolton (2008).
2
the substantive implementation of good governance policies. Again, the unforeseen meltdowns of
Enron, WorldCom, and their likes around the world (Parmalat, Ahold, for example) illustrate the
extent of the problem.
The contribution of this paper is to address the important question whether firms adopt
good governance policies substantively or only symbolically, by tracking subsequent violations of
rules and regulations put in place to protect shareholders. Our empirical results suggest that Thai
firms on average implement governance policies substantively: better governance scores in 2002
are associated with a significantly lower number of violations in the period 2003-2006, while
controlling for the level of agency conflicts at the firm. A second contribution is that we also find
strong evidence of symbolic governance among a small group of “talk-only” firms that excel in
issuing declarations on governance and business ethics, while lagging in adoption of policies
related to shareholder rights and board independence. We find that this talk-only approach to
governance is associated with a 96% increase in the propensity to commit violations and an
increase in the probability of committing violations from 27% to 49%.
Very little has been written on the relation between the adoption of formal good
governance policies and subsequent governance practices. Closest to our paper is a study by Chen
et al. (2006) that examines the effect of ownership structure and boardroom characteristics on
corporate financial fraud in China. Using data on enforcement actions of the Chinese Securities
Regulatory Commission, they find that a higher proportion of outside directors is associated with
a lower probability of fraud. While Chen et al. (2006) investigate whether various governance
mechanisms can help to explain fraud, our paper studies violations to see whether a large sample
of Thai firms that voluntarily adopted formal governance policies really implemented them.3
Our empirical analysis uses data on listed firms in Thailand. The Stock Exchange of
Thailand (SET) introduced a voluntary corporate governance code for listed companies in March
3 An indirectly related paper about governance in Asia is Aman and Nguyen (2008), finding no relation between the risk-adjusted excess stock market return of Japanese firms and a corporate governance index.
3
2002 consisting of 15 principles of good governance, similar to existing codes in developed
markets (e.g. the U.K).4 The code addresses the protection of rights of minority shareholders and
other stakeholders, the importance of independent directors and the disclosure of potential
conflicts of interest, among other things. Listed firms must disclose their voluntary compliance
with good governance principles yearly in their annual reports and registration statements on a
“comply-or-explain” basis. In 2003, the Corporate Governance Center of the SET conducted a
study that measured the adoption of the governance code based on firms’ disclosed information
for the fiscal year 2002, resulting in a composite code adoption score for 333 listed companies.
To test our main hypothesis that the adoption of governance policies reduces the
likelihood of subsequent misbehavior by firms, we develop an objective, outcome-based measure
of misbehavior, by focusing on violations of listing rules and regulations put in place to protect
shareholders. Thai listed firms are monitored and regulated by the stock exchange and the Thai
Security and Exchange Committee (SEC). We use publicly available information on violations
announced by both the SET and SEC, including failure to disclose information about related party
connections, failure to disclose other material information, forced rectifications of financial
statements, and violations of the regulations relating to market manipulation and tender offers.
Further, we include data on warnings issued by the exchange when an auditor expresses an
adverse opinion, a disclaimer of opinion, or a qualified opinion about a listed firm’s financial
statements.
The paper is organized as follows. Section 2 provides the theoretical background for the
study and develops hypotheses, based on the existing literature about agency theory and
decoupling. Section 3 describes the methodology and data, including our measures of formal
policy adoption and violations of rules and regulations. Section 4 discusses our empirical results,
including several robustness checks. Section 5 concludes the paper.
4 Prior to the introduction of the 15 principles, in 1998 the Stock Exchange of Thailand (SET) required all listed companies to establish an audit committee. Further, in 1998 the SET also issued a code of best practices for board members of listed companies.
4
2. Theoretical Background and Hypothesis Development
2.1 Agency Conflicts and Adoption of Governance Policy
Berle and Means (1932) and Jensen and Meckling (1976) analyze the classical conflict between
owners and managers in widely held corporations. The problem usually arises due to the
separation of ownership and control as the owners (shareholders) delegate their decision making
authority and leave control over the firm’s assets and operations to the discretion of the managers.
Examples of agency problems include managerial shirking, entrenchment, underinvestment and
fraud. Good corporate governance policies provide firms with high agency conflicts a mechanism
to mitigate these problems. We therefore expect that firms with high agency conflicts are more
likely adopt formal good governance policies:
Hypothesis H1: There is a positive relation between the severity of agency conflicts and
the adoption of formal good governance policies by firms.
In the absence of good governance policies we expect firms with high agency conflicts to violate
rules and regulations that protect shareholders more often than firms with low agency conflicts.
When firms with high agency conflicts implement good corporate governance policies, we expect
violations to decrease in comparison with similar firms without these policies. Hence, controlling
for the level of agency conflicts, we expect a negative relation between governance policy
adoption and violations:
Hypothesis H2: Controlling for the level of agency conflicts at the firm, there is a
negative relation between formal good governance policy adoption and subsequent
violations of rules and regulations.
5
As our study is conducted in a market with high ownership concentration, agency conflicts may
also arise between large and small shareholders. Jensen and Meckling (1976) point out that large
shareholders have greater incentives to monitor managers and hence the presence of a large
shareholder can mitigate agency problems. However, large shareholders might also use their
controlling position in the firm to extract private benefits at the expense of small shareholders.
Villalonga and Amit (2006) refer to the agency conflict between large and small shareholders as a
Type II agency problem, whereas they refer to the classical agency conflict between owners and
managers as a Type I agency problem. In the Thai market the majority of firms (80%) are
controlled by founding families with large stakes and therefore Type II agency problems may
occur. We expect Hypothesis H1 and H2 to hold regardless of the precise type of agency conflicts
(Type I or II), but it implies that our list of proxies for the severity of agency conflicts needs to
include a measure of ownership concentration.
2.2 Evidence on Effectiveness of Governance Mechanisms
Empirical evidence on the effect of widely used governance mechanisms – including outside
directors, audit committees, and institutional shareholders – in monitoring management and
preventing fraud is mixed. Some studies document a negative relationship between good
governance mechanisms and fraud (Beasley, 1996, Chen et al., 2006), and earnings management
(Dechow et al., 1996). Chen et al. (2006) examine the effect of board characteristics on corporate
financial fraud in China and conclude that outside directors can help to deter fraud, while Beasley
(1996) reports similar results for financial statement fraud among U.S. firms.
On the other hand, several other studies find that the presence of governance mechanisms
does not seem to deter corporate misbehavior. For example, Uzun et al. (2004) find that board
characteristics such as size of the board, frequency of meetings, and CEO/Chairman duality are
not associated with fewer fraud occurrences. Agrawal and Chadha (2005) and Park and Shin
6
(2004) find that outside directors do not reduce earnings management; only when there is an
independent director with financial expertise that they find that the probability of earnings
management is lower.5 They also document that other key governance characteristics including
audit committees, the provision of non-audit services by outside directors, and the average tenure
of outside directors, are unrelated to the probability of accounting manipulations.
The apparently mixed results of existing work on the effectiveness of governance
mechanisms calls for more research on this topic. Park and Shin (2004) suggests in a study of
Canadian firms that the ineffectiveness of governance mechanisms may be due to the highly
concentrated ownership and underdeveloped market for outside directors in Canada. We argue
that, beside policy ineffectiveness, decoupling of formal policy from practice may be another
plausible reason why several studies did not detect positive effects of governance mechanisms on
violations. For example, a firm might nominate a director that is formally independent, but in
practice connected to management or controlling shareholders. Audit committees can be
undermined by withholding relevant information, and other tactics. We will now review literature
that provides evidence of decoupling and symbolic actions by firms.
2.3 Decoupling and Symbolic Policy Adoption
Westphal and Zajac (1994) study the adoption and implementation of long-term incentive plans
(LTIPs) by U.S. firms over the period 1972 through 1990. Long-term incentive plans typically
involve stock options, stock appreciation rights, restricted stocks and performance plans for the
CEO and other top managers. LTIPs can be considered as a governance mechanism, as in theory
they mitigate the agency problem between managers and shareholders by tying part of
management compensation to the firm’s stock price. Surprisingly, Westphal and Zajac (1994)
5 Earnings management is not necessarily illegal; it does not violate Generally Accepted Accounting Principles (GAAP). However, managers engaging in earnings management are regarded as being opportunistic and untruthful to shareholders. The sources of earnings manipulations within GAAP include the choice of accounting methods, the application of accounting methods, and the timing of asset acquisitions and dispositions.
7
estimate that at least 21 percent (and up to 45 percent) of the 570 U.S. firms in their sample who
adopted long-term incentive plans did not grant any options, stocks or other units to management
in the following years. Hence, in these cases the adoption of LTIPs is mainly symbolic, as it is
not followed by actual implementation: this is referred to as decoupling of policy from practice.
Westphal and Zajac (1994) draw upon the literature about impression management and
institutional theory to explain why firms decouple the adoption and implementation of LTIPs, and
under what circumstances. First, decoupling increases the legitimacy of powerful CEO’s, while
minimizing the risk of their compensation contracts. Second, decoupling can arise from the need
to manage stakeholder’s impressions in the face of poor firm performance. Third, decoupling can
arise as a reaction to the increased legitimization and institutionalization of LTIPs by firms who
do not actually want to alter their existing compensation structure.
Westphal and Zajac (2001) provide further evidence of decoupling, focusing on stock
repurchase programs. Share buyback plans redistribute part of a firm’s free cash flows to
investors and can therefore reduce agency conflicts. As a measure of stock repurchase plan
implementation, Westphal and Zajac (2001) divide the number of shares repurchased in a given
year as part of an outstanding plan by the number of shares reserved under the plan for repurchase
in that year. On average, the ratio equals 0.09, indicating that many repurchase plans are not, or
only partially, implemented.
The work of Westphal and Zajac and others on decoupling provides an interesting
alternative perspective on the adoption of good governance policies by Thai firms. Initiatives to
improve corporate governance were mainly introduced by the Thai government and Thai
regulatory bodies as a reaction to the Asian crisis, driven by recommendations from international
organizations such as the IMF and the World Bank. As most of these good governance initiatives
did not emanate from Thai firms themselves, a relevant question is to what extent Thai firms
support these governance reforms and whether they implement the policies substantially or only
adopt them symbolically. Relatively poor monitoring by non-family shareholders might facilitate
8
decoupling: there is no active market for corporate control and there are no powerful independent
institutional shareholders in Thailand.6 Further, in a developing country like Thailand, weak rule
of law and lack of human resources may elevate the cost of good governance implementation to
be well above that incurred by firms in mature countries.
As discussed shortly below, our measures of formal corporate governance policy
adoption is divided into three categories: (i) statements issued by firms about good governance,
ethics and corporate mission; (ii) formal policies related to shareholder rights; (iii) board structure
and independence. As the first category is purely based on written statements, the ease of
engaging in purely symbolic actions seems greater. We single out firms that score relatively high
in the first category, but rather low in the second or the third category and label them “talk-only”
firms. We expect that firms in the talk-only group are less likely to substantively implement
formal good governance policies than other firms and have higher violations:
Hypothesis H3: Talk-only firms violate rules and regulations more often than other firms,
controlling for the level of agency conflicts.
3. Methodology and Data 3.1 Measurement of Formal Corporate Governance Policy Adoption In 2003 the SET used information about corporate governance disclosed by firms for the
accounting year 2002 to construct a measure of listed firms’ adoption of the various good
governance policies recommended by the Thai Code. The measure is based on an assessment of:
(i) written claims issued by the firm about its adherence to good governance principles (e.g. the
firm writes in its annual report or on its website that it adheres to principles of good governance);
(ii) formal policies related to the good governance principles that can be objectively verified (e.g.
6 Large foreign institutional shareholders might be the only exception, but their influence is limited by restrictive caps on foreign ownership. See Ananchotikul (2007) for a detailed study of the impact of foreign investment on the corporate governance of Thai listed firms.
9
the firm has procedures facilitating voting by proxy, and the Board has established a remuneration
committee); (iii) disclosure of information related to good governance or relevant for
stakeholders (e.g. the remuneration of each director is disclosed in the annual report).
The governance index constructed by SET is a weighted average of 15 sub scores, one for
each of the 15 principles of good governance described in the Thai code. We have assessed each
of these 15 measures and checked carefully whether they are solely based on written claims by
the firm about the adoption of good governance policies, and/or factual information about the
adoption of formal good governance policies by the firm, without containing additional
information about the substantive implementation of these policies. The reason we want to
exclude potential information about substantive implementation of good governance practices is
that in our research design adoption of formal governance policies is used as a predictor of
subsequent violations, our outcome-based measure of substantive implementation. Hence, we
want to make sure that the adoption of formal policies measure does not accidentally contain
some information about substantive implementation as well.
Below follows a list of nine good governance principles from the Thai Code that we
deem relevant and that meet our criteria, divided in the following three main categories: A. Policy
Statements, B. Shareholder Rights, and C. Board Structure and Independence.7 Below each
principle we list the information used by the Thai exchange to assess the adoption of the principle
by listed firms in 2002. For each of the three groups, we also indicate briefly how firms might be
able to decouple policy and practice.
A. Policy Statements:
Principle 1, “Policy on Corporate Governance”:
– The company has a written corporate governance policy.
7 Appendix A lists the good governance principles that we choose not to use for our study, with motivation.
10
Principle 7: “Business Ethics”
– The Board of Directors provides a code of ethics or statement of business conduct for
all directors and employees.
Principle 5: “Leadership and Vision”
– The company provides information on its corporate vision / mission.
Potential for symbolic adoption: clearly, firms can choose to adopt these policies only
symbolically, without making any substantial changes in firm governance.
B. Formal Policies Related to Shareholder Rights:
Principle 4: Shareholders: Rights and Equitable Treatment
– Implementation of the “one-share-one-vote” principle.
– Procedures facilitating voting through proxy.
Principle 2: “Shareholders’ Meeting”
– Sending out the notice of a shareholder meeting well in advance.
– Providing sufficient information on each agenda item of the shareholder meeting,
including names and sufficient background information when the appointment of a
director or auditor is proposed.
– Encouraging shareholders to express their opinion and ask questions during
shareholder meetings.
Potential for symbolic adoption: given the prevalence of large controlling shareholders in
Thailand, the lack of a market for corporate control, limits on foreign ownership in most
industries, and the absence of large domestic institutional investors who could press for
changes, the majority of listed firms can adopt these policies without effectively giving more
influence to shareholders.
11
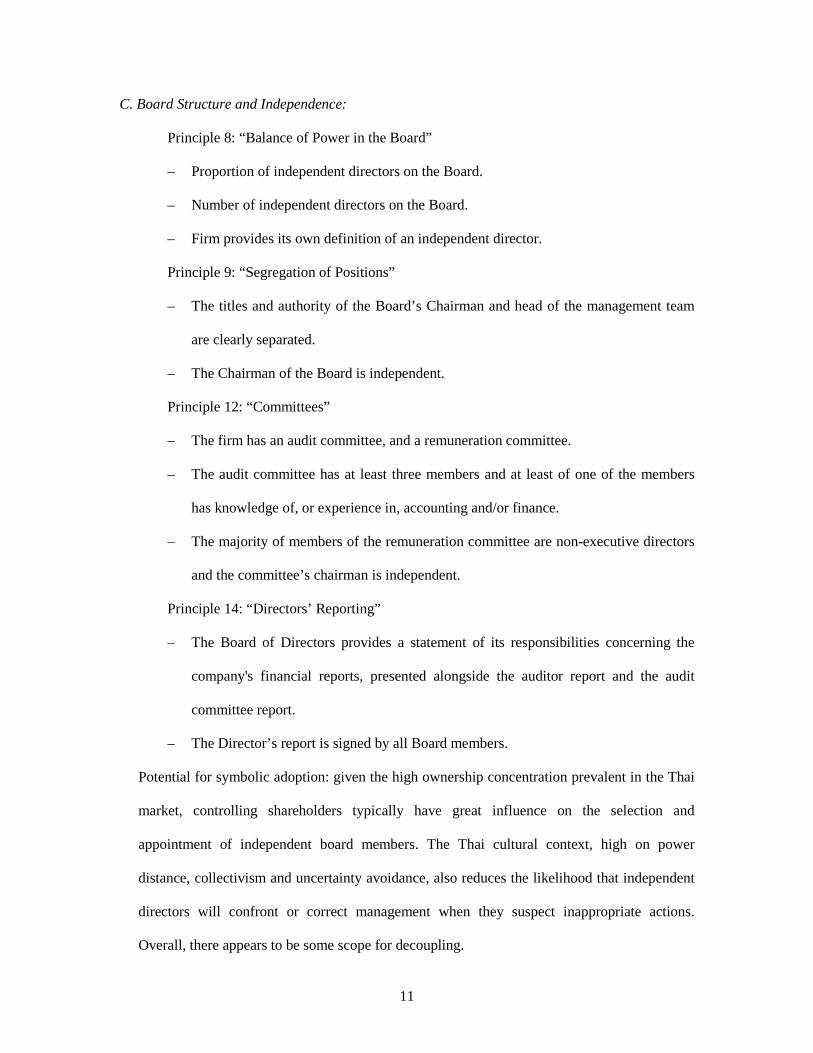
C. Board Structure and Independence:
Principle 8: “Balance of Power in the Board”
– Proportion of independent directors on the Board.
– Number of independent directors on the Board.
– Firm provides its own definition of an independent director.
Principle 9: “Segregation of Positions”
– The titles and authority of the Board’s Chairman and head of the management team
are clearly separated.
– The Chairman of the Board is independent.
Principle 12: “Committees”
– The firm has an audit committee, and a remuneration committee.
– The audit committee has at least three members and at least of one of the members
has knowledge of, or experience in, accounting and/or finance.
– The majority of members of the remuneration committee are non-executive directors
and the committee’s chairman is independent.
Principle 14: “Directors’ Reporting”
– The Board of Directors provides a statement of its responsibilities concerning the
company's financial reports, presented alongside the auditor report and the audit
committee report.
– The Director’s report is signed by all Board members.
Potential for symbolic adoption: given the high ownership concentration prevalent in the Thai
market, controlling shareholders typically have great influence on the selection and
appointment of independent board members. The Thai cultural context, high on power
distance, collectivism and uncertainty avoidance, also reduces the likelihood that independent
directors will confront or correct management when they suspect inappropriate actions.
Overall, there appears to be some scope for decoupling.
12
We create a formal governance policy adoption score for each of the three categories above by
equally weighting the sub-scores given to the various principles. The three cross-sectional policy
adoption indices are denoted by CG Policy, CG Shareholders and CG Board. Finally, we create
our overall measure of adoption of formal good governance policies by firms, CG Total, as an
equally-weighted average of CG Policy, CG Shareholders and CG Board.
Firms that score high on policy statements concerning good governance, business ethics
and corporate mission, but low on formal policies affecting shareholder rights, board structure
and board independence are dubbed “talk-only” firms. To test Hypothesis H3, we create a
talk-only dummy variable: it equals 1 if a firm has a CG Policy score among the top 33 percent,
but either a CG Shareholders score or a CG Board score in the bottom 33 percent; the dummy is
0 otherwise. In total 43 firms out of 333 – 12 percent – are identified as talk-only.
3.2 Measurement of Violations of Rules and Regulations We now describe our measure of violations of the principles of good governance by the firm and
its controlling shareholders, to be used as an indirect, outcome-based, measure of substantive
implementation of good governance practices.
Thai listed companies fall under the supervision of the exchange and the market regulator
(SEC). The Stock Exchange of Thailand (SET) supervises the dissemination of information by
listed companies; it can impose fines, and suspend trading, when listed firms fail to submit
financial reports or any information which is likely to have a significant effect on the stock price.
Further, SET monitors the trading of stocks for signs of insider trading and market manipulation.
SET issues a variety of “trading sign” announcements to notify investors of information
dissemination problems at listed companies, and/or other unusual situations that could potentially
affect a security’s price.
The first sign, “NP (Notice Pending)”, is issued to indicate that the SET is waiting for
additional information or clarification from the company, or when a listed firm has failed to
13
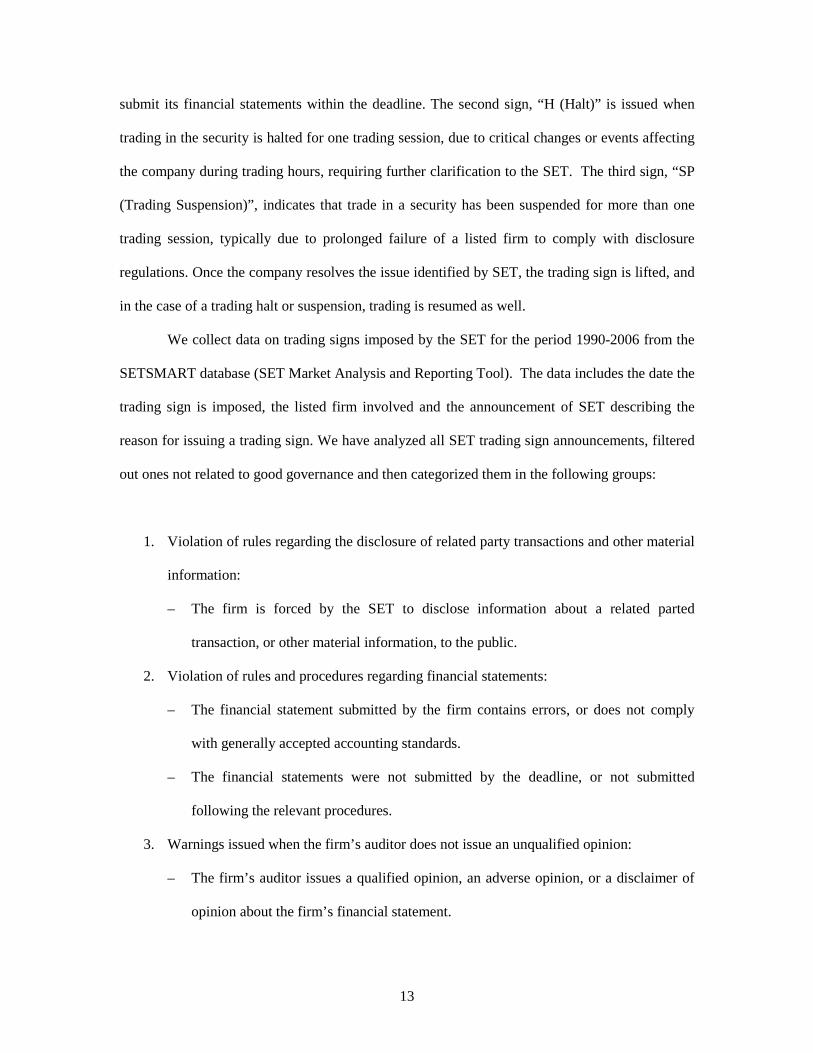
submit its financial statements within the deadline. The second sign, “H (Halt)” is issued when
trading in the security is halted for one trading session, due to critical changes or events affecting
the company during trading hours, requiring further clarification to the SET. The third sign, “SP
(Trading Suspension)”, indicates that trade in a security has been suspended for more than one
trading session, typically due to prolonged failure of a listed firm to comply with disclosure
regulations. Once the company resolves the issue identified by SET, the trading sign is lifted, and
in the case of a trading halt or suspension, trading is resumed as well.
We collect data on trading signs imposed by the SET for the period 1990-2006 from the
SETSMART database (SET Market Analysis and Reporting Tool). The data includes the date the
trading sign is imposed, the listed firm involved and the announcement of SET describing the
reason for issuing a trading sign. We have analyzed all SET trading sign announcements, filtered
out ones not related to good governance and then categorized them in the following groups:
1. Violation of rules regarding the disclosure of related party transactions and other material
information:
– The firm is forced by the SET to disclose information about a related parted
transaction, or other material information, to the public.
2. Violation of rules and procedures regarding financial statements:
– The financial statement submitted by the firm contains errors, or does not comply
with generally accepted accounting standards.
– The financial statements were not submitted by the deadline, or not submitted
following the relevant procedures.
3. Warnings issued when the firm’s auditor does not issue an unqualified opinion:
– The firm’s auditor issues a qualified opinion, an adverse opinion, or a disclaimer of
opinion about the firm’s financial statement.
14
4. Violation of the rules regarding tender offers:
– The firm fails to report that its shareholding of another public company passes a
multiple of 5% of the outstanding shares.
– The firm does not make a tender offer when required.
Apart from the stock exchange, the supervision of listed companies is the responsibility
of the Thai Securities and Exchange Committee (SEC). The SEC investigates possible offences
of the securities law and if it deems that a serious violation has occurred, the SEC will file a
criminal complaint with the Economic Crime Investigation Division of the Thai Police for
prosecution. However, certain less grave offences can be fined directly by the SEC’s Settlement
Committee. We collect data from the SEC’s website on fines imposed and criminal complaints
filed during the period 1999-2006.8 The types of violations include expropriation, falsification of
financial statements, insider trading and market manipulation. The website provides the name of
the offender, the specific law and the section of the law that were violated, a short description of
the accusation and, if available, the fine imposed or the outcome of the criminal justice process.
We examine each case to verify whether the offenders identified by SEC were employees, Board
members or controlling shareholders of a listed company in our sample at the time of the
violation, and if this is the case, we link the violation to the listed company and record the year
the offense took place.9
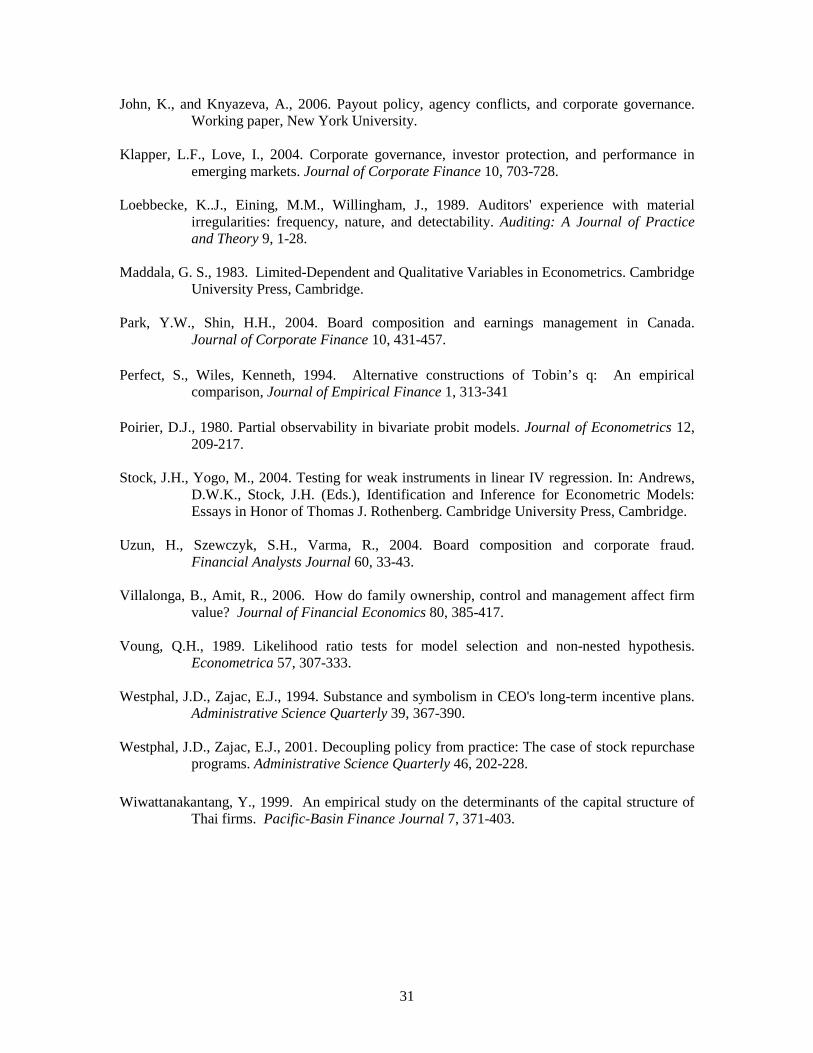
Table 1 provides an overview of all the SEC and SET information that we use to
construct our measure of violations of the principles of good governance, as well as the number of
violations involved. Please note that all violations covered in Table 1 are clearly at odds with
good corporate governance practices, either involving fraud or failure to disseminate relevant
8 Data on SEC violations is available from 1999 onwards. See: http://www.sec.or.th/enforcement/Content_0000000392.jsp?categoryID=CAT0000278&lang=en 9 We also checked for potential overlap with the trading signs imposed by the exchange. In our sample, there are only two cases where a violation received both a SET trading sign and a SEC fine and/or criminal complaint; both cases involved companies failing to make a tender offer.
15
information to shareholders and the public at large. We classify the various violations into three
groups based on their severity, see Table 1, as follows: (1) Severe violation of good governance
principles; (2) Medium, i.e. a violation that is neither severe nor minor; (3) Minor violation.
For our research we are mainly interested in the total number of violations committed by
the firm in the period 2003-2006—the period after the SET governance scores were collected. As
a small number of firms were delisted before the end of 2006, we adjust the number of violations
for the length of period that a stock was listed, creating the following measure: the average
number of violations per year listed in the period 2003-2006. To take into account the difference
in severity among the various violations, we also calculate a severity-weighted measure of the
violations measure, with a weight of 1/6 for minor violations, 2/6 for medium violations and 3/6
for severe violations. The choice of the weights has very little impact on the overall measure, as
the occurrence of medium and severe violations is positively correlated (+0.55), and minor
violations do not occur more frequently than other two types. We will use these two variables as
the dependent variables in our empirical analyses. As control variables in our regression models
we will also use similar measures for the historical period 1990-2002.
Apart from the total number of violations, Table 1 also shows the average number of
violations per year in the period 1990-2002 and 2003-2006. Comparing the two periods, we
observe a remarkable shift from more serious fraud cases in the period 1990-2002 towards
“cooking the books”, i.e. incorrect financial statements, in the period 2003-2006. The underlying
reason is probably the relatively unchecked rapid development of the Thai stock market before
the 1997 crisis, marred by lack of good governance and corruption, followed by a tightening of
the regulatory environment, improved standards of accounting and auditing, and an increased
focus on governance. Although the type of violations detected and/or committed might have
changed, the frequency of violations is remarkably stable: the average number of violations per
firm per year listed is 0.182 in 1990-2002 versus 0.181 in 2003-2006 (correlation: +0.32).
16
3.3 Regression Model The primary variable of interest for our study is the average number of violations per year
committed by listed firms during the period 2003-2006, denoted by Fi for i = 1, 2, …, I. We
would like to test our main hypothesis that the adoption of corporate governance policies,
measured by the index CGi, is negatively related to violations, while controlling for the severity
of agency conflicts (Hypothesis H2). The severity of agency conflicts at firm i is proxied by a set
of k1 variables collected in the vector XACi, including variables such as leverage, dividend payout,
growth opportunities, asset tangibility, size and the presence of a controlling shareholder.
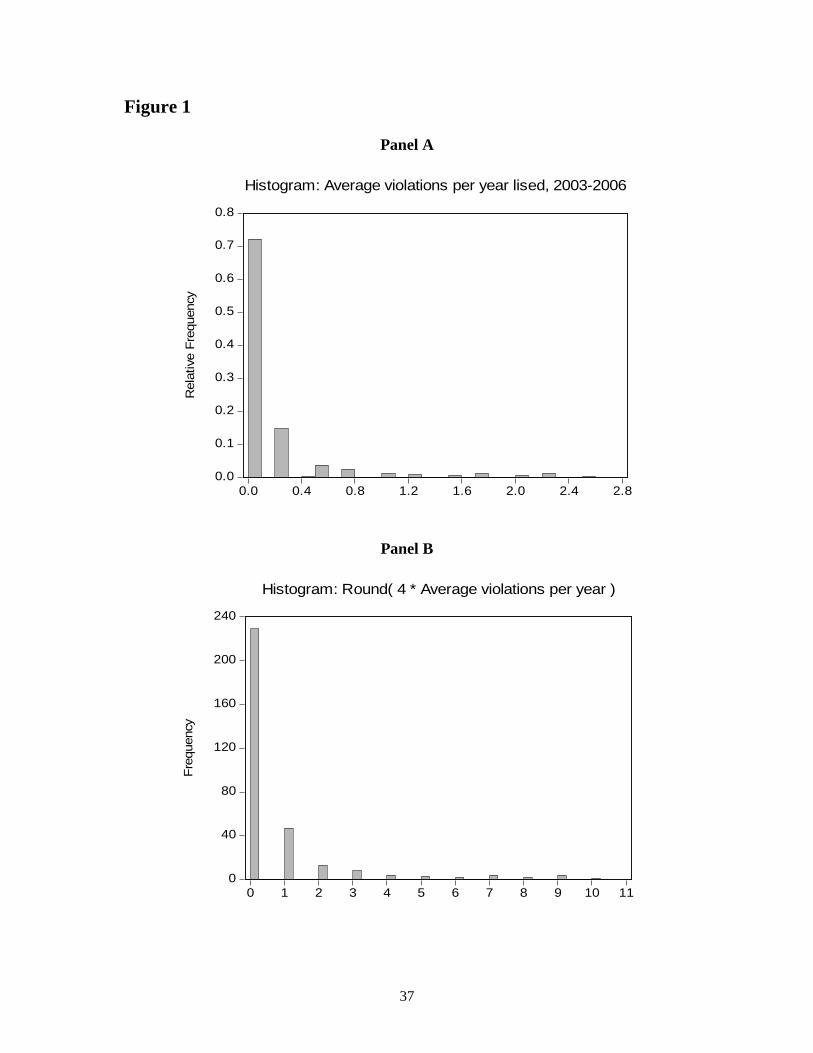
As 239 out of 333 firms in the sample were not found by the regulators to violate any
rules, the distribution of the dependent variable has a relatively large probability mass at zero (see
Figure 1), invalidating ordinary least squares regression models. To take into account the left-
censoring in the data, we estimate a Tobit model:
(1) F*i =
�0 +
�1 CGi +
�2 X
ACi +
�3 X
Otheri + �i,
Fi = F*i, if F*
i > 0,
Fi = 0, if F*i ≤ 0,
where F*
i is a latent variable that measures the firm’s propensity to violate the rules, CGi is a
corporate governance policy adoption index, XACi is a (1 x k1)-vector of proxy variables for the
severity of agency conflicts at firm i, XOtheri is a (1 x k2)-vector of other relevant control variables, �
2 and �
3 are column vectors of size k1 and k2 with regression coefficients, and �i is a normally
distributed error term with constant variance.
The second relevant equation explains formal good governance policy governance
adoption. We expect the index CGi to be positively related to the severity of agency conflicts
(Hypothesis H1):
17
(2) CGi = �0 + � 1 XAC
i + � 2 XOther
i + � 3 Zi + �i,
where Zi is a (1 x k3)-vector of k3 instruments for CGi, �1, �2 and �3 are column vectors of size k1,
k2 and k3 with regression coefficients, and �i is a normally distributed error term with constant
variance.
Endogeneity is a concern when estimating the Tobit equation (1) for violations. For
example, suppose that relevant variables have been omitted that affect both violations Fi and
CGi.10 In that case CGi would become correlated with the error term �i of equation (1) and the
estimated coefficient 1β̂ for CGi would become biased. We try to mitigate this potential
endogeneity problem by using two-stage Tobit estimation with instrumental variables (Heckman,
1979, and Maddala, 1983). In the first stage we estimate (2) by OLS, regressing CGi on all
relevant explanatory variables and a vector of instruments Zi that affect CGi but not violations. In
the second stage we estimate equation (1) for violations with a Tobit regression, but with CGi
replaced by the first stage predicted values. We use the Stock and Yogo (2004) test for weak
instruments to select appropriate instruments for CGi. We use a Wald test and the Durbin–Wu–
Hausman test (see, e.g., Davidson and MacKinnon 1993, pp. 237-242) to test the exogeneity of
CGi in the violations equation. If we cannot reject that CGi is exogenous in (1), then two-stage IV
estimation is inefficient and it is better to estimate (1) directly with a regular Tobit regression.
3.3.1 Control variables related to the severity of agency conflicts
We will now define all control variables for the regression models, including a brief motivation
and the expected sign of the corresponding coefficients. The severity of agency conflicts is
proxied by the following set of variables (XACi): leverage, dividend payout, growth opportunities,
asset tangibility, size and the presence of a controlling shareholder. Leverage is the ratio of total
10 The severity of agency conflicts at the firm could affect both violations and governance policy adoption. However, the severity of agency conflicts is not an omitted factor, as we explicitly include and control for several proxies for agency conflicts (XAC
i) in both equations.
18
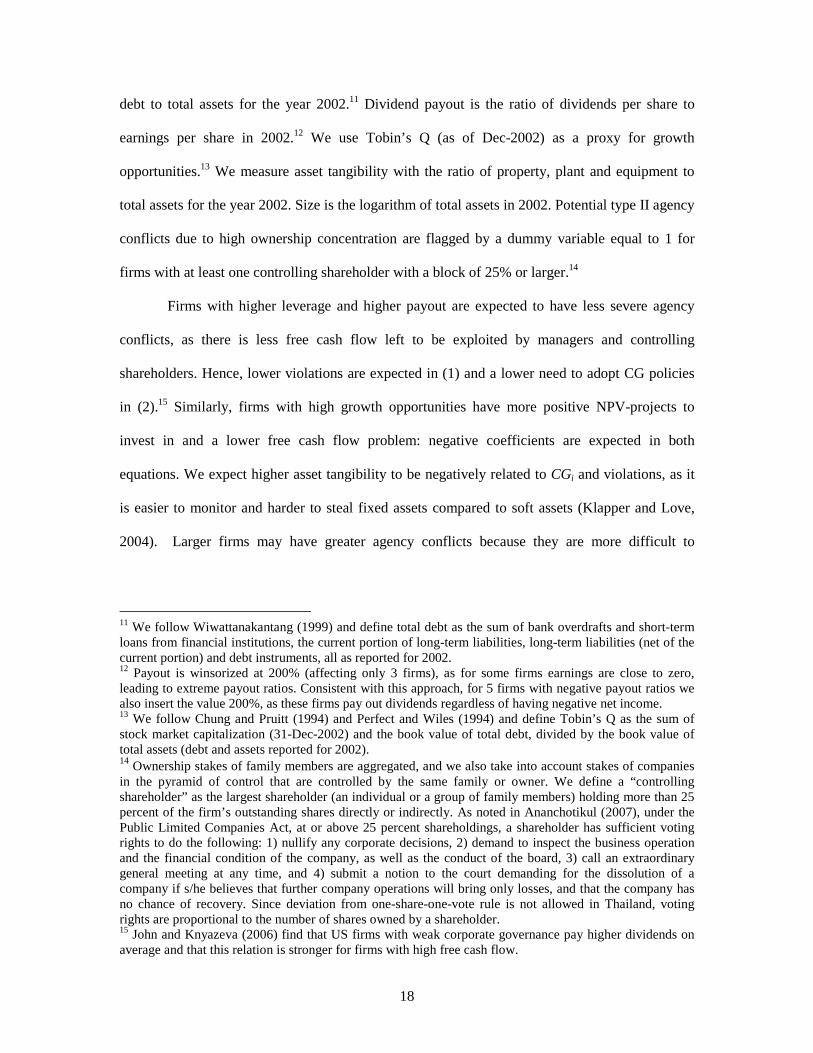
debt to total assets for the year 2002.11 Dividend payout is the ratio of dividends per share to
earnings per share in 2002.12 We use Tobin’s Q (as of Dec-2002) as a proxy for growth
opportunities.13 We measure asset tangibility with the ratio of property, plant and equipment to
total assets for the year 2002. Size is the logarithm of total assets in 2002. Potential type II agency
conflicts due to high ownership concentration are flagged by a dummy variable equal to 1 for
firms with at least one controlling shareholder with a block of 25% or larger.14
Firms with higher leverage and higher payout are expected to have less severe agency
conflicts, as there is less free cash flow left to be exploited by managers and controlling
shareholders. Hence, lower violations are expected in (1) and a lower need to adopt CG policies
in (2).15 Similarly, firms with high growth opportunities have more positive NPV-projects to
invest in and a lower free cash flow problem: negative coefficients are expected in both
equations. We expect higher asset tangibility to be negatively related to CGi and violations, as it
is easier to monitor and harder to steal fixed assets compared to soft assets (Klapper and Love,
2004). Larger firms may have greater agency conflicts because they are more difficult to
11 We follow Wiwattanakantang (1999) and define total debt as the sum of bank overdrafts and short-term loans from financial institutions, the current portion of long-term liabilities, long-term liabilities (net of the current portion) and debt instruments, all as reported for 2002. 12 Payout is winsorized at 200% (affecting only 3 firms), as for some firms earnings are close to zero, leading to extreme payout ratios. Consistent with this approach, for 5 firms with negative payout ratios we also insert the value 200%, as these firms pay out dividends regardless of having negative net income. 13 We follow Chung and Pruitt (1994) and Perfect and Wiles (1994) and define Tobin’s Q as the sum of stock market capitalization (31-Dec-2002) and the book value of total debt, divided by the book value of total assets (debt and assets reported for 2002). 14 Ownership stakes of family members are aggregated, and we also take into account stakes of companies in the pyramid of control that are controlled by the same family or owner. We define a “controlling shareholder” as the largest shareholder (an individual or a group of family members) holding more than 25 percent of the firm’s outstanding shares directly or indirectly. As noted in Ananchotikul (2007), under the Public Limited Companies Act, at or above 25 percent shareholdings, a shareholder has sufficient voting rights to do the following: 1) nullify any corporate decisions, 2) demand to inspect the business operation and the financial condition of the company, as well as the conduct of the board, 3) call an extraordinary general meeting at any time, and 4) submit a notion to the court demanding for the dissolution of a company if s/he believes that further company operations will bring only losses, and that the company has no chance of recovery. Since deviation from one-share-one-vote rule is not allowed in Thailand, voting rights are proportional to the number of shares owned by a shareholder. 15 John and Knyazeva (2006) find that US firms with weak corporate governance pay higher dividends on average and that this relation is stronger for firms with high free cash flow.
19
monitor: stricter governance mechanisms and higher violations are expected.16 Finally, type II
agency conflicts are expected to be higher in firms with at least one controlling shareholder, as
well as violations and CGi. In sum: leverage, dividend payout, Tobin’s Q and asset tangibility are
negatively related to agency conflicts and for these variables we expect negative coefficients in
equations (1) and (2). Firm size and the controlling shareholder dummy are positively related to
agency conflicts and we therefore expect positive coefficients in equations (1) and (2).
We would like point out briefly that some of our proxies for the severity of agency
conflicts could have different effects than described previously, as agency conflicts can have
several dimensions. For example, we expect high type II agency conflicts between minority
shareholders and controlling shareholders (usually a family or business group in Thailand), due to
entrenchment effects. However, it might be the case that the positive effect of alignment of
interest between managers and owners dominates, potentially leading to lower violations and
lower need to increase CGi. Similarly, agency conflicts between bondholders and shareholders
may change the effect of leverage. For example, Dechow et al. (1996) point out that highly
leveraged firms are more likely to misstate financial statements and manipulate earnings to avoid
debt-covenant violations.
3.3.2 Other control variables
We include a dummy variable for talk-only firms in the violations equation to test Hypothesis H3.
Further, we also include this dummy in the governance policy adoption equation, as talk-only
firms may have relatively high overall good governance policy adoption scores due to their effort
in making declarations and policy statements about good governance.
For the violations equation we select a number of control variables that are expected to be
related to the propensity to commit violations or the likelihood of detection. As a robustness
16 Smaller firms may also have higher growth opportunities and therefore a need for better governance to attract external financing (Klapper and Love, 2004). However, growth opportunities are already explicitly controlled for in both equations.
20
check we will later on also estimate versions of equation (1) that take into account the partial
observability of violations, by adding a separate probit equation for the detection of violations and
fraud. We refer to Appendix B for the exact models and details. We expect that firms with lower
profitability, measured by return on assets (ROA) in 2002, are more likely to commit violations.
Loebbecke et al. (1989) find that poor financial performance often causes management to place
undue emphasis on reported earnings.
We expect past violations, measured by the average number of violations per year listed
in the period 1990-2002, to be positively related to future violations (2003-2006). As observed by
Dana (2001), regulators and auditors closely monitor firms with repeated violations, so the
probability of apprehension may increase with past violations. We also include a dummy equal to
one if return on assets (ROA) in 2002 is in the top or bottom percentile. Regulators and auditors
might scrutinize firms with either very low or high profitability more closely to check for
irregularities. Finally, we include a dummy for consolidation of financial statements. Firms with
consolidated financial statements tend to be more transparent (Durnev and Kim, 2005) and hence
we expect that these firms are less likely to violate the accounting rules.
3.3.3 Instruments for governance policy adoption
The Thai corporate governance code was a new initiative in 2002 and we expect that the
familiarity of board members with the code may have influenced adoption. Directors frequently
serve on multiple boards: 69% and 19% of board members serve on one and two other boards,
respectively. We expect a positive relation between the ratio of directors serving on other boards
and code adoption because these directors are more likely to observe good governance practices
at other firms and push for adoption at firms with lacking governance mechanisms. We do not
expect the ratio to be related to violations, as apart from potentially giving the director more
21
experience, serving on several boards also consumes more time and spreads the director’s
attention over multiple firms.17
As a second potential instrument, we use a dummy for firms that received ISO14000
certification before or during 2003. We expect that firms with ISO14000 certification are more
familiar with adopting standards for stakeholders and therefore more willing to adopt governance
policies to reduce agency conflicts. We include firms that have received ISO14000 in the year
2003, as it may take a long time for firms to be approved for ISO14000 certification and most
likely these firms have been working on ISO certification since 2002 or earlier.
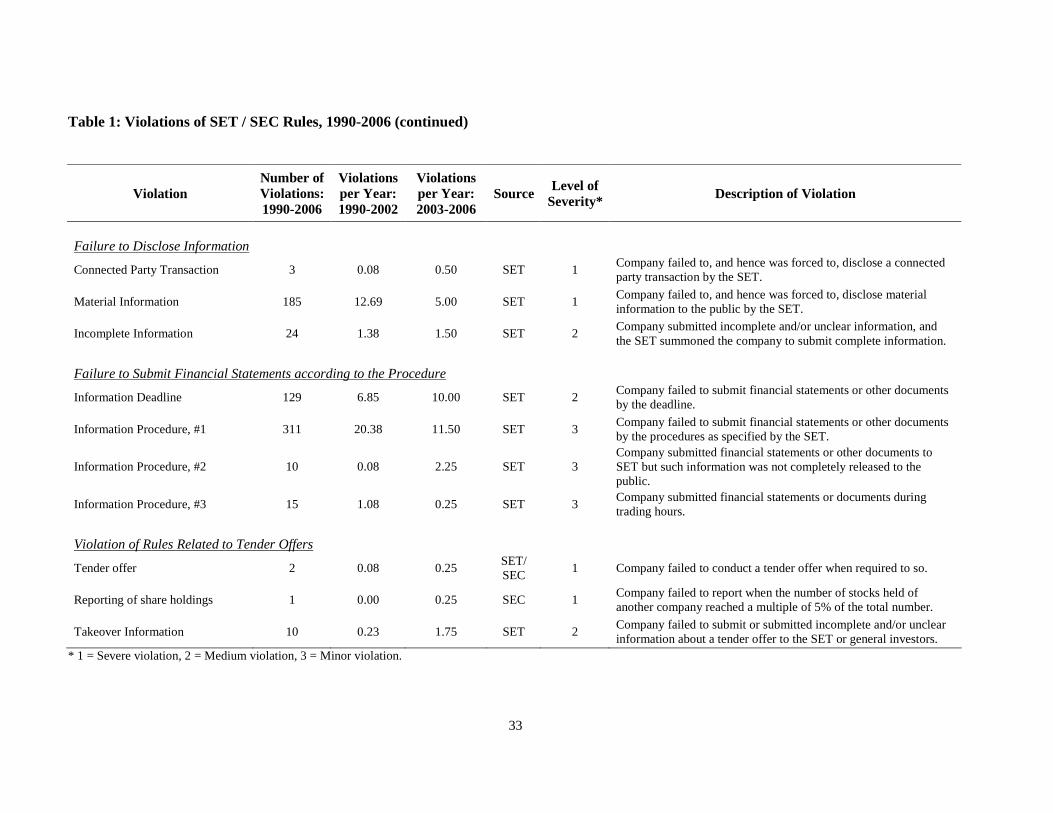
3.4 Descriptive Statistics Table 2 presents summary statistics of the formal good governance policy adoption index and the
three sub indices. The composite index (CG Total) has a mean of 69.77 with standard deviation
14.20, and ranges from 28.59 to 96.05. As a preliminary analysis, we look at the correlation
between the code adoption index and violations. CG Total in 2002 and the average frequency of
violations in the period 2003-2006 have a correlation of -0.24 with a t-statistic of -4.52 (not
shown in the table), which indicates a statistically significant negative relationship.
Further, in Table 3 we group the firms into five quantiles by CG Total and estimate the
mean frequency of violations within each group. It is clear that the average frequency of
violations is monotonically decreasing as the group average of CG Total increases. The ANOVA
F-test and Welch F-test clearly reject equality of the mean violation frequency among the quintile
groups (with p-values of 0.002 and 0.000, respectively). When we only focus on firm policy
statements about governance, i.e. the CG Policy index, the results are similar and significant.
The inverse relationship reported suggests that firms with higher formal good governance
policy adoption scores indeed behave better than firms with poorer scores, implying substantive
17 The data confirms this: the ratio of directors serving on other boards has a significant positive correlation of 0.26 (p-value < 0.001) with CGi and insignificant correlation with violations (r = -0.10, p-value = 0.10).
22
implementation of governance policies. However, we cannot readily make the above conclusion
since here we have not controlled for other factors that might affect violation propensity and the
violation detection probability. We will investigate the relationship in a fully specified model
in Subsection 4.2. Table 4 shows summary statistics of the variables that will be used in the
regression models. For our regression analysis the sample is limited to 275 non-financial firms
only, as some variables such as leverage can be substantially different for financial firms. Out of
275 non-financial firms, 19 firms have missing data on past violations or no data on stock market
value in 2002 (due to lack of trading), leaving a sample of 256 firms with complete data.18
4. Empirical Results
4.1 Governance Policy Adoption To test hypothesis H1 we estimate equation (2), explaining the good governance policy adoption
index CG Total with variables proxying for agency conflicts, other controls and instruments. We
find that leverage has a negative relation with the adoption of governance policies
(p-value = 0.0901), as expected given that firms with high leverage have a lower free cash flow
problem and less severe agency conflicts. Similarly, we find that large firms have significantly
higher good governance policy adoption scores than smaller firms (p-value = 0.002),
corresponding to our expectation that large firms have more severe agency conflicts. Dividend
payout, growth opportunities and asset tangibility have negative signs as expected, but the
coefficients are not significantly different from zero. The sign of the control dummy is negative,
but not significant.
Among the other control variables in the equation, the talk-only dummy is significantly
positive (p-value < 0.01). This indicates that talk-only firms manage to achieve higher overall
18 Firms were selected based on data availability in 2002 and therefore there is no survivorship bias in the period 2003-2006 used for measuring violations. When a firms drops out of the sample in the period 2003-2006 we simply measure average violations over the months that are available for that firm.
23
governance policy scores than other comparable firms, as the high scores for policy declarations
apparently more than compensate for below average scores for policies relating to shareholder
rights and the board. The remaining control variables are insignificant.
The instrument directors on other boards has a significantly positive relation with
policy adoption tends to increase when a firm’s board has a higher proportion of directors serving
on other boards. The F-statistic passes the weak instrument test of Stock and Yogo (2004) at a
significance level of 5%, for a bias level between 10% and 20%. As explained in the robustness
section, after eliminating redundant independent variables that are insignificant in both equation
(1) and (2), the F-statistic for directors on other boards increases from 8.51 to 9.80, passing the
Stock and Yogo (2004) weak instrument test at a lower bias level of 10%. We do not report
estimation results in Table 5 for the second proposed instrument, the ISO14000 certification
dummy, as the estimated coefficient was insignificant (p-value = 0.330, F-statistic = 0.95), and
hence it did not pass the test. Column 1 of Table 5 displays the first stage regression model used
to generate instrumented values for governance policy adoption (subsequently used in the second
stage Tobit equation), only using the proportion of directors on other boards as an instrument for
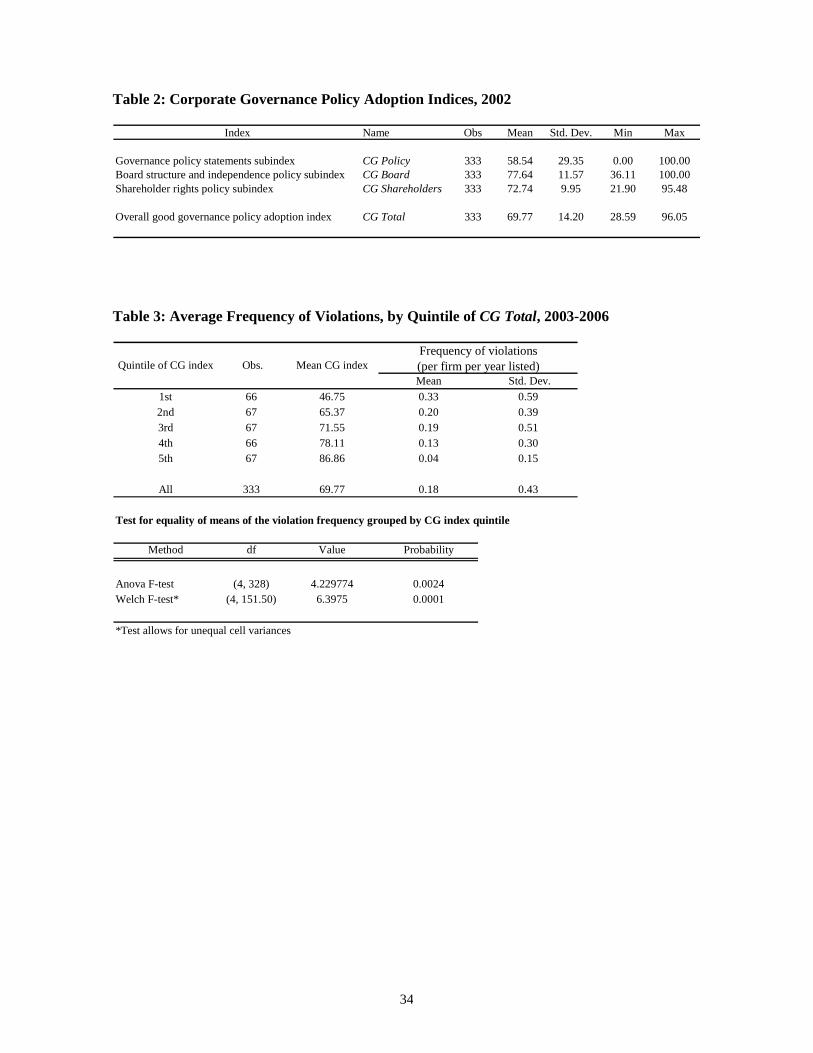
governance. The adjusted R2 of the first stage regression is 0.166.
4.2 Governance Policy Adoption and Violations We now test our main hypothesis (H2) and investigate whether there is a negative relation
between formal good governance policy adoption and subsequent violations of rules and
regulations, while controlling for the severity of agency conflicts at the firm. The second column
of estimates in Table 5 displays the baseline Tobit estimation results. Consistent with the
correlation results, after controlling for agency conflicts and other variables in a fully specified
model, CG Total in 2002 has a significant negative relation with subsequent violations in the
period 2003-2006 (p-value = 0.039). Thus, hypothesis H2 is supported. The result suggests that
24
Thai firms on average substantively implement good governance policies. For a widely-held firm
of average size and profitability, a one standard deviation increase in CG Total is associated with
a decrease in the propensity to commit violations of 0.14 per year (29% decrease relative to the
mean) and a decrease in the probability of committing violations from 27% to 21%.
However, we also find clear evidence of decoupling of policy and practice among some
firms. Consistent with hypothesis H3, talk-only firms have a significantly higher propensity to
commit violations (p-value = 0.014). For a widely-held firm of average size and profitability, a
talk-only approach to governance is associated with an increase in the propensity to commit
violations of 0.46 per year (96% increase relative to the mean) and an increase in the probability
of committing violations from 27% to 49%. Hence, investors can reduce their exposure to
violations substantially by avoiding firms that have issued many policy declarations about good
governance, while actually lagging in adoption of good governance policies related to shareholder
rights and the board of directors.
Among the proxies for the severity of agency conflicts, dividend payout has a significant
negative relation with violations (p-value = 0.067), while leverage has a significantly positive
relation (p-value = 0.039). The sign of dividend payout is as predicted: firms with larger dividend
payouts commit less violations as agency conflicts are reduced by high dividend payments. The
sign of leverage is unexpected, however: Thai firms with higher leverage commit more violations,
while we would expect lower violations due to reduced free cash flows. The severity of agency
conflicts between bondholders and shareholders may explain this result. For example, Dechow et
al. (1996) point out that highly leveraged firms are more likely to misstate financial statements
and manipulate earnings to avoid debt-covenant violations.
Focusing on the remaining control variables, we find that less profitable firms are more
likely to commit violations (ROA, p-value = 0.002), as expected. Firms with bad past records of
violations also have a higher rate of violations in the subsequent period (p-value = 0.009).
Consolidation of financial statements is negatively related to violations (p-value = 0.081).
25
So far we have taken corporate governance policy adoption as exogenous. A concern
about these Tobit model estimation results is that there might be omitted factors that affect both
governance policy adoption and violations simultaneously, potentially creating correlation
between the random error term of the violations equation and the governance policy adoption
index. We have therefore also estimated equation (2) with a two-stage Tobit estimation approach,
where the governance policy adoption index is replaced by predicted values from the first stage
regression (1). The second stage IV-Tobit estimation results for the violations equation are
displayed in the third column of Table 5, while the first stage OLS regression results for CG Total
are displayed in the first column as discussed before.
Comparing the IV-Tobit results (in column 3) to the regular Tobit results (in column 2),
we observe that the variables CG Total, Leverage and Consolidation are no longer significant
after two-stage IV Tobit estimation. The estimated coefficient of CG Total is more negative than
before (-0.036 versus -0.010), in line with hypothesis H2, but the increase in the standard error of
the coefficient is even lager (0.029 versus 0.005), leaving the variable insignificant (p-value =
0.217).
The Wald test statistic of exogeneity for the IV Tobit regression is equal to 0.81, with
p-value of 0.399. Hence, we cannot reject the null that CG Total is exogenous to the violations
equation. The Durbin–Wu–Hausman test gives a similar result (F-statistic = 0.89, p-value =
0.348) and cannot reject exogeneity of CG Total. Based on these two tests, we conclude that
CG Total is not correlated with the error term of the violations equation. IV estimation is an
inefficient method when CG Total is exogenous to the violations equation (inefficiency gives rise
to larger standard errors than necessary) and the regular Tobit model in column 2 is the preferred
model specification. We are therefore not very concerned about the insignificance of CG Total in
the IV-Tobit model specification, taking into account that the coefficient is actually more
negative than before and that the tests of exogeneity favor the regular Tobit model.
26
4.3 Robustness of the Results
We have repeated all estimations with the CG Policy index instead of the broader CG Total index,
focusing only on declarations by the firm about ethics and good governance. Interestingly, the
estimation results hardly change (results not reported to save space) and we reach similar
conclusions: on average a higher level of declarations about good governance is significantly
associated with lower subsequent violations, while controlling for the severity of agency
conflicts. Still, talk-only firms do have a significantly higher propensity to commit violations,
suggesting that decoupling does occur among this group of firms. As a further robustness check,
we have also used the average severity-weighted number of violations as the dependent variable
in the Tobit models, based on the classification of violations in three severity groups in Table 1.
The results and conclusions are very similar to those for the non-weighted case and not reported
to save space (available on request).
A standard Tobit model ignores the fact that not all violations committed by firms are
detected by the regulators. Following Poirier (1980), Feinstein (1990) and others, we can add one
equation to model the probability that violations are detected by regulators, resulting in a Tobit
model with partial observability. We refer to Appendix B for the specification and technical
details. We select past violations, the dummy for exceptionally high or low profitability and size
as variables for the detection equation. Regulators might be more reluctant to report violations of
larger –established– firms, while past violations and exceptional profitability might invite more
scrutiny. The estimation results for Tobit models with partial observability are disappointing, as
none of the variables in the fraud detection equation are statistically significant. We have also
included a dummy variable in the detection equation for firms with family connections to cabinet
members, as Thai firms with political connections may have more power and ability to lobby the
27
regulators not to announce violations.19 Again, the coefficient was not significant, providing no
added value beyond a standard Tobit model.
As the assumption of a normally distributed error term is often violated for our estimated
Tobit models, we have investigated count data models as an alternative. Even though the average
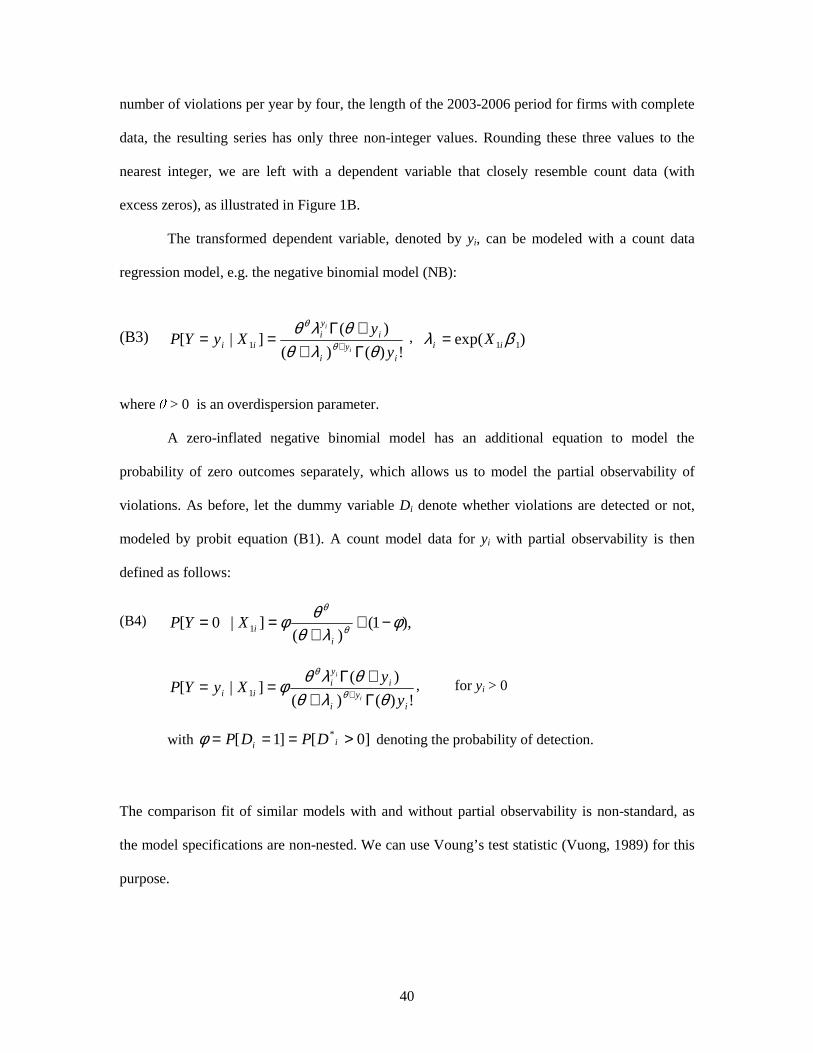
number of violations per year is measured on a ratio scale, we can transform the variable back to
count data with almost no loss of information. After multiplying the average number of violations
per year by four, the length of the 2003-2006 period for firms with complete data, the resulting
series has only three non-integer values. After rounding these three values to the nearest integer,
we are left with a dependent variable that closely resemble count data (with excess zeros), as
illustrated in Figure 1B. We have estimated a negative binomial count data model and a zero-
inflated negative binomial model. The latter model is a count data model with a separate probit
equation for zero observations, which allows us to take into account partial observability of
violations (similar to a Tobit model with partial observability). Again, we find that the results are
similar to the Tobit estimation results in Table 5, except that the coefficient of dividend payout is
no longer significant. Adding a detection equation again does not add value, as the coefficients of
all variables included in the equation are insignificant.
If explanatory variables are incorrectly included in a regression model, the standard errors
of all variables may be larger than necessary. Four explanatory variables are insignificant in both
equation (1) and in equation (2) in Table 5: Tobin’s Q, asset tangibility, the control dummy and
the dummy for firms with very high/low ROA. As a robustness check, we exclude these four
variables and re-estimate the models. We find that the significance of the remaining variables
increases markedly and all conclusions are reinforced. For example, the p-value of the estimated
19 We create a dummy for listed firms partially owned (5% or more) by cabinet members and their family. From February 9, 2001, until the coup of September 19, 2006, the telecom tycoon Thaksin Shinawatra was prime minister of Thailand. Many cabinet members in the governments led by telecom tycoon Thaksin Shinawatra belonged to families that owned large businesses. Bunkanwanicha and Wiwattanakantang (2007) show that the market value of firms connected to these cabinet members increased much stronger during this period than the value of similar non-connected firms.
28
coefficient of CG Total decreases from 3.9% to 0.3%. The smaller model specification may also
alleviate concerns about the potential weakness of our instrument for CG Total, as the F-statistic
for the ratio of directors on other boards increases from 8.51 to 9.80, passing the Stock and Yogo
(2004) weak instrument test at a bias level of 10%.
Finally, some readers may be concerned that our instrument ratio of directors on other
boards is related to future violations. We would prefer to use an alternative instrument for a
robustness check, but very few good instruments for governance have been found in the literature
so far.20 Doidge, Karolyi and Stulz (2007) report multi-country evidence that firm-level corporate
governance in emerging markets is difficult to explain, appearing to be largely random or
exogenous. Single country studies by Black, Jang and Kim (2006) in Korea and
Balasubramanian, Black and Khanna (2008) in India also find that much of the variation in
firm-level governance is idiosyncratic. This is also reflected in the low adjusted R2 of 0.166 that
we report. The prevailing evidence that firm-level governance by firms in emerging markets is
largely idiosyncratic confirms the results of our two exogeneity tests and in our opinion reduces
potential concerns about the endogeneity of governance.
5. Conclusions
This paper investigates whether the adoption of formal good corporate governance policies by
listed firms is mainly symbolic or indicative of substantive implementation of good governance
practice. Our empirical results suggest that Thai firms on average implement governance policies
substantively, as opposed to symbolically: a higher level of adoption of formal good governance
policies is associated with a significantly lower number of subsequent violations in the period
2003-2006, while controlling for the level of agency conflicts at the firm.
20 A study by Black, Jang and Kim (2006) on governance and firm value in Korea is an exception, using unique features of Korean legal rules to construct an instrument for a corporate governance policy index. Quoting Black et al. (2006, p.367): “Good instruments are not available in other comparable studies.”
29
However, there is a small group of “talk-only” firms that excel in issuing declarations on
governance and business ethics, while lagging in adoption of policies related to shareholder rights
and board independence. We find that such a talk-only approach to governance is associated with
an increase in the propensity to commit violations of 0.46 per year (96% increase relative to the
mean) and an increase in the probability of committing violations from 27% to 49%. Another
finding is that Thai firms with high leverage might suffer from agency conflicts between
bondholders and shareholders, as an increase in leverage is associated with higher violations.
Our paper can be extended in several directions. First, we lack time series information on
governance code adoption for running a panel regression that might provide more reliable results.
Second, if a database of comparable information on governance adoption and fraud and violations
can be constructed for multiple countries – and this is still an open question, due to potential
divergence in rules and regulations from one country to the other, as well as variety in the levels
of enforcement – it would be relevant to extend this study to multiple countries.
References Agrawal, A., Chadha, S., 2005. Corporate governance and accounting scandals. Journal of Law
and Economics 48, 371-406. Aman, H., Nguyen, P., 2008. Do stock prices reflect the corporate governance quality of Japanese
firms? Journal of the Japanese and International Economies 22, 647-662. Ananchotikul, N., 2007. Does foreign investment really improve corporate governance? Evidence
from Thailand. Working paper, University of California, Berkeley. Balasubramanian, B.N., Black, B.S. and Khanna, V.S., 2008, Firm-level corporate governance in
emerging markets: A case study of India, Working paper, University of Michigan. Bauer, R., Guenster, N., Otten, R., 2004. Empirical Evidence on corporate governance in Europe:
The effect on stock return, firm value and performance, Journal of Asset Management 5, 91-104.
Beasley, M.S., 1996. An empirical analysis of the relation between the board of director
composition and financial statement fraud. Accounting Review 71, 443-465.
30
Berle, A.A., Means, G.C., 1932. The Modern Corporation and Private Property. Macmillan, New York.
Bhagat, S., Bolton, B., 2008. Corporate governance and firm performance. Journal of Corporate
Finance 14, 257–273. Black, B.S., Jang, H., Kim, W., 2006. Does corporate governance predict firms’ market values?
Evidence from Korea. Journal of Law, Economics, and Organization 22, 366-413. Bunkanwanicha, P., Wiwattanakantang, Y., 2007, Big business owners in politics,
Working paper, AFA 2007 Chicago Meetings. Chen, G., Firth, M., Gao, D.N., Rui, O.M., 2006. Ownership structure, corporate governance, and
fraud: Evidence from China. Journal of Corporate Finance 12, 424-448. Chesher, A., Irish, M., 1987. Residual analysis in the grouped data and censored normal linear
model. Journal of Econometrics 34, 33-62. Chung, K. H., Pruitt, S. W., 1994. A simple approximation of Tobin’s Q. Financial
Management 23, 70-74. Dana, D.A., 2001. Rethinking the puzzle of escalating penalties for repeat offenders. Yale Law
Journal 110, 733-783. Davidson, R., MacKinnon, J.G., 2004. Estimation and Inference in Econometrics. Oxford
University Press, New York. Dechow, P.M., Sloan, R.G., Sweeney, A.P., 1996. Causes and consequences of earnings
manipulation: An analysis of firms subject to enforcement actions by the SEC. Contemporary Accounting Research 13, 1-36.
Doidge, C.A., Karolyi, G.A., Stulz, R.M., 2007. Why do countries matter so much for corporate
governance? Journal of Financial Economics 86, 1-39. Durnev, A., Kim, E.H., 2005. To steal or not to steal: Firm attributes, legal environment, and
valuation. Journal of Finance 60, 1461-1493. Drobetz, W, Schillhofer, A, Zimmermann, H., 2004. Corporate governance and expected stock
returns: Evidence from Germany. European Financial Management 10, 267-293. Feinstein, J., 1990. Detection controlled estimation. Journal of Law and Economics 33, 233-276. Gompers, P.A., Ishii, J.L., and Metrick, A., 2003, Corporate governance and equity prices,
Quarterly Journal of Economics 118, 107-155.
Heckman, J, 1979. Sample selection bias as a specification error. Econometrica 47, 153-161.
Jensen, M., Meckling, W., 1976. Theory of the firm: Managerial behavior, agency costs, and capital structure. Journal of Financial Economics 3, 305-360.
31
John, K., and Knyazeva, A., 2006. Payout policy, agency conflicts, and corporate governance. Working paper, New York University.
Klapper, L.F., Love, I., 2004. Corporate governance, investor protection, and performance in
emerging markets. Journal of Corporate Finance 10, 703-728. Loebbecke, K..J., Eining, M.M., Willingham, J., 1989. Auditors' experience with material
irregularities: frequency, nature, and detectability. Auditing: A Journal of Practice and Theory 9, 1-28.
Maddala, G. S., 1983. Limited-Dependent and Qualitative Variables in Econometrics. Cambridge
University Press, Cambridge. Park, Y.W., Shin, H.H., 2004. Board composition and earnings management in Canada.
Journal of Corporate Finance 10, 431-457.
Perfect, S., Wiles, Kenneth, 1994. Alternative constructions of Tobin’s q: An empirical comparison, Journal of Empirical Finance 1, 313-341
Poirier, D.J., 1980. Partial observability in bivariate probit models. Journal of Econometrics 12, 209-217.
Stock, J.H., Yogo, M., 2004. Testing for weak instruments in linear IV regression. In: Andrews,
D.W.K., Stock, J.H. (Eds.), Identification and Inference for Econometric Models: Essays in Honor of Thomas J. Rothenberg. Cambridge University Press, Cambridge.
Uzun, H., Szewczyk, S.H., Varma, R., 2004. Board composition and corporate fraud.
Financial Analysts Journal 60, 33-43. Villalonga, B., Amit, R., 2006. How do family ownership, control and management affect firm
value? Journal of Financial Economics 80, 385-417. Voung, Q.H., 1989. Likelihood ratio tests for model selection and non-nested hypothesis.
Econometrica 57, 307-333. Westphal, J.D., Zajac, E.J., 1994. Substance and symbolism in CEO's long-term incentive plans.
Administrative Science Quarterly 39, 367-390. Westphal, J.D., Zajac, E.J., 2001. Decoupling policy from practice: The case of stock repurchase
Source Level of Severity* Description of Violation
Fraud
Expropriation 8 2.00 0.00 SEC 1 Expropriation of assets by managers of the firm.
Falsification 5 1.25 0.00 SEC 1 Management falsified financial statements or other documents.
Insider Trading 2 0.50 0.00 SEC 1 Managers or owners of the firm used inside information to trade the firm's shares for their own benefit.
Market Manipulation 7 1.75 0.25 SEC 1 Managers or owners of the firm manipulated the trading of company's stocks to mislead or lure others to buy or to sell.
Financial Statements Not Correct
Accounting Violation 1 0.00 0.25 SET 1 Financial statements failed to comply with Generally Accepted Accounting Standards.
Financial Statement Amendment 10 0.00 2.50 SET 1 Company was required to amend their financial statements.
Adverse Opinion 50 0.00 12.50 SET 1 Auditors issued an adverse opinion on the firm's financial statement.
Disclaimer of Opinion 38 0.00 9.50 SET 2 Auditors issued a disclaimer of opinion on the firm's financial statement.
Qualified Opinion 2 0.00 0.50 SET 2 Auditors issued a qualified opinion on the firm's financial statement.
Financial Statement Rectification 1 0.08 0.00 SET 3 Company was asked by the SET to rectify mistakes in their financial statement.
* 1 = Severe violation, 2 = Medium violation, 3 = Minor violation.
33
Table 1: Violations of SET / SEC Rules, 1990-2006 (continued)
Violation Number of Violations: 1990-2006
Violations per Year: 1990-2002
Violations per Year: 2003-2006
Source Level of
Severity* Description of Violation
Failure to Disclose Information
Connected Party Transaction 3 0.08 0.50 SET 1 Company failed to, and hence was forced to, disclose a connected party transaction by the SET.
Material Information 185 12.69 5.00 SET 1 Company failed to, and hence was forced to, disclose material information to the public by the SET.
Incomplete Information 24 1.38 1.50 SET 2 Company submitted incomplete and/or unclear information, and the SET summoned the company to submit complete information.
Failure to Submit Financial Statements according to the Procedure
Information Deadline 129 6.85 10.00 SET 2 Company failed to submit financial statements or other documents by the deadline.
Information Procedure, #1 311 20.38 11.50 SET 3 Company failed to submit financial statements or other documents by the procedures as specified by the SET.
Information Procedure, #2 10 0.08 2.25 SET 3 Company submitted financial statements or other documents to SET but such information was not completely released to the public.
Information Procedure, #3 15 1.08 0.25 SET 3 Company submitted financial statements or documents during trading hours.
Violation of Rules Related to Tender Offers
Tender offer 2 0.08 0.25 SET/ SEC
1 Company failed to conduct a tender offer when required to so.
Reporting of share holdings 1 0.00 0.25 SEC 1 Company failed to report when the number of stocks held of another company reached a multiple of 5% of the total number.
Takeover Information 10 0.23 1.75 SET 2 Company failed to submit or submitted incomplete and/or unclear information about a tender offer to the SET or general investors.
* 1 = Severe violation, 2 = Medium violation, 3 = Minor violation.
Adj. R2 0.166 --- ---Wald test of exogeneity --- --- 0.810 p-value --- --- (0.369)
Note: standard errors in parentheses. *, ** , *** : significant at 10%, 5% and 1% level, respectively.
37
Figure 1
Panel A
0.0
0.1
0.2
0.3
0.4
0.5
0.6
0.7
0.8
0.0 0.4 0.8 1.2 1.6 2.0 2.4 2.8
Rel
ativ
e F
requ
ency
Histogram: Average violations per year lised, 2003-2006
Panel B
0
40
80
120
160
200
240
0 1 2 3 4 5 6 7 8 9 10 11
Fre
quen
cy
Histogram: Round( 4 * Average violations per year )
38
Appendix A: Good Governance Principles from the Thai Code Not Used for Measuring Formal Policy Adoption A. Principles with sub-scores partially based on substantive implementation
The sub-score for the following principles might have some substantive aspects that overlap with
our SET and SEC violations data:
Principle 3: “Rights of Various Groups of Stakeholders”
– The sub-score for this principle is based on accusation/prosecution concerning
violation of stakeholders' legal rights.
Principle 6: “Conflicts of Interest”
– Sufficient measures are in place to prevent the use of inside information.
– No connected transactions took place, or directors/audit committee are of the opinion
that the price/condition is equivalent to transactions with third party.
Principle 15: “Investor Relations”
– Information disclosure complies with the rules and regulations.
– There is an investor relations unit or staff.
B. Principles with sub-scores measuring only information disclosure:
We do not use the sub-scores for the two principles listed below, as they do not contain
information about adoption of formal governance policies that could be decoupled from practice
(firms either disclose the information or not).
Principle 10: “Directors and Management Remuneration”
– The company provides detailed information on the remuneration of Board members
and management.
Principle 11: “Board of Directors’ Meetings”
– Each director’s attendance record is disclosed in the company’s annual report.
C. Principle deemed not relevant for good governance:
Finally, we do not use the following principle, as it does not consider the relation between the
firm and its various stakeholders, but rather internal risk management procedures.
Principle 13: “System of Control and Internal Auditing”
39
Appendix B: Partial Observability and Count Data Models The standard Tobit model ignores the fact that not all violations committed by firms are detected
by the regulators, i.e. violations are only partially observed. Following Poirier (1980), Feinstein
(1990) and others, we add one equation modeling the probability that a firm’s violations are
detected. We let the binary variable Di indicate whether violations are detected: Di = 1 if one or
more violations are detected; and Di = 0 otherwise. Violations are only observed when a firm
intends to violate the rules (F*i > 0) and violations are detected (Di = 1): Fi = F*
i Di when F*i > 0
and Di = 1; and Fi = 0 otherwise. The resulting model is called a Tobit model with partial
observability:
(B1) D*
i = X2i �
2 + ui,
Di = 1, if D*i > 0,
Di = 0, if D*i ≤ 0,
(B2) F*
i = X1i �
1 + �i,
Fi = DiF*i, if F*
i > 0 and Di = 1,
Fi = 0, otherwise.
where X2i is a (1 x k2)-vector of observations on k2 explanatory variables for firm i that help
predict detection of violations, �
2 is a (k2 x 1) vector containing the corresponding regression
coefficients and ui is a random error term.
The Tobit model assumes that the error term �i in the Tobit equations (B2) is normally
distributes. As the dependent variable in our study is derived from a count of violations and
violations occur infrequently, the residuals are unlikely to follow a normal distribution. We use
the Lagrange-Multiplier (LM) test of Chesher and Irish (1987) to test the normality assumption,
using generalized residuals. In case of violations of normality, we can transform the dependent
variable back to count data with almost no loss of information. After multiplying the average
40
number of violations per year by four, the length of the 2003-2006 period for firms with complete
data, the resulting series has only three non-integer values. Rounding these three values to the
nearest integer, we are left with a dependent variable that closely resemble count data (with
excess zeros), as illustrated in Figure 1B.
The transformed dependent variable, denoted by yi, can be modeled with a count data
regression model, e.g. the negative binomial model (NB):
(B3) !)()(
)(]|[ 1
iy
i
iyi
iiy
yXyYP
i
i
θλθθλθ
θ
θ
Γ++Γ
== + , )exp( 11 βλ ii X=
where
� > 0 is an overdispersion parameter.
A zero-inflated negative binomial model has an additional equation to model the
probability of zero outcomes separately, which allows us to model the partial observability of
violations. As before, let the dummy variable Di denote whether violations are detected or not,
modeled by probit equation (B1). A count model data for yi with partial observability is then
defined as follows:
(B4) ),1()(
]|0[ 1 φλθ
θφ θ
θ
−++
==i
iXYP
!)()(
)(]|[ 1
iy
i
iyi
iiy
yXyYP
i
i
θλθθλθφ θ
θ
Γ++Γ
== +, for yi > 0
with ]0[]1[ * >=== ii DPDPφ denoting the probability of detection.
The comparison fit of similar models with and without partial observability is non-standard, as
the model specifications are non-nested. We can use Voung’s test statistic (Vuong, 1989) for this