Do Firms Time Seasoned Equity Offerings? Evidence from SEOs Issued Shortly after IPOs Yi Jiang*, Mark Stohs* and Xiaoying Xie* October 2013 Abstract: This paper examines whether firms take advantage of brief windows of opportunity to time seasoned equity offerings (SEOs) when their equity is substantially overvalued given managers’ private information. We find that firms experiencing larger IPO underpricing, larger stock price run–ups after the IPO, and larger IPO offer size tend to return to the market with an SEO earlier than the others. Firms which issue SEOs quickly after an IPO underperform in comparison to their peers. The mean three-day abnormal return of firms issuing SEOs within six months of IPOs is 2.69% lower than that of firms issuing SEOs six months or more following their IPOs. Firms issuing SEOs shortly after their IPOs also exhibit worse long-run stock returns and operating performance. The results are most consistent with the hypothesis that managers with private information time SEOs in ways that benefit existing shareholders. JEL classification: G14, G34, G32. Keywords: Seasoned equity offering; Initial public offering; Market timing; Market feedback We thank Matt Billett, Philip Davis, Jon Garfinkel, Erik Lie, Yimin Qian, Ashish Tiwari, and Anand Vijh for helpful comments and suggestions. All remaining errors are our own. * Mihaylo College of Business and Economics, California State University, Fullerton. Email: [email protected]; [email protected]; [email protected]
Transcript
Do Firms Time Seasoned Equity Offerings?
Evidence from SEOs Issued Shortly after IPOs
Yi Jiang*, Mark Stohs* and Xiaoying Xie*
October 2013
Abstract: This paper examines whether firms take advantage of brief windows of opportunity to time seasoned equity offerings (SEOs) when their equity is substantially overvalued given managers’ private information. We find that firms experiencing larger IPO underpricing, larger stock price run–ups after the IPO, and larger IPO offer size tend to return to the market with an SEO earlier than the others. Firms which issue SEOs quickly after an IPO underperform in comparison to their peers. The mean three-day abnormal return of firms issuing SEOs within six months of IPOs is 2.69% lower than that of firms issuing SEOs six months or more following their IPOs. Firms issuing SEOs shortly after their IPOs also exhibit worse long-run stock returns and operating performance. The results are most consistent with the hypothesis that managers with private information time SEOs in ways that benefit existing shareholders. JEL classification: G14, G34, G32. Keywords: Seasoned equity offering; Initial public offering; Market timing; Market feedback We thank Matt Billett, Philip Davis, Jon Garfinkel, Erik Lie, Yimin Qian, Ashish Tiwari, and Anand Vijh for helpful comments and suggestions. All remaining errors are our own. *Mihaylo College of Business and Economics, California State University, Fullerton. Email: [email protected] ; [email protected] ; [email protected]
Some firms decide to issue seasoned equity offerings (SEOs) very quickly after an initial
public offering (IPO). Such corporate decisions are puzzling for the following reasons. First, it
is known that the average impact upon firm value from an SEO is negative. So why issue at all?
Second, firms that issue SEOs typically wait one to three years after an IPO. Why then do some
act so quickly, i.e., by issuing SEOs within six months of an IPO, a very sensitive time period for
existing shareholders?1 The primary objective of our research is to investigate why some firms
issue SEOs quickly after an IPO. While earlier studies have improved our understanding of
corporate equity issue decisions, very few have examined the time between an IPO and the first
SEO. Our contribution intends to fill this void by focusing on a group of firms that return to the
equity market shortly after their IPOs.
The finance literature offers two primary explanations for these early SEO decisions.
The first is the market feedback hypothesis, which states that high stock returns after an IPO
signal that the marginal return to the project is high, which in turn encourages managers to
increase investment by raising additional capital. Jegadeesh, Weinstein and Welch (1993) find
that firms experiencing larger post–IPO returns tend to issue SEOs within three years of their
IPOs, and that the size of their SEOs are larger. They interpret their results as being consistent
with the market feedback hypothesis.
The second explanation is that firms issue an SEO shortly after an IPO to exploit market
timing opportunities (also labeled as the overvaluation hypothesis by Myers and Majluf (1984)).
According to this hypothesis, stock offering is motivated primarily by a manager’s desire to take
advantage of an “open financing window” to sell overvalued equity. 1 See ∆T (days) in Table 1. The period is sensitive because after an initial public offering, most existing shareholders are subject to a lock–up period in which they cannot sell their shares for a pre–specified time.
2
Overall, we find support for the market timing/overvaluation hypothesis in explaining
firms’ SEO decisions shortly after their IPOs. The support relies on studying publicly traded
firms that issue SEOs within six months of their IPOs. Specifically, we address the following
research questions: 1) Why do firms decide to conduct SEOs rapidly after an IPO? Is it due to
good investment opportunities, or is it because these firms are timing equity issues in ways that
benefit existing shareholders? 2) How does the market react to the announcement of an SEO
following an IPO? 3) What is the long–run stock price performance of firms conducting SEOs
shortly after IPOs? 4) What is the operating performance of our sample firms?
Jegadeesh, Weinstein and Welch (1993) find that firms with larger post–IPO returns are
more likely to issue SEOs within three years of their IPOs and suggest that firms experiencing
higher aftermarket returns tend to issue SEOs sooner.2 They interpret their results as being most
supportive of the market feedback hypothesis. Yet they overlook the overvaluation hypothesis
and some of their results do not support the market feedback hypothesis. Their analysis employs
a long (three–year) window. We suggest that a short window is more likely to capture a firm’s
equity issuance decision soon after its IPO. In addition, we examine the post–issue performance
of SEO firms to detect whether managers engage in market timing.
DeAngelo, DeAngelo and Stulz (2010) study the factors determining a firm’s decision to
issue SEO at a given year and find that near-term cash need is the primary motivation for SEOs.
They argue that both market–timing opportunities and a firm’s corporate lifecycle (which is
defined as the number of years listed) play a statistically significant but only ancillary role in the
decision. Our paper differs from theirs by focusing on what factors determine an early SEO right
after an IPO.
2 They study 411 first SEOs issued during 1980–1986. They found similar results when they used a five–year period
window.
3
DeAngelo et al. treat the time between an IPO and SEO as exogenous to an SEO issue
decision, using the number of years listed as a proxy for a firm’s lifecycle. Our analysis differs
by treating the time between an IPO and SEO as endogenously determined by firm
characteristics and market conditions. To control for the corporate lifecycle hypothesis in
explaining a firm’s equity issuance decisions, following Loughran and Ritter (2004), we use the
number of years since the founding date of the firm as a proxy for a firm’s life cycle stage.3 Our
results suggest that the market–timing hypothesis continues to hold after controlling for a firm’s
life cycle stage.
Our research approach is as follows. First, we address the question of why some firms
return to the equity issue market for an SEO earlier than other firms following an IPO. The
results indicate that, among firms that issue SEOs, those firms experiencing larger IPO
underpricing, larger stock price run–ups after the IPO, with larger IPO issue size, and smaller
and younger tend to return to the market with SEOs earlier than the others.
Next, we examine market reaction by analyzing the announcement effect of SEOs. Prior
research has generally demonstrated a negative announcement effect upon an SEO
announcement (see Asquith and Mullins (1986) and Eckbo and Masulis (1995)).4 Our study
differs in that we compare the announcement effect for firms issuing SEOs within six months of
their IPOs and for firms conducing SEOs six months following their IPOs. We find that the
market is more surprised by earlier SEO issues after the IPO and that the price decline associated
with the SEO announcement is more severe for these firms. Firms issuing an SEO within six
months of an IPO earn 2.69% lower abnormal returns over the three–day window surrounding
3 Loughran and Ritter (2004) define firm age as the year of the IPO minus the year of founding. 4 Cooney and Kalay (1993) extend the Myers–Majluf framework by introducing the existence of negative NPV
projects. They show that an announcement of SEO can contain favorable information about a firm and that a positive price reaction upon the announcement of an SEO is possible. Korajczyk, Lucas and McDonald (1991) report less of a negative announcement effect when an SEO is conducted shortly after a favorable earnings release.
4
the announcement date than those issuing later. This finding indicates that the market treats SEO
announcements taking place shortly after an IPO less favorably, because such issues might signal
a greater degree of stock price overvaluation. We argue that the equity issuance decision of these
firms is more likely driven by the overvaluation rather than the investment opportunity
hypothesis.
Third, we analyze whether the market properly values firms. Specifically, if companies
announce stock issues when their stock is grossly overvalued, can the market reevaluate the
stock appropriately, or will the stock still be substantially overvalued when the issue occurs? To
address this question, we compare the long–term stock returns of firms issuing SEOs in our
sample against five alternative matching benchmarks. Consistent with Loughran and Ritter
(1995), we find strong evidence of poor performance following equity issuance. The mean three–
year buy–and–hold abnormal–return (BHAR) for all SEOs in our sample is –23.13%5, while
firms returning to the equity market within six months of an IPO have a more negative BHAR of
–59.97%, compared with a BHAR of –17.54% for firms issuing SEOs after six months of IPOs.
If the firms returning to the equity market earlier are more overvalued than the others, then the
poorer long–run performance is merely a consequence of the market’s failure to incorporate all
the information. The stock is still substantially overvalued when such an issue occurs. Current
shareholders benefit from a quick SEO, while new shareholders suffer a loss in the long–run.
To evaluate the impact of the timing of SEOs and firm characteristics on the firm’s
subsequent share performance more thoroughly, we perform multivariate regressions of BHAR
on the logarithm of the time between IPO and SEO (or early issue dummy), pre–issue stock–
price appreciation, and other control variables. We find that firms’ three–year BHAR is
positively related to the logarithm of the time between IPO and the first SEO (or negatively 5 Issuers and non–issuers are matched by size, industry and book–to–market.
5
related to the early issue dummy), which provides evidence for the poorer long–run performance
of firms conducting SEOs shortly after their IPOs.
Beyond the buy–and–hold returns approach, we use other two procedures to examine the
underperformance of firms conducting early SEOs. The first procedure uses a time–series of
cross–sectional regressions on monthly individual firm returns. The results suggest that firms
conducting new issues underperform by 41.5 basis points per month, and firms conducting SEOs
within 6 months of IPOs underperform by 111 basis points per month.6 This evidence suggests
that firms conducting SEOs within 6 months of their IPOs experience more severe
underperformance.
The second procedure is the calendar–time portfolio analysis. We regress portfolio excess
returns on Fama–French’s three factors and report the “alphas,” which measure the monthly
abnormal returns associated with the SEO announcement. In the three–factor regressions, the
alphas of non–issuers are larger than the alphas of issuers. For all issuers, the alpha of issuers
conducting an SEO more than 6 months after an IPO significantly exceeds that of issuers
conducting an SEO within 6 months of an IPO. These results also support the overvaluation
hypothesis.
We also consider an alternative hypothesis, the market feedback hypothesis. This
hypothesis implies that investments increase with aftermarket returns. Hence, firms issuing SEOs
shortly after IPOs should have higher investment rates. Hovakimian and Hutton (2010) examine
repeat SEOs and document a positive relationship between the first year post–issue returns and
the likelihood of a follow–on equity issuance. They interpret their results as most consistent with
the market feedback hypothesis: that a high post–issue return encourages managers to increase
6 111 basis points = 41.5 basis points (new issue) + additional 69.5 basis points (issue within 6 months of IPO) as shown in Table 7 Panel (7).
6
the firm’s investment because the marginal return to the project is high. We test this hypothesis
by estimating regressions of investment on aftermarket returns, an SEO within 6 months of IPO
dummy, as well as the interaction variables between aftermarket returns and the 6 months
dummy. Our estimation results are inconsistent with the market feedback hypothesis.
Finally, we examine whether the timing of an SEO affects post–issue operating
performance. We find that firms conducting SEOs shortly after an IPO exhibit the most severe
decline in operating performance among all the issuing firms. As the inflated stock price cannot
be sustained following the IPO, the returns decline, reflecting poor operating performance. This
finding is also consistent with the overvaluation hypothesis.
The rest of the paper is organized as follows. Section 2 describes the hypotheses tested in
the paper and the data we use for analyses, section 3 discusses the methodology to measure SEO
underperformance, section 4 presents the main results, section 5 provides robustness checks of
our analyses, and section 6 summarizes.
2. Hypotheses and Data
2.1. Hypotheses
The market feedback hypothesis states that high stock returns signal high marginal
returns to the projects, which in turn, encourages managers to increase investment by raising
additional capital. The hypothesis therefore predicts:
H.1. Firms with higher aftermarket returns are more likely to issue an SEO more quickly
following an IPO than firms with lower aftermarket returns.
7
The underlying intuition is that firms with high aftermarket returns are high quality firms
with good investment opportunities. It is more costly for high–quality firms to defer their
investments in new projects than it is for low quality firms.
H.2. The market reacts less unfavorably to the announcement of an SEO by firms that issue the
SEO shortly after the IPO.
If firms with good investment opportunities are more likely to issue an SEO shortly after
an IPO, the market should be less surprised by SEO announcements by these firms.
H.3. Firms conducting SEOs shortly after their IPOs exhibit relatively better long–run stock
performance.
If firms that issue SEOs shortly after IPOs are high–quality firms with good investment
opportunities, it is reasonable to assume that these firms will exhibit better long–run stock
performance after the issue.
H.4. Investment rates are higher for firms that issue SEOs shortly after IPOs
High aftermarket returns encourage managers to increase the firm’s investments because
the marginal return to the project is high. Thus, the investment rates should be higher for firms
that return to the equity issue market shortly after the IPO.
H.5. Firms conducting SEOs shortly after their IPOs exhibit stronger post–issue operating
performance.
The overvaluation hypothesis, in contrast, states that firms issue equity when they believe
their stock prices are overvalued relative to management’s private information. Thus, market
timing hypothesis predicts:
H.1a. Firms with higher aftermarket returns are more likely to issue an SEO more quickly after
the IPO than firms with lower aftermarket returns.
8
Under the overvaluation hypothesis, if managers believe their stocks are overvalued, they
tend to issue new equity more quickly after the IPO to take advantage of “windows of
opportunity” in ways that benefit existing shareholders.
H.2a. The market reacts more unfavorably to the announcement of an SEO by firms that issue
the SEO shortly after the IPO.
The market treats the SEO announcement shortly after an IPO less favorably because
such equity issue might signal a greater degree of stock price overvaluation.
H.3a. Firms conducting SEOs shortly after their IPOs experience poorer long–run stock
performance.
If the stock prices of firms issuing SEOs shortly after IPOs are even more significantly
overvalued than the others, then the poorer long–run performance is merely a consequence of the
market’s failure to incorporate all the information. The stock is still substantially overvalued
when the issue occurs.
H.4a. Investment rates are not necessarily higher for firms that issue an SEO shortly after the
IPO.
If a firm’s equity issue decision is driven by overvaluation rather than good investment
opportunities, investment rates may not be higher for firms conducting an SEO shortly after an
IPO.
H.5a. Firms conducting an SEO shortly after going public exhibit no better or even worse post–
issue operating performance.
The rationale behind this proposition is that after the issue, as the inflated stock price
cannot be sustained, the returns may decline, reflecting poor operating performance.
2.2. Data
9
We use Thomson Financial’s SDC Global New Issues database to identify firms that
conduct IPOs during 1970–2006, and then select the first–time SEOs by these firms for the same
time period. Our ending date is restricted to2006 so that we have available data from CRSP to
compute long-run returns. Our sample satisfy the following criteria: (1) include only common
share offers listed on NYSE (the New York Stock Exchange), AMEX (the American Stock
Exchange) or NASDAQ; (2) exclude IPOs with offer price≤$57; (3) exclude IPOs with gross
proceeds (in real 1984 dollar) less than $1 million; (4) exclude financial companies, such as
banking, insurance and REITs (SIC codes between 6000–6999) and utility companies (SIC
codes 4900–4949); (5) exclude unit offers, spinoffs, carve–outs, rights, and shelf offerings8; (6)
include only firms with stock return data available in CRSP after the issue, and with financial
data available in COMPUSTAT, and (7) exclude firms with a market cap of less than $10
million during 1970–2006 to minimize the influence of outliers in the analysis. The resulting
sample consists of 1,610 first time SEOs.
Table 1 reports summary statistics of firm characteristics and other main explanatory
variables used in the paper, with more complete definitions and the COMPUSTAT origins of
data presented in the Appendix. ΔT is the number of calendar days between IPO and the first
SEO. The median value of ΔT is about one and half years (496 days). Under IPO is IPO
underpricing, defined as the difference between the first day post–issue price and the IPO offer
price divided by the offer price, with a median underpricing of 8.93%. AB RET 20 is the
abnormal return over the period from trading day 1 to trading day 20 after the IPO date, with a
median of 3.79%. AB RET 40 is the abnormal return over the period from trading day 21 to
7 Analyses using the offer price<=$1 yield quantitatively similar results. 8 A shelf SEO is defined as an SEO whose issue date is 60 days after the filing date. Following Altinkilic and Hansen (2003) and Huang and Zhang (2011), we exclude shelf registered offers.
10
trading day 40 after the IPO date. The median abnormal return 20 days before SEO issues is 3.59%
(not presented in Table 1), indicating the fact that SEO firms experience strong price run–ups
prior to the issue. SEO AR is the SEO 3–day announcement period abnormal return, calculated
over the event days –1, 0, and +1. The median SEO AR is around –3.40%.
Table 1 also reports firm characteristics traditionally used to identify market timing. The
median market value of equity for our SEO sample is $277.73 million. The mean is larger at
$694.49 million, indicating skewness of distribution. Our sample firms have a median Tobin’s Q
of 1.91, which suggests that the typical SEO firm is profitable and has valuable growth
opportunities. Finally, firms that issue SEOs on average raise 2.08 times as much capital through
SEOs as they raise from their IPOs (measured by SEO/IPO).
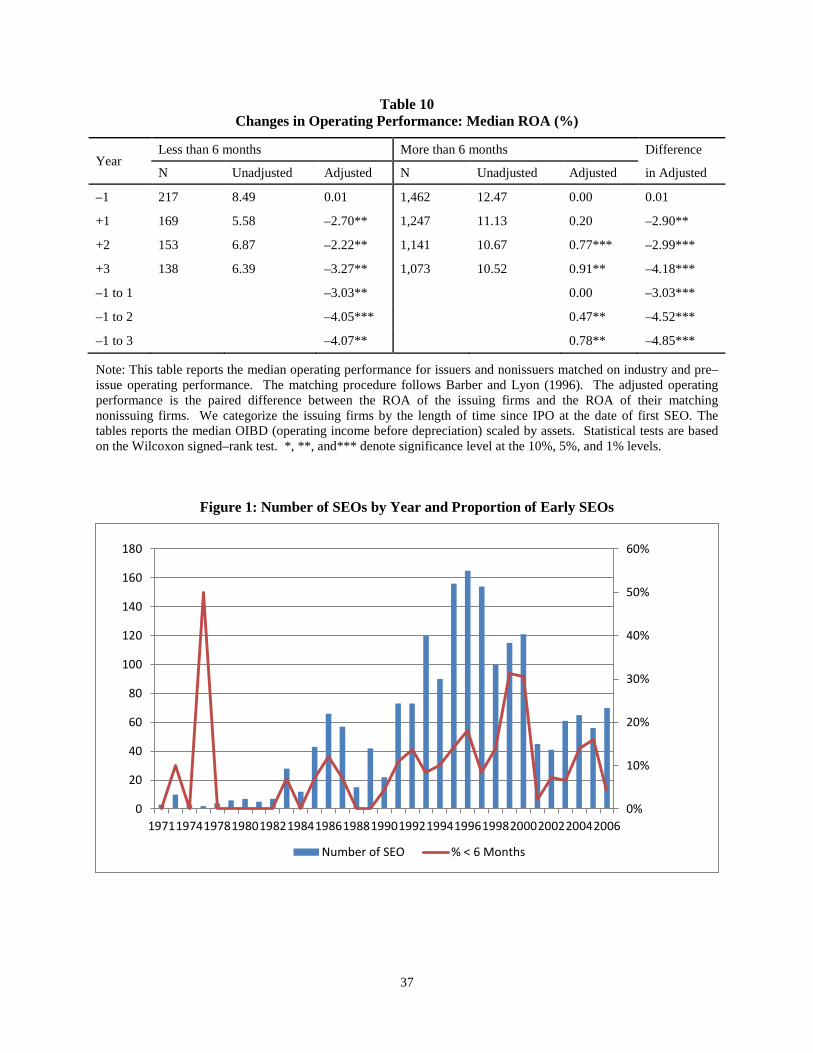
Figure 1 presents the number of SEOs in our sample by year and the proportion of early
SEOs (SEO issued within 6 months of IPO). The volume of SEOs displays large variations over
time, with the period 1991–2000 being the “hot” issue period, and we observe a higher
proportion of early SEOs during this period as well. Early SEOs account for 10%–30% of all
SEOs during this hot issue period.
3. Measuring SEO Underperformance
We use three procedures to examine the underperformance of seasoned equity offerings.
The first procedure is the buy–and–hold abnormal return (BHAR) analysis. The second
procedure uses a time–series of cross–sectional regressions on monthly individual firm returns.
Last, we use the Fama–French three–factor regressions.
11
3.1. Buy–and–hold abnormal returns
Extensive literature exists about long–run stock performance following corporate events;
yet long–term studies on stock returns remain controversial. Following Billett, Flannery and
Garfinkel (2005), we calculate buy–and–hold abnormal returns (BHAR) over a three–year
holding period after the SEO issue. The BHAR is calculated from the first CRSP–listed post–
issue closing price to the appropriate anniversary date of the offering. A firm’s holding period
return is calculated as:
(1) 𝑅𝑖,𝑇 = �∏ �1 + 𝑅𝑖,𝑡� − 1𝑇𝑡=1 � × 100% ;
where Ri,t is the daily return for firm i, T is the number of trading days in the three–year window
following the issue, and Ri,T is the cumulative holding period return.
For each issuing firm, we select five separate sets of peer non–issuing firms. Following
Vijh (1999), the five alternative sets of matching firms are constructed as follows. The first set
controls only for size. Each SEO firm is matched with the non–issuing firm having the closest,
but higher, market capitalization on the prior December 31. The second set controls for size and
book–to–market. We identify firms whose market value lies between 70% and 130% of the
sample firm value. Of those, we select the firm with the closest book–to–market value. The third
set controls for size and industry effect. Each sample firm is paired with a peer firm that has the
closest market value and the same two–digit SIC code. The fourth set controls for size and
earnings–to–price effect. We identify firms whose market value lies between 70% and 130% of
the sample firm value, and then select the firm that has the closest earnings–to–price value. The
last set controls for size, industry and book–to–market. Our reported results are mainly based on
the last set, the most refined method of matching.
12
Following the existing literature, in our calculation, if a matching firm is delisted before
the three-year anniversary date of the offering, the next closest matching firm’s return is used.
Up to four matching firms are kept for each SEO firm in the sample. If sample firms are delisted,
the BHAR is calculated until the delisting date, and the corresponding matching firm’s return is
used. The BHAR is the difference between the holding period return for each sample firm and
its matching firm.
3.2. Cross–sectional regressions on monthly returns
Our second procedure for measuring SEO underperformance uses a time–series of cross–
sectional regressions based on monthly individual firm returns. We run cross–sectional
regressions on all firms listed on NASDAQ, AMEX, or NYSE during 1970–2006 as follows:
where Rpt is the equally weighted portfolio returns of sample firms in month t; Rmt is the return
on the equally–weighted index of NYSE, AMEX, and NASDAQ stocks in month t; Rft is the
three–month T–bill yield in month t; SMBt is the return on small firms minus the return on large
firms in month t, and HMLt is the return on high book–to–market stocks minus the return on low
book–to–market stocks in month t. The intercepts from these regressions are interpreted as
abnormal returns. Abnormal returns will be associated with the event studied if the intercepts in
the regressions are economically and statistically significant.
4. Results
4.1. Why do some firms return to the equity market earlier than the others?
We begin our analysis by examining why some firms return to the equity issue market
earlier than the others. Results are presented in Table 2. We first focus on what kind of firms is
more likely to issue SEOs within 6 months of IPO. To address the concern that the “6 months”
classification of “early” issue is “arbitrary,” we also use a continuous variable LnΔT, defined as
the logarithm of the time between a firm’s IPO and its first SEO, as a dependent variable. To
14
address the concern that the IPO/SEO market may have changed over time (Loughran and Ritter,
2004) regarding types of issuers, incentives of issues and market conditions, we run the analyses
for both the full sample (1970–2006) and subsample (1990-2006).
According to the overvaluation hypothesis, if managers believe their stocks are
overvalued, they tend to issue new equity to take advantage of “windows of opportunity” in ways
that benefit existing shareholders. If this hypothesis holds, we should find that firms go back to
market earlier when they experienced higher IPO aftermarket abnormal returns.
Our probit regression shows that firms with larger IPO underpricing (Under IPO) are
more likely to conduct an “early” issue. This is consistent with the signaling hypothesis of IPOs
by Chemmanur (1993) and Welch (1989), which proposes that firms underprice their IPOs so
that they can subsequently issue seasoned equity at a favorable price, and can return more
quickly to the equity market with SEOs. The coefficients of AB RET 20 and AB RET 40 are also
positively significant, suggesting that firms experiencing larger stock price run–ups after the IPO
tend to return to the market with an SEO earlier than the others. Since large pre–issue stock
price appreciation signals that the current stock price is overvalued, the above results are
consistent with the hypothesis that management use their private information to time equity
offerings to take advantage of the “windows of opportunity.” The associated coefficient
estimates on firm size and firm age are all significantly negative, suggesting that larger firms and
older firms are less likely to conduct a quick SEO (t<6 months) after an IPO.
Similar results are found in regressions on the length of time between an IPO and the first
SEO. In addition to taking advantage of overvalued stocks, the results also show that firms with
higher expenditure ratio and higher operating performance (ROA) return to the equity issuance
market more quickly. These variables are not significant in the “quick SEO” probit regression.
15
The results for subsample are mostly consistent with the full sample analyses. Overall, we
conclude that firms’ decisions to issue “quick SEOs” are driven by market timing rather than
broader economic considerations.
4.2. Market reaction
Prior research generally shows a negative announcement effect upon the announcement
of an SEO (Loughran and Ritter, 1995; Houston and Ryngaert, 1997; Jegadeesh, Weinstein and
Welch, 1993).9 We extend the existing literature by examining the relations between the timing
of SEOs and SEO announcement effects. Specifically, we address whether or not the market is
more surprised by firms that conduct their SEOs comparatively earlier following their IPOs. If
the market timing hypothesis holds, we expect to find a less favorable market response because
an earlier SEO issue may signal a greater degree of stock overvaluation. To address this question,
we report the abnormal returns around SEO announcements categorized by length of time since
the IPO at the date of the first SEO in Panel A of Table 3.
Consistent with the market timing hypothesis, we find that the price decline associated
with SEO announcement is more severe for the group of firms conducting SEOs within 6 months
of their IPOs (with an SEO 3–day announcement period abnormal return of –5.79%). Panel B
of Table 3 shows the difference test between the groups of firms issuing “quick SEOs” and firms
whose SEO takes place more than six months after an IPO. Based on the t-test and Wilcoxon
test, the differences in the SEO 3–day announcement–period abnormal return are statistically
significant at 1% level. Table 3 also shows that among the seven groups of firms classified by the
timing of SEOs, the group of firms conducting “quick SEOs” (t < 6 months) experience the
9 Literature has documented on average a –3% SEO announcement abnormal return, followed by another –3% SEO issue day abnormal return. Loughran and Ritter (1995) find that SEO firms underperform size and industry matched non–issuance firms over the five years following SEOs.
16
largest AB RET 20 (22.29%) and AB RET 40 (11.39%). This finding confirms our results in
Table 2, indicating that firms with higher stock price run–ups after the IPO tend to return to the
market with an SEO earlier than the others.
To provide an additional test of the hypothesis that the market might be more surprised
by SEO announcements shortly after IPOs, we conduct a regression analysis with the dependent
variable being the SEO 3–day announcement abnormal returns, and the key independent
variables being either a dummy variable which equals one if the number of calendar days
between IPO and the first SEO is less than 6 months (6 months dummy) or a continuous variable
representing the time difference between IPO and first SEO (lnΔT). The results are presented in
Table 4. The coefficient of the six months dummy is negative and significant for all sample
periods, suggesting that the market is more surprised by “quick SEOs” and that the price decline
associated with the SEO announcement is more severe for these firms. The interaction between
market overvaluation (AB RET 20) and SEO within 6 months of IPO dummy is negative and
significant for the full sample period and the 1990–2006 period. The decision to issue equity for
these firms appears to be driven more by overvaluation rather than by investment opportunities.
Hence, there is a more negative market reaction when good motivations are not apparent. The
regression with continuous days (lnΔT) also shows that firms waiting longer to return to equity
issue market generally experience higher announcement abnormal returns.
4.3. Buy–and–hold abnormal returns analysis
Table 5 reports the three–year buy–and–hold abnormal returns for the sample firms
between 1970 and 2006. Consistent with prior studies, firms announcing SEOs underperform
their size, industry and book–to–market matched counterparts. The mean BHAR is –23.13% and
is reliably different from zero. Similar results are obtained for the other four alternative sets of
17
matching firms, based on 1) size alone, 2) size and book–to–market, 3) size and two–digit SIC
code, and 4) size and earnings–to–price ratio. The poor long–run performance suggests that the
market does not fully react to the information implied by an equity issue announcement, because
only part of the overvaluation problem is corrected upon the announcement of an equity issue.
Next, in Panel A of Table 5, we report the BHAR as categorized by the length of time
since IPO at the date of first SEO. Among the seven groups of firms classified by the timing of
SEOs, the group of firms conducting “quick SEOs” (t < 6 months) experiences the most severe
long–run underperformance, as shown using size, industry and book–to–market matched
benchmarks. Panel B of Table 5 shows the difference test between the groups of firms whose
SEO is within six months of IPO and whose SEO is after six months. Using size, industry and
book–to–market matched peer firms, firms returning to the equity market within six months of
IPO experience a three–year BHAR of –59.97%, while firms conducting SEOs after six months
of IPOs experience a BHAR of –17.54%. The difference in the BHAR between the two groups
of firms is negative and statistically significant (p=0.035).
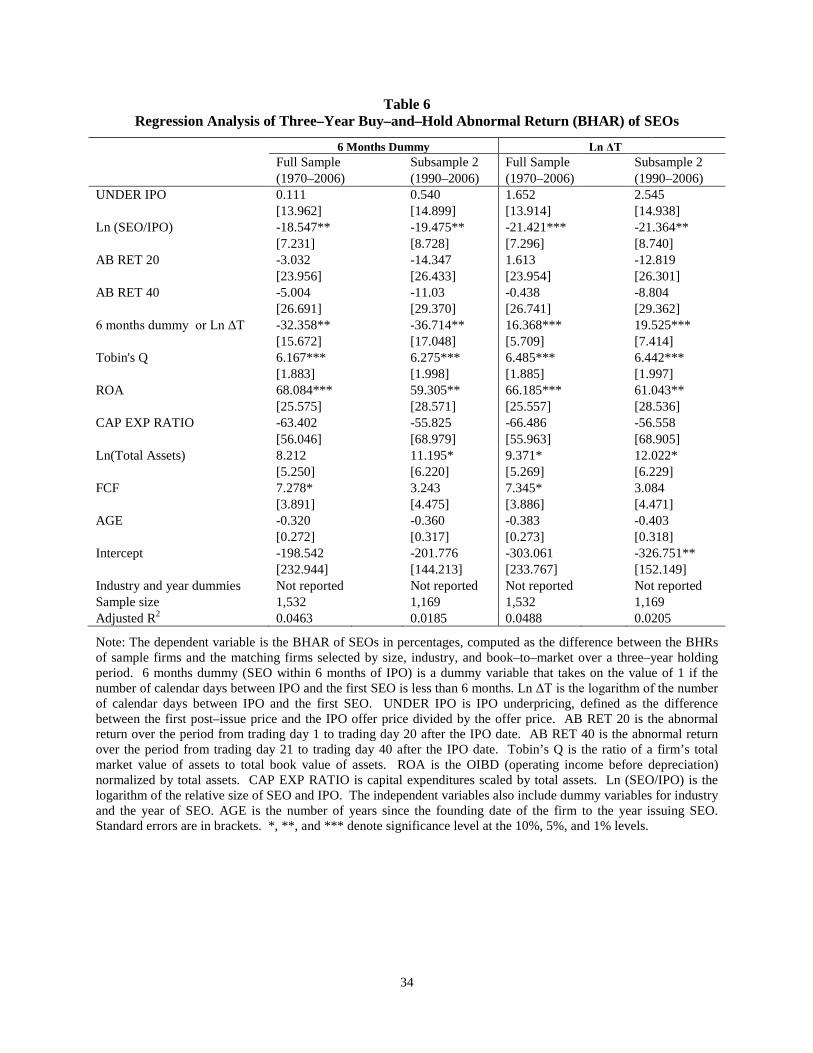
To evaluate the impact of SEO timing and firm characteristics on a firm’s subsequent
share performance in more detail, we run multivariate regressions of BHAR with the key
explanatory variables being “quick SEO” dummy (the six months dummy) or the logarithm of
the time between a firm’s IPO and its first SEO (lnΔT). Table 6 reports the regression results.
We find that firms issuing “quick SEOs” experience lower BHAR for the full sample period
1970–2006 and the subsample period 1990–2006. In general a longer waiting time between an
IPO and the first SEO (lnΔT) is associated with better ex post peer–adjusted, long–term stock
returns. This result provides further evidence about the poorer long–run performance of firms
conducting SEOs shortly after their IPOs. If the stock prices of firms issuing SEOs shortly after
18
IPOs are significantly more overvalued than the others, then the poorer long–run performance is
merely a consequence of the market’s failure to incorporate all the information from the
announcement of an SEO. The stock is still substantially overvalued when the issue occurs.
4.4. Cross–sectional regressions on monthly returns
To test whether there is a “new issues effect” independent of a more severe
underperformance of firms conducting SEOs within six months of IPOs, we perform a time–
series of cross–sectional regressions on monthly individual firm returns following Loughran and
Ritter (1995). Table 7 presents the multivariate analysis of monthly firm returns under seven
different model specifications. The key variables we examine are “ISSUE” and “ISSUE 6
month”. In the full model (7), the coefficients of ISSUE and ISSUE6month indicate that firms
conducting new issues underperform by 41.5 basis points per month, and firms conducting SEOs
within 6 months of an IPO underperform by additional 69.5 basis points per month. In model (2),
we report the average coefficients for monthly regressions where the sole explanatory variable is
the new issue dummy variable. The mean parameter value of –0.47 indicates that firms
conducting new issues subsequently underperform by 47 basis points. In model (3), where the
only explanatory variable is the ISSUE 6 month dummy, the coefficient estimate of –0.968
implies that firms conducting SEOs within 6 months of IPOs subsequently underperform by 96.8
basis points. In model (4), when we consider both the new issues effect and the effect of SEOs
within six months of IPOs, issuing firms conducting SEOs within 6 months of IPOs
underperform by 64.9 basis points. The results in model (4) and model (7) imply that the
underperformance of new issues cannot be solely attributed to the size and book–to–market
effects. Instead, a “new issues effect” exists, demonstrating that issuing firms underperform
19
non–issuing firms, and that firms conducting SEOs within 6 months of their IPOs experience
more severe underperformance.
4.5. Fama–French three–factor regressions
Table 8 reports the alphas from time–series regressions of monthly portfolio excess
returns on Fama–French three factors, as used in Fama et al. (1993). The advantage of forming
portfolios is that the cross–sectional dependence problem in Table 7 is reduced while the
disadvantage is that power is sacrificed.
We find that for all firms, the alphas of non-issuers exceed those of issuers by 0.50 on the
monthly basis, and the difference is statistically significant at the 1% level (Panel A). We split
the sample into large firms and small firms. Large firms are those whose market capitalization is
above the size of the median NASDAQ, AMEX and NYSE firm in the sample. We find that for
small firms, the alphas of non-issuers are significantly higher than that of issuers.
We also form portfolios of firms issuing an SEO both within 6 months of an IPO (quick
SEO) and more than 6 months following an IPO (Panel B). The results show that for all issuers,
the alpha of firms conducting an SEO more than 6 months following an IPO exceeds that of
quick SEO issuers by 1.09 on monthly basis. We find negative differences when we split the
sample into large and small issuers, though the differences are not statistically significant.
Overall, we find underperformance of issuers and more severe underperformance of those with
“quick SEOs”. This evidence again supports the hypothesis that firms take advantage of
“windows of opportunity” by issuing equity when they are substantially overvalued.
4.6. Aftermarket returns and investments
According to the market feedback hypothesis, high stock returns signal that the marginal
return to the project is high, which encourages managers to increase investment by raising
20
additional capital. Therefore, firms issuing SEOs shortly after IPOs should have higher
investment rates. We test this hypothesis by estimating regressions of investment (measured by
total net property, plant and equipment, following Hovakimian and Hutton (2010)) 10 on
aftermarket returns, 6 months issue dummy or the logarithm of the time between a firm’s IPO
and its first SEO (lnΔT), and the interaction variables between aftermarket returns and the 6
months dummy. We also include control variables such as book–to–market, free cash flow and
other firm characteristics. Results reported in Table 9 are inconsistent with the market feedback
hypothesis. The coefficient estimates on AB RET 20 and SEO within 6 months of IPO dummy
are negative and significant for the full sample period and the period of 1990–2006, instead of
being positive. The coefficients of the interacted terms are statistically insignificant from zero.
Overall, we find no evidence that capital expenditures increase with the aftermarket returns for
firms that conduct SEOs within 6 months of IPOs.
4.7. Changes in operating performance Finally, we examine the operating performance of firms conducting SEOs by addressing
the questions: (1) does the post–issue operating performance of issuers deteriorate relative to
non–issuing firms? and (2) is there more severe deterioration of operating performance among
the group of issuers who conducted SEOs shortly after IPOs? Table 10 presents the results.
Table 10 reports the median operating performance ratios for issuers and non–issuers
matched on industry and pre–issue operating performance. The matching procedure follows
Barber and Lyon (1996). We report the results based on the median OIBD (Operating Income
before Depreciation) scaled by assets. To examine whether the timing of an SEO affects post–
issue operating performance, we categorize the issuing firm by the length of time since IPO at 10 We find similar results when using the measure of change of a firm’s capital expenditure ratio as the dependent variable.
21
the date of the first SEO: early issuer (an SEO issued within 6 months of an IPO) vs. late issuer
(an SEO issued more than 6 months following an IPO).
We find that for early issuers, there is deterioration in operating performance for the
median issuer relative to the median non–issuer during the years after the offer, which is
consistent with the findings of Loughran and Ritter (1997).11 The deterioration from year –1 to
year 3 is statistically significant at conventional levels. However, the median late issuer
demonstrates a slightly better operating performance than the median non–issuer two or three
years after the offer. For late issuers, the median benchmark–adjusted OIBD to assets from year
–1 to year 3 is 0.78%. In contrast, the median benchmark–adjusted OIBD to assets for early
issuers from year –1 to year 3 is –4.07%. The difference between early issuers and late issuers is
statistically different. Again, our results indicate that firms conducting an SEO shortly after
going public exhibit the most severe decline in operating performance among all the issuing
firms.
5. Robustness checks12
5.1. Impact of lockup period and firm performance
Existing literature has documented that many IPOs specify a lockup period for future
equity issues, and in general, most lockup restrictions expire 6 months after the IPO (Field and
Hanka, 2002). Chen, Chen, and Huang (2012) find that insiders’ (especially senior executives)
selling of shares has a negative impact on the long-run stock returns subsequent to the lockup
expiration. To test the impact of lockup days, we perform univariate and regression analyses.
11 Loughran and Ritter (1997) find that the operating performance of issuing firms shows substantial improvement
prior to the offering, then deteriorates. 12 Complete robustness results are available from the authors upon request.
22
We find that the mean and median lockup period of early issuers are 190 days and 180
days, respectively, not significantly different from the mean and median lockup period of late
issuers (179 days and 180 days). To examine the impact of lockup period on SEO firm
performance, we further control for the lockup period in the announcement return and buy–and–
hold abnormal return regression analyses. We find no impact of lockup period on the more
negative performance of SEOs issued within 6 months of IPOs.
5.2. Impact of secondary shares offering, venture–capital backed offerings, and high–tech
industry
For SEO issues, the shares offered may include pure primary shares (newly created
shares that generate proceeds for the firms), pure secondary shares (insider's shares that do not
increase the cash holdings of firms) or a mix of both. We perform several robustness checks to
test whether our results are driven by secondary shares offerings.
In the univariate analysis, we find that for early issuers, 18% (39 firms) are pure
secondary offerings, 69% (147 firms) are mixed offerings (60% of which (89 firms) with
primary shares less than 50% of total offers); for late issuers, 13% are pure secondary offerings,
54% are mixed offerings (32% of which with primary shares less than 50% of total offers). We
define pure secondary offerings or mixed offers with primary shares less than 50% as “second”.
For early issuers, 60% of firms are “second”, and for late issuers, 30% of firms are “second”.
The difference is significant at 1% level.
The first robustness check we perform is to exclude pure secondary offerings from our
sample, that is, we only keep firms with at least some newly issued (primary) shares (Loughran
and Ritter, 1995). We re–run all the analyses performed in the paper, and reach exactly the same
conclusion. However, secondary offerings may signal additional information for the firms,
23
especially when insiders have an incentive to cash out as early as possible following an IPO.
Therefore, we perform another set of robustness check by controlling for “second” offerings (a
dummy variable equal to one if an SEO is pure secondary offering or if an SEO has at least 50%
shares offered being secondary) in various multivariate analyses. The market timing story still
holds and we find that early issuers (defined by 6 month dummy or lnΔT) continue to experience
more negative announcement abnormal returns and lower long–run BHARs after controlling for
offering type.
It is also possible that if an IPO is venture capital (VC) based, the existing owners may
desire to exit via secondary shares as early as possible (Brav and Gompers, 1997). To test this
hypothesis, we tabulate the percentage of VC–backed IPOs for early issuers and late issuers. We
find that 66.82% of early issuers are backed by venture capital while 49.07% of late issuers are
backed by venture capital. The difference is significant at the 1% level. We then control for VCs,
and the interaction of VCs and secondary offering type in aProbit regression to assess the
decision to conduct an SEO. We find that VC dummy is not significant in the regressions, but
VC backed secondary offerings are conducted sooner than non–VC backed secondary offerings.
The key market timing opportunities variables, IPO underpricing, AB RET 20, and AB RET 40,
remain significant after controlling for VCs and offerings type.
Another concern is high–tech/internet firms, the stock of which may behave differently as
shown by the literature.13 Loughran and Ritter (2004) find that riskier IPOs offered by high–tech
firms are more underpriced than less–risky IPOs. Bartov et al.(2002) document differences in
IPO valuations between internet and non–internet firms as well as across different stages in the
IPO process. In our sample, 38.32% of early issuers are high tech/internet firms while 21.56%
13 We follow Loughran and Ritter (2004) and Cliff and Denis (2004) to categorize firms with the following SIC codes as tech firms: 2833, 2834, 2835, 2836, 3571, 3572, 3575, 3577, 3578, 3661, 3663, 3669, 3674, 3812, 3823, 3825, 3826, 3827, 3829, 3841, 3845, 4812, 4813, 4899, 7370, 7371, 7372, 7373, 7374, 7375, 7377, 7378, and 7379.
24
late issuers are high tech/internet firms. In the subsample, about 26% of IPO issuers are high
tech firms during 1990–2006 (about 33% of IPO issuers are high tech firms during 1995–2000).
We include a high–tech firm dummy variable in the regression analyses and find: (1) high–tech
firms do not necessarily come back to equity issue market earlier than others (the coefficient
estimate is not statistically significant) after controlling for other firm characteristics; (2) high–
tech firms do not experience greater negative SEO 3–day announcement abnormal returns
(coefficient estimate is not statistically significant); (3) high–tech firms do not exhibit more
negative long–run returns (coefficient estimate is not statistically significant). The coefficient
estimates for our key market–timing variables are still significant after controlling for high–tech
firms in the regressions. We also perform the univariate analyses as shown in table 5, with
separate analyses for non–high–tech firms and high–tech firms by early issue and late issue. For
both high tech and non–high–tech firms, early issuers demonstrate more negative BHAR than
late issuers. However, there is no significant difference in BHAR between non–high–tech firms
and high–tech firms categorized by either early issuers or late issuers.14
5.3. Cash needs and the possibility of early SEO issue
Recent literature suggests that firms issue SEOs for precautionary reasons. That is, firms
issue equity to save cash. McLean (2011) reports that in the 1970s, issuing firms generated $0.23
in cash savings for every $1.00 issued, but in the 2000s, the cash savings increased to $0.60.
DeAngelo, DeAngelo and Stulz (2010) also state that the near–term cash need is the primary
motivation for SEOs. They find that firms with higher cash needs are more likely to issue SEOs.
Our analyses do not preclude the cash need motivation. However, since we focus on the timing
of a firm returning quickly to the equity issuance market after its IPO, cash needs around an SEO
may not be a valuable explanatory variable. That is, we believe near–term cash need around SEO 14 All the results are available from authors upon request.
25
is a powerful factor determining whether a firm issues an SEO or not, but it may not predict or
explain why some firms issue sooner than others.
Nonetheless, we address this concern by performing two analyses. First, following
DeAngelo, DeAngelo and Stulz (2010), we measure a company’s near–term cash needs as: Pro
Forma Cash/TA ratio = (Cash t+1– SEO proceeds from primary shares)/(Total Assets t+1 – SEO
proceeds from primary shares), and add the variable to the Probit regression. As predicted, this
variable carries no explanatory power regarding early issue or late issue. The market–timing
hypothesis still holds after controlling for a company’s cash saving needs. Second, we consider
the counterfactual condition that had there been no SEO issue, would a firm run out of cash. We
find that for early issuers, about 68.4% of firms would have run out of cash without the issue,
and that 67.7% of the late issuers would have run out of cash. The difference is statistically
insignificant.
6. Conclusion
Our research investigates whether firms take advantage of transitory “windows of
opportunity” to time seasoned equity issues when their equity is substantially overvalued with
respect to managers' private information, i.e., the overvaluation hypothesis. Our main results
provide support for this hypothesis. First, we find that firms experiencing larger IPO
underpricing, larger stock price run–ups after the IPO, and larger IPO offer size tend to return to
the market with an SEO earlier than the others. This implies that overvalued firms tend to time
their equity issues. Second, we find that firms issuing SEO within six months of IPO on average
earn a 2.69% lower three–day announcement excess return than those issuing six months or more
26
following an IPO, indicating that the market treats SEO announcements shortly after IPOs as less
favorable because such equity issues might signal a greater degree of stock price overvaluation.
Third, we show that firms’ three–year BHAR is positively related to the logarithm of the
time between IPO and the first SEO. Using three different approaches (the buy–and–hold
analysis, cross–sectional regressions, and calendar time portfolio analysis) we document more
severe underperformance of firms conducting SEOs within six months of their IPOs. The results
hold after controlling for the effects of firm age, secondary share offerings, lockup period and
venture capital based nature of IPOs. In addition, we find no evidence that investments increase
with aftermarket stock returns for firms conducting SEOs within 6 months of IPOs, which is
inconsistent with the market feedback hypothesis. Our results also suggest that firms conducting
SEOs shortly after their IPOs exhibit the most severe deterioration in operating performance
among all the issuing firms.
In general, the combined evidence is consistent with the overvaluation hypothesis that
managers with private information time SEOs in ways that benefit existing shareholders. We
find little support for the market feedback hypothesis, which assumes that firms issuing SEOs
shortly after IPOs are high–quality firms with good investment opportunities. Firms returning to
the equity market shortly after their IPOs are worse off in terms of announcement market
reaction, long–run share returns, and operating performance because their stocks are even more
overvalued; therefore, management is able to time the market by issuing overvalued equities to
take advantage of the “windows of opportunity.”
27
REFERENCES Altinkilic, O., Hansen, R., 2003. Discounting and underpricing in seasoned equity offers. Journal
of Financial Economics 69, 285–324.
Asquith, P., Mullins Jr., D.W., 1986. Equity issues and offering dilution. Journal of Financial Economics 15, 61–89.
Barber, B.M., Lyon, J.D., 1996. Detecting long–run abnormal stock returns: the empirical power and specification of test–statistics. Journal of Financial Economics 43, 341−372.
Bartov E, Mohanram P, Seethamraju C. 2002. Valuation of Internet Stocks−An IPO Perspective. Journal of Accounting Research 40(2): 321–346.
Brav, Alon, and Paul A. Gompers, 1997, Myth or reality? the long-run underperformance of initial public offerings: Evidence from venture and non-venture capital-backed companies, Journal of Finance 52, 1791–1821.
Billett, M., Flannery, M., Garfinkel, J., 2006. Are bank loans special? Evidence on the post announcement performance of bank borrows. Journal of Financial and Quantitative Analysis 41, 4, 733–751.
Chen, H., Chen, S., Huang, C., 2012. Why Do Insiders Sell Shares Following IPO Lockups? Financial Management 41, 813–847.
Chemmanur, T.J., 1993. The pricing of initial public offerings: a dynamic model with information production. Journal of Finance 48, 285−304.
Cliff, M., Denis, D. J., 2004. Do IPO firms purchase analyst coverage with underpricing? Journal of Finance 59, 2871–2901.
Cooney Jr., J.W., Kalay, A., 1993. Positive information from equity issue announcements. Journal of Financial Economics 33, 149–172.
DeAngelo, H., DeAngelo, L., Stulz, R., 2010, Seasoned equity offerings, market timing, and the corporate life–cycle. Journal of Financial Economics 95, 275–295.
Eckbo, E., Masulis, R., 1995. Seasoned equity offerings: a survey. In: Jarrow, R., Maksimovic, V., Ziemba, W., eds., Handbooks in operations research and management science, (Elsevier, Amsterdam) Chapter 31.
Fama, E., French, K., 1993. Common risk factors in the returns of stocks and bonds, Journal of Financial Economics 33, 3–55.
Field, L., Hanka, G., 2002. The expiration of IPO share lockups, Journal of Finance 56, 471–500.
Houston, J., Ryngaert, M., 1997. Equity issuance and adverse selection: a direct test using conditional stock offers. Journal of Finance 52, 197–219.
Hovakimian, A. Hutton, I., 2010. Market feedback and equity issuance: evidence from repeat equity issues. Journal of Financial and Quantitative Analysis 45, 3, 739–762.
Huang, R., Zhang, D., 2011. Managing underwriters and the marketing of seasoned equity offerings. Journal of Financial and Quantitative Analysis 46, 141–170.
28
Jegadeesh, N., Weinstein, M., Welch, I., 1993. An empirical investigation of IPO return and subsequent equity offerings. Journal of Financial Economics 34, 153–175
Korajczyk, R.A., Lucas, D.J., McDonald, R.L., 1991. The effect of information releases on the pricing and timing of equity issues. Review of Financial Studies 4, 685–708.
Loughran, T., Ritter, J., 1995. The new issues puzzle. Journal of Finance 50, 23–51.
Loughran, T., Ritter, J., 1997. The operating performance of firms conducting seasoned equity offerings. Journal of Finance 52, 1823–1850.
Loughran T., Ritter, J., 2004. Why has IPO underpricing changed over time? Financial Management 33, 5–37.
Lyon, J.D., Barber, B.M., Tsai, C. L., 1999. Improved methods for tests of long–run abnormal stock returns. Journal of Finance 54, 165−201.
McLean, D., 2011. Share issuance and cash savings, Journal of Financial Economics 99 (3), 693–715.
Myers, S.C., Majluf, N.S., 1984. Corporate financing and investment decisions when firms have information that investors do not have. Journal of Financial Economics 13, 187–221.
Vijh, A., 1999. Long–term Returns from Equity Carveouts, Journal of Financial Economics, 51: 273–308.
Welch, I., 1989. Seasoned offerings, imitation costs, and the underpricing of initial public offerings. Journal of Finance 44, 421−449.
29
Table 1 Descriptive Statistics for Sample SEO firms
Note: The sample consists of all firms listed on NASDAQ, AMEX, or NYSE that conducted both IPO and SEO during calendar years from 1970–2006, after applying our sample screening criteria. Market value is price multiplied by the number of shares outstanding. B/M is the ratio of book value of equity to market value of equity. Tobin’s Q is the ratio of total market value of assets to total book value of assets. ROA is the OIBD (Operating Income before Depreciation) normalized by total assets. CAP EXP RATIO is capital expenditure to total assets. FCF is the free cash flow, defined as net income after tax plus depreciation less common and preferred dividends, deflated by the firm’s beginning–of–year capital. IPO SIZE is the amount of capital raised in the IPO. SEO SIZE is the amount of capital raised in the SEO. SEO/IPO is SEO size as a fraction of capital raised in the IPO. SEO/MV EQ is SEO size as a fraction of market value of equity. ΔT is the number of calendar days between IPO and the first SEO. UNDER IPO is IPO underpricing, defined as the difference between the first post–issue price and the IPO offer price divided by the offer price. AB RET 20 is the abnormal return over the period from trading day 1 to trading day 20 after the IPO date. AB RET 40 is the abnormal return over the period from trading day 21 to trading day 40 after the IPO date. SEO AR, the SEO 3–day announcement period abnormal return, is calculated using market model over the event days –1, 0 and +1, where day 0 is the filing date. Age is the number of years since the founding date of the firm to the year issuing SEO.
30
Table 2 Firm Characteristics and Early SEO
Ln ΔT Likelihood of an Early SEO Full Sample Subsample 2 Full Sample Subsample 2
(1970–2006) (1990–2006) (1970–2006) (1990–2006) UNDER IPO –0.299*** –0.317*** 0.477*** 0.425***
Industry and year dummies Not reported Not reported Not reported Not reported Sample size 1,532 1,169 1,532 1,169 Adjusted R2 0.303 0.212
p–value of regression 0.0000 0.0000
Note: This table reports (1) the cross–sectional regression of the logarithm of time between IPO and the first SEO. The dependent variable is the logarithm of the time between the IPO and the first SEO (Ln ΔT), and (2) probit regression of the factors leading to an early SEO after IPO. The dependent variable is a dummy variable with value equal to one when an SEO is issued within six months of IPO and zero otherwise. The independent variables include: UNDER IPO is IPO underpricing, defined as the difference between the first post–issue price and the IPO offer price, divided by the offer price. Ln IPO SIZE is the logarithm of IPO size (the amount of equity capital raised in the IPO). AB RET 20 is the abnormal return over the period from trading day 1 to trading day 20 after the IPO date. AB RET 40 is the abnormal return over the period from trading day 21 to trading day 40 after the IPO date. Tobin’s Q is the ratio of total market value of assets to total book value of assets. CAP EXP RATIO is capital expenditure scaled by total assets. FCF is the free cash flow, defined as net income after tax plus depreciation less common and preferred dividends, deflated by the firm’s beginning–of–year capital. ROA is the OIBD (operating income before depreciation) normalized by total assets. AGE is the number of years since the founding date of the firm to the year issuing SEO. The independent variables also include dummy variables for industry and the year of SEO. Standard errors are listed in brackets. *, **, and *** denote significance level at the 10%, 5%, and 1% levels.
31
Table 3 SEO Three–day Announcement Period Abnormal Returns, AB RET 20, and AB RET 40
Panel A: Abnormal returns categorized by length of time since IPO at the date of first SEO
Time (t) between N SEO AR (%) AB RET 20 (%) AB RET 40 (%)
IPO and SEO
(1) t < 6 months 214 –5.79 22.29 11.39 (2) 6 months ≤ t < 1 year 428 –3.67 8.38 5.91 (3) 1 year ≤ t < 2 years 379 –2.59 2.59 2.40 (4) 2 years ≤ t < 3 years 185 –2.63 2.37 0.82 (5) 3 years ≤ t < 4 years 115 –2.82 1.26 0.06 (6) 4 years ≤ t < 5 years 82 –3.97 1.75 0.63 (7) t ≥ 5 years 207 –3.10 1.44 1.25
Sample Size/Averages 1,610 –3.46 6.44 3.94
Panel B: Difference tests
< 6 months ≥6 months Difference Tests [p – value]
Mean Median Mean Median T– test Median Test
SEO AR (%) –5.79 –5.34 –3.10 –3.17 [0.00]*** [<0.001]***
AB RET 20 22.29 14.63 4.01 2.43 [0.00]*** [<0.0001]***
AB RET 40 11.39 11.80 2.80 1.74 [0.00]*** [<0.0001]***
Note: The SEO AR (3–day announcement period abnormal return) is calculated using standard market model over the event days –1, 0 and +1, where day 0 is the filing date. AB RET 20 is the abnormal return over the period from trading day 1 to trading day 20 after the IPO date. AB RET 40 is the abnormal return over the period from trading day 21 to trading day 40 after the IPO date. They are calculated by subtracting the market index from the returns at time t. p–values are in the brackets. *, **, and *** denote significance level at the 10%, 5%, and 1% levels.
32
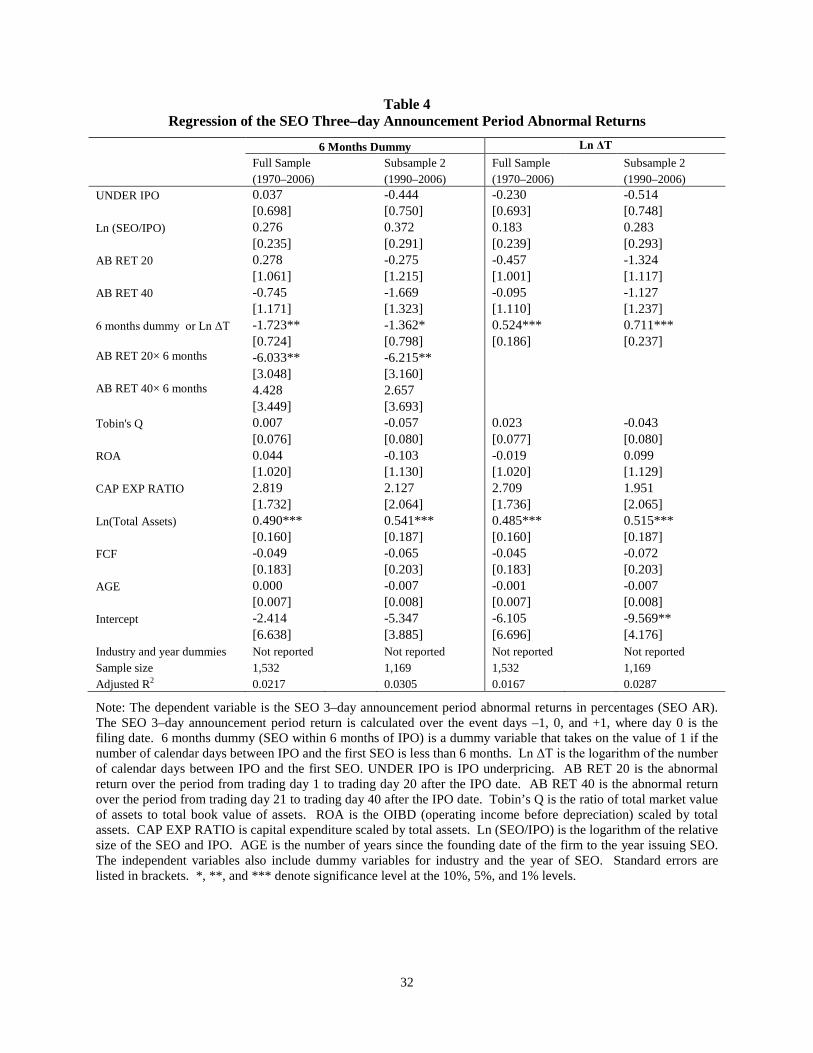
Table 4 Regression of the SEO Three–day Announcement Period Abnormal Returns
6 Months Dummy Ln ΔT Full Sample Subsample 2 Full Sample Subsample 2
(1970–2006) (1990–2006) (1970–2006) (1990–2006) UNDER IPO 0.037 -0.444 -0.230 -0.514
[0.698] [0.750] [0.693] [0.748]
Ln (SEO/IPO) 0.276 0.372 0.183 0.283
[0.235] [0.291] [0.239] [0.293]
AB RET 20 0.278 -0.275 -0.457 -1.324
[1.061] [1.215] [1.001] [1.117]
AB RET 40 -0.745 -1.669 -0.095 -1.127
[1.171] [1.323] [1.110] [1.237]
6 months dummy or Ln ΔT -1.723** -1.362* 0.524*** 0.711***
Industry and year dummies Not reported Not reported Not reported Not reported Sample size 1,532 1,169 1,532 1,169 Adjusted R2 0.0217 0.0305 0.0167 0.0287
Note: The dependent variable is the SEO 3–day announcement period abnormal returns in percentages (SEO AR). The SEO 3–day announcement period return is calculated over the event days –1, 0, and +1, where day 0 is the filing date. 6 months dummy (SEO within 6 months of IPO) is a dummy variable that takes on the value of 1 if the number of calendar days between IPO and the first SEO is less than 6 months. Ln ΔT is the logarithm of the number of calendar days between IPO and the first SEO. UNDER IPO is IPO underpricing. AB RET 20 is the abnormal return over the period from trading day 1 to trading day 20 after the IPO date. AB RET 40 is the abnormal return over the period from trading day 21 to trading day 40 after the IPO date. Tobin’s Q is the ratio of total market value of assets to total book value of assets. ROA is the OIBD (operating income before depreciation) scaled by total assets. CAP EXP RATIO is capital expenditure scaled by total assets. Ln (SEO/IPO) is the logarithm of the relative size of the SEO and IPO. AGE is the number of years since the founding date of the firm to the year issuing SEO. The independent variables also include dummy variables for industry and the year of SEO. Standard errors are listed in brackets. *, **, and *** denote significance level at the 10%, 5%, and 1% levels.
33
Table 5 The Long–Run Performance of SEOs by Length of Time between IPO and First SEO
Panel A: BHAR 3–Year Mean Buy–and–Hold Abnormal Returns %
Time (t) between IPO and SEO Size alone
Size and book–to–market
Size Size and earnings–to–price ratio
Size, SIC
and SIC and book–to–market
(1) t < 6 months –51.80 –68.98 –37.89 –22.53 –59.97
(2) 6 months ≤ t < 1 year –16.87 –32.27 –9.45 –24.22 –24.81
(3) 1 year ≤ t < 2 years –20.04 –22.72 –19.34 –22.68 –11.85
(4) 2 years ≤ t < 3 years –4.54 –23.55 –12.99 –16.55 –23.86
(5) 3 years ≤ t < 4 years –17.39 –32.61 –25.17 –14.34 –25.42
(6) 4 years ≤ t < 5 years –4.05 –3.90 4.79 –6.32 –19.01
(7) t ≥ 5 years –9.65 –9.87 –9.19 –18.90 –2.44
(8) All SEOs (1970–2006) –19.27 –29.53 –16.31 –20.46 –23.13
Panel B: Difference tests on BHAR Time (t) between 3–Year Mean BHR (%)
IPO and SEO N SEOs Matching firms BHAR (%)
(1) t < 6 months 208 –12.09 47.88 –59.97
(2) t≥ 6 months 1370 21.48 39.01 –17.54
Difference Tests (p–value) [0.035]**
Note: The sample of first seasoned equity offering during 1970 to 2006 is categorized by the length of time since IPO at the date of SEO. BHAR is the abnormal return defined as the difference between a sample firm’s BHR and its matching firm’s BHR. We use five sets of matching firms. The first set controls for size. The second controls for size and book–to–market. The third set controls for size and industry effect. The fourth set controls for size and earnings–to–price effect, and the fifth set controls for size, industry, and book–to–market. Panel A reports BHAR using the five alternative matching procedures. Panel B presents the difference tests on BHAR (matched by size, SIC and B/M). p–values are in brackets. *, **, and*** denote significance level at the 10%, 5%, and 1% levels.
34
Table 6 Regression Analysis of Three–Year Buy–and–Hold Abnormal Return (BHAR) of SEOs
6 Months Dummy Ln ΔT Full Sample Subsample 2 Full Sample Subsample 2 (1970–2006) (1990–2006) (1970–2006) (1990–2006) UNDER IPO 0.111 0.540 1.652 2.545
6 months dummy or Ln ΔT -32.358** -36.714** 16.368*** 19.525***
[15.672] [17.048] [5.709] [7.414]
Tobin's Q 6.167*** 6.275*** 6.485*** 6.442***
[1.883] [1.998] [1.885] [1.997]
ROA 68.084*** 59.305** 66.185*** 61.043**
[25.575] [28.571] [25.557] [28.536]
CAP EXP RATIO -63.402 -55.825 -66.486 -56.558
[56.046] [68.979] [55.963] [68.905]
Ln(Total Assets) 8.212 11.195* 9.371* 12.022*
[5.250] [6.220] [5.269] [6.229]
FCF 7.278* 3.243 7.345* 3.084
[3.891] [4.475] [3.886] [4.471]
AGE -0.320 -0.360 -0.383 -0.403
[0.272] [0.317] [0.273] [0.318]
Intercept -198.542 -201.776 -303.061 -326.751**
[232.944] [144.213] [233.767] [152.149]
Industry and year dummies Not reported Not reported Not reported Not reported Sample size 1,532 1,169 1,532 1,169 Adjusted R2 0.0463 0.0185 0.0488 0.0205
Note: The dependent variable is the BHAR of SEOs in percentages, computed as the difference between the BHRs of sample firms and the matching firms selected by size, industry, and book–to–market over a three–year holding period. 6 months dummy (SEO within 6 months of IPO) is a dummy variable that takes on the value of 1 if the number of calendar days between IPO and the first SEO is less than 6 months. Ln ΔT is the logarithm of the number of calendar days between IPO and the first SEO. UNDER IPO is IPO underpricing, defined as the difference between the first post–issue price and the IPO offer price divided by the offer price. AB RET 20 is the abnormal return over the period from trading day 1 to trading day 20 after the IPO date. AB RET 40 is the abnormal return over the period from trading day 21 to trading day 40 after the IPO date. Tobin’s Q is the ratio of a firm’s total market value of assets to total book value of assets. ROA is the OIBD (operating income before depreciation) normalized by total assets. CAP EXP RATIO is capital expenditures scaled by total assets. Ln (SEO/IPO) is the logarithm of the relative size of SEO and IPO. The independent variables also include dummy variables for industry and the year of SEO. AGE is the number of years since the founding date of the firm to the year issuing SEO. Standard errors are in brackets. *, **, and *** denote significance level at the 10%, 5%, and 1% levels.
Note: The sample consists of all firms listed on NASDAQ, AMEX, or NYSE during 1970–2006. Ln MV EQ is the logarithm of the market value of equity. Ln B/M is the logarithm of B/M, using the book value of equity for the most recent fiscal year end. ISSUE is a dummy variable that takes the value of 1 if a company conducted at least one public equity offering (SEO or IPO) within the 60 months preceding a given June 30th. ISSUE 6 Month is dummy variable that equals 1 if a company conducted SEO within 6 months of its IPO. The dependent variable is the firm’s monthly percentage stock return. T–statistics are listed in brackets. *, **, and *** denote significance levels at the 10%, 5%, and 1% levels. Model (2) 𝑟𝑖𝑡 = 𝑎 + 𝑏 ln 𝑀𝑉𝑖𝑡 + 𝑐 ln 𝐵𝑉 𝑀𝑉𝑖𝑡⁄ + 𝑑 𝐼𝑆𝑆𝑈𝐸𝑖𝑡 + 𝑒 𝐼𝑆𝑆𝑈𝐸6𝑚𝑜𝑛𝑡ℎ𝑖𝑡 + 𝜀𝑖𝑡
Table 8 Monthly Alphas Using Fama–French Three–Factor Model
Panel A: Issuers vs. Nonissuers Panel B: Early Issuers vs. Late issuers Issuers Nonissuers Difference < 6 months ≥6 months Difference All firms –0.27 0.21 –0.50 All issuers –0.89 0.12 –1.09
[–1.66]* [2.03]* [–4.94]*** [–1.97]** [1.06] [–2.62]*** Large firms 0.17 0.29 –0.13 Large issuers –0.13 0.28 –0.41
Note: The sample consists of all firms listed on NASDAQ, AMEX, or NYSE during 1970–2006. Large firms are those whose market capitalization on June 30 of year t is greater than the market capitalization of the median company in the sample. Small firms are those whose market capitalization is below the median. The monthly data for the market, size, and book–to–market factor returns are obtained from French’s website. Panel A reports regression alphas for portfolios of issuers and nonissuers and the difference in alphas. Panel B reports regression alphas for portfolios of issuers conducting SEOs within 6 months of IPOs (early issuers), issuers conducting SEOs after 6 months of IPOs (late issuers), and the difference in alphas. T–statistics are listed in brackets. *, **, and *** denote significance level at the 10%, 5%, and 1% levels. Model (3) �𝑅𝑝𝑡 − 𝑅𝑓𝑡� = 𝑎 + 𝑏 �𝑅𝑚𝑡 − 𝑅𝑓𝑡� + 𝑠 𝑆𝑀𝐵𝑡 + ℎ 𝐻𝑀𝐿𝑡 + 𝜀𝑡
36
Table 9 Aftermarket Returns and Investments
6 Months Dummy Ln ΔT Full Sample Subsample 2 Full Sample Subsample 2
(1970–2006) (1990–2006)
(1970–2006) (1990–2006)
AB RET 20 -8.249*** -8.366*** -5.758** -6.631***
[2.479] [2.799] [2.299] [2.495] AB RET 40 1.196 0.76 1.146 0.651
[5.545] [7.046] [7.196] [9.186] Industry and year dummies Not reported Not reported Not reported Not reported Sample size 1,451 1,115 1,451 1,115 Adjusted R2 0.25 0.268 0.252 0.27
Note: The table reports an OLS regression estimating the determinants of corporate investment. The dependent variable is corporate investment measured by total net property, plant and equipment. 6 months dummy (SEO within 6 months of IPO) is a dummy variable that takes on the value of 1 if the number of calendar days between IPO and the first SEO is less than 6 months. Ln ΔT is the logarithm of the number of calendar days between IPO and the first SEO. AB RET 20 is the abnormal return over the period from trading day 1 to trading day 20 after the IPO date. AB RET 40 is the abnormal return over the period from trading day 21 to trading day 40 after the IPO date. B/M equals the ratio of book value of equity to market value of equity. FCF is the free cash flow. The cash flow measure is scaled by the firm’s beginning–of–year capital. ROA is the OIBD (operating income before depreciation) normalized by total assets. Industry and year dummy variables are included in the regression but results are not reported. Standard errors are in brackets. *, **, and *** denote significance level at the 10%, 5% and 1% levels.
37
Table 10 Changes in Operating Performance: Median ROA (%)
Year Less than 6 months More than 6 months Difference
N Unadjusted Adjusted N Unadjusted Adjusted in Adjusted
–1 217 8.49 0.01 1,462 12.47 0.00 0.01
+1 169 5.58 –2.70** 1,247 11.13 0.20 –2.90**
+2 153 6.87 –2.22** 1,141 10.67 0.77*** –2.99***
+3 138 6.39 –3.27** 1,073 10.52 0.91** –4.18***
–1 to 1 –3.03** 0.00 –3.03***
–1 to 2 –4.05*** 0.47** –4.52***
–1 to 3 –4.07** 0.78** –4.85***
Note: This table reports the median operating performance for issuers and nonissuers matched on industry and pre–issue operating performance. The matching procedure follows Barber and Lyon (1996). The adjusted operating performance is the paired difference between the ROA of the issuing firms and the ROA of their matching nonissuing firms. We categorize the issuing firms by the length of time since IPO at the date of first SEO. The tables reports the median OIBD (operating income before depreciation) scaled by assets. Statistical tests are based on the Wilcoxon signed–rank test. *, **, and*** denote significance level at the 10%, 5%, and 1% levels.
Figure 1: Number of SEOs by Year and Proportion of Early SEOs