37
205 DO UNIVERSITY ENTRANCE EXAMS PREDICT ACADEMIC ACHIEVEMENT? Iida Häkkinen
| Date post: | 16-Feb-2017 |
| Category: |
Government & Nonprofit |
| Upload: | palkansaajien-tutkimuslaitos |
| View: | 417 times |
| Download: | 1 times |

205DO UNIVERSITY
ENTRANCEEXAMS PREDICT
ACADEMICACHIEVEMENT?
Iida Häkkinen
PALKANSAAJIEN TUTKIMUSLAITOS •TYÖPAPEREITALABOUR INSTITUTE FOR ECONOMIC RESEARCH • DISCUSSION PAPERS
* I am grateful to Per-Anders Edin, Jonas Lagerström, Roope Uusitalo, Hanna Ågren, BjörnÖckert, and the seminar participants at Uppsala University and FDPE labour workshop inHelsinki for valuable comments. I also thank Tuulikki Kaski and Pirjo Solin at the HelsinkiUniversity of Technology and Pekka Rahkonen and Jukka Hartikainen at the University ofJyväskylä for access to data. Financial support from Yrjö Jahnsson foundation and theFinnish Cultural Foundation is gratefully acknowledged. This paper has also been publishedin the working paper series of the Department of Economics, Uppsala University (WP2004:16).
** Department of Economics, Uppsala University, Box 513, SE-75120 Uppsala, SwedenTel. +46-18-4717140; fax. +46-18-4711478. E-mail address: [email protected]
Helsinki 2004
205
DO UNIVERSITYENTRANCEEXAMS PREDICTACADEMICACHIEVEMENT?*
Iida Häkkinen**

ISBN 952−209−001−8ISSN 1795−1801

ABSTRACT
The study examines which factors predict academic performance at university and com-
pares the predictive values of subject-related entrance exams and indicators of past school
performance. The results show that in the fields of engineering and social sciences entrance
exams predict both graduation and the number of study credits better than past performance.
In education past school performance is a better predictor of graduation. Changing the
admission rule to school grades would affect the average student performance negatively in
engineering and social sciences but positively in education. Using only entrance exams
would not significantly change the average performance in any field.
JEL Classification: I21
Key words: university admission decisions, entrance exams, academic achievement
1. INTRODUCTION
In most European countries, university education has grown enormously during the past few
decades. The enlargement of the secondary education has increased the number of eligible
applicants at tertiary level, and as a result, universities have abolished free entry policy and
created different kinds of student selection methods. Admission rules should be designed to
help in achieving education policy goals and they should be comprehensible, stable, fair,
cost-effective and legitimate. Student quality is also of direct economic interest and
universities are interested in predicting the academic achievement of the students when
deciding which applicants to admit. University admission processes have been formed
during a long time and the way they have turned out to be is largely dependent on the whole
education system and especially on the structure of the secondary education. In many
countries, university admission is based on general aptitude tests, e.g. SAT scores, possibly
combined with indicators of past performance at school and interviews or letters of recom-
mendation. Some countries base their university admissions mainly on past performance or
even lotteries, while others admit all applicants but only the best performing students may
continue their studies after one or two years of study.

2
In Finland, university admission is currently based on various subject-related entrance
exams and grades in the national senior secondary school final exam, matriculation exami-
nation. Universities select their students independently and there are no national entrance
exams. The problems of the current system are well known. Competition for the slots in
higher education is fierce and annual admission quotas apply to all fields of study. In total,
less than a third of the applicants are accepted. Competition and quotas force many appli-
cants to apply several times before they are accepted to the desired program. This has lead
to a high median starting age in some fields of study. In addition, less selective programs
suffer from high dropout rates when students succeed to get into other programs after a few
years. The admission decisions are made at the department or faculty level, which makes
the admission system very dispersed.1 The lack of coordination in the admission procedure
is problematic from the applicants' point of view because the applicants have to take sepa-
rate subject-related entrance exams for each university and retake the exam every year they
want to apply to the university. The dispersed exam-based system might not be cost-effec-
tive for the universities either.
Studies on predicting student performance at higher education abound. However, there are
few studies on how alternative admission systems would work and how reforms would
change the composition of applicants or students. One of the most important questions for
the universities is whether different admission rules lead to altered student populations and
change in average student achievement. A subject-related entrance exam may measure mo-
tivation and applicant's interest in the field of study and might therefore predict academic
success better than a general aptitude test or matriculation examination grades. Entrance
exams may also be a second chance for students who have received low grades in school.
On the other hand, entrance exams are costly for universities and for the society – especially
if students apply several times before they get admitted. It is not self-evident that the current
entrance exams measure the right things or give a realistic picture of what the actual
studying is like. Also, admission rules that are based on past performance could result in
admitting the same individuals than admission based on entrance exams. In this case uni-
versities should choose the admission criteria that minimize the costs.
This study examines which factors predict academic performance. In particular it compares
the predictive values of subject-related entrance exams and indicators of past school per-
formance which are the instruments that universities can use in the student selection. The
1 In the 20 Finnish universities, there are a total of 540 units who make the admission decisions.

3
study also looks at the student and applicant composition and how the student population or
average student performance would change if the admission criteria were changed. The
study uses three cohorts of students from the University of Jyväskylä and Helsinki Univer-
sity of Technology (HUT). Engineering is the largest field of study and HUT is the oldest,
largest and most selective university of technology in Finland, which makes it an ideal uni-
versity to analyze factors that predict academic achievement in the field of engineering.
However, one cannot draw conclusions from looking at one field and therefore, the study
also uses data on students in the fields of social sciences, education and sport sciences from
the University of Jyväskylä. University of Jyväskylä is a good example of a median Finnish
multidisciplinary university.
The rest of this paper is organized as follows. Section 2 summarizes the previous literature
on predicting student performance at tertiary education. Section 3 describes the university
admission process in Finland. Section 4 introduces the data and variables. Section 5 intro-
duces the methods used in evaluation. Empirical results are presented in Section 6 and Sec-
tion 7 concludes.
2. PREVIOUS LITERATURE
There is an extensive literature concentrated on predicting student performance. This lit-
erature uses mainly correlation analysis and the main conclusion from these studies is that
up to 25 percent of an individual's future educational success can be explained with factors
that are observable at the time of the admission. The general finding is that grade point
averages (GPA) from previous school and aptitude test scores provide the best forecast of
success, whether the success is measured as grades or completion of higher education. Betts
and Morell (1999) study the determinants of first-year college grades at the University of
California, San Diego, and find that personal background (gender, ethnic group, family
income) and the socio-economic environment of the school are significantly linked to col-
lege GPA. In addition, high school GPA and SAT scores are strongly correlated to success
at college, but predictions could be improved by adding background variables. Also
Rothstein (2003) finds that much of the aptitude test's predictive power derives from its
correlation with high school demographic characteristics.

4
Krueger and Wu (2000) study the determinants of success of 344 economics graduate stu-
dents who applied for admission to a "top five" department in the U.S. in 1989. They de-
termine the success by the students' job placement nine years after the beginning of the
graduate studies and find that although there is considerable uncertainty in predicting which
applicants will be placed in high-ranking jobs, the math graduate record examination, the
subjective ratings of the admissions committee, and the prominence of reference letter
writers are statistically significant predictors of applicants' subsequent job placements.
Öckert (2001) studies the completion probability and the effects of university studies on
labor market performance using data from the admission selection process in Sweden in
1982. His results show that female applicants, applicants with long senior secondary
schooling and high GPA from senior secondary school are most likely to graduate from
university. Age at entry is negatively related to student performance.
There are also a few studies that have examined the admission procedure in Finland. Most
studies find that senior secondary school grades are positively correlated with success in
higher education. The correlation of entrance exams and success in studies is somewhat
unclear because there are such many types of entrance exams. Lindblom-Ylänne et al.
(1992) examine the correlation of an aptitude test and first year university grades for
students in medicine and find that the test explains only a very small fraction of the varia-
tion in student performance. Gillberg (1987) analyzes students in business and finds that
success in the entrance exam is negatively correlated with dropout probability but entrance
exams have no connection with times-to-degree. Rantanen (2001) studies non-university
tertiary education in Finland and concludes that 60 percent of the applicants would have
been admitted to the same program even if entrance exams were abolished and students
were admitted on the basis of their past school performance. Rantanen finds that the best
indicators for student performance are applicant's school and program preference ranking
and the GPA from previous school. Performance in the entrance exam predicted student
performance only in the field of engineering. Some studies have found that past per-
formance in school and success in the entrance exam are quite weakly correlated, some-
times even negatively correlated (Silvennoinen et al., 1991; Ahola, 2004).
Most previous studies have looked at student performance at the beginning of the studies
and usually for one field of study. This paper includes four fields of study and has access to
yearly information on each student's study credits throughout the whole enrollment time,
which enables the identification of dropouts and following the students from admission to

5
graduation. In addition, the data sets used in this study include not only admitted students
but all applicants, which makes it possible to calculate how the student population would
change if different admission rules were used.
3. FEATURES OF THE FINNISH UNIVERSITY SYSTEM AND
ADMISSION PROCESS
The three-year Finnish senior secondary school concludes with a matriculation examination
that provides general eligibility for university studies.2 Matriculation examination is
compulsory for all senior secondary school students. It is drawn up nationally, and there is a
centralized body to grade the exam according to uniform criteria. The results are also
standardized to be comparable across the years. There are four compulsory exams in the
matriculation examination: mother tongue, the second national language, one foreign lan-
guage3, and either mathematics or science and humanities exam4. The grades in each exam
range from improbatur (failed) to laudatur (excellent), which are converted to a scale from 0
to 6 in this study. Mathematics exam is compulsory for students who have studied advanced
mathematics courses in senior secondary school. Students may also voluntarily take
additional exams in other foreign languages or take both the mathematics and the science
and humanities exam. The exams are held each spring and autumn during a two-week ex-
amination period. From 1996 onwards the students have been able to take the exam over the
maximum of three examination periods. Prior to 1996, the full exam had to be taken within
the same examination period, usually in the spring term of the senior year. More than 50
percent of the age group completes senior secondary school.
Matriculation exam gives the general eligibility for studies at tertiary level, but universities
select their students independently and there is restricted entry to all fields of study. The
number of study slots at tertiary level is determined each year in performance negotiations
between the Ministry of Education and the universities. Student selection may be based on
2 Individuals without the matriculation exam are eligible to apply for universities if they have at leastthree-year vocational qualification after compulsory schooling. However, there are very few applicantswithout the matriculation exam and these applicants are excluded from the empirical estimations.3 For the Finnish-speaking majority, the second national language is Swedish and the compulsory foreignlanguage is usually English.4 The science and humanities exam includes questions from physics, chemistry, biology, psychology,geography, religion, and history. Students can choose to answer questions from any subject area.

6
the combination of senior secondary school grades, matriculation exam grades, and the
entrance exam, which is the most common procedure; on the entrance exam alone; or on the
grades in the matriculation exam and the senior secondary school final grades. In addition,
some fields may place additional emphasis on work experience, previous studies or
practical training. Entrance exams are designed by the university, faculty or department in
question to assess the applicants’ motivation, suitability and aptitude in the field concerned.
The entrance exams are written subject-related tests with a book or two to read. There may
also be interviews or exams based on material that is distributed at the beginning of the test,
and students may be required to demonstrate their skills (e.g., at art academies).
Universities co-operate in organizing the student selection to varying degrees. The field of
engineering and architecture applies a joint selection system, where each of the universities
uses the same selection criteria and the same application form. There is also co-operation
between universities in biology, languages, class teacher and kindergarten teacher educa-
tion, and medicine. However, this co-operation does not constitute an actual joint selection
system. For the most fields, there is no coordination of the entrance exams, required litera-
ture or dates of the exams. For example, in 2004, there are six universities providing edu-
cation in sociology. An applicant to sociology could take four entrance exams in four
universities and would have to choose between the two universities that have the exam at
the same time. Also, the applicant might have to read different material for each of the
exams.
In total, less than a third of the applicants are accepted, but there are huge differences in the
acceptance rates between the fields and, to some extent, between universities. As shown in
Figure 1, the lowest acceptance rates (less than 10 %) are in the fields of theatre and psy-
chology, and the highest acceptance rates are in engineering (48 %), theology (39 %) and
natural sciences (38 %).

7
Figure 1. Share of accepted applicants by study field.
0 0,1 0,2 0,3 0,4 0,5 0,6
Engineering
Theology
Natural sciences
Theology
Dentistry
Agric. and forestry
Health sciences
Industrial arts
Business
Humanities
Social sciences
Medicine
Music
Law
Veterinary
Physical education
Education
Psychology
Theatre
Accepted students/applicants in 2002
Source: KOTA database of Ministry of Education.
Most students are accepted to programs leading to a Master's degree, which consists of one
major and one or more minor subjects. Students usually apply directly to a specific major.
The graduation requirement is, depending on the field of study, 160 or 180 credits. One
credit corresponds roughly to one week of full-time study. The target duration of studies in
most fields is five years, but the actual durations are usually longer. The median time-to-
degree is roughly six years. Currently there are no strict limits on the duration of enroll-
ment.
All Finnish universities are state-owned and their activities are mainly financed from the
state budget through the Ministry of Education. In 2003, the proportion of state funding was
about 65 percent of the operating costs. The rest comes from various sources, mainly as
acquired funding for research and services. The state funding system has been gradually

8
reformed since 1994 towards a system based on university outcomes. The core funding
consists of four segments: expenditure on new students and facilities, teaching, research,
and societal services. Teaching and research parts comprise 74 percent of the core funding
and the funding is allocated on the basis of the number of targeted and completed Master's
degrees and doctorates. Thus, there is an incentive for the universities to select successful
students who are able to finish their degree in reasonable time. In addition to core funding,
universities can receive performance based funding. The performance based funding repre-
sents about 2.4 percent of universities' operational expenditure and rewards universities for
the quality and effectiveness of their operations. The criteria for the performance based
funding include e.g. high quality research, students' progress in studies, and placement of
graduates in the labor market. (Ministry of Education, 2004).
3.1. Admission process in the Helsinki University of Technology (HUT)
As mentioned in the previous section, universities of technology have a unique joint appli-
cation system, which enables students to apply to all universities with one application. The
details of the admission rules are summarized in Table 1. In 1986, 1990 and 1995, each
applicant had to take two exams, one in mathematics and one in physics, chemistry or social
sciences depending on the desired program. Applicants were also given entry credits, which
are called initial entry points, on the basis of matriculation exam and senior secondary
school grades. In 1986 and 1990, initial entry points were based on the compulsory exams
in the matriculation examination, points from questions in physics or chemistry in science
and humanities matriculation exam, senior secondary school final grades in mathematics
and physics or chemistry, and senior secondary school GPA. In 1995, only senior secondary
school final grades in physics or chemistry and compulsory exams in the matriculation
exam gave initial entry points. Total admission points are calculated summing up initial
points and entrance exam points. Entrance exam constituted 47 percent of the total points in
1986 and 1990, and 65 percent in 1995.
In 1986, the admission of all students was based on total points. In 1990 and 1995, 80 per-
cent of the students were selected on the basis of total points and the remaining 20 percent
were selected ranking the applicants according to their entrance exam points. Students are
admitted directly into different majors. Due to the higher demand, popular majors have
higher entry requirements. Each major makes up a separate admission quota group.

9
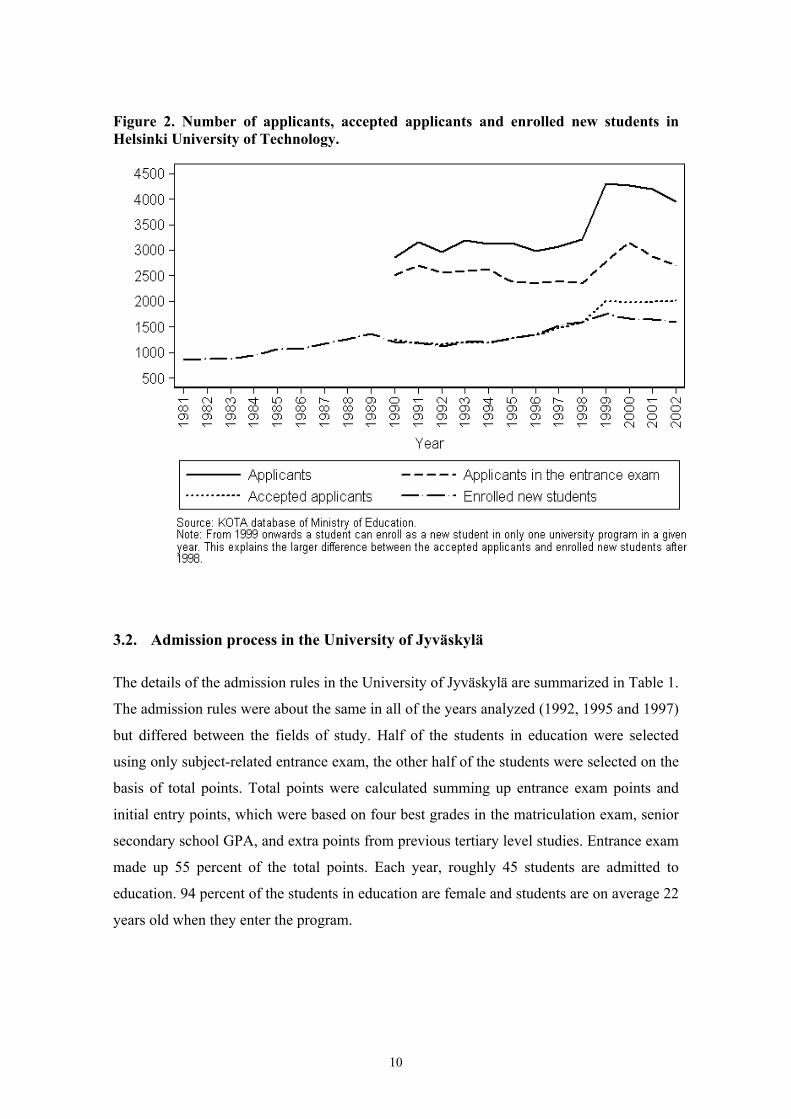
80 percent of the students in engineering are male. Unlike in most other fields, new entrants
are on average 19 years old and about 70 percent of the new enrollees at HUT have finished
their senior secondary school in the same year. About one thousand new students are ad-
mitted each year. The number of accepted students and the fraction of students who decide
to enroll have been quite stable in HUT during the time period that is analyzed in this study
(figure 2). The number of applications and new students did not grow much until the end of
the 1990s. It is also worth noting that nearly all admitted applicants decided to enroll be
cause prior to 1999 one could be admitted to and enroll in several universities in the same
year.
Table 1. Summary of admission rules.
Helsinki University of Technology University of Jyväskylä
Engineering Socialsciences
Sportsciences
Education
Year 86 90 95 92, 95, 97 92, 95, 97 92, 95, 97
Total points
1. Initial points
i. Matriculation exam
a. Mother tonguea X X X X X X
b. 2nd national languagea X X X X X
c. Foreign languagea X X X X X X
d. Mathematics/Sciencea X X X X X X
e. Other foreign language X X
f. Science/Mathematics Xb Xb Xe Xg
ii. Senior secondary school grades
a. Average (GPA) X X X X X X
b. Subjects MathPhys/Chem
MathPhys/Chem
Phys/Chem Sports
iii. Other merits
a. Work experience In field
b. Previous studies In field Tertiary
c. Other Gender
2. Entrance exam points
i. Written exam MathPhys/Chem/Soc c
MathPhys/Chem/Soc c
MathPhys/Chem/Soc c
Subjectrelated
Subjectrelated
Subjectrelated
ii. Aptitude test Xd X
Exam's weight in total points 47 % 47 % 65 % 50 % 55 %f 55 %
Admission rule
i. Total points 100 % 80 % 80 % 80 % 100 %f 50 %
ii. Entrance exam points 20 % 20 % 20 % 50 %
Notes: a=compulsory exam, b=questions in physics/chemistry, c=depends on applied major, d=Psychologyapplicants, e=higher weight on compulsory exams, f=weights for entrance exam points differ between majors, theapplicants with highest initial points are invited to the entrace exams, g=four best exams.
10
Figure 2. Number of applicants, accepted applicants and enrolled new students inHelsinki University of Technology.
3.2. Admission process in the University of Jyväskylä
The details of the admission rules in the University of Jyväskylä are summarized in Table 1.
The admission rules were about the same in all of the years analyzed (1992, 1995 and 1997)
but differed between the fields of study. Half of the students in education were selected
using only subject-related entrance exam, the other half of the students were selected on the
basis of total points. Total points were calculated summing up entrance exam points and
initial entry points, which were based on four best grades in the matriculation exam, senior
secondary school GPA, and extra points from previous tertiary level studies. Entrance exam
made up 55 percent of the total points. Each year, roughly 45 students are admitted to
education. 94 percent of the students in education are female and students are on average 22
years old when they enter the program.

11
In the years analyzed in this study, 80 percent of the students in social sciences5 were se-
lected on the basis of total points and the remaining 20 percent were selected ranking the
remaining applicants according to their entrance exam points. Entrance exam constituted 50
percent of the total points. Initial entry points were based on senior secondary school GPA,
matriculation exam grades in mother tongue, foreign language, and mathematics or science
and humanities exam. In addition, the applicants to psychology had to take a special apti-
tude test. Each year, roughly 230 students are admitted to social sciences. About 60 percent
of the admitted applicants are female and only 18 percent are senior secondary school
graduates of the same year. The average age at entry is 21.9 years.
Students in sport sciences were selected in two phases. First, applicants were ranked based
on their matriculation examination grades, senior secondary school GPA and grade in
physical education, work experience as a gym teacher or studies in the field. About 300 best
male and 300 best female applicants were then invited to take the written entrance exam and
the aptitude test measuring athletics and teaching skills. Students were ranked according to
the sum of exam points and initial entry points, giving a different weight to the initial points
in different majors. Entrance exam constituted about 55 percent of the total points. About
80 students are admitted each year and each major forms its own admission quota. 55
percent of the new entrants are female and the proportion of recent senior secondary school
graduates is about 12 percent.
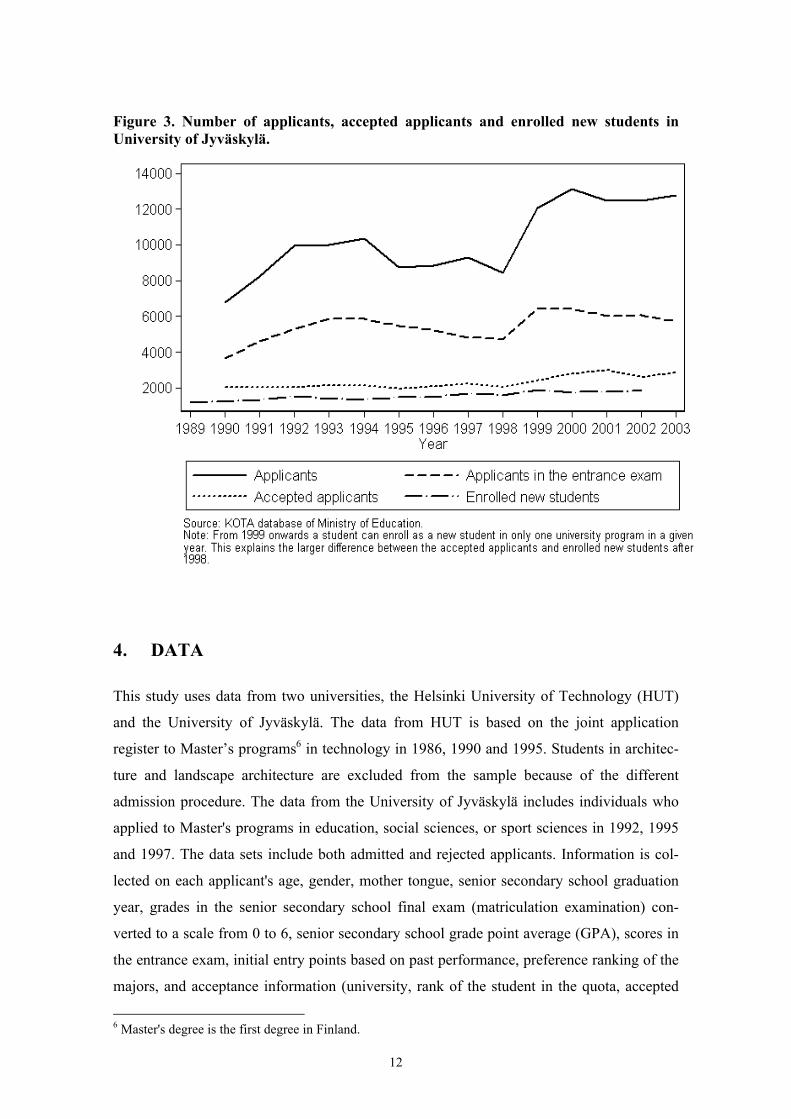
The number of accepted students and the fraction of students who decide to enroll have
been very stable in the University of Jyväskylä between the years 1992, 1995 and 1997
(figure 3). For the fields studied in this paper, roughly 15 percent of the admitted
applicants decide not to enroll.
5 Social sciences include philosophy, political science, psychology, social policy, social work, sociology,statistics, economics, business, and information systems science. Students are admitted directly intomajors.
12
Figure 3. Number of applicants, accepted applicants and enrolled new students inUniversity of Jyväskylä.
4. DATA
This study uses data from two universities, the Helsinki University of Technology (HUT)
and the University of Jyväskylä. The data from HUT is based on the joint application
register to Master’s programs6 in technology in 1986, 1990 and 1995. Students in architec-
ture and landscape architecture are excluded from the sample because of the different
admission procedure. The data from the University of Jyväskylä includes individuals who
applied to Master's programs in education, social sciences, or sport sciences in 1992, 1995
and 1997. The data sets include both admitted and rejected applicants. Information is col-
lected on each applicant's age, gender, mother tongue, senior secondary school graduation
year, grades in the senior secondary school final exam (matriculation examination) con-
verted to a scale from 0 to 6, senior secondary school grade point average (GPA), scores in
the entrance exam, initial entry points based on past performance, preference ranking of the
majors, and acceptance information (university, rank of the student in the quota, accepted
6 Master's degree is the first degree in Finland.
13
applicant’s major). Unfortunately there was no acceptance information for the students in
sport sciences and for the 1995 and 1997 starting cohorts of students in education. There-
fore, we can observe the accepted applicants who enrolled into these programs, but we can-
not distinguish an admitted applicant who did not enroll from a rejected applicant.
However, this does not cause any problems when we are looking at the achievement of the
enrolled students.
Initial entry points are points that admission units calculate from the matriculation exami-
nation grades, senior secondary school grades and possibly some other indicators of past
performance. Initial entry points are calculated differently for each field as described in the
previous section. To be able to compare entrance exam scores and initial entry points, per-
centile ranks within the admission quota (major) are used instead of actual scores. To be
able to make comparisons across the fields, different components of the initial points as
well as an alternative measure for initial points, which is calculated similarly for all fields,
are used in the estimations.
The applicant registers are matched with the student registers of the corresponding univer-
sities. The student registers contain yearly information on student's enrollment, academic
achievement (number of credits and courses taken) and time of the graduation. Students are
followed from the entry year to the fall of 2003. A student is defined as a dropout in the
year after which no study credits are achieved. Student register information is naturally only
available for admitted applicants who have decided to enroll. There is no information on
study success for the rejected applicants or admitted applicants who did not start their
studies. Further, the data do not include information on whether these applicants were ad-
mitted later or to other programs in other universities7. This creates a selection problem that
is discussed in the next section. The data include 3,278 students in engineering, 687 stu-
dents in social sciences, 249 students in sport sciences and 133 students in education.
Descriptive statistics of the applicants and enrolled students are presented in the Appendix
in Table A1.
7 Except for engineering, where acceptance (but not enrollment) information was available for alluniversities of technology for the years 1986, 1990 and 1995.

14
5. METHODS
It is not self-evident how "academic achievement" should be defined when trying to analyze
which factors predict achievement. The university might be interested in admitting students
that receive high grades, but clearly that is not the only measure of success. Since the times-
to-degree in Finland are very long and the government funding is partly based on the
received degrees, one interesting issue is how to select students who will graduate in the
targeted time. In addition, universities might be interested in predicting the dropout rates of
different types of applicants. Furthermore, graduate placement in the job market is also an
interesting issue. How graduates succeed in the labor market after graduation is an indicator
of school quality which affects the pool of applicants. Graduate placement is also a factor in
the government funding formula. Unfortunately, the data in their current form do not in-
clude any labor market information on students or their job placements after graduation.
Thus, this study concentrates on predicting the number of credits received during the first
four study years and the probability to graduate within seven years.
The university's problem is to identify a subset of the applicant pool most likely to be aca-
demically successful. Following Rothstein (2003), the university's assessment of student i is
given by
γβα iiiii XSXSyE ++=],|[ ,
(1)
where yi is a measure of the student's success at university (e.g. grades, number of credits),
Si is the student's entrance exam score, and Xi is a vector of other admissions variables (e.g.
matriculation exam grades). The conditional expectation is assumed to be linear and addi-
tive.8
The population for whom outcomes are to be predicted is the group of potential applicants,
while success in university can only be observed for enrolled students. Since one cannot
observe how well rejected students would have performed had they been admitted to the
university, the sample is selective. However, the data include all information that is used
when selecting the students from the pool of applicants. Under the selection-on-observables
assumption the OLS estimates for admitted applicants reflect the predictive power of en-
trance exams and other admission criteria for all applicants. However, since there are no
15
observations on the admitted applicants who did not enroll and the enrollment decision
might not be random, the estimates might still be biased. The probable explanation why
admitted students do not enroll is that they get accepted to other programs. Unfortunately
this is not observed in the data. Since the number of admitted applicants who do not enroll
is quite small, this should not be a major problem.
The basic analysis is based on an OLS regression model where the number of credits after
four study years is used as the dependent variable. Only a small fraction of students
graduates in less than four years. However, 10–15 percent of the students drop out. The
OLS models are estimated both including the dropouts and conditional on studying in the
fourth year. In addition, linear graduation probability models are estimated for the student
population. The empirical models are estimated separately for each field but pooling the
data for the three entry cohorts and adding cohort dummies to the models. The results do
not change much if models are estimated separately for each cohort.
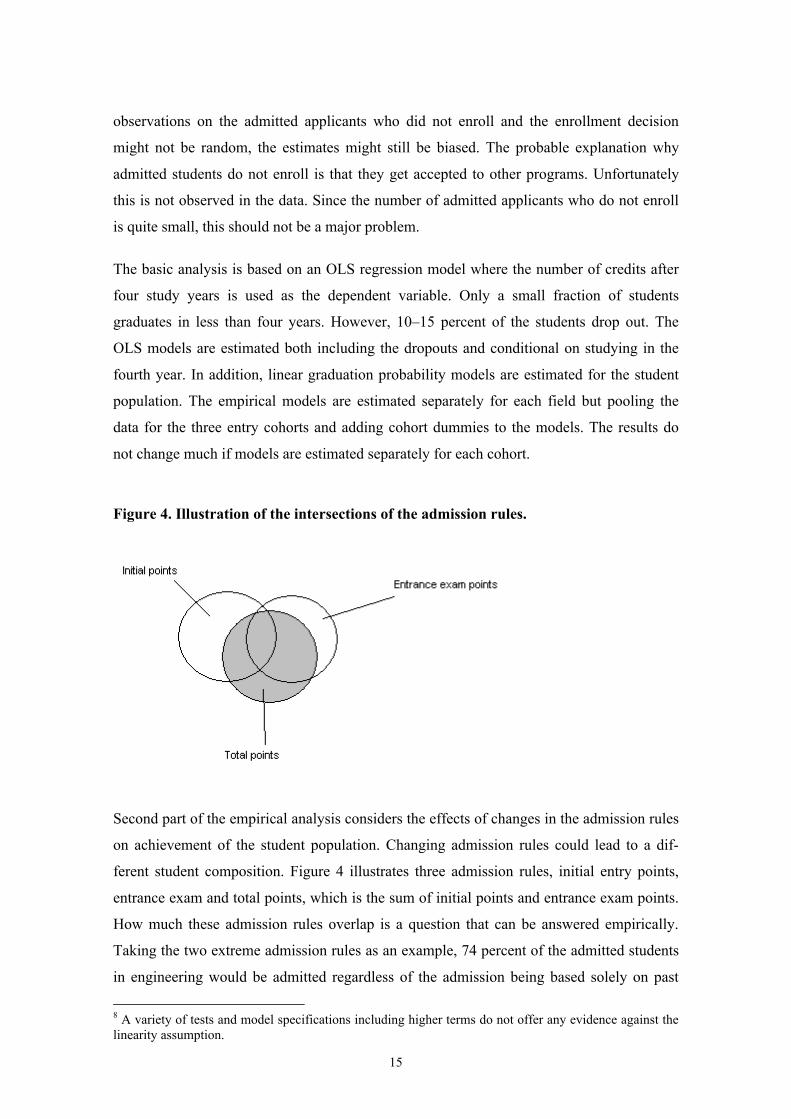
Figure 4. Illustration of the intersections of the admission rules.
Second part of the empirical analysis considers the effects of changes in the admission rules
on achievement of the student population. Changing admission rules could lead to a dif-
ferent student composition. Figure 4 illustrates three admission rules, initial entry points,
entrance exam and total points, which is the sum of initial points and entrance exam points.
How much these admission rules overlap is a question that can be answered empirically.
Taking the two extreme admission rules as an example, 74 percent of the admitted students
in engineering would be admitted regardless of the admission being based solely on past
8 A variety of tests and model specifications including higher terms do not offer any evidence against thelinearity assumption.
16
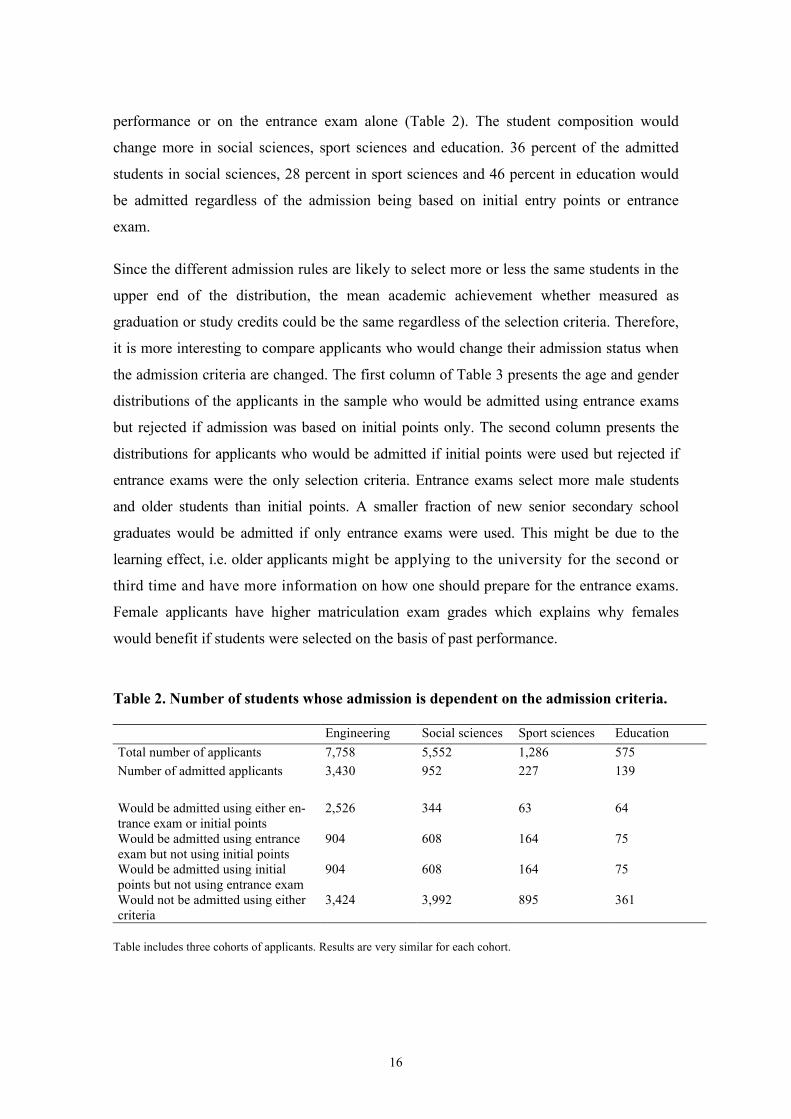
performance or on the entrance exam alone (Table 2). The student composition would
change more in social sciences, sport sciences and education. 36 percent of the admitted
students in social sciences, 28 percent in sport sciences and 46 percent in education would
be admitted regardless of the admission being based on initial entry points or entrance
exam.
Since the different admission rules are likely to select more or less the same students in the
upper end of the distribution, the mean academic achievement whether measured as
graduation or study credits could be the same regardless of the selection criteria. Therefore,
it is more interesting to compare applicants who would change their admission status when
the admission criteria are changed. The first column of Table 3 presents the age and gender
distributions of the applicants in the sample who would be admitted using entrance exams
but rejected if admission was based on initial points only. The second column presents the
distributions for applicants who would be admitted if initial points were used but rejected if
entrance exams were the only selection criteria. Entrance exams select more male students
and older students than initial points. A smaller fraction of new senior secondary school
graduates would be admitted if only entrance exams were used. This might be due to the
learning effect, i.e. older applicants might be applying to the university for the second or
third time and have more information on how one should prepare for the entrance exams.
Female applicants have higher matriculation exam grades which explains why females
would benefit if students were selected on the basis of past performance.
Table 2. Number of students whose admission is dependent on the admission criteria.
Engineering Social sciences Sport sciences EducationTotal number of applicants 7,758 5,552 1,286 575Number of admitted applicants 3,430 952 227 139
Would be admitted using either en-trance exam or initial points
2,526 344 63 64
Would be admitted using entranceexam but not using initial points
904 608 164 75
Would be admitted using initialpoints but not using entrance exam
904 608 164 75
Would not be admitted using eithercriteria
3,424 3,992 895 361
Table includes three cohorts of applicants. Results are very similar for each cohort.

17
Table 3. Age and gender distributions of applicants who would change admissionstatus when admission criteria are altered.
(1) (2) (3)
Admitted using entranceexam, but not usinginitial points
Admitted using initialpoints, but not usingentrance exam
Difference (1) – (2)(std error)
Engineering (904 obs) (904 obs) (1,808 obs)
Fraction of female applicants 0.102 0.287 -0.185** (0.018)
Mean age at entry 20.37 19.96 0.408** (0.100)
Fraction of new senior secondaryschool graduates
0.428 0.378 0.050* (0.023)
Social Sciences (608 obs) (608 obs) (1,216)
Fraction of female applicants 0.516 0.696 -0.179** (0.028)
Mean age at entry 22.61 20.70 1.903** (0.184)
Fraction of new senior secondaryschool graduates
0.081 0.421 -0.339** (0.023)
Sport Sciences (164 obs) (164 obs) (328 obs)
Fraction of female applicants 0.470 0.720 -0.250** (0.053)
Mean age at entry 21.63 20.70 0.933** (0.271)
Fraction of new senior secondaryschool graduates
0.158 0.390 -0.232** (0.048)
Education (75 obs) (75 obs) (150 obs)
Fraction of female applicants 0.920 0.933 -0.013 (0.043)
Mean age at entry 23.31 21.44 1.867* (0.726)
Fraction of new senior secondaryschool graduates
0.028 0.333 -0.305** (0.058)
The sample used includes only students who are admitted using one admission criteria, either entrance exam or initialpoints, but not with both admission criteria (rows 4 and 5 in Table 2) . Standard errors in the parenthesis are from arobust regression. * significant at 5 percent level; ** significant at 1 percent level. The results in column 3 areunchanged if controls for the applied major and starting cohort are included.
We can see how the student population would change if the admission criteria were altered,
but there are no observations on the achievement of the rejected applicants who would have
been admitted using other criteria. Since the admission is based on observables, the success
in studies can be predicted for the applicants that were not accepted or did not enroll using
the results on the enrolled students. Predicting the performance of the admitted but non-
enrolled applicants is not problematic since they are very similar in their observable
characteristics to enrolled students. Predicting the performance at university for the rejected
applicants has to be done by running out of sample predictions, since there is very little
overlap in the entrance exam results between the admitted and rejected applicants. Since the
admission weighs the entrance exam more than the past school performance, there is some
overlap in the matriculation exam and senior secondary school grades between the admitted
and rejected applicants. Out of sample predictions rely heavily on functional form assump-
tions. Within the sample (enrolled students), the relationship between entrance exams and

18
study credits after four years is linear and it is assumed in this study that the relationship is
linear also for the lower tail of the entrance exam distribution. Using higher moments of
explanatory variables in the performance prediction does not affect the qualitative results.
The range of the entrance exams and indicators of past performance is restricted in the sense
that those who have performed poorly in school and who are likely to perform poorly in the
entrance exam do not apply to university. Therefore, if the regressions were run for the
whole population, the university admission criteria would probably explain a much higher
proportion of the variation in achievement at university. Nevertheless, the predictions for
the population are not very interesting for the university's decision making.
Altered admission rules could affect the pool of applicants because people adapt to regula-
tory frameworks. However, there is no straightforward way to analyze what the effects
would be for the pool of applicants. A survey on senior secondary school graduates finds
that applicants with high grades prefer admission that is based on school grades or subject-
related tests whereas applicants who did not excel in school prefer general aptitude tests
(Garam and Ahola, 2001). Admission rules based on past performance could increase re-
taking passed matriculation exams and senior secondary school courses. Grade inflation,
retaking passed courses or choosing easier courses at senior secondary school to get better
grades has become a problem in Sweden, where university admission is largely based on
past performance (SOU 2004). Using entrance exams as the sole admission rule could en-
courage individuals with lower school grades to apply to university but also discriminate
new senior secondary school graduates who have less time to prepare for the entrance
exams than older applicants.
6. RESULTS
OLS regression results on the number of study credits after four years are presented in
Table 4. The sample used includes all admitted and enrolled students, regardless of their
student status in the fourth year. Some of the students have graduated, dropped out or
changed field of study, but the cumulative number of study credits can still be
calculated for all individuals who enrolled at least in the first year. Since each major
within the field of study forms an admission quota, all models include controls for the
major subjects. The possible cohort effects are controlled with dummy variables for the

19
admission year. In addition to the controls for student's major and cohort, the first
column for each field includes percentile ranks of entrance exam score and field specific
initial entry points. The results show that students with high rank in the entrance exam
have more study credits after four years. The magnitude of the effect varies between the
fields of study and it is statistically significant at 5 % level for all fields except for
education. The coefficient of the initial points percentile rank is positive but much
smaller and statistically significant only for sport sciences.
Table 4. OLS estimates of cumulative number of credits after four years.
Social sciences Sport sciences Education Engineering
(1) (2) (3) (4) (5) (6) (7) (8)
Rank ofentrance exam
90.775***(18.960)
82.353***(18.738)
35.445**(16.650)
30.991*(16.700)
37.236*(20.031)
37.469*(19.532)
54.430***(5.545)
59.875***(5.515)
Rank of initialpoints
11.683(7.611)
7.239(8.568)
29.274**(11.293)
20.937(12.712)
37.088(22.529)
39.934*(20.432)
5.313(4.178)
5.225(4.244)
Female 19.972*** 4.040 -57.486*** 20.436***
(4.855) (7.009) (17.286) (2.646)
Age at entry:21-23
10.407**(4.347)
-3.704(6.908)
-14.364(8.722)
15.229***(3.035)
24- 6.425 -22.187** -17.313 3.992
(6.534) (10.536) (15.797) (7.060)
Observations 687 687 244 244 133 133 3,278 3,278
R-squared 0.12 0.14 0.06 0.09 0.07 0.14 0.08 0.11
F statistic(Prob>F)
7.65(0.0000)
8.09(0.0000)
2.43(0.0201)
2.55(0.0061)
2.24(0.0679)
4.41(0.0002)
17.19(0.0000)
19.30(0.0000)
Robust standard errors in parentheses. * significant at 10 %; ** significant at 5 %; *** significant at 1 % level. Allmodels include controls for student's major and entry cohort. The excluded entry age group is 18-20-year-olds.
Background variables in student performance prediction are not particularly informative
about admissions policy, but they are still interesting. It is plausible that entrance exam
score and school grades are correlated with socio-economic background of the student that
predicts the student performance. The data include information on student's gender and age.
These are added as controls in the second column for each field in Table 4. The coefficient
of the entrance exam rank is more or less unchanged. The effect of the rank of initial points
is diminished for social sciences, engineering and sport sciences. For the field of education,
the effect of the rank of initial points increases slightly and it is significant at 10 % level.
Female students have more study credits after four years in all fields except in education.
The deviating gender effect for education is probably due to the very small number of male
students in the field. Female students have on average higher grades in the matriculation

20
examination and therefore higher initial points. When gender is not controlled for, the per-
centile rank of initial points partly captures the gender effects. There are no statistically
significant age effects for the field of education. Students who are 21-23-years old when
they enter the university perform better than 18-20-year-olds in the fields of engineering
and social sciences. Students who are older than 23 when they enter the university perform
worse in sport sciences.
Since initial points are calculated differently in each field, it is difficult to make compari-
sons between fields. Therefore, Table 5 uses an alternative measure of initial points that are
calculated similarly for all fields. Initial points in Table 5 include four compulsory exams in
matriculation exam and senior secondary school GPA. The results do not change much for
social sciences, because this measure of initial points is very similar to the way the real
initial points are calculated. For the other fields, the coefficient of the rank of initial points
is diminished.
It is also possible to look at how the different components of initial points predict cumula-
tive number of study credits. Table 6 includes entrance exam ranks, senior secondary school
GPA and matriculation exam grades in the compulsory exams. The sample size in these
regressions is smaller because all matriculation grades were not available for some students.
Senior secondary school GPA is a good predictor of study credits at university in all fields
but matriculation exam grades are mostly insignificant and even negative. The variation in
the matriculation exam grades is not very large among the admitted students; the maximum
grade in the matriculation exam is 6 and the mean grade in the student population is about
5. Therefore, it is not so surprising that the explanatory power of matriculation exams is so
poor. Results do not change even if rank of entrance exam is excluded from the regressions.
None of the coefficients in the field of education are statistically significant because of the
small sample size.

21
Table 5. OLS estimates of cumulative number of credits after four years using sameinitial points for all fields.
Social sciences Sport sciences Education Engineering
(1) (2) (3) (4) (5) (6) (7) (8)
Rank ofentrance exam
88.540***(18.976)
82.303***(18.800)
32.455*(17.371)
28.999*(17.493)
30.440(21.348)
33.706*(19.631)
54.730***(5.548)
60.010***(5.513)
Rank of initialpointsa
15.204**(7.284)
8.182(7.601)
5.455(10.805)
-6.243(10.894)
7.532(17.530)
17.565(16.467)
3.421(3.631)
-0.014(3.651)
Female 20.047*** 8.947 -54.907*** 20.858***
(4.876) (6.729) (16.193) (2.657)
Age at entry:21-23
8.496** -4.099 -20.605** 14.521***
(4.216) (6.931) (8.681) (2.988)
24- 4.625 -25.007** -22.342 3.029
(6.081) (10.671) (15.933) (7.031)
Observations 687 687 244 244 133 133 3,278 3,278
R-squared 0.12 0.15 0.04 0.08 0.04 0.12 0.08 0.11
F statistic(Prob>F)
7.67(0.0000)
8.10(0.0000)
1.30(0.2519)
2.21(0.0180)
1.38(0.0370)
3.70(0.0011)
17.13(0.0000)
19.31(0.0000)
Robust standard errors in parentheses. * significant at 10%; ** significant at 5%; *** significant at 1% level. a initialpoints are calculated similarly for all fields including four compulsory matriculation exams and senior secondaryschool GPA (max. 34 points). All models include controls for student's major and entry cohort. The excluded entryage group is 18-20-year-olds.
Table 6. OLS estimates of cumulative number of credits after four years. Matriculation exam results.
Social sciences Sport sciences Education Engineering(1) (2) (3) (4)
Rank of entrance exam 83.731*** 19.042 38.884 54.256**(21.405) (18.553) (24.325) (5.575)
Senior secondary school GPA 12.824*** 19.472*** 22.021 14.936***(4.797) (6.817) (13.281) (2.135)
ME grade mother tongue -5.452* 1.649 8.511 -3.658***(3.075) (4.482) (6.101) (1.206)
ME grade mathematics/science 0.071 1.598 -3.986 -0.947(1.889) (2.668) (3.726) (1.423)
ME grade foreign language -6.705** -5.510 -3.918 -4.329***(2.773) (3.344) (6.252) (1.076)
ME grade the other national language 4.424 0.205 -4.570 0.649(3.377) (3.832) (9.063) (1.156)
Observations 520 214 110 3,267R-squared 0.16 0.12 0.09 0.10F statistic(Prob>F)
6.58(0.0000)
2.71(0.0028)
2.37(0.0220)
17.78(0.0000)
Robust standard errors in parentheses. * significant at 10%; ** significant at 5%; *** significant at 1% level. Allmodels include controls for student's major and entry cohort.
22
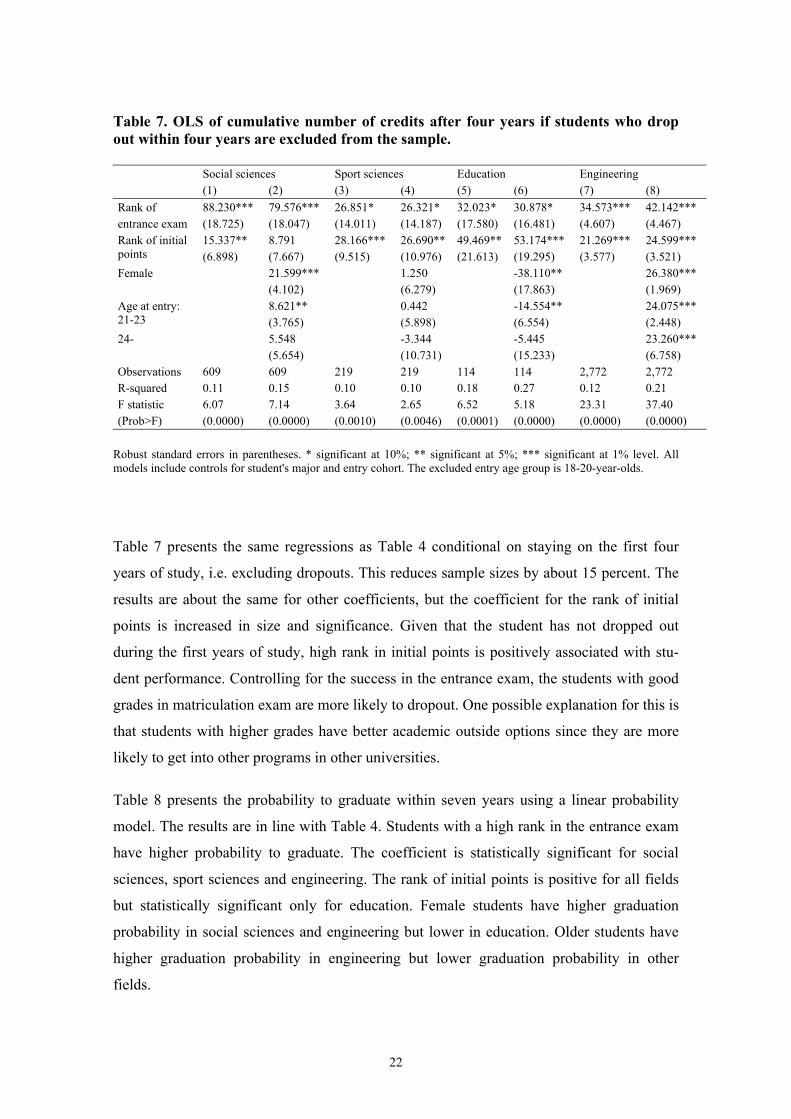
Table 7. OLS of cumulative number of credits after four years if students who dropout within four years are excluded from the sample.
Social sciences Sport sciences Education Engineering(1) (2) (3) (4) (5) (6) (7) (8)
Rank ofentrance exam
88.230***(18.725)
79.576***(18.047)
26.851*(14.011)
26.321*(14.187)
32.023*(17.580)
30.878*(16.481)
34.573***(4.607)
42.142***(4.467)
Rank of initialpoints
15.337**(6.898)
8.791(7.667)
28.166***(9.515)
26.690**(10.976)
49.469**(21.613)
53.174***(19.295)
21.269***(3.577)
24.599***(3.521)
Female 21.599*** 1.250 -38.110** 26.380***(4.102) (6.279) (17.863) (1.969)
Age at entry:21-23
8.621**(3.765)
0.442(5.898)
-14.554**(6.554)
24.075***(2.448)
24- 5.548 -3.344 -5.445 23.260***(5.654) (10.731) (15.233) (6.758)
Observations 609 609 219 219 114 114 2,772 2,772R-squared 0.11 0.15 0.10 0.10 0.18 0.27 0.12 0.21F statistic(Prob>F)
6.07(0.0000)
7.14(0.0000)
3.64(0.0010)
2.65(0.0046)
6.52(0.0001)
5.18(0.0000)
23.31(0.0000)
37.40(0.0000)
Robust standard errors in parentheses. * significant at 10%; ** significant at 5%; *** significant at 1% level. Allmodels include controls for student's major and entry cohort. The excluded entry age group is 18-20-year-olds.
Table 7 presents the same regressions as Table 4 conditional on staying on the first four
years of study, i.e. excluding dropouts. This reduces sample sizes by about 15 percent. The
results are about the same for other coefficients, but the coefficient for the rank of initial
points is increased in size and significance. Given that the student has not dropped out
during the first years of study, high rank in initial points is positively associated with stu-
dent performance. Controlling for the success in the entrance exam, the students with good
grades in matriculation exam are more likely to dropout. One possible explanation for this is
that students with higher grades have better academic outside options since they are more
likely to get into other programs in other universities.
Table 8 presents the probability to graduate within seven years using a linear probability
model. The results are in line with Table 4. Students with a high rank in the entrance exam
have higher probability to graduate. The coefficient is statistically significant for social
sciences, sport sciences and engineering. The rank of initial points is positive for all fields
but statistically significant only for education. Female students have higher graduation
probability in social sciences and engineering but lower in education. Older students have
higher graduation probability in engineering but lower graduation probability in other
fields.

23
Table 8. Linear probability to graduate in 7 years.
Social sciences Sport sciences Education Engineering(1) (2) (3) (4) (5) (6) (7) (8)
Rank of en-trance exam
0.480***(0.161)
0.510***(0.163)
0.416***(0.158)
0.381**(0.158)
0.124(0.220)
0.136(0.218)
0.304***(0.047)
0.346***(0.046)
Rank ofinitial points
0.113(0.069)
0.029(0.078)
0.120(0.114)
0.072(0.122)
0.529***(0.165)
0.539***(0.159)
0.039(0.036)
0.041(0.036)
Female 0.118*** -0.089 -0.459*** 0.151***(0.046) (0.071) (0.153) (0.022)
Age at entry:21-23
-0.090**(0.044)
-0.232***(0.074)
-0.071(0.098)
0.104***(0.024)
24- -0.030 -0.349*** -0.231* 0.089(0.057) (0.090) (0.135) (0.050)
Observations 687 687 244 244 133 133 3,278 3,278R-squared 0.11 0.13 0.11 0.16 0.07 0.11 0.06 0.08F statistic(Prob>F)
7.72(0.0000)
7.58(0.0000)
7.13(0.0000)
6.08(0.0000)
2.76(0.0306)
4.96(0.0000)
12.40(0.0000)
14.75(0.0000)
Robust standard errors in parentheses. * significant at 10%; ** significant at 5%; *** significant at 1%level. All models include controls for student's major and entry cohort. The excluded entry age group is18-20-year-olds.
6.1. Predicted effects of a change in the admission rules
The results in the previous tables show that subject-related entrance exams are better pre-
dictors of achievement in engineering, social sciences and sport sciences whether the
achievement is measured as study credits after four years or as graduation. Initial points
predict graduation better in the field of education. In addition, results show that senior
secondary school GPA is a good predictor of success at university. However, it is hard to
compare different admission systems based on these results because a large number of stu-
dents would be admitted regardless of the admission rules used. Therefore, it is interesting
to look at students who would be admitted using one rule but rejected using the other. Suc-
cess in studies can only be observed for the students who were admitted in the current sys-
tem and alternative selection rules might admit different students. However, since the
admission is based on observables, the performance of the non-enrolled students can be
predicted using results in Table 4. Controls are added for entrance exam and initial point
ranks, gender, three age groups, major, and entry cohort. Including higher terms of regres-
sors does not change the qualitative results.
The first column in Table 9 presents the success of students who would have been admitted
using entrance exam but rejected using initial points and the second column presents the
success of students who would have been accepted using initial points but rejected using
entrance exam. The difference between the first group (entrance exam) and the second group

24
(initial points) – presented in the third column – can be seen as the difference in the average
performance of the "marginal" individuals. In engineering, the difference in mean number of
study credits after four years between the two groups is about 19 credits, the difference in
median credits is slightly lower (15 credits). Further, a significantly higher proportion of
students graduate within seven years in the first group than in the second group. For social
sciences, the mean (median) number of study credits after four years is about 22 (27) credits
more for the first group, and almost 51 percent of the students in the first group graduate in
seven years compared to the 37 percent in the second group. In education and sport sciences,
the only significant difference between the groups is the fraction of students who graduate in
seven years. Students selected using entrance exams do better in sport sciences but worse in
education.
The results using the "marginal" students who would only be selected using one admission
rule suggest that at least in engineering and social sciences it would be better to select stu-
dents with entrance exam. The interesting question for the university is how the total per-
formance of students would change if the current system using mainly total points would be
replaced by a system using either entrance exams or initial points. The performance of the
non-enrolled students is predicted as above. The effect of the change in the admission rules
on mean performance is estimated by regressing the number of study credits after four years
on a full set of dummy variables for different combinations of admission status in the three
admission systems (see figure 4) and calculating the change as a linear combination of the
dummy variables. The first column in Table 10 shows the change in the mean study credits
of the whole student population if the selection system is changed from total points to
entrance exams. There are no statistically significant changes in the mean number of study
credits for any fields.

25
Table 9. Success of students who will change admission status depending on whichadmission criteria are used.
(1) (2) (3)Admitted usingentrance exam, but notusing initial points
Admitted using initialpoints, but not usingentrance exam
Difference (1) – (2)(std error)
Engineering (904 obs) (904 obs) (1,808 obs)Number of study credits after four yearsMeanMedian
86.482.4
67.767.1
18.694** (1.836)15.415** (1.388)
Fraction of students who graduate within 7years
0.207 0.116 0.091** (0.014)
Social sciences (608 obs) (608 obs) (1,216 obs)Number of study credits after four yearsMeanMedian
142.1146.0
120.0119.5
22.095** (1.841)26.523** (1.771)
Fraction of students who graduate within 7years
0.508 0.366 0.142** (0.018)
Sport sciences (164 obs) (164 obs) (328 obs)Number of study credits after four yearsMeanMedian
120.1123.1
124.9124.4
-4.296 (3.052)-1.793 (1.202)
Fraction of students who graduate within 7years
0.580 0.502 0.078* (0.037)
Education (75 obs) (75 obs) (150 obs)Number of study credits after four yearsMeanMedian
144.9152.9
146.2151.5
-1.273 (6.961)1.356 (5.268)
Fraction of students who graduate within 7years
0.309 0.593 -0.133* (0.063)
The sample used includes only students who are admitted using one admission criteria, either entrance exam or initialpoints, but not with both admission criteria. Performance of the students who were not admitted or did not enroll ispredicted using results from table 4 (including controls for gender, three age groups, starting cohort and students'major). Standard errors in the parenthesis are from a robust regression. * significant at 5 % level; ** significant at 1% level.
The second column shows the same figures for the change from total points to initial points
system. In social sciences and engineering the mean number of credits after four years
would diminish if the total points system was replaced by a system based on initial points.
In education the mean performance of the student population would be better if initial
points were used instead of total points.
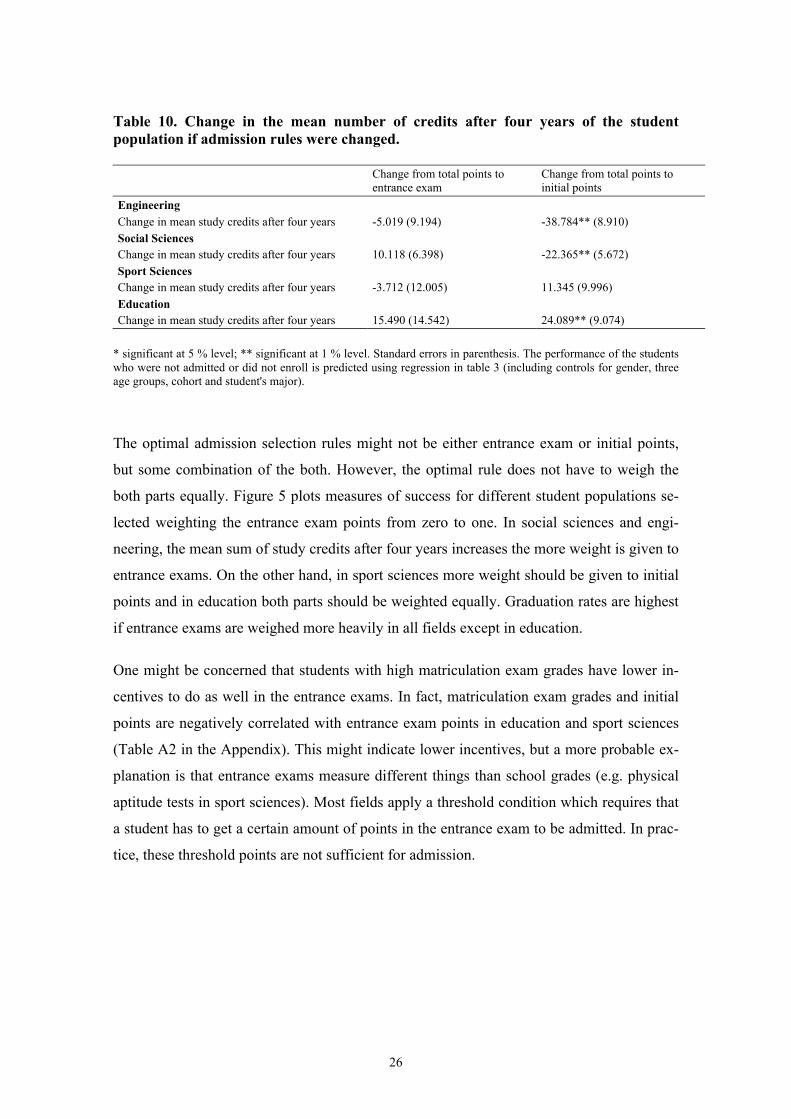
26
Table 10. Change in the mean number of credits after four years of the studentpopulation if admission rules were changed.
Change from total points toentrance exam
Change from total points toinitial points
EngineeringChange in mean study credits after four years -5.019 (9.194) -38.784** (8.910)Social SciencesChange in mean study credits after four years 10.118 (6.398) -22.365** (5.672)Sport SciencesChange in mean study credits after four years -3.712 (12.005) 11.345 (9.996)EducationChange in mean study credits after four years 15.490 (14.542) 24.089** (9.074)
* significant at 5 % level; ** significant at 1 % level. Standard errors in parenthesis. The performance of the studentswho were not admitted or did not enroll is predicted using regression in table 3 (including controls for gender, threeage groups, cohort and student's major).
The optimal admission selection rules might not be either entrance exam or initial points,
but some combination of the both. However, the optimal rule does not have to weigh the
both parts equally. Figure 5 plots measures of success for different student populations se-
lected weighting the entrance exam points from zero to one. In social sciences and engi-
neering, the mean sum of study credits after four years increases the more weight is given to
entrance exams. On the other hand, in sport sciences more weight should be given to initial
points and in education both parts should be weighted equally. Graduation rates are highest
if entrance exams are weighed more heavily in all fields except in education.
One might be concerned that students with high matriculation exam grades have lower in-
centives to do as well in the entrance exams. In fact, matriculation exam grades and initial
points are negatively correlated with entrance exam points in education and sport sciences
(Table A2 in the Appendix). This might indicate lower incentives, but a more probable ex-
planation is that entrance exams measure different things than school grades (e.g. physical
aptitude tests in sport sciences). Most fields apply a threshold condition which requires that
a student has to get a certain amount of points in the entrance exam to be admitted. In prac-
tice, these threshold points are not sufficient for admission.

27
Figure 5. Performance of students when admission decision is made giving differentweights to the entrance exam.
Other concern is that percentile ranks of entrance exams might predict success better be-
cause the distribution of the entrance exams is different from the distribution of the initial
points and there might be more variation in the entrance exam points. Figure A1 in the Ap-
pendix shows histograms of initial points and entrance exam points in each field. There are
clear differences in the distributions but both initial points and entrance exam points have
variation. Further, since 80 percent of the students in social sciences and engineering are
admitted using total points and the remaining 20 percent are selected using only entrance
exam, this last 20 percent has by definition lower initial points than the first 80 percent of
the students. This might affect the coefficients of the percentile ranks. As a robustness
check, the regressions are run excluding the students who were admitted on the basis of the
entrance exam only. The results do not change qualitatively.
8010
012
014
016
0M
ean
stud
y cr
edits
0 .2 .4 .6 .8 1Weight given to entrance exam
Study credits after 4 years
.2.3
.4.5
.6G
radu
atio
n ra
te
0 .2 .4 .6 .8 1Weight given to entrance exam
Fraction graduating in 7 years

28
7. CONCLUSION
At best, factors which can be used as admission criteria and which are observable to the
admission committee at the time of the admission decision explain about 15 percent of the
variation in the student achievement. The results show that initial entry points based on past
performance in school are good predictors of graduation from university in the field of edu-
cation. For the fields of social sciences, sport sciences and engineering, percentile ranks in
entrance exams provide a better prediction for student achievement. A large fraction of
students would be admitted whether the admission was based on entrance exams, initial
entry points or total points, which is the sum of entrance exam and initial points. This is
especially true for the field of engineering. Admitting students on the basis of their past
school performance instead of total points would decrease the mean performance of the
student population in engineering and social sciences but increase the mean performance in
education. Using only entrance exams would not affect the mean performance in any of the
fields studied. However, changing the admission rules could lead to changes in the pool of
applicants and unfortunately it is not possible to estimate the effects of the change in the
pool of applicants. In addition, the performance predictions of the rejected applicants are
based on strong assumptions on the functional form, and the results on the effect of a
change in the admission criteria should be read with that in mind.
University admission process has some important welfare effects. Direct costs of the ad-
mission systems might not be very large but the quality of the students significantly in-
fluences the financial situation of the universities through the government funding criteria.
Students who have to apply to universities for several times before they get admitted have
high costs in the form of foregone earnings. Also, it is estimated that if Finnish students
would enter universities at younger age and finish their education one year faster than what
they do today, the amount of highly educated workers would increase by 15,000 (Ministry
of Education 2003). This would be a significant increase in the educated labor force. Thus,
the efficiency of the university admission system should be intensified.
The data in the current form include no family background variables or labor market infor-
mation for the students. The future extension of this study is to match the data with registers
that include information on student's family background, earnings and months of work
during and after the enrollment. This will enable e.g. to study how much pre-university
skills affect earnings after graduation or the effect of different admission criteria on the
success in the labor market.

29
REFERENCES
Ahola, S. (2004): Yhteishausta yhteisvalintaan. Yliopistojen opiskelijavalintojen kehittäminen. Ope-
tusministeriön työryhmämuistioita ja selvityksiä 2004:9. Ministry of Education.
Betts, J. R. and D. Morell (1999): The determinants of undergraduate grade point average: the
relative importance of family background, high school resources, and peer group effects. The
Journal of Human Resources 34, 268-293.
Garam, I. and S. Ahola (2001): Suuntana tulevaisuus. Tutkimus varsinaissuomalaisten abiturienttien
koulutustoiveista, -suunnitelmista sekä niiden taustalla olevista käsityksistä. Länsi-Suomen läänin-
hallituksen julkaisuja 15/2001.
Gillberg, A. (1987): Tutkimus Helsingin kauppakorkeakoulun vuosina 1977-1979 sisäänpäässeiden
opiskelijoiden opintomenestykseen vaikuttaneista tekijöistä. Helsingin kauppakorkeakoulun julkai-
suja D-94. Helsinki.
KOTA database. Administrated by the Ministry of Education, available online at
http://www.csc.fi/kota/nuts.html
Krueger, A. B. and S. Wu (2000): Forecasting job placements of economics graduate students.
Journal of Economic Education 31, 81-94.
Lindblom-Ylänne, S., K. Lonka and S. Maury (1992): Miten aineistokokeessa menestyminen ennus-
taa alkuvaiheen opintomenestystä. Helsingin yliopisto. Opintoasiain julkaisuja. Helsinki.
Ministry of Education (2003): Korkeakoulujen opintoaikojen lyhentämisen toimenpideohjelma.
Opetusministeriön työryhmämuistioita ja selvityksiä 2003:27.
Ministry of Education (2004): Management and steering of higher education in Finland.
Publications of the Ministry of Education, Finland 2004:20.
Rantanen, P. (2001): Valintakoe vai ei? Ammatillisen koulutuksen ja ammattikorkeakoulujen opis-
kelijavalinnan tarkastelua. Koulutus- ja tiedepolitiikan osaston julkaisusarja 83. Ministry of Education.
Rothstein, J. M. (2003): College performance predictions and the SAT. Journal of Econometrics 121,
297-317.
Silvennoinen, M., L. Laakso and J. Turunen (1991): Liikuntatieteellisen tiedekunnan valintakoe-
tutkimus. Jyväskylän yliopisto. Liikuntakasvatuksen laitos A 20. Jyväskylä.
SOU (2004): Tre vägar till den öppna högskolan. Betänkande av Tillträdesutredningen. Statens
offentliga utredningar 2004:29. Stockholm.
Öckert, B. (2001): Does pre-university background matter? In Effects of higher education and the
role of admission selection, Dissertation series no. 52, Swedish Institute for Social Research,
Stockholm University.

3
APPENDIX
Table A1. Descriptive statistics.
EngineeringAdmitted applicants Non-admitted applicants
Variable N Mean Std. Dev. N Mean Std. Dev.Female 3,391 0.196 0.397 4,366 0.185 0.388Age at entry: 18-20 3,391 0.850 0.357 4,366 0.661 0.47321-23 3,391 0.124 0.330 4,366 0.244 0.43023- 3,391 0.026 0.159 4,366 0.095 0.293Number of study credits after four years 3,391 89.1 52.9Rank in entrance exam 3,391 0.757 0.166 4,366 0.309 0.194Rank in initial points 3,391 0.709 0.213 4,366 0.344 0.233ME grade mother tongue 3,391 5.254 0.877 4,362 4.548 1.080ME grade the other national language 3,385 5.088 1.067 4,356 4.168 1.307ME grade foreign language 3,389 5.176 1.040 4,359 4.375 1.287ME grade mathematics 3,387 5.581 0.693 4,290 4.546 1.181ME grade science and humanities 1,109 5.605 0.809 1,763 4.481 1.341Senior secondary school GPA 3,389 8.832 0.616 4,362 8.106 0.693Cohort 1986 3,391 0.337 0.473 4,366 0.285 0.451Cohort 1990 3,391 0.334 0.472 4,366 0.305 0.461Cohort 1995 3,391 0.329 0.470 4,366 0.410 0.492
Social SciencesAdmitted applicants Non-admitted applicants
Variable N Mean Std. Dev. N Mean Std. Dev.Female 881 0.620 0.486 4,671 0.601 0.490Age at entry: 18-20 881 0.413 0.493 4,671 0.468 0.49921-23 881 0.390 0.488 4,671 0.344 0.47523- 881 0.196 0.397 4,671 0.188 0.391Number of study credits after four years 881 101.6 74.8Rank in entrance exam 881 0.871 0.137 4,671 0.456 0.253Rank in initial points 881 0.711 0.260 4,671 0.471 0.279ME grade mother tongue 853 5.298 0.811 4,445 4.823 0.966ME grade the other national language 765 4.918 1.080 4,181 4.246 1.185ME grade foreign language 853 5.014 1.072 4,443 4.304 1.214ME grade mathematics 720 4.601 1.256 3,421 3.986 1.403ME grade science and humanities 809 5.190 1.024 4,265 4.611 1.190Senior secondary school GPA 710 8.537 0.691 3,612 8.118 0.704Cohort 1992 881 0.296 0.457 4,671 0.300 0.458Cohort 1995 881 0.356 0.479 4,671 0.305 0.461Cohort 1997 881 0.347 0.476 4,671 0.395 0.489
Table continues on the next page.

4
Table continues from the previous page.
Sport SciencesAdmitted applicants Non-admitted applicants
Variable N Mean Std. Dev. N Mean Std. Dev.Female 249 0.546 0.499 1,067 0.455 0.498Age at entry: 18-20 249 0.367 0.484 1,067 0.608 0.48821-23 249 0.438 0.497 1,067 0.276 0.44723- 249 0.192 0.394 1,067 0.116 0.321Number of study credits after four years 249 118.5 47.3Rank in entrance exam 249 0.768 0.221 1,067 0.419 0.263Rank in initial points 249 0.607 0.285 1,067 0.480 0.281ME grade mother tongue 239 4.954 0.846 1,007 4.906 0.811ME grade the other national language 235 4.762 1.079 942 4.562 0.969ME grade foreign language 239 4.506 1.045 1,006 4.326 1.066ME grade mathematics 216 4.366 1.254 927 4.297 1.204ME grade science and humanities 230 4.700 1.164 972 4.623 1.078Senior secondary school GPA 219 8.537 0.609 859 8.444 0.535Cohort 1992 249 0.341 0.475 1,067 0.407 0.491Cohort 1995 249 0.309 0.463 1,067 0.303 0.460Cohort 1997 249 0.349 0.477 1,067 0.291 0.454
EducationAdmitted applicants Non-admitted applicants
Variable N Mean Std. Dev. N Mean Std. Dev.Female 137 0.934 0.249 438 0.863 0.344Age at entry: 18-20 137 0.431 0.497 438 0.400 0.49021-23 137 0.394 0.490 438 0.349 0.47723- 137 0.175 0.382 438 0.251 0.434Number of study credits after four years 137 141.6 57.3Rank in entrance exam 137 0.816 0.158 438 0.409 0.250Rank in initial points 137 0.719 0.233 438 0.439 0.273ME grade mother tongue 134 5.142 0.833 423 4.574 0.943ME grade the other national language 125 4.704 0.976 419 3.924 1.138ME grade foreign language 134 4.328 1.024 423 3.652 1.202ME grade mathematics 107 4.243 1.373 296 3.541 1.491ME grade science and humanities 129 5.116 0.898 407 4.199 1.121Senior secondary school GPA 115 8.501 0.566 381 7.947 0.639Cohort 1992 137 0.365 0.483 438 0.477 0.500Cohort 1995 137 0.299 0.460 438 0.281 0.450Cohort 1997 137 0.336 0.474 438 0.242 0.429

5
Table A2. Rank correlations of variables.
Spearman's rank correlation MEmeangrade
MothertongueMEgrade
OthernationallanguageME grade
ForeignlanguageMEgrade
Mathe-maticsMEgrade
SeniorsecondaryschoolGPA
Initialpoints
En-tranceexampoints
Engineering:Initial points 0.43 0.42 0.43 0.38 0.30 0.53Entrance exam points 0.29 0.16 0.15 0.17 0.37 0.24 -0.03Number of study credits after 4 years 0.06 0.01 0.07 -0.01 0.07 0.17 0.03 0.24Social Sciences:Initial points 0.79 0.71 0.70 0.67 0.37 0.75Entrance exam points 0.06 0.05 0.08 -0.02 -0.06 0.03 0.08Number of study credits after 4 years 0.04 -0.03 0.12 -0.05 0.02 0.17 0.05 0.11Sport Sciences:Initial points 0.58 0.36 0.45 0.38 0.36 0.51Entrance exam points -0.09 -0.17 -0.08 -0.14 -0.01 -0.11 -0.09Number of study credits after 4 years 0.09 0.09 0.02 -0.09 0.08 0.22 0.19 0.11Education:Initial points 0.75 0.47 0.67 0.59 0.45 0.86Entrance exam points -0.33 -0.15 -0.21 -0.16 -0.001 -0.31 -0.09Number of study credits after 4 years 0.01 0.15 -0.03 0.02 0.06 0.14 0.14 0.17

6
Figure A1. Distribution of initial points and entrance exam points of admitted studentsby field of study.
0.0
1.0
2.0
3.0
4.0
5D
ensi
ty
0 20 40 60 80Initial points
0.0
1.0
2.0
3.0
4.0
5D
ensi
ty
0 20 40 60 80Entrance exam points
Social Sciences0
.02
.04
.06
Den
sity
0 10 20 30 40Initial points in admission
0.0
2.0
4.0
6D
ensi
ty
0 10 20 30 40Entrance exam points
Engineering

7
0.0
2.0
4.0
6.0
8D
ensi
ty
0 20 40 60Initial points
0.0
1.0
2.0
3.0
4.0
5D
ensi
ty
0 20 40 60Entrance exam points
Education
0.0
2.0
4.0
6.0
8D
ensi
ty
0 20 40 60 80 100Initial points
0.0
1.0
2.0
3.0
4.0
5D
ensi
ty
0 20 40 60 80 100Entrance exam points
Sport Sciences


