306
1 DocAve 6: Report Center User Guide DocAve® 6 Report Center Service Pack 8 Issued November 2016
1
DocAve 6: Report Center
User Guide
DocAve® 6 Report Center
Service Pack 8
Issued November 2016
2
DocAve 6: Report Center
Table of Contents What’s New in this Guide ........................................................................................................................... 10
About Report Center ................................................................................................................................... 11
Available Reports in Report Center ............................................................................................................ 12
Complementary Products ........................................................................................................................... 17
Submitting Documentation Feedback to AvePoint .................................................................................... 18
Before You Begin ......................................................................................................................................... 19
AvePoint’s Testing Policy and Environment Support .............................................................................. 19
Supported Software Environments..................................................................................................... 19
Supported Hardware ........................................................................................................................... 19
Supported Backup and Recovery ........................................................................................................ 19
Configuration .......................................................................................................................................... 20
Agents ..................................................................................................................................................... 20
Required Permissions ............................................................................................................................. 21
Local System Permissions ................................................................................................................... 23
Getting Started ............................................................................................................................................ 24
Launching Report Center ........................................................................................................................ 24
Navigating DocAve .................................................................................................................................. 25
Data Retrieval Information ......................................................................................................................... 26
Configuring Report Center Settings ............................................................................................................ 31
Data Collection ........................................................................................................................................ 31
Activity History Pruning .......................................................................................................................... 34
Creating a Pruning Profile ................................................................................................................... 35
Using Profile Manager......................................................................................................................... 36
IIS Logging ............................................................................................................................................... 38
Reporting Service .................................................................................................................................... 39
Cross-Farm Service Configuration ........................................................................................................... 40
Audit Controller ...................................................................................................................................... 41
Building Plans ...................................................................................................................................... 41
Using Plan Manager ............................................................................................................................ 50
Audit Pruning .......................................................................................................................................... 51
3
DocAve 6: Report Center
Creating a Pruning Profile ................................................................................................................... 52
Using Profile Manager......................................................................................................................... 53
Manage Feature ...................................................................................................................................... 55
Managing the Document Auditing Feature ........................................................................................ 55
Managing the Usage Activity Web Parts Feature ............................................................................... 56
Export Location ....................................................................................................................................... 57
Creating an Export Location ................................................................................................................ 57
Managing Export Locations ................................................................................................................. 59
Shared Location ...................................................................................................................................... 60
Scope Filter ............................................................................................................................................. 60
Managing Scope Filters ....................................................................................................................... 61
Configuring a Scope Filter ................................................................................................................... 61
Item Caching Service ............................................................................................................................... 62
Configuring an Item Caching Database ............................................................................................... 62
Using the Item Caching Service Scope Settings interface ................................................................... 63
Usage Activity Web Parts Settings .......................................................................................................... 65
Working with Reports ................................................................................................................................. 67
Run Report .............................................................................................................................................. 67
Show Report ............................................................................................................................................ 67
Export Report .......................................................................................................................................... 67
Exporting to a Datasheet .................................................................................................................... 68
Exporting as a Screenshot ................................................................................................................... 69
Auditor Database ................................................................................................................................ 69
Usage Reports ............................................................................................................................................. 70
Usage Reports Interface.......................................................................................................................... 70
Creating a Usage Reports Plan ................................................................................................................ 71
Searching Nodes Using the Advanced Search Feature ....................................................................... 75
Configuring Specific Export Report Settings ....................................................................................... 76
Configuring Usage Alert E-mails .......................................................................................................... 76
Using the Usage Reports Interface ......................................................................................................... 79
Managing Usage Report Plans ............................................................................................................ 79
Generating Reports in the Usage Reports Interface ........................................................................... 80
4
DocAve 6: Report Center
Using the Show Report Interface ............................................................................................................ 80
Viewing Usage Reports ....................................................................................................................... 81
Creating Infrastructure Reports .................................................................................................................. 89
Infrastructure Reports Interface ............................................................................................................. 89
SharePoint Services ................................................................................................................................. 90
Generating SharePoint Services Reports ............................................................................................ 90
Viewing SharePoint Services Reports ................................................................................................. 90
CPU/Memory Usage ............................................................................................................................... 90
Generating CPU/Memory Usage Reports ........................................................................................... 90
Viewing CPU/Memory Usage Reports ................................................................................................ 91
Networking.............................................................................................................................................. 91
Generating Networking Reports ......................................................................................................... 92
Viewing Networking Reports .............................................................................................................. 92
SharePoint Topology ............................................................................................................................... 93
Generating SharePoint Topology Reports .......................................................................................... 93
Viewing SharePoint Topology Reports ................................................................................................ 93
SharePoint Search Services ..................................................................................................................... 93
Generating SharePoint Search Services Reports ................................................................................ 93
Viewing SharePoint Search Services Reports ...................................................................................... 94
Environment Search ................................................................................................................................ 94
Generating Environment Search Reports ........................................................................................... 94
Site Collection Comparison ..................................................................................................................... 95
Generating Site Collection Comparison .............................................................................................. 95
Viewing Site Collection Comparison ................................................................................................... 96
Site Collection Load Time ........................................................................................................................ 96
Generating Site Collection Load Time Reports ................................................................................... 96
Viewing Site Collection Load Time Reports ........................................................................................ 97
Storage Optimization .............................................................................................................................. 97
Storage Trends .................................................................................................................................... 97
Storage Analyzer ............................................................................................................................... 101
User Storage Size .............................................................................................................................. 104
Creating Administration Reports .............................................................................................................. 107
5
DocAve 6: Report Center
Administration Reports Interface ......................................................................................................... 107
Configuration Reports ........................................................................................................................... 107
Generating Configuration Reports .................................................................................................... 108
Best Practice Reports ............................................................................................................................ 110
About Threshold Profile .................................................................................................................... 110
Configuring Threshold Profile ........................................................................................................... 111
Generating Best Practice Reports ..................................................................................................... 112
Viewing Best Practice Reports .......................................................................................................... 115
Creating Compliance Reports ................................................................................................................... 116
Compliance Reports Interface .............................................................................................................. 116
Term Store Changes .............................................................................................................................. 117
Generating Term Store Changes Reports ......................................................................................... 117
Viewing Term Store Changes Reports ............................................................................................... 119
Content Type Usage Reports ................................................................................................................ 119
Generating the Content Type Usage Reports ................................................................................... 119
Viewing Content Type Usage Reports ............................................................................................... 121
Information Management Policies ....................................................................................................... 122
Generating Information Management Policies Reports ................................................................... 122
Viewing Information Management Policies Reports ........................................................................ 124
Upcoming Content Expiration ............................................................................................................... 124
Generating Upcoming Content Expiration Reports .......................................................................... 124
Viewing Upcoming Content Expiration Reports ............................................................................... 126
Auditor Reports ..................................................................................................................................... 126
Generating User Lifecycle Reports .................................................................................................... 127
Generating List Access Reports ......................................................................................................... 130
Generating Item Lifecycle Reports .................................................................................................... 133
Generating Site Access Reports ........................................................................................................ 136
Generating List Deletion Reports ...................................................................................................... 139
Generating Permission Changes Reports .......................................................................................... 142
Generating Content Type Changes Reports ...................................................................................... 146
Generating Custom Report ............................................................................................................... 148
Viewing Auditor Reports ................................................................................................................... 151
6
DocAve 6: Report Center
Creating DocAve Reports .......................................................................................................................... 153
DocAve Reports Interface ..................................................................................................................... 153
DocAve Topology .................................................................................................................................. 153
Performance Monitoring ...................................................................................................................... 154
Generating Performance Monitoring Reports .................................................................................. 154
Viewing Performance Monitoring Reports ....................................................................................... 155
Disk Space Monitoring .......................................................................................................................... 155
Generating Disk Space Monitoring Reports ...................................................................................... 155
Viewing Disk Space Monitoring Reports ........................................................................................... 156
Job Performance Monitoring ................................................................................................................ 157
Viewing the Job Performance Monitoring Report ............................................................................ 157
DocAve Auditor ..................................................................................................................................... 157
Viewing the DocAve Auditor Report ................................................................................................. 158
Monitoring User Activities in SharePoint via Usage Pattern Alerting ....................................................... 159
Types of Usage Pattern Alerting Rules .............................................................................................. 159
Configuring Rule Profiles ....................................................................................................................... 159
Creating a Rule Profile....................................................................................................................... 160
Managing Rule Profiles ..................................................................................................................... 161
Configuring Custom Action Profiles ...................................................................................................... 162
Creating a Custom Action Profile ...................................................................................................... 162
Managing Custom Action Profiles ..................................................................................................... 167
Configuring Usage Pattern Alerting Plans ............................................................................................. 167
Creating a Usage Pattern Alerting Plan ............................................................................................. 167
Managing Usage Pattern Alerting Plans ........................................................................................... 169
Viewing Usage Pattern Alerting Reports............................................................................................... 170
Setting Filter for Usage Pattern Alerting Report ............................................................................... 172
DocAve Report Center Features in SharePoint ......................................................................................... 173
Document Auditing Feature.................................................................................................................. 173
Deploying Document Auditing Solution ............................................................................................ 173
Activating Document Auditing Feature............................................................................................. 174
Document Auditing Settings ............................................................................................................. 174
Viewing Audit History ....................................................................................................................... 175
7
DocAve 6: Report Center
Usage Activity Web Parts Feature ........................................................................................................ 175
Deploying Usage Activity Solution .................................................................................................... 175
Activating the Usage Activity Web Parts Feature ............................................................................. 176
Adding a New Usage Activity Web Part ............................................................................................ 177
Editing Web Part Properties ............................................................................................................. 177
Data Collection for Usage Activity Web Parts ................................................................................... 183
Supported Browser Versions for Usage Activity Web Parts ............................................................. 184
Most Active Contributors Web Part .................................................................................................. 184
Most Popular Contributors ............................................................................................................... 185
Top Documents ................................................................................................................................. 185
Top Blog Posts ................................................................................................................................... 186
Top Discussions ................................................................................................................................. 187
Top Wiki Pages .................................................................................................................................. 187
Report Center Dashboard Web Part ................................................................................................. 188
Supported and Unsupported Data Filters for Usage Activity Web Parts .......................................... 201
Appendix A: Supported Object Levels of DocAve Report Center Reports ................................................ 203
Appendix B: DocAve Module Actions Audited by DocAve Auditor .......................................................... 246
Appendix C: Advanced Configurations ...................................................................................................... 258
Customizing the Report Template ........................................................................................................ 258
Visualize the XLSX Report Data Using SharePoint Chart Web Part ....................................................... 258
Configuring the ReportCenterServiceCustomProperties.config File .................................................... 259
Configuring the ReportCenterServiceProperties.config File ................................................................. 261
Appendix D: Required W3C Logging Fields for Specific Functions............................................................ 263
Appendix E: Examples of Scope Filters ..................................................................................................... 264
Site Collection Level .............................................................................................................................. 264
Site Level ............................................................................................................................................... 271
List/Library Level ................................................................................................................................... 278
Appendix F: Supported SharePoint Audit Events and Object Levels of Usage Pattern Alerting Rules ..... 283
Appendix G: Supported and Unsupported List of DocAve Report Center Functions for SharePoint Online
.................................................................................................................................................................. 285
Summary ............................................................................................................................................... 285
Configuration Reports ........................................................................................................................... 286
8
DocAve 6: Report Center
Auditor Reports ..................................................................................................................................... 289
Auditor Controller ................................................................................................................................. 289
Audit Pruning ........................................................................................................................................ 291
Storage Trends ...................................................................................................................................... 291
Appendix H: Accessing Hot Key Mode ...................................................................................................... 292
Common Access .................................................................................................................................... 292
Usage Reports Interface........................................................................................................................ 293
Infrastructure Reports Interface ........................................................................................................... 294
Administration Reports Interface ......................................................................................................... 294
Compliance Reports Interface .............................................................................................................. 295
Term Store Changes .......................................................................................................................... 296
Content Type Usage .......................................................................................................................... 296
Information Management Policies ................................................................................................... 296
Upcoming Content Expiration ........................................................................................................... 296
Auditor Reports ................................................................................................................................. 297
DocAve Reports Interface ..................................................................................................................... 298
Usage Pattern Alerting Interface .......................................................................................................... 298
Plan Manger ...................................................................................................................................... 299
Usage Pattern Alerting Report .......................................................................................................... 299
Rule Profile ........................................................................................................................................ 300
Custom Action Profile ....................................................................................................................... 300
Settings Interface .................................................................................................................................. 300
Data Collection .................................................................................................................................. 301
Active History Pruning....................................................................................................................... 301
IIS Logging ......................................................................................................................................... 302
Reporting Service .............................................................................................................................. 302
Cross-Farm Service Configuration ..................................................................................................... 302
Auditor Controller ............................................................................................................................. 302
Audit Pruning .................................................................................................................................... 303
Manage Feature ................................................................................................................................ 304
Export Location ................................................................................................................................. 304
Shared Location ................................................................................................................................ 304
9
DocAve 6: Report Center
Scope Filter........................................................................................................................................ 305
Item Caching Service ......................................................................................................................... 305
Usage Activity Web Parts Settings .................................................................................................... 305
Notices and Copyright Information .......................................................................................................... 306
10
DocAve 6: Report Center
What’s New in this Guide
Updated the Required Permissions, and added a separate classification of the SQL Server permissions for SharePoint 2013.
Updated the Local System Permissions to include the path information of the redirection.config and IIS applicationHost.config files.
Added the Data Retrieval Information of SharePoint Online Audit Log Collector.
Updated the configurations of Data Collection.
Updated Activity History Pruning to include the information of removing job data of SharePoint Online Audit Log Report from the Report database.
Updated Audit Controller to include the information of collecting auditing data for SharePoint Online objects.
Added instructions for exporting PivotChart of the Usage Reports, Storage Trends, and Report Center Dashboard Web Part.
Added the instructions for the download information of File Download Ranking, User Download Ranking, and Details in Viewing Download Ranking Reports.
Added the Duration option in the Time Rule configurations for Generating Storage Analyzer Reports.
Updated the threshold profile settings for SharePoint 2016 in Best Practice Reports.
Updated the Required SharePoint Permissions for Object Selection for Editing Report Center Dashboard Properties.
Added a Report Center Dashboard Web part of Browser Usage.
Added a Report Center Dashboard Web part of Referrers.
11
DocAve 6: Report Center
About Report Center
Gain a comprehensive understanding of your SharePoint platform's usage, topology, performance, and
storage trends while generating customizable SharePoint usage reports and alerts with DocAve Report
Center. Delivering all the tools of DocAve SharePoint Monitor, plus many additional enterprise-class
reporting solutions, DocAve Report Center enables administrators to configure customizable alerts to be
notified immediately of network, storage, or usage issues that could result in a negative end-user
experience, allowing for more proactive and intelligent management decisions.
Piloted via a single, easy-to-use interface, and delivering a customizable dashboard fully integrated into
the SharePoint interface, DocAve Report Center is the only tool administrators need to obtain the
knowledge vital for delivering optimal platform performance and successful strategic planning.
By having all of your reporting tools in a centralized location, you can quickly and easily access all of the
information you need. To access a report category, click its corresponding tab.
Each report category contains a ribbon of tools for creating different types of reports within that
category, along with an Actions toolbar for executing and managing reports. Below the ribbon, you will
find the configuration areas for each report type as well as the report display pane. Due to each report
category requiring different configurations, the interface for each report category is unique. You will be
introduced to each category’s interface at the beginning of each respective section in this guide.
Report Center also has the DocAve Job Monitor integrated within each module’s interface so you can
more easily keep track of running reports and scheduled reports. To access the jobs of each module,
click Job Monitor on the ribbon. For more information about using Job Monitor, refer to the DocAve 6
Job Monitor User Guide.
12
DocAve 6: Report Center
Available Reports in Report Center
DocAve Report Center provides you with a comprehensive and customizable reporting toolset. The
reports are broken down into seven categories, each with its own interface containing various report
types.
For details on the supported object levels of each report mentioned above, refer to Appendix A:
Supported Object Levels of DocAve Report Center Reports.
Usage Reports – Analyze SharePoint usage and behavior using data collected from SharePoint Audit logs
and IIS logs. This category offers the following report types:
Search Usage – Displays usage data for search terms and scopes within the selected SharePoint farm or site collections.
Site Visitors and Activity – Displays count of events (updates, deletions, and views) and unique visitors for the selected site collections, sites, lists, or items. Uses SharePoint Auditor.
Checked-Out Documents – Displays information about checked-out documents within the selected Web applications, site collections, sites, or lists.
Page Traffic – Displays the number of hits and amount of throughput the sites collections or sites have received.
Referrers – Displays the top pages and hosts that have referred traffic to the selected site collections or sites.
Last Accessed Time – Displays when the selected site collections or sites were last accessed, and by whom. Uses SharePoint Auditor.
Failed Login Attempts – Displays information about failed login attempts for the selected farm or sites.
Workflow Status – Displays information about workflow definitions and instances within the selected site collections, sites, or lists.
SharePoint Alerts – Displays information about SharePoint alerts configured by end users within the selected farm, Web applications, site collections, sites, or lists.
Download Ranking – Displays the number of times that documents have been downloaded within the selected sites.
Site Activity Ranking – Displays the most and least active sites, pages, lists, items, and users per site collection or site, as determined by hits. Uses SharePoint Auditor.
Active Users – Displays the number of non-system activities for all users within the selected Web applications, site collections, sites, or lists. Uses SharePoint Auditor.
*Note: In a SharePoint Foundation 2010 environment, the Search Usage report and Referrers report are
not available. In a SharePoint 2013 and 2016 environments, the Referrers report are not available.
13
DocAve 6: Report Center
Infrastructure Reports – Monitor SharePoint storage, performance and capacity for planning and
alerting. This category provides the following report types:
SharePoint Services – Displays the servers and their respective roles within the selected SharePoint farms, as well as the status of the services on each server.
CPU/Memory Usage – Monitors the CPU and memory usage, as well as other performance metrics, of the selected SharePoint Agent hosts.
Networking – Monitors the network status and usage (both wired and wireless) of the selected SharePoint Agent hosts and adapters.
SharePoint Topology – Displays the logical and physical topology of the selected SharePoint farms.
SharePoint Search Services – Monitors the crawling status and settings of SharePoint Search service applications in the selected farms.
Environment Search – Displays information about SharePoint servers, including which ones have DocAve installed, in the selected environment.
Site Collection Comparison – Displays various site collection statistics in respect to basic information, settings, and security, and highlights the differences.
Site Collection Load Time – Displays the latency of the selected site collections.
Storage Trends – Displays current and projected storage consumption by the selected SharePoint on-premises farm, Web applications, content databases, or site collections, or SharePoint Online site collections. Drill-down allocation analysis is available at the site collection level.
Storage Analyzer – Displays the size and proportion of data stored in SharePoint and external devices for the selected farm, Web applications, site collections, or content databases.
User Storage Size – Displays the number of items and storage size of content created by each user within the selected site collections or sites. Also ranks the top contributors in each library, list, discussion board, survey, or issue.
Administration Reports – Oversee SharePoint settings and securities for governance purposes. This
category provides the following report types:
Configuration Reports – Displays configuration details and statistics for the selected SharePoint on-premises farms, Web applications, site collections, content databases, sites, and/or lists, or SharePoint Online site collections, sites, and/or lists.
Best Practice Reports – Analyzes the health of the selected farms, Web applications, site collections, content databases, sites, or lists by comparing environment data against Microsoft issued boundaries and limitations or custom thresholds.
*Note: The Configuration Report and Best Practice Report can collect most of the data in a SharePoint
Foundation 2010/2013/2016 environment, but some services and functions cannot be collected, as
defined here:
14
DocAve 6: Report Center
The Configuration Report does not collect the following data:
o Data of Shared Service and Current License at the farm level
o Data of Web Application Feature at the Web application level
o Data of Site Collection Usage at the site collection level
o Data of Site Usage at the site level
The Best Practice Report does not collect the following data:
o Data of User Profile Service and Managed Metadata Term Store (database) at farm level.
o Data of Solution Cache Size at Web application level.
Compliance Reports – Respond to queries for “who did what where” for behavior, productivity and
litigation analysis. This category provides the following report types:
Term Store Changes – Displays detailed information for all managed metadata changes within the global and local term groups of the selected farm.
Content Type Usage – Displays content type usage details within the selected site collections or sites.
Information Management Policies – Displays details about the configured information management policies for the content types within the selected Web applications, site collections, sites, or lists.
Upcoming Content Expiration – Displays details about items that have the configured information management policies and expiration dates within the selected Web applications, site collections, sites, or lists.
User Lifecycle – Displays a log of activity of users within the selected SharePoint on-premises Web applications, site collections, sites, or lists, or SharePoint Online site collections, sites, or lists.
List Access – Displays a log of user activity within the selected SharePoint on-premises Web applications, site collections, sites or lists, or SharePoint Online site collections, sites, or lists.
Item Lifecycle – Displays a log of audit events for items within the selected SharePoint on-premises Web applications, site collections, sites, or lists, or SharePoint Online site collections, sites, or lists.
Site Access – Displays a log of user activity within the selected SharePoint on-premises Web applications, site collections, sites, or lists, or SharePoint Online site collections, sites, or lists.
List Deletion – Displays a log of deletion events for items within the selected SharePoint on-premises Web applications, site collections, sites or lists, or SharePoint Online site collections, sites, or lists.
15
DocAve 6: Report Center
Permission Changes – Displays a log of permission changes within the selected SharePoint on-premises Web applications, site collections, sites, or lists, or SharePoint Online site collections, sites, or lists.
Content Type Changes – Displays a log of changes made to content types within the selected SharePoint on-premises Web applications, site collections, sites, or lists, or SharePoint Online site collections, sites, or lists.
Custom Report – Displays a customized log from the collected audit records for the selected SharePoint on-premises Web applications, site collections, sites, or lists, or SharePoint Online site collections, sites, or lists.
DocAve Reports – Track the DocAve system capacity, performance, and usage. This category provides
the following report types:
DocAve Topology – Displays the service topology of the DocAve Manager, as well as the statuses of the services on each server.
Performance Monitoring – Monitors the CPU and memory usage, as well as other performance metrics, of the selected DocAve Manager hosts.
Disk Space Monitoring – Displays current and projected storage consumption by the selected DocAve logical devices.
Job Performance Monitoring – Displays job performance data for Granular Backup, Granular Restore, Platform Backup, and Platform Restore jobs.
DocAve Auditor – Displays a log of user activity within the DocAve system.
Usage Pattern Alerting – Monitor user activities based on predefined thresholds within your SharePoint
environment.
o Activity Report – Displays a report of the user activities identified by the rules in the Usage Pattern Alerting plans.
o Analysis Report – Displays an analysis report on how many times the Usage Pattern Alerting rules were triggered and the distribution of the triggered times of each rule based on the corresponding data metric used in the rule threshold.
Usage Activity Web Parts – Allow for the creation of social Web parts in SharePoint that rank popular
documents, discussions, blog posts, wiki pages, and content contributors, as well as a dashboard Web
part that contains the multiple reports for analyzing SharePoint usage and behavior across a
configurable scope. This category provides the following Web parts and report types:
Most Active Contributors Web part – Displays the users who have contributes the most documents, blog posts, and discussions.
Most Popular Contributors Web part – Displays the users who have received community feedback for their documents, blog posts, and discussions.
Top Documents Web part – Displays the documents that have received the most views, followers, and likes.
16
DocAve 6: Report Center
Top Blog Posts Web part – Displays the blog posts that have received the most views, likes, and comments.
Top Discussions Web part – Displays the discussions that have received the most views, replies, and likes.
Top Wiki Pages Web part – Displays the wiki pages that have been viewed the most.
Report Center Dashboard Web part – Contains the following reports for analyzing SharePoint usage and behavior across a configurable scope:
o Summary – Displays a summary on the usage of the SharePoint site collections or sites.
o Active Users – Displays rankings of users by the number of activities within each of the selected site collections and sites.
o Checked-Out Documents – Displays the information of checked-out documents within the selected site collections or sites.
o Activity Ranking – Displays rankings of sites, pages, lists, and documents by activity within each selected site collection or site.
o Last Accessed Time – Displays when the selected site collections or sites were last accessed, and by whom.
o Site Traffic – displays charts of the numbers of activities and throughput that the selected site collections or sites have received.
o Search Usage – Displays the usage data for search activities, search terms and search scopes within the selected site collections.
o Site Visitors – Displays the numbers of unique visitors and user activities of the selected site collections/sites.
o Top Document by Social Activities – Displays rankings of documents which have been viewed the most and/or have the most followers and/or likes within each selected site collection or site.
o Content Type Usage – Displays the latest content type usage details within the selected site collections or sites.
o Storage Trends – Displays the information of current storage consumption of the selected SharePoint on-premises farm, Web applications, content databases, or site collections.
o Storage Analyzer– Displays the rankings of the size and proportion of data stored in SharePoint and external devices for the selected farm, Web applications, site collections, or content databases.
o User Storage Size– Displays rankings of the storage size of content created by each user within the selected site collections or sites.
17
DocAve 6: Report Center
Complementary Products
Many products and product suites on the DocAve 6 platform work in conjunction with one another. The
following products are recommended for use with Report Center:
DocAve Archiver for moving unused data to lower tiered storage which reduces storage cost.
DocAve Connector for collaborating upon network file shares and cloud storage resources directly through SharePoint without migration. Connected content appears as normal SharePoint content and can be leveraged exactly as if it were residing within a SharePoint document library.
DocAve Storage Manager for offloading BLOBs from SQL servers to more cost efficient storage devices.
DocAve Content Manager for SharePoint for restructuring or moving SharePoint content.
DocAve Replicator to perform live or event-driven and scheduled or offline replication. Synchronization and management of all content, configurations, and securities is performed with full fidelity.
DocAve Data Protection for setting backup and recovery points prior to adjusting SharePoint governance policies in this product.
DocAve Platform Backup and Restore to back up the entire SharePoint environment, including farm-level components.
DocAve Platform Backup and Restore for NetApp Systems to back up and restore the entire SharePoint environment. It backs up all content, customizations, solutions, and features, as well as back-end SQL databases, all configurations, index/job servers, front-end IIS settings, file system resources, and custom application databases. It allows for restore of an entire platform or individual SharePoint environment components.
DocAve Granular Backup and Restore to back up all farm content and restore content down to the item level.
18
DocAve 6: Report Center
Submitting Documentation Feedback to AvePoint
AvePoint encourages customers to provide feedback regarding our product documentation. You can
Submit Your Feedback on our website.
19
DocAve 6: Report Center
Before You Begin
Refer to the sections below for the system requirements for Report Center.
AvePoint’s Testing Policy and Environment Support
Supported Software Environments
AvePoint is committed to testing against all major versions and service packs of SharePoint as well as the latest versions of Windows Server and SQL Server, as Microsoft announces support and compatibility.
*Note: AvePoint does not recommend or support installing DocAve on client operating systems.
Supported Hardware
AvePoint is committed to maintaining a hardware agnostic platform to ensure that DocAve operates on common Windows file sharing and virtualization platforms. To ensure that DocAve is hardware agnostic, AvePoint tests hardware that is intended to support SharePoint and DocAve infrastructure, storage targets, and hardware-based backup and recovery solutions, as supported by AvePoint’s partnerships. AvePoint directly integrates with the following platforms: any Net Share, FTP, Amazon S3, AT&T Synaptic, Box, Caringo Storage, Cleversafe, DELL DX Storage, Dropbox, EMC Atmos, EMC Centera, Google Drive, HDS Hitachi Content Platform, IBM Spectrum Scale Object, IBM Storwize Family, Microsoft Azure Storage, NetApp Data ONTAP, NFS, OneDrive, Rackspace Cloud Files, and TSM.
All other hardware platforms that support UNC addressable storage devices are supported.
*Note: AvePoint has ended the test and development for Caringo Storage and DELL DX Storage in DocAve since DocAve 6 SP7 CU1, as the providers of these two platforms have stopped the platform maintenance.
*Note: Due to changes in the IBM Tivoli Storage Manager API, DocAve 6 Service Pack 6 and later versions require that TSM Client version 7.1.2 is installed on the Control Service and Media Service servers.
*Note: Most of the hardware partnerships referenced in this guide are intended to make use of advanced functionality (such as snapshot mirroring, BLOB snapshots, indexing, long-term storage, WORM storage, etc.), and are not indications that any changes to the product are required for basic support. In most cases, hardware can be supported with no change to the product.
Supported Backup and Recovery
DocAve supports BLOB backup storage according to the list of hardware platforms above. BLOB snapshot function, however, is currently only supported on OEM versions and NetApp hardware.
DocAve supports SQL content and Application database backups via the SharePoint Volume Shadow Copy Service (VSS) on all Windows and SQL server platforms listed above. DocAve also supports snapshot-based SharePoint VSS on all hardware listed above where the hardware partner has certified support with Microsoft.
20
DocAve 6: Report Center
DocAve supports application and configuration server backups for all the supported software environments listed above. DocAve 6 SP5 or later supports VM backup via Hyper-V/VMWare for the following operating systems: Windows Server 2008 R2, Windows Server 2012, Windows Server 2012 R2, and Microsoft Hyper–V Server 2012 R2.
Configuration
In order to use Report Center, the DocAve 6 platform must be installed and configured properly on your
farm. Report Center will not function without DocAve 6 present on the farm.
Agents
SharePoint Agents are responsible for running DocAve jobs and interacting with the SharePoint object
model. DocAve Agents enable DocAve Manager to communicate with the respective servers, allowing
for Report Center commands to function properly.
*Note: The use of system resources on a server increases when the installed Agent is performing
actions. This may affect server performance. However, if the Agent installed on the server is not being
used, the use of system resources is very low, and therefore, the effect on server performance is
negligible.
For instructions on installing the DocAve Platform, DocAve Manager, and DocAve Agents, refer to the
DocAve 6 Installation Guide.
21
DocAve 6: Report Center
Required Permissions
To install and use Report Center properly, ensure that the Agent account has the following permissions.
1. Local System Permissions: These permissions are automatically configured by DocAve during installation. Refer to Local System Permissions for a list of the permissions automatically configured upon installation. If there are no strict limitations within your organization on the permissions that can be applied, you can simply add the DocAve Agent Account to the local Administrators group to apply all of the required permissions.
2. SharePoint Permissions: User is a member of the Farm Administrators group. Since Administrator works across farms and on all SharePoint settings and configurations, this account is needed in order to provide the best and most complete quality of service.
Full Control to all zones of all Web applications via the User Policy for Web Applications
User Profile Service Application permissions:
o Full Control in Connection Permissions
o User Profile Service Application Administrator
o Use Personal Features (For SharePoint 2010 only)
o Create Personal Site
o Use Social Features (For SharePoint 2010 only)
o Follow People and Edit Profile (For SharePoint 2013 and SharePoint 2016)
o Use Tags and Notes (For SharePoint 2013 and SharePoint 2016)
Managed Metadata Service: Term Store Administrator
Search Service: Full Control
3. SQL Server Permissions
For SharePoint 2010 and SharePoint 2016
o Database Role of db_owner for all the databases related with SharePoint, including Content databases, Config database, and Central Admin database.
o Db_owner of Content database and Stub database.
*Note: To use the Search Usage report and Referrers report for SharePoint
2010, the users must have the db_owner role for the SharePoint 2010 Web
Analytics Service Databases.
To use the Search Usage report for SharePoint 2016, the users must have the
db_owner role for the SharePoint 2016 Search Service Application Analytics
Reporting databases and Search Service Application Administration databases.
To use the SharePoint Search Services report, the users must have the
db_owner role for the SharePoint 2010 or 2016 WSS_Logging database.
22
DocAve 6: Report Center
To use the Configuration Reports, the users must have the db_owner role for
the User Profile Service Application databases.
To use the Best Practice Reports, the users must have the db_owner role for the
Metadata Service Application databases.
For SharePoint 2013
o Database Role of SharePoint_Shell_Access for all the databases related with SharePoint, including Content databases, Config database, and Central Admin database.
o SharePoint_Shell_Access of Stub database.
*Note: The SharePoint_Shell_Access role can only be assigned via Windows
PowerShell. For instructions on how to assign this role to a user, refer to the
following Microsoft technical article: https://technet.microsoft.com/en-
us/library/ff607596.aspx.
To use the Search Usage report, the users must have the
SharePoint_Shell_Access role for the SharePoint 2013 Search Service
Application Analytics Reporting databases and Search Service Application
Administration databases.
To use the SharePoint Search Services report, the users must have the
SharePoint_Shell_Access role for the SharePoint 2013 WSS_Logging database.
To use the Configuration Reports, the users must have the
SharePoint_Shell_Access role for the SharePoint 2013 User Profile Service
Application databases.
To use the Best Practice Reports, the users must have the
SharePoint_Shell_Access role for the SharePoint 2013 Metadata Service
Application databases.
4. Registered SharePoint Sites Permission:
The site collection user used to register the site collection must be a member of Site Collection Administrators.
*Note: If you want to use Configuration Reports or Storage Trends report to report on
the site collection quota, the site collection user must be a member of SharePoint
Administrators group.
The following permissions are required, if using Scan Mode to add the registered site collections:
o To scan the SharePoint Online site collections or OneDrive for Business libraries, the user must be a member of:
23
DocAve 6: Report Center
SharePoint Administrators
Local Administrators
o To scan the SharePoint on-premises site collections, the user must have:
Full Control to all zones of all Web applications via the User Policy for Web Applications
Database Role of db_owner for all the databases related with SharePoint, including Content databases, Config database, and Central Admin database.
Local System Permissions
Some local system permissions are automatically configured during DocAve 6 installation. The user will
be set up as a member of the following local groups:
IIS WPG (for IIS 6.0) or IIS IUSRS (for IIS 7.0, IIS 8.0, and IIS 8.5)
Performance Monitor Users
DocAve Users (the group is created by DocAve automatically; it has the following permissions):
o Full Control to the Registry of HKEY_LOCAL_MACHINE\SOFTWARE\AvePoint\DocAve6
o Full Control to the Registry of HKEY_LOCAL_MACHINE\System\CurrentControlSet\Services\eventlog
o Full Control to the Communication Certificate
o Permission of Log on as a batch job (it can be found within Control Panel > Administrative Tools > Local Security Policy > Security Settings > Local Policies > User Rights Assignment)
o Full Control permission for DocAve Agent installation directory
*Note: If you want to use CPU/Memory Usage or Networking reports, you must be the member of local
Administrators group. If you want to use Download Ranking, Failed Login Attempts, IIS Logging, Best
Practice Reports, or select the Retrieve IIS Logs option to retrieve data, you must have Full Control to
the path of IIS log files, the paths (C:\Windows\System32\inetsrv\config) of the redirection.config and
IIS applicationHost.config files.
24
DocAve 6: Report Center
Getting Started
Refer to the sections below for important information on getting started with Report Center.
Launching Report Center
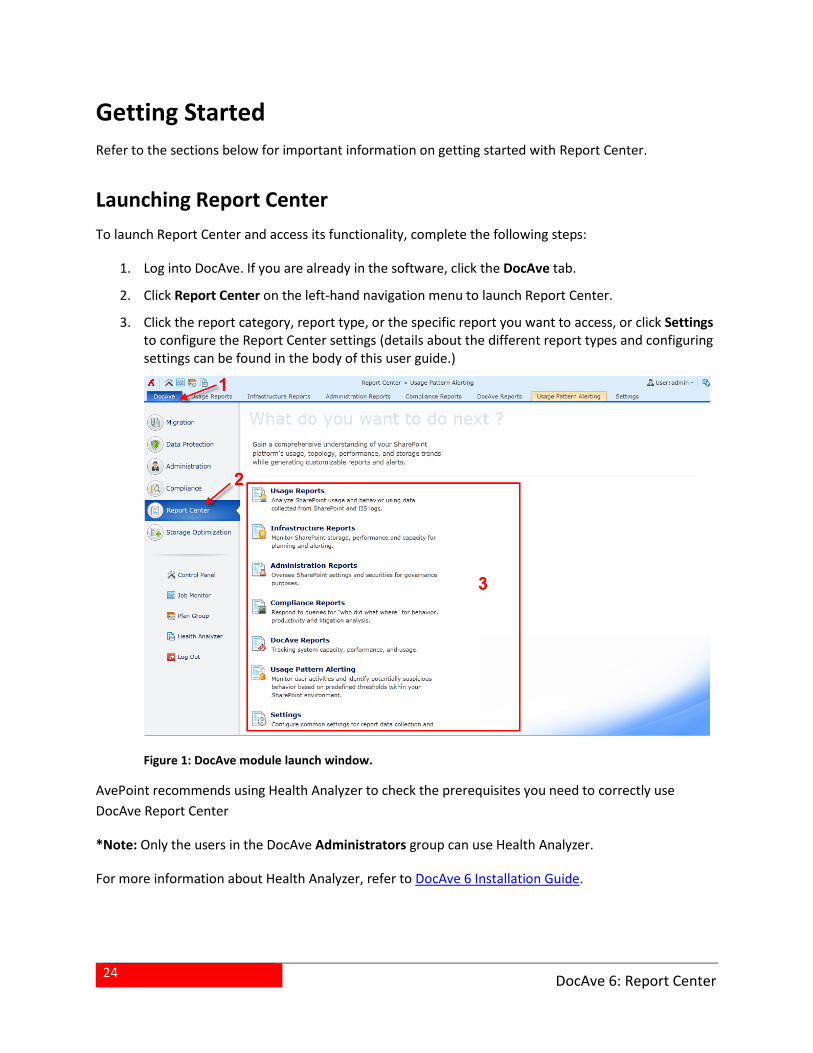
To launch Report Center and access its functionality, complete the following steps:
1. Log into DocAve. If you are already in the software, click the DocAve tab.
2. Click Report Center on the left-hand navigation menu to launch Report Center.
3. Click the report category, report type, or the specific report you want to access, or click Settings to configure the Report Center settings (details about the different report types and configuring settings can be found in the body of this user guide.)
Figure 1: DocAve module launch window.
AvePoint recommends using Health Analyzer to check the prerequisites you need to correctly use
DocAve Report Center
*Note: Only the users in the DocAve Administrators group can use Health Analyzer.
For more information about Health Analyzer, refer to DocAve 6 Installation Guide.
25
DocAve 6: Report Center
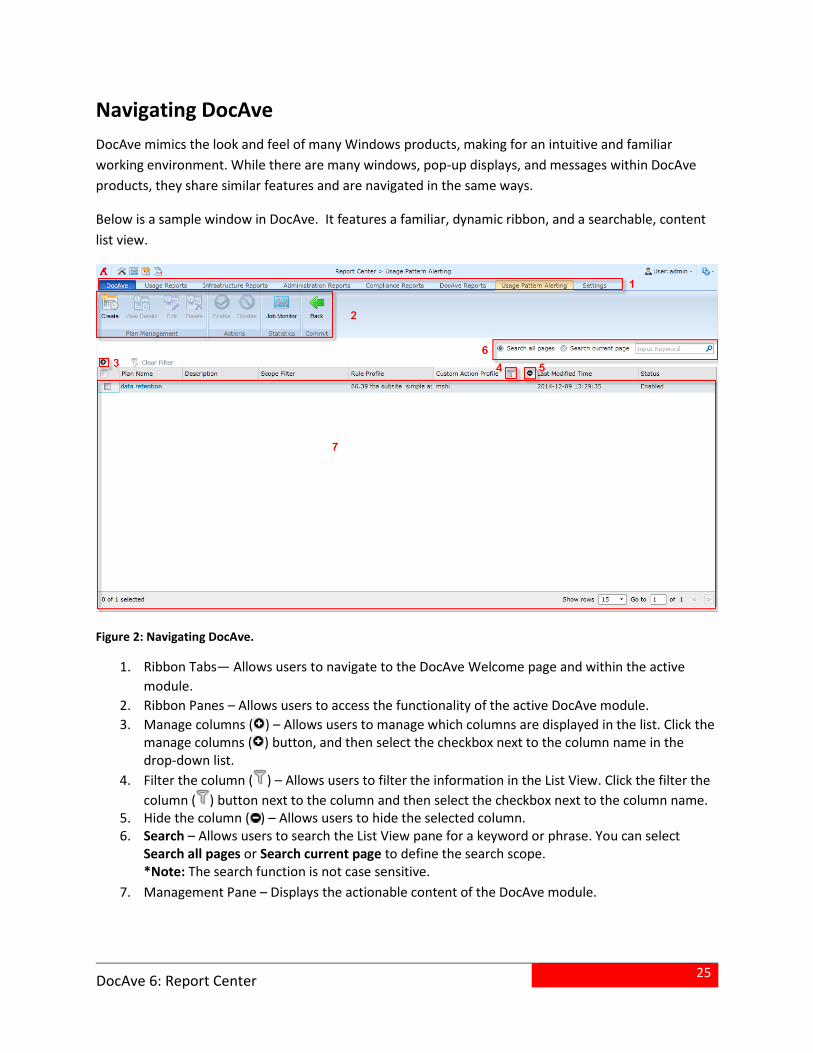
Navigating DocAve
DocAve mimics the look and feel of many Windows products, making for an intuitive and familiar
working environment. While there are many windows, pop-up displays, and messages within DocAve
products, they share similar features and are navigated in the same ways.
Below is a sample window in DocAve. It features a familiar, dynamic ribbon, and a searchable, content
list view.
Figure 2: Navigating DocAve.
1. Ribbon Tabs— Allows users to navigate to the DocAve Welcome page and within the active
module.
2. Ribbon Panes – Allows users to access the functionality of the active DocAve module.
3. Manage columns ( ) – Allows users to manage which columns are displayed in the list. Click the manage columns ( ) button, and then select the checkbox next to the column name in the drop-down list.
4. Filter the column ( ) – Allows users to filter the information in the List View. Click the filter the
column ( ) button next to the column and then select the checkbox next to the column name. 5. Hide the column ( ) – Allows users to hide the selected column. 6. Search – Allows users to search the List View pane for a keyword or phrase. You can select
Search all pages or Search current page to define the search scope. *Note: The search function is not case sensitive.
7. Management Pane – Displays the actionable content of the DocAve module.
26
DocAve 6: Report Center
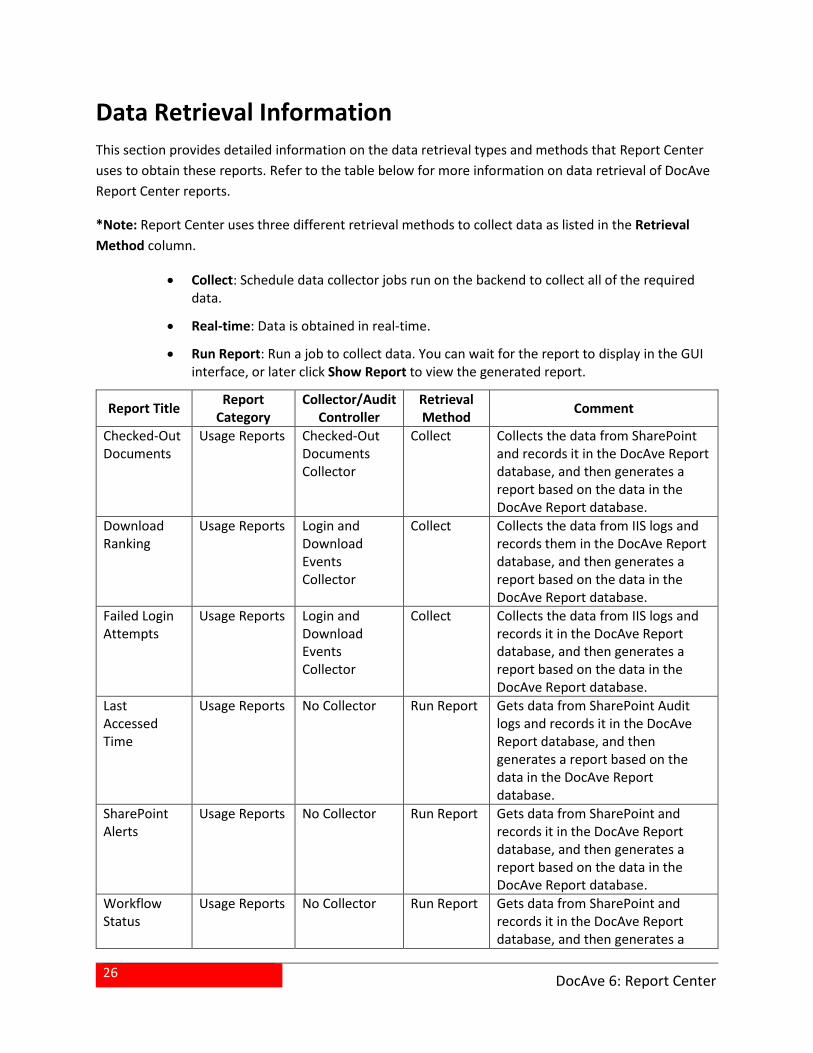
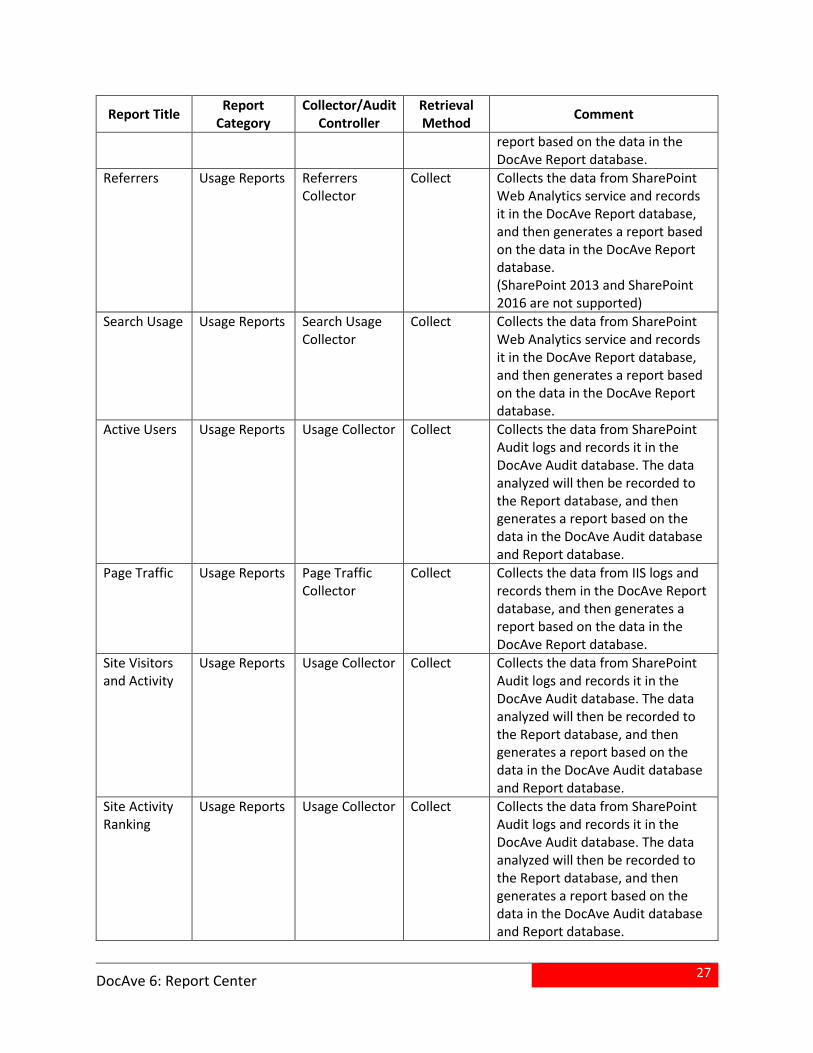
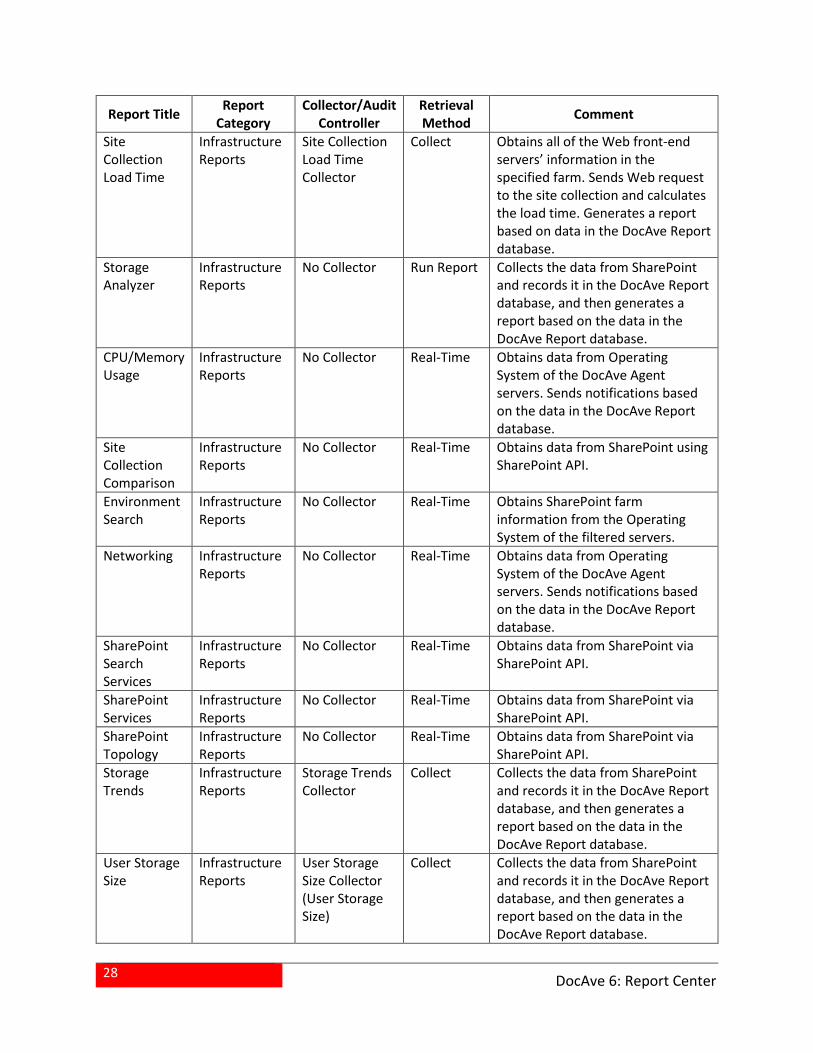
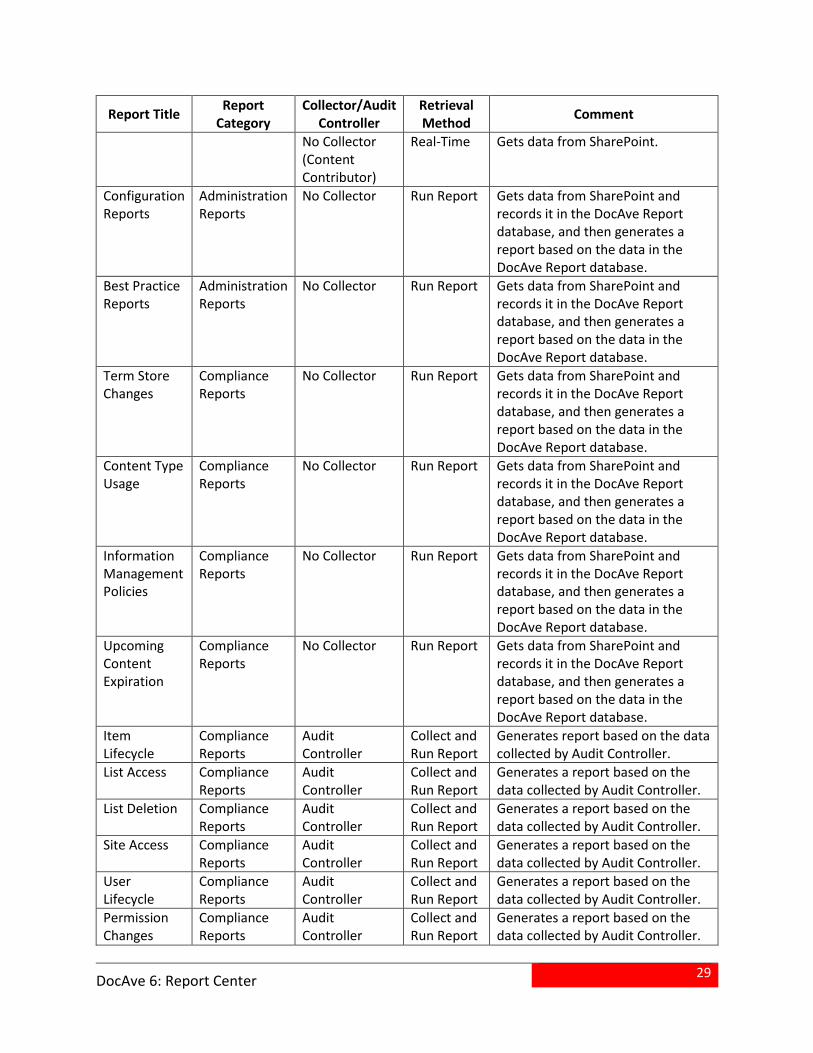
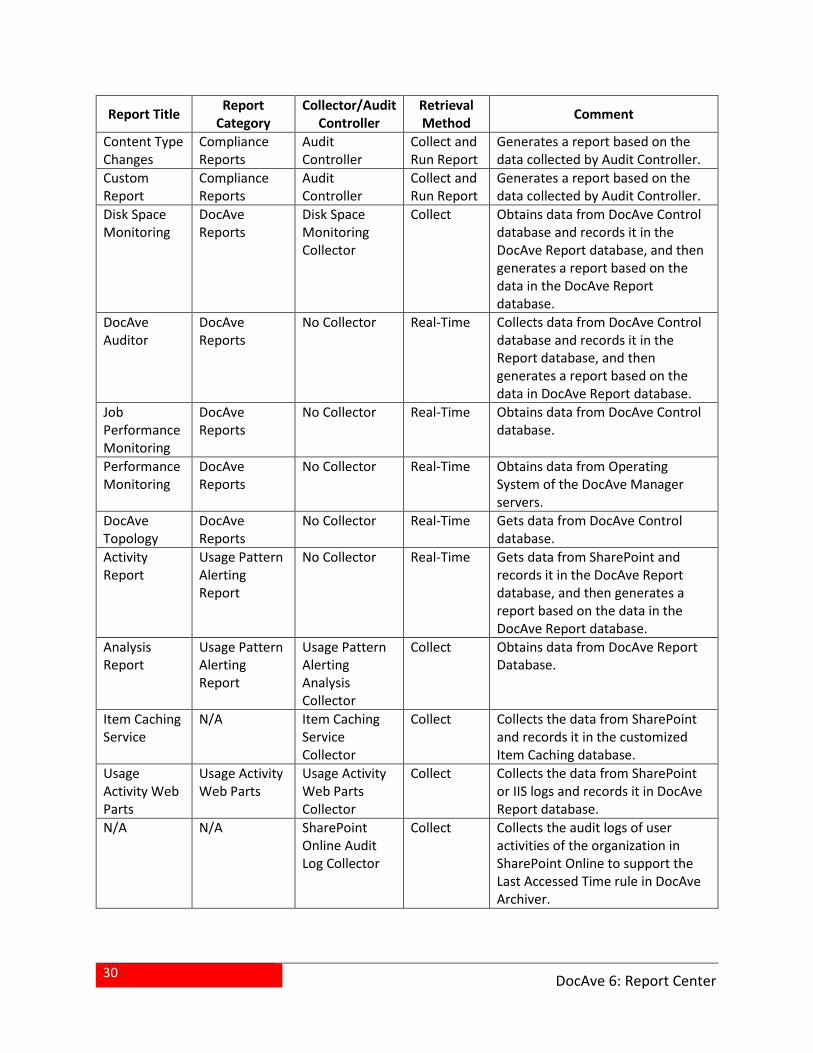
Data Retrieval Information
This section provides detailed information on the data retrieval types and methods that Report Center
uses to obtain these reports. Refer to the table below for more information on data retrieval of DocAve
Report Center reports.
*Note: Report Center uses three different retrieval methods to collect data as listed in the Retrieval
Method column.
Collect: Schedule data collector jobs run on the backend to collect all of the required data.
Real-time: Data is obtained in real-time.
Run Report: Run a job to collect data. You can wait for the report to display in the GUI interface, or later click Show Report to view the generated report.
Report Title Report
Category Collector/Audit
Controller Retrieval Method
Comment
Checked-Out Documents
Usage Reports Checked-Out Documents Collector
Collect Collects the data from SharePoint and records it in the DocAve Report database, and then generates a report based on the data in the DocAve Report database.
Download Ranking
Usage Reports Login and Download Events Collector
Collect Collects the data from IIS logs and records them in the DocAve Report database, and then generates a report based on the data in the DocAve Report database.
Failed Login Attempts
Usage Reports Login and Download Events Collector
Collect Collects the data from IIS logs and records it in the DocAve Report database, and then generates a report based on the data in the DocAve Report database.
Last Accessed Time
Usage Reports No Collector Run Report Gets data from SharePoint Audit logs and records it in the DocAve Report database, and then generates a report based on the data in the DocAve Report database.
SharePoint Alerts
Usage Reports No Collector Run Report Gets data from SharePoint and records it in the DocAve Report database, and then generates a report based on the data in the DocAve Report database.
Workflow Status
Usage Reports No Collector Run Report Gets data from SharePoint and records it in the DocAve Report database, and then generates a
27
DocAve 6: Report Center
Report Title Report
Category Collector/Audit
Controller Retrieval Method
Comment
report based on the data in the DocAve Report database.
Referrers Usage Reports Referrers Collector
Collect Collects the data from SharePoint Web Analytics service and records it in the DocAve Report database, and then generates a report based on the data in the DocAve Report database. (SharePoint 2013 and SharePoint 2016 are not supported)
Search Usage Usage Reports Search Usage Collector
Collect Collects the data from SharePoint Web Analytics service and records it in the DocAve Report database, and then generates a report based on the data in the DocAve Report database.
Active Users Usage Reports Usage Collector Collect Collects the data from SharePoint Audit logs and records it in the DocAve Audit database. The data analyzed will then be recorded to the Report database, and then generates a report based on the data in the DocAve Audit database and Report database.
Page Traffic Usage Reports Page Traffic Collector
Collect Collects the data from IIS logs and records them in the DocAve Report database, and then generates a report based on the data in the DocAve Report database.
Site Visitors and Activity
Usage Reports Usage Collector Collect Collects the data from SharePoint Audit logs and records it in the DocAve Audit database. The data analyzed will then be recorded to the Report database, and then generates a report based on the data in the DocAve Audit database and Report database.
Site Activity Ranking
Usage Reports Usage Collector Collect Collects the data from SharePoint Audit logs and records it in the DocAve Audit database. The data analyzed will then be recorded to the Report database, and then generates a report based on the data in the DocAve Audit database and Report database.
28
DocAve 6: Report Center
Report Title Report
Category Collector/Audit
Controller Retrieval Method
Comment
Site Collection Load Time
Infrastructure Reports
Site Collection Load Time Collector
Collect Obtains all of the Web front-end servers’ information in the specified farm. Sends Web request to the site collection and calculates the load time. Generates a report based on data in the DocAve Report database.
Storage Analyzer
Infrastructure Reports
No Collector Run Report Collects the data from SharePoint and records it in the DocAve Report database, and then generates a report based on the data in the DocAve Report database.
CPU/Memory Usage
Infrastructure Reports
No Collector Real-Time Obtains data from Operating System of the DocAve Agent servers. Sends notifications based on the data in the DocAve Report database.
Site Collection Comparison
Infrastructure Reports
No Collector Real-Time Obtains data from SharePoint using SharePoint API.
Environment Search
Infrastructure Reports
No Collector Real-Time Obtains SharePoint farm information from the Operating System of the filtered servers.
Networking Infrastructure Reports
No Collector Real-Time Obtains data from Operating System of the DocAve Agent servers. Sends notifications based on the data in the DocAve Report database.
SharePoint Search Services
Infrastructure Reports
No Collector Real-Time Obtains data from SharePoint via SharePoint API.
SharePoint Services
Infrastructure Reports
No Collector Real-Time Obtains data from SharePoint via SharePoint API.
SharePoint Topology
Infrastructure Reports
No Collector Real-Time Obtains data from SharePoint via SharePoint API.
Storage Trends
Infrastructure Reports
Storage Trends Collector
Collect Collects the data from SharePoint and records it in the DocAve Report database, and then generates a report based on the data in the DocAve Report database.
User Storage Size
Infrastructure Reports
User Storage Size Collector (User Storage Size)
Collect Collects the data from SharePoint and records it in the DocAve Report database, and then generates a report based on the data in the DocAve Report database.
29
DocAve 6: Report Center
Report Title Report
Category Collector/Audit
Controller Retrieval Method
Comment
No Collector (Content Contributor)
Real-Time Gets data from SharePoint.
Configuration Reports
Administration Reports
No Collector Run Report Gets data from SharePoint and records it in the DocAve Report database, and then generates a report based on the data in the DocAve Report database.
Best Practice Reports
Administration Reports
No Collector Run Report Gets data from SharePoint and records it in the DocAve Report database, and then generates a report based on the data in the DocAve Report database.
Term Store Changes
Compliance Reports
No Collector Run Report Gets data from SharePoint and records it in the DocAve Report database, and then generates a report based on the data in the DocAve Report database.
Content Type Usage
Compliance Reports
No Collector Run Report Gets data from SharePoint and records it in the DocAve Report database, and then generates a report based on the data in the DocAve Report database.
Information Management Policies
Compliance Reports
No Collector Run Report Gets data from SharePoint and records it in the DocAve Report database, and then generates a report based on the data in the DocAve Report database.
Upcoming Content Expiration
Compliance Reports
No Collector Run Report Gets data from SharePoint and records it in the DocAve Report database, and then generates a report based on the data in the DocAve Report database.
Item Lifecycle
Compliance Reports
Audit Controller
Collect and Run Report
Generates report based on the data collected by Audit Controller.
List Access Compliance Reports
Audit Controller
Collect and Run Report
Generates a report based on the data collected by Audit Controller.
List Deletion Compliance Reports
Audit Controller
Collect and Run Report
Generates a report based on the data collected by Audit Controller.
Site Access Compliance Reports
Audit Controller
Collect and Run Report
Generates a report based on the data collected by Audit Controller.
User Lifecycle
Compliance Reports
Audit Controller
Collect and Run Report
Generates a report based on the data collected by Audit Controller.
Permission Changes
Compliance Reports
Audit Controller
Collect and Run Report
Generates a report based on the data collected by Audit Controller.
30
DocAve 6: Report Center
Report Title Report
Category Collector/Audit
Controller Retrieval Method
Comment
Content Type Changes
Compliance Reports
Audit Controller
Collect and Run Report
Generates a report based on the data collected by Audit Controller.
Custom Report
Compliance Reports
Audit Controller
Collect and Run Report
Generates a report based on the data collected by Audit Controller.
Disk Space Monitoring
DocAve Reports
Disk Space Monitoring Collector
Collect Obtains data from DocAve Control database and records it in the DocAve Report database, and then generates a report based on the data in the DocAve Report database.
DocAve Auditor
DocAve Reports
No Collector Real-Time Collects data from DocAve Control database and records it in the Report database, and then generates a report based on the data in DocAve Report database.
Job Performance Monitoring
DocAve Reports
No Collector Real-Time Obtains data from DocAve Control database.
Performance Monitoring
DocAve Reports
No Collector Real-Time Obtains data from Operating System of the DocAve Manager servers.
DocAve Topology
DocAve Reports
No Collector Real-Time Gets data from DocAve Control database.
Activity Report
Usage Pattern Alerting Report
No Collector Real-Time Gets data from SharePoint and records it in the DocAve Report database, and then generates a report based on the data in the DocAve Report database.
Analysis Report
Usage Pattern Alerting Report
Usage Pattern Alerting Analysis Collector
Collect Obtains data from DocAve Report Database.
Item Caching Service
N/A Item Caching Service Collector
Collect Collects the data from SharePoint and records it in the customized Item Caching database.
Usage Activity Web Parts
Usage Activity Web Parts
Usage Activity Web Parts Collector
Collect Collects the data from SharePoint or IIS logs and records it in DocAve Report database.
N/A N/A SharePoint Online Audit Log Collector
Collect Collects the audit logs of user activities of the organization in SharePoint Online to support the Last Accessed Time rule in DocAve Archiver.
31
DocAve 6: Report Center
Configuring Report Center Settings
While Report Center is able to generate some reports without any configuration, in order to have all
features of Report Center ready to use when you need them, it is best to configure your settings ahead
of time.
To configure settings for Report Center, follow the instructions in each of the corresponding sections.
Data Collection
In Data Collection settings, users can view and manage when and how often data is collected by Report
Center collectors. Report Center collectors are imperative for many of the Report Center components,
and must be configured correctly before any data can be gathered.
All of the collectors in Data Collection except the User Profile Collector and Item Caching Service
Collector only run Incremental collector jobs to collect the data on the current day. User Profile
Collector and Item Caching Service Collector can run Full collector jobs besides the Incremental collector
jobs. To change the mode of the User Profile Collector jobs, configure the <UserProfileSyncMode> node
in the ReportCenterServiceProperties.config file. For details, refer to Configuring the
ReportCenterServiceProperties.config File. To configure the collection mode of the Item Caching Service
Collector, refer to Collection Mode
Incremental – Incremental is the default mode of all collector jobs. An incremental collector job collects the addition, modification, and deletion of the corresponding data after the last successful collector job. Scheduling incremental collector jobs to run more frequently will necessarily reduce the size of the data collected by each job.
Full – A full collector job collects all of the corresponding data within the designated scope. Collector jobs run in Full mode will take more time to complete than incremental collector jobs. A full User Profile Collector job must be run after you add user properties into the <UserProfileCustomProperties> node within the ReportCenterServiceCustomProperties.config file.
By giving you the flexibility of when and how often to collect data, Data Collection can be optimized to
fit your scheduling needs. To configure Data Collection settings for Report Center, click the Settings tab
in Report Center, then click Data Collection. The Collector Management pane appears with a list of
different types of collectors for Report Center. You can perform the following actions on Report Center
collectors:
View Profile – Allows you to view all saved job profiles of the selected collector. Click on a collector, and then click View Profile on the ribbon to see a list of all of the saved collector job profiles.
*Note: The View Profile feature is not supported for Usage Activity Web Part Collector,
User Profile Collector, Item Caching Service Collector, Usage Pattern Alerting Analysis
Collector, and SharePoint Online Audi Log Collector.
32
DocAve 6: Report Center
In the View Profile page, you can also perform the following operations on the profiles:
o Enable – To enable the collector jobs for a particular Disabled profile, select the profile and click Enable on the ribbon. The status of the profile becomes Enabled.
o Disable – To disable the collector jobs for a particular Enabled profile, select the profile and click Disable on the ribbon. The status of the profile becomes Disabled.
*Note: The Enable and Disable buttons are only available for Storage Trends
Collector, Site Collection Load Time Collector, Disk Space Monitoring Collector,
and User Storage Size Collector.
o View Scope – To view the tree of a particular profile, select the profile and click View Scope on the ribbon. The scope tree is displayed in the View Scope pane.
Edit – Allows you to configure the schedule and notification of the selected collector. Select the collector by clicking on its row in the display table, then click Edit on the ribbon. A configuration window appears.
o Client ID and Key (only available for SharePoint Online Audit Log Collector) – In this area, complete the following configurations:
Client ID – Enter the client ID that is automatically generated by Azure AD when your application is registered with Azure AD. For details of application registration in Azure AD, refer to Get started with Office 365 Management APIs.
Key – Enter the key of your application.
o Office 365 Domain (only available for SharePoint Online Audit Log Collector) – Configure and authorize your application to access and collect SharePoint Online Audit data from one or more Office 365 Domains by following the instructions below:
Add a Domain – Click this button to add a new Office 365 domain.
Authorize – Click the Authorize button in the same row to authorize your application to access and collect SharePoint Online Audit data from this Office 365 Domain.
Remove – Click the Remove ( ) button in the row of the Office 365 Domain that needs to be removed.
o Schedule – In the schedule configuration area, choose one of the following options:
No schedule – Select this option if you do not want to configure a schedule for this collector. If you choose this option, you must collect the data manually by clicking Collect Now.
Configure the schedule myself – Select this option to configure the schedule of the selected collector. Enter an integer in the Interval text
33
DocAve 6: Report Center
box to designate the frequency for the data to be collected and then designate a time of day you want the collector to run by selecting a choice from the Collect data at drop-down menu. As needed, click the time zone link and choose a time zone from the drop-down menu. The collector job will run at the specified time automatically. You can click Calendar View to read the schedule by Day, Week, or Month.
o Collection Mode (only available for Item Caching Service Collector) – Schedule a full collection job to run after a number of consecutive incremental collections have run, enter a number into the Run a full collection job after every_incremental collection jobs field.
o E-mail Notification – Select an e-mail notification profile from the drop-down menu or create a new profile by clicking New E-mail Notification. Refer to User Notification Settings section in the DocAve 6 Control Panel Reference Guide for detailed information.
o Enable SharePoint Auditor (only available for Usage Collector) – Select whether to enable SharePoint Auditor automatically for the site collections in the profile scopes while running each collector job. The Automatically enable SharePoint Auditor for the site collections in plan scopes option is selected unless you manually deselect it.
With this option selected, Usage Collector will initiate a sub-job to enable SharePoint Auditor for the site collections in the specified plan scopes while running each collector job for retrieving data.
If you do not select this option, Usage Collector will only automatically enable SharePoint Auditor for the site collections in the specified plan scopes when new plans are created. If you create new site collections within a previously created plan scope, Usage Collector will not automatically enable SharePoint Auditor for these new site collections.
*Note: If you do not want to collect the data for some SharePoint objects via
the Usage Collector jobs, you can configure a URL filter to exclude these objects
by URL via configuring the <UsageCollectorSetting> node in the
ReportCenterServiceProperties.config file on each of your Report Service
server. For detailed instructions, refer to Configuring the
ReportCenterServiceProperties.config File.
Click Save to save your configurations, and close the window. Click Cancel to close the window without saving your configurations.
Collect Now – Allows you to run the collector job immediately.
Job Monitor – Allows you to view the detailed job information about all of the Report Center jobs.
Back – Returns you to the Report Center Settings page.
34
DocAve 6: Report Center
Activity History Pruning
Activity History Pruning allows you to remove Report Center job data from the DocAve Report database
based on pre-defined criteria. By creating profiles and running pruning jobs in Activity History Pruning,
you can automate the deletion of outdated Report Center job data to save space in the SQL Server.
When creating an Activity History Pruning profile, you can:
Select the report types whose job data you want to remove from the Report database. Activity History Pruning supports the following report types:
o Active Users
o Checked-Out Documents
o Download Ranking
o Failed Login Attempts
o Page Traffic
o Referrers
o Search Usage
o Site Visitors and Activity
o Site Collection Load Time
o Storage Trends
o Disk Space Monitoring
o DocAve Auditor
o SharePoint Online Audit Log Report
Configure the time range for pruning the job data. The job data generated within the designated time range will be automatically pruned.
Choose how to deal with the job data in the DocAve Report database. You can choose to delete the data, or move it to another location.
Set up a schedule in the profile to prune data, or run it manually, providing you with more flexibility in the execution of Activity History Pruning profiles.
To access Activity History Pruning, click the Settings tab in Report Center, and then click Activity History
Pruning on the ribbon. The Profile Manager interface appears.
To check the progress of any profile that has been run or is scheduled to run, you can click Job Monitor
on the ribbon of the Activity History Pruning > Profile. For more information about using Job Monitor,
refer to the DocAve 6 Job Monitor User Guide.
35
DocAve 6: Report Center
Creating a Pruning Profile
Before creating a pruning profile, you can configure export locations to store the pruned job data. For
details on how to configure export locations for Report Center, see the Configuring Export Locations
section of the Export Location.
To create a pruning profile, complete the following steps:
1. In the Profile Manager interface, click Create on the ribbon to access the Create Profile interface.
2. Enter a Profile Name for this new pruning profile. Enter an optional Description for future reference.
3. Specify the report types whose job data you want to remove from the DocAve Report database in the Which reports’ job data would you like to prune? section by selecting the corresponding checkboxes in the right pane.
*Note: You can only configure one pruning profile per report type. If a report type already has
an existing pruning profile configured, the corresponding checkbox is grey out and not
selectable.
4. Select the time range of the job data you want to prune in the What time range would you like to cover in this pruning profile? section:
To prune data older, select All data older than: and then enter an integer in the text box. Select Days, Weeks , Months or Years from the drop-down menu.
To prune data generated during a specific date range, select All data between, then select the desired starting and ending dates using the calendars.
5. Choose what to do with the pruned data in What action would you like to perform on the pruned data? section:
Select Delete Data to directly delete the job data from the Report database.
Select Move data to move the job data to an export location. To designate an export location to store the pruned data, select an export location from the Export Location drop-down menu, or click New Export Location to create a new export location. For the detailed instructions on configuring a new export location, refer to Creating an Export Location.
6. Choose whether or not to set a schedule to run this profile on a regular basis, or to run this profile manually in Profile Manager:
No Schedule – Select this to run the profile manually in Profile Manager.
Configure the schedule myself– Select this option to configure the time you want this profile to run. A schedule configuration area appears. You can customize the schedule with the following options:
o Start time – Select the date and time to start running this profile.
36
DocAve 6: Report Center
*Note: The start time cannot be earlier than the current time.
o Interval – Enter an integer into the text box and select by Hour(s), Day(s), Week(s), or Month(s). This profile will run repeatedly based on this schedule until manually stopped Click Calendar View to see the schedule in a calendar.
o Schedule ending – Designate when to stop running this profile.
Select No end date for this profile to run repeatedly until you stop it manually.
Select End after ___ occurrence(s) to stop running this profile after the number of occurrences you designate in the text box.
Select End by to select the end date and time for this profile to stop being run.
7. Would you like to notify users of the job status? – Send the e-mail notifications according to the configurations of this profile. Select an existing e-mail notification profile from the drop-down menu, or click New E-mail Notification to create a new one. Refer to the User Notification Settings section in the DocAve 6 Control Panel Reference Guide for more information.
8. Click Save and Run Now to save the profile and run it immediately, Save to save the profile, or Cancel to return to the Profile Manager interface without saving these configurations.
Using Profile Manager
Profile Manager of Activity History Pruning provides you with a centralized location to view and edit
your Activity History Pruning profiles. To access Profile Manager, click the Settings tab in Report Center,
and then click Activity History Pruning on the ribbon. You will see a list of your previously created
profiles in the Profile Manager viewing pane. To change the number of profiles displayed per page,
select the desired number from the Show rows drop-down menu in the lower-right corner. To sort the
profiles, click on a column heading Profile Name and Action to Take.
On the bottom message bar, you will see the selection status of the profiles. Click Clear Selection on the
message bar to deselect all of the selected checkboxes.
Operations in Profile Manager
Once you have configured Profile Manager to display the profiles of your choice, you can perform the
following actions on your profiles:
View Details – Select a profile, and then click View Details on the ribbon to open the View Details page to view configurations of the selected profile.
Edit – Select a profile, then click Edit on the ribbon to open the profile editing page. Here you can make changes to the configurations of the selected profile.
o To save your configurations of the profiles, click Save and make a selection from the drop-down list:
37
DocAve 6: Report Center
Click Save to save any changes made to the profile, and return to the Profile Manager page.
Click Save and Run Now to save any changes made to the profile, and run a job of this profile immediately.
o If you do not want to save the changes to the profile, click Cancel to close the profile editing page without saving any changes.
Delete – Select a profile, then click Delete on the ribbon to delete the profile. A window pops up to confirm that you want to proceed with deleting the selected profile. Click OK to delete the profile, or click Cancel to return to the Profile Manager page without deleting the profile.
Run Now – Select a profile, then click Run Now to run the selected profile immediately.
Restore Pruned Data – Restore the data moved to exported locations by previously finished pruning jobs of Move Data profiles. For details, see Restoring Pruned Data in the Restore Interface.
*Note: The data deleted by the jobs of the profiles with the Delete data option selected cannot be restored.
Job Monitor – Keep track of running profiles and scheduled profiles. To access the jobs of each profile, click Job Monitor on the ribbon. For more information about using Job Monitor, refer to the DocAve 6 Job Monitor User Guide.
Restoring Pruned Data in the Restore Interface
Using the Restore interface of Activity History Pruning, you can restore the job data moved to export
locations by previously finished Move Data pruning jobs by completing the following steps.
1. To access the Restore interface from Profile Manager, choose either of the following methods:
Click Restore Pruned Data on the ribbon of Profile Manager. All the Activity History Pruning jobs which moved data to exported locations run within the current month will be displayed in the viewing pane of the Restore interface.
To view the finished jobs of the selected Activity History Pruning profiles, select the profiles whose jobs you want to view in Profile Manager, and click Restore Pruned Data on the ribbon. All the finished jobs of the selected profiles will be displayed in the viewing pane of the Restore interface.
2. Configure the settings in the Set Filter area to limit or expand the jobs loaded in the viewing pane of the Restore interface. The default filter rule includes all of the finished Move Data pruning jobs within the current month. For detailed instructions on using Set Filter, see Setting Filter for Activity History Pruning Jobs.
3. After applying the Set Filter settings, all the jobs that meet the configured filter rules are displayed in the viewing pane. You can also perform the following operations to determine how the jobs are displayed in the viewing pane.
38
DocAve 6: Report Center
List View – Click this button to view job information in table format. List View is the default view of the viewing pane for the Restore interface.
Calendar View – Click this button to view job information in calendar view.
Search – Filter the jobs displayed by the keyword you designate. The keyword must be contained in a column value. At the top of the viewing pane, enter the keyword for the jobs you want to view. You can select to Search all pages or Search current page.
4. Select the jobs that pruned the data you want to restore and click Restore on the ribbon to start restoring the data.
Setting Filter for Activity History Pruning Jobs
To set the filter criteria to extend or limit the jobs displayed in the viewing pane via the Set Filter
feature, complete the following steps:
1. Click Set Filter above the viewing pane to access the Set Filter window.
2. Filter by Profile – Filter the jobs by profile name. Select the profiles you want to run from the Profile Name drop-down list, or select All Profiles to display all jobs.
3. Filter by Time Range – Filter the jobs by finished time of pruning job or generated time of pruned data.
Filter by job finished time – Filter the jobs by finished time of pruning jobs.
o All jobs – Select this option to display all Finished/Finished with Exception Activity History Pruning jobs.
o Job finished within – Select this option to select a date range from the drop-down list. All of the Finished/Finished with Exception Activity History Pruning jobs whose finish time is in the specified date range will be displayed.
Filter by data generated time – Filter the jobs by generated time of pruned data by selecting a date range from the drop-down list. All of the jobs that pruned the data generated within the specified date range will be displayed.
4. Click Filter to apply the configured filter criteria. All Activity History Pruning jobs that meet the criteria are listed in the viewing pane. To reset all filter criteria, click Reset .To return to the viewing pane without applying the filter criteria, click Back.
IIS Logging
IIS Logging allows DocAve to retrieve data from the IIS Log. By configuring the IIS Logging settings, you
can obtain reports for Download Ranking, Failed Login Attempts, and Page Traffic. To ensure that Report
Center can retrieve all of the required data from the IIS logs for these reports on SharePoint nodes, the
IIS logging settings of IIS websites containing the corresponding SharePoint nodes must be in the W3C
format with all of the logging fields selected. Instead, if you do not want to log all of the fields through
the configuration of the IIS Logging in Report Center, make sure the required fields are selected as
needed to retrieve data for Download Ranking, Failed Login Attempts, or Page Traffic, as well as for
39
DocAve 6: Report Center
retrieving IIS logs and logging source IP to retrieve data for Audit Reports. For details, refer to Appendix
D: Required W3C Logging Fields for Specific Functions.
To configure IIS Logging settings, complete the following steps:
1. In the Settings tab of Report Center, click IIS Logging. A window appears with a list of all Web applications allowing you to modify the IIS Logging settings for each Web application.
2. Select a Web application by checking its corresponding checkbox. Then click either Select All Fields or Rollback on the ribbon.
Select All Fields – Include all of the IIS logging fields for data collection.
Rollback – Returns IIS logging configuration to the previous state.
*Note: DocAve will not automatically restore the IIS log settings to the original value
after the uninstallation. You must set it to the original value in this interface before
uninstalling DocAve.
Reporting Service
Reporting Service extracts data from the SQL Reporting Services for Report Center. Reporting Center
also enables Report Center to export Usage, Infrastructure, and DocAve Reports in several formats,
including PDF, TIF, XML, and MHTML.
*Note: DocAve 6 Service Pack 1 and later versions support generating CSV, XLS, and, XLSX reports in all
the report categories without the need to configure Reporting Service. When the Reporting Service is
not configured, you can also generate the PDF report in Compliance Reports.
To configure Reporting Services for Report Center, complete the following steps:
1. In the Settings tab of Report Center, click Reporting Service. The Reporting Services configuration window appears.
2. Check the SQL Reporting Services Configuration checkbox to enable Reporting Services.
3. Enter the Web Service URL, and then enter the Username and Password in the appropriate text box. This provides Report Center with the Report Server Web Service URL used to connect to the SQL reporting service.
4. Select which type of authentication method to use to access the database. Then enter the Account and Password.
*Note: Use the same credentials as you did when you set up Reporting Service on the SQL
server.
5. If you want to store the report definition documents in a SharePoint library, check the SharePoint Integrated checkbox to use SharePoint Integrated mode. Enter the Document Library URL of the document library used to store the report file, and then enter the Username and Password in the appropriate text boxes.
40
DocAve 6: Report Center
*Note: SharePoint Integrated mode is not supported in SQL Server 2012. If you are using SQL
Server 2012 in SharePoint integrated mode, you can still export reports to UNC paths or
SharePoint libraries. However, you are not able to configure the SQL Server Reporting Services
in DocAve for exporting additional export reports in TIF, XML and, MHTML formats. You can only
export reports in XLS, XLSX, and CSV formats (and .PDF format for Compliance Reports). To
configure the SQL Server Reporting Services for SQL Server 2012, change your SQL Server
Reporting Services to native mode.
Click Save to save the configuration. Click Cancel to go back to the Settings interface without saving any
changes.
Cross-Farm Service Configuration
Cross-Farm Service Configuration specifies whether to collect data from the shared services of the
publishing farm when generating reports on the consuming farm. The Cross-Farm Service Configuration
on Web Analytics Service Application (only available in SharePoint 2010), User Profile Service
Application, and Search Service Application can currently be used to generate the Search Usage reports,
Referrer reports, Configuration reports, and reports in the Usage Activity Web parts.
A consuming farm is the farm using the service applications shared by the publishing farm, while the
publishing farm is the farm sharing its service applications to other farms. The consuming farm can be its
own publishing farm at the same time.
To configure the Cross-Farm Service Configuration for the Report Center, click Cross-Farm Service
Configuration in the Settings tab of Report Center. The Cross-Farm Service Configuration page opens
with a list of shared service applications for the consuming farm and publishing farm. You can perform
the following actions in this window:
Configure – Designate shared service applications for the consuming farm where you can collect data for the report as you want. Click Configure on the ribbon to make the following configurations:
o Consuming Farm – Select the farm from the Consuming Farm drop-down menu
which will be configured for the shared service applications it can use from the
publishing farms. The shared service applications that the consuming farm has
been using will appear and stay checked in the pane below. Check the
checkboxes next to the services that you want to use across the farm. The
configuration cannot change the usage status of the service applications in
SharePoint, because it only enables Report Center to generate related reports
depending on the data of those service applications.
*Note: To ensure Report Center can collect the data of the selected shared
service applications while generating reports, DocAve Agents must be running
on the servers where the corresponding shared services are enabled.
41
DocAve 6: Report Center
o Rediscover – Click Rediscover to return to the original SharePoint service usages
status of the selected consuming farm.
Click Save to save the configuration. Click Cancel to return without saving any changes.
Rediscover All – Clear all the saved Cross-Farm Service Configuration and revert back the shared service application usage status to the original SharePoint service usage status of all the listed farms.
Delete – Click Delete under the Delete column in the table to remove the corresponding shared service application usage.
Click Save to save the configuration. Click Cancel to go back to the setting page without saving any
changes.
Audit Controller
Audit Controller leverages native SharePoint functionalities to allow Auditor Reports in Report Center to
obtain user operation information at various SharePoint object levels: from the Web applications to
items. By creating plans in Audit Controller, you can fully customize what data to collect and from
where. When creating plans, you can:
Configure rules in Audit Controller to customize which audit record events to collect from SharePoint.
Create filters so that these rules are only applied to the designated objects, users, or AD profiles.
Configure Audit Controller rules to either overwrite previous rules or append to those rules if there are overlaps.
Leverage DocAve Report Service to retrieve IIS logs and the log source IP.
Schedule the plans to apply rules and retrieve data or manually apply the rule and retrieve data.
Click Job Monitor on the ribbon of the Audit Controller page to see Audit Control job progress or check
the details of the jobs. For more information about using Job Monitor, refer to the DocAve 6 Job
Monitor User Guide.
To access functions in Audit Controller, in the Settings tab of Report Center, click Audit Controller on
the ribbon. You will be brought to the Audit Controller interface.
Building Plans
In Audit Controller, there are two ways to build plans:
Wizard Mode – For those unfamiliar with creating Audit Controller plans, Wizard Mode provides step-by-step guidance.
42
DocAve 6: Report Center
Form Mode – For more experienced users, Form Mode provides you with a consolidated interface where you can configure your Audit Controller plan.
*Note: Fields marked with a * are required fields.
Wizard Mode
To build a new Audit Controller plan with the wizard, click Plan Builder in the Audit Controller interface
and then select Wizard Mode from the drop-down menu. To create your plan, complete the following
steps:
1. What would you like to name this plan? – Enter a Plan Name. Enter an optional Description for future reference. Click Next.
2. Which operations would you like to do with this plan? – Choose the actions you want this plan to perform:
Apply Rule enables the auditing of the selected actions on the specified SharePoint scope.
Retrieve Data retrieves the auditing records from SharePoint and stores them in the DocAve Auditor database.
Click Next to go to the next step.
3. Scope – Select the desired scope for this plan to audit by clicking on object names to expand the data tree or entering a URL or object name in the search text box above the tree. To narrow down the search criteria and display fewer nodes under a particular farm/Web application level node, a Sites node, or a Lists node on the tree, right-click the node and select Advanced Search to access the Advanced Search interface. For detailed instructions on using the Advanced Search feature, refer to Searching Nodes Using the Advanced Search Feature. Check the checkboxes next to the desired objects to begin configuring the audit settings. To configure settings for an individual node, select an object, and then click Edit Rules Individually next to the object name.
Would you also like to audit these actions in lower object levels? – This section is only available when site or list level nodes are selected in the Scope pane. Select the Trickle down checkbox if you want to audit the data of the child objects under the selected object. If you do not select the Trickle down, DocAve will only audit the selected objects and ignore the child objects under them. The Trickle down option is unavailable for nodes at the site collection or above level because the child objects of site collections are automatically audited.
*Note: If the Trickle down settings on the selected nodes are configured differently at
an individual level, the Trickle down checkbox will be greyed out. Click Set All to Default
if you need to clear the existing trickle down settings on the selected nodes, and then
perform the configuration in bulk.
Which events would you like to audit? – Check the corresponding checkboxes of the audit record events you want to audit in the selected nodes. In the Which events would
43
DocAve 6: Report Center
you like to audit? area for an individual node, you can view the audit events that are currently being audited in this node by clicking the link here at the bottom of the page.
*Note: If different audit events are selected for individual nodes, the settings area for
selecting audit events for the selected scope in bulk will be disabled. Click Set All to
default if you need to clear all of the individual selections for your selected nodes, and
then perform the configuration in bulk.
*Note: If you want to audit the Site Collection Deletion or Site Creation actions, make
sure the SP2010AuditorMonitor.wsp solution has already been deployed. Refer to the
Solution Manager section in the DocAve 6 Control Panel Reference Guide for the
detailed instructions to deploy this solution.
*Note: For the objects in SharePoint 2016, there will be only records on viewing
documents with the View option selected.
After you have finished the configuration, click Next to go to the next step.
4. Options – Configure the Apply Rule Settings and Retrieve Data Settings. These configurations are optional.
Apply Rule Settings – Configure the filter policy, operation settings, and schedule for applying the audit rules.
o Would you like to filter the scope for applying the audit rules? – This field is
only available when SharePoint on-premises nodes are selected in the Scope
pane in step 3. Designate the specific objects or data you want to filter. Click the
Add a Filter Category link to add a category, and then select Site Collection,
Site, or List/Library from the drop-down menu to specify the objects you want
to audit. Click Add a Criterion, make selections in the Rule and Condition drop-
down lists and then enter a value in the Value text box.
Repeat this step to create additional criteria. Click to delete any of the filter
policies.
o What would you like to do with existing audit actions? – Configure how the
new rules of this plan are handled when there are already auditing rules
configured for the same SharePoint object. Select one of the following options
from the drop-down list:
Overwrite – Overwrite the original audit actions of the specified nodes with the new ones.
Append – Append the new audit actions to the existing ones.
o How should the schedule be defined? – Select the type of schedule to apply
the audit rule by choosing one of the following options: No schedule and
Configure the schedule myself. Select No schedule to retrieve auditing data of
44
DocAve 6: Report Center
this plan manually from Plan Manager. Select Configure the schedule myself to
configure the specified time you want to retrieve the plan’s auditing data. A
separate Schedule configuration area appears when you select this option
where you can customize the schedule with the following options:
Start time – Select the date and time for the rules of this plan to be applied.
*Note: The start time cannot be earlier than the current time.
Interval – Enter an integer in the text box and select by Hour(s), Day(s, Week(s), or Month(s). The rules of this plan will be applied repeatedly based on this schedule. Click Calendar View to see the schedules in a calendar.
Schedule ending – Designate when to stop applying the rules of this plan. Select No end date for the rules of this plan to be applied repeatedly until you stop it manually. Select End after ___ occurrence(s) to have the job stopped after a defined number of occurrences. Select End by to specify the exact date and time for this rule to stop being applied.
o Would you like to have the audit log for the selected nodes automatically trimmed? – This field is only available when the nodes under My Registered Sites are selected in the Scope pane in step 3. This field is used to determine whether or not the audit log for the selected nodes should be automatically trimmed. If yes, select the Delete auditor data in SharePoint older than _ days checkbox and then enter the number of days to retain audit log data.
Retrieve Data Settings – Configure the filter policy, advanced rules, and schedule for retrieving the auditing data.
o Would you like to filter the objects whose audit data will be retrieved? – Designate the specific objects or data you want to filter. Click the Add a Filter Category link to add a category, and then select Site Collection, URL, User, or AD Profile from the drop-down menu to specify the objects containing the audit data you want to retrieve. Click Add a Criterion, make selections in the Rule and Condition drop-down lists, and then enter a value in the Value text box.
Note the following:
The Custom Property: Text criterion in the Site Collection category filters the site collections created by Governance Automation.
The AD Profile category is only available when SharePoint on-premises nodes are selected in the Scope pane in step 3.
Repeat this step to create additional criteria. Click the delete button ( ) if you
want to delete any of the filter policies you have configured.
o Would you like to configure advanced settings for retrieving data? – This field is only available when SharePoint on-premises nodes are selected in the Scope
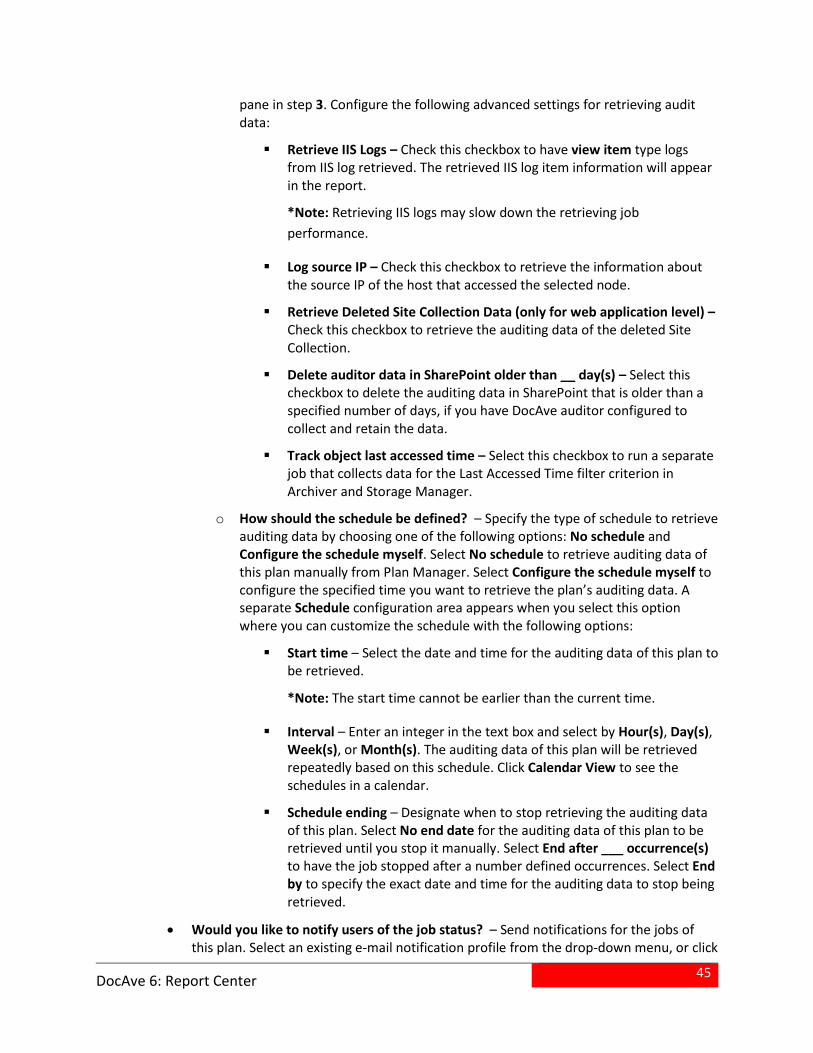
45
DocAve 6: Report Center
pane in step 3. Configure the following advanced settings for retrieving audit data:
Retrieve IIS Logs – Check this checkbox to have view item type logs from IIS log retrieved. The retrieved IIS log item information will appear in the report.
*Note: Retrieving IIS logs may slow down the retrieving job
performance.
Log source IP – Check this checkbox to retrieve the information about the source IP of the host that accessed the selected node.
Retrieve Deleted Site Collection Data (only for web application level) – Check this checkbox to retrieve the auditing data of the deleted Site Collection.
Delete auditor data in SharePoint older than __ day(s) – Select this checkbox to delete the auditing data in SharePoint that is older than a specified number of days, if you have DocAve auditor configured to collect and retain the data.
Track object last accessed time – Select this checkbox to run a separate job that collects data for the Last Accessed Time filter criterion in Archiver and Storage Manager.
o How should the schedule be defined? – Specify the type of schedule to retrieve auditing data by choosing one of the following options: No schedule and Configure the schedule myself. Select No schedule to retrieve auditing data of this plan manually from Plan Manager. Select Configure the schedule myself to configure the specified time you want to retrieve the plan’s auditing data. A separate Schedule configuration area appears when you select this option where you can customize the schedule with the following options:
Start time – Select the date and time for the auditing data of this plan to be retrieved.
*Note: The start time cannot be earlier than the current time.
Interval – Enter an integer in the text box and select by Hour(s), Day(s), Week(s), or Month(s). The auditing data of this plan will be retrieved repeatedly based on this schedule. Click Calendar View to see the schedules in a calendar.
Schedule ending – Designate when to stop retrieving the auditing data of this plan. Select No end date for the auditing data of this plan to be retrieved until you stop it manually. Select End after ___ occurrence(s) to have the job stopped after a number defined occurrences. Select End by to specify the exact date and time for the auditing data to stop being retrieved.
Would you like to notify users of the job status? – Send notifications for the jobs of this plan. Select an existing e-mail notification profile from the drop-down menu, or click
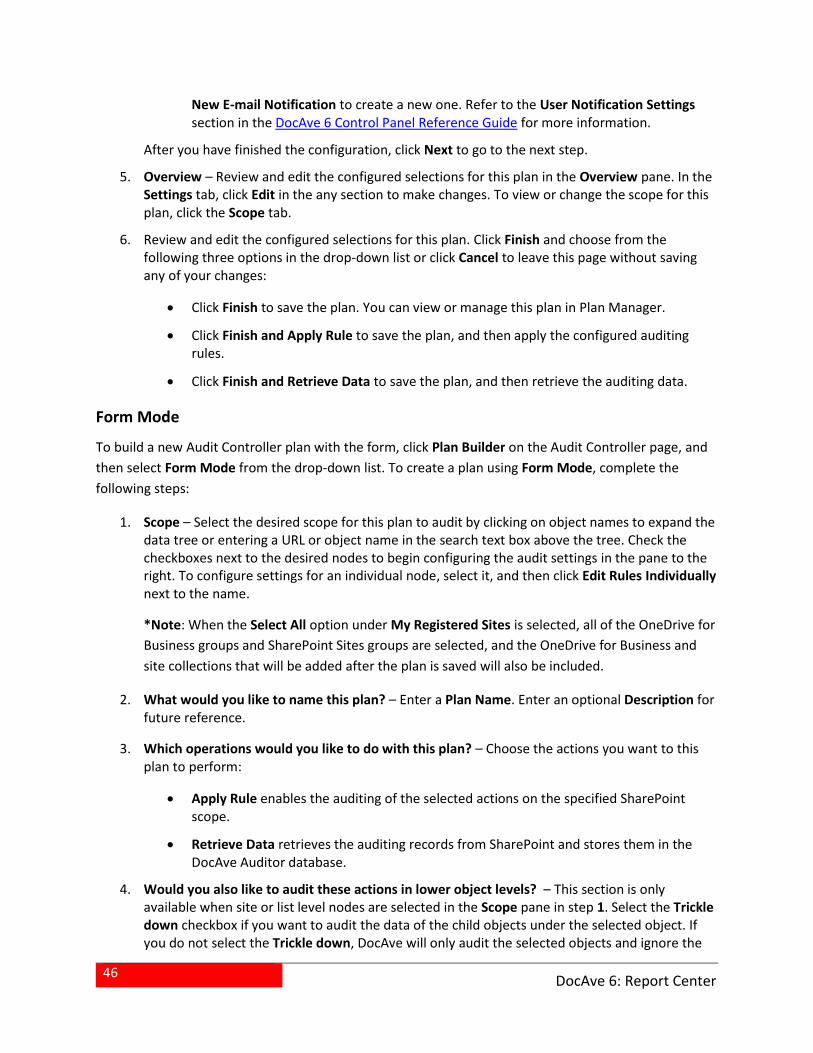
46
DocAve 6: Report Center
New E-mail Notification to create a new one. Refer to the User Notification Settings section in the DocAve 6 Control Panel Reference Guide for more information.
After you have finished the configuration, click Next to go to the next step.
5. Overview – Review and edit the configured selections for this plan in the Overview pane. In the Settings tab, click Edit in the any section to make changes. To view or change the scope for this plan, click the Scope tab.
6. Review and edit the configured selections for this plan. Click Finish and choose from the following three options in the drop-down list or click Cancel to leave this page without saving any of your changes:
Click Finish to save the plan. You can view or manage this plan in Plan Manager.
Click Finish and Apply Rule to save the plan, and then apply the configured auditing rules.
Click Finish and Retrieve Data to save the plan, and then retrieve the auditing data.
Form Mode
To build a new Audit Controller plan with the form, click Plan Builder on the Audit Controller page, and
then select Form Mode from the drop-down list. To create a plan using Form Mode, complete the
following steps:
1. Scope – Select the desired scope for this plan to audit by clicking on object names to expand the data tree or entering a URL or object name in the search text box above the tree. Check the checkboxes next to the desired nodes to begin configuring the audit settings in the pane to the right. To configure settings for an individual node, select it, and then click Edit Rules Individually next to the name.
*Note: When the Select All option under My Registered Sites is selected, all of the OneDrive for
Business groups and SharePoint Sites groups are selected, and the OneDrive for Business and
site collections that will be added after the plan is saved will also be included.
2. What would you like to name this plan? – Enter a Plan Name. Enter an optional Description for future reference.
3. Which operations would you like to do with this plan? – Choose the actions you want to this plan to perform:
Apply Rule enables the auditing of the selected actions on the specified SharePoint scope.
Retrieve Data retrieves the auditing records from SharePoint and stores them in the DocAve Auditor database.
4. Would you also like to audit these actions in lower object levels? – This section is only available when site or list level nodes are selected in the Scope pane in step 1. Select the Trickle down checkbox if you want to audit the data of the child objects under the selected object. If you do not select the Trickle down, DocAve will only audit the selected objects and ignore the
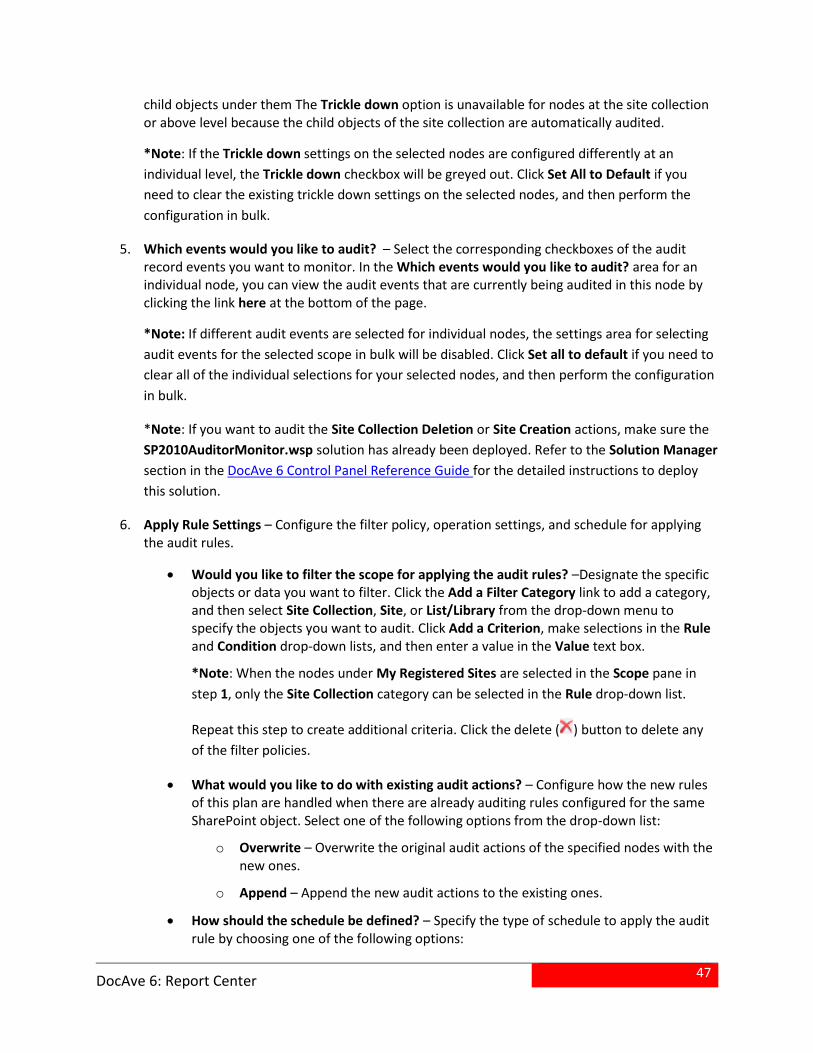
47
DocAve 6: Report Center
child objects under them The Trickle down option is unavailable for nodes at the site collection or above level because the child objects of the site collection are automatically audited.
*Note: If the Trickle down settings on the selected nodes are configured differently at an
individual level, the Trickle down checkbox will be greyed out. Click Set All to Default if you
need to clear the existing trickle down settings on the selected nodes, and then perform the
configuration in bulk.
5. Which events would you like to audit? – Select the corresponding checkboxes of the audit record events you want to monitor. In the Which events would you like to audit? area for an individual node, you can view the audit events that are currently being audited in this node by clicking the link here at the bottom of the page.
*Note: If different audit events are selected for individual nodes, the settings area for selecting
audit events for the selected scope in bulk will be disabled. Click Set all to default if you need to
clear all of the individual selections for your selected nodes, and then perform the configuration
in bulk.
*Note: If you want to audit the Site Collection Deletion or Site Creation actions, make sure the
SP2010AuditorMonitor.wsp solution has already been deployed. Refer to the Solution Manager
section in the DocAve 6 Control Panel Reference Guide for the detailed instructions to deploy
this solution.
6. Apply Rule Settings – Configure the filter policy, operation settings, and schedule for applying the audit rules.
Would you like to filter the scope for applying the audit rules? –Designate the specific objects or data you want to filter. Click the Add a Filter Category link to add a category, and then select Site Collection, Site, or List/Library from the drop-down menu to specify the objects you want to audit. Click Add a Criterion, make selections in the Rule and Condition drop-down lists, and then enter a value in the Value text box.
*Note: When the nodes under My Registered Sites are selected in the Scope pane in
step 1, only the Site Collection category can be selected in the Rule drop-down list.
Repeat this step to create additional criteria. Click the delete ( ) button to delete any
of the filter policies.
What would you like to do with existing audit actions? – Configure how the new rules of this plan are handled when there are already auditing rules configured for the same SharePoint object. Select one of the following options from the drop-down list:
o Overwrite – Overwrite the original audit actions of the specified nodes with the new ones.
o Append – Append the new audit actions to the existing ones.
How should the schedule be defined? – Specify the type of schedule to apply the audit rule by choosing one of the following options:
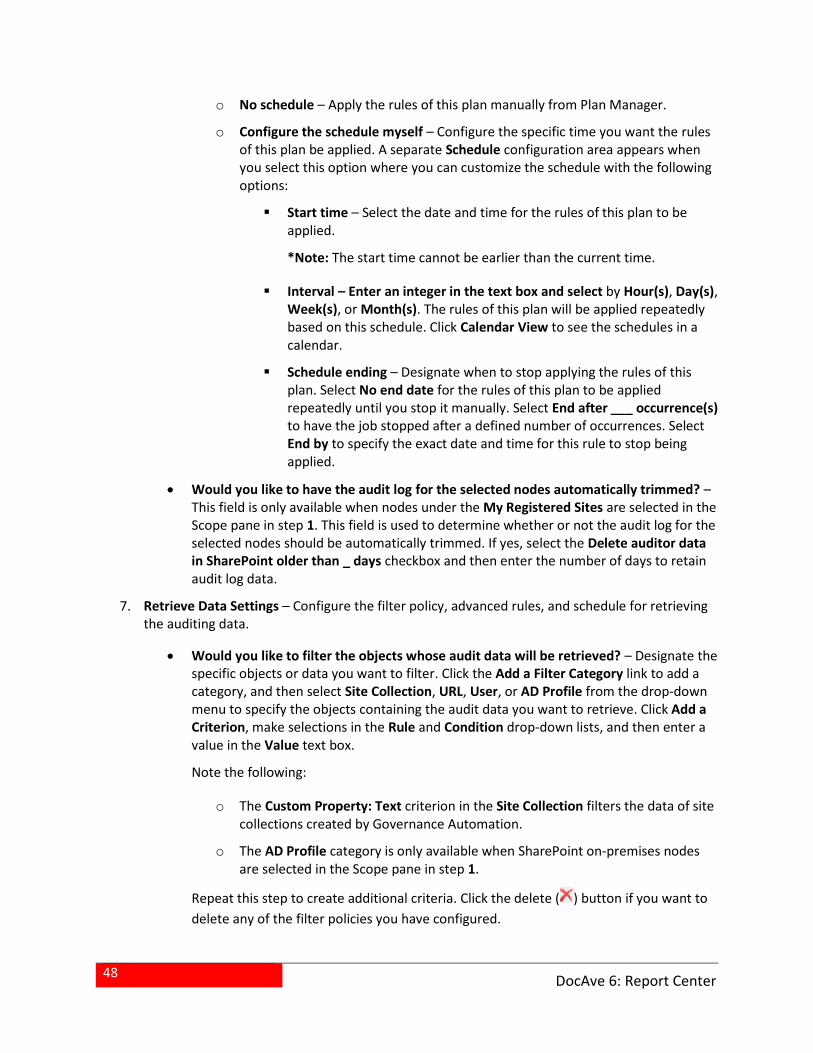
48
DocAve 6: Report Center
o No schedule – Apply the rules of this plan manually from Plan Manager.
o Configure the schedule myself – Configure the specific time you want the rules of this plan be applied. A separate Schedule configuration area appears when you select this option where you can customize the schedule with the following options:
Start time – Select the date and time for the rules of this plan to be applied.
*Note: The start time cannot be earlier than the current time.
Interval – Enter an integer in the text box and select by Hour(s), Day(s), Week(s), or Month(s). The rules of this plan will be applied repeatedly based on this schedule. Click Calendar View to see the schedules in a calendar.
Schedule ending – Designate when to stop applying the rules of this plan. Select No end date for the rules of this plan to be applied repeatedly until you stop it manually. Select End after ___ occurrence(s) to have the job stopped after a defined number of occurrences. Select End by to specify the exact date and time for this rule to stop being applied.
Would you like to have the audit log for the selected nodes automatically trimmed? – This field is only available when nodes under the My Registered Sites are selected in the Scope pane in step 1. This field is used to determine whether or not the audit log for the selected nodes should be automatically trimmed. If yes, select the Delete auditor data in SharePoint older than _ days checkbox and then enter the number of days to retain audit log data.
7. Retrieve Data Settings – Configure the filter policy, advanced rules, and schedule for retrieving the auditing data.
Would you like to filter the objects whose audit data will be retrieved? – Designate the specific objects or data you want to filter. Click the Add a Filter Category link to add a category, and then select Site Collection, URL, User, or AD Profile from the drop-down menu to specify the objects containing the audit data you want to retrieve. Click Add a Criterion, make selections in the Rule and Condition drop-down lists, and then enter a value in the Value text box.
Note the following:
o The Custom Property: Text criterion in the Site Collection filters the data of site collections created by Governance Automation.
o The AD Profile category is only available when SharePoint on-premises nodes are selected in the Scope pane in step 1.
Repeat this step to create additional criteria. Click the delete ( ) button if you want to
delete any of the filter policies you have configured.
49
DocAve 6: Report Center
Would you like to configure advanced settings for retrieving data? – This field is only available when SharePoint on-premises nodes are selected in the Scope pane in step 1. Configure the following advanced settings for retrieving the audit data:
o Retrieve IIS Logs – Check this checkbox to have view item type logs from IIS log retrieved. The retrieved IIS log item information will appear in the report.
*Note: Retrieving IIS logs may slow down the retrieving job performance.
o Log source IP – Check this checkbox to retrieve the information about the source IP of the host who accessed the selected node.
o Retrieve Deleted Site Collection Data (only for web application level) – Check this checkbox to retrieve the auditing data of the deleted Site Collection.
o Delete auditor data in SharePoint older than __ day(s) – Select this checkbox to delete the auditing data in SharePoint that is older than a specified number of days, if you have DocAve auditor configured to collect and retain the data. The default threshold is seven (7) days.
o Track object last accessed time – Select this checkbox to run a separate job that collects data for the Last Accessed Time filter criterion in Archiver and Storage Manager.
How should the schedule be defined? – Specify the type of schedule to retrieve auditing data by choosing one of the following options:
o No Schedule – Retrieve auditing data of this plan manually from Plan Manager.
o Configure the schedule myself – Configure the specific time you want to retrieve the plan’s auditing data. A separate Schedule configuration area appears when you select this option where you can customize the schedule with the following options:
Start time – Select the date and time for the auditing data of this plan to be retrieved.
*Note: The start time cannot be earlier than the current time.
Interval – Enter an integer in the text box and select by Hour(s), Day(s), Week(s), or Month(s). The auditing data of this plan will be retrieved repeatedly based on this schedule. Click Calendar View to see the schedules in a calendar.
Schedule ending – Designate when to stop retrieving the auditing data of this plan. Select No end date for the auditing data of this plan to be retrieved repeatedly until you stop it manually. Select End after ___ occurrence(s) to have the job stopped after the defined occurrences you designate in the text box. Select End by to specify the exact date and time for the auditing data to stop being retrieved.
8. Would you like to notify users of the job status? – Send notifications for the jobs of this plan. Select an existing e-mail notification profile from the drop-down menu, or click New E-mail
50
DocAve 6: Report Center
Notification to create a new one. Refer to the User Notification Settings section in the DocAve 6 Control Panel Reference Guide for more information.
9. Review and edit the configured selections for this plan. Click Finish and choose from the following three options in the drop-down list, or click Cancel to leave this page without saving any of your changes:
Click Finish to save the plan. You can view or manage this plan in Plan Manager.
Click Finish and Apply Rule to save the plan, and then apply the configured auditing rule.
Click Finish and Retrieve Data to save the plan, and then retrieve the auditing data.
Using Plan Manager
Plan Manager provides you with a centralized location to view and edit your previously created audit
plans. In the Audit Controller page of Report Center, click Plan Manager on the ribbon to see a list of
your previously created plans in the Plan Manager viewing pane. To change the number of plans
displayed per page, select the desired number from the Show rows drop-down menu in the lower right-
hand corner. To sort the plans, click on a column heading such as Plan Name, Plan Type, Farm, or Last
Modified Time.
On the bottom message bar, you will see the selection status of the plans. Click Clear Selection on the
message bar to deselect all of the selected checkboxes.
Operations in Plan Manager
You can perform the following actions on your plans with the Plan Manager:
View Details – Select a plan and then click View Details on the ribbon to open the View Details page, which will show the Settings and Audit Rules of the selected plan. Click Edit in View Detail interface to make changes to the plan. When you are finished reviewing the plan, click Close to return to the Plan Manager page.
Edit – Select a plan and then click Edit on the ribbon to open the Form Mode plan editing page. You can make changes to the scope and settings of the selected plan here. To save the plan:
o Click Save and then make a selection from the drop-down list:
Click Save to save any changes made to the plan and return to the Plan Manager page.
Click Save As to save the changes as a new plan. Enter a name for the new plan and then click OK to save the new plan.
Click Save and Apply Rule to save any changes made to the plan and apply the rules of the selected plan.
51
DocAve 6: Report Center
Click Save and Retrieve Data to save any changes made to the plan and retrieve the data from the selected nodes.
o Click Reset to reverse any changes made back to the previously saved settings in any of the fields.
o Click Cancel to close the plan editing page without saving any changes.
Delete – Select a plan and click Delete on the ribbon to delete the plan. A pop-up window appears to confirm that you want to proceed. Click OK to delete the plan or click Cancel.
Apply Rule – Select a plan and then click Apply Rule on the ribbon to apply the rules of the selected plan.
Retrieve Data – Select a plan and then click Retrieve Data on the ribbon to retrieve the data from the selected nodes.
*Note: Prior to retrieving audit data from particular SharePoint nodes, you must enable
the audit settings of the desired nodes.
*Note: The lowest level node that can be retrieved is site collection. If you select a site
or list, data from the corresponding parent site collection will be retrieved.
Job Monitor – Can help you keep track of running reports and scheduled reports. To access the jobs of each module, click Job Monitor on the ribbon. For more information about using Job Monitor, refer to the DocAve 6 Job Monitor User Guide.
When you are finished viewing and editing your plans, click Back on the ribbon to return to the Audit
Controller page. To exit the Audit Controller page, click Back on the ribbon of the Audit Controller
interface to return to the Settings page.
Audit Pruning
Audit Pruning allows you to delete the retrieved SharePoint audit data from the DocAve Auditor
database after a specified amount of time. By creating profiles in Audit Pruning, you can automate the
deletion of outdated audit data. When creating an Audit Pruning profile, you can:
Configure the time range for pruning audit data. The audit data generated within the specified time range will be automatically pruned.
Specify where, at the Web application or site collection level of SharePoint on-premises or at the site collection level of SharePoint Online, to delete audit data.
Choose to delete the data or simply move it to another location.
Set up a schedule in the profile to prune data or run it manually, providing you with more flexibility in the execution of Audit Pruning profiles.
For any profiles you run in Audit Pruning, or any future profiles scheduled to run, you can click Job
Monitor on the ribbon of the Audit Pruning page or Profile Manager page to see its progress or check
52
DocAve 6: Report Center
details about the job. For more information about using Job Monitor, refer to the DocAve 6 Job Monitor
User Guide.
To access functions in Audit Pruning, in the Settings tab of Report Center, click Audit Pruning on the
ribbon to return to the Audit Pruning interface.
Creating a Pruning Profile
Before creating a pruning profile, you can configure export locations, which are used by Report Center
to store the pruned auditing data. For details on how to configure export locations for Report Center,
see the Configuring Export Locations section of the DocAve 6 Control Panel Reference Guide.
To create a pruning profile, complete the following steps:
1. In the Audit Pruning page in the Scope pane, click on the appropriate SharePoint object name and expand the data tree down to the desired object level, or enter a URL/name in the search text box above the tree. Check the checkboxes next to the nodes you want to view.
2. Click New on the ribbon. A pruning profile creation work space will appear next to the Scope pane.
3. Enter a Profile Name for this new pruning profile. Enter an optional Description for future reference.
4. Specify the auditing data you want to prune in under What time range would you like to cover in this pruning profile:
To prune data older than a certain amount of time, select All data older than: and then enter an integer in the text box, and select Hour(s), Day(s), Week(s) or Month(s) from the drop-down menu.
To prune data before a certain date, select All data before: and then click the calendar icon. A calendar will appear at your cursor. Select the desired date and time of day, then click OK.
To prune data between two dates, select All data between, then select the desired date range.
5. Choose what to do with the pruned data in How would you like to deal with the audit data specified above?:
Select Delete Data to delete the specified auditing data.
Select Move data to move the specified auditing data to an export location. You must designate an export location in order to have the data moved; Click the Export Location drop-down menu, select a predefined export location or click New Export Location to create a new export location. If you choose New Export Location in the Export Location drop-down menu, a child window will appears for you to configure the new export location. For the detailed instructions on configuring a new export location, refer to the Creating an Export Location section in this user guide.
53
DocAve 6: Report Center
6. Configure whether or not to run this profile at a scheduled time or manually from Profile Manager:
No Schedule – Select this to run this profile manually from Plan Manager.
Configure the schedule myself – Select this option to configure the specific time you want this profile to run. A schedule configuration area appears. You can customize the schedule with the following options:
o Start time – Select the date and time for this profile to run.
o Interval – Enter an integer into the text box and select by Hour(s), Day(s), Week(s), or Month(s). This profile will run repeatedly based on this schedule. Click Calendar View to see the schedule in a calendar.
o Schedule ending – Designate when to stop running this profile. Select No end date for this profile to run repeatedly until you stop it manually. Select End after ___ occurrence(s) to stop running this profile after the number of occurrences you designate in the text box. Select End by to specify the exact date and time for this profile to stop being run.
7. Would you like to receive e-mail notifications on the status of the pruning job? – Send notifications according to the configurations of this plan. Select an existing e-mail notification profile from the drop-down menu or click New E-mail Notification to create a new one. Refer to the User Notification Settings section in the DocAve 6 Control Panel Reference Guide for more information.
8. When creating an Audit Pruning Profile, you can customize which user to include or exclude, as well as which audit actions to include, when pruning auditing data. Click Advanced Data Selection to access the User Filter and Action Filter.
Would you like to filter any user activity? – By default, Include all users are selected. To specify which users to include, select User(s) to include, then enter the usernames in the text box in the following format: AD User: domain\username and separate each username with a semicolon (;). To specify which users to exclude, select User(s) to exclude, then enter the usernames in the text box in the following format: AD User: domain\username and separate each username with a semicolon (;).
Which audit action would you like to prune? – Check the checkbox for the audit actions that you want to prune.
9. Click Save and Run Now to save the profile and run it immediately, Save to save the profile, or Cancel to return to the Audit Pruning page without saving these configurations.
Using Profile Manager
Profile Manager provides you with a central location to view and edit audit pruning profiles and the
previously run jobs for the profiles. In the Audit Pruning page in Report Center, click Profile Manager on
the ribbon. You will see a list of profiles in the Profile Manager viewing pane. To change the number of
profiles displayed per page, select the desired number from the show rows drop-down menu in the
lower right-hand corner. To sort the profiles, click on a column heading such as Profile Name, Action to
Take, or Last Pruned Time.
54
DocAve 6: Report Center
On the bottom message bar, you will see the selection status of the profiles. Click Clear Selection on the
message bar to deselect all of the selected checkboxes.
Operations in Profile Manager
Once you have configured Profile Manager to display the plans of your choice, you can perform the
following actions on your profiles:
View Details – Select a profile, and then click View Details on the ribbon to open the View Details page to see configurations of the selected profile. You can click Edit in View Detail interface to make changes to the profile. When you are finished reviewing the profile, click Close to return to the Profile Manager page.
View Jobs - Select a profile and click View Jobs to see the jobs that have run for this profile. The View Jobs interface appears, displaying all of the previously run jobs for the selected profile. You can perform the following operations on the jobs:
o Delete – Select the jobs you want to delete and click Delete on the ribbon to delete the jobs. A pop-up window appears to confirm that you want to proceed. Click OK to delete the jobs or click Cancel.
o Restore – Select a job of the Move type and click Restore on the ribbon to restore the data moved to an export location by this job.
*Note: The data deleted by the jobs of the Delete type cannot be restored.
Edit – Select a profile then click Edit on the ribbon to open the profile editing page. Here you can make changes to the configurations of the selected profile.
o To save your configurations of the profiles, click Save and make a selection from the drop-down list:
Click Save to save any changes made to the profile, and return to the Profile Manager page.
Click Save As to save the profile along with any changes made as a new profile. A pop-up window appears for you to input a name for the new profile. Click OK to save the new profile and return to the Profile Manager page.
Click Save and Run Now to save any changes made to the profile, and run a job of this profile immediately.
o If you do not want to save the changes to the profile, click Cancel to close the profile editing page without saving any changes.
Delete – Select a profile and click Delete on the ribbon to delete the profile. A pop-up window appears to confirm that you want to proceed with deleting the selected profile. Click OK to delete the profile or click Cancel to return to the Profile Manager page without deleting the profile.
Run Now – Select a profile and click Run Now to run the selected profile immediately.
55
DocAve 6: Report Center
Job Monitor – You can keep track of running reports and scheduled reports. To access the jobs of each module, click Job Monitor on the ribbon. For more information about using Job Monitor, refer to the DocAve 6 Job Monitor User Guide.
When you are finished viewing and editing your plans, click Back to return to the Audit Controller page.
To exit the Audit Controller page, click Back on the ribbon of the Audit Controller interface to return to
the Settings page.
Manage Feature
Report Center provides you an integrated interface to manage all of the DocAve Report Center features.
You can view and manage the status of the features as well as activate or deactivate the features on the
specified SharePoint site collections.
Navigate to Report Center > Settings > Manage Feature to go to the Manage Feature interface to
activate or deactivate the Report Center Document Auditing and Usage Activity Web Parts features.
Managing the Document Auditing Feature
By deploying the Document Auditing solution (SP2010DocumentAuditing.wsp for SharePoint 2010,
SP2013DocumentAuditing.wsp for SharePoint 2013, and SP2016DocumentAuditing.wsp for SharePoint
2016) on SharePoint farms, Report Center adds the Document Auditing feature into SharePoint site
collections, which allows you to view the audit history of all documents within the site collection. For
detailed information on deploying and using the Document Auditing feature in SharePoint, refer to
Document Auditing Feature.
After the Document Auditing solution is deployed on your SharePoint farm, you can activate the feature
in SharePoint site collections or through the Manage Feature interface. To activate the feature in
SharePoint, refer to Activating Document Auditing Feature. In Manage Feature, you can activate or
deactivate the feature on site collections and configure the advanced settings for the activation of the
feature in SharePoint site collections. To manage the Document Auditing Feature through Manage
Feature, complete the following steps:
1. In the Manage Feature interface, click Document Auditing on the ribbon.
2. In the interface for managing the Document Auditing feature interface you can perform the following operations:
Advanced Settings – Advanced settings will affect the activation of the Document Auditing feature in SharePoint site collections. To configure the Advanced Settings for a farm, select the checkbox next to the farms and click Advanced Settings on the ribbon. The Advanced Settings interface appears. Configure the following settings:
o Password – Check the Enable Password checkbox and enter the password in the Feature activation password and Confirm password text boxes. You will be asked to enter this password when activating the AvePoint Document Auditing feature for a specified site collection in SharePoint.
56
DocAve 6: Report Center
o Legal Terms – Enter your legal terms for managing this feature. The legal terms will be displayed when activating the AvePoint Document Auditing feature for a specified site collection in SharePoint. The users must agree with the legal terms before they activate this feature.
o Advanced Settings – Configure the Advanced Settings to be used when activating the feature. If you select the Check style checkbox, the auditing data of the site collections in SharePoint 2007 style will not be collected. If you select the Check site collection size checkbox, enter an integer in the text box and select MB or GB to set up the maximum site collection size.
*Note: If the site collection where you want to activate the feature is beyond
the configured size limitation, this feature will fail to activate.
Activate – Expand the tree to load the site collection level and activate the Document Auditing feature on site collections via the following methods:
o Click Activate in the Actions column besides the site collection where you want to activate the Document Auditing feature.
o Select multiple site collections or check the Select All checkbox under one Web application where you want to activate the Document Auditing feature and click Activate on the ribbon to operate the status of this feature in bulk.
After the feature is activated on a site collection, the Status of the site collection
becomes Active.
Deactivate – Expand the tree to load the site collection level and then you can deactivate the Document Auditing feature on site collections through the following methods:
o Click Deactivate in the Actions column besides the site collection where you want to deactivate the Document Auditing feature.
o Select multiple site collections or check Select All checkbox under one Web application where you want to deactivate the Document Auditing feature and click Deactivate on the ribbon to operate the status of this feature in bulk.
After the feature is deactivated on a site collection, the Status of the site collection
becomes Inactive.
Managing the Usage Activity Web Parts Feature
By deploying the Usage Activity Web Parts solution (SP2010UsageActivityWebParts.wsp for SharePoint
2010, SP2013UsageActivityWebParts.wsp for SharePoint 2013, and SP2016UsageActivityWebParts.wsp
for SharePoint 2016) on SharePoint farms, Report Center adds the Usage Activity Web Parts feature
into SharePoint site collections. The Usage Activity Web Parts allow for the creation of social Web parts
that rank popular documents, discussions, blog posts, wiki pages, and content contributors, as well as a
dashboard Web part that displays usage analytics reports. For detailed information about deploying and
using the Usage Activity Web Parts feature in SharePoint, refer to Usage Activity Web Parts Feature.
57
DocAve 6: Report Center
After the Usage Activity Web Parts solution is deployed on your SharePoint farm, you can activate the
feature in SharePoint site collections or through Manage Feature. To activate the feature in SharePoint,
refer to Activating the Usage Activity Web Parts Feature. To activate or deactivate the Usage Activity
Web Parts feature in Manage Feature, complete the following steps:
1. In the Manage Feature interface, click Usage Activity Web Parts on the ribbon.
2. In the interface for managing the Usage Activity Web Parts feature, expand the tree to the site collection level and then you can activate or deactivate the feature on site collections:
Activate – Click Activate in the Actions column next to the site collection where you want to activate the feature. You can also select multiple site collections or check Select All checkbox under the Web application and click Activate on the ribbon to operate the status of this feature in bulk.
After the feature is activated on a site collection, the Status of the site collection
becomes Active.
Deactivate – Click Deactivate in the Actions column besides the site collection where you want to deactivate the feature. You can also select multiple site collections or check Select All checkbox under the Web application, and then click Deactivate on the ribbon to change the status of this feature in bulk.
After the feature is deactivated on a site collection, the Status of the site collection becomes Inactive.
Export Location
Export Location in Report Center allows you to store reports in a designated storage device through a
universal naming convention (UNC) path or in a specified SharePoint document library. Export locations
are also used to store pruned auditing data under a desired universal naming convention (UNC) path.
To configure export locations, click Export Locations on the ribbon in the Settings tab of Report Center.
*Note: SharePoint Foundation users are unable to export reports from the web part. This is because the
functionality is not supported by SharePoint natively.
Creating an Export Location
In the Export Location interface in Report Center, click Create on the ribbon, then configure the
following settings:
1. Name and Description – Enter a Name for the new export location. Then enter an optional Description for future reference.
2. Location Type – Specify the type of the export location you want to create from the drop-down menu.
UNC Path – To use a net share location as the export location, select UNC Path from the drop-down menu. The Path configuration area appears. Enter the UNC path for this
58
DocAve 6: Report Center
export location and select a previously created managed account from the drop-down list or create a new one to retrieve the account credentials to access this path. For more information on configuring a managed account, refer to DocAve 6 Control Panel Reference Guide. Click Validation Test to check that the entered information is correct. Click Save to save these configurations, or click Cancel to close the New Export Location configuration interface without saving any changes.
SharePoint Document Library – To use document libraries in SharePoint on-premises or SharePoint Online as the export location, select SharePoint Document Library from the drop-down menu. The SharePoint Document Library configuration area appears. Complete the following steps:
i. Choose one of the following options:
Check the Specify a Document library checkbox to select the farm or My Registered Sites, and enter the site URL and library name where you want to store the exported report files.
Check the Each site in selected scope checkbox to store the report about each site to the document library of each site accordingly. Enter the document library name you want to use to store the exported report files in the text box; you can also use the default name: DocAve Report Center Reports. The specified library will be created in each site in the selected scope.
*Note: This configuration is only effective when you select site
collection level nodes or site level nodes to perform the reports’ offline
export.
ii. Rules – Choose one of the following actions to perform when exporting the
report to the document library which already contains an exported report file:
Select Overwrite Previous Reports from the drop-down menu to overwrite the previously generated report file stored in the library.
Select Create a New Report File to create a new one. If you choose to create a new report file, the most recent report file will be appended with a time stamp and the new report file will be created with the specified name.
iii. File Name – Designate the exported report file name. By default, the report file
will be named based on the report type; for example, the latest exported
content type usage report will use the name Content_Type_Usage.XLSX. To
specify the file name manually, check the Specify the file name radio button,
and then enter a name in the text box.
Physical Device – To use a physical device as the export location, select Physical Device and then configure the following settings:
i. Storage Type – Select the storage type of the physical device that you want to
use as the export location from the drop-down list. The previously configured
59
DocAve 6: Report Center
physical devices of the selected storage type will be automatically loaded in the
Physical Device drop-down list below.
ii. Physical Device – Select a previously created physical device from the drop-
down list as the export location. To create a new physical device, select New
Physical Device. For more information on creating a new physical device, refer
to the DocAve 6 Control Panel Reference Guide.
iii. Folder – Choose to export reports to a specific folder in the physical device or
exports reports to the root folder of the physical device.
To export reports to a specific folder under the selected physical device, select Specify a folder and then enter the desired folder name. If the entered folder does not exists, the folder will be automatically created under the physical device when report is exported to this new export location for the first time.
To export all of the reports to the root folder of the physical device, deselect Specify a folder.
3. When you have finished, click Save to save these configurations, or click Cancel to close the New Export Location configuration interface without saving any changes.
Managing Export Locations
In Report Center, click the Settings tab, then click Export Location on the ribbon. The Export Location
page appears with a list of your previously configured export locations.
To change the number of export locations displayed per page, select the desired number from the Show
rows drop-down menu in the lower right-hand corner. To sort the export locations, click on a column
heading such as Location Name or Location Type.
On the bottom message bar, you will see the selection status of the export locations. Click Clear
Selection on the message bar to deselect all of the selected checkboxes.
You can perform the following actions to the export locations:
Create – Click Create on the ribbon to create a new export location. For detailed on creating a new export location, see the Creating an Export Location section in this guide.
View – Click View on the ribbon to open the View Details interface to view the detailed configuration of the selected export location. If you want to make any changes, click Edit on the ribbon. Click Save to save the changes, or click Cancel to go back without saving any changes.
Edit –Select the export location, and then click Edit on the ribbon to open the Edit Export Location Interface. Make the necessary changes, and then click Save to save the changes, or click Cancel to close the Edit Export Location configuration interface without saving any changes.
60
DocAve 6: Report Center
Delete – Click Delete on the ribbon. A confirmation window pops up and asks if you are sure you want to proceed with the deletion. Click OK to delete the selected export locations, or click Cancel to return to the Export Location interface without deleting the selected export locations.
To exit the Export Location page, click Back on the ribbon to return to the Settings tab.
Shared Location
Shared Location allows you to configure a location for storing the shared files of Report Center via a
Universal Naming Convention (UNC) path. With a configured shared location, the files that are uploaded
during the configuration of Usage Pattern Alerting custom action profiles will be stored in this shared
location and can be shared by all of the Report services within your DocAve system. Report Center
Shared files include .exe application files and PowerShell scripts uploaded while configuring Usage
Pattern Alerting custom action profiles. For detailed on uploading shared files, refer to Creating a
Custom Action Profile.
If you do not configure a shared location, an uploaded file will be stored in the default location
(…\AvePoint\DocAve6\Manager\Report\SharedLocation) on the server containing the Report service
that is used for configuring the custom action profile, therefore, the uploaded file cannot be shared by
multiple Report services.
*Note: If you have multiple Report services in your DocAve system and you want to use the Run .exe file
or Run a PowerShell script features in Usage Pattern Alerting custom action profiles, you must configure
a shared location.
To configure a shared location, complete the following steps:
1. Navigate to Report Center > Settings > Shared Location. The Shared Location interface appears.
2. Select the Use the UNC path as the shared location checkbox.
3. Configure the UNC Path by entering the UNC path to the location where you want to store the shared files of Report Center.
4. Select a managed account profile – Select a managed account profile from the drop-down menu to specify the credentials for accessing the entered UNC path. Click Validation Test to check that the entered information is correct.
5. Click Save to save the configuration.
Scope Filter
Scope Filter allows you to set up filter rules to filter SharePoint objects at site collection/site/list/library
level within the selected scopes of Usage Reports, Usage Pattern Alerting, Configuration Reports, and
Auditor Reports, so that you can target objects more precisely. By setting up scope filters, apply the
same filter policies to different plans/profiles without having to recreate them each time.
61
DocAve 6: Report Center
To configure scope filters, click Scope Filter on the ribbon in the Settings tab of Report Center.
In the viewing pane, you can view a list of all previously created scope filters. See the sections below to
configure a scope filter and manage scope filters.
Managing Scope Filters
In Scope Filter, you can perform the following operations to create new or manage existing scope filters:
Create – Click Create on the ribbon to create a new scope filter. For details on creating a new scope filter, see Configuring a Scope Filter.
View – To view the detailed configuration of a scope filter, select the corresponding checkbox in the viewing pane and then click View on the ribbon to access the View Details interface. If you want to make any changes to the scope filter, click Edit on the ribbon to access the Edit Scope Filter interface. For details on editing a scope filter, see Configuring a Scope Filter.
Edit – To edit a previously created scope filter, select the corresponding checkbox in the viewing pane, and then click Edit on the ribbon to access the Edit Scope Filter Interface. For details on editing a scope filter, see Configuring a Scope Filter.
Delete – To delete specific scope filters, select the corresponding checkboxes in the viewing pane and click Delete on the ribbon. A confirmation window pops up and asks if you are sure you want to proceed with the deletion. Click OK to delete the selected scope filters, or click Cancel to return to the Scope Filter interface without deleting the selected scope filters.
To exit the Scope Filter page, click Back on the ribbon to return to the Settings tab.
Configuring a Scope Filter
To create a new scope filter, click Create on the ribbon. To modify a previously configured scope filter,
select the scope filter and then click Edit on the ribbon. In the Create Scope Filter or Edit Scope Filter
interface, configure the following settings:
1. In the Name and Description text boxes, enter a name and an optional description for the scope filter you are about to create.
2. Configure the criteria of this scope filter by completing the following steps:
a. Click Add a Filter Level Group to add a new rule of the specified level and then click Add
a Criterion to add criteria for the new rule by completing the fields below, or click to
delete the rule that is no longer needed.
o Rule – Select the new rule you want to create from the drop-down list. Each level has a unique set of rules that can be applied to enhance configurations. Refer to Appendix E: Examples of Scope Filters for examples of filter policies that users can configure.
o Condition – Select the condition for the rule.
62
DocAve 6: Report Center
o Value – Enter a value you want the rule to use in the text box.
b. To add more filters to the scope filter, repeat step a, above.
o If two or more rules are configured, configure the logical relationships between the filter rules. There are currently two logical relationships: And and Or. The default logical relationship is And. To change the logical relationship between the rules, click on the links in the And/Or column.
And – Objects that meet all of the rules will be filtered and included in the results.
Or – Objects that meet any one of the rules will be filtered and included in the results.
*Note: And and Or are available choices for the logical relationship between
filter rules of the same level. The logical relationship between filter rules of
different levels can only be And. For example, the logical relationship between
two filter rules of the Site level can be And or Or. The logical relationship
between the filter rules of the Site level and the rules of the Site Collection level
can only be And.
o In the Basic Filter Condition section, you can view the logical relationship of the filter rules.
For example: if the logical relationship is “(Filter 1 Or Filter 2) And Filter 3” in the Basic Filter
Condition area, the objects that meet either of the Filter 1 and Filter 2 rules and meet the Filter
3 rule will be included in the result.
3. Click Save to save the configurations and return to the Scope Filter interface, or click Cancel to return to the Scope Filter interface without saving the configurations.
Item Caching Service
Using the Item Caching Service, you can configure the database to store the data collected on the
column types within the SharePoint Web applications or site collections. .
Configuring an Item Caching Database
To configure a dedicated Item Caching Database to store the data collected via the Item Caching Service
Collector, complete the following steps:
1. Navigate to DocAve 6 > Report Center > Settings. Click Item Caching Service. The Item Caching Service interface appears.
2. Click Item Caching Database on the ribbon. The Item Caching Database window appears.
3. Configure the following settings for the Item Caching Database:
63
DocAve 6: Report Center
Configure the Item Caching Database – Report Center supplies a default Database Server and Database Name. The database server of the DocAve 6 Control database is automatically set as the default database server for the Item Caching Database. If desired, enter a new database server and database name in the corresponding fields. If the database does not exist, DocAve will create a new database using the specified name. However, AvePoint recommends that you use the default database server for most instances.
Authentication – Select the authentication mode, database credentials and an optional failover database server for the Item Caching Database:
o Select the Windows Authentication or SQL Authentication mode for the database and enter the database credential for the selected authentication mode. After this, you can validate the specified account by clicking Validation Test.
Windows Authentication (recommended) – Use this method if you want the user’s identity to be confirmed by Windows. Select a previously configured account from the Select a managed account profile drop-down list, or click New Managed Account Profile to create a new managed account profile in Control Panel. For more information on configuring a managed account profile, refer to the DocAve 6 Control Panel Reference Guide.
SQL Authentication – SQL Server will confirm the user’s identity according to the user’s account and password.
*Note: The account for creating or accessing the Item Caching Database must
be the db_creator in the SQL server where you want to create the Item Caching
Database and the db_owner in the newly created/existing Item Caching
Database.
o Failover Database Server – Optionally select this checkbox and enter a failover database server. In the event that the Item Caching Database collapses, the data stored in the Item Caching Database can be transferred to this standby database.
4. Click OK to save the configurations.
Using the Item Caching Service Scope Settings interface
The Item Caching Service Scope Settings interface is used to configure the scope settings for the Item
Caching Service Collector, to select the column values to collect within the Web applications and site
collections.
To access the Item Caching Service Scope Settings, Navigate to DocAve 6 > Report Center > Settings >
Item Caching Service > Item Caching Service Scope Settings. In the Item Caching Service Scope Settings
interface, expand the Scope tree to the Web application or site collection level to view the scope
settings on each node.
64
DocAve 6: Report Center
Status – This column displays whether you have configured which columns to collect values from the node. If you have selected which column values to collect from a node, its Status is Configured.
Inherited Column Settings? – This column displays whether the site collection node is inheriting column settings from its parent Web application node. Yes represents that the site collection is inheriting the column settings from its parent node. No represents that the site collection has unique column settings.
You can perform the following operation in the Item Caching Service Scope Settings interface:
Configure – To configure the values of which columns you want to collect via the Item Caching Service Collector, follow the instructions in Configuring Item Caching Service Scope Settings.
Clear All – To clear all of the previously configured Item Caching Service scope settings in all of the nodes within your SharePoint environment, click Clear All and click OK in the confirmation window.
Collect Now –To collect data on the selected scope, click Collect Now. You can choose to run a Full Collection job or an Incremental Collection job. Full Collection is to collect all of the data under the selected scope. Incremental Collection only collects data generated between since the last incremental job.
Job Monitor –Click Job Monitor on the ribbon of the Item Caching Service Scope Setting page to see the job’s progress or check the details of the jobs. For more information about using Job Monitor, refer to the DocAve 6 Job Monitor User Guide.
Back – To return to the Item Caching Service interface, click Back.
Configuring Item Caching Service Scope Settings
To configure the Item Caching Service Scope Settings for the Item Caching Service Collector, select the
column values to collect within the Web applications and site collections, by completing the following
steps:
1. In the Scope pane of the Item Caching Service Scope Settings interface, expand the farm name and expand the data tree to the desired Web applications or site collections, or enter the keyword for the desired URL or object name in the search text box above the farm name.
To configure the scope settings for multiple nodes in bulk, select the checkboxes of the desired nodes and click Configure on the ribbon. The Item Caching Service Scope Settings interface for the selected nodes appears.
To configure the scope settings for an individual node, hover over the URL of the desired node and click the Configure button next to the URL. The Item Caching Service Scope Settings interface for the selected node appears.
2. Configure the following settings in the Item Caching Service Scope Settings interface:
65
DocAve 6: Report Center
Inheritance Settings – This section is only available when site collection nodes are selected in the Scope pane in step 3. Use this section to inherit the column setting from the parent nodes or configure unique settings.
o Inherit column settings from the parent node – To enforce that the selected site collection nodes inherit the column settings from their parent nodes, select this option. The Column Settings section below will become disabled.
o Configure unique column settings – To configure unique column settings for the selected site collection nodes, select this option and then configure the Column Settings section below.
Column Settings – This section is available when the selected nodes in step 3 are Web applications nodes or site collection nodes for which the Configure unique column settings option is selected above. Use this section to select the columns whose values you want to collect from the selected nodes.
o To collect the values of a desired column, click Add a Row below the table on the right, enter the Column Name, and select the Column Type in the table.
o Not to collect the values of a desired column which has been added to the table,
click the Remove ( ) button for this column in the table, or select the checkbox for the column and click Delete the Selected Rows.
o To collect values of the columns that are recommended by DocAve from the selected nodes, select Include the recommended columns. The recommended columns are Created, Created By, Modified, and Modified By.
3. Click Save to save the configurations or click Cancel to cancel the changes and exit the current page.
After the configured column settings for the selected nodes are saved, the Item Caching Service
Collector will run collection jobs on these nodes as the schedule configured in Data Collection. For
detailed instructions on configuring the schedule for the Item Caching Service Collector, refer to Data
Collection.
Usage Activity Web Parts Settings
The Usage Activity Web Parts Setting allows you to configure whether or not to cache the data displayed
in Web parts and configure the cache expiration date, and set up the filter to collect the data for the
Usage Activity Web parts.
To configure the Usage Activity Web Parts Settings, follow the instructions below:
1. Navigate to Report Center > Settings. Click Usage Activity Web Parts Setting. The Usage Activity Web Parts Settings window appears.
2. Would you like to cache the stored data? – Choose whether or not to store the data displayed on Web parts into cache and configure when the cache expires. Select the Enable Caching option to enable the cache setting, and then specify when to expire the cache. Enter a number
66
DocAve 6: Report Center
into the text box behind Cache expires in:, and select Minutes or Hours from the drop-down list. The data will be removed from cache after being stored for the specified time. The Web parts will receive the data from the Report database and store the newly obtained data into the cache again.
3. Would you like to filter the data to be displayed? – Choose whether or not to set up filters for filtering the collected data on the Web parts. Select the Enable Filters option to add filters into the Data Filters field.
4. Data Filter – The default filters are provided. You can change or delete them as desired. Click
Add a Criterion to add criteria for the new rule by completing the fields below, or click to delete the rule that is no longer needed.
Rule – Select the new rule you want to create from the drop-down list. Each level has a unique set of rules that can be applied to enhance configurations.
Condition – Select the condition for the rule.
Value – Enter a value you want the rule to use in the text box.
To add more filters to the scope filter, repeat the step above.
5. If two or more rules are configured, configure the logical relationships between the filter rules. There are currently two logical relationships: And and Or. The default logical relationship is And. To change the logical relationship between the rules, click on the links in the And/Or column.
And – Objects that meet all of the rules will be filtered and included in the results.
Or – Objects that meet any one of the rules will be filtered and included in the results.
*Note: And and Or are available choices for the logical relationship between filter rules
of the same level. The logical relationship between the filter rules of the different levels
can only be And.
6. Click Save to save the configurations; click Cancel to go back to the Settings interface without saving any changes.

67
DocAve 6: Report Center
Working with Reports
Report Center allows you to perform a number of actions to reports. You can run a customized report
immediately, save customized report profiles to run at a later time, view the previous report generated,
and export reports to datasheets or screenshots.
The following sections explain how to work with reports. These actions can be found in the Report
Actions toolbar on the ribbon of each tab in Report Center.
Run Report
After configuring the scopes for a report in any of the Report Center modules, click Run Report on the
ribbon or at the bottom of the window, and then select Run Report Only or Save and Run Report from
the drop-down menu to collect the data and generate the report. The report will appear in the Report
Display pane. Clicking Save and Run Report will save the configured profile.
Show Report
After configuring the scopes for a report in any of the Report Center modules, click Show Report on the
ribbon to generate the report. The report will appear in the Report Display pane.
If you select a previously saved profile whose data has been collected according to the profile’s settings,
click Show Report on the ribbon or at the lower left section. The report will appear in the Report Display
pane to display the previously collected data.
Having the report in the display panel allows you to remain on the DocAve interface rather than having
to open the datasheet or screenshot.
Export Report
Report Center allows you to export reports you create to datasheets, or as a screenshot. By exporting to
a datasheet, the report can be saved locally or to a specified location. The datasheet can be exported in
the following formats:
CSV
MHTML
TIF
XLS
XML
68
DocAve 6: Report Center
XLSX
By exporting the report as a screenshot, the report can be printed right from within the DocAve
interface, or saved as an image on your local storage device.
Exporting to a Datasheet
In DocAve 6, Report Center supports report exports in CSV and XLSX format without the connection to
the SQL Reporting Service. Additionally, Compliance Reports support exports of CSV/PDF/XLSX reports
without connection to the SQL Reporting Service.
If you want to export a report in additional formats, the Reporting Service must be configured in Report
Settings. For instructions on configuring Reporting Service, see the Reporting Service section.
To export a report after it has been generated, complete the following steps:
1. With the report displayed in the Report Display pane, click Export Now in the Report Actions group on the ribbon, and then select Export to Datasheet. The Export to Datasheet window appears. Complete the following steps to generate the report:
Report Format – Select the desired report format from the drop-down menu.
Export Settings – Choose whether to export the report now. Check the Export to local immediately checkbox and click OK to export the report immediately, or check the Export to a different location checkbox, and then configure the following settings:
o Export Location – Select one previously configured export location from the drop-down menu, or if you want to configure a new export location, click New Export Location then follow the instructions provided in the Export Location section of this guide.
o Notification – Check the Send Notification checkbox and select the Recipient of this notification. You can select a previously configured e-mail notification profile and click View to access detailed information, or click New E-mail Notification to create a new e-mail notification profile. For details on creating an e-mail notification profile, see the User Notification Settings section in the DocAve 6 Control Panel Reference Guide. You can choose to have the report included in the e-mail as an attachment by checking the Attach report to the e-mail when the size of the report is less than … checkbox, and then enter the maximum size of the report allowed in the less than __ MB text box.
2. Click OK to export the report based on these configurations.
*Note: Certain types of reports have additional configurable settings for exporting to datasheet.
Detailed instructions on these settings are provided in the sections for the corresponding reports.
69
DocAve 6: Report Center
Exporting as a Screenshot
To output a screenshot of the report, please refer to the following steps:
1. With the report displayed in the Report Display pane, click Export Now on the ribbon. A drop-down menu appears.
2. Click Output Screenshot. A window appears with a preview of the screenshot.
3. Click Print, to print the screenshot, or click Export to save the screenshot as an image to your local storage device.
Click Close once you are done printing or saving the screenshot. This closes the screenshot preview popup window.
Auditor Database
Since there is no default threshold for the size of an MS SQL type Auditor Database, you can configure a
threshold for the Auditor Database size by completing the following steps:
*Note: The default threshold for the size of a Build-in type Auditor Database is 9 GB and cannot be
changed.
1. Navigate to the …\AvePoint\DocAve6\Manager\Report\bin\ directory on the DocAve Manager server.
2. Open the ReportCenterServiceProperties.config file.
3. Locate the <AuditorDatabaseSize> node; its default value is -1.
4. Change the value of this node to your desired threshold.
*Note: The threshold is calculated in MB and value of the threshold must be a positive integer.
5. Save your changes and close the file.
If this threshold is reached and if Report Service has the proper permissions to create databases, a new
Auditor Database will be created automatically. If Report Service does not have the right permissions,
you must create databases manually according to the following naming format:
docave6_auditordb, docave6_auditordb_001, docave6_auditordb_002 …
*Note: If you update your DocAve platform to DocAve 6 Service Pack 5 from a previous version, the
threshold of the Auditor Database size depends on the threshold before the update:
If you have customized the threshold of the Auditor Database size before the update, the threshold will remain the same after the update.
If you keep the default threshold of the Auditor Database size before the update, there will no default threshold for the Auditor Database size after the update.
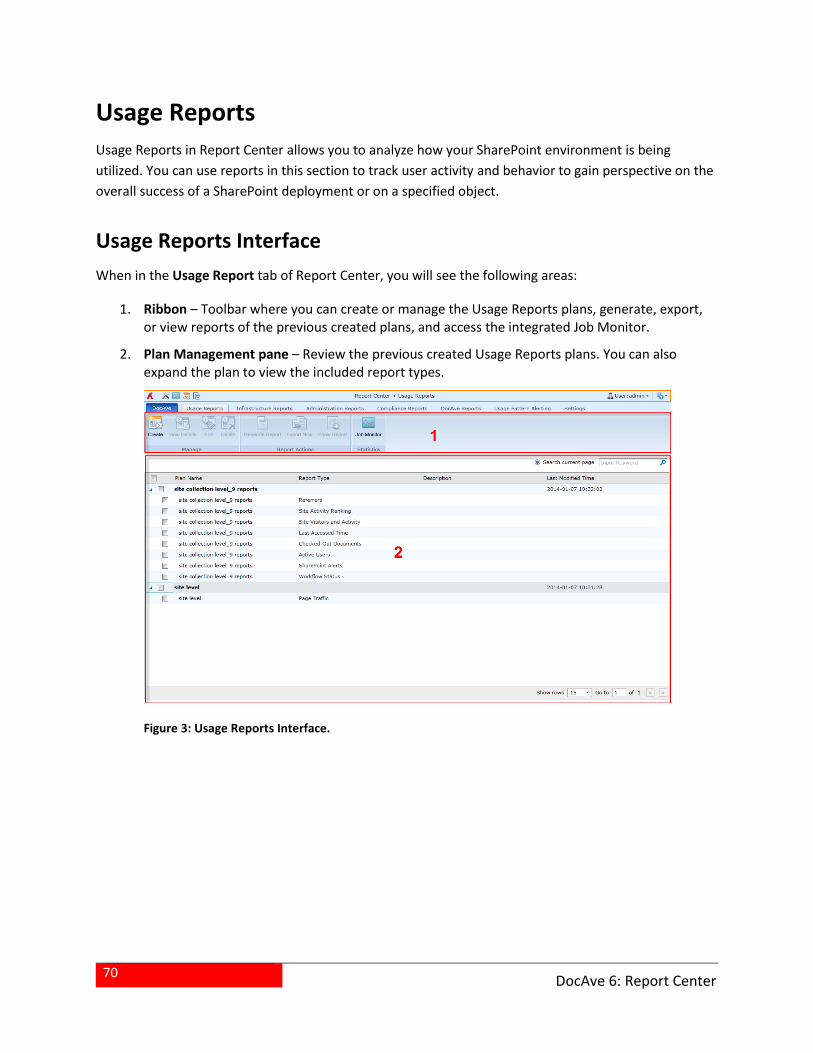
70
DocAve 6: Report Center
Usage Reports
Usage Reports in Report Center allows you to analyze how your SharePoint environment is being
utilized. You can use reports in this section to track user activity and behavior to gain perspective on the
overall success of a SharePoint deployment or on a specified object.
Usage Reports Interface
When in the Usage Report tab of Report Center, you will see the following areas:
1. Ribbon – Toolbar where you can create or manage the Usage Reports plans, generate, export, or view reports of the previous created plans, and access the integrated Job Monitor.
2. Plan Management pane – Review the previous created Usage Reports plans. You can also expand the plan to view the included report types.
Figure 3: Usage Reports Interface.
71
DocAve 6: Report Center
Creating a Usage Reports Plan
Prior to generating usage reports, you must configure Usage Reports plans which include the desired
reporting scope, report types, and other settings for generating reports. To create a Usage Reports plan,
navigate to Report Center > Usage Reports, click Create on the ribbon, and then complete the following
steps on the Create Plan tab:
1. Report Scope and Type Selection – Select the scope and report types for the plan you are about to create.
a. In the left pane, specify desired scope for this plan to generate reports in the following
methods:
o Select the scope on the tree – With this option selected, specify the desired scope by clicking on object names to expand the data tree or entering a URL or object name in the search text box above the tree. To narrow down the search criteria and display fewer nodes under a particular farm/Web application level node, a Sites node, or a Lists node on the tree, right-click the node and select Advanced Search to access the Advanced Search interface. For detailed instructions on using the Advanced Search feature, refer to Searching Nodes Using the Advanced Search Feature.
o Manually input URLs – To create a plan for showing Site Visitors and Activity reports of specified URLs, select this option, and then select a farm from the Farm drop-down menu. Enter the Site Collection URL and Item URL in the URL text boxes. To add more URLs, click Add Another URL.
b. At which level would you like to generate reports? – If you selected Web
application/site collection/site level nodes on the tree, select the desired scope level for
reporting by selecting the corresponding radio button. If the option for all current and
new objects within is selected, then newly created objects under the selected nodes will
automatically be included in the plan for future reports.
*Note: If you select a farm node or list level nodes on the tree, the selected farm or list
level nodes are automatically set as the reporting scope and cannot be changed.
c. Would you like to filter objects within the selected scope? – To filter SharePoint
objects you would like to include in this plan within the selected scope, select a
previously created scope filter from the drop-down list. To create a new scope filter,
click New Scope Filter. For details on creating a scope filter, refer to Configuring a Scope
Filter.
d. Which report types would you like to include in this plan? – Select the desired report
types for this plan. Report Center automatically loads the supported report types based
on the configured report scope and report levels. To get an example of a particular
report type, click the corresponding report type name or the button next to it.
72
DocAve 6: Report Center
2. Basic Settings – Enter the plan name, description, and the required settings for the selected report types.
What would you like to name this plan? – Enter a name and an optional description for the plan you are about to create.
Would you like to enable the Collectors for retrieving data on schedule?– This section is available when you select one or more of the following report types in step 1: Search Usage, Site Visitors and Activity, Checked-Out Documents, Page Traffic, Referrers, Failed Login Attempts, Download Ranking, Site Activity Ranking, and Active Users. In this section, specify whether to enable the Collector for the reports whose data are collected via Collector jobs.
o If you select the Enable Collector checkbox, the Collectors retrieve the data according to the schedule configured in Data Collection. By default, the collector schedule is enabled and each Collector collects data once a day.
o To disable the collector schedule, uncheck the Enable Collector checkbox. The status of the collector will change to Disabled, and DocAve will not collect the information according to the schedule.
Click Data Collection to jump to the Data Collection page. For more information about
Collector, refer to the Data Collection section of this guide.
*Note: If you select Site Visitors and Activity, Site Activity Ranking, or Active Users in
step 1, DocAve will automatically enable SharePoint Auditor for the site collections in
this plan’s scope since these reports use the Usage Collector to collect SharePoint audit
data. If you decide to disable SharePoint Auditor in the future, go to Data Collection to
edit the Enable SharePoint Auditor settings for Usage Collector to stop Report Center
re-enabling it.
If you select Search Usage or Referrers in step 1, the Web Analytic service in SharePoint
must be started to ensure the Search Usage Collector job can retrieve the required data.
Would you like to filter any user activity? –This section is available when you select one or more report types of the following report types in step 1: Site Visitors and Activity, Last Accessed Time, Failed Login Attempts, Workflow Status, SharePoint Alerts, Site Activity Ranking, and Active Users. In this section, specify the user whose activity you want to include in, or exclude from, the reports.
o Include All Users – By default this option is selected. The activities of all users can be viewed.
o Users to Include – Enter the users whose activity you want to view. Click the
check names ( ) button to check the name you entered, or click the browse (
) button to find the users you want to include.
o Users to Exclude – Enter the users whose activity you do not wish to view. Click
the check names ( ) button to check the name you entered, or click the
browse ( ) button to find the users you want to exclude.
73
DocAve 6: Report Center
What time range would you like to cover in the Last Accessed Time Report – This section is available when you select the Last Accessed Time report in the Report Scope and Type Selection step of this wizard. Choose one of the following options:
o Duration – Check the Duration checkbox, and then select the desired time range from the drop-down menu. There are eight durations available: This Month, Last Month, Last 2 Months, This Week, Last Week, Last 2 Weeks, Today, and Yesterday.
o Custom – Check the Custom checkbox to designate the time frame for collecting the data.
3. Advanced Settings – Configure the settings for exporting and sending usage alerts for the selected reports.
Would you like to export reports for this plan? – Select whether to export reports for this plan by selecting the corresponding radio button.
o When you select Yes, the Export Report Settings and Export Schedule sections are displayed below. Configure the settings and schedule for exporting reports and Report Center will export reports for this plan based on these configurations.
o If you do not want to configure a schedule for this plan, select No. The Export Report Settings and Export Report Schedule sections will not appear. You must collect data and export reports of this plan manually.
How would you like to export the reports? –Specify the common settings for exporting each report in this plan and advanced settings for exporting certain reports in this plan.
o Common Settings – Specify the following common settings for exporting each report.
Report Format – Select the desired report format from the drop-down menu.
Export Location – Select one previously configured export location from the drop-down menu, or if you want to configure a new export location, click New Export Location and refer to Export Location for instructions.
Export the PivotChart – Select this option to export PivotChart of this report in XLSX format.
*Note: This option is only available when the Report Format is XLSX,
and the report types are Active Users, Checked-Out Documents, Failed
Login Attempts, Page Traffic, and Site Visitors and Activity.
Send Notification – To send an e-mail notification of the export report jobs, check the Send Notification checkbox and select the Recipient of this notification. You can select a previously configured e-mail notification profile, and then click View to access detailed information. Or, click New E-mail Notification to create a new e-mail notification profile. For details on creating an e-mail notification profile, see the
74
DocAve 6: Report Center
User Notification Settings section in the DocAve 6 Control Panel Reference Guide. You can choose to have the report included in the e-mail as an attachment by checking the Attach report to the e-mail when the size of the report is less than … checkbox, and then enter the maximum size of the report allowed in the less than __ MB text box.
o Advanced Settings – Specify the advanced settings for certain reports in this plan.
Date Range – The Date Range configuration area is available when one or more of the following report types are selected in step 1: Search Usage, Site Visitors and Activity, Checked-Out Documents, Page Traffic, Referrers, Failed Login Attempts, Download Ranking, Site Activity Ranking, and Active Users. In this area, choose one of the following options:
Select a predefined time range by clicking the Duration radio button and selecting the desired time range from the drop-down list. There are eight durations available: This Month, Last Month, Last 2 Months, This Week, Last Week, Last 2 Weeks, Today, and Yesterday.
Choose to customize a start date by clicking the Starting Date radio button and selecting the desired date using the calendar.
Frequency – This field is only available when the Page Traffic and/or Site Visitors and Activity reports are selected in step 1. Select an interval in which the data in the exported report is displayed.
Automatically – With this option selected, the system will automatically choose an interval from Daily, Weekly, and Monthly options according to the configured Date Range.
*Note: If the date range is within 14 days, the system will automatically choose Daily as an interval; If the date range is more than 14 days and within 60 days, the system will automatically choose Weekly as an interval; If the date range is more than 60 days, the system will automatically choose Monthly as an interval.
Specific Settings – In this configuration area, configure each specific setting for certain reports in this plan. For detailed information on configuring these settings, refer to Configuring Specific Export Report Settings.
Would you like to configure a schedule for exporting the reports? – Specify the schedule for exporting the reports in this plan. In this configuration area, choose one of the following options:
o No Schedule – Select this option if you do not want to configure a schedule for this plan. If you choose this option, you must generate reports manually.
75
DocAve 6: Report Center
o Configure the schedule myself – Select this option to configure the specific time you want to export reports of this plan. A schedule configuration area appears. Customize the schedule with the following options:
Start time – Select the date and time when to start exporting reports of this plan.
*Note: The start time cannot be earlier than the current time.
Interval – Enter an integer into the text box and select by Hour(s), Day(s), Week(s), or Month(s). The reports will be exported repeatedly based on this schedule. Click Calendar View to see the schedules in a calendar.
Schedule ending– Designate when to stop exporting reports of this plan. Select No end date for the reports of this plan to be exported repeatedly until you stop it manually. Select End after ___ occurrence(s) to have the job stopped after the defined occurrences that you configured in the text box. Select End by Date + Time to specify the exact date and time to stop exporting the reports of this plan.
Would you like to receive e-mail alerts for specific reports? – This configuration area is available, when one or more of the following report types are selected in step 1: Site Visitors and Activity, Checked-Out Documents, Page Traffic, Failed Login Attempts, Workflow Status, and Active Users. In this area, select the checkboxes for the desired repots to have usage alert e-mail notifications sent out when the specified criteria are met. For more information on configuring the usage alert e-mails, refer to Configuring Usage Alert E-mails.
4. Overview – In this page, review and edit all of your plan configurations. To make changes, click Back on the ribbon and edit the settings in the corresponding page.
5. After you finish configuring this plan, click Finish and choose from the following two options in the drop-down list, or click Cancel to leave this page without saving any of your changes:
Click Finish to save the plan. You can view or manage this plan in the Usage Reports interface.
Click Finish and Generate Report to save the plan, and then generate reports immediately.
Searching Nodes Using the Advanced Search Feature
To narrow down the search criteria and display fewer nodes under a particular farm/Web application
level node, a Sites node, or a Lists node on the tree, right-click the node and then select Advanced
Search. In the Advanced Search interface, click Add a Criterion and configure the following settings:
1. Rule – Select the rule for this search. You can use the URL rule to filter Web application level nodes, and the URL rule and the Name rule to filter site collection/site/list/library level nodes.
2. Condition – Select the condition for the rule from the drop-down list.
76
DocAve 6: Report Center
3. Value – Enter the value for the rule in the text box.
4. To add more criteria, click Add a Criterion, and repeat steps above. You can change the logical relationships between the criteria by clicking the And or Or. By default, the logical relationship is set to And.
And means that the child nodes that meet all of the criteria will be included in the result.
Or means that the child nodes that meet any criterion will be included in the result.
The Basic Filter Condition area displays the logic relationships of filter criteria.
5. Click Search to start searching the child nodes.
Configuring Specific Export Report Settings
If you select Page Traffic, Download Ranking, Site Activity Ranking, and Active Users in the Report
Scope and Type Selection step of this wizard, the following specific settings are available in the Export
Report Settings section of the Edit Plan page:
Page Traffic – This setting is available when you select Page Traffic in the Report Scope and Type Selection step of this wizard. Select Hits or Throughput as the type to display the page traffic in the Page Traffic report.
Download Ranking – This setting is available when you select Download Ranking in the Report Scope and Type Selection step of this wizard. Enter an integer into the Top __ for text box, and select Sites or Selected Scope from the drop-down menu to designate the number and nodes to be displayed in the report.
Site Activity Ranking – This setting is available when you select Site Activity Ranking in the Report Scope and Type Selection step of this wizard. Enter an integer into the Top/Bottom __ text box, and select Sites /Pages/Users/Items/Lists from the drop-down menu to designate the number and nodes to be displayed in the report.
Active Users – This setting is available when you select Active Users in the Report Scope and Type Selection step of this wizard. Check the Show all records checkbox to display all the collected data in the report pane, or check the Top/Bottom __ records checkbox, and then enter an integer into the text box to designate the number of the top/bottom ranking results to be displayed in the report.
Configuring Usage Alert E-mails
To configure the Usage Alert E-mails settings for specific report types, complete the following steps:
Active Users usage alert –Select this checkbox to have e-mail notifications sent out when the desired criteria are met. Then configure the following settings:
o Notification Name – Select a previously configured e-mail notification, or click New E-mail Notification to create a new e-mail notification profile. For more
77
DocAve 6: Report Center
information, see the User Notification Settings section in the DocAve 6 Control Panel Reference Guide.
o Time Range – Specify the time frame for this alert.
o Thresholds – Specify the trigger for the notification. Enter a positive integer into the More than __ activities text box.
*Note: By default, the threshold is checked depending on the interval you
configured. If the number exceeds the threshold set here, an e-mail notification
will be sent.
o Interval – Specify the frequency of e-mail notifications. Enter a positive integer into the Every text box, then select by Day(s) or Week(s) from the drop-down menu.
Checked-Out Documents usage alert – Select this checkbox to have e-mail notifications sent out when the desired criteria are met. Then configure the following options:
o Notification Name – Select a previously configured e-mail notification, or click New E-mail Notification to create a new e-mail notification profile. For details on creating an e-mail notification profile, see the User Notification Settings section in the DocAve 6 Control Panel Reference Guide.
o Time Range – Specify the time frame for this alert.
o Threshold – Specify the trigger for the notification. Enter a positive integer into the More than __ checked out document(s) text box.
*Note: By default, the threshold is checked depending on the interval you
configured. If the number exceeds the threshold set here, an e-mail notification
will be sent.
o Interval – Specify how frequent to send e-mail notifications. Enter a positive integer into the Every text box, then select Day(s) or Week(s) from the drop-down menu.
Failed Login Attempts usage alert – Select this checkbox to send out e-mail notifications when the desired criteria is met. Then configure the following options:
o Notification Name – Select a previously configured e-mail notification, or click New E-mail Notification to create a new e-mail notification profile. For details on creating an e-mail notification profile, see the User Notification Settings section in the DocAve 6 Control Panel Reference Guide.
o Interval – Specify how frequent to send e-mail notifications. Enter a positive integer into the Send the e-mail every text box, then select Day(s) or Week(s) from the drop-down menu.
Page Traffic usage alert – Select this checkbox to send out e-mail when the desired criteria is met. Then configure the following options:
78
DocAve 6: Report Center
o Notification Name – Select a previously configured e-mail notification, or click New E-mail Notification to create a new e-mail notification profile. For details on creating an e-mail notification profile, see the User Notification Settings section in the DocAve 6 Control Panel Reference Guide.
o Time Range – Specify the time frame for this alert. Enter a positive integer into the In the last text box, then select Hour(s), Day(s), Week(s), Month(s), Year(s).
o Thresholds – Specify the triggers for this notification. Enter a positive integer into the More than __ hits text box.
*Note: By default, the threshold is checked depending on the interval you
configured. If the number exceeds the threshold set here, an e-mail notification
will be sent.
o Interval – Specify the frequency of e-mail notifications. Enter a positive integer into the Every text box, then select by Day(s) or Week(s) from the drop-down menu.
Site Visitors and Activity usage alert – Select this checkbox to send out e-mail notifications when the desired criteria are met. Then configure the following options:
o Notification Name – Select a previously configured e-mail notification, or click New E-mail Notification to create a new e-mail notification profile. For more information, see the User Notification Settings section in the DocAve 6 Control Panel Reference Guide.
o Time Range – Specify the time frame for this alert.
o Thresholds – Specify the triggers for the notification. You may choose to use one or both of these thresholds:
Check the More than __ event(s) checkbox to activate this threshold, and then enter a positive integer into the text box.
Check the More than __ unique visitor(s) checkbox to activate this threshold, and then enter a positive integer into the text box.
*Note: By default, thresholds are checked depending on the interval you have
configured. If these numbers exceed the thresholds set here, an e-mail
notification will be sent.
o Interval – Specify how frequent to send e-mail notifications. Enter a positive integer into the Every text box, and then select Day(s) or Week(s) from the drop-down menu.
Workflow Status usage alert – Select this checkbox to send out e-mail notifications when the desired criteria are met. Then configure the following options:
o Notification Name – Select a previously configured e-mail notification, or click New E-mail Notification to create a new e-mail notification profile. For details on creating an e-mail notification rule, see the User Notification Settings section in the DocAve 6 Control Panel Reference Guide.
79
DocAve 6: Report Center
o Thresholds – Specify the triggers for the notification. Enter a positive integer into the More than __ open workflow(s) assigned to a user text box.
*Note: By default, thresholds are checked depending on the interval you
configured. If these numbers exceed the thresholds set here, an e-mail
notification will be sent.
o Interval – Specify the frequency to send e-mail notifications. Enter a positive integer into the Every text box, and then select Day(s) or Week(s) from the drop-down menu.
Using the Usage Reports Interface
When you finish configuring the Usage Report plans, you can view and manage all of the previously
created plans and generate reports of the plans in the Usage Reports interface. In the viewing pane of
this interface, you can view the Plan Name, Report Type, Description, and Last Modified Time of each
previously created Usage Reports plan. Refer to the following sections for detailed instructions of
managing the Usage Reports plans and generating reports of the plans.
Managing Usage Report Plans
In the Usage Reports interface, you can perform the following operations to manage the plans:
To view the report types included in a particular plan, click the arrow ( ) button next to the desired plan to expand it in the Plan Management pane. All of the included report types are displayed under the plan name.
View Details – Select a plan, and then click View Details on the ribbon to open the View Details page to see the reporting scope and settings of the selected plan. You can click Edit Plan on the ribbon to make changes to the plan. When you are finished reviewing the plan, click Close to return to the Usage Reports page.
Edit – Select a plan, then click Edit on the ribbon to open the Edit Plan page. Here you can make changes to the scope and settings of the selected plan. Then, choose from the following options:
o Click Finish and then make a selection from the drop-down list:
Click Finish to save the plan. You can view or manage this plan in the Usage Reports interface.
Click Finish and Generate Report to save the plan, and then generate reports immediately.
o Click Cancel to close the Edit Plan page without saving any changes.
Delete – Select a plan, then click Delete on the ribbon to delete the plan. A window pops up to confirm whether you want to proceed with deleting the selected plan. Click OK to delete the plan, or click Cancel to return to the Plan Manager page without deleting the plan.
80
DocAve 6: Report Center
Job Monitor – Keep track of running reports and scheduled reports. To access the jobs of each module, click Job Monitor on the ribbon. For more information about using Job Monitor, refer to the DocAve 6 Job Monitor User Guide.
Generating Reports in the Usage Reports Interface
If you configure an export report schedule for a specific plan, Report Center will generate and export
reports based on the configured export schedule and export report settings. When the scheduled export
report jobs finish, you can go to the specified export locations to view the exported reports. If you want
to generate reports of specific plans immediately, perform the following operations in the Usage
Reports interface:
Generate Report – Select your desired reports, and then click Generate Report on the ribbon to run jobs immediately to retrieve the latest data for the selected reports.
Export Now – Select your desired reports, and then click Export Now on the ribbon to export the report details to the export location you configured in the corresponding plans.
Show Report – Select a specific report whose data has been retrieved, and then click Show Report on the ribbon to access the Show Report page. You can view the report of previously collected data. If you select a report whose data has not been retrieved, and then click Show Report, the report display pane in the Show Report page displays no data. For more detailed on viewing reports in the Show Report page, refer to Viewing Usage Reports.
Using the Show Report Interface
In the Show Report interface, you can view the report details or run jobs to generate reports of the
reports in a specific Usage Reports plan. Also, you can view and edit the specified Usage Reports plan. To
access the Show Report interface, choose either of the following methods:
To access the Show Report interface to view all of the generated reports for a particular plan, navigate to the Usage Reports tab, select the desired plan, and then click Show Report on the ribbon. The Show Report interface for the selected plan appears.
To access the Show Report interface to view a particular report, complete the following steps:
i. Navigate to the Usage Reports tab, and click the arrow ( ) button next to the
plan that contains the desired report to expand the plan. All of the included
reports are displayed under the plan node.
ii. Select the desired report included in this plan.
iii. Click Show Report on the ribbon. The Show Report interface for the selected
report appears.
In the Show Report interface, you can perform the following operations:
81
DocAve 6: Report Center
Report Type – If you access the Show Report interface for a particular plan, all of the report types for this plan are included in the Report Type drop-down list. Select a desired report type from this drop-down list, and then choose to view the report details or generate a report of the selected plan immediately.
*Note: If you access the Show Report interface for a particular report, the selected
report type is the only option in the Report Type drop-down list and cannot be changed.
Report – Click this button to view the details of the report specified in Report Type. For more information on how to view the reports, refer to Viewing Usage Reports.
Plan Details – Click this button to view the detail settings of the current selected plan.
Edit Plan – Click this button to edit the current selected plan on the Edit Plan page. For more information on editing the plan, refer to Managing Usage Report Plans.
Run Report – This button is available when you select one of the following report types in Report Type: Last Accessed Time, SharePoint Alerts, and Workflow Status. Click this button to run the report of the selected report immediately. When the report is generated, the report details are displayed in the report display pane below. When the report is generated, you can view the latest retrieved data in the report display pane below. For more information on view the reports, refer to Viewing Usage Reports.
Collect Now – This button is available when you select one of the following report types in Report Type: Search Usage, Site Visitors and Activity, Checked-Out Documents, Page Traffic, Referrers, Failed Login Attempts, Download Ranking, Site Activity Ranking, and Active Users. Click this button to run the Collector of the selected report immediately to retrieve the latest data for this report. When the report is generated, you can view the latest retrieved data in the report display pane below. For more information on view the reports, refer to Viewing Usage Reports.
Export Now – Click this button and then select a desired option from the drop-down list to export the report details of the selected report in Report Type. For more information on exporting a report, refer to Export Report.
Job Monitor – Keep track of running reports and scheduled reports. To access the jobs of each module, click Job Monitor on the ribbon. For more information about using Job Monitor, refer to the DocAve 6 Job Monitor User Guide.
Close – Click this button to exit this page and return to the Usage Reports interface.
Viewing Usage Reports
In the report display pane of the Show Report interface, the latest retrieved data of the selected Report
Type in a specific plan is displayed. Refer to the section below for detailed instructions on viewing the
Usage Reports.
82
DocAve 6: Report Center
Viewing Search Usage Reports
A Search Usage report displays the terms that have been searched, number of times these terms have
been searched and the number of unique searches within the time frame you specify.
Once you have generated a report, the report display pane has a number of configurable settings so that
you can customize how the report displays the data. For Search Usage reports, the following settings can
be configured in the report display pane:
Range – Time frame parameter for the report.
Frequency – Time interval the report is displayed in.
Custom – Customize the Date Range and Frequency in a calendar.
Top – Top number of results.
Scope – Change the scope for the data shown in the report.
Search Terms – Display by search terms.
Search Scopes – Display by search scopes.
Viewing Site Visitors and Activity Reports
A Site Visitors and Activity report displays the activity, usage, and number of unique visitors for site
collections, sites, sub sites, lists, and/or libraries within the time frame you select.
Once you have generated a report, the report display pane has a number of configurable settings so that
you can customize how the report displays the data. For Site Visitors and Activity reports, the following
settings can be configured in the report display pane:
Range – Time frame parameter for the report.
Frequency – Time interval the report is displayed in.
Type – Set report type.
Custom – Customize the Date Range, Frequency and Type in a calendar.
Scope – Change the scope for the data shown in the report.
Sort By – Order to display the data in.
Events – You can view the number of the corresponding events within your selected scope in a specified time range. By defaults, such events are update, delete and view.
Events Calculator – Display by number of events.
Unique Visitors Calculator – Display by number of unique visitors.
Details – Display detailed information for each individual site.

83
DocAve 6: Report Center
Viewing Checked-Out Documents Reports
A Checked-Out Documents report displays the number of the documents checked out within the scope
you select.
Once you have generated a report, the report display pane has a number of configurable settings so that
you can customize how the report displays the data. For Checked-Out Documents reports, the following
settings can be configured in the report display pane:
Range – Time frame parameter for the report.
Frequency – Time interval the report is displayed in.
Type – Set report type.
Custom – Customize the Date Range, Frequency, and Type in a calendar.
Scope – Change the scope for the data shown in the report.
Checked-Out Documents – Graphical report of checked-out documents based on the scope.
Details – Display detailed information for each individual site.
Viewing Page Traffic Reports
A Page Traffic report analyzes the traffic level of the page at the site/site collection level. In the specific
site, you can view the page traffic level, the amount of throughput and the hits within a specific time
frame.
Once you have generated a report, the report display pane has a number of configurable settings so that
you can customize how the report displays the data. For Page Traffic reports, the following settings can
be configured in the report display pane:
Range – Time frame parameter for the report.
Frequency – Time interval the report is displayed in.
Display by – Information to display the report by.
Custom – Customize the Date Range and Frequency in a calendar.
Scope – Change the scope for the data shown in the report.
Page Traffic – Page traffic information.
Details – Detailed information by frequency.
Viewing Referrers Reports
A Referrers report is used to record and analyze the referring frequency of hosts or pages within a
specified scope to site collection or sites.
84
DocAve 6: Report Center
*Note: The Referrers report does not support SharePoint 2013 or SharePoint 2016. The site collections
or sites selected for this report have to be limited within the same farm instead of multiple farms.
To generate a Referrers report in Report Center, the required primary data in Site Referrers of
SharePoint has to be configured in SharePoint. To configure the primary data in SharePoint, complete
the following steps:
1. Enter to your SharePoint 2010 environment.
2. Navigate to Central Administration > Monitoring > Configure health data Collection.
3. Enable Health Data Collection.
4. Click Log Collection Schedule, and then enable all the log collection schedules.
Once you have generated a report, the report display pane has a number of configurable settings so that
you can customize how the report displays the data. For Referrers reports, the following settings can be
configured in the report display pane:
Sort by – Information to display the report by.
Range – Time frame parameter for the report.
Frequency – Time interval the report is displayed in.
Custom – Customize the Date Range and Frequency in a calendar.
Type – Set report type.
Y-Axis – Set the parameter for the Y-Axis.
Scope – Change the scope for the data shown in the report.
Site Referrers – Site referrer information.
Details – Display detailed information for each individual site.
Viewing Last Accessed Time Reports
Last Accessed Time report displays when the selected site collections or sites were last accessed, and by
whom, using SharePoint Auditor.
*Note: SharePoint Audit settings must be enabled for any site collections or sites of which you want to
generate the reports.
Once you have generated a report, the report display pane has a number of configurable settings so that
you can customize how the report displays the data. For Last Accessed Time reports, the following
settings can be configured in the report display pane:
Display by – Information to display the report by.
Scope – Change the scope for the data shown in the report.
Filter selection – Filter the data displayed.
85
DocAve 6: Report Center
Viewing Failed Login Attempts Reports
Failed Login Attempts is used to monitor failed login or access attempts for the specified farm or site.
*Note: To get Failed Login Attempts information, you must first configure IIS Logging. For details on
configuring IIS Logging, refer to IIS Logging section.
Once you have generated a report, the report display pane has a number of configurable settings so that
you can customize how the report displays the data. For Failed Login Attempts reports, the following
settings can be configured in the report display pane:
Range – Time frame parameter for the report.
Frequency – Time interval the report is displayed in.
Custom – Customize the Date Range and Frequency in a calendar.
Scope – Change the scope for the data shown in the report.
Y-Axis – Set the parameter for the Y-Axis.
Display by – Information to display the report by.
Failed Login Attempts – Failed login attempt per frequency.
Details – Display detailed information for each individual site.
Viewing Workflow Status Reports
Workflow Status reports display the number of workflows per workflow template created by SharePoint
2016, SharePoint 2013, SharePoint 2010, or SharePoint Designer. Workflow Status reports are used to
view each workflow status by workflow template, users, library, or list within a specific scope, the
average time to complete the workflow, the number of the workflow which is currently open, and the
person assigned to each workflow.
Once you have generated a report, the report display pane has a number of configurable settings so that
you can customize how the report displays the data. For Workflow Status reports, the following settings
can be configured in the report display pane:
Sort by – Order to display the data in.
Y-Axis – Set the parameter for the Y-Axis.
Show Average – Show average workflow.
Scope – Change the scope for the data shown in the report.
Template Allocation – Show a summary of all of the workflows and the workflow allocation by template within the selected scope.
Details – Display detailed information for each individual site.
86
DocAve 6: Report Center
Viewing SharePoint Alerts Reports
SharePoint Alerts reports display the number of alerts for the specified scope. Once you have generated
a report, the report display pane has a number of configurable settings so that you can customize how
the report displays the data. For SharePoint Alerts reports, the following settings can be configured in
the report display pane:
Sort by – Order to display the data in.
Scope – Change the scope for the data shown in the report.
Alerts – Alerts per farm.
Details – Where the alerts were encountered and how often.
Viewing Download Ranking Reports
A Download Ranking report is used to list the downloaded files’ information.
*Note: To get Download Ranking information, you must first configure IIS Logging. For details on
configuring IIS Logging, refer to IIS Logging section.
Once you have generated a report, the Report Display pane has a number of configurable settings so
you can customize how the report displays the data. For Download Ranking reports, the following
settings can be configured in the Report Display pane:
Range – Time frame parameter for the report.
Custom – Customize the time range and frequency in a calendar.
Advanced – Top downloads per scope.
Scope – Change the scope for the data shown in the report.
Filter selection – Filter the data displayed.
You can also view the following download information:
File Download Ranking – Display file download rankings for each individual site.
User Download Ranking – Display user download rankings for each individual site.
Details – Display detailed information for each individual download event.
Viewing Site Activity Ranking Reports
A Site Activity Ranking report analyzes the site activities at the site collection and site levels. In a specific
site collection, you can view the site which is the top hit site, page, or user for a specific time. By default,
it will list the top eight hit sites, pages, users, lists, or items.
87
DocAve 6: Report Center
Once you have generated a report, the report display pane has a number of configurable settings so that
you can customize how the report displays the data. For Site Activity Ranking reports, the following
settings can be configured in the report display pane:
Range – Time frame parameter for the report.
Advanced – Top or Bottom number of parameters set here.
Custom – Customize the Date Range and Frequency in a calendar.
Scope – Change the scope for the data shown in the report.
Filter selection – Filter the data displayed.
Viewing Active Users Reports
An Active Users report displays the users with the most activities within the scope you configured. Once
you have generated a report, the report display pane has a number of configurable settings so that you
can customize how the report displays the data. For Active Users reports, the following settings can be
configured in the report display pane:
Range – Time frame parameter for the report.
Custom – Customize the Date Range and Frequency in a calendar.
Sort by – Order to display the data in.
Scope – Change the scope for the data shown in the report.
Active Users – Active users per scope.
Details – Display detailed information for each individual site.
Exporting Active Users Reports with Additional User Properties
By default, exported Active Users reports include the same information as the Show Report feature, but
also include the login and display names of the reported users. To export Active Users reports with
more user properties, complete the following steps:
1. Add the user properties you want to include in the exported Active Users report into the <UserProfileCustomProperties> node in ReportCenterServiceCustomProperties.config file on your Report service server. For detailed instructions, refer to Configuring the ReportCenterServiceCustomProperties.config File.
2. After adding the user properties, you must run a Full User Profile Collector job to collect the data of the corresponding user properties from the Search service application. To do so, complete the steps below:
a. Change the mode of data collector jobs to Full by configuring the
<UserProfileSyncMode> node in the ReportCenterServiceProperties.config under the
same directory. For detailed instructions, refer to Configuring the
ReportCenterServiceProperties.config File.
88
DocAve 6: Report Center
b. Go to DocAve Manager > Report Center > Data Collection, to run a job of the User
Profile Collector. For detailed information on running a data collector job in Data
Collection, refer to Data Collection.
c. After this User Profile Collector job is finished, the data of the configured user
properties are retrieved and stored to the Report database. Later, you can run
incremental User Profile Collector jobs to collect the user profile data. Go back to your
Report service server and change the mode of data collector jobs to Incremental by
configuring the <UserProfileSyncMode> node in the
ReportCenterServiceProperties.config. For detailed instructions, refer to Configuring
the ReportCenterServiceProperties.config File.
3. After the steps mentioned above are completed, the newly export Active Users report will include the user properties of each reported user as configured in the ReportCenterServiceProperties.config file. With a configured schedule for exporting reports in the Would you like to export reports for this plan? section of the Usage Report plan that contains the Active Users report type, you can export an Active Users report in the following methods:
Wait for the next scheduled export report job to export the Active Users report including the configured user properties.
To manually export an Active Users report of a Usage Report plan, use the Export Now > Export to Datasheet feature in the Usage Reports or Show Report interface.
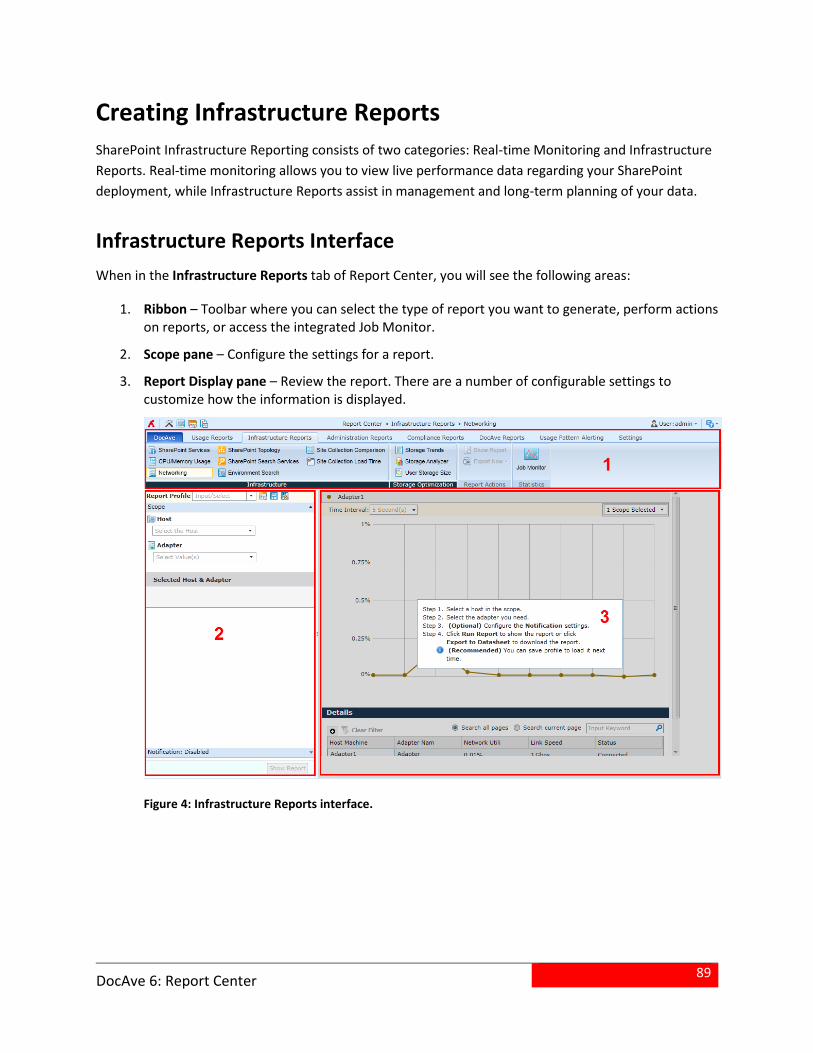
89
DocAve 6: Report Center
Creating Infrastructure Reports
SharePoint Infrastructure Reporting consists of two categories: Real-time Monitoring and Infrastructure
Reports. Real-time monitoring allows you to view live performance data regarding your SharePoint
deployment, while Infrastructure Reports assist in management and long-term planning of your data.
Infrastructure Reports Interface
When in the Infrastructure Reports tab of Report Center, you will see the following areas:
1. Ribbon – Toolbar where you can select the type of report you want to generate, perform actions on reports, or access the integrated Job Monitor.
2. Scope pane – Configure the settings for a report.
3. Report Display pane – Review the report. There are a number of configurable settings to customize how the information is displayed.
Figure 4: Infrastructure Reports interface.
90
DocAve 6: Report Center
SharePoint Services
SharePoint Services allows you to view the latest active SharePoint Servers and SharePoint services,
along with their status.
*Note: While the Details tab of the SharePoint Topology report shows similar information, the
SharePoint Topology report is able to display information about multiple farms.
Generating SharePoint Services Reports
To configure the basic settings for the SharePoint Services report, go to the Infrastructure Reports tab
of Report Center, and click SharePoint Services on the ribbon. In the Scope configuration area, select
the farm you want to view from the drop-down menu by checking the corresponding checkbox. Click
Show Report to generate the report in the Report Display pane on the right.
Viewing SharePoint Services Reports
Once you have generated a report, the Report Display pane has a number of configurable settings so
that you can customize how the report displays the data. For SharePoint Services reports, the following
settings can be configured in the Report Display pane:
Sort Services by – Order to display the data in.
Scope – Change the scope for the data shown in the report.
Filter selection – Filter the data displayed.
CPU/Memory Usage
A CPU/Memory Usage report provides a real time monitoring of the CPU and memory usage of the host
machine where the DocAve Agent is located
Generating CPU/Memory Usage Reports
To configure the basic settings for the CPU/Memory Usage report, in the Infrastructure Reports tab of
Report Center, click CPU/Memory Usage on the ribbon. You can configure the following settings in the
Scope pane:
1. Report Profile Name – Select a previously configured profile from the drop-down menu or create a new profile by entering a new name in the Report Profile text box. Click the new button
( ) to clear all fields, click the save button ( ) to save changes to the current report profile, or
click the save as button ( ) to save any changes under a new profile name.
2. Host – Select the host machine where the DocAve Agent is located.
91
DocAve 6: Report Center
3. E-mail Notification – Check the Usage alert checkbox if you want to have e-mail notifications sent out when the desired criteria are met. Then configure the following options:
Notification Name – Select a previously configured e-mail notification, or click New E-mail Notification to create a new e-mail notification profile. For details on creating an e-mail notification profile, see the User Notification Settings section in the DocAve 6 Control Panel Reference Guide.
Thresholds – Specify the triggers for the notification. You may choose to use one or both of these thresholds:
o Check the CPU checkbox to activate this threshold, and then enter the values for __% lasts for more than __ minute(s).
o Check the Memory checkbox to activate this threshold, and then enter the values for __% lasts for more than __ minute(s).
*Note: By default, thresholds are checked one time each minute. If these numbers exceed the thresholds set here, an e-mail notification will be sent.
Interval – Specify the frequency of e-mail notifications. Enter a positive integer into the Every text box, then select Day(s) or Week(s) from the drop-down menu.
Click Show Report to generate the report in the Report Display pane on the right.
Viewing CPU/Memory Usage Reports
Once you have generated a report, the Report Display pane has a number of configurable settings so
that you can customize how the report displays the data. For CPU/Memory Usage reports, the following
settings can be configured in the Report Display pane:
Time Interval – Time interval the report is displayed in.
CPU/Memory – Display CPU information, memory information, or both.
Scope – Change the scope for the data shown in the report.
Details – Detailed usage information per host machine.
Filter selection – Filter the data displayed.
Networking
A Networking report provides real-time information on networking usage (both wired and wireless) of
DocAve Agent servers.
92
DocAve 6: Report Center
Generating Networking Reports
To configure the basic settings for the Networking report, in the Infrastructure Reports tab of Report
Center, click Networking on the ribbon. You can configure the following settings in the Scope pane:
1. Report Profile Name – Select a previously configured profile from the drop-down menu or create a new profile by entering a new name in the Report Profile text box. Click the new button
( ) to clear all fields, click the save button ( ) to save changes to the current report profile, or
click the save as button ( ) to save any changes under a new profile name.
2. Host – Select the host machine where the DocAve Agent is located.
3. Adapter – Select the adapter.
4. E-mail Notification – Check the Usage alert checkbox if you want to have e-mail notifications sent out when the desired criteria are met. Then configure the following options:
Notification Name – Select a previously configured e-mail notification, or click New E-mail Notification to create a new e-mail notification profile. For details on creating an e-mail notification profile, see the User Notification Settings section in the DocAve 6 Control Panel Reference Guide.
Thresholds – Specify the triggers for this notification. Enter the values for __% lasts for __ minute(s).
*Note: By default, thresholds are checked one time each minute. If the number exceeds the threshold set here, an e-mail notification will be sent.
Interval – Specify the frequency of e-mail notifications. Enter a positive integer into the Every text box, then select Day(s) or Week(s) from the drop-down menu.
Click Show Report to generate the report in the Report Display pane on the right.
Viewing Networking Reports
Once you have generated a report, the Report Display pane has a number of configurable settings so
that you can customize how the report displays the data. For networking reports, the following settings
can be configured in the Report Display pane:
Time Interval – Time interval the report is displayed in.
Scope – Change the scope for the data shown in the report.
Details – Networking data per host machine.
Filter selection – Filter the data displayed.
93
DocAve 6: Report Center
SharePoint Topology
The SharePoint Topology is a role-based function that displays all the server names and number in one
of your SharePoint farms with an intuitive topology. You can view more information on a particular
server on your farm by clicking the corresponding icons.
Generating SharePoint Topology Reports
To configure the basic settings for the SharePoint Topology report, in the Infrastructure Reports tab of
Report Center, click SharePoint Topology on the ribbon. You can configure the following settings in the
Scope pane:
Scope – In the Scope configuration area, select the farm you want to view from the drop-down menu.
Click Show Report to generate the report in the Report Display pane on the right.
Viewing SharePoint Topology Reports
Once you have generated a report, the Report Display pane has a number of configurable settings so
that you can customize how the report displays the data. For SharePoint Topology reports, the following
settings can be configured in the Report Display pane:
Topology by Role – Find information by role in farm.
Topology by Server – See all of the services.
Details – Service and status per server role.
o Sort services by – Order to display data in.
o Filter selection – Filter the data displayed.
SharePoint Search Services
The SharePoint Search Services report provides real time information on the crawling speed of the
SharePoint SSA, as well as the detailed information about the SSA such as content source status, system
status and the search application topology.
Generating SharePoint Search Services Reports
To configure the basic settings for the SharePoint Search Service report, in the Infrastructure Reports
tab of Report Center, click SharePoint Search Services on the ribbon. You can configure the following
settings in the Scope pane:
1. Report Profile Name – Select a previously configured profile from the drop-down menu or create a new profile by entering a new name in the Report Profile text box. Click the new button
94
DocAve 6: Report Center
( ) to clear all fields, click the save button ( ) to save changes to the current report profile, or
click the save as button ( ) to save any changes under a new profile name.
2. Scope – In the Scope configuration area, select the Farm you want to view from the drop-down menu. Then select the Search Service Application from the drop-down menu. You can generate the SharePoint Search Service report for the Search Service Applications of SharePoint 2010 and SharePoint 2013 at the same time.
Click Show Report to generate the report in the Report Display pane on the right.
Viewing SharePoint Search Services Reports
Once you have generated a report, the Report Display pane has a number of configurable settings so
that you can customize how to display the reports, the following settings can be configured in the
Report Display pane:
Time Interval – Time interval the report is displayed in.
Scope – Change the scope for the data shown in the report.
Crawling Speed – Crawling speed of search service.
Content Sources – Information about the search service.
o Filter selection – Filter the data displayed.
System Status – Status of the search service.
Search Application Topology – Where the search service is.
o Filter selection – Filter the data displayed.
Environment Search
Environment Search generates reports for objects in specified environments, such as host, farm as well
as services, servers and their status in farm.
Generating Environment Search Reports
To configure the basic settings for the Environment Search report, in the Infrastructure Reports tab of
Report Center, click Environment Search on the ribbon. You can configure the following settings in the
Scope pane:
1. Report Profile Name – Select a previously configured profile from the drop-down menu or
create a new profile by entering a new name in the Report Profile text box. Click to clear all
fields, click to save changes to the current report profile, or click to save any changes under a new profile name.
2. Criteria – In the Criteria configuration area, configure the following options:
Criteria – Select Domain, IPv4 Range or Host Name.
95
DocAve 6: Report Center
Value – Enter the Domain Name, IPv4 range or Host Name depending on the Criteria you have selected.
Username – Enter the username according to the Criteria and Value you have entered.
Password – Enter the password for the account.
3. Additional filters – You may add additional filters of the same Criteria.
Domain – For multiple filters, click Add another filter. By default, the logic is set to And. The logic can be configured as And or Or by clicking on the logic itself. Click Search Host. The Host Name, Username, and Operating System will be displayed in the Host table. Click Save to save these search results. They will remain on the screen when you reopen this layout page.
IPv4 Range – For multiple filters, click Add another IPv4 Range filter. The logic for IPv4 Range filters is Or.
Host Name – For multiple filters, click Add another Host Name filter. The logic for Host Name filters is Or.
Click Scan to scan the environment based on the filters configured.
Site Collection Comparison
A Site Collection Comparison displays the differences among selected site collections based on
predefined criteria.
Generating Site Collection Comparison
To configure the basic settings for the Site Collection Comparison, in the Infrastructure Reports tab of
Report Center, click Site Collection Comparison on the ribbon. You can configure the following settings
in the Scope pane:
1. Report Profile Name – Select a previously configured profile from the drop-down menu or create a new profile by entering a new name in the Report Profile text box. Click the new button
( ) to clear all fields, click the save button ( ) to save changes to the current report profile, or
click the save as button ( ) to save any changes under a new profile name.
2. Scope – In the Scope configuration area, click the farm name and expand the data tree down to the desired object level, or enter a URL/name in the search text box above the tree. Check the checkboxes next to the nodes you want to include in the report. To narrow down the search criteria and display fewer nodes under a particular farm/Web appellation level node on the tree, right-click the node and select Advanced Search to access the Advanced Search interface. For detailed instructions on using the Advanced Search feature, refer to Searching Nodes Using the Advanced Search Feature.
Click Show Report to generate the report in the Report Display pane on the right.
96
DocAve 6: Report Center
Viewing Site Collection Comparison
Once you have generated a report, the Report Display pane has a number of configurable settings so
that you can customize how to display the reports, the following settings can be configured in the
Report Display pane:
Information – Various site collection statistics in respect to basic information, settings, and security highlighting the differences.
Scope – Change the scope for the data shown in the report.
Site Collection Load Time
This report displays the time taken to load the selected site collections.
Generating Site Collection Load Time Reports
To configure the basic settings for the Site Collection Load Time report, in the Infrastructure Reports tab
of Report Center, click Site Collection Load Time on the ribbon. You can configure the following settings
in the Scope pane:
1. Report Profile Name – Select a previously configured profile from the drop-down menu or create a new profile by entering a new name in the Report Profile text box. Click the new button
( ) to clear all fields, click the save button ( ) to save changes to the current report profile, or
click the save as button ( ) to save any changes under a new profile name.
2. Scope – In the Scope configuration area, click the farm name and expand the data tree down to the desired object level, or enter a URL/name in the search text box above the tree. Check the checkboxes next to the nodes you want to include in the report. To narrow down the search criteria and display fewer nodes under a particular farm/Web appellation level node on the tree, right-click the node and select Advanced Search to access the Advanced Search interface. For detailed instructions on using the Advanced Search feature, refer to Searching Nodes Using the Advanced Search Feature.
3. Enable Collector – Collect data for the report. By default, this feature collects the information at midnight everyday (according to your Control Service’s time zone). Click Data Collection to jump to the Data Collection page. By default, the collector schedule is enabled. To disable the collector schedule, uncheck the Enable Collector checkbox. The status of the collector will change to Disabled, and DocAve will not collect the information according to the schedule. For more information about Collector, refer to the Data Collection section of this guide.
4. E-mail Notification – Check the Usage alert checkbox if you want to have e-mail notifications sent out when the desired criteria are met. Then configure the following options:
Notification Name – Select a previously configured e-mail notification, or click New E-mail Notification to create a new e-mail notification profile. For details on creating an e-mail notification profile, see the User Notification Settings section in the DocAve 6 Control Panel Reference Guide.
97
DocAve 6: Report Center
Thresholds – Specify the trigger for this notification. Enter the values for More than __ seconds with __ consecutive tries.
*Note: By default, the threshold is checked depending on the interval you have configured. If the number exceeds the threshold set here, an e-mail notification will be sent.
Interval – Specify the frequency of e-mail notifications. Enter a positive integer into the Every text box, then select Day(s) or Week(s) from the drop-down menu.
Click Collect Now to collect the information of the current profile immediately. Click Show Report to
generate the report in the Report Display pane on the right.
Viewing Site Collection Load Time Reports
Once you have generated a report, the Report Display pane has a number of configurable settings so
that you can customize how to display the reports, the following settings can be configured in the
Report Display pane:
Range - Time frame parameter for the report.
Frequency - Time interval the report is displayed in.
Type - Set report type.
Custom - Customize the time range and frequency in a calendar.
Scope - Change the scope for the data shown in the report.
Load Time - Load time per frequency.
Details - Display detailed information for each individual site.
Storage Optimization
Storage Optimization reports are infrastructure reports that provide specific information on your
storage use in DocAve.
Storage Trends
A Storage Trends report displays the current and projected storage use by selected SharePoint on-
premises farm, Web applications, content databases, or site collections or SharePoint Online site
collections on an adjustable time scale. It also provides a drill-down analysis of the size of each site
collection by document type, size by sites, and size by SharePoint lists or libraries.
98
DocAve 6: Report Center
Generating Storage Trends Reports
To configure the basic settings for a Storage Trends report, go to the Infrastructure Reports tab of
Report Center, and click Storage Trends on the ribbon. You can configure the following settings in the
Scope pane:
1. Report Profile Name – Select a previously configured profile from the drop-down menu or create a new profile by entering a new name in the Report Profile text box. Click the new button
( ) to clear all fields, click the save button ( ) to save changes to the current report profile, or
click the save as button ( ) to save any changes under a new profile name.
2. Scope – In the Scope configuration area, expand the data tree and select the SharePoint objects. You can also enter a URL/name in the search text box above the tree to search for the objects. Check the checkboxes next to the nodes you want to include in the report. To narrow down the search criteria and display fewer nodes under a particular farm/Web appellation level node on the tree, right-click the node and select Advanced Search to access the Advanced Search interface. For detailed instructions on using the Advanced Search feature, refer to Searching Nodes Using the Advanced Search Feature.
3. Enable Collector – Collect data for the report. By default, this feature collects the information at midnight everyday (according to your Control Service’s time zone). Click Data Collection to jump to the Data Collection page. By default, the collector schedule is enabled. To disable the collector schedule, uncheck the Enable Collector checkbox. The status of the collector will change to Disabled, and DocAve will not collect the information according to the schedule. For more information about Collector, refer to Data Collection.
4. Export Schedule – In the schedule configuration area, choose one of the following options:
No Schedule – Select this option if you do not want to configure a schedule for this profile. If you choose this option, you must run the report manually.
Configure the schedule myself – Select this option to configure the specific time you want to export reports of this profile. A schedule configuration area appears. You can customize the schedule with the following options.
o Start time – Select the date and time when to start exporting reports of this profile.
*Note: The start time cannot be earlier than the current time.
o Interval – Enter an integer into the text box and select by Hour(s), Day(s), Week(s), or Month(s). The reports will be exported repeatedly based on this schedule. Click Calendar View to see the schedules in a calendar.
o Schedule ending – Designate when to stop exporting reports of this profile. Select No end date for the reports of this profile to be exported repeatedly until you stop it manually. Select End after ___ occurrence(s) to have the job stopped after the defined occurrences that you configured in the text box. Select End by Date + Time to specify the exact date and time to stop exporting the reports of this profile.
99
DocAve 6: Report Center
o Export Report Settings – Select the desired Report Format and Export Location, and then click View to access detailed information about the selected export location. If you want to configure a new export location, click New Export Location, and follow the instructions provided in the Export Location section of this guide. To export PivotChart of this report in XLSX format, select the Export the PivotChart option under the Export Location text box.
o Date Range – In the Date Range configuration area, choose one of the following options:
Duration – Click the Duration radio button, and then select the desired time range from the drop-down menu. There are eight durations available: This Month, Last Month, Last 2 Months, This Week, Last Week, Last 2 Weeks, Today, and Yesterday.
Custom Start Date – Click the Starting Date radio button to designate the start date from when the data will be included in the exported reports.
o Frequency – Select the time interval in which the data is displayed in the exported report.
Automatically – With this option selected, the system will automatically choose an interval from Daily, Weekly, and Monthly options according to the configured Date Range.
*Note: If the date range is within 14 days, the system will automatically
choose Daily as an interval; If the date range is more than 14 days and
within 60 days, the system will automatically choose Weekly as an
interval; If the date range is more than 60 days, the system will
automatically choose Monthly as an interval.
o Notification – Optionally, check the Send Notification checkbox and select the Recipient of this notification. You can select a previously configured e-mail notification profile, and then click View to access detailed information, or click New E-mail Notification to create a new e-mail notification profile. For details on creating an e-mail notification profile, refer to the User Notification Settings section in the DocAve 6 Control Panel Reference Guide. You can choose to have the report included in the e-mail as an attachment by checking the Attach report to the e-mail when the size of the report is less than … checkbox, and then enter the maximum size of the report allowed in the less than __ MB.
5. E-mail Notification – In the e-mail notification configuration area, you can set up two types of notifications for this report. You can configure one or both of the Usage Alert Settings and Prediction Settings. Check the Usage alert checkbox if you want to have e-mail notifications sent out when the desired criteria are met (the Usage Alert Settings area becomes active), and/or check the Prediction checkbox if you want to have email notifications sent out when the prediction value is met (the Prediction Settings area becomes active). Configure the following settings as necessary:
100
DocAve 6: Report Center
Notification Name – The two types of notifications use the same notification profile to send the e-mail. Select a previously configured e-mail notification, or click New E-mail Notification to create a new e-mail notification profile. For details on creating an e-mail notification profile, see the User Notification Settings section in the DocAve 6 Control Panel Reference Guide.
Usage Alert Settings – Specify the storage and time interval triggers by configuring the following settings. When the storage size exceeds the set values, the e-mail will be sent out.
o Thresholds – Specify the usage alert triggers for this notification.
When the storage size exceeds the specified value, an e-mail will be sent. Enter the values for Storage: More than __, and then select MB or GB from the drop-down menu.
When the storage limit exceeds the specified percentage, an e-mail will be sent out. Enter an integer for Storage: More than __% of the storage limit in quota template. The notification configured for the storage limit is only supported for the site collection level nodes.
*Note: By default, thresholds are checked depending on the interval you have configured. If these numbers exceed the thresholds set here, an e-mail notification will be sent out.
o Interval – Specify the frequency of e-mail notifications. Enter a positive integer into the Every text box, then select Day(s) or Week(s) from the drop-down menu.
Prediction Settings – Check this checkbox to enable notifications triggered by prediction values, then configure the following settings:
o Time Range – Enter a positive integer into the Projected usage in the upcoming__ textbox, and select Day(s), Week(s) or Month(s) from the drop-down menu.
o Thresholds – Enter a positive integer into the Storage: More than __, and then select MB or GB from the drop-down menu.
*Note: By default, thresholds are checked depending on the interval you have configured. If these numbers exceed the thresholds set here, an e-mail notification will be sent out.
o Interval – Specify the frequency of e-mail notifications. Enter a positive integer into the Every text box, then select Day(s) or Week(s) from the drop-down menu.
Click Collect Now to collect the information of the current profile immediately. Click Show Report to
generate the report in the Report Display pane on the right.
101
DocAve 6: Report Center
Viewing Storage Trends Reports
Once you have generated a report, the Report Display pane has a number of configurable settings so
that you can customize how to display the reports, the following settings can be configured in the
Report Display pane:
Range – Time frame parameter for the report.
Frequency – Time interval the report is displayed in.
Type – Set report type.
Custom – Customize the time range and frequency in a calendar.
Scope – Change the scope for the data shown in the report.
Storage Trends – Storage trends per frequency.
Prediction – Predicted trends based on current trends.
Allocation – This tab is only available for site collection level Storage Trends reports. Use it to view the allocation of the sites, contents, and types by size or number within a specific site collection.
Item Details – This tab is only at the site collection level Storage Trends reports. Use it to view the details of each list/library of a specific site collection.
Storage Analyzer
A Storage Analyzer report displays the size and proportion of data stored in SharePoint and external
devices. The external devices are related to your settings in the module of Storage Optimization.
Generating Storage Analyzer Reports
To configure the basic settings for the Storage Analyzer report, in the Infrastructure Reports tab of
Report Center, click Storage Analyzer on the ribbon. You can configure the following settings in the
Scope pane:
1. Report Profile Name – Select a previously configured profile from the drop-down menu or create a new profile by entering a new name in the Report Profile text box. Click the new button
( ) to clear all fields, click the save button ( ) to save changes to the current report profile, or
click the save as button ( ) to save any changes under a new profile name.
2. Scope – In the Scope configuration area, click the farm name and expand the data tree down to the desired farm/Web application/site collection/content database, or enter a URL/name in the search text box above the tree. Check the checkboxes next to the nodes you want to include in the report.
3. Generate Raw Data – Generate raw data of selected scopes. Click Generate Raw Data. The configuration window appears. Complete the following steps:
102
DocAve 6: Report Center
Export Location – Select a configured export location from the drop-down menu, or click New Export Location to create a new one. Refer to Export Location for more information.
E-mail Notification – Check the Send Notification checkbox and select the Recipient of this notification. You can select a previously configured e-mail notification profile, and then click View to access detailed information. Or, click New E-mail Notification to create a new e-mail notification profile. For details on creating an e-mail notification profile, see the User Notification Settings section in the DocAve 6 Control Panel Reference Guide. You can choose to have the report included in the e-mail as an attachment by checking the Attach report to the e-mail when the size of the report is less than … checkbox, and then enter the maximum size of the report allowed in the less than __ MB text box.
Physical Location – Check the Physical Location checkbox to include the physical location information in the raw data report. The Physical Location column will be added to the report files, and it allows you to have a general view on the physical location information of the data.
*Note: Including physical location information may slow down the generation speed.
The generated report displays the size of the object accordingly in the Size in Content Database(KB) column and the Size in Other Storage(KB) column.
4. Analysis Rule – Specify the critical object type, and configure the rules accordingly to generate report:
Object Type – Select the object (Attachment, Document, Document Version, Item, and Item Version) you want to contain in the report from the drop-down menu.
Rules – You must select at least one rule. Size Rule and Time Rule collect data and then display data separately in the report pane according to your configurations:
o Size Rule – Specify BLOB Size and Size Interval. The range from 0 to the specified BLOB size will be divided by the size interval, and displayed as the Y Axis of the report diagram. For example, if the specified BLOB size is 100MB and the size interval is 20MB. The Y Axis will display: 0MB, 20MB, 60MB, 80MB, and 100 MB.
o Time Rule – Specify a certain period and Time Interval for collecting data. Select the Created Date or Last Modified Date as the start time when the data is collected and displayed. You can select a duration from the Duration drop-down
list, or select Time Range option and click the calendar button ( ) to specify the time range and time zone. Then, enter an integer in the Time Interval text box. The time range will be divided by the time interval, and displayed as the Y Axis of the report diagram.
5. Schedule – In the schedule configuration area, choose one of the following options:
No Schedule– Collect the data manually by clicking the Run Report drop down list and selecting Run Report Only or Save Profile and Run Report. Clicking Save Profile and Run Report also saves the configured report profile.
103
DocAve 6: Report Center
Configure the schedule myself – Select this option to configure the specific time you want to collect the data of this profile. A schedule configuration area appears. You can customize the schedule with the following options:
o Start time – Select the date and time for collecting the data.
*Note: The start time cannot be earlier than the current time.
o Interval – Enter an integer into the text box and select by Hour(s), Day(s), Week(s), or Month(s). The data will be collected repeatedly based on this schedule. Click Calendar View to see the schedules in a calendar.
o Schedule ending – Designate when to stop collecting the data of this profile. Select No end date for the data of this profile to be collected repeatedly until you stop it manually. Select End after ___ occurrence(s) to have the job stopped after the defined occurrences that you configured in the text box. Select End by Date + Time to specify the exact date and time for the data to stop being collected.
o Export Report Settings – Check the Export report checkbox and configure the following settings for the reports to be exported.
Report Format – Select the desired format for the reports you want to export.
Export Location – Select the export location where you want to store the exported reports, and then click View to access the detailed information of the selected export location. If you want to configure a new export location, click New Export Location, and follow the instructions provided in the Export Location section of this guide.
Storage Analyzer Type – Select the type of the data you want to export.
Analysis Rule – Specify the rule based on which exported reports are generated.
Send Notification – Optionally, check the Send Notification checkbox and select the Recipient of this notification to send notification e-mails for the jobs of this profile. You can select a previously configured e-mail notification profile, and then click View to access detailed information, or click New E-mail Notification to create a new e-mail notification profile. For details on creating an e-mail notification profile, refer to the User Notification Settings section in the DocAve 6 Control Panel Reference Guide. You can choose to have the report included in the e-mail as an attachment by checking the Attach report to the e-mail when the size of the report is less than … checkbox, and then enter the maximum size of the report allowed in the less than __ MB.
Click the Run Report drop-down list, and then select Run Report only or Save Report and Run Report to
generate the report in the Report Display pane on the right.
104
DocAve 6: Report Center
Viewing Storage Analyzer Reports
Once you have generated a report, the Report Display pane has a number of configurable settings so
that you can customize how to display the reports, the following settings can be configured in the
Report Display pane:
Rule – Display the report according to the rule settings.
Display by – Order to display the data in.
X-Axis – Set the parameter for the X-axis.
Scope – Change the scope for the data shown in the report.
SQL Data Analyzer – BLOB data broken down by the specified object.
BLOB Inventory – BLOB storage information.
User Storage Size
User Storage Size is used to display storage size down at site collection level/site level for certain users
as well as the information on the content contributors to certain libraries, lists, and discussion boards.
Generating User Storage Size Reports
To configure the basic settings for the User Storage Size report, in the Infrastructure Reports tab of
Report Center, click User Storage Size on the ribbon. You can configure the following settings in the
Scope pane:
1. Report Profile Name – Select a previously configured profile from the drop-down menu or create a new profile by entering a new name in the Report Profile text box. Click the new button
( ) to clear all fields, click the save button ( ) to save changes to the current report profile, or
click the save as button ( ) to save any changes under a new profile name.
2. Scope – In the Scope configuration area, click the farm name and expand the data tree down to the desired site collection/site, or enter a URL/name in the search text box above the tree. Check the checkboxes next to the nodes you want to include in the report. To narrow down the search criteria and display fewer nodes under a particular farm/Web appellation level node or a Sites node on the tree, right-click the node and select Advanced Search to access the Advanced Search interface. For detailed instructions on using the Advanced Search feature, refer to Searching Nodes Using the Advanced Search Feature.
3. Enable Collector – Collect data for the report. By default, this feature collects the information at midnight everyday (according to your Control Service’s time zone). Click Data Collection to jump to the Data Collection page. By default, the collector schedule is enabled. To disable the collector schedule, uncheck the Enable Collector checkbox. The status of the collector will change to Disabled, and DocAve will not collect the information according to the schedule. For more information about Collector, refer to Data Collection.
105
DocAve 6: Report Center
4. User – In the User configuration area, you can set the users whose activity you want to view or do not want to view:
Include All Users – By default this option is selected. The activities of all users can be viewed.
Users to Exclude – Enter the users whose activity you do not wish to view. You can click
the check names button ( ) to check the name you entered or click the browse button (
) to find the users you want to exclude in the report.
Users to Include – Enter the users whose activity you want to view. You can click the
check names button ( ) to check the name you entered or click the browse button ( ) to find the users you want to include in the report.
Include Anonymous Users – Check the checkbox of Include Anonymous Users to include the activities of anonymous users.
5. E-mail Notification – Check the Usage alert checkbox if you want to have e-mail notifications sent out when the desired criteria are met. Then configure the following options:
Notification Name – Select a previously configured e-mail notification, or click New E-mail Notification to create a new e-mail notification profile. For details on creating an e-mail notification profile, see the User Notification Settings section in the DocAve 6 Control Panel Reference Guide.
Thresholds – Specify the triggers for this notification. Enter the values for More than __, then select MB or GB from the storage size drop-down menu.
*Note: By default, thresholds are checked depending on the interval you have configured. If these numbers exceed the thresholds set here, an e-mail notification will be sent.
Interval – Specify the frequency of e-mail notifications. Enter a positive integer into the Every text box, then select Day(s) or Week(s) from the drop-down menu.
Click Collect Now to collect the data of the current profile immediately, or click Show Report to
generate the report in the Report Display pane on the right.
Viewing User Storage Size Reports
Once you have generated a report, the Report Display pane has a number of configurable settings so
that you can customize how to display the reports, the following settings can be configured in the
Report Display pane:
Display by – Information to display the report by.
Sort by – Order to display the data in.
Scope – Change the scope for the data shown in the report.
User Storage Size – Storage size per user.
Details – Storage size per user per site collection/site URL.

106
DocAve 6: Report Center
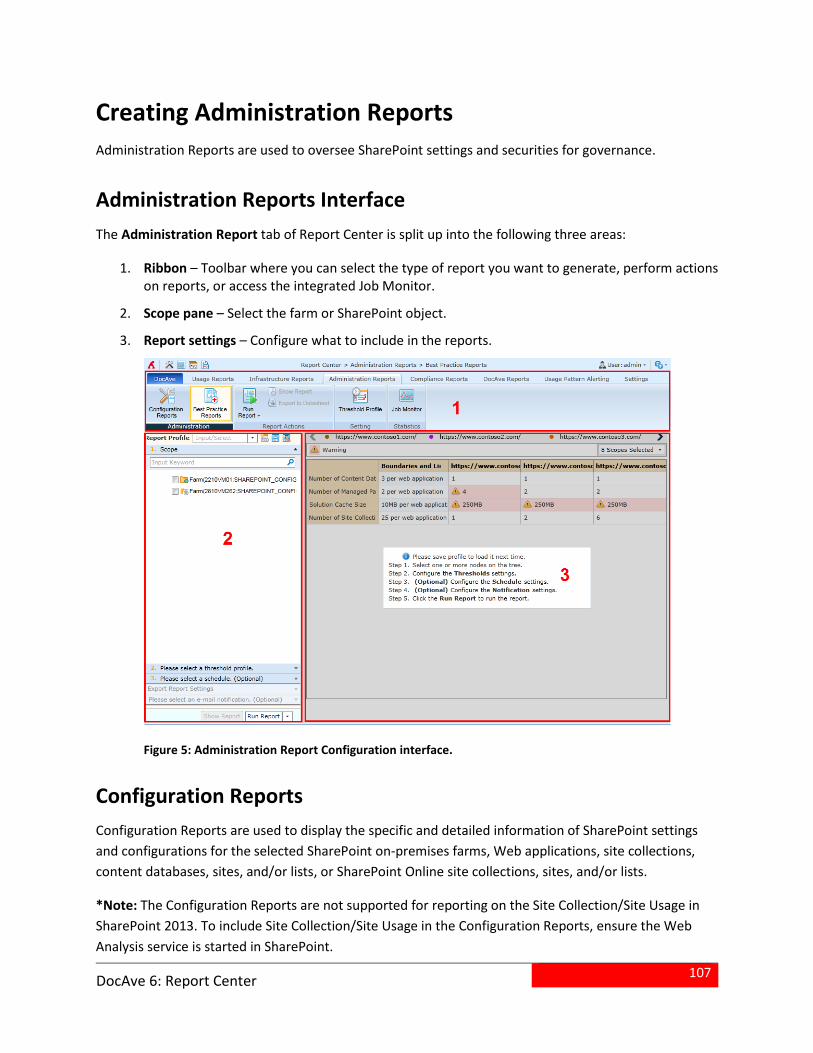
107
DocAve 6: Report Center
Creating Administration Reports
Administration Reports are used to oversee SharePoint settings and securities for governance.
Administration Reports Interface
The Administration Report tab of Report Center is split up into the following three areas:
1. Ribbon – Toolbar where you can select the type of report you want to generate, perform actions on reports, or access the integrated Job Monitor.
2. Scope pane – Select the farm or SharePoint object.
3. Report settings – Configure what to include in the reports.
Figure 5: Administration Report Configuration interface.
Configuration Reports
Configuration Reports are used to display the specific and detailed information of SharePoint settings
and configurations for the selected SharePoint on-premises farms, Web applications, site collections,
content databases, sites, and/or lists, or SharePoint Online site collections, sites, and/or lists.
*Note: The Configuration Reports are not supported for reporting on the Site Collection/Site Usage in
SharePoint 2013. To include Site Collection/Site Usage in the Configuration Reports, ensure the Web
Analysis service is started in SharePoint.
108
DocAve 6: Report Center
Generating Configuration Reports
To configure the basic settings for the Configuration report, in the Administration Reports tab of Report
Center, click Configuration Reports on the ribbon. You can configure the following settings in the Scope
pane:
1. Report Profile Name – Select a previously configured profile from the drop-down menu or create a new profile by entering a new name in the Report Profile text box. Click the new button
( ) to clear all fields, click the save button ( ) to save changes to the current report profile, or
click the save as button ( ) to save any changes under a new profile name.
2. Scope – In the Scope configuration area, click the farm name or My Registered Sites node to expand the tree. For SharePoint on-premises farm, you can expand the data tree down to the desired farm/Web application/content database/site collection/site/library/list; For the My Registered Sites, you can expand the data tree down to the group/site collection (or OneDrive for Business)/site/library/list. You can also enter a URL/name in the search text box above the tree to search objects. Check the checkboxes next to the nodes you want to include in the report.
*Note: You can generated the Configuration Reports when selecting multiple nodes at the same
level from different SharePoint farms, which can be SharePoint 2010, SharePoint 2013, or
SharePoint 2016.
3. Scope Filter – To filter SharePoint objects you would like to include in this profile within the selected scope, select a previously created scope filter from the Select a scope filter drop-down list. To create a new scope filter, click New Scope Filter. For details on creating a scope filter, refer to Configuring a Scope Filter.
4. Please select a schedule (Optional) – In the schedule configuration area, choose one of the following:
No Schedule – Select this option if you do not want to configure a schedule for this profile. If you choose this option, you must collect the data manually by clicking Save Profile and Run Report.
Configure the schedule myself – Select this option to configure the specific time you want to collect the data of this profile. A schedule configuration area appears. You can customize the schedule with the following options:
o Start time – Select the date and time for collecting the data.
*Note: The start time cannot be earlier than the current time.
o Interval – Enter an integer into the text box and select by Hour(s), Day(s), Week(s), or Month(s). The data will be collected repeatedly based on this schedule. Click Calendar View to see the schedules in a calendar.
o Schedule ending – Designate when to stop collecting the data of this profile. Select No end date for the data of this profile to be collected repeatedly until you stop it manually. Select End after __ occurrence(s) to have the job stopped after the defined occurrences you designate in the text box. Select
109
DocAve 6: Report Center
End by Date + Time to specify the exact date and time for the data to stop being collected. Then select the desired Report Format and Export Location in the Export Report Settings configuration area, and click View to access to the detailed information of the selected export location. If you want to configure a new export location, click New Export Location, then follow the instructions provided in the Export Location section of this guide.
5. Please select an e-mail notification (Optional) – Check the Export Report checkbox and select a notification profile from the E-mail Notification drop-down menu, or click New E-mail Notification to create a new profile. For more information, see the User Notification Settings section in the DocAve 6 Control Panel Reference Guide. You can choose to have the report included in the e-mail as an attachment by checking the Attach report to the e-mail when the size of the report is less than … checkbox, and then enter the maximum size of the report allowed in the less than __ MB text box.
6. Please configure report settings – Configure what information you would like the report to contain.
Report Settings – Select the corresponding checkboxes next to the information you want to include.
*Note: You can configure to generate the SharePoint Storage Report by selecting the
SharePoint Storage Report option in the Statistics group. The SharePoint Storage
Report will be included in the SharePoint Storage Report section of the exported
report, displaying the number of lower level nodes and the storage size of the objects
within the selected scope. The data in the Total Size column includes the specific
object’s SQL storage size and the size of data stored in logical devices. The SQL Size
includes the specific object’s SQL storage size. The Actual Storage Size includes the
occupied SQL storage size and the size of other storages occupied by Storage Manager
and Connector.
At the Site Collection level, you can select the Sharing Outside Your Company option
from the Generate Settings category to report on the events where your employees
share the SharePoint files, folders, or libraries outside your company.
Additional Report Type – Select whether to include summary reports in the exported report.
o Include summary report (XLS and XLSX formats only) –To include the summary reports of each node at specific levels, select this option and then select the corresponding checkboxes for the levels where you want to include the summary reports.
When you have finished configuring the settings, click Save Profile and Run Report. The Export Report
window appears. Select the desired Report Format and Export Location, and then click View to access
to the detailed information of the selected export location. If you want to configure a new export
location, click New Export Location, then follow the instructions provided in the Export Location section
of this guide.
110
DocAve 6: Report Center
*Note: When exporting a Configuration report in Microsoft Excel (XLS/XLSX) format, each sheet of Excel
can only contain 500,000 records. If the number of report records exceeds 500,000, a new sheet will be
created in the Excel. A workbook cannot exceed 1370 sheets, otherwise, it will not be viewable. This is a
built-in restriction of the Microsoft Excel software.
Check the Send Notification checkbox to notify the users of the status of reports. Select the Recipient of
this notification. You can choose to have the report included in the e-mail as an attachment by checking
the Attach report to the e-mail when the size of the report is less than … checkbox, and then enter the
maximum size of the report allowed in the less than __ MB text box.
Click OK to generate the report or Cancel to return to the configurations.
Best Practice Reports
Since SharePoint comes with some performance limitations, Best Practice Reports are designed to
oversee configurations and settings in SharePoint and help you to check performance and inform the
related users in a timely manner.
About Threshold Profile
Best Practice Reports include a Threshold Profile that is used to judge whether the SharePoint
environment is healthy or not. The threshold profile allows you to configure the boundaries and
limitations of each SharePoint object level with the SharePoint default limitation as a reference. Each
SharePoint 2010 farm, SharePoint 2013 farm, and SharePoint 2016 farm has a whole set of default
threshold profiles at each SharePoint object level.
In the Best Practice Reports interface, click Threshold Profile on the ribbon to go to the Settings >
Threshold Profile interface. A list of the default threshold profiles and your previously-created threshold
profiles will be displayed in this page.
To change the number of threshold profiles displayed per page, select the desired number from the
Show rows drop-down menu in the lower right-hand corner. To sort the threshold profiles, click on the
column heading such as Profile Name, SharePoint Version, or Report Level.
In the viewing pane, you can customize how these threshold profiles are displayed in the following ways:
Search – Filter the threshold profiles displayed by the keyword you designate. The keyword must be contained in a column value. At the top of the viewing pane, enter the keyword for the threshold profiles you want to display. You can select to Search all pages or Search current page.
*Note: The search function is not case sensitive.
Manage columns ( ) – Manage which columns are displayed in the list so that only the information you want to see is displayed. Click the manage columns button ( ), and
111
DocAve 6: Report Center
then check the checkbox next to the column name to have that column shown in the list.
Hide the column ( ) – Hide the column. Hover over the column name of the column you want to hide, and then click the hide the column button ( ).
Filter the column ( ) – Filter which item in the list is displayed. Unlike search, you can filter whichever item you want, rather than search based on a keyword. Hover over the
column name, and then click the filter the column button ( ) of the column you want to filter. Check the checkbox next to the item name to have that item shown in the list.
You can perform the following actions to the threshold profiles:
Create – Click Create on the ribbon to create a new threshold profile. For details on creating a new threshold profile, see the Configuring Threshold Profile section in this guide.
Edit – Select the threshold profile, and then click Edit on the ribbon to open the Settings > Threshold Profile Interface. Make the necessary changes, and then click Save to save the changes, or click Cancel to close the interface without saving any changes.
Delete – Click Delete on the ribbon. A confirmation window pops up and asks if you are sure you want to proceed with the deletion. Click OK to delete the selected threshold profiles, or click Cancel to return to the Threshold Profile interface without deleting the selected threshold profiles.
To exit the Threshold Profile page, click Close on the ribbon to return to the Best Practice Reports
interface.
Configuring Threshold Profile
1. In the Threshold Profile interface, click Create on the ribbon to create a new threshold profile, or click Edit when you selected a previously-created threshold profile to edit the settings. To configure the threshold profile settings, complete the following steps: Profile Name – Enter a new Profile Name in the text box.
2. SharePoint Version – Specify the SharePoint version of the threshold profile that you are about to create.
3. Report Level – Select the desired Report Level from the drop-down menu.
4. Threshold Settings – Check the desired Limit, and then the value of the threshold becomes editable (the default value is the Maximum Value). Select the desired type of threshold and configure the value. Refer to the following explanations of these columns.
Limit – The name of SharePoint Limitation.
Maximum Value – The maximum value of each limit recommended by Microsoft.
Limit Type – There are two limit types:
o Threshold – Configurable limits that can be exceeded to accommodate specific requirements.
112
DocAve 6: Report Center
o Supported – Configurable limits that have been set by default to a tested value.
*Note: When you create a farm/Web application/site collection threshold profile, the Include Lower Level area will appear below the table. The Include Lower Level area is only for exporting the report, meaning that lower level information will only be contained in the exported report, and the corresponding information will not be displayed in the report pane. If you want to contain the performance information of the lower levels in the exported report, check the corresponding checkbox next to desired level and specify the threshold settings.
5. When you have finished, click Save to save these configurations, or click Cancel to close the Threshold Profile configuration interface without saving any changes.
Generating Best Practice Reports
To configure the basic settings for the Best Practice Reports, click Best Practice Reports on the ribbon in
the Administration Reports tab of Report Center. Configure the following settings in the Scope pane:
1. Report Profile Name – Select a previously configured profile from the drop-down menu or create a new profile by entering a new name in the Report Profile text box. Click the new button
( ) to clear all fields, click the save button ( ) to save changes to the current report profile, or
click the save as button ( ) to save any changes under a new profile name.
2. Scope – In the Scope configuration area, click the farm name and expand the data tree down to the desired object level, or enter a URL/name in the search text box above the tree. Check the checkboxes next to the nodes you want to include in the report.
*Note: You can generate the Best Practice Reports when selecting multiple nodes at the same level from all the SharePoint 2010 tree, the SharePoint 2013, and SharePoint 2016 tree at the same time.
3. Threshold Profile – Select one of the default threshold profiles from the Threshold Profile drop-down menu. If you want to view or edit the selected profile, click the View and Edit Threshold Profile link to jump to the Threshold Profile interface. To create a new threshold profile, click New Threshold Profile in the drop-down menu to create a new one. Refer to Configuring Threshold Profile for more information on configuring the threshold profile settings. If you want to view all current profiles, click Threshold Profile on the ribbon. Refer to About Threshold Profile for more information on managing the threshold profiles.
*Note: If you select the nodes of SharePoint 2010, only the threshold profiles of SharePoint 2010 can be selected. If you select the nodes of SharePoint 2013, the threshold profiles of SharePoint 2010 and SharePoint 2013 are both available to be selected. If you select the nodes of SharePoint 2016, only the threshold profiles of SharePoint 2016 can be selected. If you have selected the nodes from SharePoint 2010 farm and SharePoint 2013 farm, only the threshold profiles whose SharePoint version is SharePoint 2010 can be selected. In the farm level threshold profile, the Social Tags, Notes and Ratings threshold is not supported for the ratings data in SharePoint 2013.
4. Schedule – In the schedule configuration area, choose one of the following:
113
DocAve 6: Report Center
No Schedule – Select this option if you do not want to configure a schedule for this profile. If you choose this option, you must collect the data manually by clicking Run Report only or Save Profile and Run Report.
Configure the schedule myself – Select this option to configure the specific time you want to collect the data of this profile. A schedule configuration area appears. You can customize the schedule with the following options:
o Export report – Choose whether to configure the Export Report Settings to store the Best Practice reports by checking the Export report checkbox.
o Start time – Select the date and time for applying the rules of this profile and collecting the data.
*Note: The start time cannot be earlier than the current time.
o Interval – Enter an integer into the text box and select by Hour(s), Day(s), Week(s), or Month(s). The data will be collected repeatedly based on this schedule. Click Calendar View to see the schedules in a calendar.
o Schedule ending – Designate when to stop collecting the data for this profile. Select No end date for the data of this profile to be collected repeatedly until you stop it manually. Select End after ___ occurrence(s) to have the job stopped after the defined occurrences that you configured in the text box. Select End by Date + Time to specify the exact date and time for the data to stop being collected.
o Export Report Settings – Check the Export report checkbox. The Export Report Settings configuration area appears. Select the desired Report Format and Export Location, and then click View to access the detailed information of the selected export location. If you want to configure a new export location, click New Export Location, and follow the instructions provided in the Export Location section of this guide.
*Note: When exporting a Best Practice report in Microsoft Excel (XLS) format, the workbook cannot exceed 1370 sheets, or it will not be viewable.
This is a restriction is built-in to the Microsoft Excel software.
o Notification (Optional) – Check the Send Notification checkbox. The settings area appears.
Select the Recipient of this notification. You can choose to send the e-mail notification to Farm Administrator (for the reports at farm/Web application/Content Database level), Site Collection Administrator (for the reports at site collection or list level), or the Predefined Recipient. If you choose Predefined Recipient, select a predefined e-mail notification profile from the drop-down menu and click View to access the details. Or, you can click New E-mail Notification to create a new one. See the User Notification Settings section in the DocAve 6 Control Panel Reference Guide for more information.
You can choose to have the report included in the e-mail as an attachment by checking the Attach report to the e-mail when the size of the report is
114
DocAve 6: Report Center
less than … checkbox, and then enter the maximum size of the report allowed in the less than __ MB text box. If you check the Send unhealthy information only checkbox, the attached report in the e-mail will only contain the information of the unhealthy nodes (the nodes whose settings exceed the boundaries or limitations configured in the corresponding threshold profile); otherwise, you will receive all of the information contained in the attached report, according to the threshold profile settings you have configured.
5. Choose one of the following instructions to run the job:
Click Save profile and run report to save the configuration and then run the job. After the job finishes, the report is displayed in the pane. You can click Show Report to view the history data collected before. However, if this profile has no running job record, the Show Report is grayed out.
You can click the save button ( ) to save the report profile, and then navigate to Export to Datasheet from the Report Actions group on the ribbon. You are brought to the Export Report window. Complete the following steps to generate report:
o Select the desired Report Format and Export Location which has been already created. If you want to configure a new export location, click New Export Location, and then follow the instructions provided in the Export Location section of this guide.
*Note: The report generated by the Export Report will not be displayed on the report pane. But the export job will be recorded in Job Monitor. *Note: When exporting a Best Practice report in Microsoft Excel (XLS) format, the workbook cannot exceed 1370 sheets, or it will not be viewable. This is a restriction built-in to the Microsoft Excel software.
o Source Data – Check Last generated data checkbox is to export the report whose data was collected last time. Check Generate data now to run this job immediately.
o Notification – Check the Send Notification checkbox and select the Recipient of this notification. You can select a previously configured e-mail notification profile, and then click View to access detailed information. Or, click New E-mail Notification to create a new e-mail notification profile. For details on creating an e-mail notification profile, see the User Notification Settings section in the DocAve 6 Control Panel Reference Guide. You can choose to have the report included in the e-mail as an attachment by checking the Attach report to the e-mail when the size of the report is less than … checkbox, and then enter the maximum size of the report allowed in the less than __ MB text box.
Click OK to generate the report or Cancel to return to the configurations.
115
DocAve 6: Report Center
Viewing Best Practice Reports
Once you have generated a report, the Report Display pane has a number of configurable settings so
that you can customize how to display the reports. The following settings can be configured in the
Report Display pane:
Object Bar – The nodes whose information will be displayed in the table below.
Scope – Change the scope for the data shown in the report.
Warning ( ) – Emphasize the configurations which have exceeded the limitations.
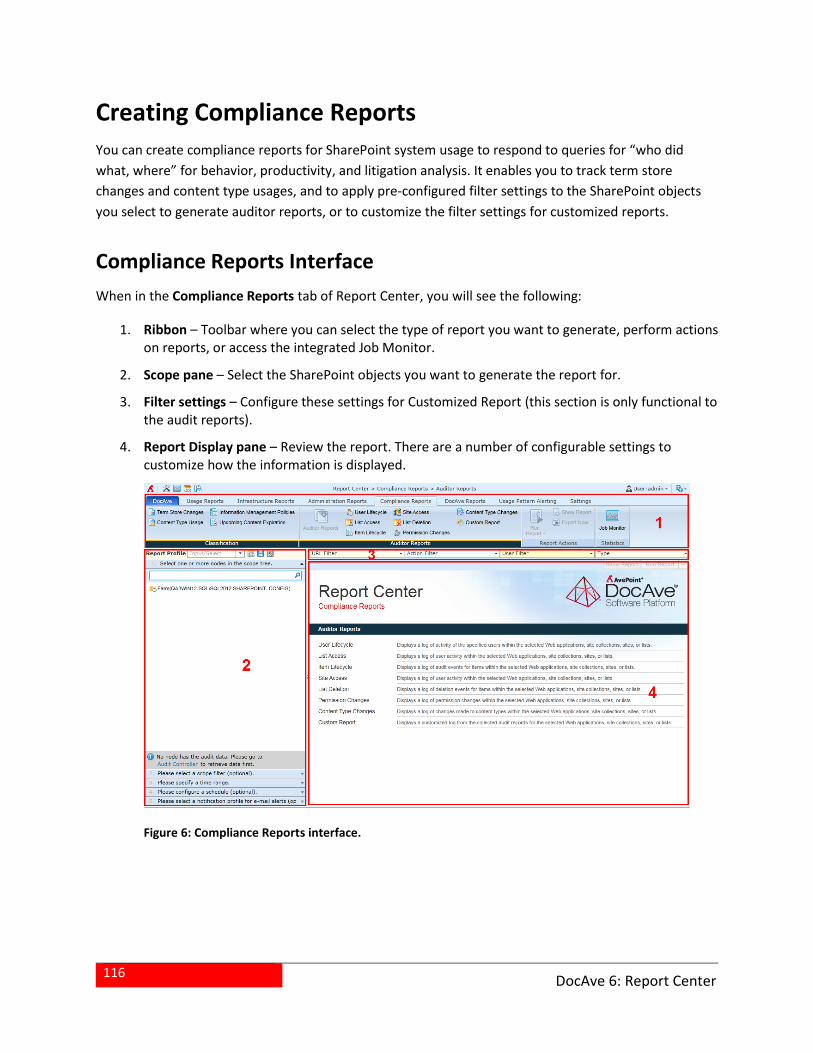
116
DocAve 6: Report Center
Creating Compliance Reports
You can create compliance reports for SharePoint system usage to respond to queries for “who did
what, where” for behavior, productivity, and litigation analysis. It enables you to track term store
changes and content type usages, and to apply pre-configured filter settings to the SharePoint objects
you select to generate auditor reports, or to customize the filter settings for customized reports.
Compliance Reports Interface
When in the Compliance Reports tab of Report Center, you will see the following:
1. Ribbon – Toolbar where you can select the type of report you want to generate, perform actions on reports, or access the integrated Job Monitor.
2. Scope pane – Select the SharePoint objects you want to generate the report for.
3. Filter settings – Configure these settings for Customized Report (this section is only functional to the audit reports).
4. Report Display pane – Review the report. There are a number of configurable settings to customize how the information is displayed.
Figure 6: Compliance Reports interface.
117
DocAve 6: Report Center
Term Store Changes
Term Store Changes reports enable you to track changes of metadata across your SharePoint
environment.
Generating Term Store Changes Reports
To configure the basic settings for the Term Store Changes report, open the Compliance Reports tab of
Report Center, click Term Store Changes in the Classification group on the ribbon. You can configure the
following settings in the Scope pane:
1. Report Profile Name – Select a previously configured profile from the drop-down menu or create a new profile by entering a new name in the Report Profile text box. Click the new button
( ) to clear all fields, click the save button ( ) to save changes to the current report profile, or
click the save as button ( ) to save any changes under a new profile name.
2. Scope – In the Scope configuration area, click the farm name and expand the data tree down to the desired term group/term set, or enter a URL/name in the search text box above the tree. Check the checkboxes next to the nodes you want to include in the report.
3. Schedule – In the schedule configuration area, choose one of the following options:
No Schedule – Select this option if you do not want to configure a schedule for this profile. If you choose this option, you must collect the data manually by clicking Run Report Only or Save Profile and Run Report.
Configure the schedule myself – Select this option to configure the specific time you want to collect the data of this profile. A schedule configuration area appears. You can customize the schedule with the following options:
o Export report – Choose whether or not to configure the Export Report Settings to store the Term Store Changes reports by checking the Export report checkbox.
o Start time – Select the date and time for collecting the data.
*Note: The start time cannot be earlier than the current time.
o Interval – Enter an integer into the text box and select by Hour(s), Day(s), Week(s), or Month(s). The data will be collected repeatedly based on this schedule. Click Calendar View to see the schedules in a calendar.
o Schedule ending – Designate when to stop collecting the data for this profile. Select No end date for the data of this profile to be collected repeatedly until you stop it manually. Select End after ___ occurrence(s) to have the job stopped after the defined occurrences that you configured in the text box. Select End by Date + Time to specify the exact date and time for the data to stop being collected.
o Export Report Settings – Check the Export report checkbox. The Export Report Settings configuration area appears. Select the desired Report Format and Export Location, and then click View to access the detailed
118
DocAve 6: Report Center
information of the selected export location. If you want to configure a new export location, click New Export Location, and follow the instructions provided in the Export Location section of this guide.
o Notification – Check the Send Notification checkbox and select the Recipient of this notification. You can select a previously configured e-mail notification profile, and then click View to access detailed information. Or, click New E-mail Notification to create a new e-mail notification profile. For details on creating an e-mail notification profile, see the User Notification Settings section in the DocAve 6 Control Panel Reference Guide. You can choose to have the report included in the e-mail as an attachment by checking the Attach report to the e-mail when the size of the report is less than … checkbox, and then enter the maximum size of the report allowed in the less than __ MB text box.
4. Time Range – Specify the time range for collecting the data of term store changes. In the Time Range configuration area, choose one of the following options:
Duration – Check the Duration checkbox, and then select the desired time range from the drop-down menu. There are eight durations provided: This Month, Last Month, Last 2 Months, This Week, Last Week, Last 2 Weeks, Today, and Yesterday.
Custom – Check the Custom checkbox to customize the time range as you want.
5. Choose one of the following options to run the Term Store Changes report:
Click Run Report, and then select Run Report only to run the job, or select Save profile and run report from the drop-down menu to save the configuration and then run the job. After the job finishes, the report is displayed in the Report Display pane. You can click Show Report to view the history data collected before. However, if this profile has no running job record, the Show Report is grayed out.
Click the save button ( ) to save the report profile, and then click Export Now in the Report Actions group on the ribbon. The Export to Datasheet window appears. Complete the following steps to generate the report:
o Report Format – Select the desired report format from the drop-down menu.
o Export Settings – Choose whether to export the report now. Check the Export to local immediately checkbox and click OK to export the report immediately, or check the Export to a different location checkbox, and then configure the following settings:
Export Location – Select one previously configured export location from the drop-down menu, or if you want to configure a new export location, click New Export Location, then follow the instructions provided in the Export Location section of this guide.
Notification – Check the Send Notification checkbox and select the Recipient of this notification. You can select a previously configured e-mail notification profile and click View to access detailed information, or click New E-mail Notification to create a new e-mail notification profile. For details on creating an e-mail notification profile, see the User
119
DocAve 6: Report Center
Notification Settings section in the DocAve 6 Control Panel Reference Guide. You can choose to have the report included in the e-mail as an attachment by checking the Attach report to the e-mail when the size of the report is less than … checkbox, and then enter the maximum size of the report allowed in the less than __ MB text box.
Click OK to save the configurations and export the report. Click Cancel to go back to the Term Store Changes report interface without saving the configurations.
Viewing Term Store Changes Reports
Once you have generated a report, the Report Display pane has a number of configurable settings so
that you can customize how to display the reports, the following settings can be configured in the
Report Display pane:
Object Bar – Display all of the selected nodes.
Scope – Change the scope for the data shown in the report.
Content Type Usage Reports
Content Type Usage reports are designed to report the site content type usage across the sites and lists
in SharePoint.
Generating the Content Type Usage Reports
To configure the basic settings for the Content Type Usage reports, open the Compliance Reports tab of
Report Center, and click Content Type Usage in the Classification group on the ribbon. You can
configure the following settings in the Scope pane:
1. Report Profile Name – Select a previously configured profile from the drop-down menu or create a new profile by entering a new name in the Report Profile text box. Click the new button
( ) to clear all fields, click the save button ( ) to save changes to the current report profile, or
click the save as button ( ) to save any changes under a new profile name.
2. Scope – In the Scope configuration area, click the farm name and expand the data tree down to the desired site collection/site, or enter a URL/name in the search text box above the tree. Check the checkboxes next to the nodes you want to include in the report. To narrow down the search criteria and display fewer nodes under a particular farm/Web appellation level node or a Sites node on the tree, right-click the node and select Advanced Search to access the Advanced Search interface. For detailed instructions on using the Advanced Search feature, refer to Searching Nodes Using the Advanced Search Feature.
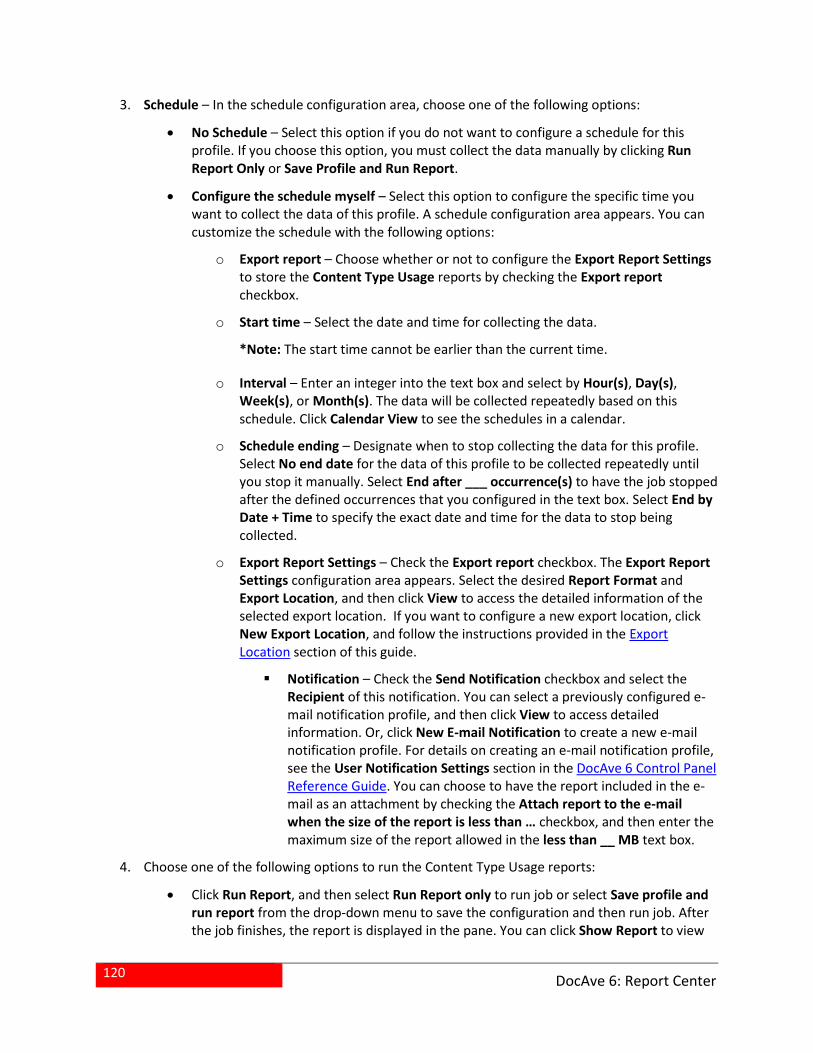
120
DocAve 6: Report Center
3. Schedule – In the schedule configuration area, choose one of the following options:
No Schedule – Select this option if you do not want to configure a schedule for this profile. If you choose this option, you must collect the data manually by clicking Run Report Only or Save Profile and Run Report.
Configure the schedule myself – Select this option to configure the specific time you want to collect the data of this profile. A schedule configuration area appears. You can customize the schedule with the following options:
o Export report – Choose whether or not to configure the Export Report Settings to store the Content Type Usage reports by checking the Export report checkbox.
o Start time – Select the date and time for collecting the data.
*Note: The start time cannot be earlier than the current time.
o Interval – Enter an integer into the text box and select by Hour(s), Day(s), Week(s), or Month(s). The data will be collected repeatedly based on this schedule. Click Calendar View to see the schedules in a calendar.
o Schedule ending – Designate when to stop collecting the data for this profile. Select No end date for the data of this profile to be collected repeatedly until you stop it manually. Select End after ___ occurrence(s) to have the job stopped after the defined occurrences that you configured in the text box. Select End by Date + Time to specify the exact date and time for the data to stop being collected.
o Export Report Settings – Check the Export report checkbox. The Export Report Settings configuration area appears. Select the desired Report Format and Export Location, and then click View to access the detailed information of the selected export location. If you want to configure a new export location, click New Export Location, and follow the instructions provided in the Export Location section of this guide.
Notification – Check the Send Notification checkbox and select the Recipient of this notification. You can select a previously configured e-mail notification profile, and then click View to access detailed information. Or, click New E-mail Notification to create a new e-mail notification profile. For details on creating an e-mail notification profile, see the User Notification Settings section in the DocAve 6 Control Panel Reference Guide. You can choose to have the report included in the e-mail as an attachment by checking the Attach report to the e-mail when the size of the report is less than … checkbox, and then enter the maximum size of the report allowed in the less than __ MB text box.
4. Choose one of the following options to run the Content Type Usage reports:
Click Run Report, and then select Run Report only to run job or select Save profile and run report from the drop-down menu to save the configuration and then run job. After the job finishes, the report is displayed in the pane. You can click Show Report to view
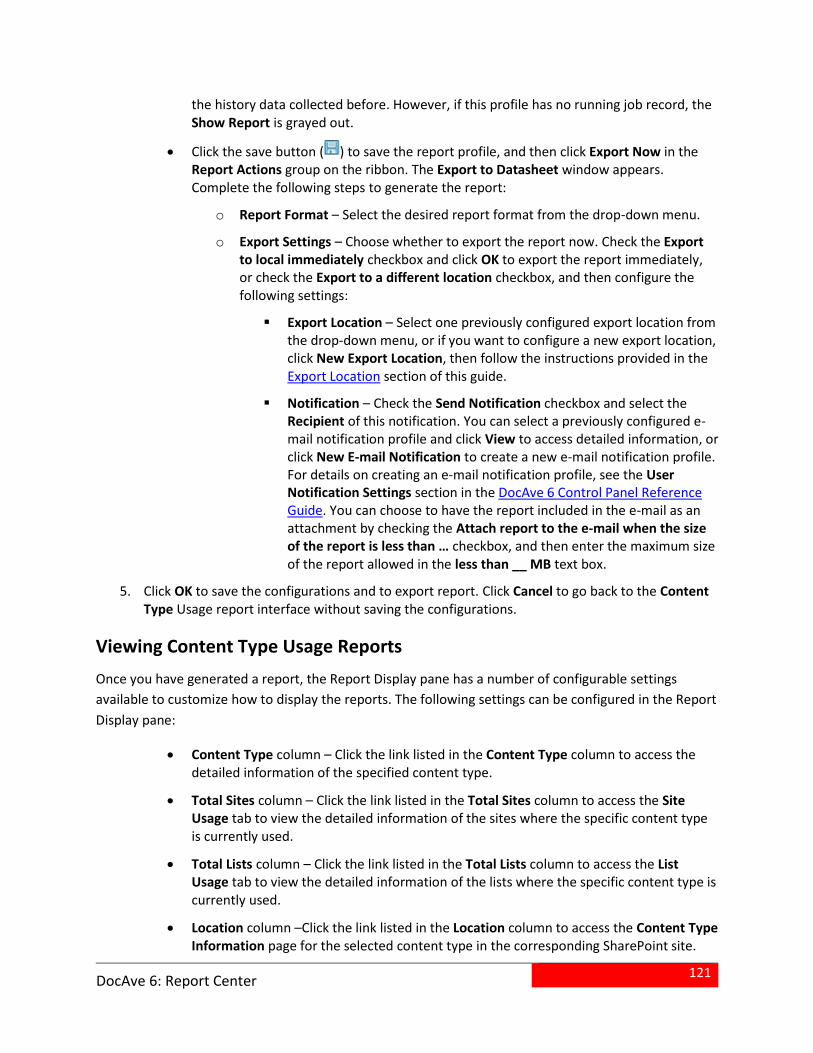
121
DocAve 6: Report Center
the history data collected before. However, if this profile has no running job record, the Show Report is grayed out.
Click the save button ( ) to save the report profile, and then click Export Now in the Report Actions group on the ribbon. The Export to Datasheet window appears. Complete the following steps to generate the report:
o Report Format – Select the desired report format from the drop-down menu.
o Export Settings – Choose whether to export the report now. Check the Export to local immediately checkbox and click OK to export the report immediately, or check the Export to a different location checkbox, and then configure the following settings:
Export Location – Select one previously configured export location from the drop-down menu, or if you want to configure a new export location, click New Export Location, then follow the instructions provided in the Export Location section of this guide.
Notification – Check the Send Notification checkbox and select the Recipient of this notification. You can select a previously configured e-mail notification profile and click View to access detailed information, or click New E-mail Notification to create a new e-mail notification profile. For details on creating an e-mail notification profile, see the User Notification Settings section in the DocAve 6 Control Panel Reference Guide. You can choose to have the report included in the e-mail as an attachment by checking the Attach report to the e-mail when the size of the report is less than … checkbox, and then enter the maximum size of the report allowed in the less than __ MB text box.
5. Click OK to save the configurations and to export report. Click Cancel to go back to the Content Type Usage report interface without saving the configurations.
Viewing Content Type Usage Reports
Once you have generated a report, the Report Display pane has a number of configurable settings
available to customize how to display the reports. The following settings can be configured in the Report
Display pane:
Content Type column – Click the link listed in the Content Type column to access the detailed information of the specified content type.
Total Sites column – Click the link listed in the Total Sites column to access the Site Usage tab to view the detailed information of the sites where the specific content type is currently used.
Total Lists column – Click the link listed in the Total Lists column to access the List Usage tab to view the detailed information of the lists where the specific content type is currently used.
Location column –Click the link listed in the Location column to access the Content Type Information page for the selected content type in the corresponding SharePoint site.
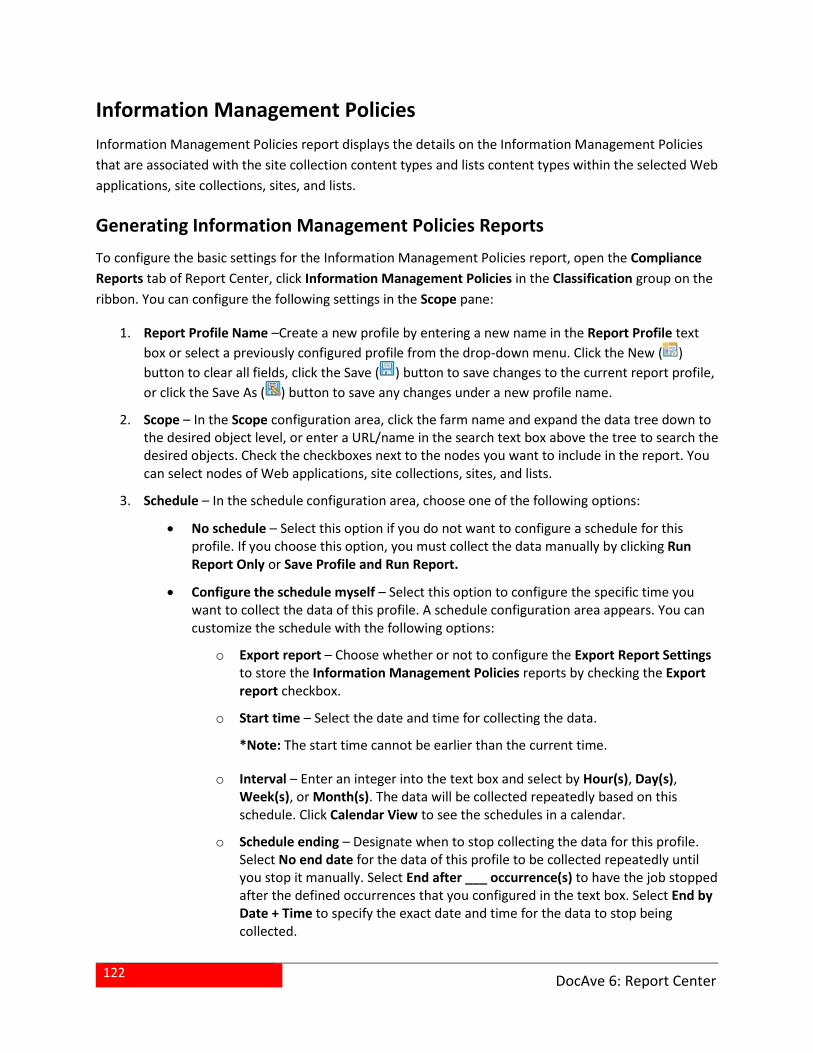
122
DocAve 6: Report Center
Information Management Policies
Information Management Policies report displays the details on the Information Management Policies
that are associated with the site collection content types and lists content types within the selected Web
applications, site collections, sites, and lists.
Generating Information Management Policies Reports
To configure the basic settings for the Information Management Policies report, open the Compliance
Reports tab of Report Center, click Information Management Policies in the Classification group on the
ribbon. You can configure the following settings in the Scope pane:
1. Report Profile Name –Create a new profile by entering a new name in the Report Profile text
box or select a previously configured profile from the drop-down menu. Click the New ( )
button to clear all fields, click the Save ( ) button to save changes to the current report profile,
or click the Save As ( ) button to save any changes under a new profile name.
2. Scope – In the Scope configuration area, click the farm name and expand the data tree down to the desired object level, or enter a URL/name in the search text box above the tree to search the desired objects. Check the checkboxes next to the nodes you want to include in the report. You can select nodes of Web applications, site collections, sites, and lists.
3. Schedule – In the schedule configuration area, choose one of the following options:
No schedule – Select this option if you do not want to configure a schedule for this profile. If you choose this option, you must collect the data manually by clicking Run Report Only or Save Profile and Run Report.
Configure the schedule myself – Select this option to configure the specific time you want to collect the data of this profile. A schedule configuration area appears. You can customize the schedule with the following options:
o Export report – Choose whether or not to configure the Export Report Settings to store the Information Management Policies reports by checking the Export report checkbox.
o Start time – Select the date and time for collecting the data.
*Note: The start time cannot be earlier than the current time.
o Interval – Enter an integer into the text box and select by Hour(s), Day(s), Week(s), or Month(s). The data will be collected repeatedly based on this schedule. Click Calendar View to see the schedules in a calendar.
o Schedule ending – Designate when to stop collecting the data for this profile. Select No end date for the data of this profile to be collected repeatedly until you stop it manually. Select End after ___ occurrence(s) to have the job stopped after the defined occurrences that you configured in the text box. Select End by Date + Time to specify the exact date and time for the data to stop being collected.
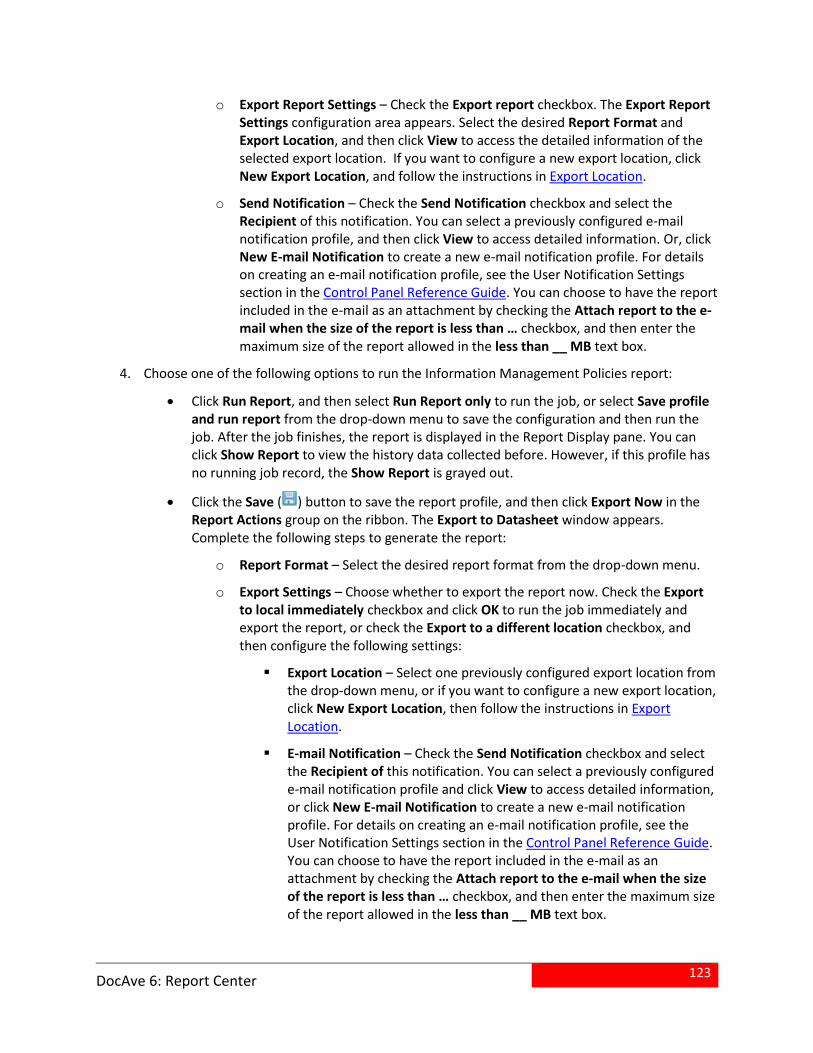
123
DocAve 6: Report Center
o Export Report Settings – Check the Export report checkbox. The Export Report Settings configuration area appears. Select the desired Report Format and Export Location, and then click View to access the detailed information of the selected export location. If you want to configure a new export location, click New Export Location, and follow the instructions in Export Location.
o Send Notification – Check the Send Notification checkbox and select the Recipient of this notification. You can select a previously configured e-mail notification profile, and then click View to access detailed information. Or, click New E-mail Notification to create a new e-mail notification profile. For details on creating an e-mail notification profile, see the User Notification Settings section in the Control Panel Reference Guide. You can choose to have the report included in the e-mail as an attachment by checking the Attach report to the e-mail when the size of the report is less than … checkbox, and then enter the maximum size of the report allowed in the less than __ MB text box.
4. Choose one of the following options to run the Information Management Policies report:
Click Run Report, and then select Run Report only to run the job, or select Save profile and run report from the drop-down menu to save the configuration and then run the job. After the job finishes, the report is displayed in the Report Display pane. You can click Show Report to view the history data collected before. However, if this profile has no running job record, the Show Report is grayed out.
Click the Save ( ) button to save the report profile, and then click Export Now in the Report Actions group on the ribbon. The Export to Datasheet window appears. Complete the following steps to generate the report:
o Report Format – Select the desired report format from the drop-down menu.
o Export Settings – Choose whether to export the report now. Check the Export to local immediately checkbox and click OK to run the job immediately and export the report, or check the Export to a different location checkbox, and then configure the following settings:
Export Location – Select one previously configured export location from the drop-down menu, or if you want to configure a new export location, click New Export Location, then follow the instructions in Export Location.
E-mail Notification – Check the Send Notification checkbox and select the Recipient of this notification. You can select a previously configured e-mail notification profile and click View to access detailed information, or click New E-mail Notification to create a new e-mail notification profile. For details on creating an e-mail notification profile, see the User Notification Settings section in the Control Panel Reference Guide. You can choose to have the report included in the e-mail as an attachment by checking the Attach report to the e-mail when the size of the report is less than … checkbox, and then enter the maximum size of the report allowed in the less than __ MB text box.
124
DocAve 6: Report Center
5. Click OK to save the configurations and export the report. Click Cancel to go back to the Information Management Policies report interface without saving the configurations.
Viewing Information Management Policies Reports
Once you have successfully generated a report, the Report Display pane has a number of configurable
settings so that you can customize how to display the reports, the following settings can be configured
in the Report Display pane:
Object Bar – Display all of the selected nodes.
Scope – Change the scope for the data shown in the report.
Upcoming Content Expiration
Upcoming Content Expiration report displays the details of the contents that have applied the retention
settings of the Information Management Policy and are about to be expired in the specified time range
within the selected Web applications, site collections, sites, and lists.
Generating Upcoming Content Expiration Reports
To configure the basic settings for the Upcoming Content Expiration report, open the Compliance
Reports tab of Report Center, and then click Upcoming Content Expiration in the Classification group
on the ribbon. Configure the following settings in the Scope pane:
1. Report Profile Name – Create a new profile by entering a new name in the Report Profile text
box or select a previously configured profile from the drop-down menu. Click the New ( )
button to clear all fields, click the Save ( ) button to save changes to the current report profile,
or click the Save As ( ) button to save any changes under a new profile name.
2. Scope – In the Scope configuration area, click the farm name and expand the data tree down to the desired object level, or enter a URL/name in the search text box above the tree to search the desired objects. Check the checkboxes next to the nodes you want to include in the report. You can select nodes of Web applications, site collections, sites, and lists.
3. Expiration Setting – Specify the filter settings on the expiration date or period for the contents to display.
Expiring on – Select a date from the calendar to report on the contents that will be expired on the specified date.
Expiring before – Select a date from the calendar to report on the contents that will be expired before the specified date.
Expiration data range – Select a time range from the calendars to report on the contents that will be expired in the specified period.
Expiring in _ days – Select 30, 60, or 90 from the drop-down list to report on the contents that will be expired in the specified period.
125
DocAve 6: Report Center
4. Schedule – In the schedule configuration area, choose one of the following options:
No schedule – Select this option if you do not want to configure a schedule for this profile. If you choose this option, you must collect the data manually by clicking Run Report Only or Save Profile and Run Report.
Configure the schedule myself – Select this option to configure the specific time you want to collect the data of this profile. A schedule configuration area appears. You can customize the schedule with the following options:
o Export report – Choose whether or not to configure the Export Report Settings to store the Upcoming Content Expiration reports by checking the Export report checkbox.
o Start time – Select the date and time for collecting the data.
*Note: The start time cannot be earlier than the current time.
o Interval – Enter an integer into the text box and select by Hour(s), Day(s), Week(s), or Month(s). The data will be collected repeatedly based on this schedule. Click Calendar View to see the schedules in a calendar.
o Schedule ending – Designate when to stop collecting the data for this profile. Select No end date for the data of this profile to be collected repeatedly until you stop it manually. Select End after ___ occurrence(s) to have the job stopped after the defined occurrences that you configured in the text box. Select End by Date + Time to specify the exact date and time for the data to stop being collected.
o Export Report Settings – Check the Export report checkbox. The Export Report Settings configuration area appears. Select the desired Report Format and Export Location, and then click View to access the detailed information of the selected export location. If you want to configure a new export location, click New Export Location, and follow the instructions provided in Export Location.
o Send Notification – Check the Send Notification checkbox and select the Recipient of this notification. You can select a previously configured e-mail notification profile, and then click View to access detailed information. Or, click New E-mail Notification to create a new e-mail notification profile. For details on creating an e-mail notification profile, see the User Notification Settings section in the Control Panel Reference Guide. You can choose to have the report included in the e-mail as an attachment by checking the Attach report to the e-mail when the size of the report is less than … checkbox, and then enter the maximum size of the report allowed in the less than __ MB text box.
5. Choose one of the following options to run the Upcoming Content Expiration report:
Click Run Report, and then select Run Report only to run the job, or select Save profile and run report from the drop-down menu to save the configuration and then run the job. After the job finishes, the report is displayed in the Report Display pane. You can click Show Report to view the history data collected before. However, if this profile has no running job record, the Show Report is grayed out.
126
DocAve 6: Report Center
Click the Save ( ) button to save the report profile, and then click Export Now in the Report Actions group on the ribbon. The Export to Datasheet window appears. Complete the following steps to generate the report:
o Report Format – Select the desired report format from the drop-down menu.
o Export Settings – Choose whether to export the report now. Check the Export to local immediately checkbox and click OK to run the job immediately and export the report, or check the Export to a different location checkbox, and then configure the following settings:
Export Location – Select one previously configured export location from the drop-down menu, or if you want to configure a new export location, click New Export Location, then follow the instructions provided in Export Location.
E-mail Notification – Check the Send Notification checkbox and select the Recipient of this notification. You can select a previously configured e-mail notification profile and click View to access detailed information, or click New E-mail Notification to create a new e-mail notification profile. For details on creating an e-mail notification profile, see the User Notification Settings section in the Control Panel Reference Guide. You can choose to have the report included in the e-mail as an attachment by checking the Attach report to the e-mail when the size of the report is less than … checkbox, and then enter the maximum size of the report allowed in the less than __ MB text box.
6. Click OK to save the configurations and export the report. Click Cancel to go back to the Upcoming Content Expiration report interface without saving the configurations.
Viewing Upcoming Content Expiration Reports
Once you have successfully generated a report, the Report Display pane has a number of configurable
settings so that you can customize how to display the reports, the following settings can be configured
in the Report Display pane:
Object Bar – Display all of the selected nodes.
Scope – Change the scope for the data shown in the report.
Auditor Reports
In Auditor Reports, you can apply pre-configured filter settings to the SharePoint objects you select to
generate Auditor Reports, or customize the filter settings for Custom Reports.
Only the SharePoint objects with Auditor records retrieved can be displayed on the tree. Before running
the report, you must collect the auditing data in Audit Controller. For more information, please refer to
Audit Controller section.
127
DocAve 6: Report Center
Generating User Lifecycle Reports
User Lifecycle Reports are used to display all actions for a specified user during their entire lifecycle.
These reports provide auditing and logging records to ensure data integrity and also provide availability
of user activity.
To generate User Lifecycle Reports, go to the Compliance Reports tab of Report Center, and click
Auditor Reports on the ribbon. Select the desired SharePoint on-premises Web applications/site
collections/sites/lists under a farm or SharePoint Online site collections/sites/lists under My Registered
Sites in the Scope pane, and then click User Lifecycle in the Auditor Reports group on the ribbon. You
can configure the following settings in the Scope pane:
1. Report Profile Name – Select a previously configured profile from the drop-down menu or create a new profile by entering a new name in the Report Profile text box. Click the new button
( ) to clear all fields, click the save button ( ) to save changes to the current report profile, or
click the save as button ( ) to save any changes under a new profile name.
2. Scope – In the Scope configuration area, click the farm name and expand the data tree down to the desired SharePoint Web applications/site collections/sites/lists, click My Registered Sites, to expand the SharePoint sites group to the desired site collections/sites/lists, or enter a URL/name in the search text box above the tree. Check the checkboxes next to the nodes you want to include in the report.
*Note: All of the selections in the Scope pane must be on the same SharePoint object level. For example, you can select multiple Web applications, or you can select multiple site collections within different Web applications, but you cannot select a Web application and a site collection at the same time.
3. Scope Filter – To filter SharePoint objects you would like to include in this profile within the selected scope, select a previously created scope filter from the Select a scope filter drop-down list. To create a new scope filter, click New Scope Filter. For details on creating a scope filter, refer to Configuring a Scope Filter.
4. Time Range – In the Time Range configuration area, choose one of the following options:
Duration – Check the Duration checkbox, and then select the time range as you want from the drop-down menu. There are eight durations provided, respectively This Month, Last Month, Last 2 Months, This Week, Last Week, Last 2 Weeks, Today, and Yesterday.
Last __ Day(s)/Week(s)/Month(s) – Enter an integer into the text box and select by Day(s)/Week(s)/Month(s) from the drop-down menu. For example, if you enter 10 in the text box, and select Day(s) from the drop-down menu, and then you run the job, you are allowed to collect the data of the latest 10 days.
Custom – Check the Custom checkbox to customize the time range.
5. Schedule (Optional) – In the schedule configuration area, choose one of the following options:
No Schedule – Select this option if you do not want to configure a schedule for this profile. If you choose this option, you must collect the data manually
128
DocAve 6: Report Center
Configure the schedule myself – Select this option to configure the specific time you want to collect the data of this profile. A schedule configuration area appears. You can customize the schedule with the following options:
o Export report – Choose whether or not to configure the Export Report Settings to store the User Lifecycle reports by checking the Export report checkbox.
o Start time – Select the date and time for collecting the data.
*Note: The start time cannot be earlier than the current time.
o Interval – Enter an integer into the text box and select by Hour(s), Day(s), Week(s), or Month(s). The data will be collected repeatedly based on this schedule. Click Calendar View to see the schedules in a calendar.
o Schedule ending – Designate when to stop collecting the data for this profile. Select No end date for the data of this profile to be collected repeatedly until you stop it manually. Select End after __ occurrence(s) to have the job stopped after the defined occurrences that you configured in the text box. Select End by Date + Time to specify the exact date and time for the data to stop being collected.
o Export Report Settings – Check the Export report checkbox. The Export Report Settings configuration area appears. Select the desired Report Format and Export Location, and then click View to access the detailed information of the selected export location. If you want to configure a new export location, click New Export Location, and follow the instructions provided in the Export Location section of this guide.
o Notification – Check the Send Notification checkbox and select the Recipient of this notification. You can select a previously configured e-mail notification profile, and then click View to access detailed information. Or, click New E-mail Notification to create a new e-mail notification profile. For details on creating an e-mail notification profile, see the User Notification Settings section the DocAve 6 Control Panel Reference Guide. You can choose to have the report included in the e-mail as an attachment by checking the Attach report to the e-mail when the size of the report is less than … checkbox, and then enter the maximum size of the report allowed in the less than __ MB text box.
6. Notification (Optional) – Select one of the configured e-mail notifications from the drop-down menu to send the job condition to the specified users. Or, click New E-mail Notification to create a new e-mail notification profile. For details on creating an e-mail notification profile, see the User Notification Settings section in the DocAve 6 Control Panel Reference Guide.
7. Filters – The following filters are configurable in the User Lifecycle reports:
URL Filter – Click to load the URL Filter tab to specify the URLs.
Action Filter – Click to load the Action Filter tab to select the actions to be included in the reports.
User Filter – Click to load the User Filter tab to set the users whose activity you want to view or do not want to view.
129
DocAve 6: Report Center
o Include All Users – By default this option is selected. The activities of all users can be viewed.
o Include All External Users – The activities of all external users can be viewed. This option is only available when the nodes under My Registered Sites are selected in the Scope pane.
o Include All Users with Guest Links – The activities of all users with guest links can be viewed. This option is only available when the nodes under My Registered Sites are selected in the Scope pane.
o Users to Include – Enter the users whose activity you want to view. You can click the check names button ( ) to check the name you entered or click the browse
button ( ) to find the users you want to include.
o Users to Exclude – Enter the users whose activity you do not wish to view. You can click the check names button ( ) to check the name you entered or click
the browse button ( ) to find the users you want to exclude.
Type – Click to load the Type tab to set the types you want to view in the report.
8. Choose one of the following options to run the User Lifecycle Usage reports:
Click Run Report, and then select Run Report only to run job or select Save profile and run report from the drop-down menu to save the configuration and then run the job. After the job finishes, the report is displayed in the Report Display pane. You can click Show Report to view the history data collected before. However, if this profile has no running job record, Show Report is grayed out.
Click the save button ( ) to save the report profile, and then click Export Now in the Report Actions group on the ribbon. The Export to Datasheet window appears. Complete the following steps to generate the report:
o Report Format – Select the desired report format from the drop-down menu.
o Export Settings – Choose whether to export the report now. Check the Export to local immediately checkbox and click OK to export the report immediately, or check the Export to a different location checkbox, and then configure the following settings:
Export Location – Select one previously configured export location from the drop-down menu, or if you want to configure a new export location, click New Export Location, then follow the instructions provided in the Export Location section of this guide.
E-mail Notification – Check the Send Notification checkbox and select the Recipient of this notification. You can select a previously configured e-mail notification profile and click View to access detailed information, or click New E-mail Notification to create a new e-mail notification profile. For details on creating an e-mail notification profile, see the User Notification Settings section in the DocAve 6 Control Panel Reference Guide. You can choose to have the report included in the e-mail as an attachment by checking the Attach report to the e-mail
130
DocAve 6: Report Center
when the size of the report is less than … checkbox, and then enter the maximum size of the report allowed in the less than __ MB text box.
Click OK to save the configurations and export the report. Click Cancel to go back to the
User Lifecycle report interface without saving the configurations.
Generating List Access Reports
You can generate List Access Reports to display who accessed a list, what changes were made, and what
time those changes were made. These reports provide auditing and logging records to ensure data
integrity and also provide availability of list information.
To generate List Access Reports, go to the Compliance Reports tab of Report Center, and click Auditor
Reports on the ribbon to expand the tab. Select the desired SharePoint on-premises SharePoint Web
applications/site collections/sites/lists under a farm or SharePoint Online site collections/sites/lists
under My Registered Sites in the Scope pane, and then click List Access in the Auditor Reports group on
the ribbon. You can configure the following settings in the Scope pane:
1. Report Profile Name – Select a previously configured profile from the drop-down menu or create a new profile by entering a new name in the Report Profile text box. Click the new button
( ) to clear all fields, click the save button ( ) to save changes to the current report profile, or
click the save as button ( ) to save any changes under a new profile name.
2. Scope – In the Scope configuration area, click the farm name and expand the data tree down to the desired SharePoint Web applications/site collections/sites/lists, click My Registered Sites, expand the SharePoint sites group to the desired site collections/sites/lists, or enter a URL/name in the search text box above the tree. Check the checkboxes next to the nodes you want to include in the report.
*Note: All of the selections in the Scope pane must be on the same SharePoint object level. For example, you can select multiple Web applications, or you can select multiple site collections within different Web applications, but you cannot select a Web application and a site collection at the same time.
3. Scope Filter – To filter SharePoint objects you would like to include in this profile within the selected scope, select a previously created scope filter from the Select a scope filter drop-down list. To create a new scope filter, click New Scope Filter. For details on creating a scope filter, refer to Configuring a Scope Filter.
4. Time Range – In the Time Range configuration area, choose one of the following options:
Duration – Check the Duration checkbox, and then select the desired time range from the drop-down menu. There are eight durations provided: This Month, Last Month, Last 2 Months, This Week, Last Week, Last 2 Weeks, Today, and Yesterday.
Last __ Day(s)/Week(s)/Month(s) – Enter an integer into the text box and select by Day(s)/Week(s)/Month(s) from the drop-down menu. For example, if you enter 10 in the text box, and select Day(s) from the drop-down menu, and then you run the job, you are allowed to collect the data of the latest 10 days.
131
DocAve 6: Report Center
Custom – Check the Custom checkbox to customize the time range as you want.
5. Schedule (Optional) – In the schedule configuration area, choose one of the following options:
No Schedule – Select this option if you do not want to configure a schedule for this profile. If you choose this option, you must collect the data manually.
Configure the schedule myself – Select this option to configure the specific time you want to collect the data of this profile. A schedule configuration area appears. You can customize the schedule with the following options:
o Export report – Choose whether or not to configure the Export Report Settings to store the List Access reports by checking the Export report checkbox.
o Start time – Select the date and time for collecting the data.
*Note: The start time cannot be earlier than the current time.
o Interval – Enter an integer into the text box and select by Hour(s), Day(s), Week(s), or Month(s). The data will be collected repeatedly based on this schedule. Click Calendar View to see the schedules in a calendar.
o Schedule ending – Designate when to stop collecting the data for this profile. Select No end date for the data of this profile to be collected repeatedly until you stop it manually. Select End after ___ occurrence(s) to have the job stopped after the defined occurrences that you configured in the text box. Select End by Date + Time to specify the exact date and time for the data to stop being collected.
o Export Report Settings – Check the Export report checkbox. The Export Report Settings configuration area appears. Select the desired Report Format and Export Location, and then click View to access the detailed information of the selected export location. If you want to configure a new export location, click New Export Location, and follow the instructions provided in the Export Location section of this guide.
o Notification – Check the Send Notification checkbox and select the Recipient of this notification. You can select a previously configured e-mail notification profile, and then click View to access detailed information. Or, click New E-mail Notification to create a new e-mail notification profile. For details on creating an e-mail notification profile, see the User Notification Settings section in the DocAve 6 Control Panel Reference Guide. You can choose to have the report included in the e-mail as an attachment by checking the Attach report to the e-mail when the size of the report is less than … checkbox, and then enter the maximum size of the report allowed in the less than __ MB text box.
6. Notification (Optional) – Select one of the configured e-mail notifications from the drop-down menu to send the job condition to the specified users. Or, click New E-mail Notification to create a new e-mail notification profile. For details on creating an e-mail notification profile, see the User Notification Settings section in the DocAve 6 Control Panel Reference Guide.
132
DocAve 6: Report Center
7. Filters – The following filters are configurable in List Access reports:
URL Filter – Click to load the URL Filter tab to narrow the scope by specifying URLs.
Action Filter – Click to load the Action Filter tab to select the actions to be included in the reports.
User Filter – Click to load the User Filter tab to set the users whose activity you want to view or do not want to view.
o Include All Users – By default this option is selected. The activities of all users can be viewed.
o Include All External Users – The activities of all external users can be viewed. This option is only available when the nodes under My Registered Sites are selected in the Scope pane.
o Include All Users with Guest Links – The activities of all users with guest links can be viewed. This option is only available when the nodes under My Registered Sites are selected in the Scope pane.
o Users to Include – Enter the users whose activity you want to view. You can click the check names button ( ) to check the name you entered or click the browse
button ( ) to find the users you want to include.
o Users to Exclude – Enter the users whose activity you do not wish to view. You can click the check names button ( ) to check the name you entered or click
the browse button ( ) to find the users you want to exclude.
Type – Click to load the Type tab to set the types you want to view in the report.
8. Choose one of the following options to run the List Access Report:
Click Run Report, and then select Run Report only to run the job or select Save profile and run report from the drop-down menu to save the configuration and then run the job. After the job finishes, the report is displayed in the Report Display pane. You can click Show Report to view the history data collected before. However, if this profile has no running job record, the Show Report is grayed out.
Click the save button ( ) to save the report profile, and then click Export Now in the Report Actions group on the ribbon. The Export to Datasheet window appears. Complete the following steps to generate the report:
o Report Format – Select the desired report format from the drop-down menu.
o Export Settings – Choose whether to export the report now. Check the Export to local immediately checkbox and click OK to export the report immediately, or check the Export to a different location checkbox, and then configure the following settings:
Export Location – Select one previously configured export location from the drop-down menu, or if you want to configure a new export location, click New Export Location, then follow the instructions provided in the Export Location section of this guide.
133
DocAve 6: Report Center
Notification – Check the Send Notification checkbox and select the Recipient of this notification. You can select a previously configured e-mail notification profile and click View to access detailed information, or click New E-mail Notification to create a new e-mail notification profile. For details on creating an e-mail notification profile, see the User Notification Settings section in the DocAve 6 Control Panel Reference Guide. You can choose to have the report included in the e-mail as an attachment by checking the Attach report to the e-mail when the size of the report is less than … checkbox, and then enter the maximum size of the report allowed in the less than __ MB text box.
Click OK to save the configurations and export the report. Click Cancel to go back to the List Access report interface without saving the configurations.
Generating Item Lifecycle Reports
Item Lifecycle Reports display information about the entire lifecycle of items in a specified list. These
reports provide auditing and logging records to ensure data integrity and also provide availability of all
activity for items in SharePoint.
To generate Item Lifecycle Reports, go to the Compliance Reports tab of Report Center, and click
Auditor Reports on the ribbon to expand the tab. Select the desired SharePoint Web applications/site
collections/site/lists under a farm or SharePoint Online site collections/sites/lists under My Registered
Sites in the Scope pane, then click Item Lifecycle in the Auditor Reports group on the ribbon. You can
configure the following settings in the Scope pane:
1. Report Profile Name – Select a previously configured profile from the drop-down menu or create a new profile by entering a new name in the Report Profile text box. Click the new button
( ) to clear all fields, click the save button ( ) to save changes to the current report profile, or
click the save as button ( ) to save any changes under a new profile name.
2. Scope – In the Scope configuration area, click the farm name and expand the data tree down to the desired SharePoint Web applications/site collections/sites/lists, click My Registered Sites, expand the SharePoint sites group to the desired site collections/sites/lists, or enter a URL/name in the search text box above the tree. Check the checkboxes next to the nodes you want to include in the report.
*Note: All of the selections in the Scope pane must be on the same SharePoint object level. For example, you can select multiple Web applications, or you can select multiple site collections within different Web applications, but you cannot select a Web application and a site collection at the same time.
3. Scope Filter – To filter SharePoint objects you would like to include in this profile within the selected scope, select a previously created scope filter from the Select a scope filter drop-down list. To create a new scope filter, click New Scope Filter. For details on creating a scope filter, refer to Configuring a Scope Filter.
4. Time Range – In the Time Range configuration area, choose one of the following options:
134
DocAve 6: Report Center
Duration – Check the Duration checkbox, and then select the desired time range from the drop-down menu. There are eight durations provided: This Month, Last Month, Last 2 Months, This Week, Last Week, Last 2 Weeks, Today, and Yesterday.
Last __ Day(s)/Week(s)/Month(s) – Enter an integer into the text box and select by Day(s)/Week(s)/Month(s) from the drop-down menu. For example, if you enter 10 in the text box, and select Day(s) from the drop-down menu, and then you run the job, you are allowed to collect the data of the latest 10 days.
Custom – Check the Custom checkbox to customize the time range.
5. Schedule (Optional) – In the schedule configuration area, choose one of the following options:
No Schedule – Select this option if you do not want to configure a schedule for this profile. If you choose this option, you must collect the data manually.
Configure the schedule myself – Select this option to configure the specific time you want to collect the data of this profile. A schedule configuration area appears. You can customize the schedule with the following options:
o Export report – Choose whether or not to configure the Export Report Settings to store the Item Lifecycle reports by checking the Export report checkbox.
o Start time – Select the date and time for collecting the data.
*Note: The start time cannot be earlier than the current time.
o Interval – Enter an integer into the text box and select by Hour(s), Day(s), Week(s), or Month(s). The data will be collected repeatedly based on this schedule. Click Calendar View to see the schedules in a calendar.
o Schedule ending – Designate when to stop collecting the data for this profile. Select No end date for the data of this profile to be collected repeatedly until you stop it manually. Select End after ___ occurrence(s) to have the job stopped after the defined occurrences that you configured in the text box. Select End by Date + Time to specify the exact date and time for the data to stop being collected.
o Export Report Settings – Check the Export report checkbox. The Export Report Settings configuration area appears. Select the desired Report Format and Export Location, and then click View to access the detailed information of the selected export location. If you want to configure a new export location, click New Export Location, and follow the instructions provided in the Export Location section of this guide.
o Notification – Check the Send Notification checkbox and select the Recipient of this notification. You can select a previously configured e-mail notification profile, and then click View to access detailed information. Or, click New E-mail Notification to create a new e-mail notification profile. For details on creating an e-mail notification profile, see the User Notification Settings section in the DocAve 6 Control Panel Reference Guide. You can choose to have the report included in the e-mail as an attachment by
135
DocAve 6: Report Center
checking the Attach report to the e-mail when the size of the report is less than … checkbox, and then enter the maximum size of the report allowed in the less than __ MB text box.
6. Notification (Optional) – Select one of the configured e-mail notifications from the drop-down menu to send the job condition to the specified users. Or, click New E-mail Notification to create a new e-mail notification profile. For details on creating an e-mail notification profile, see the User Notification Settings section in the DocAve 6 Control Panel Reference Guide.
7. Filters – The following filters are configurable in the Item Lifecycle reports:
URL Filter – Click to load the URL Filter tab to narrow the scope by specifying URLs.
Action Filter – Click to load the Action Filter tab to select the actions to be included in the reports.
User Filter – Click to load the User Filter tab to set the users whose activity you want to view or do not want to view.
o Include All Users – By default this option is selected. The activities of all users can be viewed.
o Include All External Users – The activities of all external users can be viewed. This option is only available when the nodes under My Registered Sites are selected in the Scope pane.
o Include All Users with Guest Links – The activities of all users with guest links can be viewed. This option is only available when the nodes under My Registered Sites are selected in the Scope pane.
o Users to Include – Enter the users whose activity you want to view. You can click the check names button ( ) to check the name you entered or click the browse
button ( ) to find the users you want to include.
o Users to Exclude – Enter the users whose activity you do not wish to view. You can click the check names button ( ) to check the name you entered or click
the browse button ( ) to find the users you want to exclude.
8. Choose one of the following options to run the Item Lifecycle reports:
Click Run Report, and then select Run Report only to run the job or select Save profile and run report from the drop-down menu to save the configuration and then run the job. After the job finishes, the report is displayed in the Report Display pane. You can click Show Report to view the history data collected before. However, if this profile has no running job record, the Show Report is grayed out.
Click the save button ( ) to save the report profile, and then click Export Now in the Report Actions group on the ribbon. The Export to Datasheet window appears. Complete the following steps to generate the report:
o Report Format – Select the desired report format from the drop-down menu.
o Export Settings – Choose whether to export the report now. Check the Export to local immediately checkbox and click OK to export the report immediately,
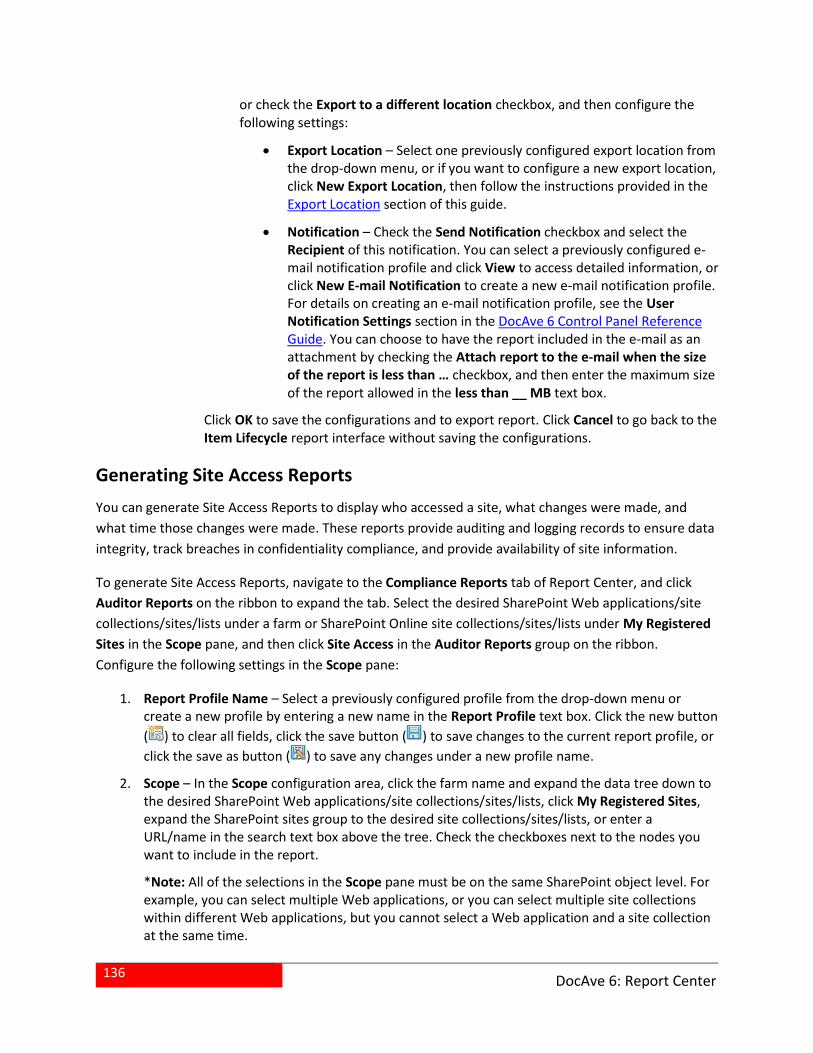
136
DocAve 6: Report Center
or check the Export to a different location checkbox, and then configure the following settings:
Export Location – Select one previously configured export location from the drop-down menu, or if you want to configure a new export location, click New Export Location, then follow the instructions provided in the Export Location section of this guide.
Notification – Check the Send Notification checkbox and select the Recipient of this notification. You can select a previously configured e-mail notification profile and click View to access detailed information, or click New E-mail Notification to create a new e-mail notification profile. For details on creating an e-mail notification profile, see the User Notification Settings section in the DocAve 6 Control Panel Reference Guide. You can choose to have the report included in the e-mail as an attachment by checking the Attach report to the e-mail when the size of the report is less than … checkbox, and then enter the maximum size of the report allowed in the less than __ MB text box.
Click OK to save the configurations and to export report. Click Cancel to go back to the Item Lifecycle report interface without saving the configurations.
Generating Site Access Reports
You can generate Site Access Reports to display who accessed a site, what changes were made, and
what time those changes were made. These reports provide auditing and logging records to ensure data
integrity, track breaches in confidentiality compliance, and provide availability of site information.
To generate Site Access Reports, navigate to the Compliance Reports tab of Report Center, and click
Auditor Reports on the ribbon to expand the tab. Select the desired SharePoint Web applications/site
collections/sites/lists under a farm or SharePoint Online site collections/sites/lists under My Registered
Sites in the Scope pane, and then click Site Access in the Auditor Reports group on the ribbon.
Configure the following settings in the Scope pane:
1. Report Profile Name – Select a previously configured profile from the drop-down menu or create a new profile by entering a new name in the Report Profile text box. Click the new button
( ) to clear all fields, click the save button ( ) to save changes to the current report profile, or
click the save as button ( ) to save any changes under a new profile name.
2. Scope – In the Scope configuration area, click the farm name and expand the data tree down to the desired SharePoint Web applications/site collections/sites/lists, click My Registered Sites, expand the SharePoint sites group to the desired site collections/sites/lists, or enter a URL/name in the search text box above the tree. Check the checkboxes next to the nodes you want to include in the report.
*Note: All of the selections in the Scope pane must be on the same SharePoint object level. For example, you can select multiple Web applications, or you can select multiple site collections within different Web applications, but you cannot select a Web application and a site collection at the same time.
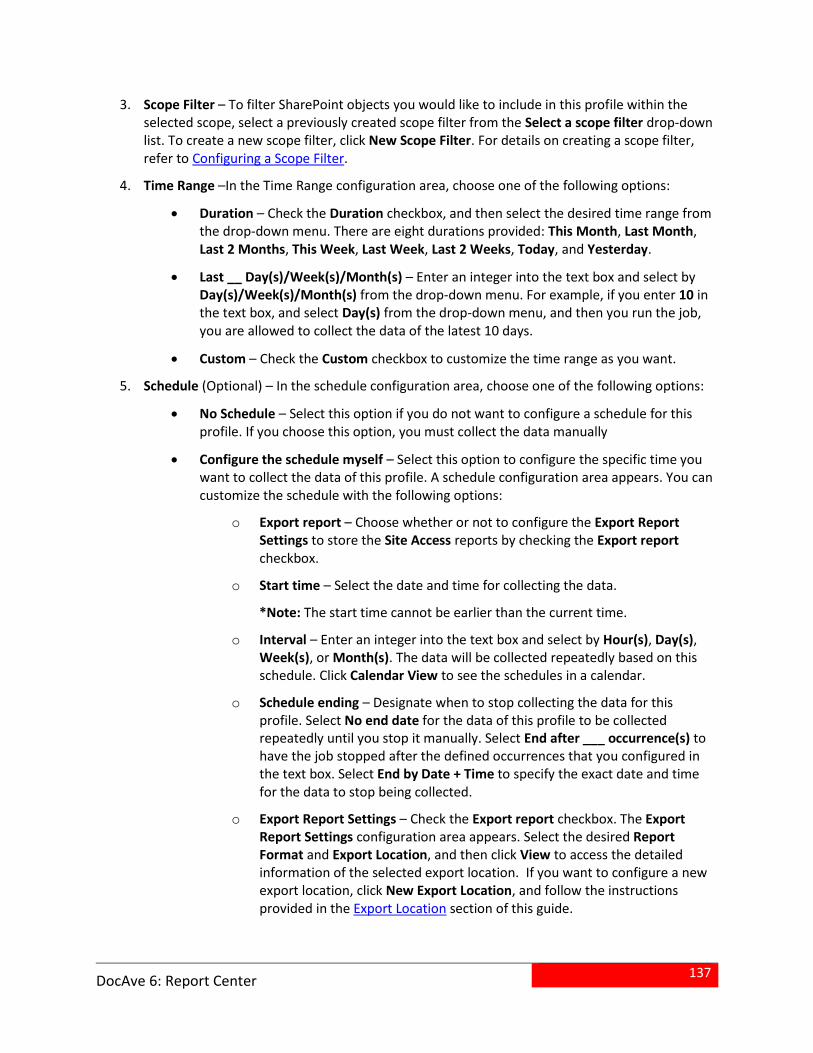
137
DocAve 6: Report Center
3. Scope Filter – To filter SharePoint objects you would like to include in this profile within the selected scope, select a previously created scope filter from the Select a scope filter drop-down list. To create a new scope filter, click New Scope Filter. For details on creating a scope filter, refer to Configuring a Scope Filter.
4. Time Range –In the Time Range configuration area, choose one of the following options:
Duration – Check the Duration checkbox, and then select the desired time range from the drop-down menu. There are eight durations provided: This Month, Last Month, Last 2 Months, This Week, Last Week, Last 2 Weeks, Today, and Yesterday.
Last __ Day(s)/Week(s)/Month(s) – Enter an integer into the text box and select by Day(s)/Week(s)/Month(s) from the drop-down menu. For example, if you enter 10 in the text box, and select Day(s) from the drop-down menu, and then you run the job, you are allowed to collect the data of the latest 10 days.
Custom – Check the Custom checkbox to customize the time range as you want.
5. Schedule (Optional) – In the schedule configuration area, choose one of the following options:
No Schedule – Select this option if you do not want to configure a schedule for this profile. If you choose this option, you must collect the data manually
Configure the schedule myself – Select this option to configure the specific time you want to collect the data of this profile. A schedule configuration area appears. You can customize the schedule with the following options:
o Export report – Choose whether or not to configure the Export Report Settings to store the Site Access reports by checking the Export report checkbox.
o Start time – Select the date and time for collecting the data.
*Note: The start time cannot be earlier than the current time.
o Interval – Enter an integer into the text box and select by Hour(s), Day(s), Week(s), or Month(s). The data will be collected repeatedly based on this schedule. Click Calendar View to see the schedules in a calendar.
o Schedule ending – Designate when to stop collecting the data for this profile. Select No end date for the data of this profile to be collected repeatedly until you stop it manually. Select End after ___ occurrence(s) to have the job stopped after the defined occurrences that you configured in the text box. Select End by Date + Time to specify the exact date and time for the data to stop being collected.
o Export Report Settings – Check the Export report checkbox. The Export Report Settings configuration area appears. Select the desired Report Format and Export Location, and then click View to access the detailed information of the selected export location. If you want to configure a new export location, click New Export Location, and follow the instructions provided in the Export Location section of this guide.
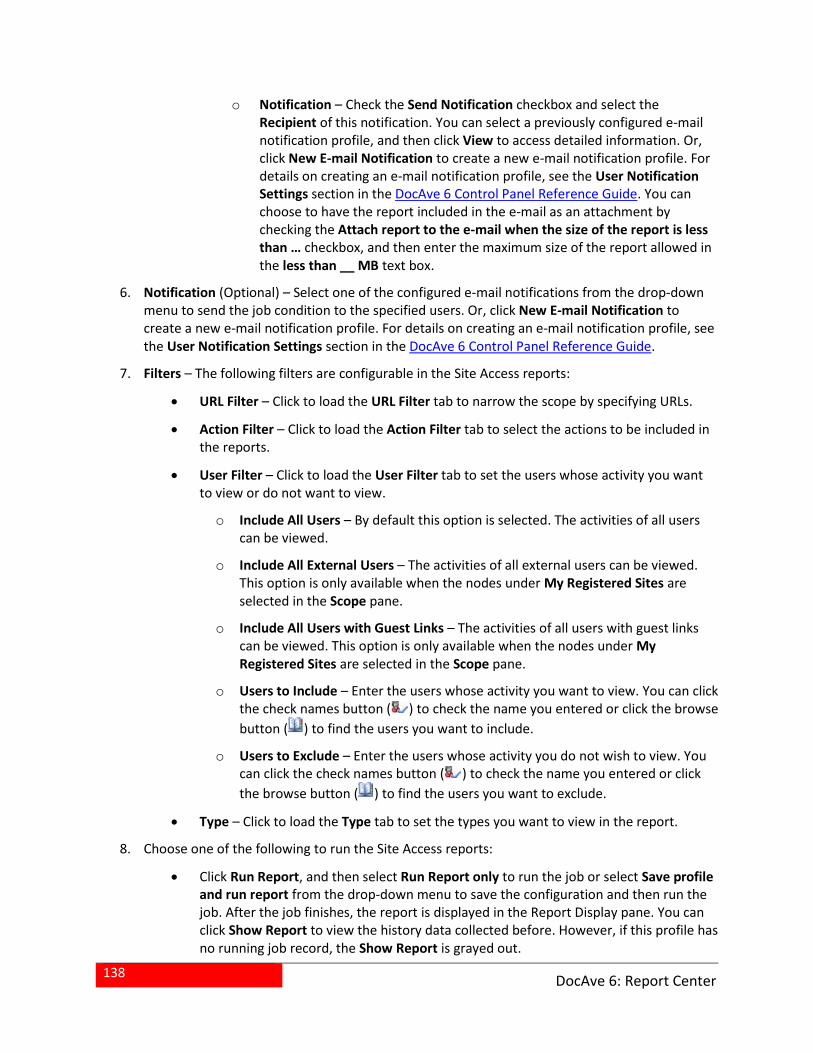
138
DocAve 6: Report Center
o Notification – Check the Send Notification checkbox and select the Recipient of this notification. You can select a previously configured e-mail notification profile, and then click View to access detailed information. Or, click New E-mail Notification to create a new e-mail notification profile. For details on creating an e-mail notification profile, see the User Notification Settings section in the DocAve 6 Control Panel Reference Guide. You can choose to have the report included in the e-mail as an attachment by checking the Attach report to the e-mail when the size of the report is less than … checkbox, and then enter the maximum size of the report allowed in the less than __ MB text box.
6. Notification (Optional) – Select one of the configured e-mail notifications from the drop-down menu to send the job condition to the specified users. Or, click New E-mail Notification to create a new e-mail notification profile. For details on creating an e-mail notification profile, see the User Notification Settings section in the DocAve 6 Control Panel Reference Guide.
7. Filters – The following filters are configurable in the Site Access reports:
URL Filter – Click to load the URL Filter tab to narrow the scope by specifying URLs.
Action Filter – Click to load the Action Filter tab to select the actions to be included in the reports.
User Filter – Click to load the User Filter tab to set the users whose activity you want to view or do not want to view.
o Include All Users – By default this option is selected. The activities of all users can be viewed.
o Include All External Users – The activities of all external users can be viewed. This option is only available when the nodes under My Registered Sites are selected in the Scope pane.
o Include All Users with Guest Links – The activities of all users with guest links can be viewed. This option is only available when the nodes under My Registered Sites are selected in the Scope pane.
o Users to Include – Enter the users whose activity you want to view. You can click the check names button ( ) to check the name you entered or click the browse
button ( ) to find the users you want to include.
o Users to Exclude – Enter the users whose activity you do not wish to view. You can click the check names button ( ) to check the name you entered or click
the browse button ( ) to find the users you want to exclude.
Type – Click to load the Type tab to set the types you want to view in the report.
8. Choose one of the following to run the Site Access reports:
Click Run Report, and then select Run Report only to run the job or select Save profile and run report from the drop-down menu to save the configuration and then run the job. After the job finishes, the report is displayed in the Report Display pane. You can click Show Report to view the history data collected before. However, if this profile has no running job record, the Show Report is grayed out.
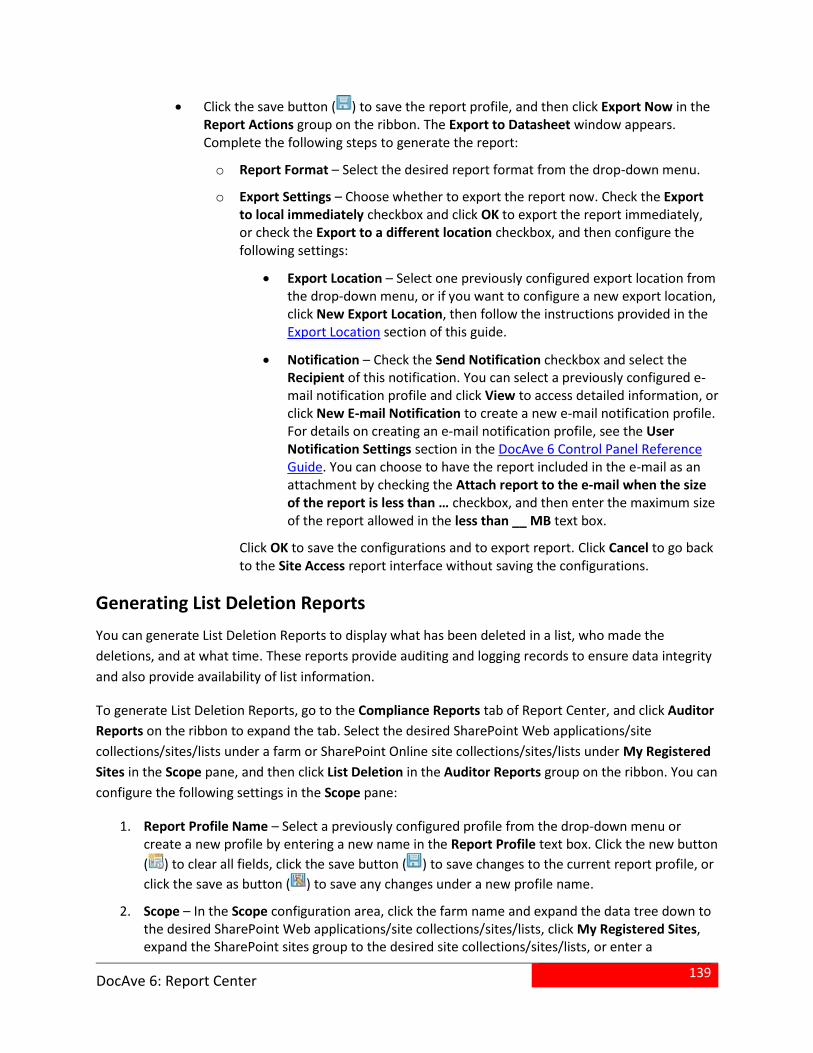
139
DocAve 6: Report Center
Click the save button ( ) to save the report profile, and then click Export Now in the Report Actions group on the ribbon. The Export to Datasheet window appears. Complete the following steps to generate the report:
o Report Format – Select the desired report format from the drop-down menu.
o Export Settings – Choose whether to export the report now. Check the Export to local immediately checkbox and click OK to export the report immediately, or check the Export to a different location checkbox, and then configure the following settings:
Export Location – Select one previously configured export location from the drop-down menu, or if you want to configure a new export location, click New Export Location, then follow the instructions provided in the Export Location section of this guide.
Notification – Check the Send Notification checkbox and select the Recipient of this notification. You can select a previously configured e-mail notification profile and click View to access detailed information, or click New E-mail Notification to create a new e-mail notification profile. For details on creating an e-mail notification profile, see the User Notification Settings section in the DocAve 6 Control Panel Reference Guide. You can choose to have the report included in the e-mail as an attachment by checking the Attach report to the e-mail when the size of the report is less than … checkbox, and then enter the maximum size of the report allowed in the less than __ MB text box.
Click OK to save the configurations and to export report. Click Cancel to go back to the Site Access report interface without saving the configurations.
Generating List Deletion Reports
You can generate List Deletion Reports to display what has been deleted in a list, who made the
deletions, and at what time. These reports provide auditing and logging records to ensure data integrity
and also provide availability of list information.
To generate List Deletion Reports, go to the Compliance Reports tab of Report Center, and click Auditor
Reports on the ribbon to expand the tab. Select the desired SharePoint Web applications/site
collections/sites/lists under a farm or SharePoint Online site collections/sites/lists under My Registered
Sites in the Scope pane, and then click List Deletion in the Auditor Reports group on the ribbon. You can
configure the following settings in the Scope pane:
1. Report Profile Name – Select a previously configured profile from the drop-down menu or create a new profile by entering a new name in the Report Profile text box. Click the new button
( ) to clear all fields, click the save button ( ) to save changes to the current report profile, or
click the save as button ( ) to save any changes under a new profile name.
2. Scope – In the Scope configuration area, click the farm name and expand the data tree down to the desired SharePoint Web applications/site collections/sites/lists, click My Registered Sites, expand the SharePoint sites group to the desired site collections/sites/lists, or enter a
140
DocAve 6: Report Center
URL/name in the search text box above the tree. Check the checkboxes next to the nodes you want to include in the report.
*Note: All of the selections in the Scope pane must be on the same SharePoint object level. For example, you can select multiple Web applications, or you can select multiple site collections within different Web applications, but you cannot select a Web application and a site collection at the same time.
3. Scope Filter – To filter SharePoint objects you would like to include in this profile within the selected scope, select a previously created scope filter from the Select a scope filter drop-down list. To create a new scope filter, click New Scope Filter. For details on creating a scope filter, refer to Configuring a Scope Filter.
4. Time Range –In the Time Range configuration area, choose one of the following options:
Duration – Check the Duration checkbox, and then select the desired time range from the drop-down menu. There are eight durations provided: This Month, Last Month, Last 2 Months, This Week, Last Week, Last 2 Weeks, Today, and Yesterday.
Last __ Day(s)/Week(s)/Month(s) – Enter an integer into the text box and select by Day(s)/Week(s)/Month(s) from the drop-down menu. For example, if you enter 10 in the text box, and select Day(s) from the drop-down menu, and then you run the job, you are allowed to collect the data of the latest 10 days.
Custom – Check the Custom checkbox to customize the time range as you want.
5. Schedule (Optional) – In the schedule configuration area, choose one of the following options:
No Schedule – Select this option if you do not want to configure a schedule for this profile. If you choose this option, you must collect the data manually
Configure the schedule myself – Select this option to configure the specific time you want to collect the data of this profile. A schedule configuration area appears. You can customize the schedule with the following options:
o Export report – Choose whether or not to configure the Export Report Settings to store the List Deletion reports by checking the Export report checkbox.
o Start time – Select the date and time for collecting the data.
*Note: The start time cannot be earlier than the current time.
o Interval – Enter an integer into the text box and select by Hour(s), Day(s), Week(s), or Month(s). The data will be collected repeatedly based on this schedule. Click Calendar View to see the schedules in a calendar.
o Schedule ending – Designate when to stop collecting the data for this profile. Select No end date for the data of this profile to be collected repeatedly until you stop it manually. Select End after ___ occurrence(s) to have the job stopped after the defined occurrences that you configured in the text box. Select End by Date + Time to specify the exact date and time for the data to stop being collected.
141
DocAve 6: Report Center
o Export Report Settings – Check the Export report checkbox. The Export Report Settings configuration area appears. Select the desired Report Format and Export Location, and then click View to access the detailed information of the selected export location. If you want to configure a new export location, click New Export Location, and follow the instructions provided in the Export Location section of this guide.
o Notification – Check the Send Notification checkbox and select the Recipient of this notification. You can select a previously configured e-mail notification profile, and then click View to access detailed information. Or, click New E-mail Notification to create a new e-mail notification profile. For details on creating an e-mail notification profile, see the User Notification Settings section in the DocAve 6 Control Panel Reference Guide. You can choose to have the report included in the e-mail as an attachment by checking the Attach report to the e-mail when the size of the report is less than … checkbox, and then enter the maximum size of the report allowed in the less than __ MB text box.
6. Notification (Optional) – Select one of the configured e-mail notifications from the drop-down menu to send the job condition to the specified users. Or, click New E-mail Notification to create a new e-mail notification profile. For details on creating an e-mail notification profile, see the User Notification Settings section in the DocAve 6 Control Panel Reference Guide.
7. Filters – The following filters are configurable in the List Deletion reports:
URL Filter – Click to load the URL Filter tab to narrow the scope by specifying URLs.
User Filter – Click to load the User Filter tab to set the users whose activity you want to view or do not want to view.
o Include All Users – By default this option is selected. The activities of all users can be viewed.
o Include All External Users – The activities of all external users can be viewed. This option is only available when the nodes under My Registered Sites are selected in the Scope pane.
o Include All Users with Guest Links – The activities of all users with guest links can be viewed. This option is only available when the nodes under My Registered Sites are selected in the Scope pane.
o Users to Include – Enter the users whose activity you want to view. You can click the check names button ( ) to check the name you entered or click the browse
button ( ) to find the users you want to include.
o Users to Exclude – Enter the users whose activity you do not wish to view. You can click the check names button ( ) to check the name you entered or click
the browse button ( ) to find the users you want to exclude.
Type – Click to load the Type tab to set the types you want to view in the report.
142
DocAve 6: Report Center
8. Choose one of the following options to run the List Deletion reports:
Click Run Report, and then select Run Report only to run the job or select Save profile and run report from the drop-down menu to save the configuration and then run the job. After the job finishes, the report is displayed in the Report Display pane. You can click Show Report to view the history data collected before. However, if this profile has no running job record, the Show Report is grayed out.
Click the save button ( ) to save the report profile, and then click Export Now in the Report Actions group on the ribbon. The Export to Datasheet window appears. Complete the following steps to generate the report:
o Report Format – Select the desired report format from the drop-down menu.
o Export Settings – Choose whether to export the report now. Check the Export to local immediately checkbox and click OK to export the report immediately, or check the Export to a different location checkbox, and then configure the following settings:
Export Location – Select one previously configured export location from the drop-down menu, or if you want to configure a new export location, click New Export Location, then follow the instructions provided in the Export Location section of this guide.
Notification – Check the Send Notification checkbox and select the Recipient of this notification. You can select a previously configured e-mail notification profile and click View to access detailed information, or click New E-mail Notification to create a new e-mail notification profile. For details on creating an e-mail notification profile, see the User Notification Settings section in the DocAve 6 Control Panel Reference Guide. You can choose to have the report included in the e-mail as an attachment by checking the Attach report to the e-mail when the size of the report is less than … checkbox, and then enter the maximum size of the report allowed in the less than __ MB text box.
Click OK to save the configurations and to export report. Click Cancel to go back to the List Deletion report interface without saving the configurations.
Generating Permission Changes Reports
Permission Changes Reports display information on the permission changes, such as breaking
permission inheritance, user permission changes, and permission levels. These reports provide auditing
and logging records to ensure data integrity, display availability of permissions and their sources, and
track breaches in confidentiality compliance.
To generate Permission Changes Reports, go to the Compliance Reports tab of Report Center, and click
Auditor Reports on the ribbon to expand the tab. Select the desired SharePoint Web applications/site
collections/sites/lists under a farm or SharePoint Online site collections/sites/lists under My Registered
143
DocAve 6: Report Center
Sites in the Scope pane, and then click Permission Changes in the Auditor Reports group on the ribbon.
You can configure the following settings in the Scope pane:
1. Report Profile Name – Select a previously configured profile from the drop-down menu or create a new profile by entering a new name in the Report Profile text box. Click the new button
( ) to clear all fields, click the save button ( ) to save changes to the current report profile, or
click the save as button ( ) to save any changes under a new profile name.
2. Scope – In the Scope configuration area, click the farm name and expand the data tree down to the desired SharePoint Web applications/site collections/sites/lists, click My Registered Sites, expand the SharePoint sites group to the desired site collections/sites/lists, or enter a URL/name in the search text box above the tree. Check the checkboxes next to the nodes you want to include in the report.
*Note: All of the selections in the Scope pane must be on the same SharePoint object level. For example, you can select multiple Web applications, or you can select multiple site collections within different Web applications, but you cannot select a Web application and a site collection at the same time.
3. Scope Filter – To filter SharePoint objects you would like to include in this profile within the selected scope, select a previously created scope filter from the Select a scope filter drop-down list. To create a new scope filter, click New Scope Filter. For details on creating a scope filter, refer to Configuring a Scope Filter.
4. Time Range –In the Time Range configuration area, choose one of the following options:
Duration – Check the Duration checkbox, and then select the desired time range from the drop-down menu. There are eight durations provided, respectively This Month, Last Month, Last 2 Months, This Week, Last Week, Last 2 Weeks, Today, and Yesterday.
Last __ Day(s)/Week(s)/Month(s) – Enter an integer into the text box and select by Day(s)/Week(s)/Month(s) from the drop-down menu. For example, if you enter 10 in the text box, and select Day(s) from the drop-down menu, and then you run the job, you are allowed to collect the data of the latest 10 days.
Custom – Check the Custom checkbox to customize the time range as you want.
5. Schedule (Optional) – In the schedule configuration area, choose one of the following options:
No Schedule – Select this option if you do not want to configure a schedule for this profile. If you choose this option, you must collect the data manually
Configure the schedule myself – Select this option to configure the specific time you want to collect the data of this profile. A schedule configuration area appears. You can customize the schedule with the following options:
o Export report – Choose whether or not to configure the Export Report Settings to store the Permission Changes reports by checking the Export report checkbox.
o Start time – Select the date and time for applying the rules of this profile and collecting the data.
144
DocAve 6: Report Center
*Note: The start time cannot be earlier than the current time.
o Interval – Enter an integer into the text box and select by Hour(s), Day(s), Week(s), or Month(s). The data will be collected repeatedly based on this schedule. Click Calendar View to see the schedules in a calendar.
o Schedule ending – Designate when to stop collecting the data for this profile. Select No end date for the data of this profile to be collected repeatedly until you stop it manually. Select End after ___ occurrence(s) to have the job stopped after the defined occurrences that you configured in the text box. Select End by Date + Time to specify the exact date and time for the data to stop being collected.
o Export Report Settings – Check the Export report checkbox. The Export Report Settings configuration area appears. Select the desired Report Format and Export Location, and then click View to access the detailed information of the selected export location. If you want to configure a new export location, click New Export Location, and follow the instructions provided in the Export Location section of this guide.
o Notification – Check the Send Notification checkbox and select the Recipient of this notification. You can select a previously configured e-mail notification profile, and then click View to access detailed information. Or, click New E-mail Notification to create a new e-mail notification profile. For details on creating an e-mail notification profile, see the User Notification Settings section in the DocAve 6 Control Panel Reference Guide. You can choose to have the report included in the e-mail as an attachment by checking the Attach report to the e-mail when the size of the report is less than … checkbox, and then enter the maximum size of the report allowed in the less than __ MB text box.
6. Notification (Optional) – Select one of the configured e-mail notifications from the drop-down menu to send the job condition to the specified users. Or, click New E-mail Notification to create a new e-mail notification profile. For details on creating an e-mail notification profile, see the User Notification Settings section in the DocAve 6 Control Panel Reference Guide.
7. Filters – The following filters are configurable in the Permission Changes reports:
URL Filter – Click to load the URL Filter tab to narrow the scope by specifying URLs.
User Filter – Click to load the User Filter tab to set the users whose activity you want to view or do not want to view.
o Include All Users – By default this option is selected. The activities of all users can be viewed.
o Include All External Users – The activities of all external users can be viewed. This option is only available when the nodes under My Registered Sites are selected in the Scope pane.
o Include All Users with Guest Links – The activities of all users with guest links can be viewed. This option is only available when the nodes under My Registered Sites are selected in the Scope pane.
145
DocAve 6: Report Center
o Users to Include – Enter the users whose activity you want to view. You can click the check names button ( ) to check the name you entered or click the browse
button ( ) to find the users you want to include.
o Users to Exclude – Enter the users whose activity you do not wish to view. You can click the check names button ( ) to check the name you entered or click
the browse button ( ) to find the users you want to exclude.
Action Filter – This filter cannot be edited, the default actions that are filtered by Permission Changes reports are: Add Group Member, Change Permission, Change Permission Level, and Break Permission Level Inheritance.
8. Choose one of the following options to run the Permission Changes reports:
Click Run Report, and then select Run Report only to run the job or select Save profile and run report from the drop-down menu to save the configuration and then run the job. After the job finishes, the report is displayed in the Report Display pane. You can click Show Report to view the history data collected before. However, if this profile has no running job record, the Show Report is grayed out.
Click the save button ( ) to save the report profile, and then click Export Now in the Report Actions group on the ribbon. The Export to Datasheet window appears. Complete the following steps to generate the report:
o Report Format – Select the desired report format from the drop-down menu.
o Export Settings – Choose whether to export the report now. Check the Export to local immediately checkbox and click OK to export the report immediately, or check the Export to a different location checkbox, and then configure the following settings:
Export Location – Select one previously configured export location from the drop-down menu, or if you want to configure a new export location, click New Export Location, then follow the instructions provided in the Export Location section of this guide.
Notification – Check the Send Notification checkbox and select the Recipient of this notification. You can select a previously configured e-mail notification profile and click View to access detailed information, or click New E-mail Notification to create a new e-mail notification profile. For details on creating an e-mail notification profile, see the User Notification Settings section in the DocAve 6 Control Panel Reference Guide. You can choose to have the report included in the e-mail as an attachment by checking the Attach report to the e-mail when the size of the report is less than … checkbox, and then enter the maximum size of the report allowed in the less than __ MB text box.
Click OK to save the configurations and to export report. Click Cancel to go back to the Permission Changes report interface without saving the configurations.
146
DocAve 6: Report Center
Generating Content Type Changes Reports
Content Type Changes Reports display all changes that have occurred to content types over a specified
period of time including where the changes were made and at what time. These reports provide
auditing and logging records to ensure data integrity related to the user, provide user information, and
also track breaches in confidentiality compliance.
To generate Content Type Changes Reports, in the Compliance Reports tab of Report Center, click
Auditor Reports on the ribbon to expand the tab. Select the desired SharePoint Web applications/site
collections/sites/lists under a farm or SharePoint Online site collections/sites/lists under My Registered
Sites in the Scope pane, and then click Content Type Changes in the Auditor Reports group on the
ribbon. You can configure the following settings in the Scope pane:
1. Report Profile Name – Select a previously configured profile from the drop-down menu or create a new profile by entering a new name in the Report Profile text box. Click the new button
( ) to clear all fields, click the save button ( ) to save changes to the current report profile, or
click the save as button ( ) to save any changes under a new profile name.
2. Scope – In the Scope configuration area, click the farm name and expand the data tree down to the desired SharePoint Web applications/site collections/sites/lists, click My Registered Sites, expand the SharePoint sites group to the desired site collections/sites/lists, or enter a URL/name in the search text box above the tree. Check the checkboxes next to the nodes you want to include in the report.
*Note: All of the selections in the Scope pane must be on the same SharePoint object level. For example, you can select multiple Web applications, or you can select multiple site collections within different Web applications, but you cannot select a Web application and a site collection at the same time.
3. Scope Filter – To filter SharePoint objects you would like to include in this profile within the selected scope, select a previously created scope filter from the Select a scope filter drop-down list. To create a new scope filter, click New Scope Filter. For details on creating a scope filter, refer to Configuring a Scope Filter.
4. Time Range – In the Time Range configuration area, choose one of the following options:
Duration – Check the Duration checkbox, and then select the desired time range from the drop-down menu. There are eight durations provided: This Month, Last Month, Last 2 Months, This Week, Last Week, Last 2 Weeks, Today, and Yesterday.
Last __ Day(s)/Week(s)/Month(s) – Enter an integer into the text box and select by Day(s)/Week(s)/Month(s) from the drop-down menu. For example, if you enter 10 in the text box, and select Day(s) from the drop-down menu, and then you run the job, you are allowed to collect the data of the latest 10 days.
Custom – Check the Custom checkbox to customize the time range as you want.
5. Schedule (Optional) – In the schedule configuration area, choose one of the following options:
No Schedule – Select this option if you do not want to configure a schedule for this profile. If you choose this option, you must collect the data manually
147
DocAve 6: Report Center
Configure the schedule myself – Select this option to configure the specific time you want to collect the data of this profile. A schedule configuration area appears. You can customize the schedule with the following options:
o Export report – Choose whether or not to configure the Export Report Settings to store the Content Type Changes reports by checking the Export report checkbox.
o Start time – Select the date and time for collecting the data.
*Note: The start time cannot be earlier than the current time.
o Interval – Enter an integer into the text box and select by Hour(s), Day(s), Week(s), or Month(s). The data will be collected repeatedly based on this schedule. Click Calendar View to see the schedules in a calendar.
o Schedule ending – Designate when to stop collecting the data for this profile. Select No end date for the data of this profile to be collected repeatedly until you stop it manually. Select End after ___ occurrence(s) to have the job stopped after the defined occurrences that you configured in the text box. Select End by Date + Time to specify the exact date and time for the data to stop being collected.
o Export Report Settings – Check the Export report checkbox. The Export Report Settings configuration area appears. Select the desired Report Format and Export Location, and then click View to access the detailed information of the selected export location. If you want to configure a new export location, click New Export Location, and follow the instructions provided in the Export Location section of this guide.
6. Notification (Optional) – Select one of the configured e-mail notifications from the drop-down menu to send the job condition to the specified users. Or, click New E-mail Notification to create a new e-mail notification profile. For details on creating an e-mail notification profile, see the User Notification Settings section in the DocAve 6 Control Panel Reference Guide.
7. Filters – The following filters are configurable in the Content Type Changes reports:
URL Filter – Click to load the URL Filter tab to narrow the scope by specifying URLs.
User Filter – Click to load the User Filter tab to set the users whose activity you want to view or do not want to view.
o Include All Users – By default this option is selected. The activities of all users can be viewed.
o Include All External Users – The activities of all external users can be viewed. This option is only available when the nodes under My Registered Sites are selected in the Scope pane.
o Include All Users with Guest Links – The activities of all users with guest links can be viewed. This option is only available when the nodes under My Registered Sites are selected in the Scope pane.
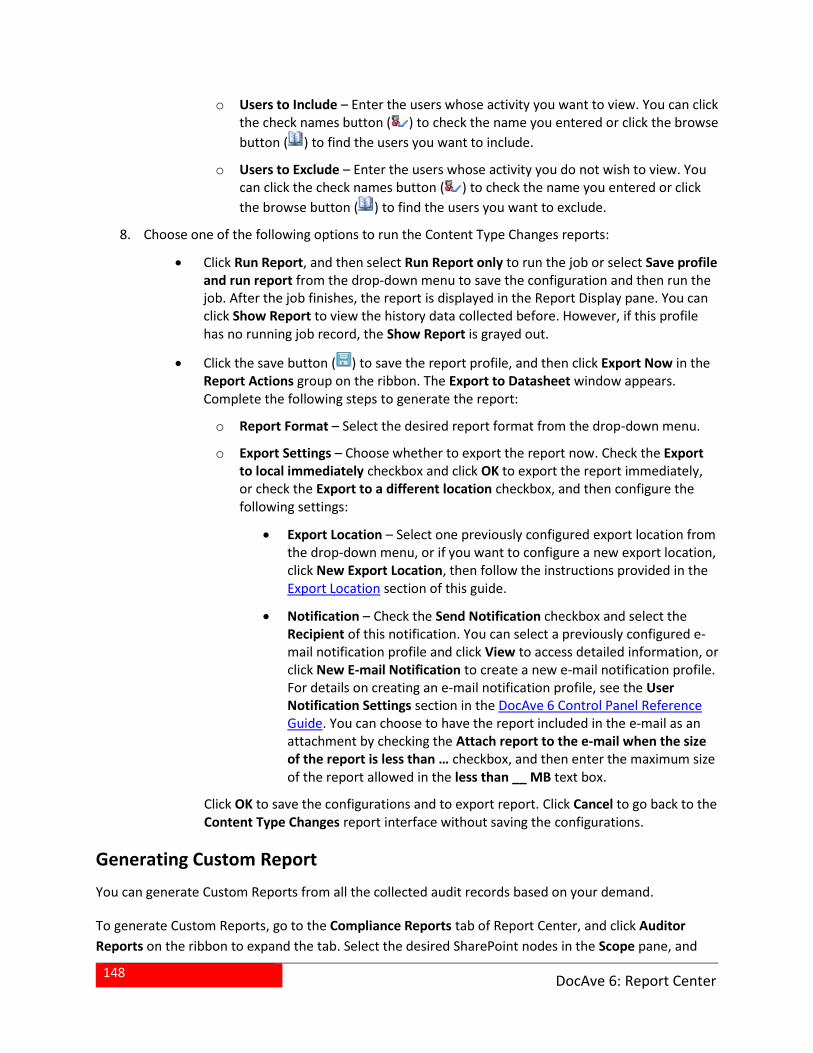
148
DocAve 6: Report Center
o Users to Include – Enter the users whose activity you want to view. You can click the check names button ( ) to check the name you entered or click the browse
button ( ) to find the users you want to include.
o Users to Exclude – Enter the users whose activity you do not wish to view. You can click the check names button ( ) to check the name you entered or click
the browse button ( ) to find the users you want to exclude.
8. Choose one of the following options to run the Content Type Changes reports:
Click Run Report, and then select Run Report only to run the job or select Save profile and run report from the drop-down menu to save the configuration and then run the job. After the job finishes, the report is displayed in the Report Display pane. You can click Show Report to view the history data collected before. However, if this profile has no running job record, the Show Report is grayed out.
Click the save button ( ) to save the report profile, and then click Export Now in the Report Actions group on the ribbon. The Export to Datasheet window appears. Complete the following steps to generate the report:
o Report Format – Select the desired report format from the drop-down menu.
o Export Settings – Choose whether to export the report now. Check the Export to local immediately checkbox and click OK to export the report immediately, or check the Export to a different location checkbox, and then configure the following settings:
Export Location – Select one previously configured export location from the drop-down menu, or if you want to configure a new export location, click New Export Location, then follow the instructions provided in the Export Location section of this guide.
Notification – Check the Send Notification checkbox and select the Recipient of this notification. You can select a previously configured e-mail notification profile and click View to access detailed information, or click New E-mail Notification to create a new e-mail notification profile. For details on creating an e-mail notification profile, see the User Notification Settings section in the DocAve 6 Control Panel Reference Guide. You can choose to have the report included in the e-mail as an attachment by checking the Attach report to the e-mail when the size of the report is less than … checkbox, and then enter the maximum size of the report allowed in the less than __ MB text box.
Click OK to save the configurations and to export report. Click Cancel to go back to the Content Type Changes report interface without saving the configurations.
Generating Custom Report
You can generate Custom Reports from all the collected audit records based on your demand.
To generate Custom Reports, go to the Compliance Reports tab of Report Center, and click Auditor
Reports on the ribbon to expand the tab. Select the desired SharePoint nodes in the Scope pane, and
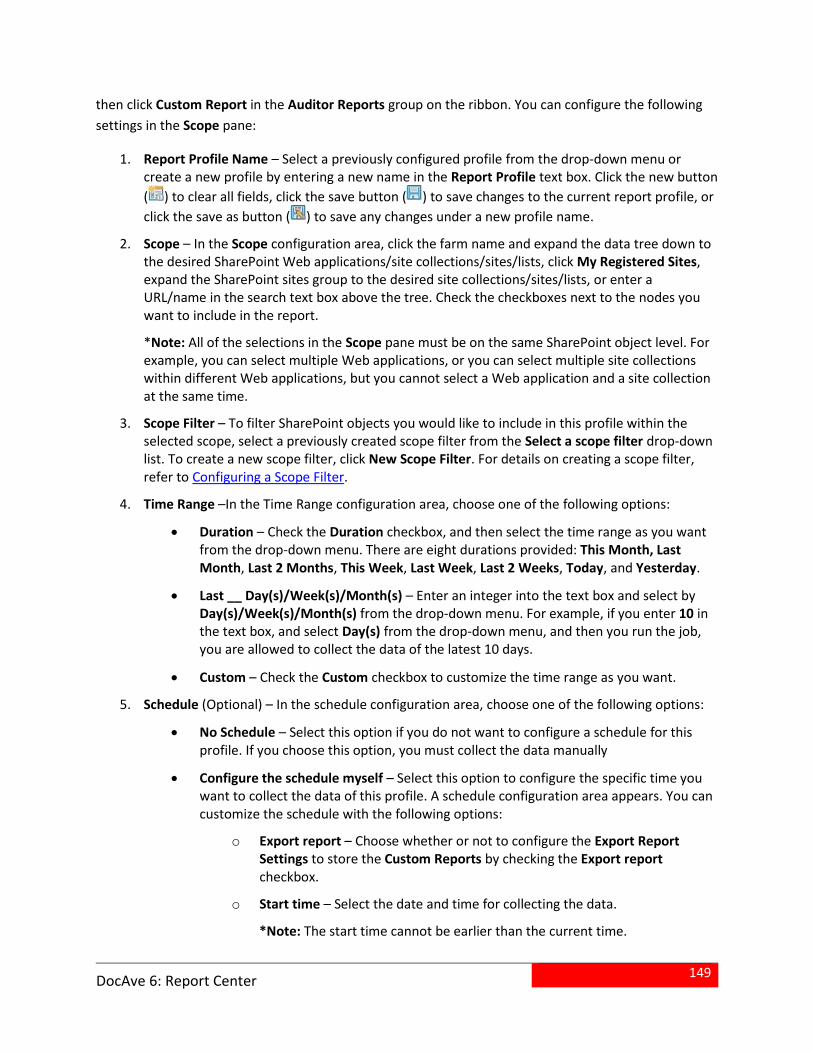
149
DocAve 6: Report Center
then click Custom Report in the Auditor Reports group on the ribbon. You can configure the following
settings in the Scope pane:
1. Report Profile Name – Select a previously configured profile from the drop-down menu or create a new profile by entering a new name in the Report Profile text box. Click the new button
( ) to clear all fields, click the save button ( ) to save changes to the current report profile, or
click the save as button ( ) to save any changes under a new profile name.
2. Scope – In the Scope configuration area, click the farm name and expand the data tree down to the desired SharePoint Web applications/site collections/sites/lists, click My Registered Sites, expand the SharePoint sites group to the desired site collections/sites/lists, or enter a URL/name in the search text box above the tree. Check the checkboxes next to the nodes you want to include in the report.
*Note: All of the selections in the Scope pane must be on the same SharePoint object level. For example, you can select multiple Web applications, or you can select multiple site collections within different Web applications, but you cannot select a Web application and a site collection at the same time.
3. Scope Filter – To filter SharePoint objects you would like to include in this profile within the selected scope, select a previously created scope filter from the Select a scope filter drop-down list. To create a new scope filter, click New Scope Filter. For details on creating a scope filter, refer to Configuring a Scope Filter.
4. Time Range –In the Time Range configuration area, choose one of the following options:
Duration – Check the Duration checkbox, and then select the time range as you want from the drop-down menu. There are eight durations provided: This Month, Last Month, Last 2 Months, This Week, Last Week, Last 2 Weeks, Today, and Yesterday.
Last __ Day(s)/Week(s)/Month(s) – Enter an integer into the text box and select by Day(s)/Week(s)/Month(s) from the drop-down menu. For example, if you enter 10 in the text box, and select Day(s) from the drop-down menu, and then you run the job, you are allowed to collect the data of the latest 10 days.
Custom – Check the Custom checkbox to customize the time range as you want.
5. Schedule (Optional) – In the schedule configuration area, choose one of the following options:
No Schedule – Select this option if you do not want to configure a schedule for this profile. If you choose this option, you must collect the data manually
Configure the schedule myself – Select this option to configure the specific time you want to collect the data of this profile. A schedule configuration area appears. You can customize the schedule with the following options:
o Export report – Choose whether or not to configure the Export Report Settings to store the Custom Reports by checking the Export report checkbox.
o Start time – Select the date and time for collecting the data.
*Note: The start time cannot be earlier than the current time.
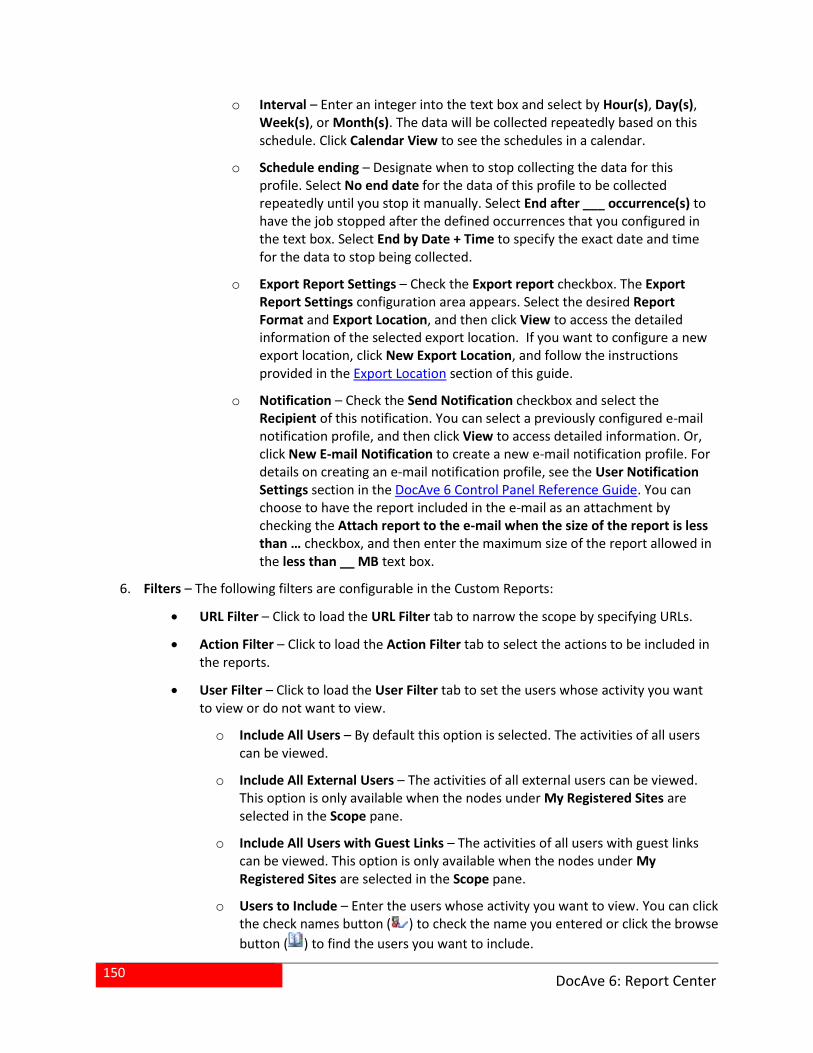
150
DocAve 6: Report Center
o Interval – Enter an integer into the text box and select by Hour(s), Day(s), Week(s), or Month(s). The data will be collected repeatedly based on this schedule. Click Calendar View to see the schedules in a calendar.
o Schedule ending – Designate when to stop collecting the data for this profile. Select No end date for the data of this profile to be collected repeatedly until you stop it manually. Select End after ___ occurrence(s) to have the job stopped after the defined occurrences that you configured in the text box. Select End by Date + Time to specify the exact date and time for the data to stop being collected.
o Export Report Settings – Check the Export report checkbox. The Export Report Settings configuration area appears. Select the desired Report Format and Export Location, and then click View to access the detailed information of the selected export location. If you want to configure a new export location, click New Export Location, and follow the instructions provided in the Export Location section of this guide.
o Notification – Check the Send Notification checkbox and select the Recipient of this notification. You can select a previously configured e-mail notification profile, and then click View to access detailed information. Or, click New E-mail Notification to create a new e-mail notification profile. For details on creating an e-mail notification profile, see the User Notification Settings section in the DocAve 6 Control Panel Reference Guide. You can choose to have the report included in the e-mail as an attachment by checking the Attach report to the e-mail when the size of the report is less than … checkbox, and then enter the maximum size of the report allowed in the less than __ MB text box.
6. Filters – The following filters are configurable in the Custom Reports:
URL Filter – Click to load the URL Filter tab to narrow the scope by specifying URLs.
Action Filter – Click to load the Action Filter tab to select the actions to be included in the reports.
User Filter – Click to load the User Filter tab to set the users whose activity you want to view or do not want to view.
o Include All Users – By default this option is selected. The activities of all users can be viewed.
o Include All External Users – The activities of all external users can be viewed. This option is only available when the nodes under My Registered Sites are selected in the Scope pane.
o Include All Users with Guest Links – The activities of all users with guest links can be viewed. This option is only available when the nodes under My Registered Sites are selected in the Scope pane.
o Users to Include – Enter the users whose activity you want to view. You can click the check names button ( ) to check the name you entered or click the browse
button ( ) to find the users you want to include.
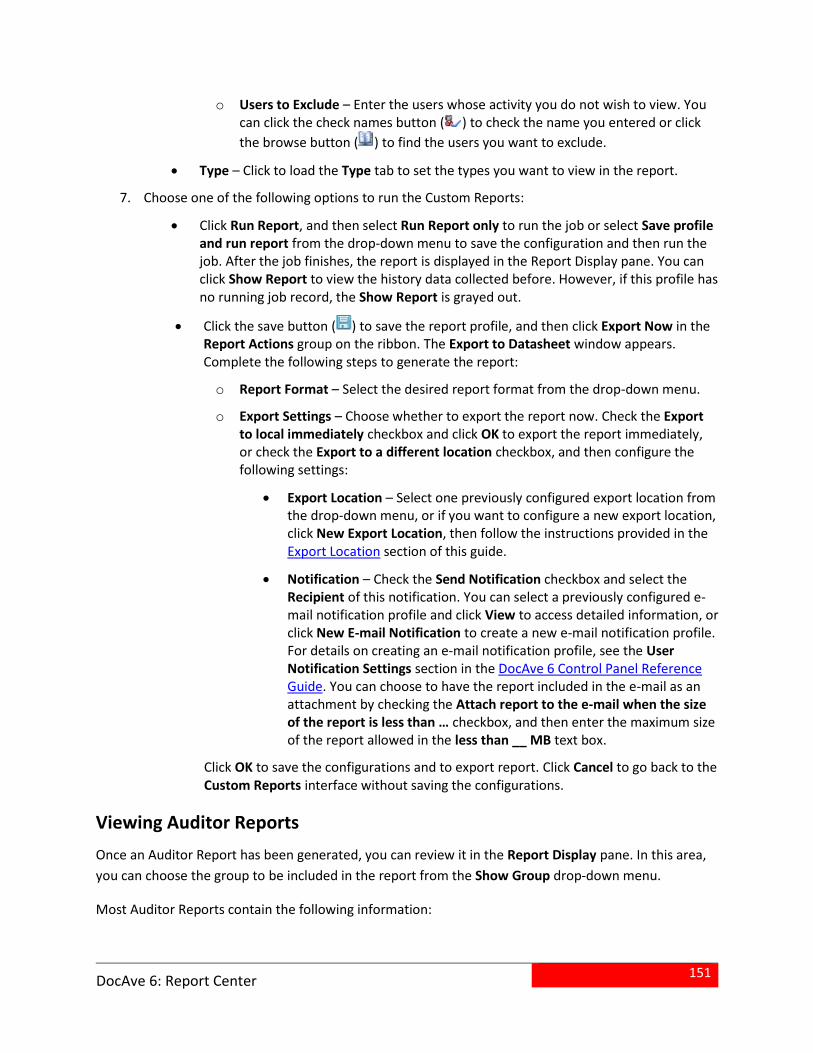
151
DocAve 6: Report Center
o Users to Exclude – Enter the users whose activity you do not wish to view. You can click the check names button ( ) to check the name you entered or click
the browse button ( ) to find the users you want to exclude.
Type – Click to load the Type tab to set the types you want to view in the report.
7. Choose one of the following options to run the Custom Reports:
Click Run Report, and then select Run Report only to run the job or select Save profile and run report from the drop-down menu to save the configuration and then run the job. After the job finishes, the report is displayed in the Report Display pane. You can click Show Report to view the history data collected before. However, if this profile has no running job record, the Show Report is grayed out.
Click the save button ( ) to save the report profile, and then click Export Now in the Report Actions group on the ribbon. The Export to Datasheet window appears. Complete the following steps to generate the report:
o Report Format – Select the desired report format from the drop-down menu.
o Export Settings – Choose whether to export the report now. Check the Export to local immediately checkbox and click OK to export the report immediately, or check the Export to a different location checkbox, and then configure the following settings:
Export Location – Select one previously configured export location from the drop-down menu, or if you want to configure a new export location, click New Export Location, then follow the instructions provided in the Export Location section of this guide.
Notification – Check the Send Notification checkbox and select the Recipient of this notification. You can select a previously configured e-mail notification profile and click View to access detailed information, or click New E-mail Notification to create a new e-mail notification profile. For details on creating an e-mail notification profile, see the User Notification Settings section in the DocAve 6 Control Panel Reference Guide. You can choose to have the report included in the e-mail as an attachment by checking the Attach report to the e-mail when the size of the report is less than … checkbox, and then enter the maximum size of the report allowed in the less than __ MB text box.
Click OK to save the configurations and to export report. Click Cancel to go back to the Custom Reports interface without saving the configurations.
Viewing Auditor Reports
Once an Auditor Report has been generated, you can review it in the Report Display pane. In this area,
you can choose the group to be included in the report from the Show Group drop-down menu.
Most Auditor Reports contain the following information:
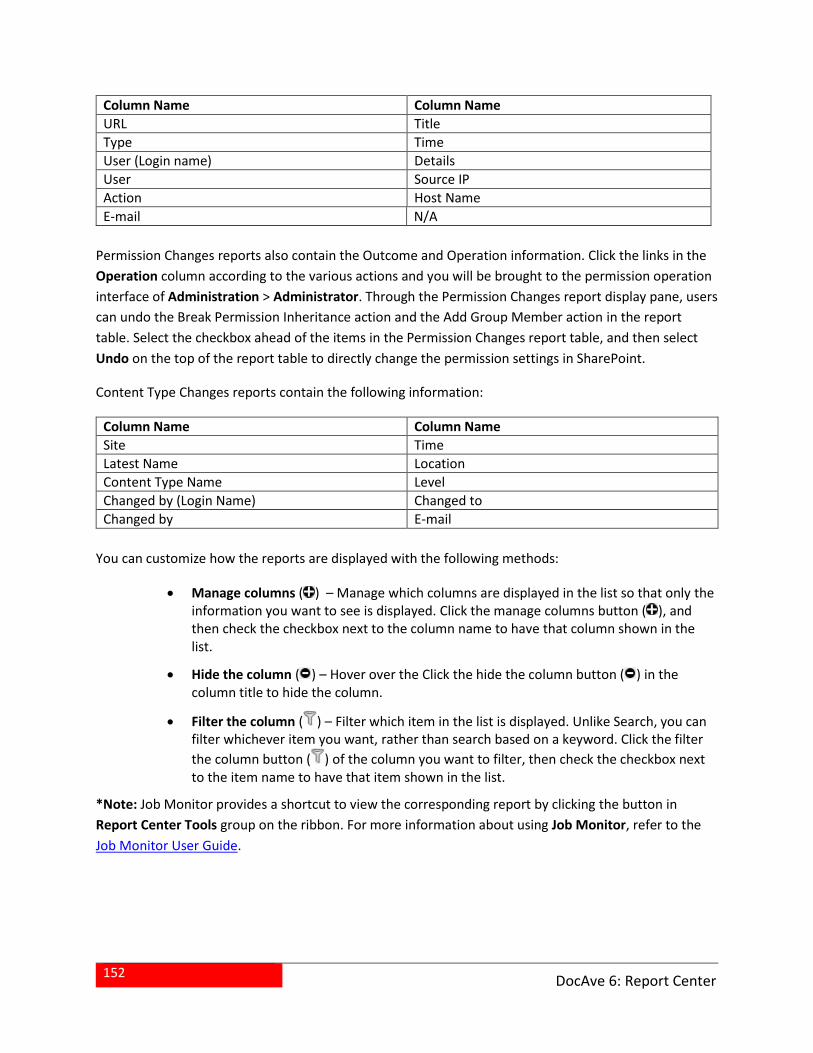
152
DocAve 6: Report Center
Column Name Column Name
URL Title
Type Time
User (Login name) Details
User Source IP
Action Host Name
E-mail N/A
Permission Changes reports also contain the Outcome and Operation information. Click the links in the
Operation column according to the various actions and you will be brought to the permission operation
interface of Administration > Administrator. Through the Permission Changes report display pane, users
can undo the Break Permission Inheritance action and the Add Group Member action in the report
table. Select the checkbox ahead of the items in the Permission Changes report table, and then select
Undo on the top of the report table to directly change the permission settings in SharePoint.
Content Type Changes reports contain the following information:
Column Name Column Name
Site Time
Latest Name Location
Content Type Name Level
Changed by (Login Name) Changed to
Changed by E-mail
You can customize how the reports are displayed with the following methods:
Manage columns ( ) – Manage which columns are displayed in the list so that only the information you want to see is displayed. Click the manage columns button ( ), and then check the checkbox next to the column name to have that column shown in the list.
Hide the column ( ) – Hover over the Click the hide the column button ( ) in the column title to hide the column.
Filter the column ( ) – Filter which item in the list is displayed. Unlike Search, you can filter whichever item you want, rather than search based on a keyword. Click the filter
the column button ( ) of the column you want to filter, then check the checkbox next to the item name to have that item shown in the list.
*Note: Job Monitor provides a shortcut to view the corresponding report by clicking the button in
Report Center Tools group on the ribbon. For more information about using Job Monitor, refer to the
Job Monitor User Guide.
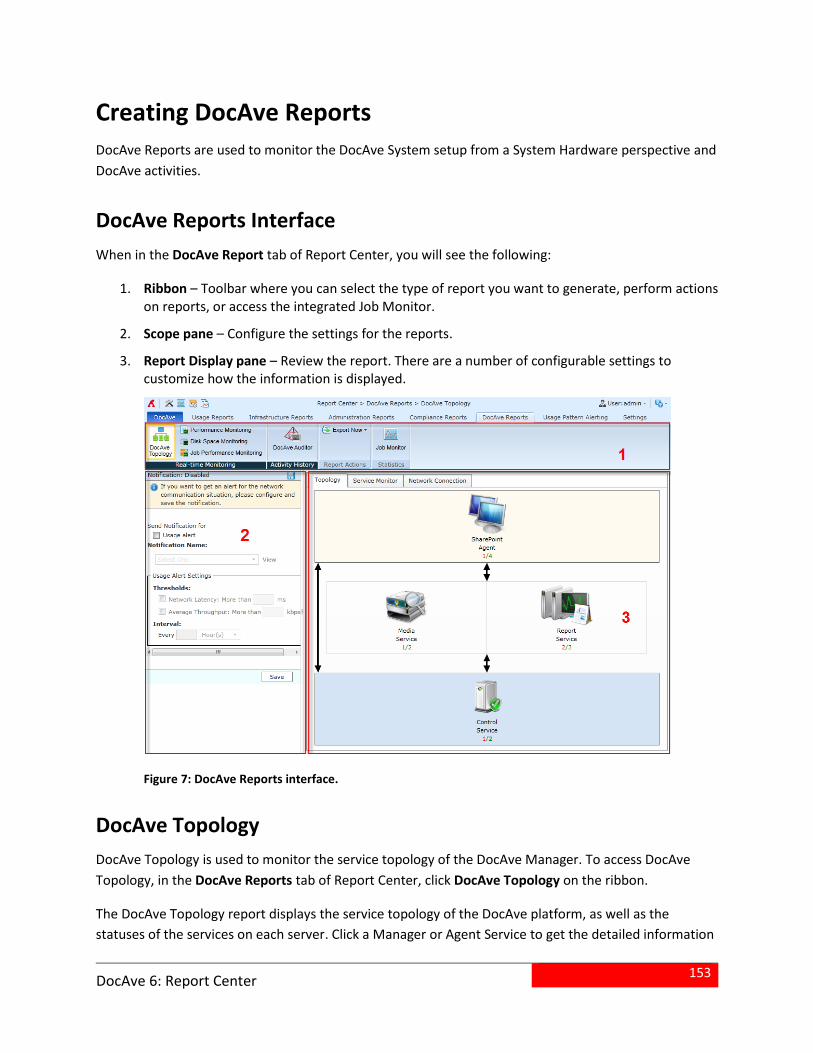
153
DocAve 6: Report Center
Creating DocAve Reports
DocAve Reports are used to monitor the DocAve System setup from a System Hardware perspective and
DocAve activities.
DocAve Reports Interface
When in the DocAve Report tab of Report Center, you will see the following:
1. Ribbon – Toolbar where you can select the type of report you want to generate, perform actions on reports, or access the integrated Job Monitor.
2. Scope pane – Configure the settings for the reports.
3. Report Display pane – Review the report. There are a number of configurable settings to customize how the information is displayed.
Figure 7: DocAve Reports interface.
DocAve Topology
DocAve Topology is used to monitor the service topology of the DocAve Manager. To access DocAve
Topology, in the DocAve Reports tab of Report Center, click DocAve Topology on the ribbon.
The DocAve Topology report displays the service topology of the DocAve platform, as well as the
statuses of the services on each server. Click a Manager or Agent Service to get the detailed information
154
DocAve 6: Report Center
such as server name, status, operating system, memory and so on. You can view the status on each
service in the topology under the Service Monitor tab and the network throughput under the Network
Connection tab.
In the Notification configuration area, check the Usage alert checkbox if you want to have e-mail
notifications sent out when the desired criteria are met. Then configure the following options:
Notification Name – Select a previously configured e-mail notification, or click New E-mail Notification to create a new e-mail notification profile. For details on creating an e-mail notification profile, see the User Notification Settings section in the DocAve 6 Control Panel Reference Guide.
Thresholds – Specify the triggers for the notification. You may choose to use one or both of these thresholds:
o Check the Network Latency: More than __ ms checkbox to activate this threshold, and then enter a positive integer into the text box.
o Check the Average Throughput: More than __ kbps checkbox to activate this threshold, and then enter a positive integer into the text box.
Interval – Specify the frequency of e-mail notifications. Enter a positive integer into the Every text box, then select by Hour(s), Day(s), Week(s), Month(s) or Year(s) from the drop-down menu.
Performance Monitoring
Performance Monitoring displays the CPU and Memory Usage of the DocAve Manager host.
Generating Performance Monitoring Reports
To configure the basic settings for the Performance Monitoring report, in the DocAve Reports tab of
Report Center, click Performance Monitoring on the ribbon. You can configure the following settings in
the Scope pane:
1. Report Profile Name – Select a previously configured profile from the drop-down menu or create a new profile by entering a new name in the Report Profile text box. Click the new button
( ) to clear all fields, click the save button ( ) to save changes to the current report profile, or
click the save as button ( ) to save any changes under a new profile name.
2. Scope – Select the Host you want to have the report generated on.
3. E-mail Notification – Check the Usage alert checkbox if you want to have e-mail notifications sent out when the desired criteria are met. Then configure the following options:
Notification Name – Select a previously configured e-mail notification, or click New E-mail Notification to create a new e-mail notification rule. For details on creating an e-mail notification rule, see the User Notification Settings section in the DocAve 6 Control Panel Reference Guide. Thresholds – Specify the triggers for the notification. You may choose to use one or both of these thresholds:
155
DocAve 6: Report Center
o Check the CPU checkbox to activate this threshold, and then enter the values for __% lasts for more than __ minute(s).
o Check the Memory checkbox to activate this threshold, and then enter the values for __% lasts for more than __ minutes.
*Note: By default the CPU and memory are checked twice each minute. If these numbers exceed the thresholds set here, an e-mail notification will be sent.
Interval – Specify the frequency of e-mail notifications. Enter a positive integer into the Every text box, then select by Minute(s) or Hour(s) from the drop-down menu.
Click Show Report to generate the report in the Report Display pane on the right.
Viewing Performance Monitoring Reports
Once you have generated a report, the Report Display pane has a number of configurable settings so
that you can customize how to display the reports, the following settings can be configured in the
Report Display pane:
Time Interval – Time interval the report is displayed in.
CPU/Memory – Display CPU data, memory data, or both.
Scope – Change the scope for the data shown in the report.
Details – Performance per host machine.
Filter selection – Filter the data displayed.
Disk Space Monitoring
A Disk Space Monitoring report displays the space usage of DocAve logical devices. It can only show the
space usage of Net Share devices used in the selected logical devices.
Generating Disk Space Monitoring Reports
To configure the basic settings for the Disk Space Monitoring report, in the DocAve Reports tab of
Report Center, click Disk Space Monitoring on the ribbon. You can configure the following settings in
the Scope pane:
1. Report Profile Name – Select a previously configured profile from the drop-down menu or create a new profile by entering a new name in the Report Profile text box. Click the new button
( ) to clear all fields, click the save button ( ) to save changes to the current report profile, or
click the save as button ( ) to save any changes under a new profile name.
2. Scope – Select the Logical Device you want to have the report generated on.
3. Enable Collector – Collect data for the report. By default, this feature collects the information at midnight everyday (according to your Report Service’s time zone). Click Data Collection to jump to the Data Collection page. By default, the collector schedule is enabled. To disable the
156
DocAve 6: Report Center
collector schedule, uncheck the Enable Collector checkbox. The status of the collector will change to Disabled, and DocAve will not collect the information according to the schedule. For more information about Collector, refer to the Data Collection section of this guide.
4. E-mail Notification – In the e-mail notification configuration area, you can set up two types of notifications for this report. You can configure both of the Usage Alert Settings and Prediction Settings, or one of them. Check the Usage alert checkbox if you want to have e-mail sent out when the specified thresholds are met, and then the Usage Alert Settings area becomes active. Check the Prediction checkbox if you want to have e-mail sent out when the prediction value is met, and then the Prediction Settings area becomes active. Configure the following settings:
Notification Name – The two types of the notification use the same notification profile to send the e-mail. Select a previously configured e-mail notification profile, or click New E-mail Notification to create a new e-mail notification profile. For details on creating an e-mail notification profile, see the User Notification Settings section in the DocAve 6 Control Panel Reference Guide.
Usage Alert Settings – Specify the triggers of the storage the time interval and, when the storage size exceeds the values you set up, the e-mail will be sent out. Configure the settings for the Usage Alert notification.
o Thresholds – Specify the usage alert triggers for this notification. Enter the values for More than __% usage.
*Note: By default, thresholds are checked depending on the interval you have configured. If these numbers exceed the thresholds set here, an e-mail notification will be sent.
o Interval – Specify the time interval for sending the e-mail. Enter an integer into the Every__ textbox, and then select the Hour(s)/Day(s)/Week(s)/Month(s)/Year(s) from the drop-down menu.
Prediction Settings– Check this checkbox to enable notifications triggered by prediction values, then configure the following settings:
o Time Range – Enter a positive integer into the In the upcoming __ text box, and select Day(s) or Week(s) from the drop-down menu.
o Thresholds – Enter the value for More than __% usage.
o Interval – Specify the frequency of e-mail notifications. Enter a positive integer into the Every__ text box, then select by Hour(s), Day(s), Week(s), Month(s) or Year(s) from the drop-down menu.
Click Collect Now to collect the data immediately. Click Show Report to generate the report in the
Report Display pane on the right.
Viewing Disk Space Monitoring Reports
Once you have generated a report, the Report Display pane has a number of configurable settings so
that you can customize how to display the reports, the following settings can be configured in the
Report Display pane:
157
DocAve 6: Report Center
X-Axis – Set the parameter for the X-Axis.
Range – Time frame parameter for the report.
Frequency – Time interval the report is displayed in.
Type – Set report type.
Custom – Customize the date range, frequency, and type in a calendar.
Scope – Change the scope for the data shown in the report.
Data – Data group to display.
Usage – Usage per frequency.
Prediction – Predicted trends based on current trends.
Status – Current data types broken down.
Details – Usage per device data.
Job Performance Monitoring
Job Performance Monitoring displays the job performance of granular and platform level backups and
restores.
Click Job Performance Monitoring. The Job Performance Monitoring report will be displayed in the
window. Select the job type you want to monitor at the top right corner of the window. You can view
the detailed information about the job in the Details tab.
Viewing the Job Performance Monitoring Report
Once you have generated a report, the Report Display pane has a number of configurable settings so
that you can customize how to display the reports, the following settings can be configured in the
Report Display pane:
Range – Time frame parameter for the report.
Custom – Customize the date range in a calendar.
Filter selection – Filter the data displayed.
Job Performance Monitoring – Job performance of all of the Platform Backup/Platform Restore/Granular Backup/ Granular Restore jobs within the selected time range.
Details – Job performance data per job.
DocAve Auditor
DocAve Auditor monitors the activities of each module across the DocAve system, such as creating a
plan, deleting a profile, installing or uninstalling the Agents, and so on. For a table of the actions that are
158
DocAve 6: Report Center
audited by DocAve Auditor across the DocAve system, refer to Appendix B: DocAve Module Actions
Audited by DocAve Auditor. To access DocAve Auditor, in the DocAve Reports tab of Report Center, click
DocAve Auditor on the ribbon.
Viewing the DocAve Auditor Report
Once you have generated a report, the Report Display pane has a number of configurable settings so
that you can customize how to display the reports, the following settings can be configured in the
Report Display pane:
Range – Time frame parameter for the report.
Frequency – Time interval the report is displayed in.
Type – Time interval the report is displayed in.
Custom – Customize the date range, frequency, and type in a calendar.
Y-Axis – Set the parameter for the Y-axis.
DocAve Auditor – Activities by time per frequency.
Details – Activities per user with modular data.
159
DocAve 6: Report Center
Monitoring User Activities in SharePoint via Usage
Pattern Alerting
Usage Pattern Alerting supports the ability to establish a limitation for certain user activities that have
occurred in SharePoint environments. By applying the Usage Pattern Alerting plans including pre-
configured rule profiles and custom action profiles to specific SharePoint nodes, Usage Pattern Alerting
keeps monitoring the corresponding user activities within your SharePoint environment. It can identify
and generate a report of the user activities that trigger the thresholds configured in rule profiles. It also
supports either automatically handling the identified user activities. Usage Pattern Alerting ensures that
all of the user activities to your SharePoint environment remain within your organization’s defined
governance policy and under control. Refer to the topics below for information related to Usage Pattern
Alerting.
To access Usage Pattern Alerting, click Usage Pattern Alerting on the Report Center welcome page.
To monitor user activities within your SharePoint environment using Usage Pattern Alerting, first review
Types of Usage Pattern Alerting Rules and then follow the procedures below:
1. Configuring Rule Profiles
2. Configuring Custom Action Profiles
3. Configuring Usage Pattern Alerting Plans
4. Viewing Usage Pattern Alerting Report
Types of Usage Pattern Alerting Rules
The following types of rules are available in Usage Pattern Alerting:
1. Activity Measured by Audit Events – Monitors how many times a user performs selected activities on SharePoint objects at user-defined levels within a user-defined time range. The user activities monitored by this rule type are defined by SharePoint audit events.
2. Objects Affected by Audit Events – Monitors the number of SharePoint objects on which a user perform selected activities at user-defined levels within a user-defined time range. The user activities monitored by this rule type are defined by SharePoint audit events.
3. Download and Upload – Monitors the frequency at which a user downloads items from or uploads items to SharePoint, the total size of those downloaded or uploaded items, and the number of downloaded items within a user-defined time range.
Configuring Rule Profiles
In Rule Profile, you can configure rule profiles to include rules as user activity thresholds. The rules in a
profile can be applied in bulk by one or more Usage Pattern Alerting plans to identify user activities that
160
DocAve 6: Report Center
trigger the pre-configured thresholds. To access the Rule Profile interface, click Usage Pattern Alerting
on the Report Center welcome page and click Rule Profile in the Usage Pattern Alerting interface.
Refer to the sections for instructions on creating and managing rule profiles.
Creating a Rule Profile
To create a rule profile, complete the steps below:
1. Click Create on the ribbon. The Create a New Rule Profile interface appears.
2. In the Name section, enter a name and an optional description for the profile you want to create into the Name and Description text boxes.
3. Configure the rules you want to add into this rule profile. For detailed instructions on configuring Usage Pattern Alerting rules, refer to Creating or Editing Usage Pattern Alerting Rules.
4. Click Save to save the configurations and create the rule profile or click Cancel to return to the Rule Profile interface without saving the configurations.
Creating or Editing Usage Pattern Alerting Rules
To create or edit Usage Pattern Alerting rules in the Create a New Rule Profile or Edit Rule Profile
interface, complete the following steps:
1. Select the type of the rule you want to add from the drop-down list next to the Add a Rule link and then click the Add a Rule link. A new rule of the selected type is added into the table above.
2. Configure the settings of the rule by completing the following fields:
Rule – Select the user activity and metric type of the rule.
o With the Activity Measured by Audit Events type selected, two drop-down lists are available in the Rule field. Select the user activity you want to monitor by this rule from the first drop-down list and the SharePoint object levels at which you want to monitor the selected user activities from the second drop-down list. For detailed information on the SharePoint audit events represented by each user activity option and the available SharePoint object level options for each user activity option, refer to Appendix F: Supported SharePoint Audit Events and Object Levels of Usage Pattern Alerting Rules.
o With the Objects Affected by Audit Events type selected, a drop-down list is available in the Rule field. Select the user activity the number of SharePoint objects affected by which you want to monitor by this rule from the drop-down list. For detailed information on the SharePoint audit events represented by each user activity option, refer to Appendix F: Supported SharePoint Audit Events and Object Levels of Usage Pattern Alerting Rules.
o With the Download and Upload type selected, two drop-down lists are available in the Rule field.
161
DocAve 6: Report Center
From the first drop-down list, select Download or Upload as the type of activity you want to monitor.
From the second drop-down list, select the metric type for selected activity from Size, Times, and Items (for the Download type only).
Value – Configure the threshold for the rule you are about to add.
o With the Activity Measured by Audit Events type selected, configure the threshold by entering an activity count integer into the >= _ times text box and then specifying a time range. If a user performs the corresponding activity the number of times entered here within the specified time range, this rule will be triggered.
o With the Objects Affected by Audit Events type selected, configure the threshold by entering an object count integer into the text box next to >=, selecting an object level, and specifying a time range. If a user performs the corresponding activity on the entered number of objects within the specified time range, this rule will be triggered.
*Note: The SharePoint object level options available in the Value filed depend on the user activity option selected in the Rule field. For detailed information on the available SharePoint object level options for each user activity option, refer to Appendix F: Supported SharePoint Audit Events and Object Levels of Usage Pattern Alerting Rules.
o With the Download and Upload type selected, configure the threshold by specifying the maximum total size, activity count, item count (for the Download type only), and a time range. If a user downloads or uploads items of the specified size, download items of the specified number, or for the specified times, this rule will be triggered.
3. To add more rules, repeat the previous step.
*Note: The logical relationship between the rules are Or. In the Basic Filter Condition section,
you can view the logical relationship of the rules.
4. After configuring one rule, click Add a Rule to add another rule or delete a previously added rule
by selecting the checkbox of the rule and clicking the Remove ( ) button.
Managing Rule Profiles
In the Rule Profile interface, all of the previously created rule profiles are displayed. You can perform
the following operations to manage the rule profiles:
View – To view the detailed configuration of a rule profile, select the corresponding checkbox of the desired rule profile and then click View on the ribbon to access the View Details of Rule Profile interface. If you want to make any changes to the rule profile, click Edit on the ribbon to access the Edit Rule Profile interface.
162
DocAve 6: Report Center
Edit – To edit a previously created rule profile, select the corresponding checkbox of the desired rule profile, and then click Edit on the ribbon to access the Edit Rule Profile Interface.
Delete – To delete the rule profiles you no longer need, select the corresponding checkboxes of the rule profiles and click Delete on the ribbon. A confirmation window pops up. Click OK to delete the selected rule profiles, or click Cancel to return to the Rule Profile interface without deleting the selected rule profiles.
Configuring Custom Action Profiles
In Custom Action Profile, you can configure custom action profiles to contain the custom actions that
will be taken immediately to handle behavior defined by the rules in Usage Pattern Alerting plans. To
access Custom Action Profile, click Usage Pattern Alerting on the Report Center welcome page and click
Custom Action Profile in the Usage Pattern Alerting interface.
Refer to the sections for instructions on creating and managing custom action profiles.
Creating a Custom Action Profile
To create a custom action profile, complete the steps below:
1. Click Create on the ribbon. The Create a New Custom Action Profile appears.
2. In the Name section, enter a name and an optional description for the profile you want to create into the Name and Description text boxes.
3. In the Actions to Take section, select and configure the actions you want DocAve to take immediately after user activities are identified by the Usage Pattern Alerting plans where this custom action profile is applied.
Send e-mail notifications of the identified suspicious user activities – To send e-mail notifications of the identified user activities to desired users, select this checkbox. The Recipients text box, Include the site collection administrators, and Include the usernames of those who triggered the rules checkboxes appear below.
o In the Recipients text box, specify the recipient who will receive the e-mail notifications by selecting a previously created e-mail notification profile or clicking New E-mail Notification to create a new one.
o Include the site collection administrators – Select this option to deliver the e-mail notifications of the identified user activities to the site collection administrators of the site collections where the activities are identified.
o Include the usernames of those who triggered the rules – Select this option to notify the users who trigger the rules in the Usage Pattern Alerting plans where this custom action profile is applied.
Run a .exe file – This option allows you to run a .exe application file automatically to handle the identified user activities immediately after the activities are identified by the Usage Pattern Alerting plan where this custom action profile is applied. Select this
163
DocAve 6: Report Center
option and click the Browse button to upload a desired .exe file. For details on how the uploaded .exe file is automatically run, and how to configure a .exe file, refer to Configuring a .exe File or PowerShell Script Used in Custom Action Profile.
Run a PowerShell script – This option allows you to run a PowerShell script automatically to handle the user activities immediately after the activities are identified by the Usage Pattern Alerting plan where this custom action profile is applied. Select this option and click the Browse button to upload a desired .ps1 file. For details on how the uploaded PowerShell script is automatically run, and how to configure a PowerShell script, refer to Configuring a .exe File or PowerShell Script Used in Custom Action Profile.
2. Click Save to save the configurations and create the custom action profile, or click Cancel to return to the Custom Action Profile interface without saving the configurations.
Configuring a .exe File or PowerShell Script Used in Custom Action Profile
While configuring a Usage Pattern Alerting custom action profile, you can use the Run .exe file or Run a
PowerShell script option to upload a .exe file or a PowerShell script to handle the user activities
identified by the rules in the Usage Pattern Alerting plan where this custom action profile is applied. In
the .exe file or PowerShell script, you can configure the custom actions used for processing the
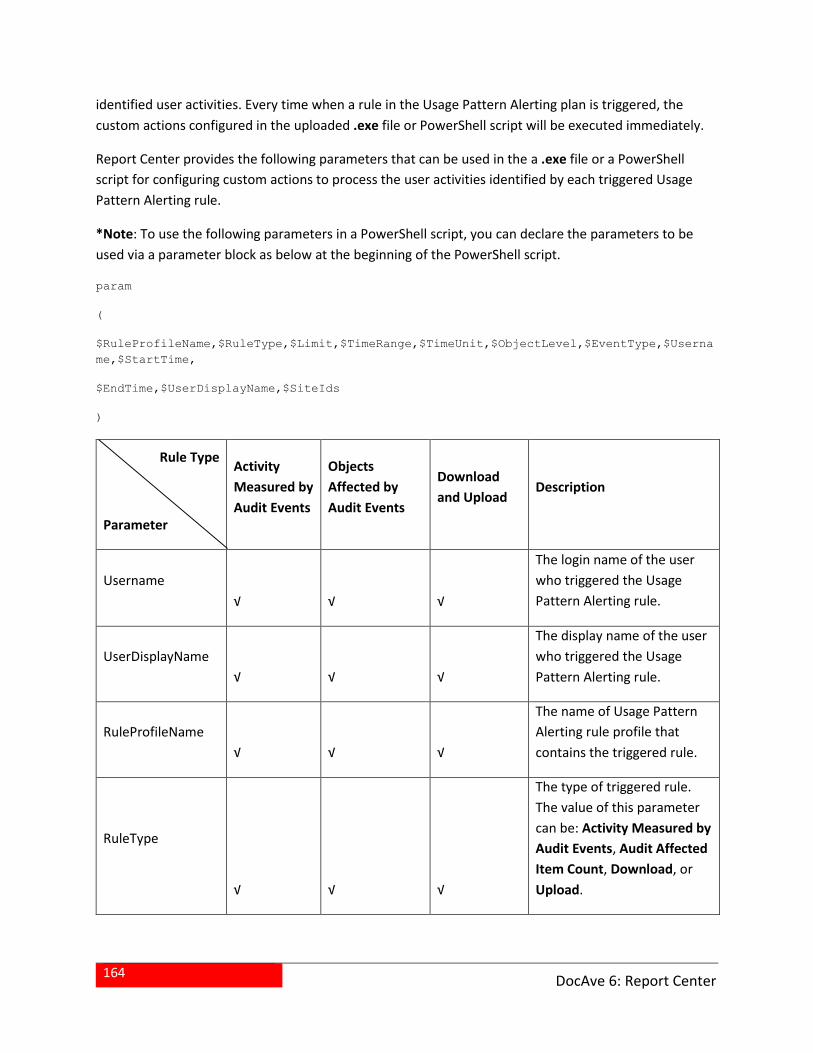
164
DocAve 6: Report Center
identified user activities. Every time when a rule in the Usage Pattern Alerting plan is triggered, the
custom actions configured in the uploaded .exe file or PowerShell script will be executed immediately.
Report Center provides the following parameters that can be used in the a .exe file or a PowerShell
script for configuring custom actions to process the user activities identified by each triggered Usage
Pattern Alerting rule.
*Note: To use the following parameters in a PowerShell script, you can declare the parameters to be
used via a parameter block as below at the beginning of the PowerShell script.
param
(
$RuleProfileName,$RuleType,$Limit,$TimeRange,$TimeUnit,$ObjectLevel,$EventType,$Userna
me,$StartTime,
$EndTime,$UserDisplayName,$SiteIds
)
Rule Type
Parameter
Activity
Measured by
Audit Events
Objects
Affected by
Audit Events
Download
and Upload Description
Username
√ √ √
The login name of the user
who triggered the Usage
Pattern Alerting rule.
UserDisplayName
√ √ √
The display name of the user
who triggered the Usage
Pattern Alerting rule.
RuleProfileName
√ √ √
The name of Usage Pattern
Alerting rule profile that
contains the triggered rule.
RuleType
√ √ √
The type of triggered rule.
The value of this parameter
can be: Activity Measured by
Audit Events, Audit Affected
Item Count, Download, or
Upload.
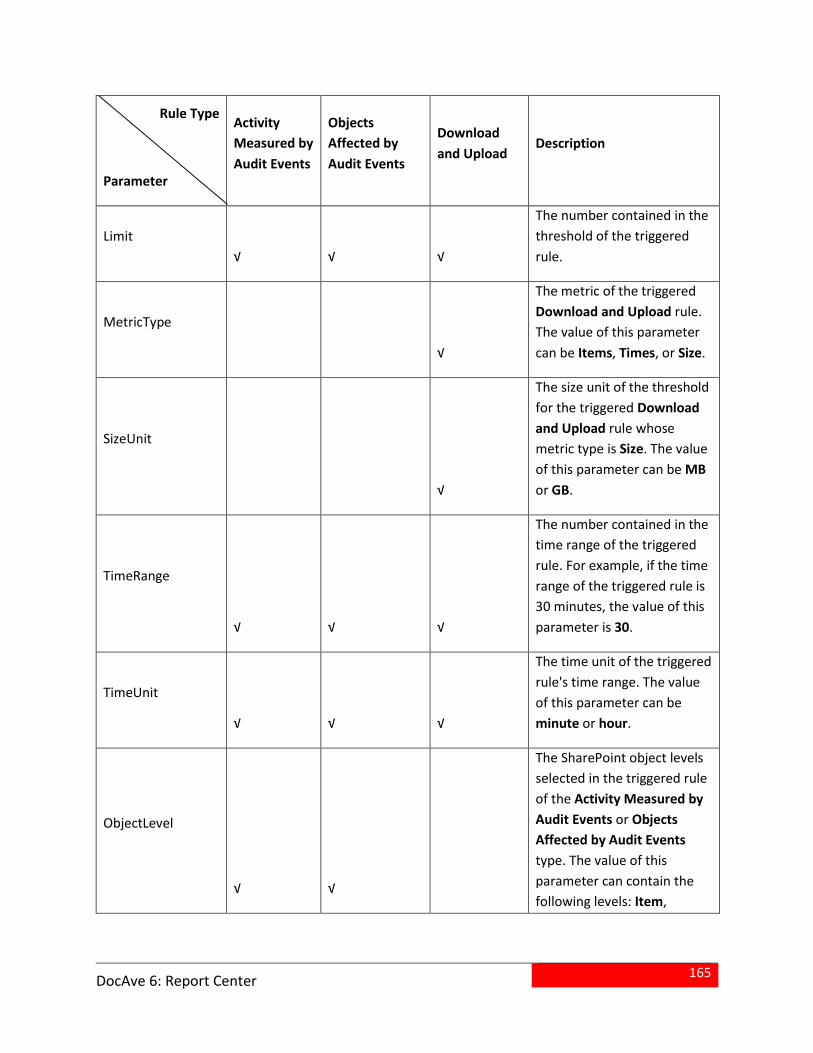
165
DocAve 6: Report Center
Rule Type
Parameter
Activity
Measured by
Audit Events
Objects
Affected by
Audit Events
Download
and Upload Description
Limit
√ √ √
The number contained in the
threshold of the triggered
rule.
MetricType
√
The metric of the triggered
Download and Upload rule.
The value of this parameter
can be Items, Times, or Size.
SizeUnit
√
The size unit of the threshold
for the triggered Download
and Upload rule whose
metric type is Size. The value
of this parameter can be MB
or GB.
TimeRange
√ √ √
The number contained in the
time range of the triggered
rule. For example, if the time
range of the triggered rule is
30 minutes, the value of this
parameter is 30.
TimeUnit
√ √ √
The time unit of the triggered
rule's time range. The value
of this parameter can be
minute or hour.
ObjectLevel
√ √
The SharePoint object levels
selected in the triggered rule
of the Activity Measured by
Audit Events or Objects
Affected by Audit Events
type. The value of this
parameter can contain the
following levels: Item,
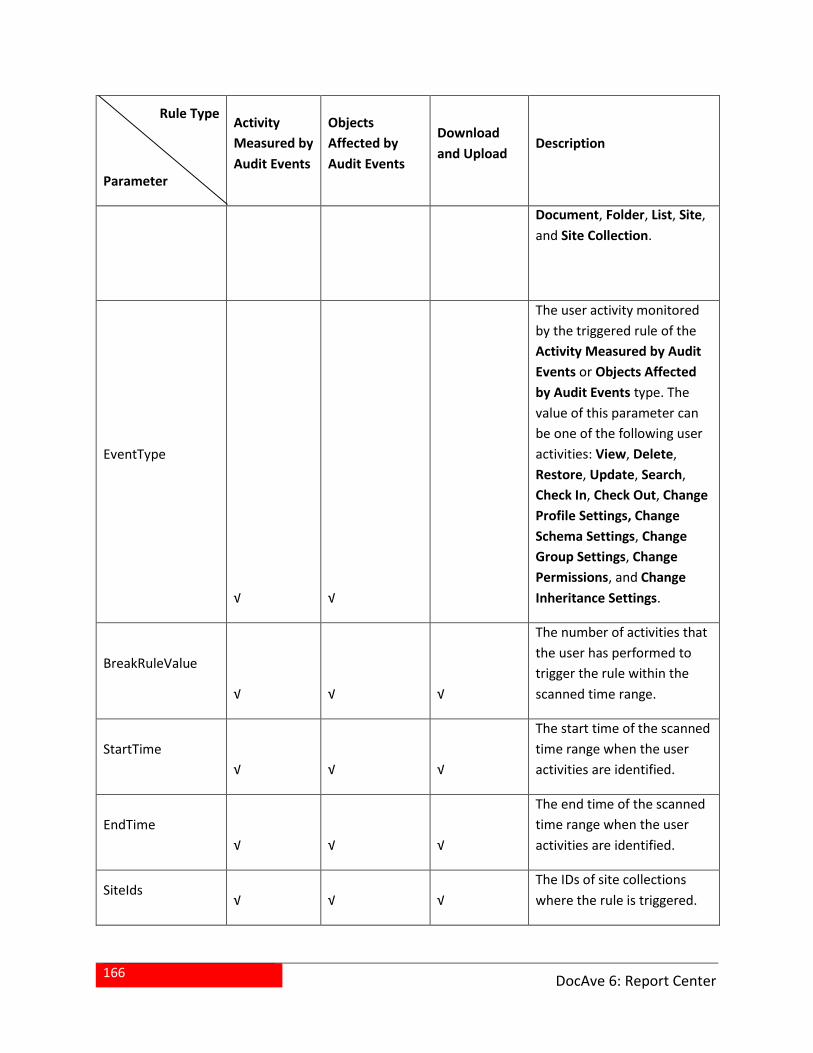
166
DocAve 6: Report Center
Rule Type
Parameter
Activity
Measured by
Audit Events
Objects
Affected by
Audit Events
Download
and Upload Description
Document, Folder, List, Site,
and Site Collection.
EventType
√ √
The user activity monitored
by the triggered rule of the
Activity Measured by Audit
Events or Objects Affected
by Audit Events type. The
value of this parameter can
be one of the following user
activities: View, Delete,
Restore, Update, Search,
Check In, Check Out, Change
Profile Settings, Change
Schema Settings, Change
Group Settings, Change
Permissions, and Change
Inheritance Settings.
BreakRuleValue
√ √ √
The number of activities that
the user has performed to
trigger the rule within the
scanned time range.
StartTime
√ √ √
The start time of the scanned
time range when the user
activities are identified.
EndTime
√ √ √
The end time of the scanned
time range when the user
activities are identified.
SiteIds √ √ √
The IDs of site collections
where the rule is triggered.
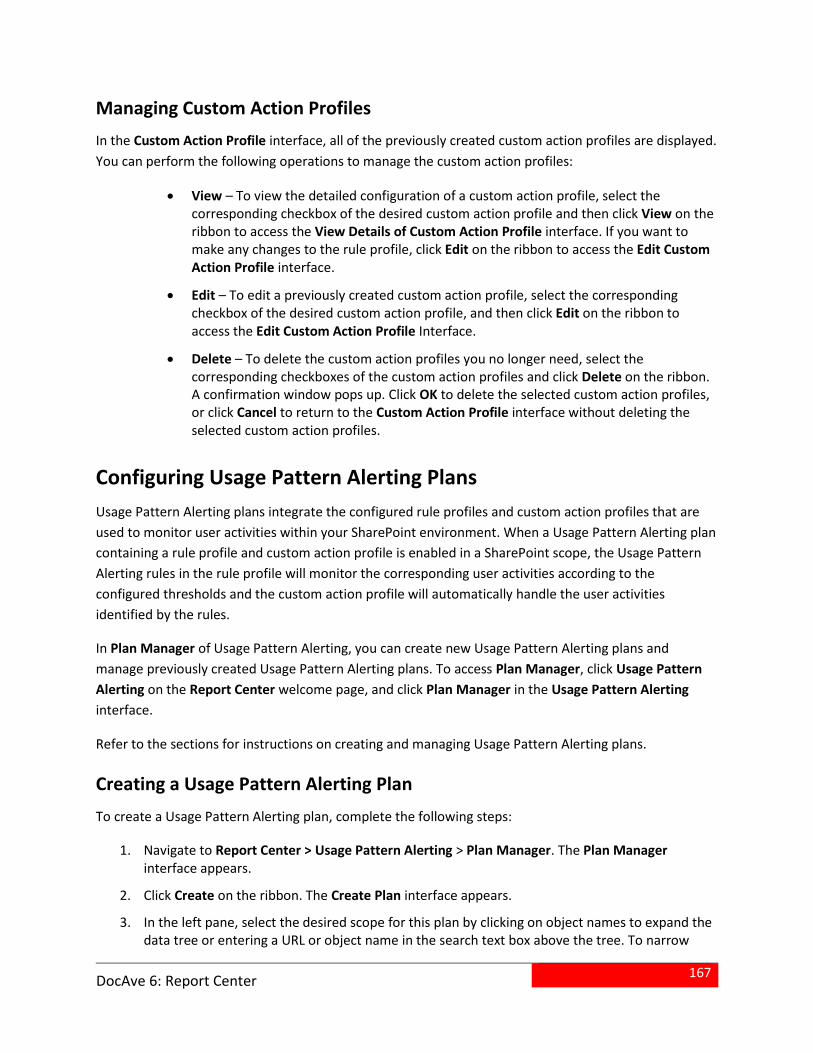
167
DocAve 6: Report Center
Managing Custom Action Profiles
In the Custom Action Profile interface, all of the previously created custom action profiles are displayed.
You can perform the following operations to manage the custom action profiles:
View – To view the detailed configuration of a custom action profile, select the corresponding checkbox of the desired custom action profile and then click View on the ribbon to access the View Details of Custom Action Profile interface. If you want to make any changes to the rule profile, click Edit on the ribbon to access the Edit Custom Action Profile interface.
Edit – To edit a previously created custom action profile, select the corresponding checkbox of the desired custom action profile, and then click Edit on the ribbon to access the Edit Custom Action Profile Interface.
Delete – To delete the custom action profiles you no longer need, select the corresponding checkboxes of the custom action profiles and click Delete on the ribbon. A confirmation window pops up. Click OK to delete the selected custom action profiles, or click Cancel to return to the Custom Action Profile interface without deleting the selected custom action profiles.
Configuring Usage Pattern Alerting Plans
Usage Pattern Alerting plans integrate the configured rule profiles and custom action profiles that are
used to monitor user activities within your SharePoint environment. When a Usage Pattern Alerting plan
containing a rule profile and custom action profile is enabled in a SharePoint scope, the Usage Pattern
Alerting rules in the rule profile will monitor the corresponding user activities according to the
configured thresholds and the custom action profile will automatically handle the user activities
identified by the rules.
In Plan Manager of Usage Pattern Alerting, you can create new Usage Pattern Alerting plans and
manage previously created Usage Pattern Alerting plans. To access Plan Manager, click Usage Pattern
Alerting on the Report Center welcome page, and click Plan Manager in the Usage Pattern Alerting
interface.
Refer to the sections for instructions on creating and managing Usage Pattern Alerting plans.
Creating a Usage Pattern Alerting Plan
To create a Usage Pattern Alerting plan, complete the following steps:
1. Navigate to Report Center > Usage Pattern Alerting > Plan Manager. The Plan Manager interface appears.
2. Click Create on the ribbon. The Create Plan interface appears.
3. In the left pane, select the desired scope for this plan by clicking on object names to expand the data tree or entering a URL or object name in the search text box above the tree. To narrow
168
DocAve 6: Report Center
down the search criteria and display fewer nodes under a particular farm/Web application level node, or a Sites node, on the tree, right-click the node and select Advanced Search to access the Advanced Search interface. For detailed instructions on using the Advanced Search feature, refer to Searching Nodes Using the Advanced Search Feature.
4. What would you like to name this plan? – Enter a name and an optional description for the plan you are about to create.
5. Would you like to filter objects within the selected scope? – To filter SharePoint objects you would like to include in this plan within the selected scope, select a scope filter from the drop-down list. To create a new scope filter, click New Scope Filter. For details on creating a scope filter, refer to Configuring a Scope Filter.
6. Whose activity would you like to monitor? – Specify the users whose activities you want to include in, or exclude from, the monitoring via this plan.
Include All Users – By default this option is selected. The activities of all users can be monitored.
Users to Include – To specify the users whose activities you want to monitor individually, select this option and enter the usernames of the desired users. Click the
check names ( ) button to check the name you entered, or click the browse ( ) button to find the users you want to include.
Users to Exclude –To specify the users whose activities you do not want to monitor individually, select this option and enter the usernames of the desired users. Click the
check names ( ) button to check the name you entered, or click the browse ( ) button to find the users you want to exclude.
Include Anonymous Users – To monitor the activities of anonymous users, select this option.
7. What rules would you like to include in this plan? – Select a rule profile for this plan. A rule profile contains the rules that you want to apply in bulk to monitor user activities within the selected scope. To create a new rule profile, click New Rule Profile. For details on creating a rule profile, refer to Creating a Rule Profile.
8. How frequently would you like to scan the selected scope based on the rules in the Rule Profile? – Select the interval for scanning user activities within the selected scope based on the rule profile selected above. There are three available scan intervals in the drop-down list: 15 Minutes, 30 Minutes, and 1 Hour.
9. Would you like to exclude objects from monitoring of the rules in this plan by URL? – To exclude some objects from the monitoring of this plan, enter the keywords contained in the relative URLs of the desired objects into the text box. To enter multiple keywords, separate them with semicolons.
10. What custom actions would you like to include in this plan? – Select a previously created custom action profile for this plan. A custom action profile contains the actions that will be taken immediately to handle the user activities that trigger the rules of this plan. To create a new custom action profile, click New Custom Action Profile. For details on creating a custom action profile, refer to Creating a Custom Action Profile.
169
DocAve 6: Report Center
11. Click Save and choose from the following two options in the drop-down list to create this plan, or click Cancel to leave this page without saving any of your changes.
Click Save to create the plan. The created plan will be displayed in the Profile Manager interface with the Disabled status. You can enable this plan in the Plan Manager interface. For details on enabling a Usage Pattern Alerting plan, refer to Managing Usage Pattern Alerting Plans.
Click Save and Enable to save and enable the plan immediately. After a Usage Pattern Alerting plan is enabled, Report Center starts monitoring the user activities within the selected scope based on the rules and settings configured in the plan.
Managing Usage Pattern Alerting Plans
In the Plan Manager interface, all of the previously created Usage Patter Alerting plans are displayed. In
the viewing pane of this interface, you can view the Plan Name, Description, Scope Filter, Rule Profile,
Custom Action Profile, Last Modified Time, and Status of each previously created Usage Pattern
Alerting plan.
*Note: Report Center only monitors user activities according to the Enabled Usage Pattern Alerting
plans.
In Profile Manager, you can perform the following operations to manage the Usage Patter Alerting
plans:
View – To view the detailed settings of a plan, select a plan, and then click View Details on the ribbon to access the View Details interface. You can click Edit Plan on the ribbon to make changes to the plan. When you are finished reviewing the plan, click Close to return to the Plan Manager interface.
Edit – To edit the settings of a plan, select the plan and then click Edit on the ribbon to access the Edit Plan page. Here you can make changes to the scope and settings of the selected plan. Then, choose from the following options:
o Click Save and then make a selection from the drop-down list:
Click Save to save the plan.
Click Save and Enable to save and enable the plan.
o Click Cancel to close the Edit Plan page without saving any changes.
Delete – To delete the plans you no longer need, select the corresponding checkboxes of the plans and click Delete on the ribbon. A confirmation window pops up. Click OK to delete the selected plans, or click Cancel to return to the Plan Manager interface without deleting the plans.
Enable – To enable a disabled plan, select the desired plan, and click Enable on the ribbon. After the selected plan is enabled, the Status of this plan becomes Enabled and Report Center starts monitoring user activities based on the settings in this plan.
170
DocAve 6: Report Center
Disable – To disable an enabled plan, select the desired plan, and click Disable on the ribbon. After the selected plan is disabled, the Status of this plan becomes Disabled and Report Center will stop monitoring user activities based on the settings in this plan.
Viewing Usage Pattern Alerting Reports
After Report Center identities user activities that trigger the thresholds of pre-defined rules according to
the settings in Usage Pattern Alerting plans, you can view the following reports on the triggered rules in
Usage Pattern Alerting Report:
Activity Report – View a report of detailed information of the activities identified by the rules in the Usage Pattern Alerting plans.
Analysis Report – View an analysis report on how many times the Usage Pattern Alerting rules were triggered and the distribution of triggered times of each rule based on the corresponding data metric used in rule threshold.
Follow the instructions below to view reports in Usage Pattern Alerting Report.
1. To access the Usage Pattern Alerting Report interface, click Usage Pattern Alerting on the Report Center welcome page, and click Usage Pattern Alerting Report in the Usage Pattern Alerting interface.
2. Click Activity Report or Analysis Report on the ribbon according to the report you want to view.
If you select Activity Report, the viewing pane of the report displays the records of the triggered rules that were scanned within the current month, including the rule profile that contains the triggered rule, type and detailed configuration information of the triggered rule, the user who triggered the rule, the scanned time of the triggered rule, and detailed information on the user activities that triggered the rule.
You can perform the following operations in the Activity Report:
o Set Filter – To limit or expand the records of the activities that triggered Usage Pattern Alerting rules displayed in the viewing pane, use Set Filter.
o Export Details – By clicking the Export Details link in the Action column of a record, the Export to Datasheet window appears. You can export the detailed information of all user activities that triggered this rule associated with this record to a datasheet. For detailed instructions in the operations in the Export to Datasheet window, see Exporting to a Datasheet.
If you select Analysis Report, the viewing pane of the report displays the records of the rules that were triggered within the current month in the Triggered Times of Rules pane, including the rule profile that contains the triggered rule, type and detailed configuration information of the triggered rule, and the number of times that the rule was triggered during the current month.
171
DocAve 6: Report Center
You can perform the following operations in the Analysis Report:
o Set Filter - To limit or expand the records of triggered rules displayed in the viewing pane, use Set Filter.
o Distribution of Triggered Times - Select a rule’s record in the Triggered Times of Rules pane, the Distribution of Triggered Times pane will display a column chart for the distribution of triggered times of the selected rule, with X-axis displaying the values of actual activities that triggered the rule and Y-axis displaying the numbers of the times that the rules were triggered.
o Trigger Times – Click the link in the Trigger Times column of a rule in the Triggered Times of Rules pane, the Activity Report page for the corresponding rule appears, displaying detailed information of each activity that triggered the rule the time range selected in Set Filter.
3. You can perform the following operations in the Usage Pattern Alerting Report interface:
Set Filter – Configure the settings in the Set Filter area to limit or expand the records of user activities that triggered rules displayed in the Activity Report or trigged rules displayed in the Analysis Report. The default filter rule includes all of the user activities/triggered rules that were recorded within the current month. For detailed instructions on using Set Filter, see Setting Filter for Usage Pattern Alerting Report.
Export Now – To export the Activity Report or Analysis Report to a datasheet, complete the following steps:
i. Click Export Now > Export to Datasheet on the ribbon. The Export Datasheet
window appears.
ii. Configure the following settings:
Report Format – Select the desired report format from the drop-down menu.
Triggered Rule Profiles – Filter the records related to the triggered rules by selecting rule profiles that contain the triggered rules from drop-down list.
Triggered Rule Types – Filter the records related to the triggered rules by selecting rule types from the drop-down list.
Date/Time Range – Filter the records related to the triggered rules by selecting the scanned date/time range that the rules were triggered in the Scanned within field.
Export Settings – Choose whether to export the report now. Check the Export to local immediately checkbox and click OK to export the report immediately, or check the Export to a different location checkbox, and then configure the following settings:
Export Location – Select one previously configured export location from the drop-down menu, or if you want to configure a new export location, click New Export Location, then follow
172
DocAve 6: Report Center
the instructions provided in the Export Location section of this guide.
Notification – Check the Send Notification checkbox and select the Recipient of this notification. You can select a previously configured e-mail notification profile and click View to access detailed information, or click New E-mail Notification to create a new e-mail notification profile. For details on creating an e-mail notification profile, see the User Notification Settings section in the DocAve 6 Control Panel Reference Guide. You can choose to have the report included in the e-mail as an attachment by checking the Attach report to the e-mail when the size of the report is less than … checkbox, and then enter the maximum size of the report allowed in the less than __ MB text box.
iii. Click OK to save the configurations and to export the report. Click Cancel to go
back to the Usage Pattern Alerting interface without exporting the report.
Setting Filter for Usage Pattern Alerting Report
To set the filter criteria to extend or limit the records associated with the triggered rules displayed in the
Activity Report or Analysis Report within the Usage Pattern Alerting Report interface via the Set Filter
feature, complete the following steps:
1. Click Set Filter above the viewing pane to access the Set Filter window.
2. Filter by Rule Profile – Filter the records by rule profile names or rule types.
Triggered Rule Profiles – Filter the records of triggered rules by rule profiles. Select the rule profiles whose triggered rules you want view from the drop-down list, or select All Rule Profiles to view the records of triggered rules of all rule profiles.
Triggered Rule Types – Filter the records of triggered rules by rule types. Select the types of which the trigged rules you want to view from the drop-down list, or select All Types to view the records of triggered rules of all types.
3. Filter by Time Range – Filter the records by the scanned time of the triggered rule. Specify a time range for the scanned time using either of the following methods:
Scanned within – Expand the Scanned within drop-down list, and select a time range from the following options: This Month, Last Month, Last 2 Months, This Week, Last Week, Last 2 Weeks, Today, and Yesterday.
Customize Time Range – To customize a time range, expand the Scanned within drop-down list, select Customize Time Range, and then select a time range using the calendar below.
4. Click Filter to apply the configured filter criteria. All records that meet the criteria are listed in the viewing pane. To reset all filter criteria, click Reset .To return to the viewing pane without applying the filter criteria, click Cancel.
173
DocAve 6: Report Center
DocAve Report Center Features in SharePoint
By deploying solutions on SharePoint farms, Report Center adds the Document Auditing and Usage
Activity Web Parts site collection features in SharePoint. The section bellow offer details instructions on
deploying and using these two features.
Document Auditing Feature
Report Center provides users a solution named SP2010DocumentAuditing.wsp for SharePoint 2010,
SP2013DocumentAuditing.wsp for SharePoint 2013, and SP2016DocumentAuditing.wsp for SharePoint
2016 to view the audit history of all documents within the specific site collection in SharePoint.
Deploying Document Auditing Solution
To use the Document Auditing feature in DocAve, you must first deploy the
SP2010DocumentAuditing.wsp, SP2013DocumentAuditing.wsp, and SP2016DocumentAuditing.wsp
solution to your SharePoint farm. Once you have installed and deployed the solution, the Document
Auditing Settings will be listed in the Site Collection Administration List.
*Note: To deploy this solution, each Web front-end server must have DocAve Agent installed.
To deploy the Document Auditing Solution to your SharePoint 2010 farm, complete the following steps:
1. Navigate to: DocAve > Control Panel > Solution Manager.
2. Select the target farm from the Farm drop-down list.
3. Check the SP2010DocumentAuditing.wsp checkbox. Click Install in the Actions group on the ribbon. Once the solution is installed on the SharePoint farm, the following message will appear in the Message column: Installed the solution successfully.
4. Check the SP2010DocumentAuditing.wsp checkbox again, and click Deploy in the Actions group on the ribbon. After the solution is deployed successfully, the status of the solution is shown as Deployed in the Status column.
Follow the same steps to deploy the SP2013DocumentAuditing.wsp solution to your SharePoint 2013
farm and deploy the SP2016DocumentAuditing.wsp solution to your SharePoint 2016 farm as
SP2010DocumentAuditing.wsp.
*Note: If you want to use the Document Auditing feature in a SharePoint 2010 experience version site
collection in a SharePoint 2013 farm, you must deploy both the SP2010DocumentAuditing.wsp solution
and the SP2013DocumentAuditing.wsp solution to your SharePoint 2013 farm.
Refer to the Solution Manager section of the DocAve 6 Control Panel Reference Guide for more
instructions on operating the solutions.
Proceed to the next section for information on activating the Document Auditing feature.
174
DocAve 6: Report Center
Activating Document Auditing Feature
Once the solution is deployed, the Document Auditing feature can be activated in SharePoint site
collections or through the Manage Feature settings in DocAve Report Center. To activate the Document
Auditing feature through DocAve, refer to Managing the Document Auditing Feature.
To activate the Document Auditing Feature in a SharePoint site collection, complete the following steps:
1. In SharePoint, access the site collection for which you want to activate Document Auditing feature. In SharePoint 2010, navigate to: Site Actions > Site Settings > Site Collection features.
In SharePoint 2013 and SharePoint 2016, navigate to: Settings icon ( ) > Site Settings > Site Collection features.
2. Click Activate next to the AvePoint Document Auditing feature to enable the feature for the selected site collection.
3. After activating the Document Auditing feature, the status of the feature reads Active in the Status column.
*Note: If you have configured the Advanced Settings on the Farm level in the Manage Feature function
of DocAve, you must enter the activation password in the text box to activate the Document Auditing
feature.
Document Auditing Settings
To configure the Document Auditing Settings to specify how to display the auditing data for the
documents, complete the following steps:
1. In the SharePoint site collection where you have activated the feature for SharePoint 2010, navigate to: Site Actions > Site Settings > Site Collection Administration > Document Auditing
Settings. For SharePoint 2013 and SharePoint 2016, navigate to Settings icon ( ) > Site settings > Site Collection Administration > Document Auditing Settings.
2. Configure the following settings on the Document Auditing Settings page:
Time Range – Display the data for a specified length of time. Select from the options of This Month, Last Month, Last 2 Months, This Week, Last Week, Last 2 Weeks, Today, and Yesterday.
Report Settings – Set the number of the report records. The default number is 100; you can customize the number as you want, but the number of the report count must be a positive integer between 0 and 1000.
User Filter – Set the users whose activities you want to view or do not want to view:
o Include All Users – By default this option is selected. The activities of all users can be viewed.
o Users to Include – Enter the users whose activity you want to view. You can click the check names button ( ) to check the name you entered or click the browse
button ( ) to find the users you want to include.
175
DocAve 6: Report Center
o Users to Exclude – Enter the users whose activity you do not wish to view. You can click the check names button ( ) to check the name you entered or click
the browse button ( ) to find the users you want to exclude.
Action Filter – Check the Exclude view event checkbox to exclude the auditing data of View action.
3. Click OK to save the Document Audit Settings, or click Cancel to go back without saving any changes.
Viewing Audit History
To view the document audit history, complete the following steps:
1. Select the document with the audit history you want to view in the site collection where you have activated the Document Auditing feature, and click the downward arrow to open the drop-down menu.
2. Click View Audit History. The AvePoint Document Auditing Feature page appears. It displays the document information and the auditing data according to the settings you have configured to the site collection where this document resides.
3. Click Generate Excel Workbook if you want to export the XLSX format report.
Usage Activity Web Parts Feature
Report Center provides a solution named SP2016UsageActivityWebParts.wsp for SharePoint 2016,
SP2013UsageActivityWebParts.wsp for SharePoint 2013, and SP2010UsageActivityWebParts.wsp for
SharePoint 2010 to add Usage Activity Web Parts in SharePoint sites. These Web parts display the
reports on social activities and contents and SharePoint usage and behavior across a configurable scope.
The Usage Activity Web Parts contains six social Web parts (Most Active Contributors, Most Popular
Contributors, Top Documents, Top Blog Posts, Top Discussions, and Top Wiki Pages) and a dashboard
Web part Report Center Dashboard (including ten reports: Summary, Active Users, Checked-Out
Documents, Activity Ranking, Last Accessed Time, Site Traffic, Search Usage, Site Visitors, Top
Documents by Social Activity, and Content Type Usage).
*Note: The Most Popular Contributors Web Part does not support SharePoint 2010.
Deploying Usage Activity Solution
To use the Usage Activity Web Part feature in SharePoint, you must first deploy the
SP2016UsageActivityWebParts.wsp to your SharePoint 2016 farm, SP2013UsageActivityWebParts.wsp
to your SharePoint 2013 farm, or SP2010UsageActivityWebParts.wsp to your SharePoint 2010 farm.
Once you have installed and deployed the solution, the AvePoint Usage Activity Web Parts feature will
be listed in the Site Collection Features List. The AvePoint Usage Activity Web Parts feature works to
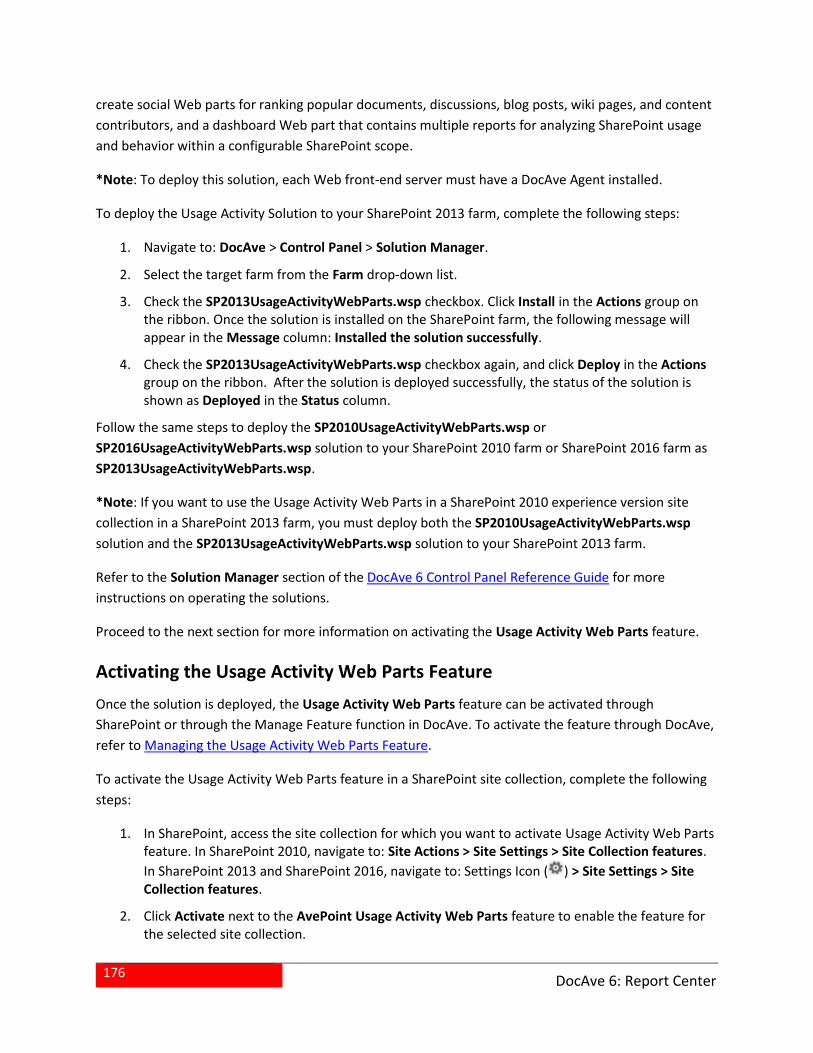
176
DocAve 6: Report Center
create social Web parts for ranking popular documents, discussions, blog posts, wiki pages, and content
contributors, and a dashboard Web part that contains multiple reports for analyzing SharePoint usage
and behavior within a configurable SharePoint scope.
*Note: To deploy this solution, each Web front-end server must have a DocAve Agent installed.
To deploy the Usage Activity Solution to your SharePoint 2013 farm, complete the following steps:
1. Navigate to: DocAve > Control Panel > Solution Manager.
2. Select the target farm from the Farm drop-down list.
3. Check the SP2013UsageActivityWebParts.wsp checkbox. Click Install in the Actions group on the ribbon. Once the solution is installed on the SharePoint farm, the following message will appear in the Message column: Installed the solution successfully.
4. Check the SP2013UsageActivityWebParts.wsp checkbox again, and click Deploy in the Actions group on the ribbon. After the solution is deployed successfully, the status of the solution is shown as Deployed in the Status column.
Follow the same steps to deploy the SP2010UsageActivityWebParts.wsp or
SP2016UsageActivityWebParts.wsp solution to your SharePoint 2010 farm or SharePoint 2016 farm as
SP2013UsageActivityWebParts.wsp.
*Note: If you want to use the Usage Activity Web Parts in a SharePoint 2010 experience version site
collection in a SharePoint 2013 farm, you must deploy both the SP2010UsageActivityWebParts.wsp
solution and the SP2013UsageActivityWebParts.wsp solution to your SharePoint 2013 farm.
Refer to the Solution Manager section of the DocAve 6 Control Panel Reference Guide for more
instructions on operating the solutions.
Proceed to the next section for more information on activating the Usage Activity Web Parts feature.
Activating the Usage Activity Web Parts Feature
Once the solution is deployed, the Usage Activity Web Parts feature can be activated through
SharePoint or through the Manage Feature function in DocAve. To activate the feature through DocAve,
refer to Managing the Usage Activity Web Parts Feature.
To activate the Usage Activity Web Parts feature in a SharePoint site collection, complete the following
steps:
1. In SharePoint, access the site collection for which you want to activate Usage Activity Web Parts feature. In SharePoint 2010, navigate to: Site Actions > Site Settings > Site Collection features.
In SharePoint 2013 and SharePoint 2016, navigate to: Settings Icon ( ) > Site Settings > Site Collection features.
2. Click Activate next to the AvePoint Usage Activity Web Parts feature to enable the feature for the selected site collection.
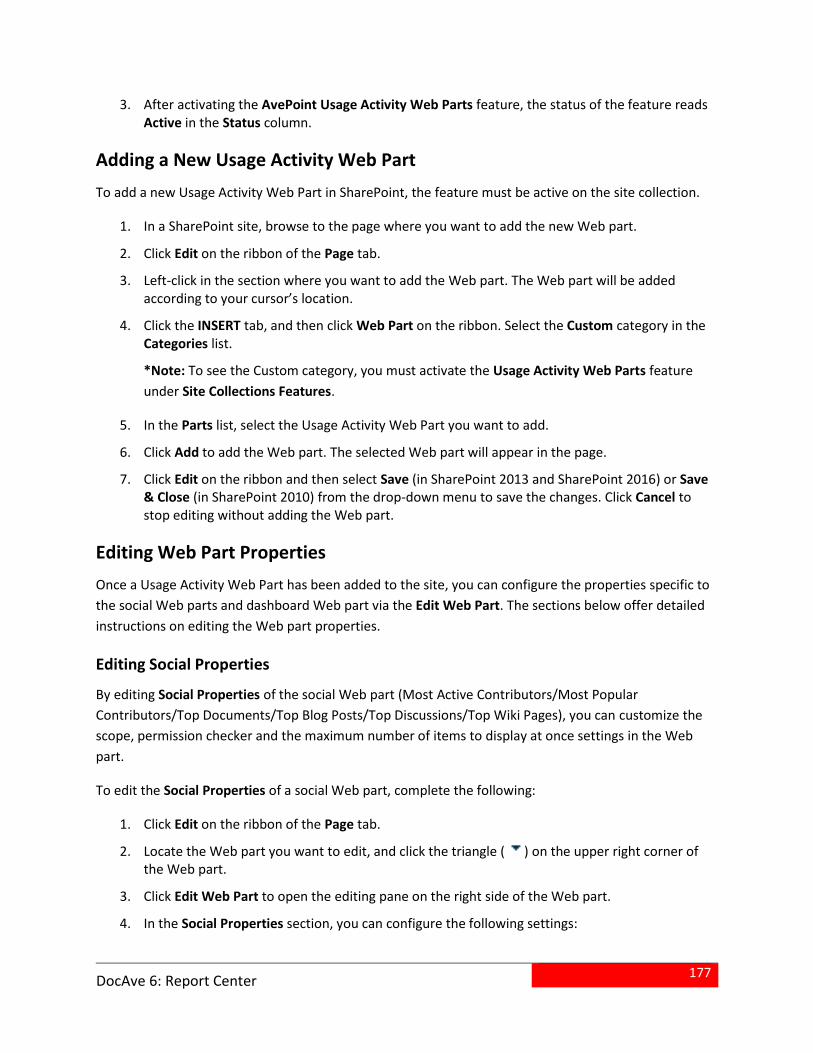
177
DocAve 6: Report Center
3. After activating the AvePoint Usage Activity Web Parts feature, the status of the feature reads Active in the Status column.
Adding a New Usage Activity Web Part
To add a new Usage Activity Web Part in SharePoint, the feature must be active on the site collection.
1. In a SharePoint site, browse to the page where you want to add the new Web part.
2. Click Edit on the ribbon of the Page tab.
3. Left-click in the section where you want to add the Web part. The Web part will be added according to your cursor’s location.
4. Click the INSERT tab, and then click Web Part on the ribbon. Select the Custom category in the Categories list.
*Note: To see the Custom category, you must activate the Usage Activity Web Parts feature
under Site Collections Features.
5. In the Parts list, select the Usage Activity Web Part you want to add.
6. Click Add to add the Web part. The selected Web part will appear in the page.
7. Click Edit on the ribbon and then select Save (in SharePoint 2013 and SharePoint 2016) or Save & Close (in SharePoint 2010) from the drop-down menu to save the changes. Click Cancel to stop editing without adding the Web part.
Editing Web Part Properties
Once a Usage Activity Web Part has been added to the site, you can configure the properties specific to
the social Web parts and dashboard Web part via the Edit Web Part. The sections below offer detailed
instructions on editing the Web part properties.
Editing Social Properties
By editing Social Properties of the social Web part (Most Active Contributors/Most Popular
Contributors/Top Documents/Top Blog Posts/Top Discussions/Top Wiki Pages), you can customize the
scope, permission checker and the maximum number of items to display at once settings in the Web
part.
To edit the Social Properties of a social Web part, complete the following:
1. Click Edit on the ribbon of the Page tab.
2. Locate the Web part you want to edit, and click the triangle ( ) on the upper right corner of the Web part.
3. Click Edit Web Part to open the editing pane on the right side of the Web part.
4. In the Social Properties section, you can configure the following settings:
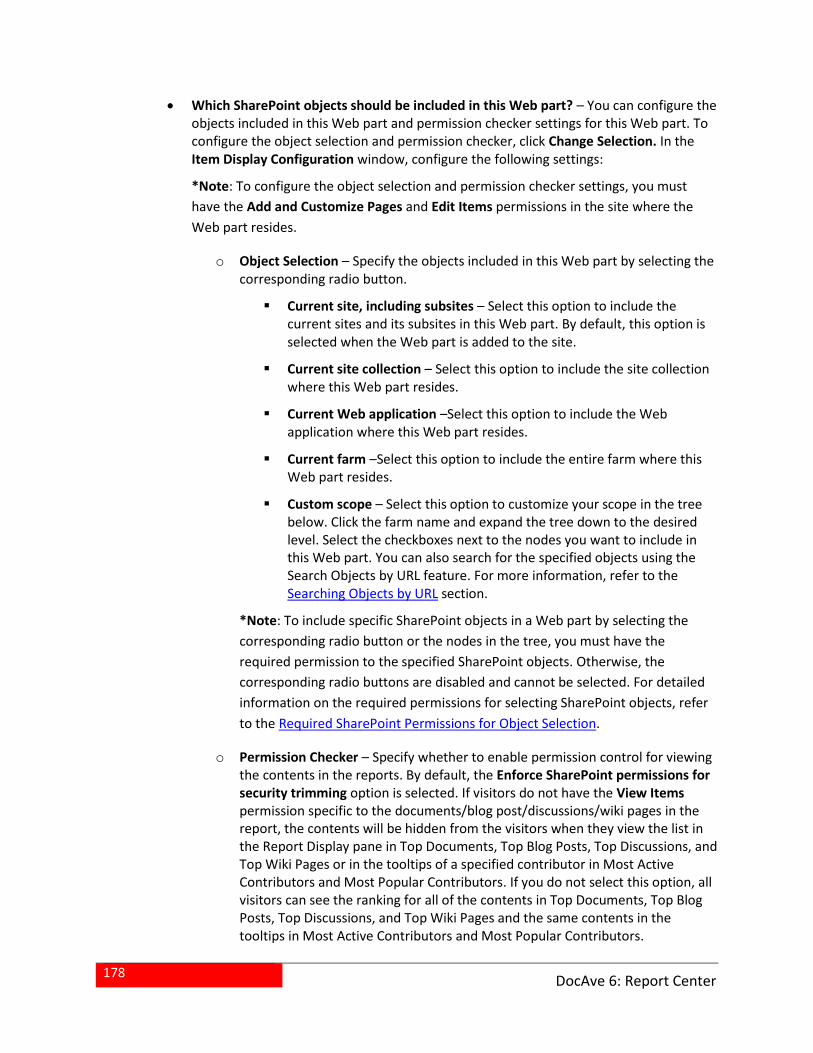
178
DocAve 6: Report Center
Which SharePoint objects should be included in this Web part? – You can configure the objects included in this Web part and permission checker settings for this Web part. To configure the object selection and permission checker, click Change Selection. In the Item Display Configuration window, configure the following settings:
*Note: To configure the object selection and permission checker settings, you must
have the Add and Customize Pages and Edit Items permissions in the site where the
Web part resides.
o Object Selection – Specify the objects included in this Web part by selecting the corresponding radio button.
Current site, including subsites – Select this option to include the current sites and its subsites in this Web part. By default, this option is selected when the Web part is added to the site.
Current site collection – Select this option to include the site collection where this Web part resides.
Current Web application –Select this option to include the Web application where this Web part resides.
Current farm –Select this option to include the entire farm where this Web part resides.
Custom scope – Select this option to customize your scope in the tree below. Click the farm name and expand the tree down to the desired level. Select the checkboxes next to the nodes you want to include in this Web part. You can also search for the specified objects using the Search Objects by URL feature. For more information, refer to the Searching Objects by URL section.
*Note: To include specific SharePoint objects in a Web part by selecting the
corresponding radio button or the nodes in the tree, you must have the
required permission to the specified SharePoint objects. Otherwise, the
corresponding radio buttons are disabled and cannot be selected. For detailed
information on the required permissions for selecting SharePoint objects, refer
to the Required SharePoint Permissions for Object Selection.
o Permission Checker – Specify whether to enable permission control for viewing the contents in the reports. By default, the Enforce SharePoint permissions for security trimming option is selected. If visitors do not have the View Items permission specific to the documents/blog post/discussions/wiki pages in the report, the contents will be hidden from the visitors when they view the list in the Report Display pane in Top Documents, Top Blog Posts, Top Discussions, and Top Wiki Pages or in the tooltips of a specified contributor in Most Active Contributors and Most Popular Contributors. If you do not select this option, all visitors can see the ranking for all of the contents in Top Documents, Top Blog Posts, Top Discussions, and Top Wiki Pages and the same contents in the tooltips in Most Active Contributors and Most Popular Contributors.
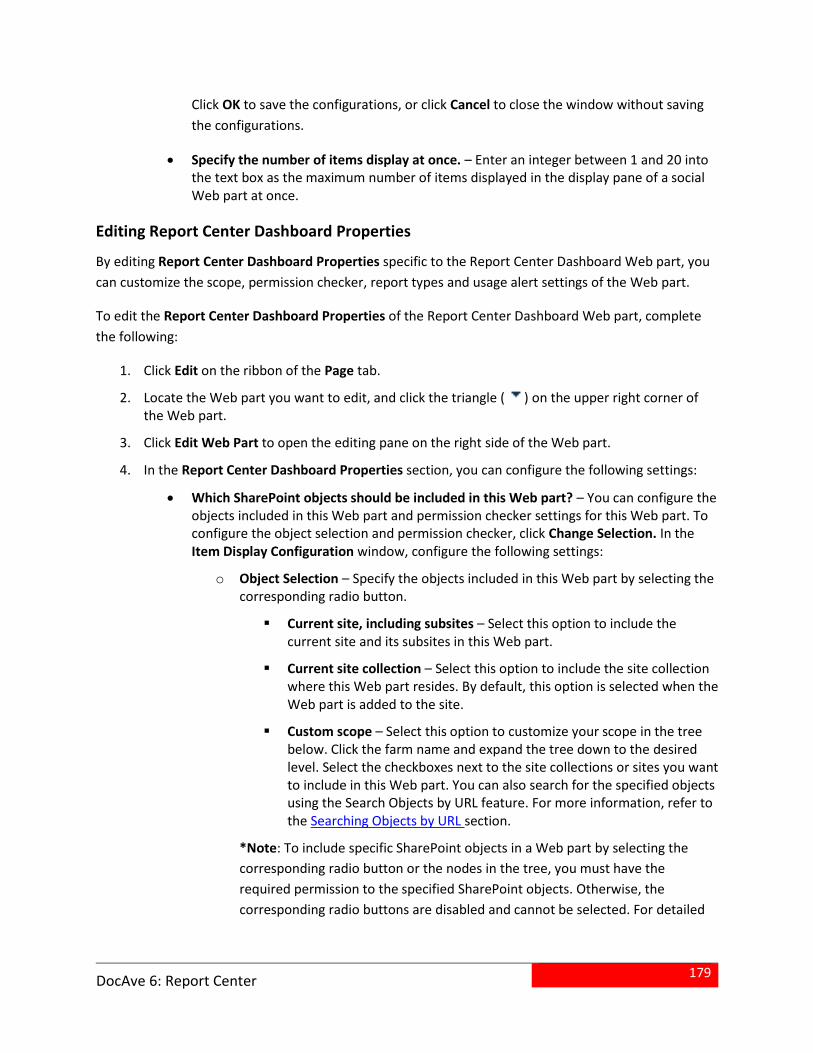
179
DocAve 6: Report Center
Click OK to save the configurations, or click Cancel to close the window without saving
the configurations.
Specify the number of items display at once. – Enter an integer between 1 and 20 into the text box as the maximum number of items displayed in the display pane of a social Web part at once.
Editing Report Center Dashboard Properties
By editing Report Center Dashboard Properties specific to the Report Center Dashboard Web part, you
can customize the scope, permission checker, report types and usage alert settings of the Web part.
To edit the Report Center Dashboard Properties of the Report Center Dashboard Web part, complete
the following:
1. Click Edit on the ribbon of the Page tab.
2. Locate the Web part you want to edit, and click the triangle ( ) on the upper right corner of the Web part.
3. Click Edit Web Part to open the editing pane on the right side of the Web part.
4. In the Report Center Dashboard Properties section, you can configure the following settings:
Which SharePoint objects should be included in this Web part? – You can configure the objects included in this Web part and permission checker settings for this Web part. To configure the object selection and permission checker, click Change Selection. In the Item Display Configuration window, configure the following settings:
o Object Selection – Specify the objects included in this Web part by selecting the corresponding radio button.
Current site, including subsites – Select this option to include the current site and its subsites in this Web part.
Current site collection – Select this option to include the site collection where this Web part resides. By default, this option is selected when the Web part is added to the site.
Custom scope – Select this option to customize your scope in the tree below. Click the farm name and expand the tree down to the desired level. Select the checkboxes next to the site collections or sites you want to include in this Web part. You can also search for the specified objects using the Search Objects by URL feature. For more information, refer to the Searching Objects by URL section.
*Note: To include specific SharePoint objects in a Web part by selecting the
corresponding radio button or the nodes in the tree, you must have the
required permission to the specified SharePoint objects. Otherwise, the
corresponding radio buttons are disabled and cannot be selected. For detailed
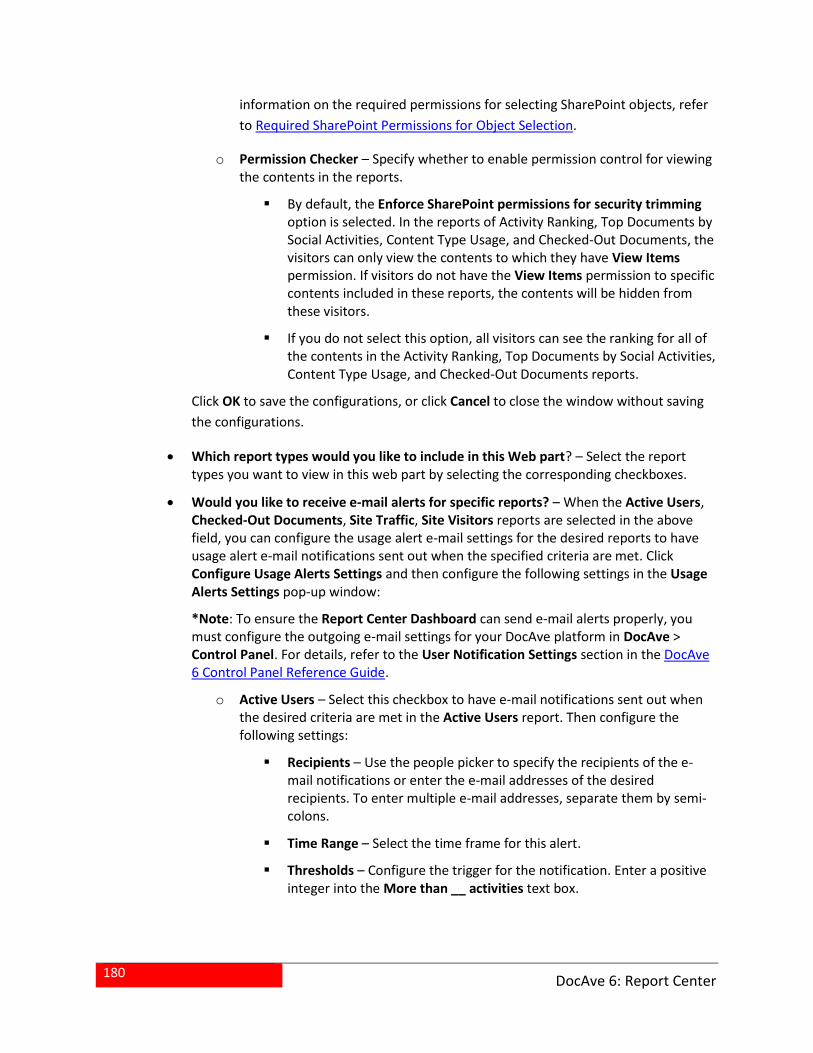
180
DocAve 6: Report Center
information on the required permissions for selecting SharePoint objects, refer
to Required SharePoint Permissions for Object Selection.
o Permission Checker – Specify whether to enable permission control for viewing the contents in the reports.
By default, the Enforce SharePoint permissions for security trimming option is selected. In the reports of Activity Ranking, Top Documents by Social Activities, Content Type Usage, and Checked-Out Documents, the visitors can only view the contents to which they have View Items permission. If visitors do not have the View Items permission to specific contents included in these reports, the contents will be hidden from these visitors.
If you do not select this option, all visitors can see the ranking for all of the contents in the Activity Ranking, Top Documents by Social Activities, Content Type Usage, and Checked-Out Documents reports.
Click OK to save the configurations, or click Cancel to close the window without saving
the configurations.
Which report types would you like to include in this Web part? – Select the report types you want to view in this web part by selecting the corresponding checkboxes.
Would you like to receive e-mail alerts for specific reports? – When the Active Users, Checked-Out Documents, Site Traffic, Site Visitors reports are selected in the above field, you can configure the usage alert e-mail settings for the desired reports to have usage alert e-mail notifications sent out when the specified criteria are met. Click Configure Usage Alerts Settings and then configure the following settings in the Usage Alerts Settings pop-up window:
*Note: To ensure the Report Center Dashboard can send e-mail alerts properly, you must configure the outgoing e-mail settings for your DocAve platform in DocAve > Control Panel. For details, refer to the User Notification Settings section in the DocAve 6 Control Panel Reference Guide.
o Active Users – Select this checkbox to have e-mail notifications sent out when the desired criteria are met in the Active Users report. Then configure the following settings:
Recipients – Use the people picker to specify the recipients of the e-mail notifications or enter the e-mail addresses of the desired recipients. To enter multiple e-mail addresses, separate them by semi-colons.
Time Range – Select the time frame for this alert.
Thresholds – Configure the trigger for the notification. Enter a positive integer into the More than __ activities text box.
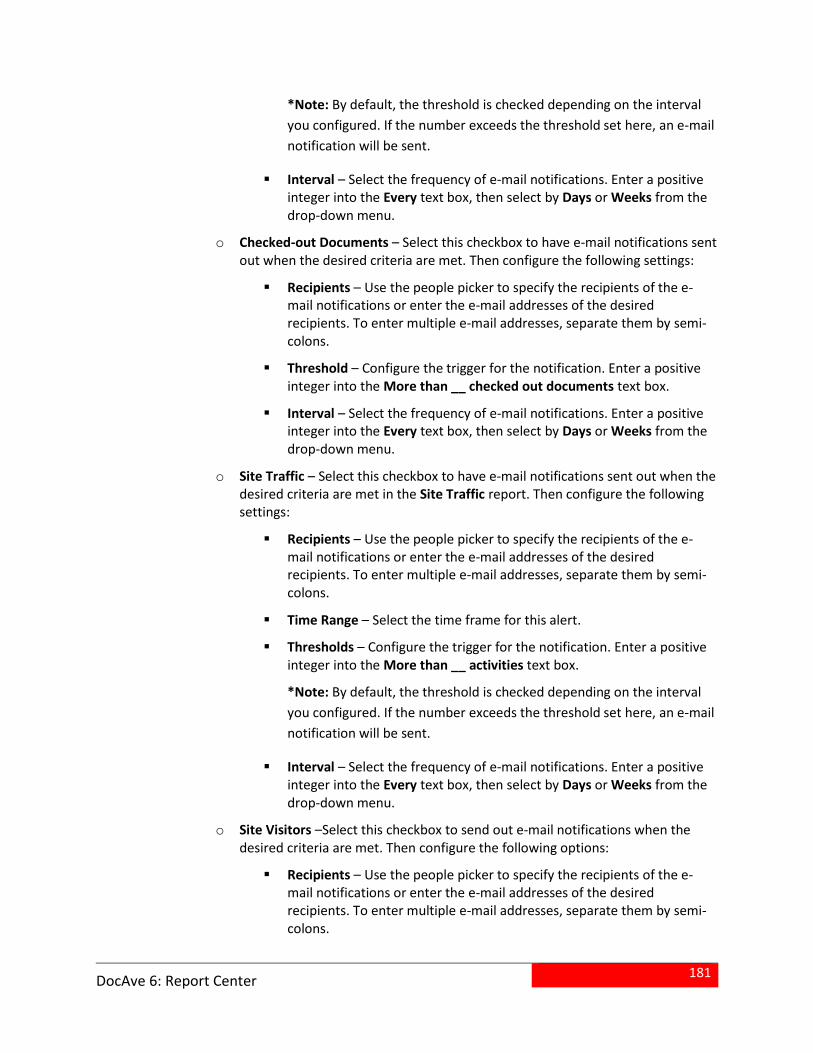
181
DocAve 6: Report Center
*Note: By default, the threshold is checked depending on the interval
you configured. If the number exceeds the threshold set here, an e-mail
notification will be sent.
Interval – Select the frequency of e-mail notifications. Enter a positive integer into the Every text box, then select by Days or Weeks from the drop-down menu.
o Checked-out Documents – Select this checkbox to have e-mail notifications sent out when the desired criteria are met. Then configure the following settings:
Recipients – Use the people picker to specify the recipients of the e-mail notifications or enter the e-mail addresses of the desired recipients. To enter multiple e-mail addresses, separate them by semi-colons.
Threshold – Configure the trigger for the notification. Enter a positive integer into the More than __ checked out documents text box.
Interval – Select the frequency of e-mail notifications. Enter a positive integer into the Every text box, then select by Days or Weeks from the drop-down menu.
o Site Traffic – Select this checkbox to have e-mail notifications sent out when the desired criteria are met in the Site Traffic report. Then configure the following settings:
Recipients – Use the people picker to specify the recipients of the e-mail notifications or enter the e-mail addresses of the desired recipients. To enter multiple e-mail addresses, separate them by semi-colons.
Time Range – Select the time frame for this alert.
Thresholds – Configure the trigger for the notification. Enter a positive integer into the More than __ activities text box.
*Note: By default, the threshold is checked depending on the interval
you configured. If the number exceeds the threshold set here, an e-mail
notification will be sent.
Interval – Select the frequency of e-mail notifications. Enter a positive integer into the Every text box, then select by Days or Weeks from the drop-down menu.
o Site Visitors –Select this checkbox to send out e-mail notifications when the desired criteria are met. Then configure the following options:
Recipients – Use the people picker to specify the recipients of the e-mail notifications or enter the e-mail addresses of the desired recipients. To enter multiple e-mail addresses, separate them by semi-colons.
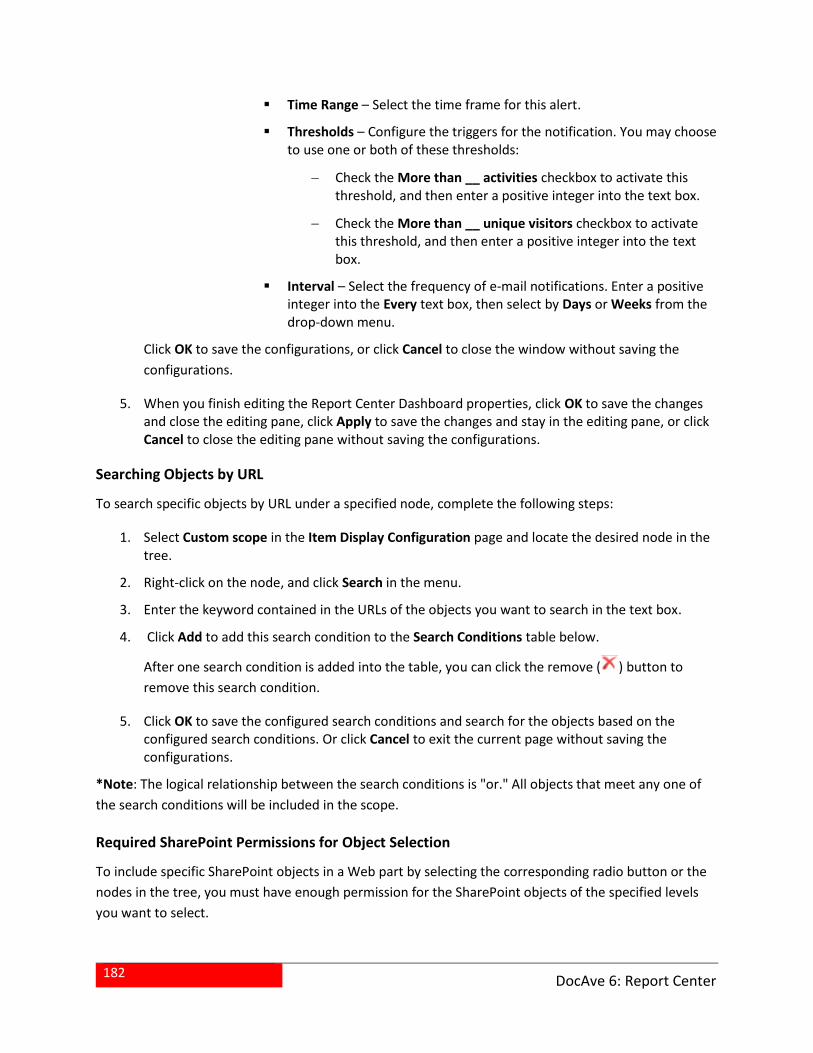
182
DocAve 6: Report Center
Time Range – Select the time frame for this alert.
Thresholds – Configure the triggers for the notification. You may choose to use one or both of these thresholds:
Check the More than __ activities checkbox to activate this threshold, and then enter a positive integer into the text box.
Check the More than __ unique visitors checkbox to activate this threshold, and then enter a positive integer into the text box.
Interval – Select the frequency of e-mail notifications. Enter a positive integer into the Every text box, then select by Days or Weeks from the drop-down menu.
Click OK to save the configurations, or click Cancel to close the window without saving the
configurations.
5. When you finish editing the Report Center Dashboard properties, click OK to save the changes and close the editing pane, click Apply to save the changes and stay in the editing pane, or click Cancel to close the editing pane without saving the configurations.
Searching Objects by URL
To search specific objects by URL under a specified node, complete the following steps:
1. Select Custom scope in the Item Display Configuration page and locate the desired node in the tree.
2. Right-click on the node, and click Search in the menu.
3. Enter the keyword contained in the URLs of the objects you want to search in the text box.
4. Click Add to add this search condition to the Search Conditions table below.
After one search condition is added into the table, you can click the remove ( ) button to
remove this search condition.
5. Click OK to save the configured search conditions and search for the objects based on the configured search conditions. Or click Cancel to exit the current page without saving the configurations.
*Note: The logical relationship between the search conditions is "or." All objects that meet any one of
the search conditions will be included in the scope.
Required SharePoint Permissions for Object Selection
To include specific SharePoint objects in a Web part by selecting the corresponding radio button or the
nodes in the tree, you must have enough permission for the SharePoint objects of the specified levels
you want to select.
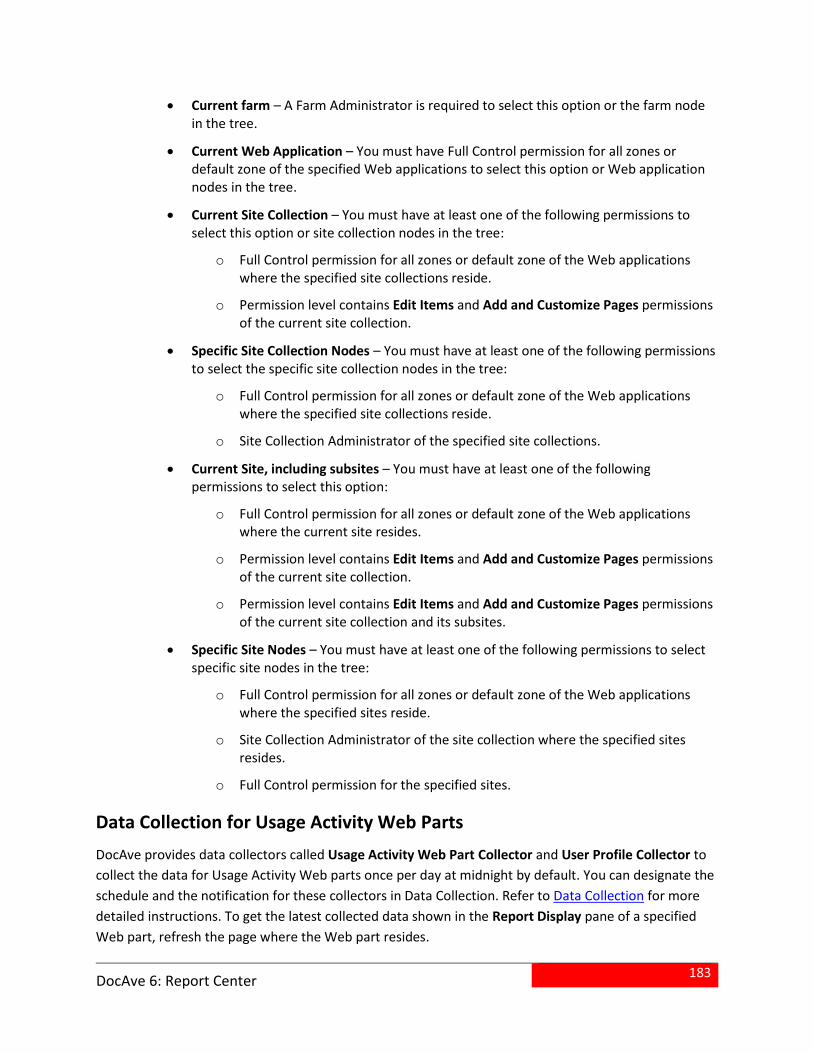
183
DocAve 6: Report Center
Current farm – A Farm Administrator is required to select this option or the farm node in the tree.
Current Web Application – You must have Full Control permission for all zones or default zone of the specified Web applications to select this option or Web application nodes in the tree.
Current Site Collection – You must have at least one of the following permissions to select this option or site collection nodes in the tree:
o Full Control permission for all zones or default zone of the Web applications where the specified site collections reside.
o Permission level contains Edit Items and Add and Customize Pages permissions of the current site collection.
Specific Site Collection Nodes – You must have at least one of the following permissions to select the specific site collection nodes in the tree:
o Full Control permission for all zones or default zone of the Web applications where the specified site collections reside.
o Site Collection Administrator of the specified site collections.
Current Site, including subsites – You must have at least one of the following permissions to select this option:
o Full Control permission for all zones or default zone of the Web applications where the current site resides.
o Permission level contains Edit Items and Add and Customize Pages permissions of the current site collection.
o Permission level contains Edit Items and Add and Customize Pages permissions of the current site collection and its subsites.
Specific Site Nodes – You must have at least one of the following permissions to select specific site nodes in the tree:
o Full Control permission for all zones or default zone of the Web applications where the specified sites reside.
o Site Collection Administrator of the site collection where the specified sites resides.
o Full Control permission for the specified sites.
Data Collection for Usage Activity Web Parts
DocAve provides data collectors called Usage Activity Web Part Collector and User Profile Collector to
collect the data for Usage Activity Web parts once per day at midnight by default. You can designate the
schedule and the notification for these collectors in Data Collection. Refer to Data Collection for more
detailed instructions. To get the latest collected data shown in the Report Display pane of a specified
Web part, refresh the page where the Web part resides.
184
DocAve 6: Report Center
*Note: On the lower right corner of each social Web part (Most Active Contributors, Most Popular
Contributors, Top Documents, Top Blog Posts, Top Discussions, and Top Wiki Pages), the last time the
data was updated is shown.
To collect the required data for all of the Usage Activity Web Parts via Usage Activity Web Part Collector
and User Profile Collector, you must ensure that the following prerequisites are met in your SharePoint
farm:
The User Profile Service is started.
The Usage Data Collection (with the Page Requests event selected) is enabled.
The Health Data Collection is enabled.
The Microsoft SharePoint Foundation Usage Data Import and Microsoft SharePoint Foundation Usage Data Processing timer jobs are enabled.
SharePoint Auditor is enabled for the objects included in all of the Usage Activity Web parts.
Supported Browser Versions for Usage Activity Web Parts
See below for the supported browser versions for Usage Activity Web parts:
Browser Version
Internet Explorer Internet Explorer 8, 9, 10
Google Chrome Latest publicly released version
Mozilla Firefox Latest publicly released version
Most Active Contributors Web Part
This Web Part provides rankings of users who have contributed the most documents, blog posts and
discussions within the selected scope.
Viewing the Report of Most Active Contributors
The Display pane has a number of configurable settings for customizing how the Web part displays
generated reports. If desired, configure the following settings in the Display pane:
All/Last Week/ Last Month – Select the time range for this report.
All/Documents/Blog Posts/Discussions – Customize the type of data shown in the report. Select All to view a ranking by the sum of all documents and blog posts contributed by users. Select Documents to view the ranking by the number of documents created by users. Select Blog Posts to view a ranking by the number of blog posts created by users. Select Discussions to view a ranking by the number of discussions created by users.
185
DocAve 6: Report Center
Page turning – Clicking the next ( ) button or the previous ( ) button to view more users of the list. Up to five users are listed per page in the Display pane.
Most Popular Contributors
This Web Part provides rankings of users who have the most document activities and/or blog post
activities and/or discussion activities within the selected scope. Document activities include the
followers, views and likes that users have for their documents. Blog post activities include the
comments, views and likes that users have for their blog posts. Discussion activities include the views,
replies and likes that users have for their discussions.
Viewing the Report of Most Popular Contributors
The Display pane has a number of configurable settings for customizing how the Web part displays
generated reports. If desired, configure the following settings in the Display pane:
All/Documents/Blog Posts/Discussions – Customize the type of data shown in the report. Select All to view a ranking by the sum of document activities, blog post activities and discussion activities users have for their documents, blog posts and discussions. Select Documents to view a ranking by the sum of followers, views and likes users have for their documents. Select Blog Posts to view a ranking by the number of comments, views and likes users have for their blog posts. Select Discussions to view a ranking by the number of views, replies and likes for their discussions.
Page turning – Clicking the next ( ) button or the previous ( ) button to view more users in the list. Up to five users are listed per page in the Display pane.
Advanced – Select Documents and hover your cursor over a row in the list, you can view a list of top five popular documents of the specified user in the popup window on the right. Select Blog Posts and hover your cursor over a row in the list, you can view a list of top five popular blogs of the specified user. Select Discussions and hover your cursor over a row in the list, you can view a list of top five popular discussions of the specified user. You can also click the title of a specific content listed in the window to view it.
Top Documents
This Web part provides rankings of documents which have been viewed the most and/or have the most
followers and/or likes within the selected scope.
By default, the documents of the following types are excluded from the Top Documents Web part
rankings: master, aspx, css, jpg, png, js, and gif. To customize the filter for excluding file types from the
rankings, configure the <FileExtensionFilter> node in the ReportCenterServiceCustomProperties.config
file. For detailed instructions, refer to Configuring the ReportCenterServiceCustomProperties.config File.
186
DocAve 6: Report Center
Viewing the Report of Top Documents
The Display pane has a number of configurable settings for customizing how the Web part displays
generated reports. If desired, configure the following settings in the Display pane:
All/Followers/Views/Likes – Customize the type of data shown in the report. Select All to view a ranking by the sum of followers, views and likes of the documents. Select Followers to view a ranking by number of followers of documents. Select Views to view a ranking by the number of views of documents. Select Likes to view a ranking by the number of likes of documents. Note that this Web part does not provide a ranking by Followers and Likes in SharePoint 2010.
All/Last Week/ Last Month – Select the time range for this report. Note that this setting only supports the ranking by Views.
Page turning – Clicking the next ( ) button or the previous ( ) button to view more items in the list. Up to five documents are listed per page in the Display pane.
Link – Click the title of a specific document to view it.
Advanced – Hover your cursor over a row in the list, and view the details of the specified document in the pop-up window on the right. At the bottom of the window, click Open to open the document and click View Library to jump to the library where it resides.
Top Blog Posts
This Web part provides rankings of blog posts that have been viewed the most and/or have the most
likes and/or comments within the selected scope.
Viewing the Report of Top Blog Posts
The Display pane has a number of configurable settings for customizing how the Web part displays
generated reports. If desired, configure the following settings in the Display pane:
All/Comments/Views /Likes – Customize the type of data shown in the Display pane. Select All to view a ranking by the sum of comments, views and likes of blog posts. Select Comments to view a ranking by number of comments on blog posts. Select Views to view a ranking by the number of views of blog posts. Select Likes to view a ranking by the number of likes on blog posts. Note that this Web part does not provide a ranking by Likes in SharePoint 2010.
All/Last Week/ Last Month – Select the time range for this report. Note that this setting only supports the ranking by Views.
Page turning – Clicking the next ( ) button or the previous ( ) button to view more items in the list. Up to five blog posts are listed per page in the Display pane.
Link – Click the title of a specific blog post to view it.
187
DocAve 6: Report Center
Advanced – Hover your cursor over a row in the list, and view the details of the specified blog post in the popup window on the right You can also open this blog post by clicking Open at the bottom of the window.
Top Discussions
This Web part provides rankings of discussions that have been viewed the most and/or have the most
replies and/or likes within the selected scope.
Viewing the Report of Top Discussions
The Display pane has a number of configurable settings for customizing how the Web part displays
generated reports. If desired, configure the following settings in the Display pane:
All/Replies/Views/Likes – Customize the type of data shown in the Display pane. Select All to view a ranking by the sum of replies, views and likes of discussions. Select Replies to view a ranking by number of replies on discussions. Select Views to view a ranking by the number of views of discussions. Select Likes to view a ranking by the number of likes of discussions. Note that this Web part does not provide a ranking by Likes in SharePoint 2010.
All/Last Week/ Last Month – Select the time range for this report. Note that this setting only supports the ranking by Views.
Page turning – Clicking the next ( ) button or the previous ( ) button to view more items in the list. Up to five discussions are listed per page in the Display pane.
Link – Click the link of the title of a specific discussion to view it.
Advanced- Hover your cursor over a row in the list, and view the details of the specified discussion board in the popup window on the right, you can also open this discussion by clicking Open at the bottom of the window.
Top Wiki Pages
This Web part provides a ranking of wiki pages that have been viewed the most for this latest
week/month within the site collection/site.
Viewing the Report of Top Wiki Pages
The Display pane has a number of configurable settings for customizing how the Web part displays
generated reports. If desired, configure the following settings in the Display pane:
All/Last Week/ Last Month – Select the time range for this report.
Page turning – Clicking the next ( ) button or the previous ( ) button to view more items in the list. Up to five wiki pages are listed per page in the Display pane.
Link – Click the title of a specific wiki page to view it.
188
DocAve 6: Report Center
Advanced – Hover your cursor over a row in the list, and view the details of the specified wiki page in the popup window on the right. You can also open this page by clicking Open at the bottom of the window
Report Center Dashboard Web Part
This Web part contains multiple reports for analyzing SharePoint usage and behavior across the selected
scope within a specific time range, including Summary, Active Users, Checked-Out Documents, Activity
Ranking, Last Accessed Time, Site Traffic, Site Visitors, Top Documents by Social Activity, and Content
Type Usage.
Before viewing the reports included in the Dashboard Web part, select the time range for the all of the
reports except the Last Accessed Time and Content Type Usage reports. To do so, select one of the
following time range options from the drop-down list on the upper-right corner: Last 7 Days/ Last 14
Days/Last 30 Days/Last Month/Last 3 Months/Last 6 Months.
See the sections below for detailed instructions on viewing each report in Report Center Dashboard.
Summary
This report displays a summary on the usage of the SharePoint site collections or sites selected in Object
Selection, within a selected time range. This report displays the following contents:
Unique Visitors – The total number of unique visitors who have accessed the selected scopes.
Checked-Out Documents –The total number of checked-out documents within the selected scopes.
Activities – The total number of all user activities within the selected scopes.
Items – The total number of list items and documents within the selected scopes.
Data Size – The total data size of the selected scopes.
Active Users
This report displays rankings of users by the number of activities within each of the selected site
collections and sites.
In the display pane of this report, there are a number of configurable settings for customizing how the
report is displayed. If desired, configure the following settings in the display pane:
Change Scope – In the upper-left corner of the display pane, you can view the title of site collection/site which is the current scope of the report. To change the scope for the data shown in the report, complete the following steps:
189
DocAve 6: Report Center
i. Click the name of the currently selected scope in the upper-left corner, a drop-
down menu appears.
ii. Click Change Scope. The window for changing the scope appears.
iii. Select the site collection/site for which you want to view the data in the report.
You can also search the desired site collection/site by entering the site title in
the text box.
iv. Click OK to save the change and return to the display pane.
Export – Export the report in XLSX format to a SharePoint folder/library by completing the following steps:
i. Click Export in the upper-right corner. The Export window appears.
ii. Export Location – Click Browse and then select a desired folder/library where
you want to store the export report on the tree in the dialog window.
iii. Date Range – Select a desired time range for the data included in the exported
report.
iv. Active Users – Check the Include all checkbox to include all of data in the
exported report, or check the Top __ users checkbox, and then enter an integer
into the text box to designate the number of the top ranking users to be
included in the report.
v. Click OK to export the report immediately. A notification message appears,
informing that the exporting has started.
vi. Click OK to close the window and return to the report display pane.
Checked-Out Documents
This report displays the information of checked-out documents within the selected site collections or
sites. The Y-axis of the chart represents the number of checked-out documents within the each of the
site collection or site. The X-axis of the chart represents the date when the data is collected.
In the display pane of this report, there are a number of configurable settings for customizing how the
report is displayed. If desired, configure the following settings in the display pane:
Change Scope – In the section above the chart, you can view the titles of site collections or sites which are the currently displayed scopes of the report. The chart can display the data for up to three scopes at one time. If there are more than three reporting scopes selected in Report Center Dashboard Properties for this Web part, you can change the
displayed scopes by clicking the next ( ) button or the previous ( ) button of the Displayed Scopes section in the upper-right corner of the display pane.
Interval – Select the interval for displaying the data in the chart by selecting the corresponding option from the Interval drop-down list.
190
DocAve 6: Report Center
Export – Export the report in XLSX format to a SharePoint folder or library by completing the following steps:
i. Click Export in the upper-right corner. The Export window appears.
ii. Export Location – Click Browse and then select a desired folder or library where
you want to store the export report on the tree in the dialog window. To export
PivotChart of this report, select the Export the PivotChart option under the
Export Location text box.
iii. Date Range – Select a desired time range for the data included in the exported
report.
iv. Frequency – Select the frequency for displaying the data in the exported report.
v. Click OK to export the report immediately. A notification message appears,
informing that the exporting has started.
vi. Click OK to close the window and return to the report display pane.
Activity Ranking
This report displays rankings of sites, pages, lists, and documents by activity within each selected site
collections/site.
Configure the URL filter in the Usage Activity Web Part Settings of DocAve Manager Report Center to
exclude the desired pages from this report. For details, refer to Usage Activity Web Parts Settings.
In the display pane of this report, there are a number of configurable settings for customizing how the
report is displayed. If desired, configure the following settings in the display pane:
Change Scope – In the upper-left corner of the display pane, you can view the title of site collection/site which is the currently displayed scope of the report. To change the scope for the data shown in the report, complete the following steps:
i. Click the name of the currently selected scope in the upper-left corner, a drop-
down menu appears.
ii. Click Change Scope. The window for changing the scope appears.
iii. Select the site collection or site for which you want to view the data in the
report. You can also search the desired site collection or site by entering the site
title in the text box.
iv. Click OK to save the change and return to the display pane.
Sites/Pages/Lists/Documents – Customize the type of data shown in the display pane by clicking the corresponding link in the upper-right corner.
*Note: The Sites link is available only when site collections are selected as the reporting
scope of the Report Center Dashboard Web part.
191
DocAve 6: Report Center
Link – Click the name of a specific site, page, list, or document in the report to access to the site, page, list, or document.
Export – Export the report in XLSX format to a SharePoint folder/library by completing the following steps:
i. Click Export in the upper-right corner. The Export window appears.
ii. Export Location – Click Browse and then select a desired folder/library where
you want to store the export report on the tree in the dialog window.
iii. Date Range – Select a desired time range for the data included in the exported
report.
iv. Activity Ranking – Enter a positive integer into the Top __ text box, and select
Select All/Sites/Pages/Documents/Lists options below to designate the number
and data types included in the exported report.
*Note: The Sites option is only available when site collections are selected as
the reporting scope of the Report Center Dashboard Web part.
v. Click OK to export the report immediately. A notification message appears,
informing that the exporting has started.
vi. Click OK to close the window and return to the report display pane.
Last Accessed Time
This report displays when the selected site collections or sites were last accessed, and by whom. In the
report display pane, you can view the last accessed time and the last visitor of each site/site collection in
the Last Accessed Time and Last Accessed By columns.
Configuring Time Range and User Filter for Last Accessed Time
By default, the Last Accessed Time report displays the last accessed time data within the selected scope
during the current month and the past 6 months, including the access records of all users. You can
customize the time range and user filter for the Last Accessed Time report by configuring the following
nodes in the ReportCenterServiceCustomProperties file.
To customize the time range of the Last Accessed Time report, configure the <LastAccessedTimeStartTime> node in the ReportCenterServiceCustomProperties file.
To customize the user filter to exclude some users from the Last Accessed Time report, configure the <LastAccessedTimeUserFilter> in the ReportCenterServiceCustomProperties file.
For details on configuring the nodes mentioned above, refer to Configuring the
ReportCenterServiceCustomProperties.config File.
192
DocAve 6: Report Center
Exporting Last Accessed Time Reports
Using the Export feature of this report, you can export the report in XLSX format to a SharePoint
folder/library by completing the following steps:
1. Click Export in the upper-right corner. The Export window appears.
2. Click Browse in the Export Location section and then select a desired folder/library where you want to store the export report on the tree in the dialog window.
3. Click OK to export the report immediately. A notification message appears, informing that the exporting has started.
4. Click OK to close the window and return to the report display pane.
Site Traffic
This report displays charts of the numbers of activities and throughput that the selected site collections
or sites have received. The Y-axis of the chart represents the number of activities or throughput that
each site/site collection has received. The X-axis of the chart represents the date when the data is
collected.
In the display pane of this report, there are a number of configurable settings for customizing how the
report is displayed. If desired, configure the following settings in the display pane:
Change Scope – In the section above the chart, you can view the titles of site collections/sites which are the currently displayed scopes of the report. The chart can display the data for up to three scopes at one time. If there are more than three reporting scopes selected in Report Center Dashboard Properties for this Web part, you
can change the displayed scopes by clicking the next ( ) button or the previous ( ) button of the Displayed Scopes section in the upper-right corner of the display pane.
Interval – Select the interval for displaying the data in the chart by selecting the corresponding option from the Interval drop-down list.
Activities/Throughput – Customize the type of data shown in the chart by clicking the corresponding link above the upper-right corner of the chart.
Export – Export the report in XLSX format to a SharePoint folder/library by completing the following steps:
i. Click Export in the upper-right corner. The Export window appears.
ii. Export Location – Click Browse and then select a desired folder/library where
you want to store the export report on the tree in the dialog window. To export
PivotChart of this report, select the Export the PivotChart option under the
Export Location text box.
iii. Date Range – Select a desired time range for the data included in the exported
report.
193
DocAve 6: Report Center
iv. Frequency – Select the frequency for displaying the data in the exported report.
v. Site Traffic – Select the data types included in the exported report by selecting
the corresponding checkboxes: Activities and Throughput.
vi. Click OK to export the report immediately. A notification message appears,
informing that the exporting has started.
vii. Click OK to close the window and return to the report display pane.
Search Usage
This report displays the usage data for search activities, search terms and search scopes within the
selected site collections.
*Note: This report is available only when site collections are selected in the Object Selection settings of
this Web part.
In the chart of the display pane, you can view the numbers of search activities occurred within the
selected site collections during a specific time range. The Y-axis of the chart represents the number of
search activities occurred in each site collection. The X-axis of the chart represents the date when the
data is collected. Also, the display pane has a number of configurable settings for customizing how the
report is displayed. If desired, configure the following settings in the display pane:
Change Scope – In the section above the chart, you can view the titles of site collections which are the currently displayed scopes of the report. The chart can display the data for up to three scopes at one time. If there are more than three reporting scopes selected in Report Center Dashboard Properties for this Web part, you can change the
displayed scopes by clicking the next ( ) button or the previous ( ) button of the Displayed Scopes section in the upper-right corner of the display pane.
Interval – Select the interval for displaying the data in the chart by selecting the corresponding option from the Interval drop-down list.
View Details – To view the details of the search scopes and search terms of a specific site collection, click View Details to access the View Details window. For details, see Viewing Details of Search Usage Reports.
Export – Export the report in XLSX format to a SharePoint folder/library. For details, refer to Exporting Search Usage Reports.
Viewing Details of Search Usage Reports
The View Details window displays rankings of search terms and search scopes by number of search
activities within a specific site collection.
To access the View Details window for viewing the ranking of search terms and search scopes of a
specific site collection, choose either of the following methods:
194
DocAve 6: Report Center
In the chart of the report display pane, click a point on the line representing the site collection for which the details you want to view. The View Details window for the selected site collection appears.
Click View Details above the chart. The View Details window appears. The default displayed scope of the View Details window is the first displayed scope on the left above the chart. To change the scope for the data shown in the window, complete the following steps:
i. Click the name of the currently selected scope in the upper-left corner, a drop-
down menu appears.
ii. Click Change Scope. The window for changing the scope appears.
iii. Select the site collection for which you want to view the data in the report. You
can also search the desired site collection by entering the site collection title in
the text box.
iv. Click OK to save the change and return to the View Details window.
In the View Details window, you can also perform the following operations:
Export – Export the details in XLSX format to a SharePoint folder/library. For details, refer to Exporting Search Usage Reports.
Show – Select the data range of the data displayed in the View Details window by selecting Top 10/Top 20/Top 50/Top 100 from the Show drop-down list in the upper-right corner.
Exporting Search Usage Reports
To export a Search Usage report in XLSX format to a SharePoint folder/library, complete the following
steps:
1. To access the Export window for configuring the export report settings, choose either of the following two methods:
Click Export in the upper-right corner of the report display pane.
Click Export in the upper-left corner of the View Details pop-up window.
2. In the Export window, configure the following settings:
Export Location – Click Browse and then select a desired folder/library where you want to store the export report on the tree in the dialog window.
Date Range – Select a desired time range for the data included in the exported report.
Search Usage – Select how many records you want to include in the exported report by selecting the corresponding option from the drop-down list.
3. Click OK to export the report immediately. A notification message appears, informing that the exporting has started.
195
DocAve 6: Report Center
4. Click OK to close the window.
Site Visitors
This report displays the numbers of unique visitors and user activities of the selected site
collections/sites.
In the chart of the display pane, you can view the numbers of unique visitors of the selected site
collections/sites. The Y-axis of the chart represents the number of unique visitors of each site/site
collection. The X-axis of the chart represents the date when the data is collected. Also, the display pane
has a number of configurable settings for customizing how the report is displayed. If desired, configure
the following settings in the display pane:
Change Scope – In the section above the chart, you can view the titles of site collections/sites which are the currently selected as the scopes of the data shown in the chart. The chart can display the data for up to three scopes at one time. If there are more than three reporting scopes selected in Report Center Dashboard Properties for this Web part, you can change the displayed scopes by clicking the next ( ) button or
the previous ( ) button of the Displayed Scopes section in the upper-right corner of the display pane.
Interval – Select the interval for displaying the data in the chart by selecting the corresponding option from the Interval drop-down list.
View Details – View the number of activities performed by each visitor within a specific site collection/site in the View Details window. For details, see Viewing Details of Site Visitors Reports.
Export – Export the report in XLSX format to a SharePoint folder/library. For details, refer to Exporting Site Visitors Reports.
Viewing Details of Site Visitors Reports
The View Details window displays rankings of visitors by number of activities within a specific site
collection/site.
To access the View Details window for viewing the number of activities performed by each visitor in a
specific site collection/site, choose either of the following methods:
Click a point on the line representing the site collection/site for which the details you want to view in the chart. The View Details window for the selected site collection/site appears.
Click View Details above the chart. The View Details window appears. The default displayed scope of the View Details window is the first displayed scope on the left above the chart. To change the scope for the data shown in the window, complete the following steps:
i. Click the name of the currently selected scope in the upper-left corner, a drop-
down menu appears.
196
DocAve 6: Report Center
ii. Click Change Scope. The window for changing the scope appears.
iii. Select the site collection/site for which you want to view the data in the report.
You can also search the desired site collection/site by entering the site title in
the text box.
iv. Click OK to save the change and return to the View Details window.
In the View Details window, you can also perform the following operations:
Export – Export the details in XLSX format to a SharePoint folder/library. For details, refer to Exporting Site Visitors Reports.
Data Range – Select the data range of the data displayed in the View Details window by selecting All/Top 100/Top 50/Top 20/Top 10.
Exporting Site Visitors Reports
To export a Site Visitors report in XLSX format to a SharePoint folder/library, complete the following
steps:
1. To access the Export window for configuring the export report settings, choose either of the following two methods:
Click Export in the upper-right corner of the report display pane.
Click Export in the upper-left corner of the View Details pop-up window.
2. In the Export window, configure the following settings:
Export Location – Click Browse and then select a desired folder/library where you want to store the export report on the tree in the dialog window. To export PivotChart of this report, select the Export the PivotChart option under the Export Location text box.
Date Range – Select a desired time range for the data included in the exported report.
Frequency – Select the frequency for displaying the data in the exported report.
Site Visitors – Select the Include all checkbox to include all of data in the exported report, or select the Top __ visitors checkbox, and then enter an integer into the text box to designate the number of the top ranking visitors to be included in the report.
3. Click OK to export the report immediately. A notification message appears, informing that the exporting has started.
4. Click OK to close the window.
Top Document by Social Activities
This report provides rankings of documents which have been viewed the most and/or have the most
followers and/or likes within each selected site collection/site.
197
DocAve 6: Report Center
The display pane has a number of configurable settings for customizing how the report is displayed. If
desired, configure the following settings in the display pane:
All/Followers/Views/Likes – Customize the type of data shown in the report. Select All to view a ranking by the sum of followers, views and likes of the documents. Select Followers to view a ranking by number of followers of documents. Select Views to view a ranking by the number of views of documents. Select Likes to view a ranking by the number of likes of documents. Note that this Web part does not provide a ranking by Followers and Likes in SharePoint 2010.
Link – Click the title of a specific document to view it.
Advanced – Click on a file name in the list, and view the details of the specified document in the pop-up window on the right. At the bottom of the window, click Open to open the document and click View Library to jump to the library where it resides.
Export – Export the report in XLSX format to a SharePoint folder/library by completing the following steps:
i. Click Export in the upper-right corner. The Export window appears.
ii. Export Location – Click Browse and then select a desired folder/library where
you want to store the export report on the tree in the dialog window.
iii. Date Range – Select a desired time range for the data included in the exported
report.
iv. Top Documents – Select the number and data metrics for the documents you
want to include in the exported report, by entering an integer between 1 and
100 into Top_ documents by and selecting the Select All/Total
Activities/Followers/Likes/Views checkboxes.
v. Click OK to export the report immediately. A notification message appears,
informing that the exporting has started.
vi. Click OK to close the window and return to the report display pane.
Content Type Usage
This report displays the latest content type usage details within the selected site collections or sites. In
the report display pane, you can view the numbers of sites, lists, and items where each content type is
currently used. The display pane has a number of settings for customizing how the report is displayed. If
desired, configure the following settings:
Content Type – To view the detailed information of a specific content type, click the link listed in the Content Type column to access the Content Type Information page of the selected content type in the corresponding site.
198
DocAve 6: Report Center
View Details – To view the detailed information of the sites or lists where a specific content type is currently used, click the link in the Total Sites/Total Lists column to access the View Details window for the selected content type.
Export – Export the report in XLSX format to a SharePoint folder or library by completing the following steps:
i. Click Export in the upper-right corner. The Export window appears.
ii. Export Location – Click Browse and then select a desired folder or library where
you want to store the export report on the tree in the dialog window.
iii. Click OK to export the report immediately. A notification message appears,
informing that the exporting has started.
iv. Click OK to close the window and return to the report display pane.
Browser Usage
This report displays the information of the latest browser usage proportion within the selected site
collections or sites. In the report display pane, you can view the percentages of different browsers that
are currently used. You can also export a Browser Usage report in XLSX format to a SharePoint
folder/library by clicking Export in the upper-right corner, and then complete the following
configurations:
Export Location – Manually input a folder or library where you want to store the export report on the tree in the window. To export PivotChart of this report, select the Export the PivotChart option under the Export Location text box.
Date Range – Select a desired time range for the data included in the exported report.
Referrers
This report provides rankings of referring frequency of sites or pages within a specified scope to site
collection or sites.
The display pane has a number of configurable settings for customizing how the report is displayed. If
desired, configure the following settings in the display pane:
Change Scope – In the upper-left corner of the display pane, you can view the title of site collection or site which is the current scope of the report. To change the scope for the data shown in the report, complete the following steps:
i. Click the name of the currently selected scope in the upper-left corner, and a
drop-down menu appears.
ii. Click Change Scope. The window for changing the scope appears.
199
DocAve 6: Report Center
iii. Select the site collection or site for which you want to view the data in the
report. You can also search the desired site collection or site by entering the
title in the text box.
iv. Click OK to save the change and return to the display pane.
Referring Sites/Referring Pages – Customize the type of data shown in the report. Select Referring Sites to view a ranking by the sum of referring frequency of sites within a specified scope to site collection or sites. Select Referring Pages to view a ranking by sum of pages within a specified scope to site collection or sites.
Link – Click the link of a specific site or page to access it.
Export – Export the report in XLSX format to a SharePoint folder/library by completing the following steps:
i. Click Export in the upper-right corner. The Export window appears.
ii. Export Location – Click Browse and then select a desired folder/library where
you want to store the export report on the tree in the dialog window.
iii. Date Range – Select a desired time range for the data included in the exported
report.
iv. Referrers – Select the type of data you want to include in the exported report
by selecting the Select All/Referring Sites/Referring Pages options.
v. Click OK to export the report immediately. A notification message appears,
informing that the exporting has started.
vi. Click OK to close the window and return to the report display pane.
Storage Trends
This report displays the information of current storage consumption of the selected SharePoint on-
premises farm, Web applications, content databases, or site collections, or SharePoint Online site
collections. The Y-aixs of the chart represent the size of storage consumption. The X-aixs of the chart
represents the date when the data is collected.
In the display pane of this report, there are a number of configurable settings for customizing how the
report is displayed. If applicable, configure the following settings in the display pane:
Change Scope – In the section above the chart, you can view the titles of site collections or sites which are the currently displayed scopes of the report. The chart can display the data for up to three scopes at one time. If there are more than three reporting scopes selected in Report Center Dashboard Properties for this Web part, you can change the
displayed scopes by clicking the next ( ) button or the previous ( ) button of the Displayed Scopes section in the upper-right corner of the display pane.
Interval – The interval for displaying the data in the chart is Daily.
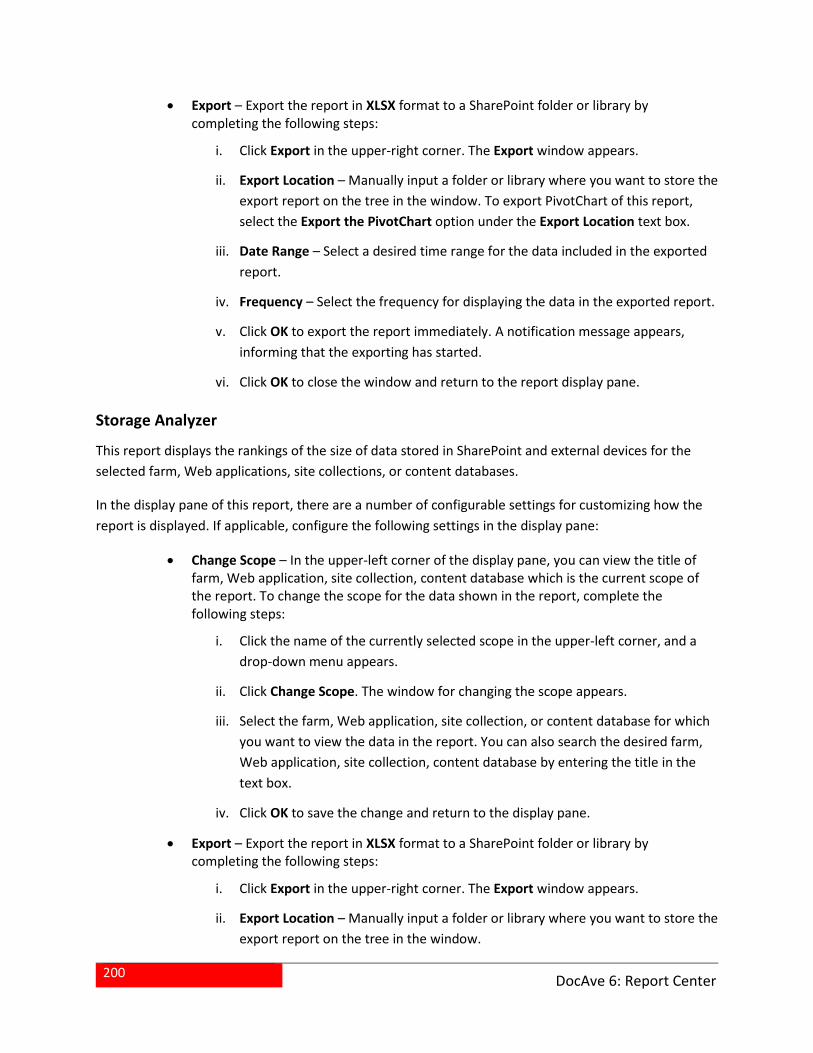
200
DocAve 6: Report Center
Export – Export the report in XLSX format to a SharePoint folder or library by completing the following steps:
i. Click Export in the upper-right corner. The Export window appears.
ii. Export Location – Manually input a folder or library where you want to store the
export report on the tree in the window. To export PivotChart of this report,
select the Export the PivotChart option under the Export Location text box.
iii. Date Range – Select a desired time range for the data included in the exported
report.
iv. Frequency – Select the frequency for displaying the data in the exported report.
v. Click OK to export the report immediately. A notification message appears,
informing that the exporting has started.
vi. Click OK to close the window and return to the report display pane.
Storage Analyzer
This report displays the rankings of the size of data stored in SharePoint and external devices for the
selected farm, Web applications, site collections, or content databases.
In the display pane of this report, there are a number of configurable settings for customizing how the
report is displayed. If applicable, configure the following settings in the display pane:
Change Scope – In the upper-left corner of the display pane, you can view the title of farm, Web application, site collection, content database which is the current scope of the report. To change the scope for the data shown in the report, complete the following steps:
i. Click the name of the currently selected scope in the upper-left corner, and a
drop-down menu appears.
ii. Click Change Scope. The window for changing the scope appears.
iii. Select the farm, Web application, site collection, or content database for which
you want to view the data in the report. You can also search the desired farm,
Web application, site collection, content database by entering the title in the
text box.
iv. Click OK to save the change and return to the display pane.
Export – Export the report in XLSX format to a SharePoint folder or library by completing the following steps:
i. Click Export in the upper-right corner. The Export window appears.
ii. Export Location – Manually input a folder or library where you want to store the
export report on the tree in the window.
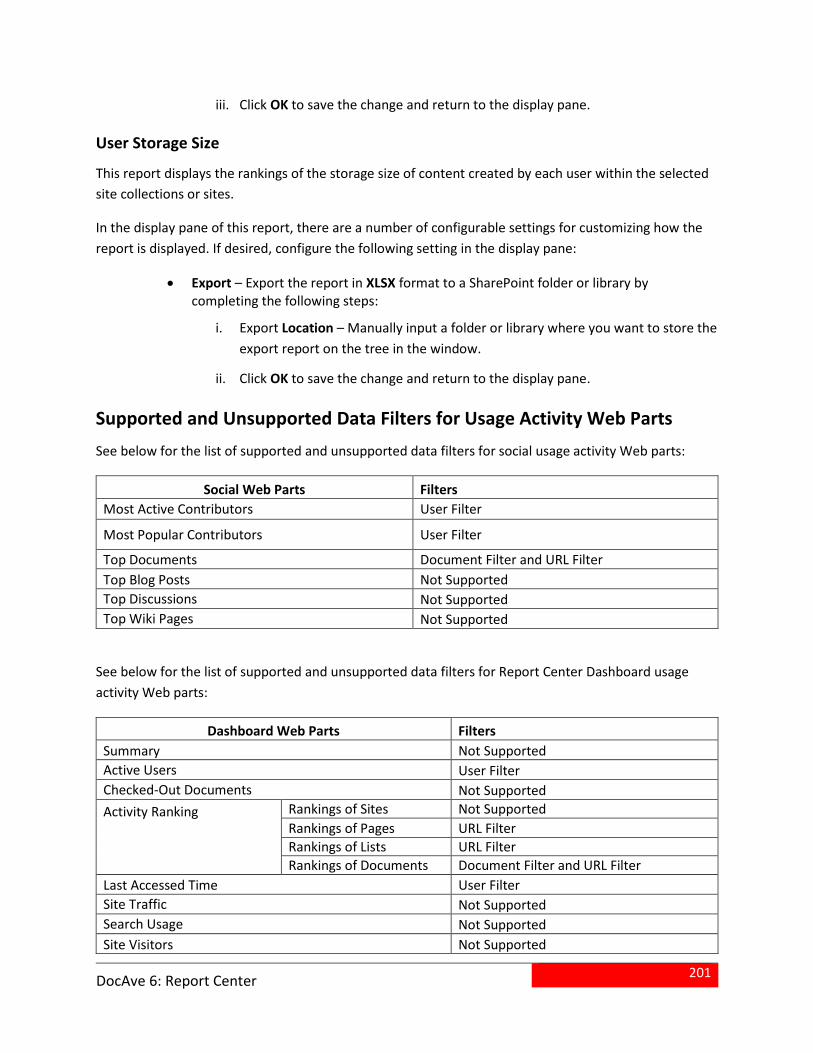
201
DocAve 6: Report Center
iii. Click OK to save the change and return to the display pane.
User Storage Size
This report displays the rankings of the storage size of content created by each user within the selected
site collections or sites.
In the display pane of this report, there are a number of configurable settings for customizing how the
report is displayed. If desired, configure the following setting in the display pane:
Export – Export the report in XLSX format to a SharePoint folder or library by completing the following steps:
i. Export Location – Manually input a folder or library where you want to store the
export report on the tree in the window.
ii. Click OK to save the change and return to the display pane.
Supported and Unsupported Data Filters for Usage Activity Web Parts
See below for the list of supported and unsupported data filters for social usage activity Web parts:
Social Web Parts Filters
Most Active Contributors User Filter
Most Popular Contributors User Filter
Top Documents Document Filter and URL Filter
Top Blog Posts Not Supported
Top Discussions Not Supported
Top Wiki Pages Not Supported
See below for the list of supported and unsupported data filters for Report Center Dashboard usage
activity Web parts:
Dashboard Web Parts Filters
Summary Not Supported
Active Users User Filter
Checked-Out Documents Not Supported
Activity Ranking
Rankings of Sites Not Supported
Rankings of Pages URL Filter
Rankings of Lists URL Filter
Rankings of Documents Document Filter and URL Filter
Last Accessed Time User Filter
Site Traffic Not Supported
Search Usage Not Supported
Site Visitors Not Supported
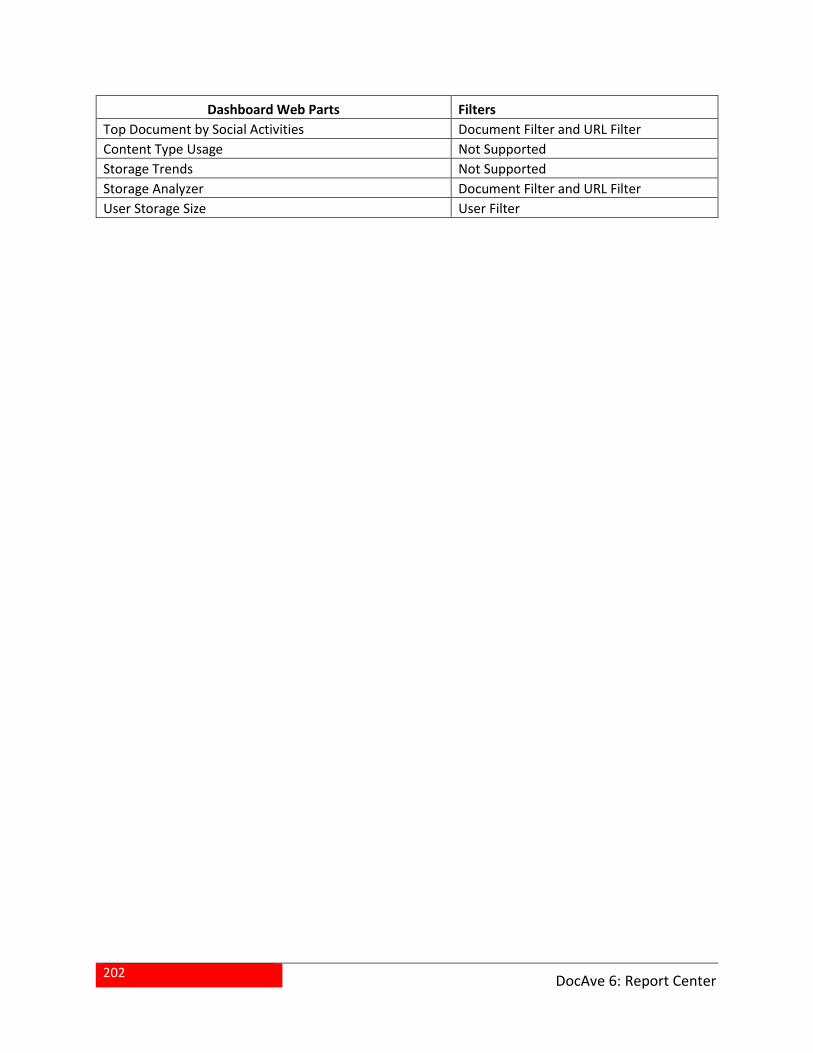
202
DocAve 6: Report Center
Dashboard Web Parts Filters
Top Document by Social Activities Document Filter and URL Filter
Content Type Usage Not Supported
Storage Trends Not Supported
Storage Analyzer Document Filter and URL Filter
User Storage Size User Filter
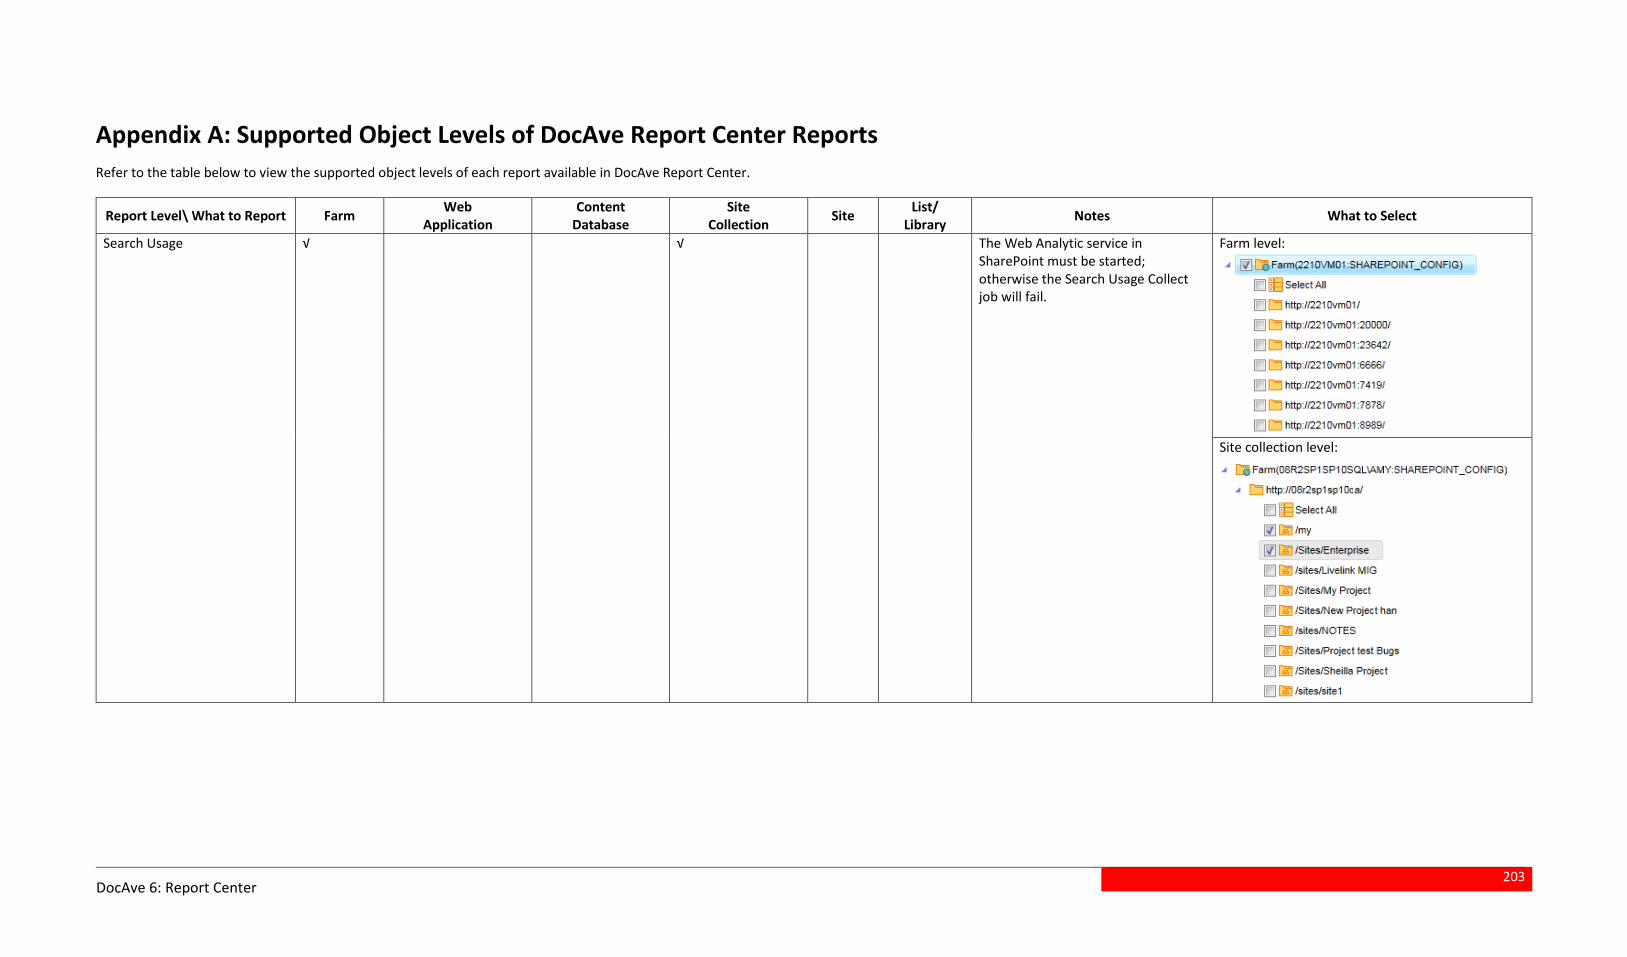
203
DocAve 6: Report Center
Appendix A: Supported Object Levels of DocAve Report Center Reports
Refer to the table below to view the supported object levels of each report available in DocAve Report Center.
Report Level\ What to Report Farm Web
Application Content
Database Site
Collection Site
List/ Library
Notes What to Select
Search Usage
√ √ The Web Analytic service in SharePoint must be started; otherwise the Search Usage Collect job will fail.
Farm level:
Site collection level:
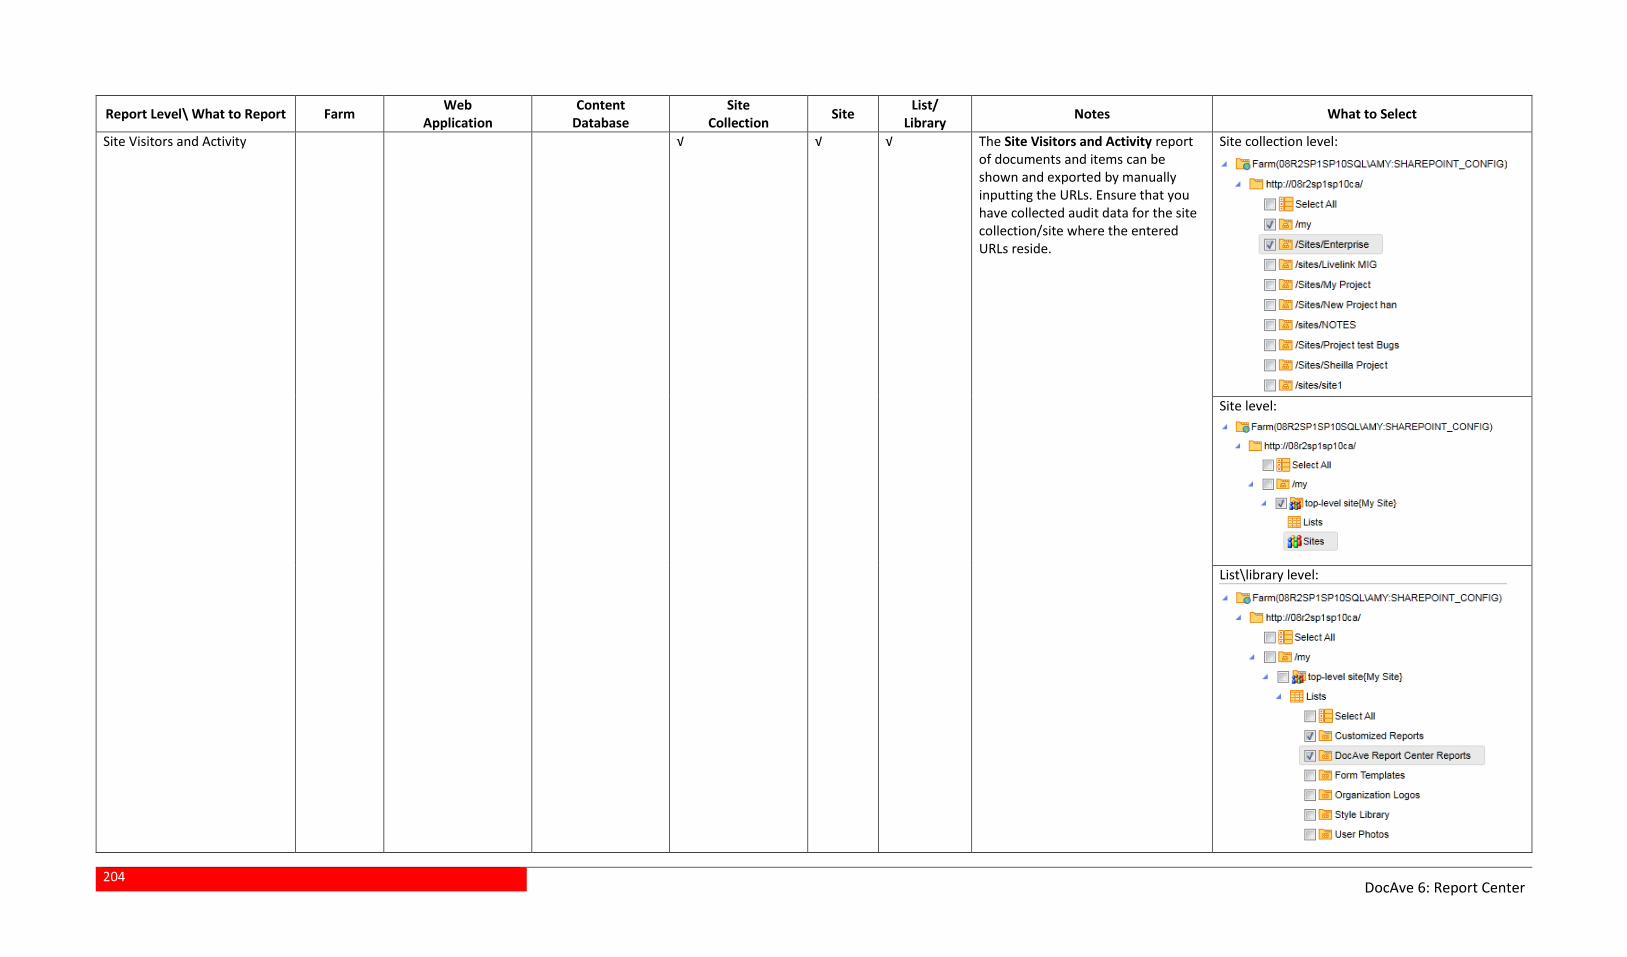
204
DocAve 6: Report Center
Report Level\ What to Report Farm Web
Application Content
Database Site
Collection Site
List/ Library
Notes What to Select
Site Visitors and Activity √ √ √ The Site Visitors and Activity report of documents and items can be shown and exported by manually inputting the URLs. Ensure that you have collected audit data for the site collection/site where the entered URLs reside.
Site collection level:
Site level:
List\library level:
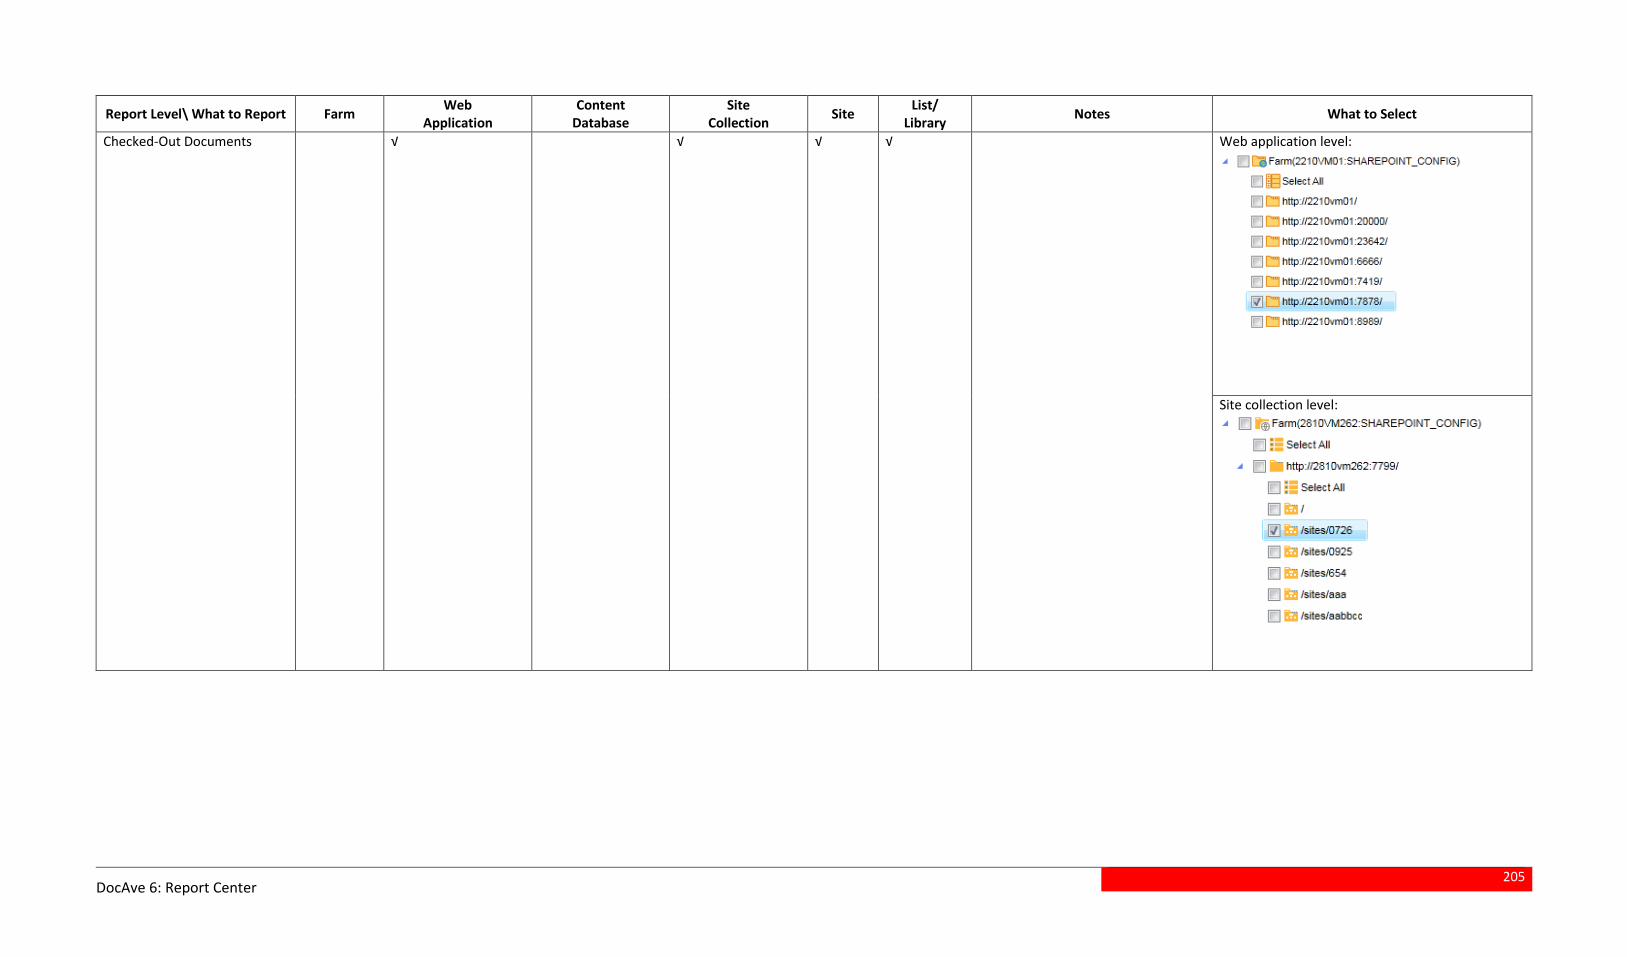
205
DocAve 6: Report Center
Report Level\ What to Report Farm Web
Application Content
Database Site
Collection Site
List/ Library
Notes What to Select
Checked-Out Documents √ √ √ √ Web application level:
Site collection level:
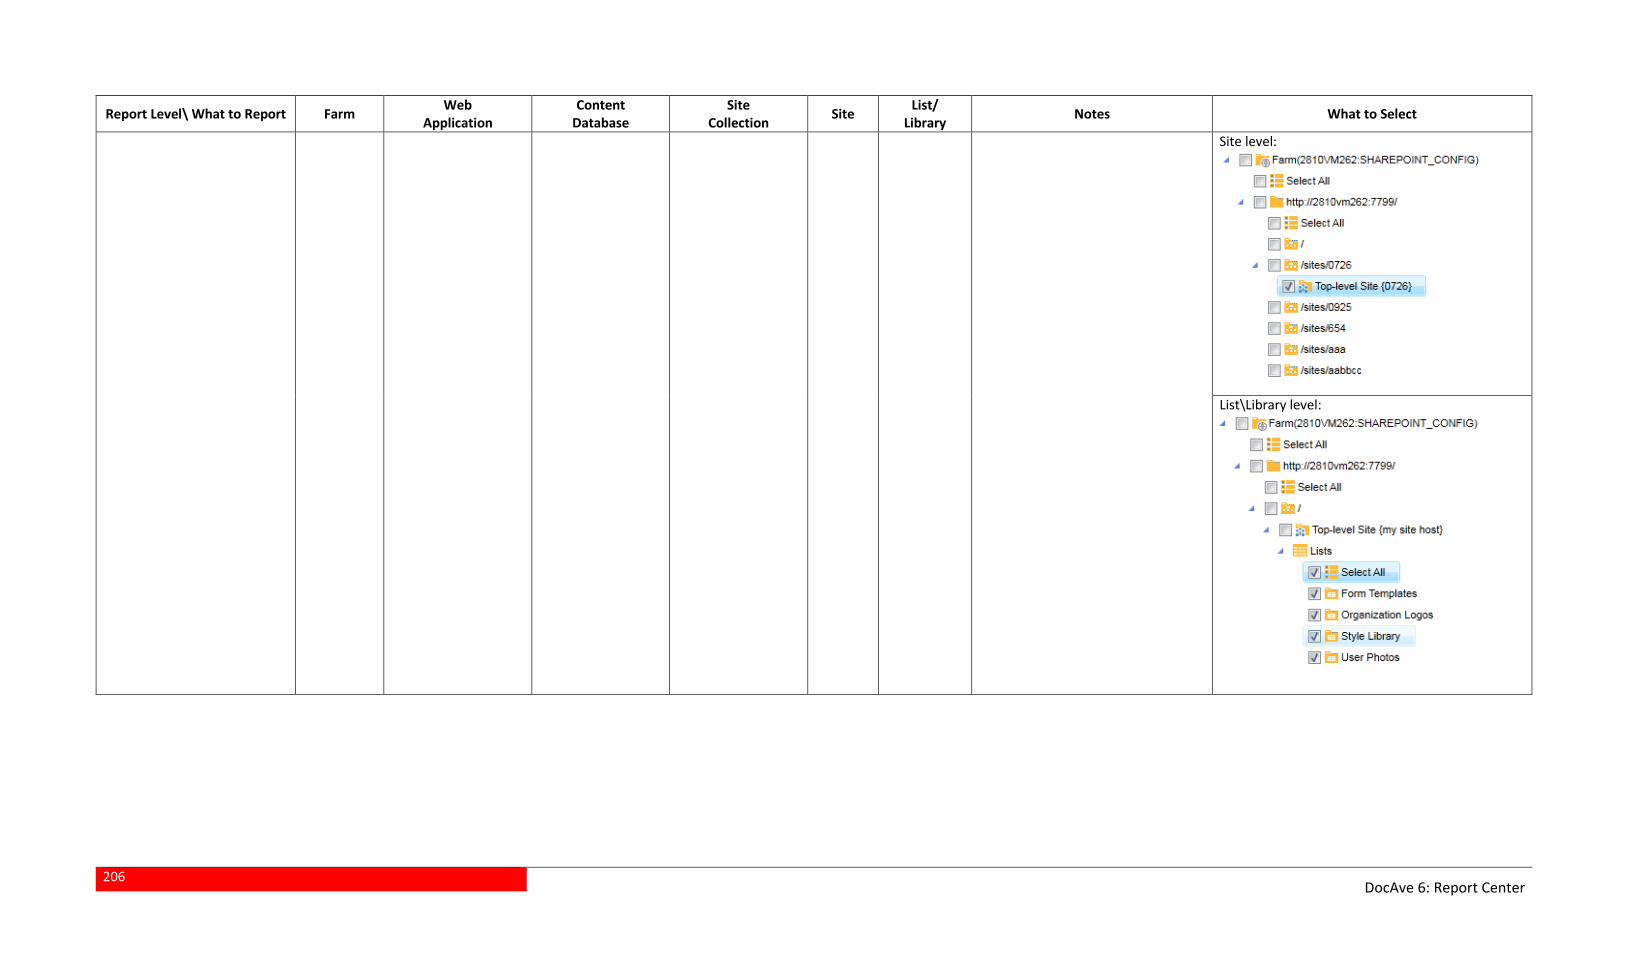
206
DocAve 6: Report Center
Report Level\ What to Report Farm Web
Application Content
Database Site
Collection Site
List/ Library
Notes What to Select
Site level:
List\Library level:

207
DocAve 6: Report Center
Report Level\ What to Report Farm Web
Application Content
Database Site
Collection Site
List/ Library
Notes What to Select
Page Traffic
√ √ Site collection level:
Site level:
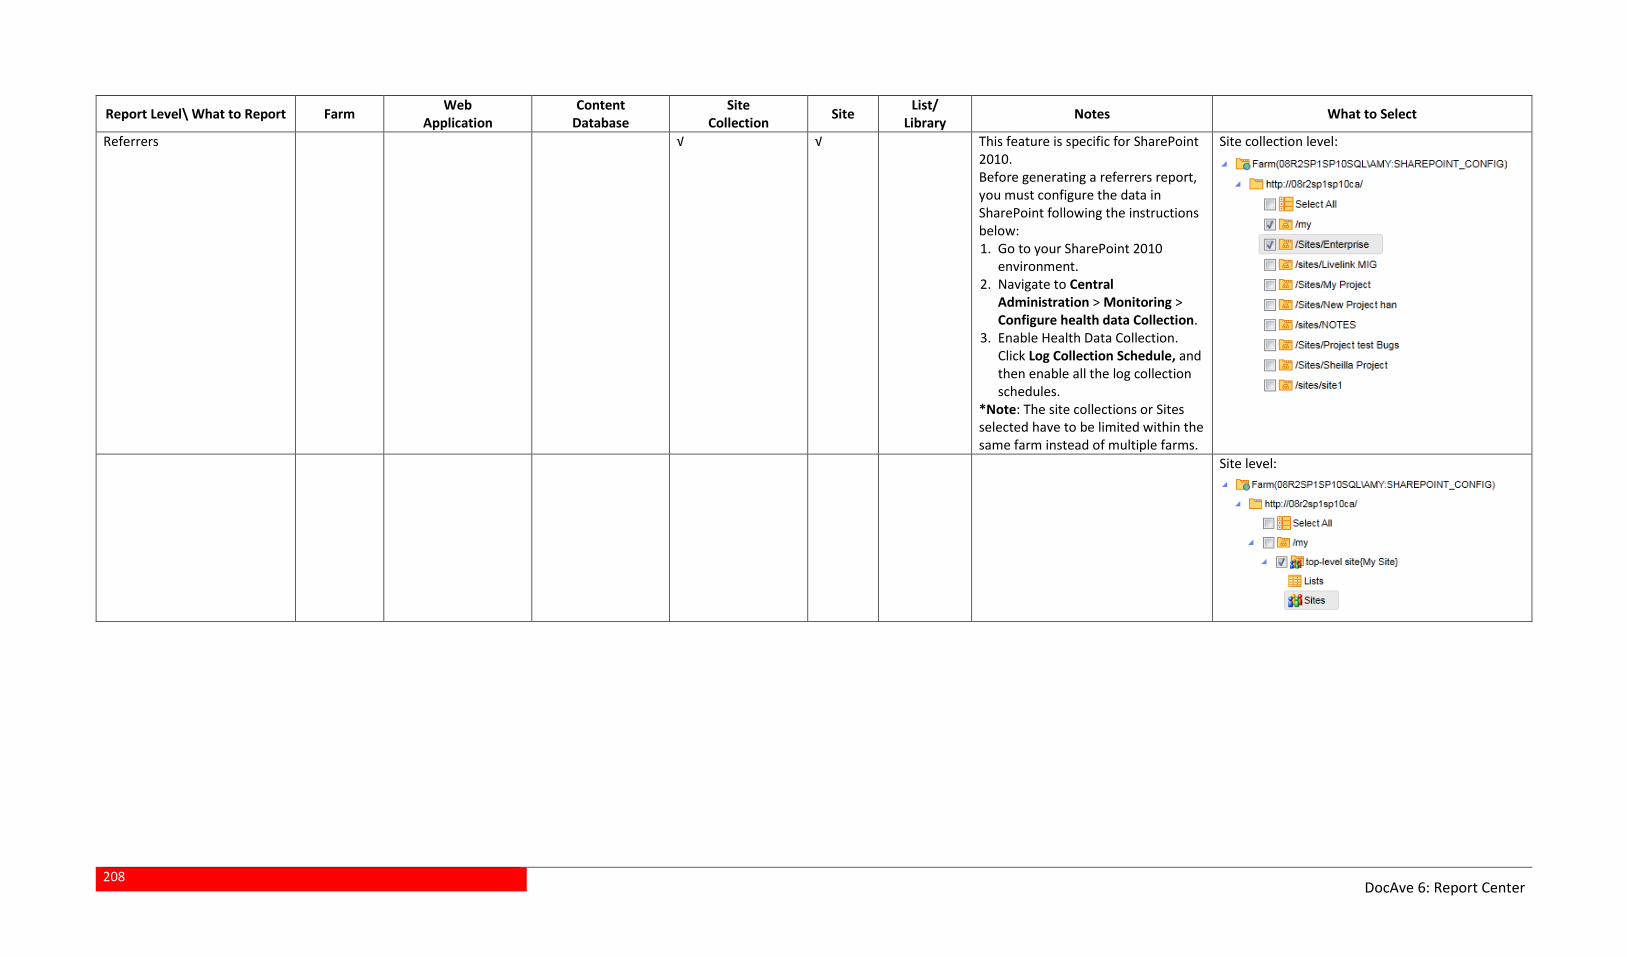
208
DocAve 6: Report Center
Report Level\ What to Report Farm Web
Application Content
Database Site
Collection Site
List/ Library
Notes What to Select
Referrers √ √ This feature is specific for SharePoint 2010. Before generating a referrers report, you must configure the data in SharePoint following the instructions below: 1. Go to your SharePoint 2010
environment. 2. Navigate to Central
Administration > Monitoring > Configure health data Collection.
3. Enable Health Data Collection. Click Log Collection Schedule, and then enable all the log collection schedules.
*Note: The site collections or Sites selected have to be limited within the same farm instead of multiple farms.
Site collection level:
Site level:
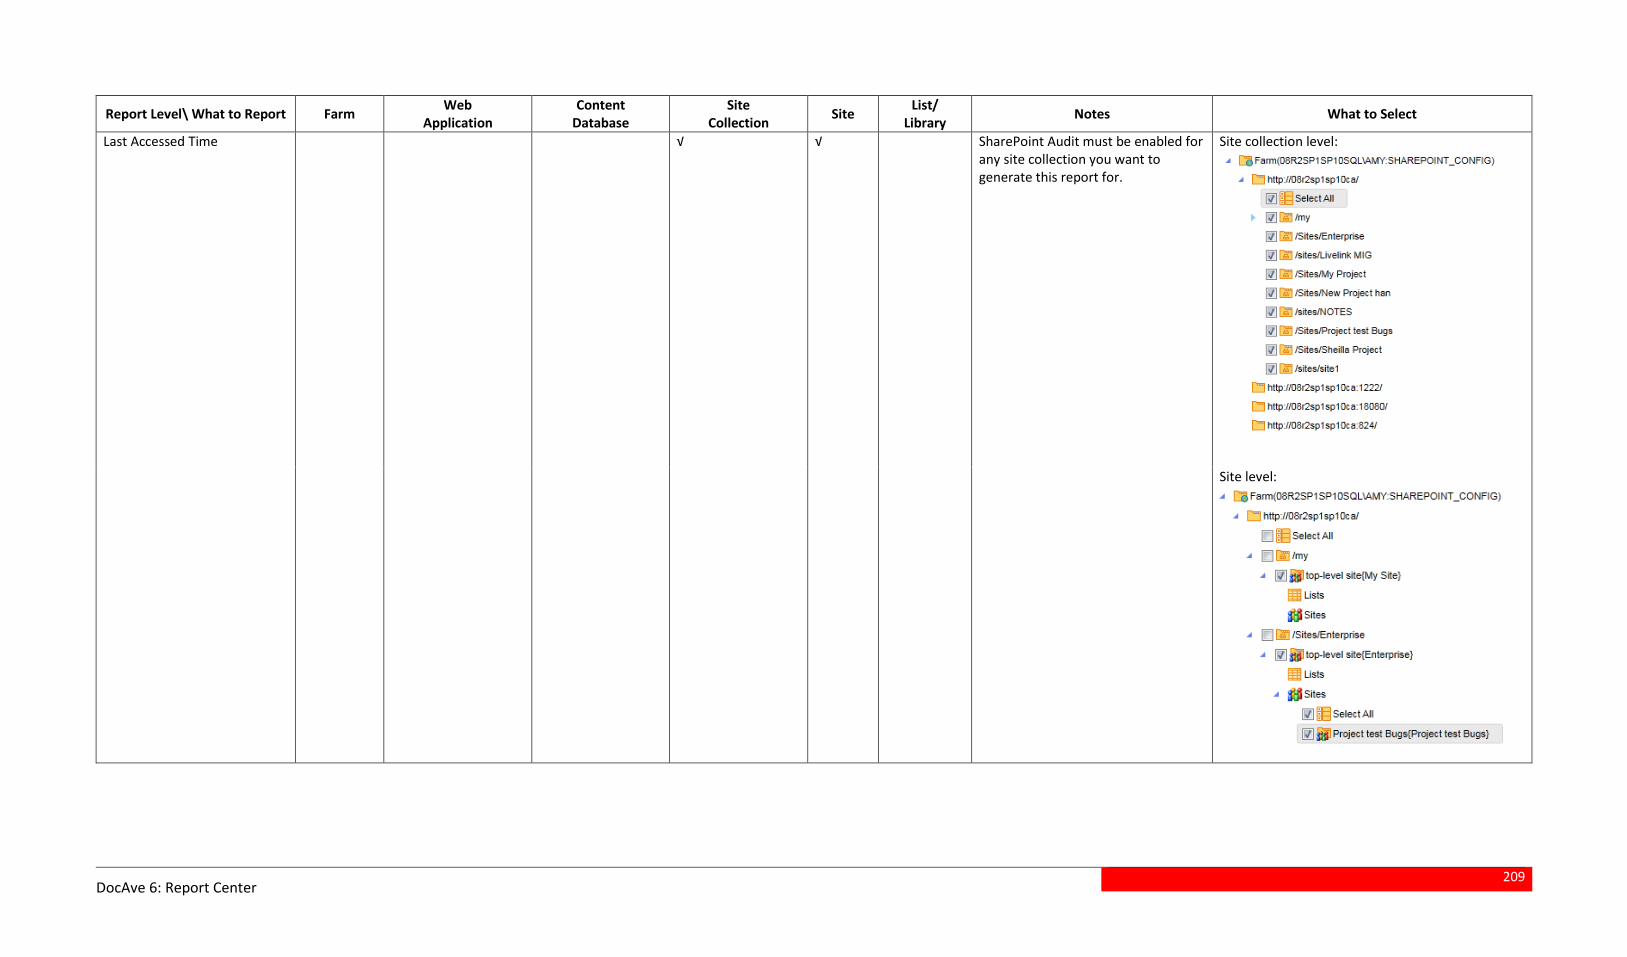
209
DocAve 6: Report Center
Report Level\ What to Report Farm Web
Application Content
Database Site
Collection Site
List/ Library
Notes What to Select
Last Accessed Time √ √ SharePoint Audit must be enabled for any site collection you want to generate this report for.
Site collection level:
Site level:
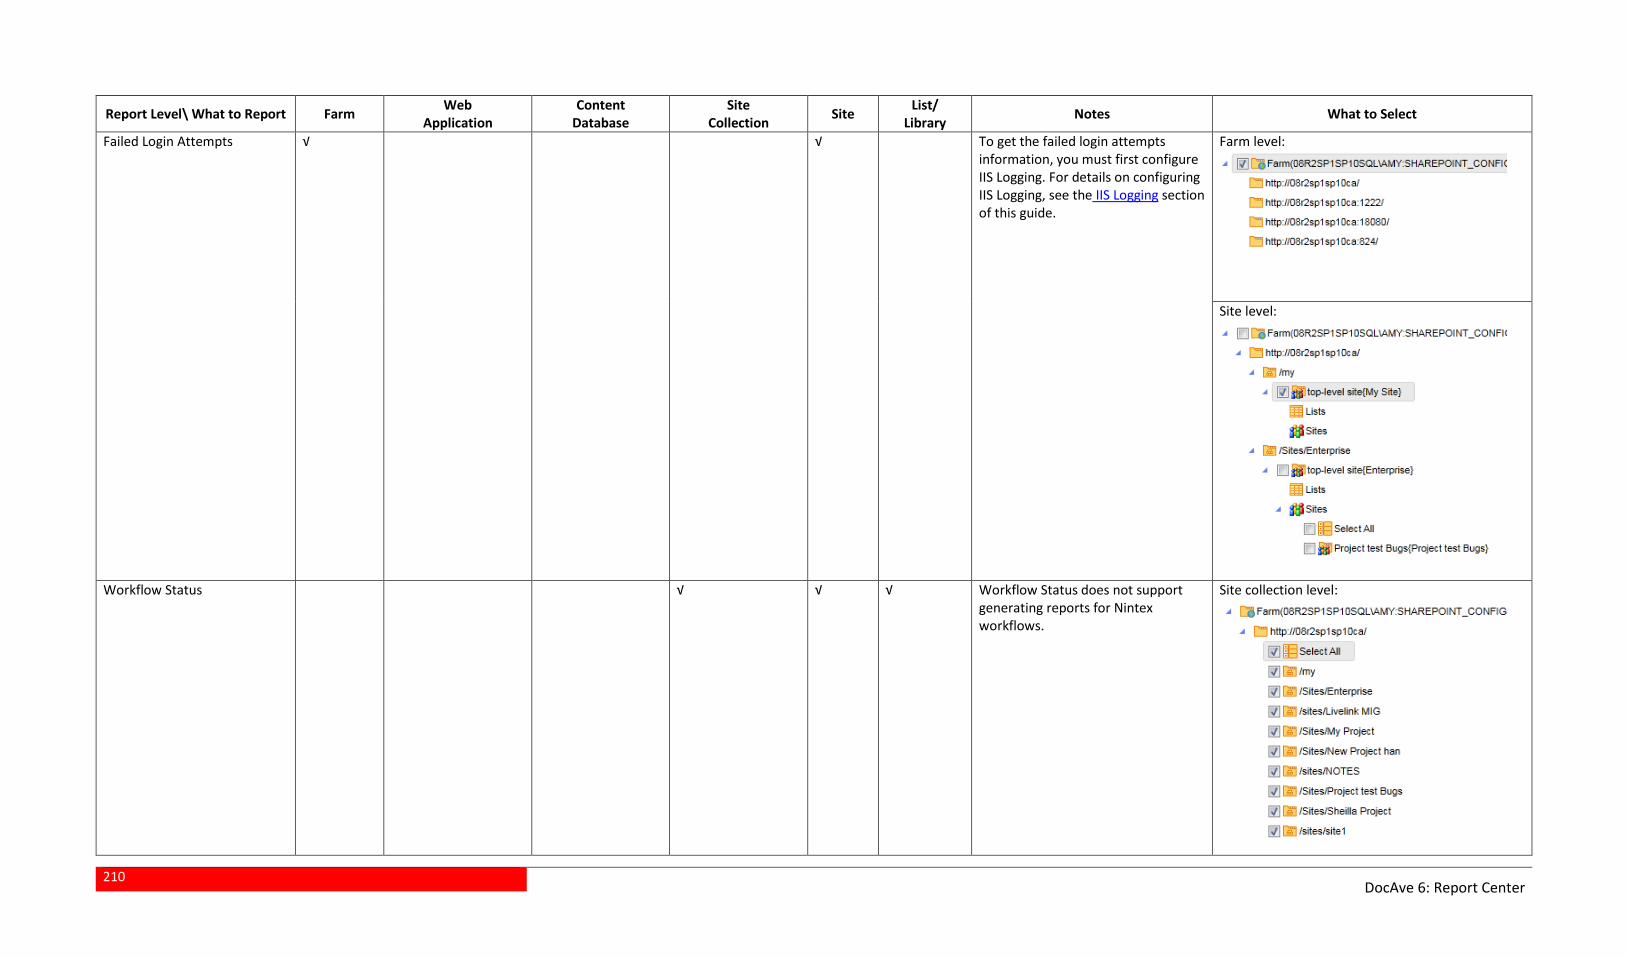
210
DocAve 6: Report Center
Report Level\ What to Report Farm Web
Application Content
Database Site
Collection Site
List/ Library
Notes What to Select
Failed Login Attempts √ √ To get the failed login attempts information, you must first configure IIS Logging. For details on configuring IIS Logging, see the IIS Logging section of this guide.
Farm level:
Site level:
Workflow Status √ √ √ Workflow Status does not support generating reports for Nintex workflows.
Site collection level:
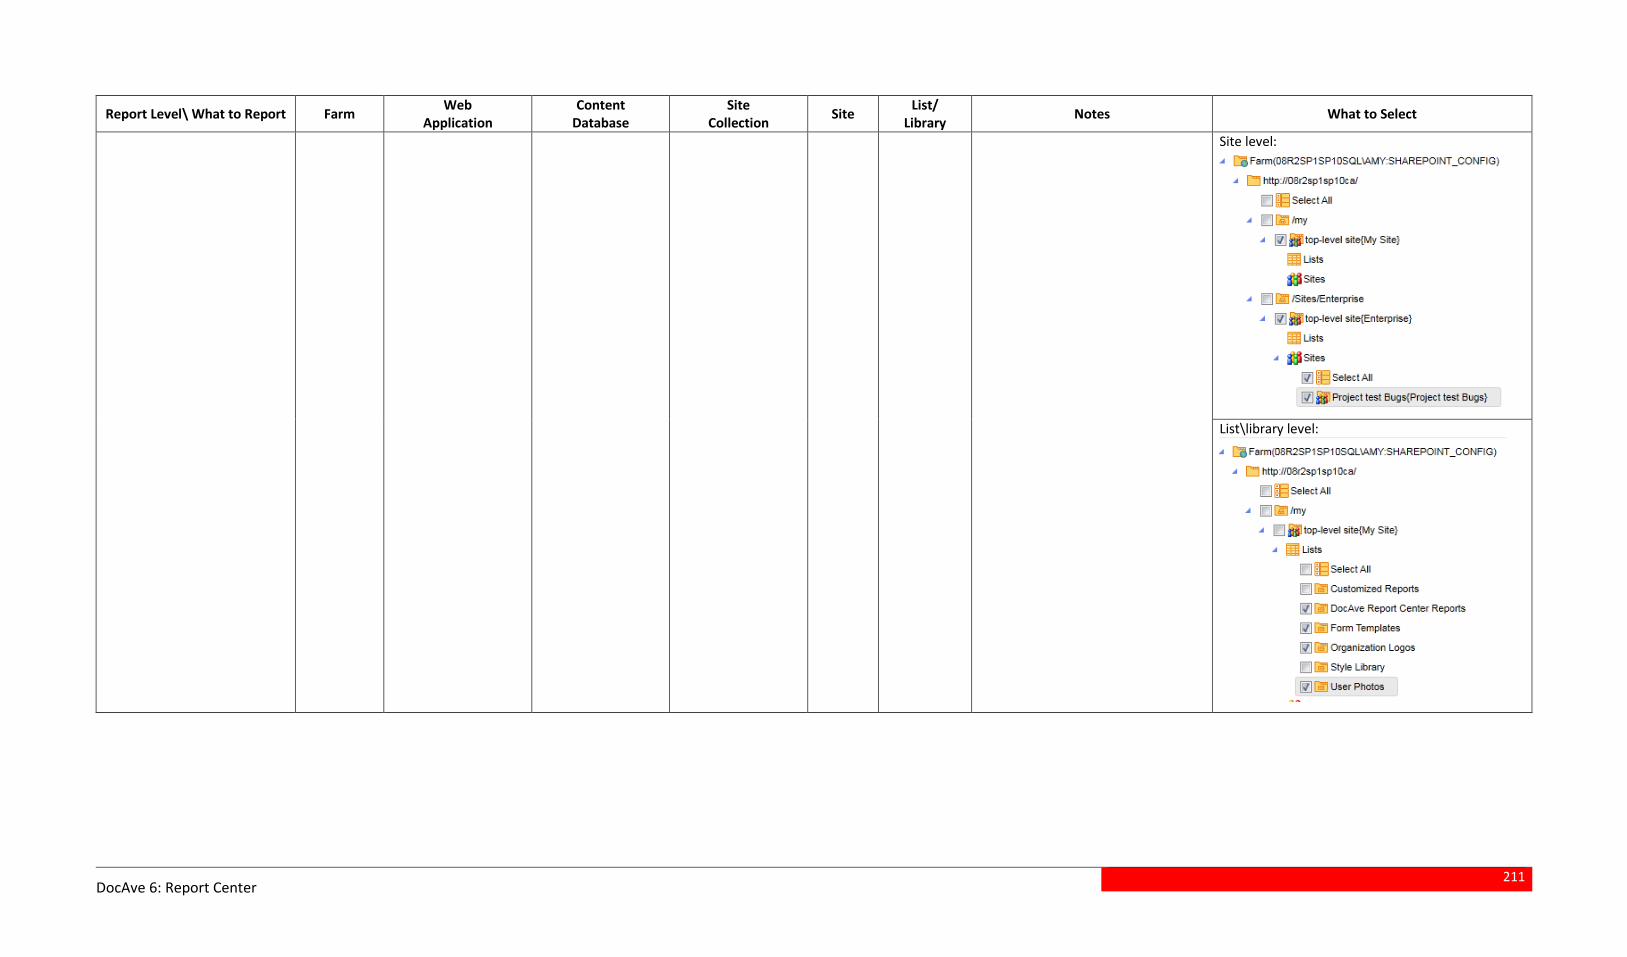
211
DocAve 6: Report Center
Report Level\ What to Report Farm Web
Application Content
Database Site
Collection Site
List/ Library
Notes What to Select
Site level:
List\library level:
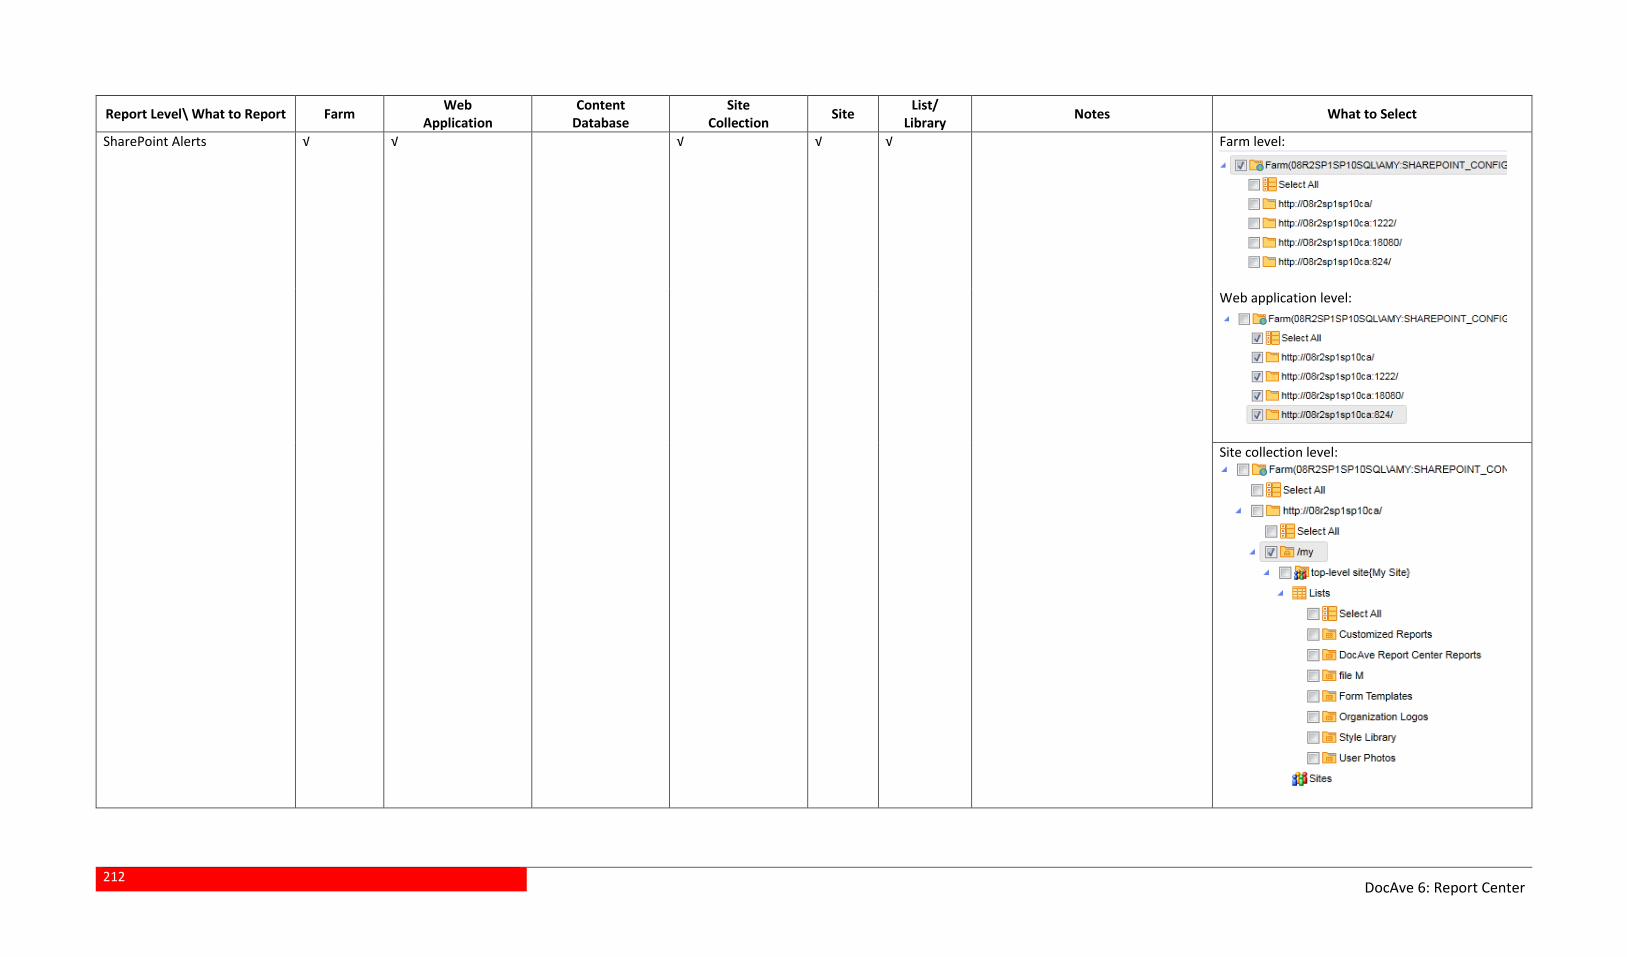
212
DocAve 6: Report Center
Report Level\ What to Report Farm Web
Application Content
Database Site
Collection Site
List/ Library
Notes What to Select
SharePoint Alerts √ √ √ √ √ Farm level:
Web application level:
Site collection level:
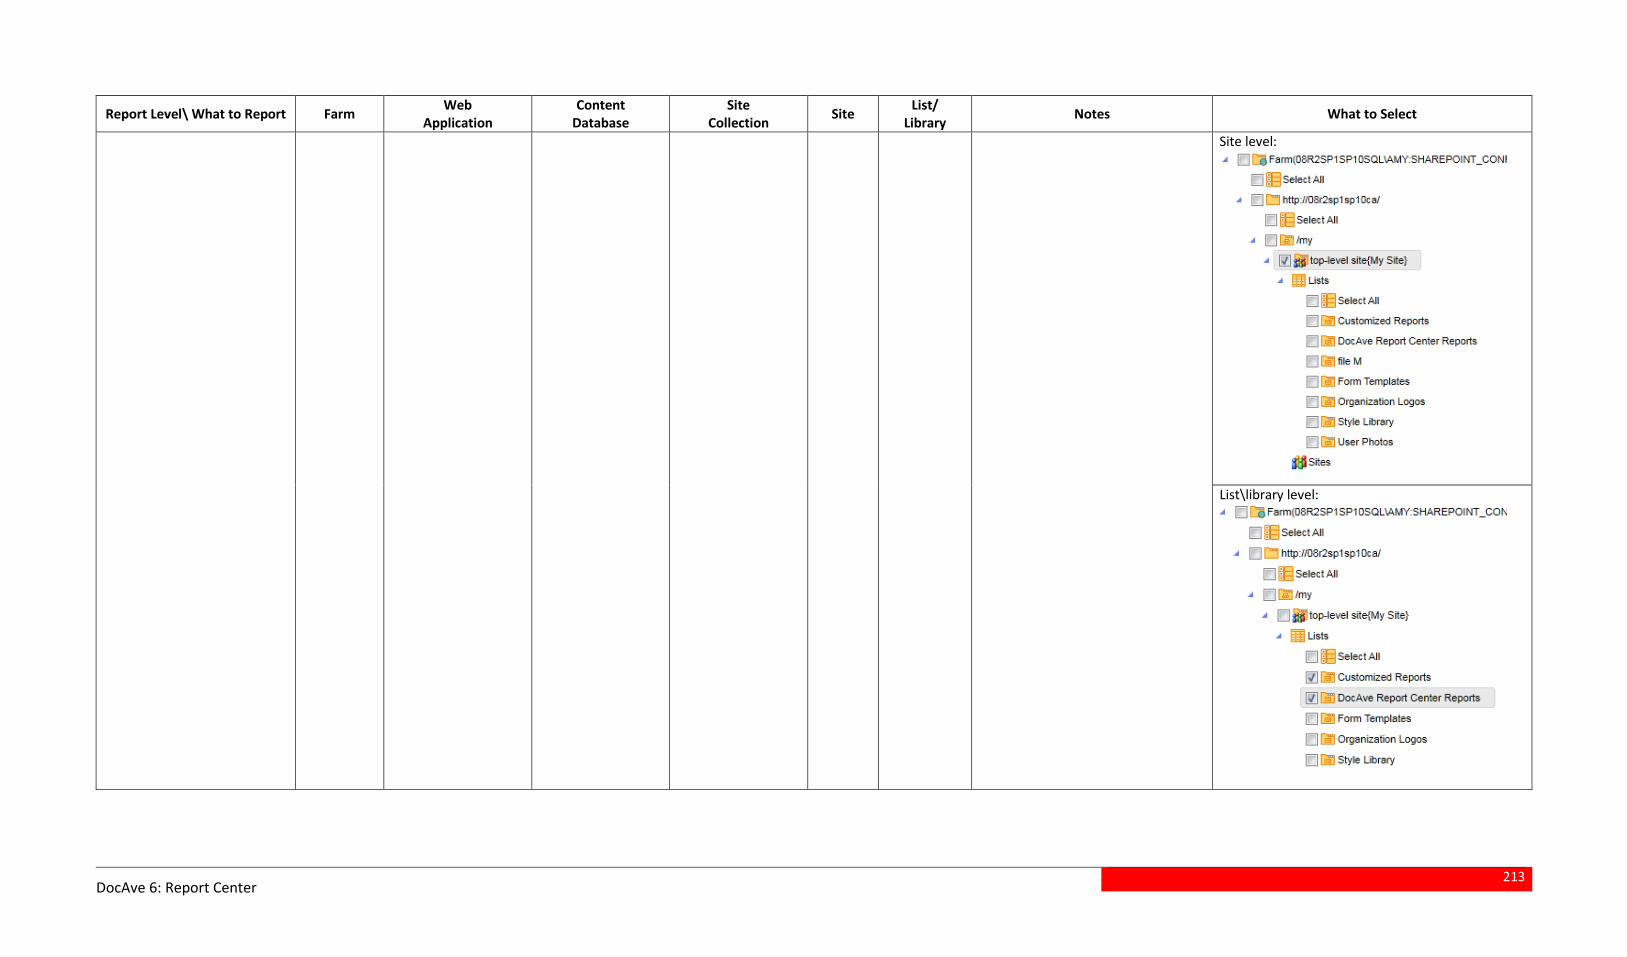
213
DocAve 6: Report Center
Report Level\ What to Report Farm Web
Application Content
Database Site
Collection Site
List/ Library
Notes What to Select
Site level:
List\library level:
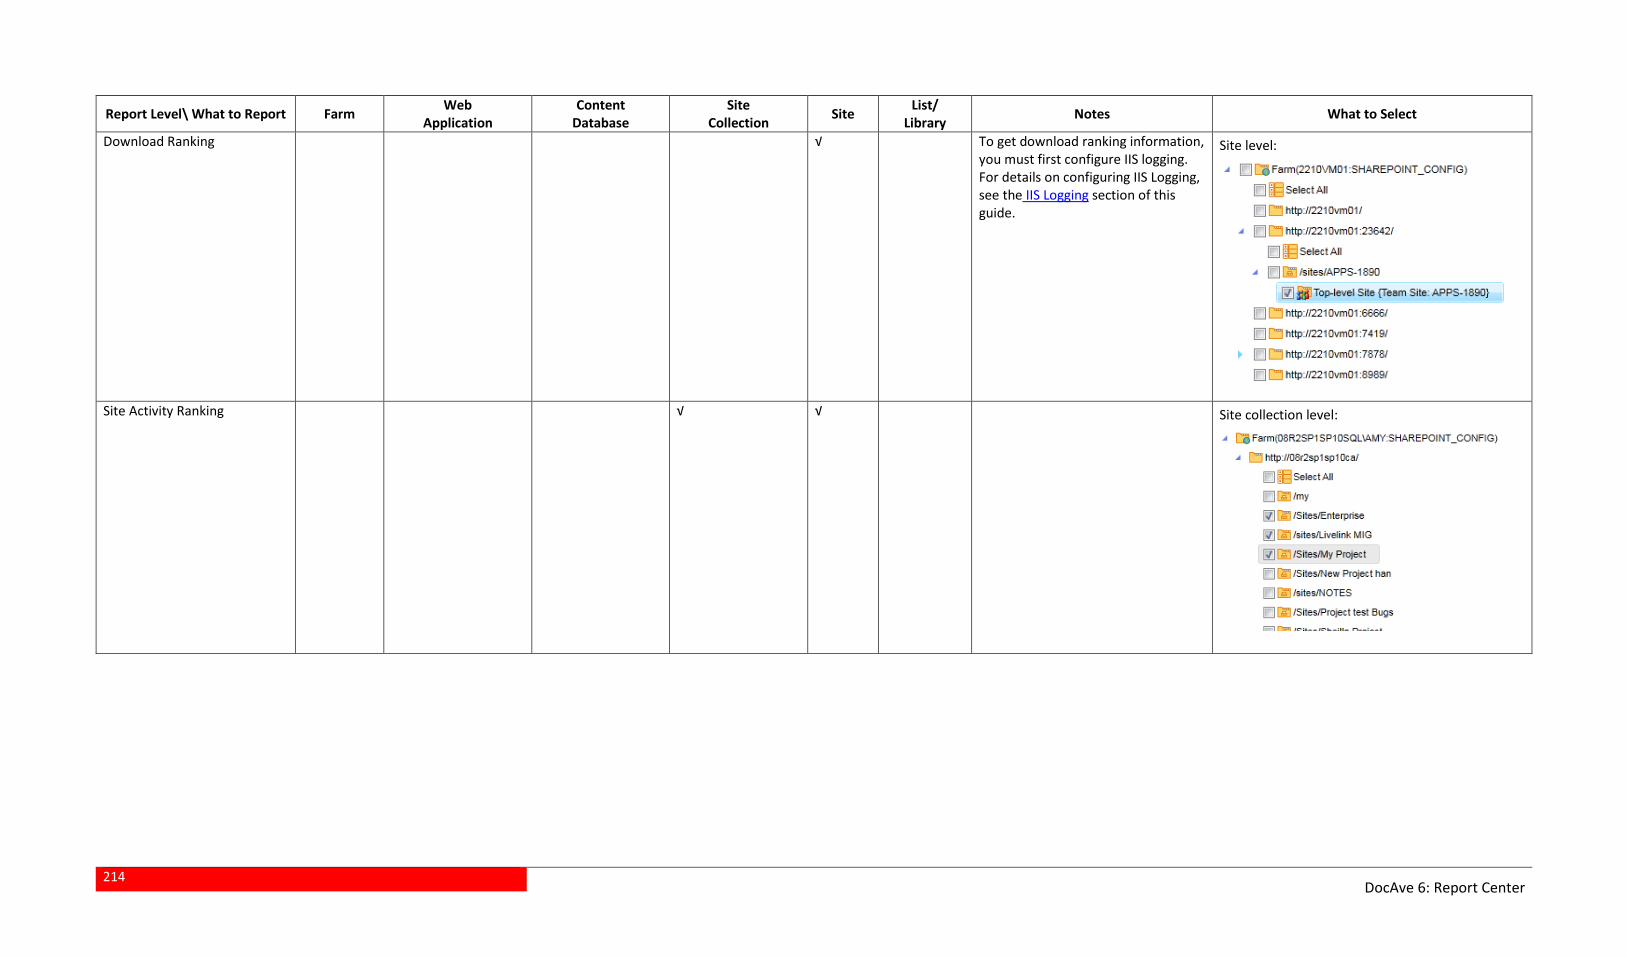
214
DocAve 6: Report Center
Report Level\ What to Report Farm Web
Application Content
Database Site
Collection Site
List/ Library
Notes What to Select
Download Ranking √ To get download ranking information, you must first configure IIS logging. For details on configuring IIS Logging, see the IIS Logging section of this guide.
Site level:
Site Activity Ranking √ √ Site collection level:
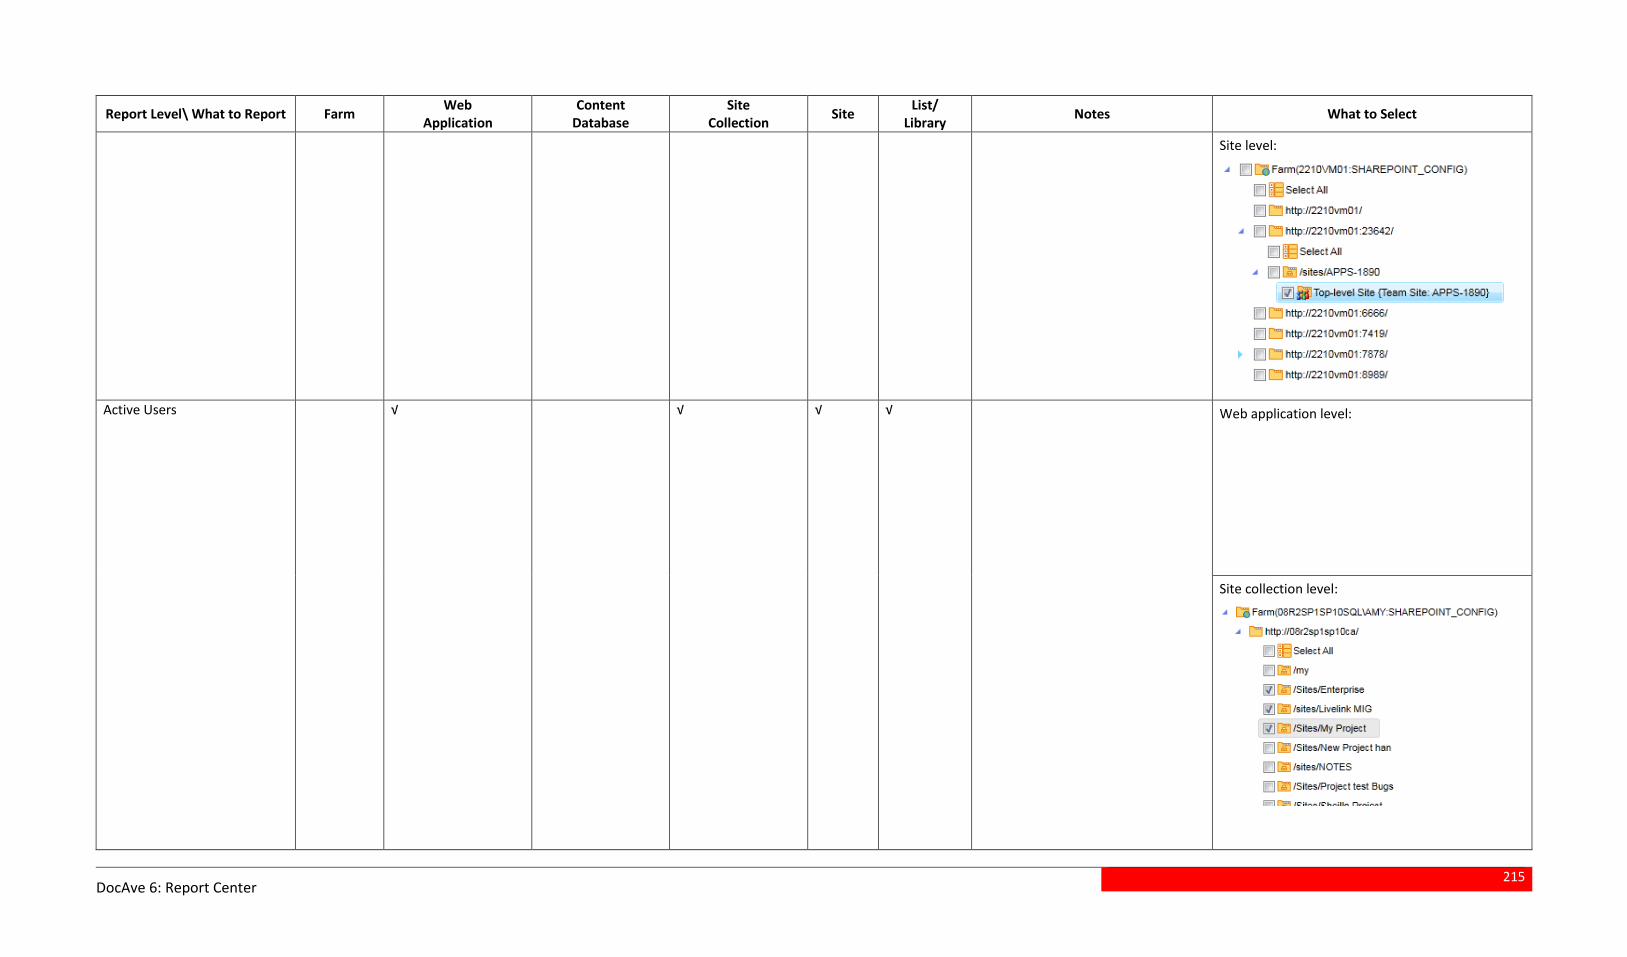
215
DocAve 6: Report Center
Report Level\ What to Report Farm Web
Application Content
Database Site
Collection Site
List/ Library
Notes What to Select
Site level:
Active Users √ √ √ √ Web application level:
Site collection level:
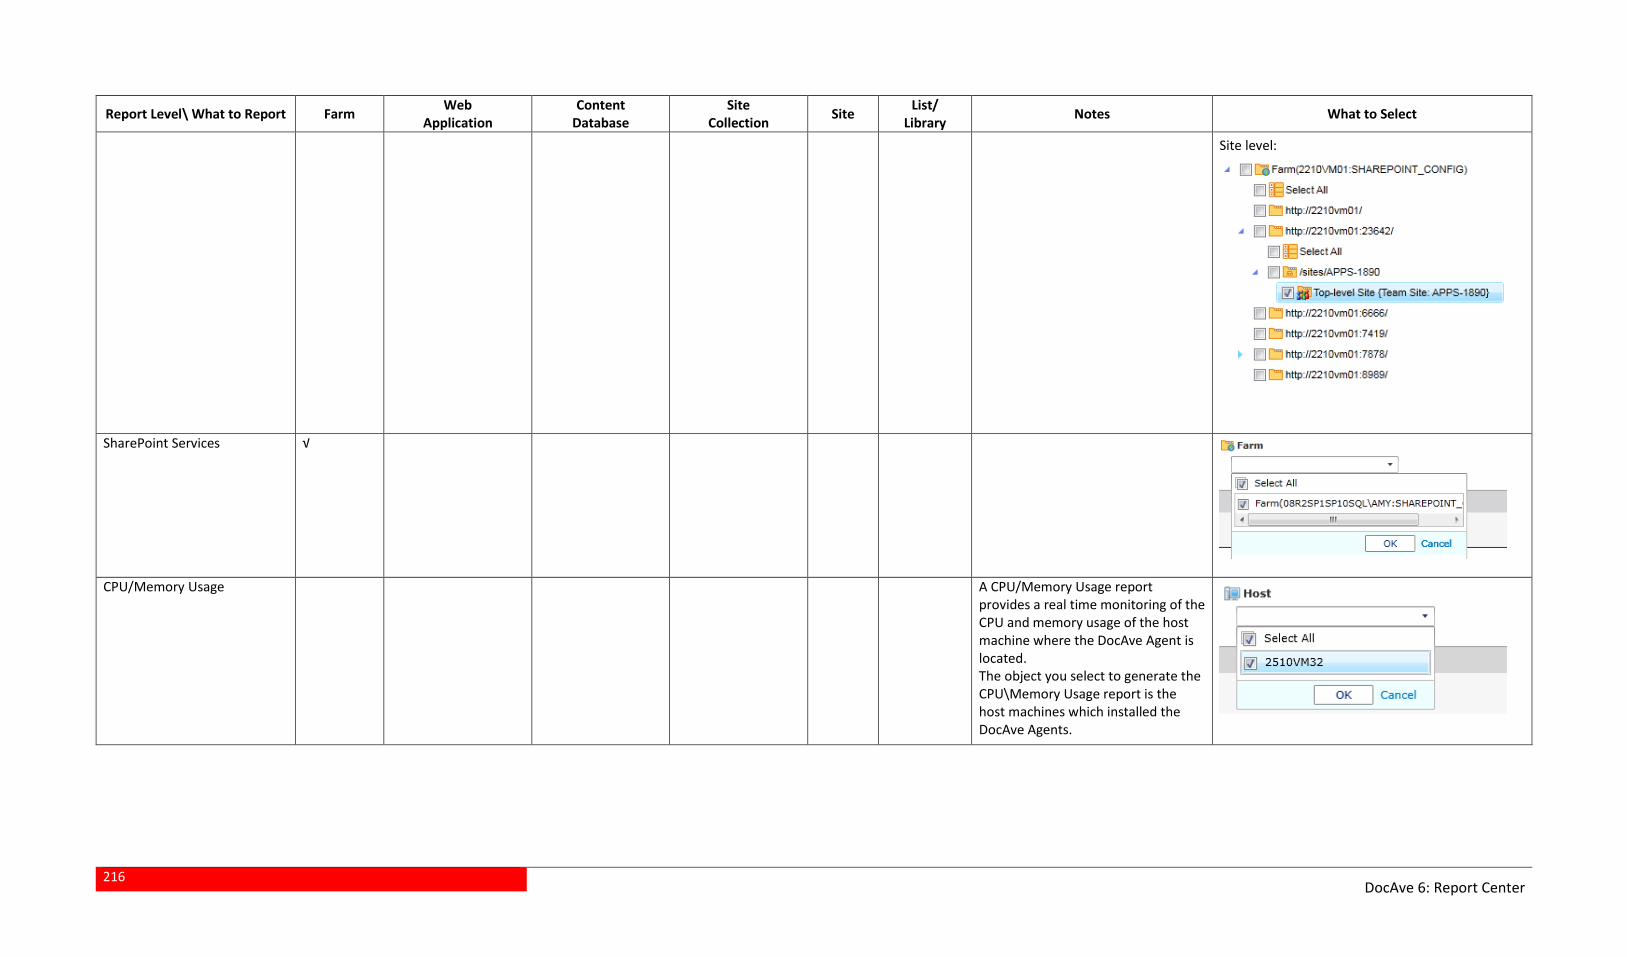
216
DocAve 6: Report Center
Report Level\ What to Report Farm Web
Application Content
Database Site
Collection Site
List/ Library
Notes What to Select
Site level:
SharePoint Services √
CPU/Memory Usage A CPU/Memory Usage report provides a real time monitoring of the CPU and memory usage of the host machine where the DocAve Agent is located. The object you select to generate the CPU\Memory Usage report is the host machines which installed the DocAve Agents.
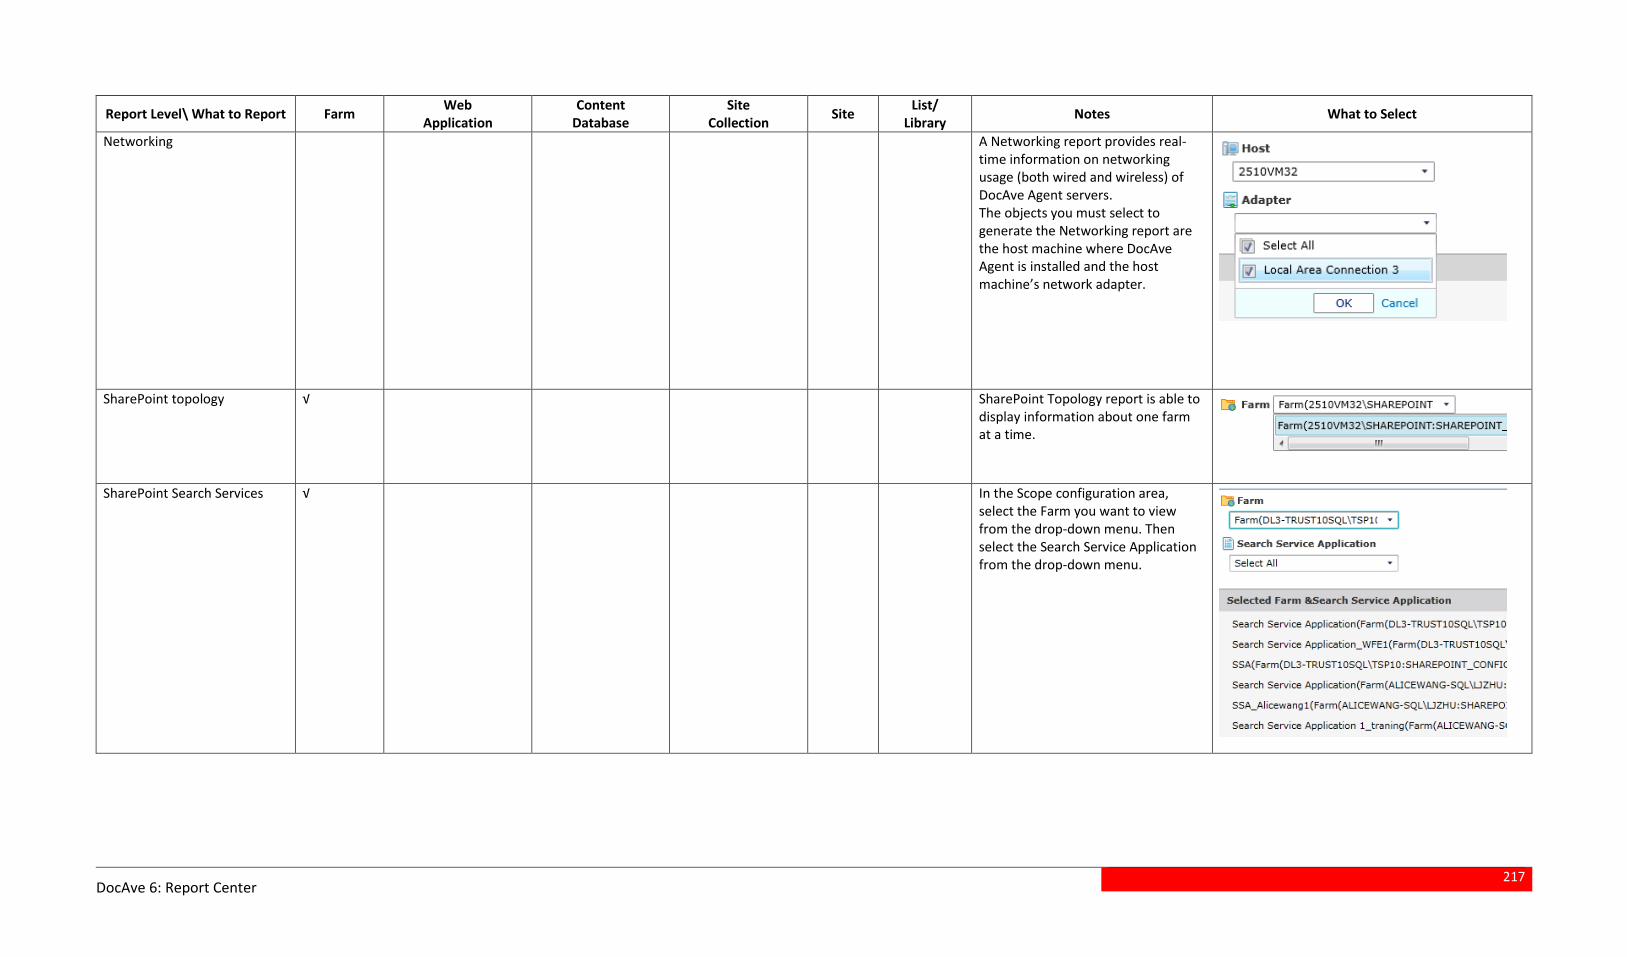
217
DocAve 6: Report Center
Report Level\ What to Report Farm Web
Application Content
Database Site
Collection Site
List/ Library
Notes What to Select
Networking A Networking report provides real-time information on networking usage (both wired and wireless) of DocAve Agent servers. The objects you must select to generate the Networking report are the host machine where DocAve Agent is installed and the host machine’s network adapter.
SharePoint topology √ SharePoint Topology report is able to display information about one farm at a time.
SharePoint Search Services √ In the Scope configuration area,
select the Farm you want to view from the drop-down menu. Then select the Search Service Application from the drop-down menu.
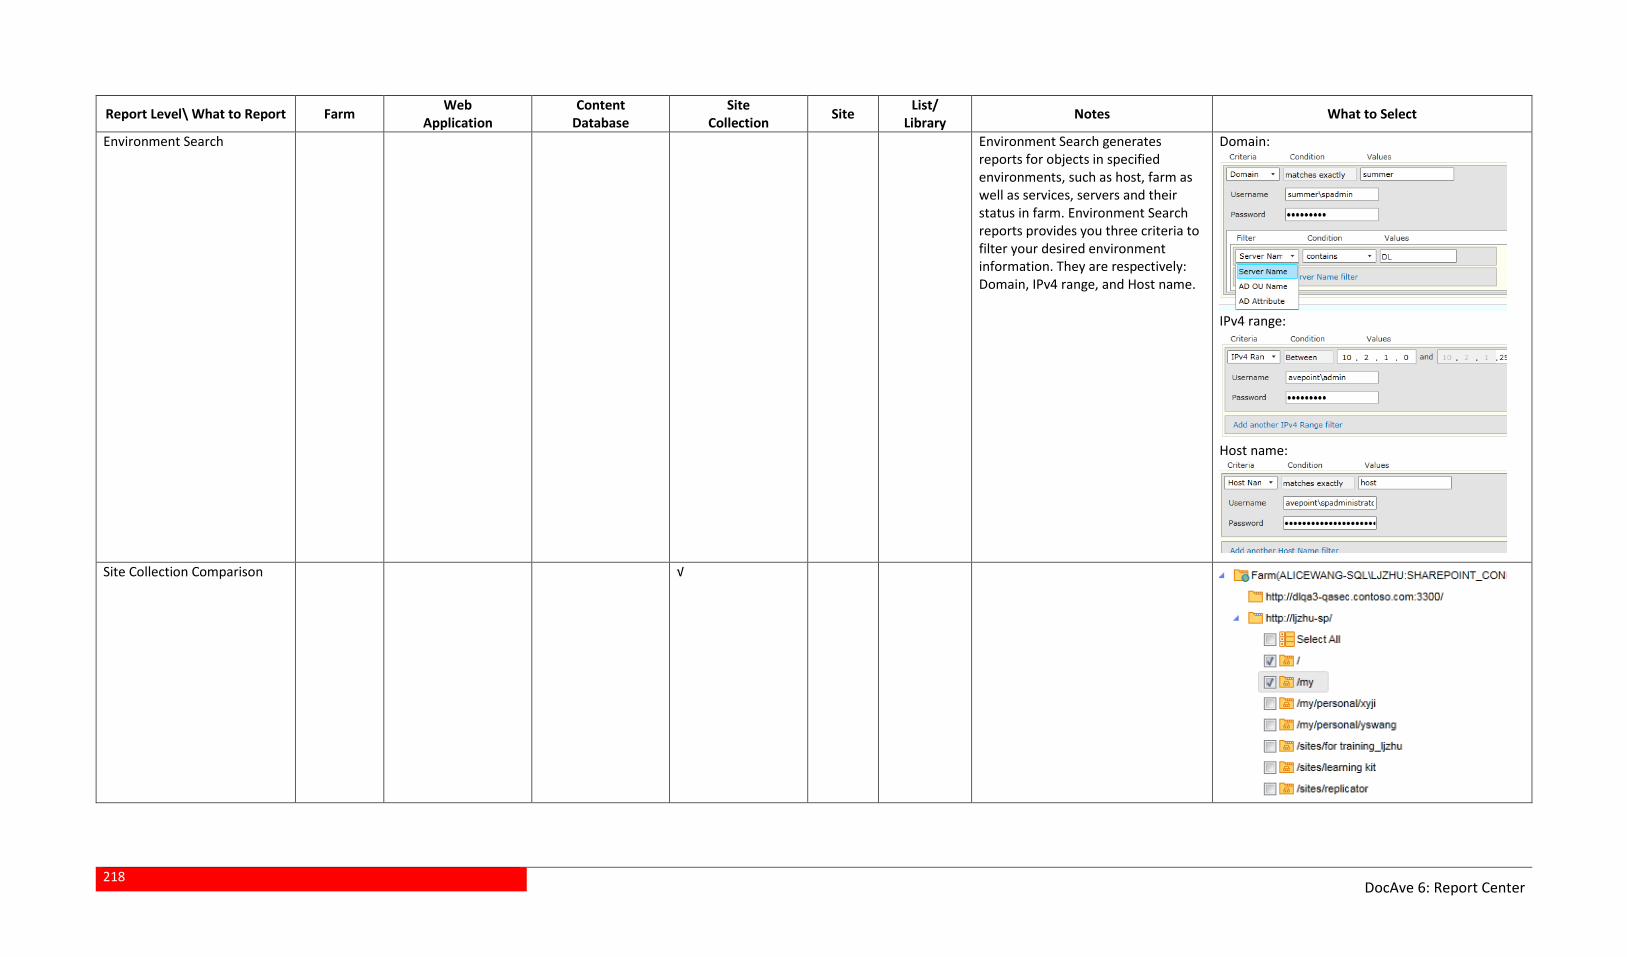
218
DocAve 6: Report Center
Report Level\ What to Report Farm Web
Application Content
Database Site
Collection Site
List/ Library
Notes What to Select
Environment Search Environment Search generates reports for objects in specified environments, such as host, farm as well as services, servers and their status in farm. Environment Search reports provides you three criteria to filter your desired environment information. They are respectively: Domain, IPv4 range, and Host name.
Domain:
IPv4 range:
Host name:
Site Collection Comparison √
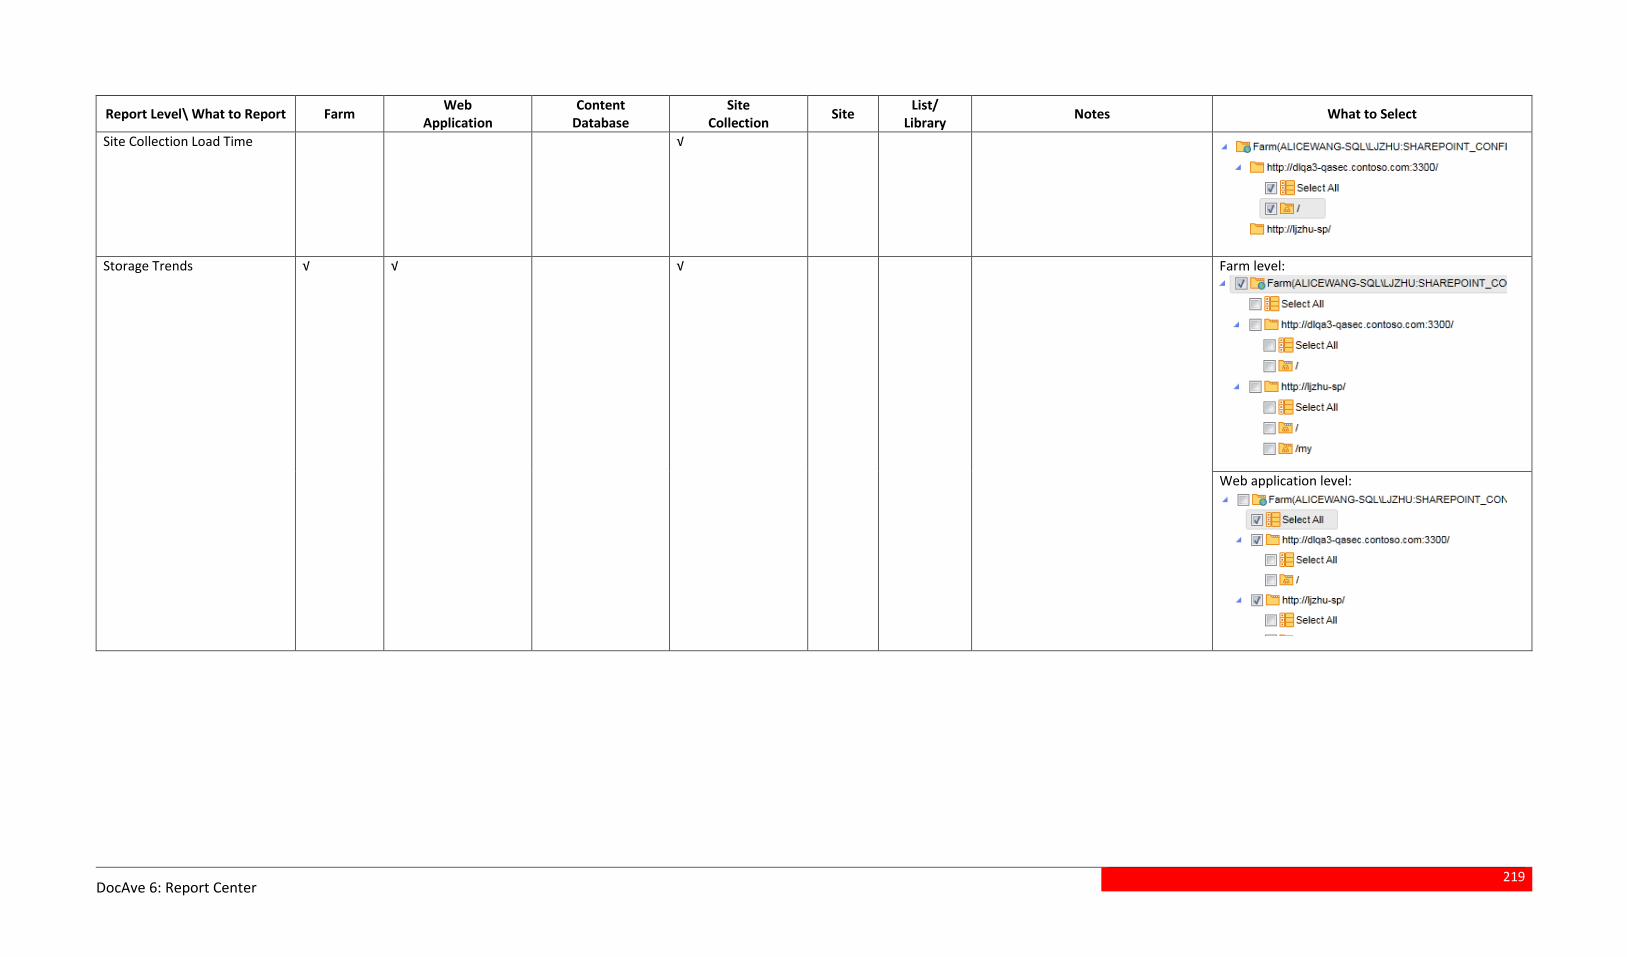
219
DocAve 6: Report Center
Report Level\ What to Report Farm Web
Application Content
Database Site
Collection Site
List/ Library
Notes What to Select
Site Collection Load Time √
Storage Trends √ √ √ Farm level:
Web application level:
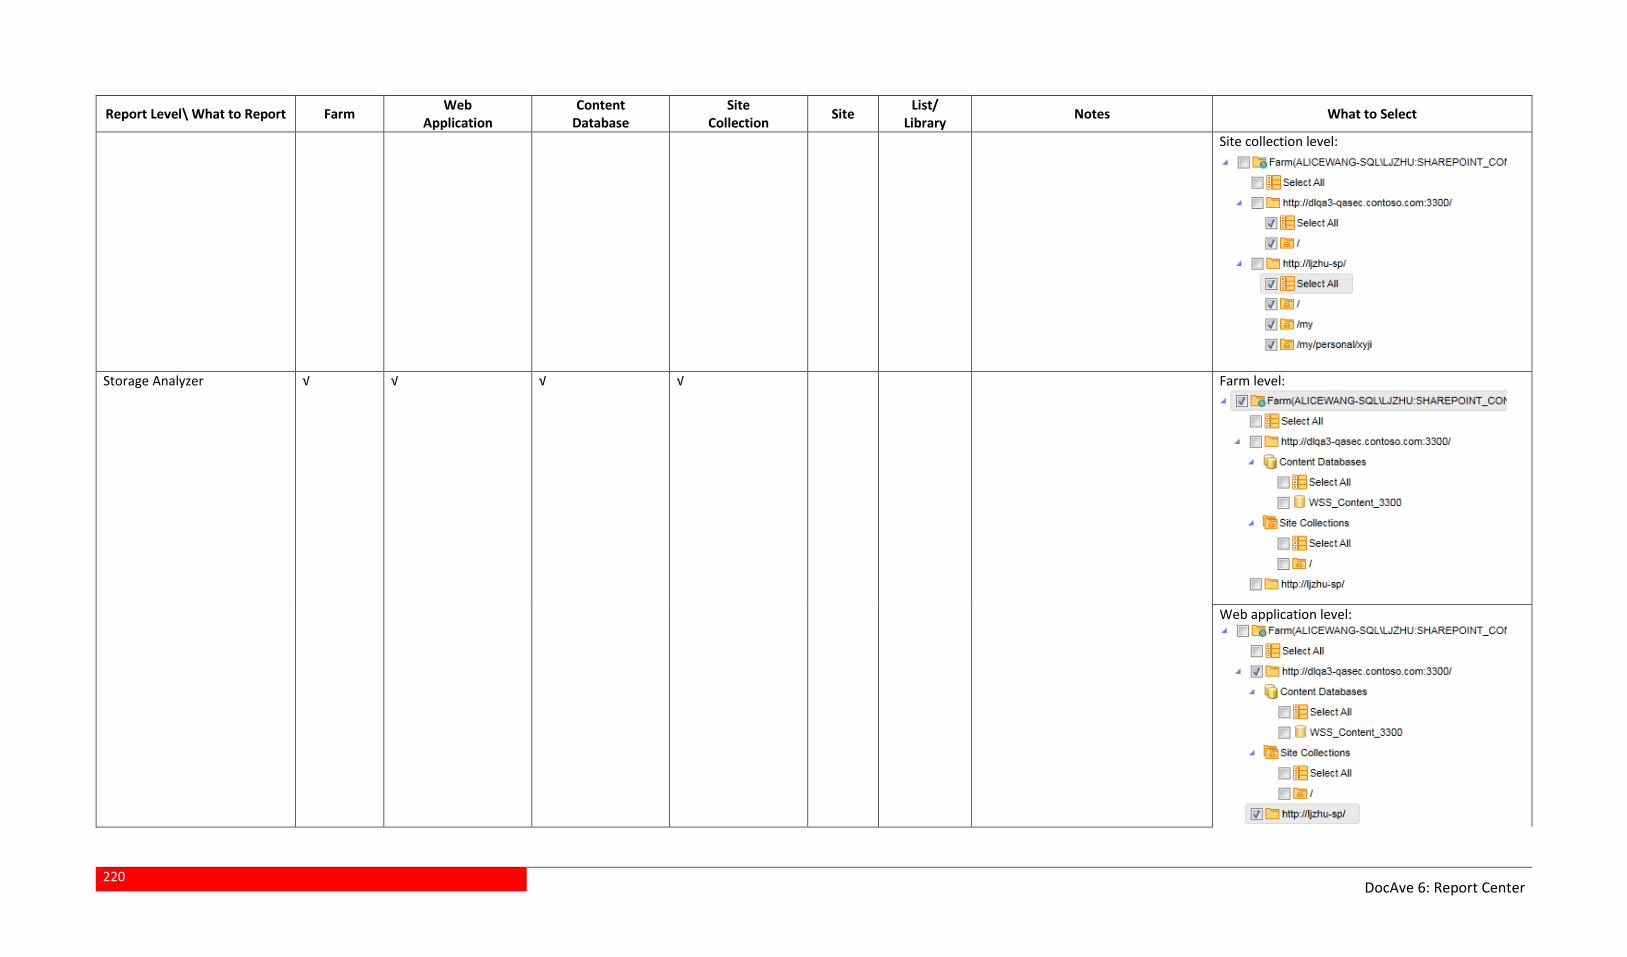
220
DocAve 6: Report Center
Report Level\ What to Report Farm Web
Application Content
Database Site
Collection Site
List/ Library
Notes What to Select
Site collection level:
Storage Analyzer √ √ √ √ Farm level:
Web application level:
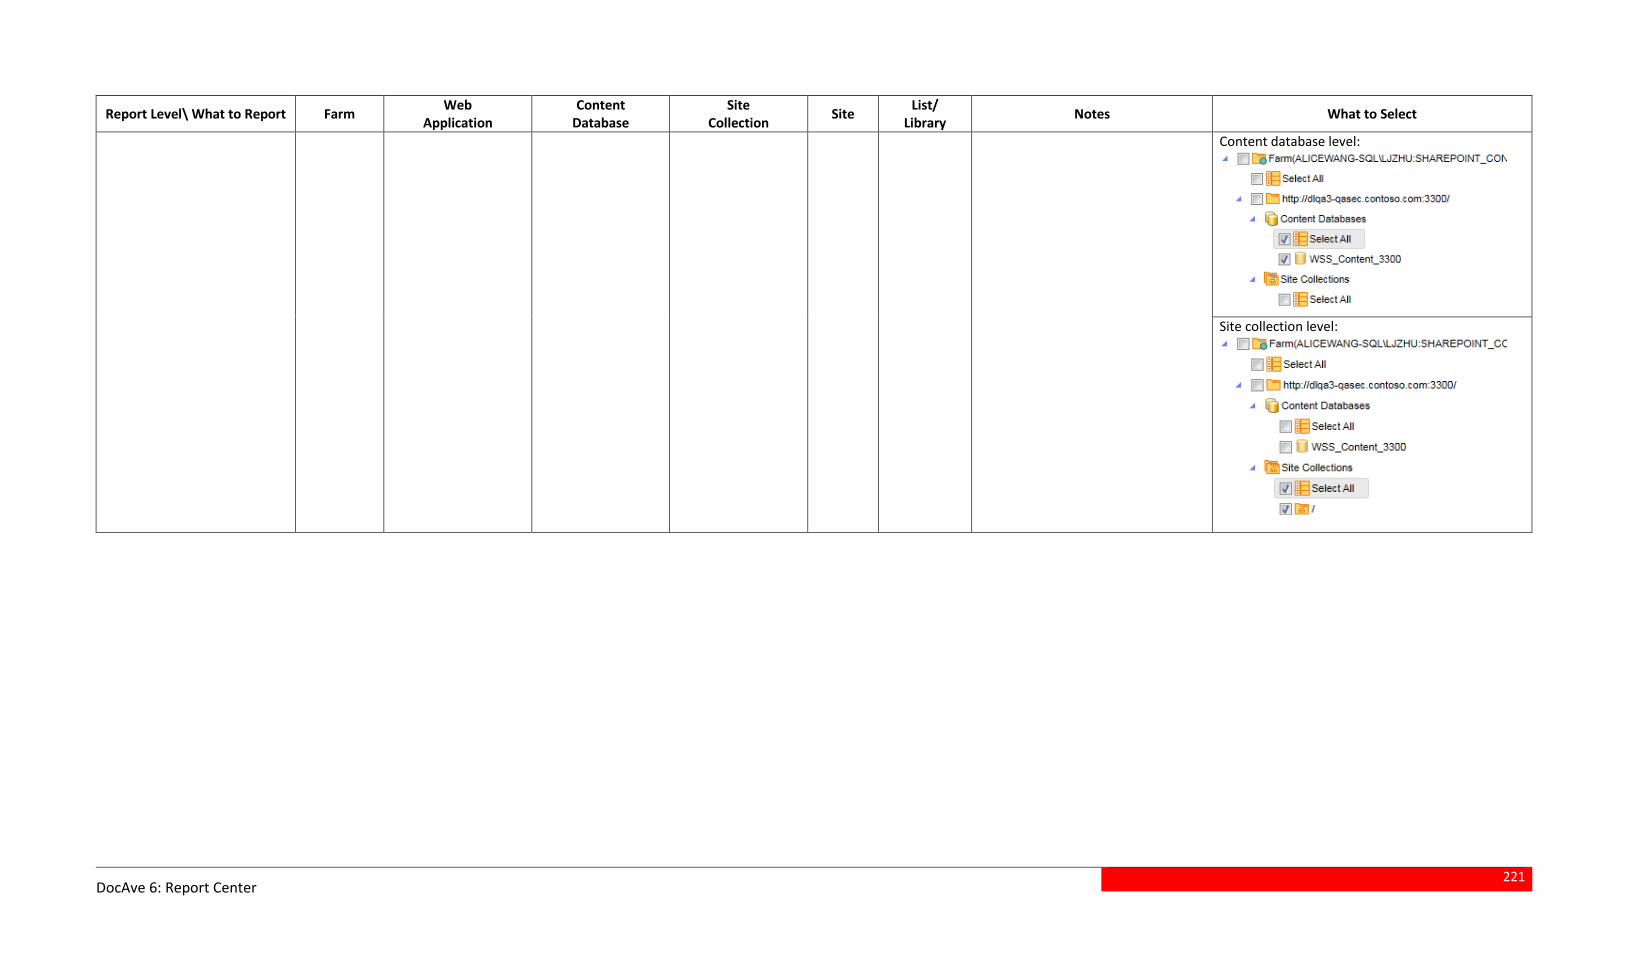
221
DocAve 6: Report Center
Report Level\ What to Report Farm Web
Application Content
Database Site
Collection Site
List/ Library
Notes What to Select
Content database level:
Site collection level:
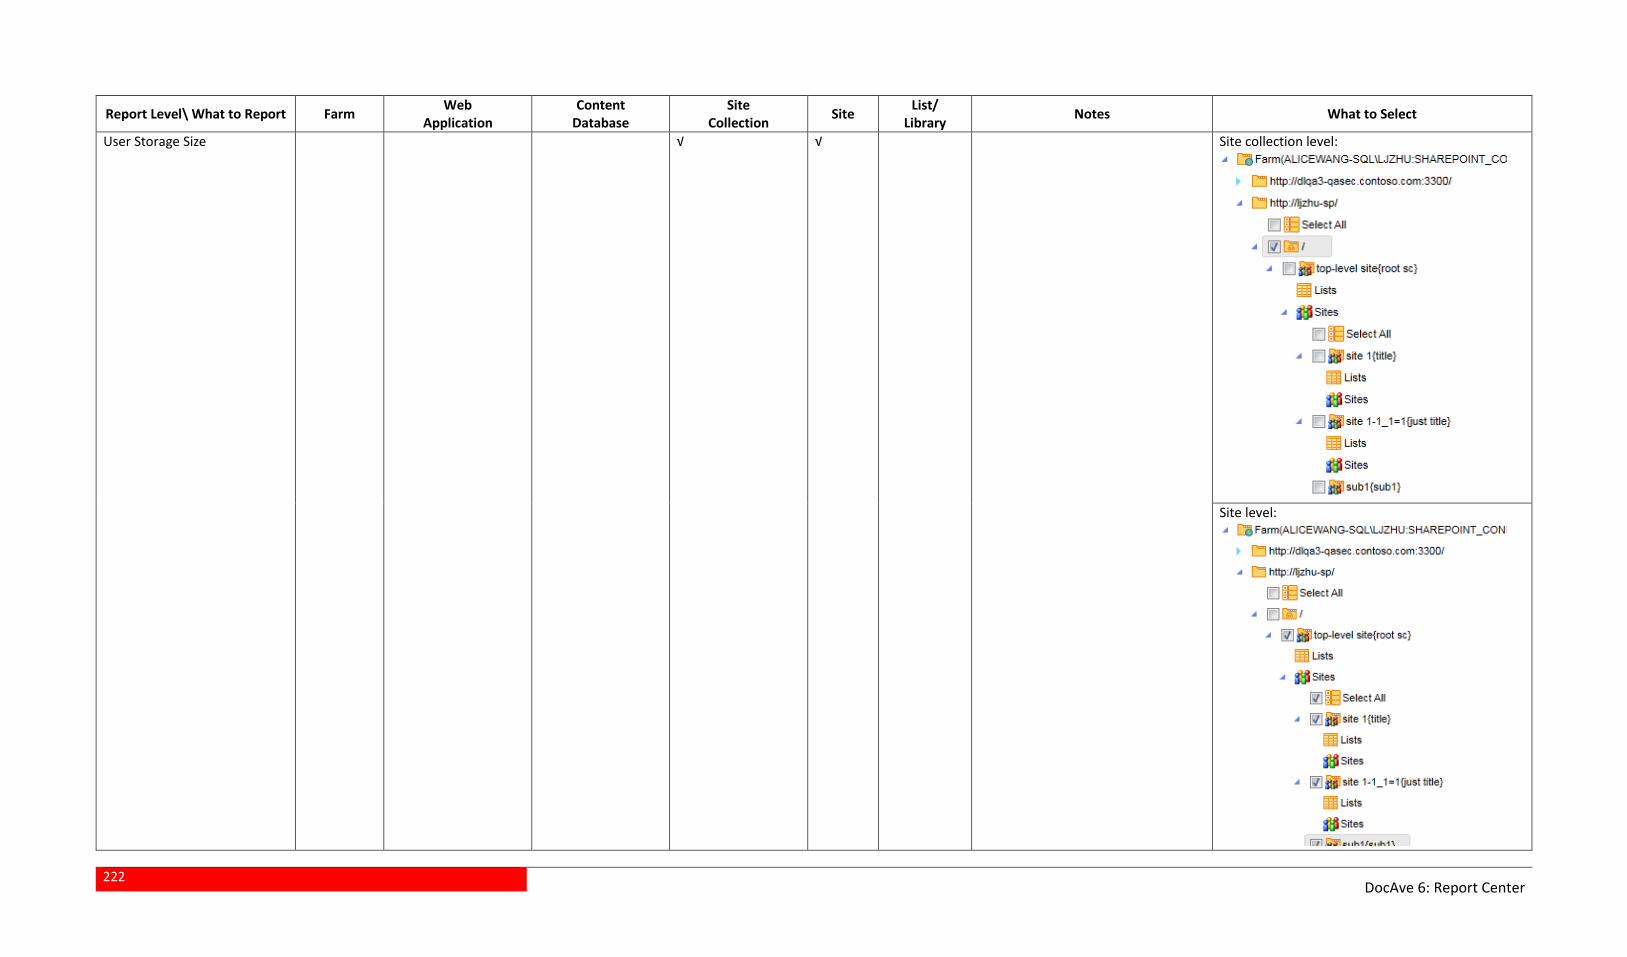
222
DocAve 6: Report Center
Report Level\ What to Report Farm Web
Application Content
Database Site
Collection Site
List/ Library
Notes What to Select
User Storage Size √ √ Site collection level:
Site level:
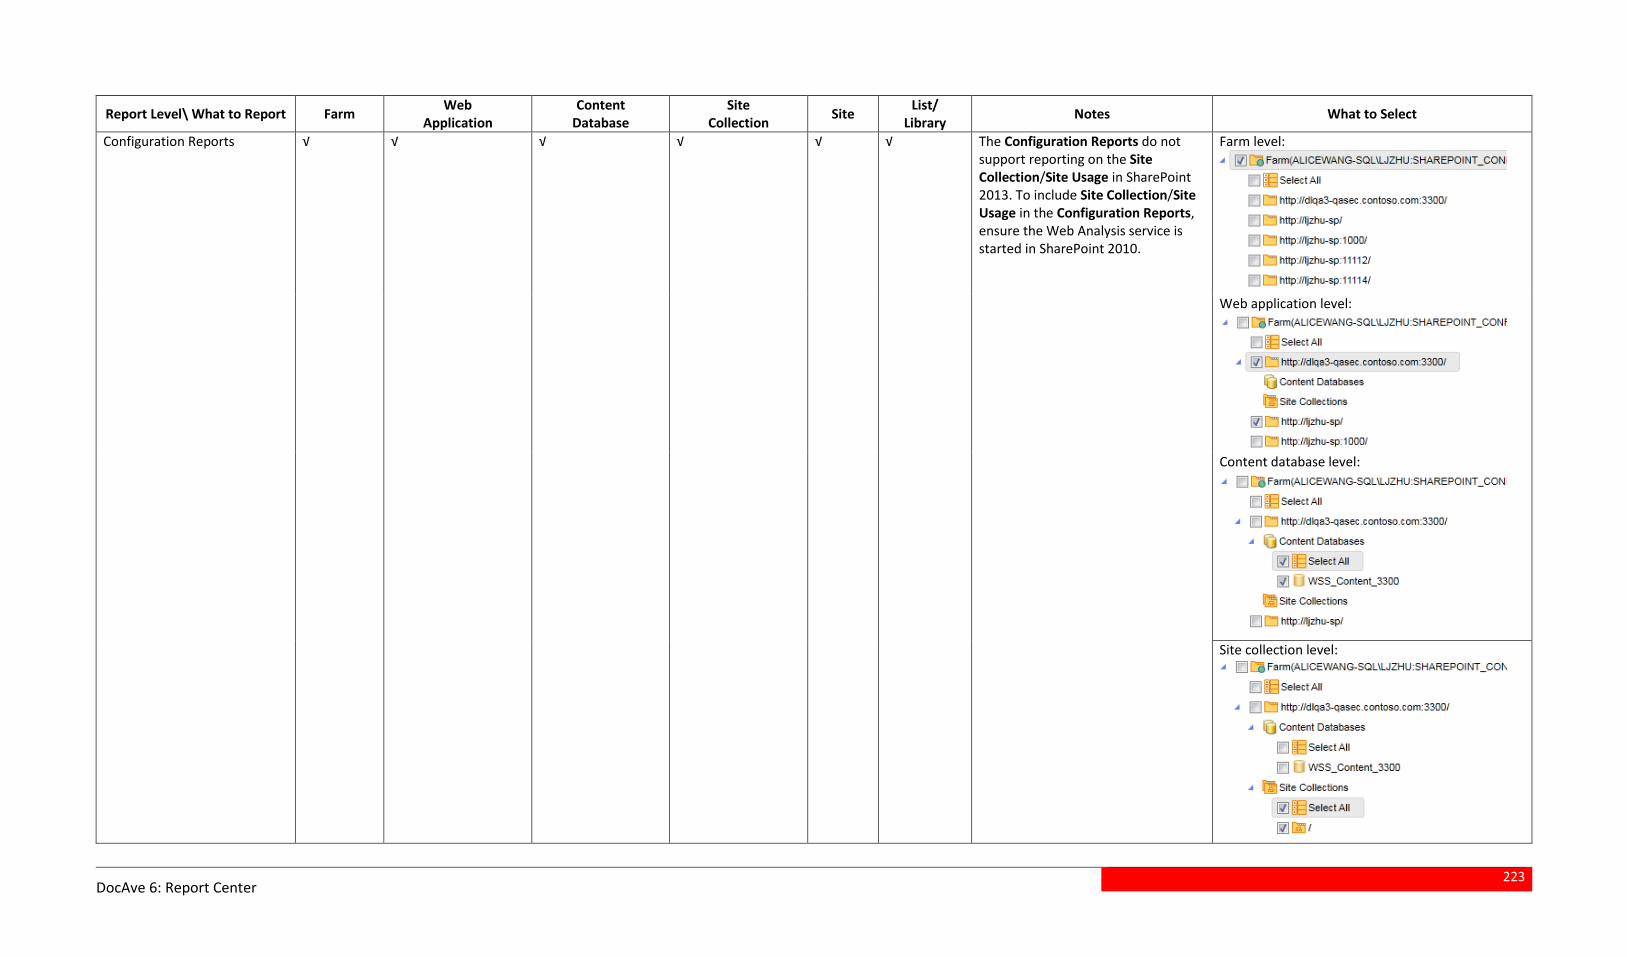
223
DocAve 6: Report Center
Report Level\ What to Report Farm Web
Application Content
Database Site
Collection Site
List/ Library
Notes What to Select
Configuration Reports √ √ √ √ √ √ The Configuration Reports do not support reporting on the Site Collection/Site Usage in SharePoint 2013. To include Site Collection/Site Usage in the Configuration Reports, ensure the Web Analysis service is started in SharePoint 2010.
Farm level:
Web application level:
Content database level:
Site collection level:
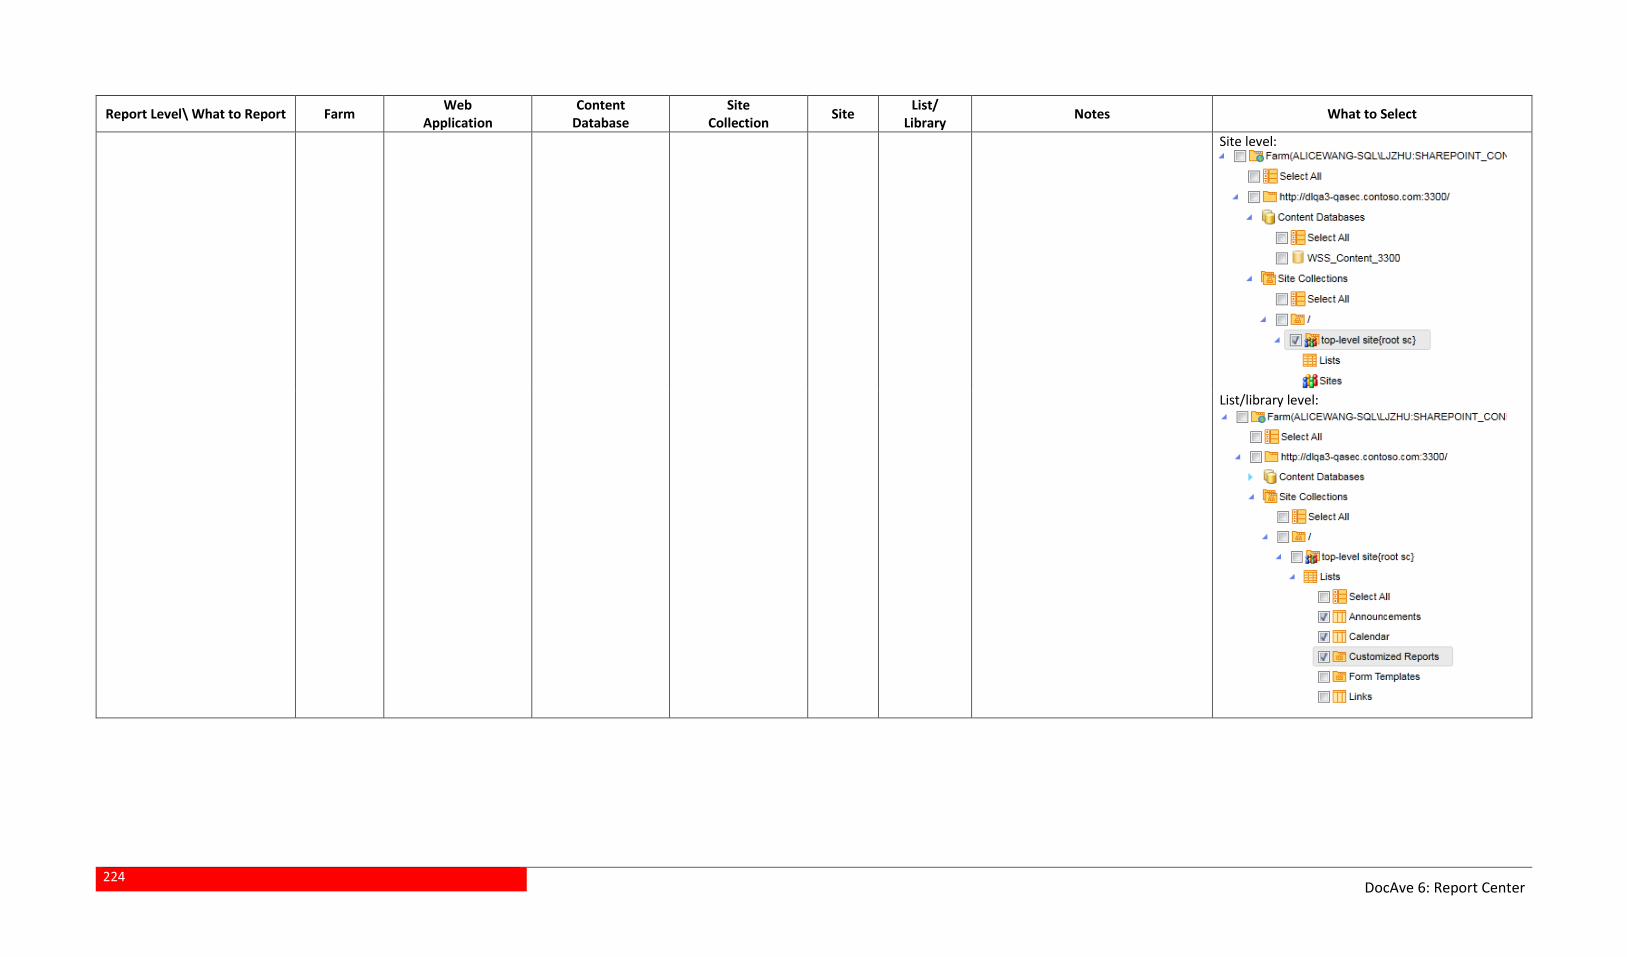
224
DocAve 6: Report Center
Report Level\ What to Report Farm Web
Application Content
Database Site
Collection Site
List/ Library
Notes What to Select
Site level:
List/library level:
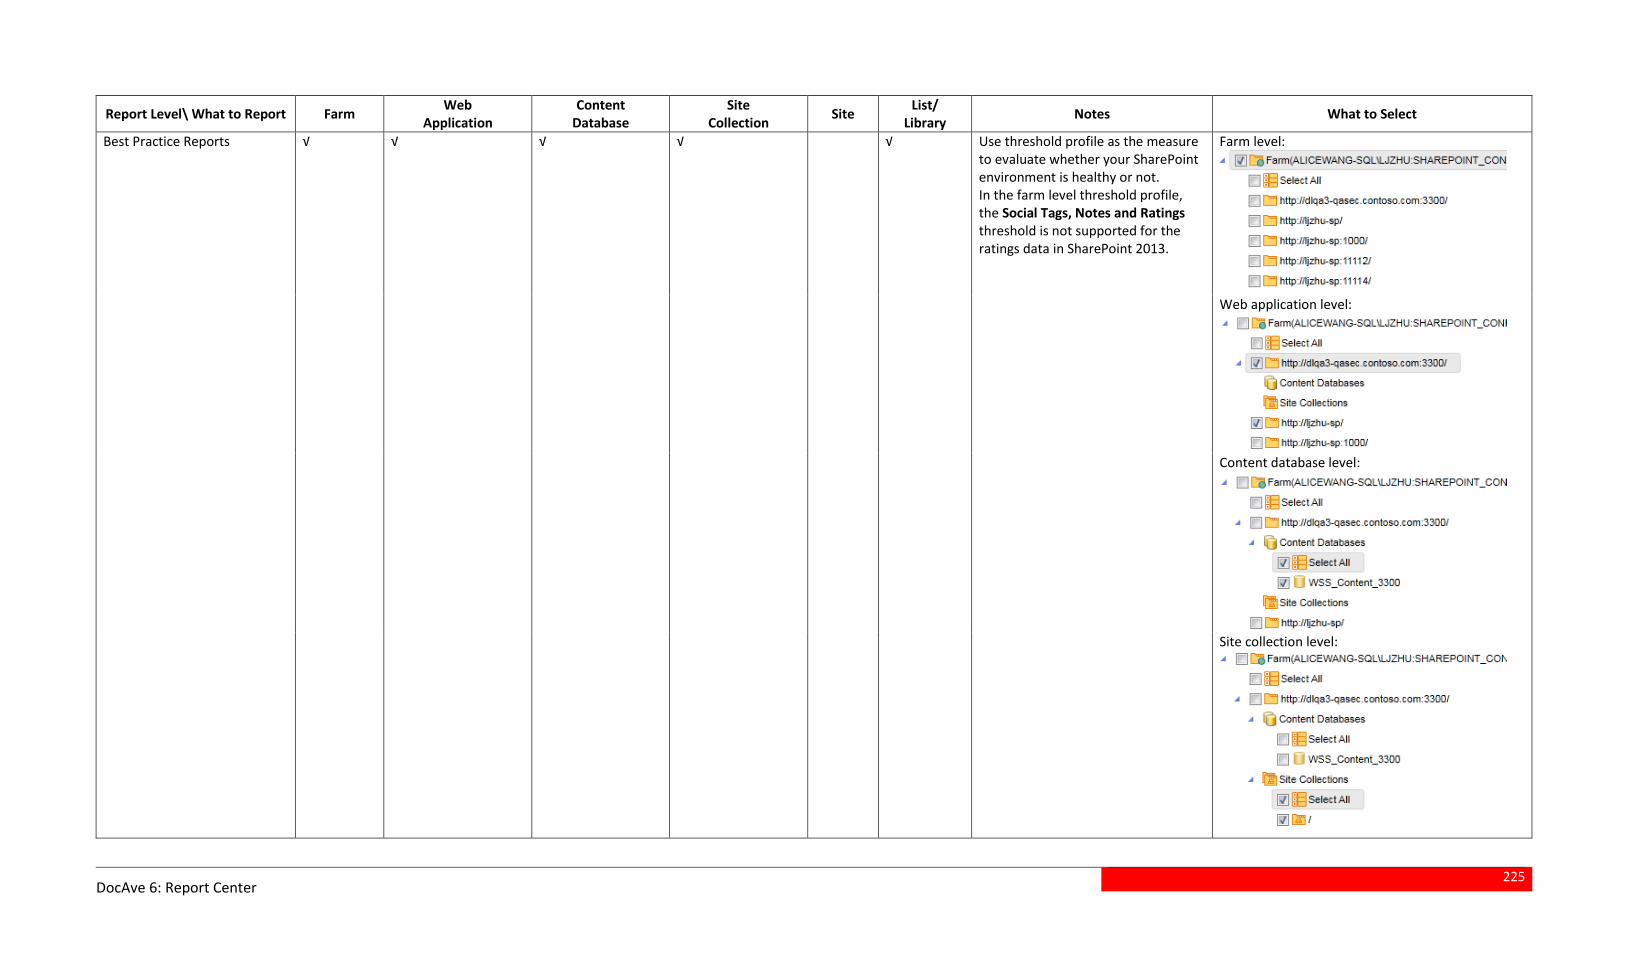
225
DocAve 6: Report Center
Report Level\ What to Report Farm Web
Application Content
Database Site
Collection Site
List/ Library
Notes What to Select
Best Practice Reports √ √ √ √ √ Use threshold profile as the measure to evaluate whether your SharePoint environment is healthy or not. In the farm level threshold profile, the Social Tags, Notes and Ratings threshold is not supported for the ratings data in SharePoint 2013.
Farm level:
Web application level:
Content database level:
Site collection level:

226
DocAve 6: Report Center
Report Level\ What to Report Farm Web
Application Content
Database Site
Collection Site
List/ Library
Notes What to Select
Site level:
List/library level:
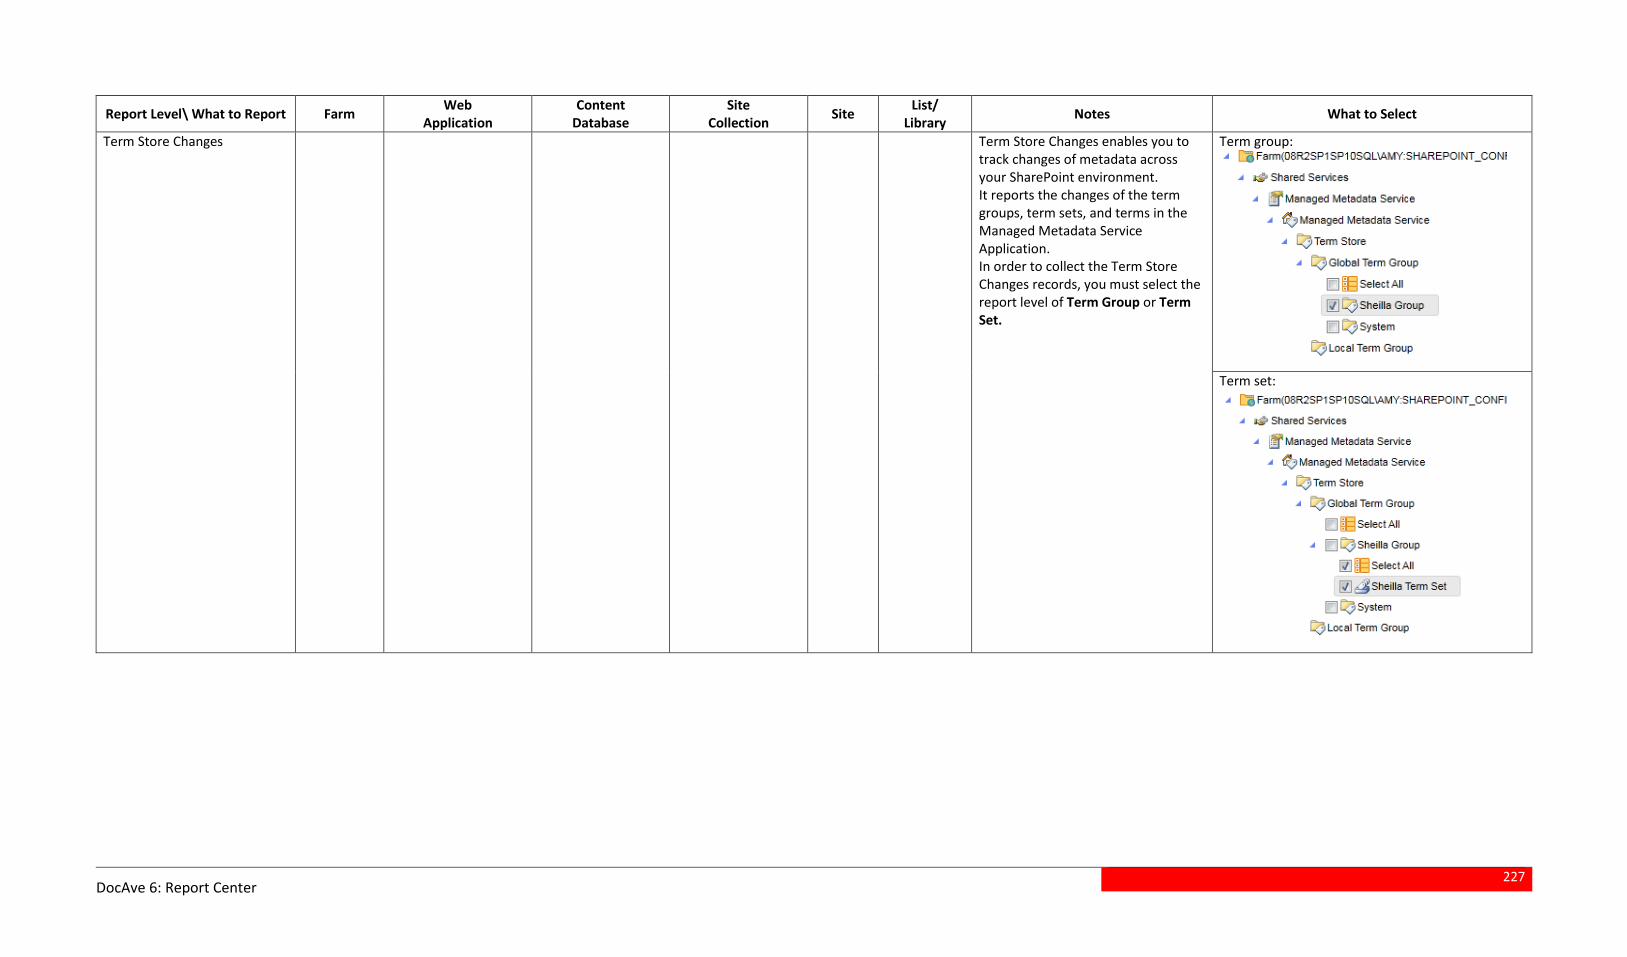
227
DocAve 6: Report Center
Report Level\ What to Report Farm Web
Application Content
Database Site
Collection Site
List/ Library
Notes What to Select
Term Store Changes Term Store Changes enables you to track changes of metadata across your SharePoint environment. It reports the changes of the term groups, term sets, and terms in the Managed Metadata Service Application. In order to collect the Term Store Changes records, you must select the report level of Term Group or Term Set.
Term group:
Term set:
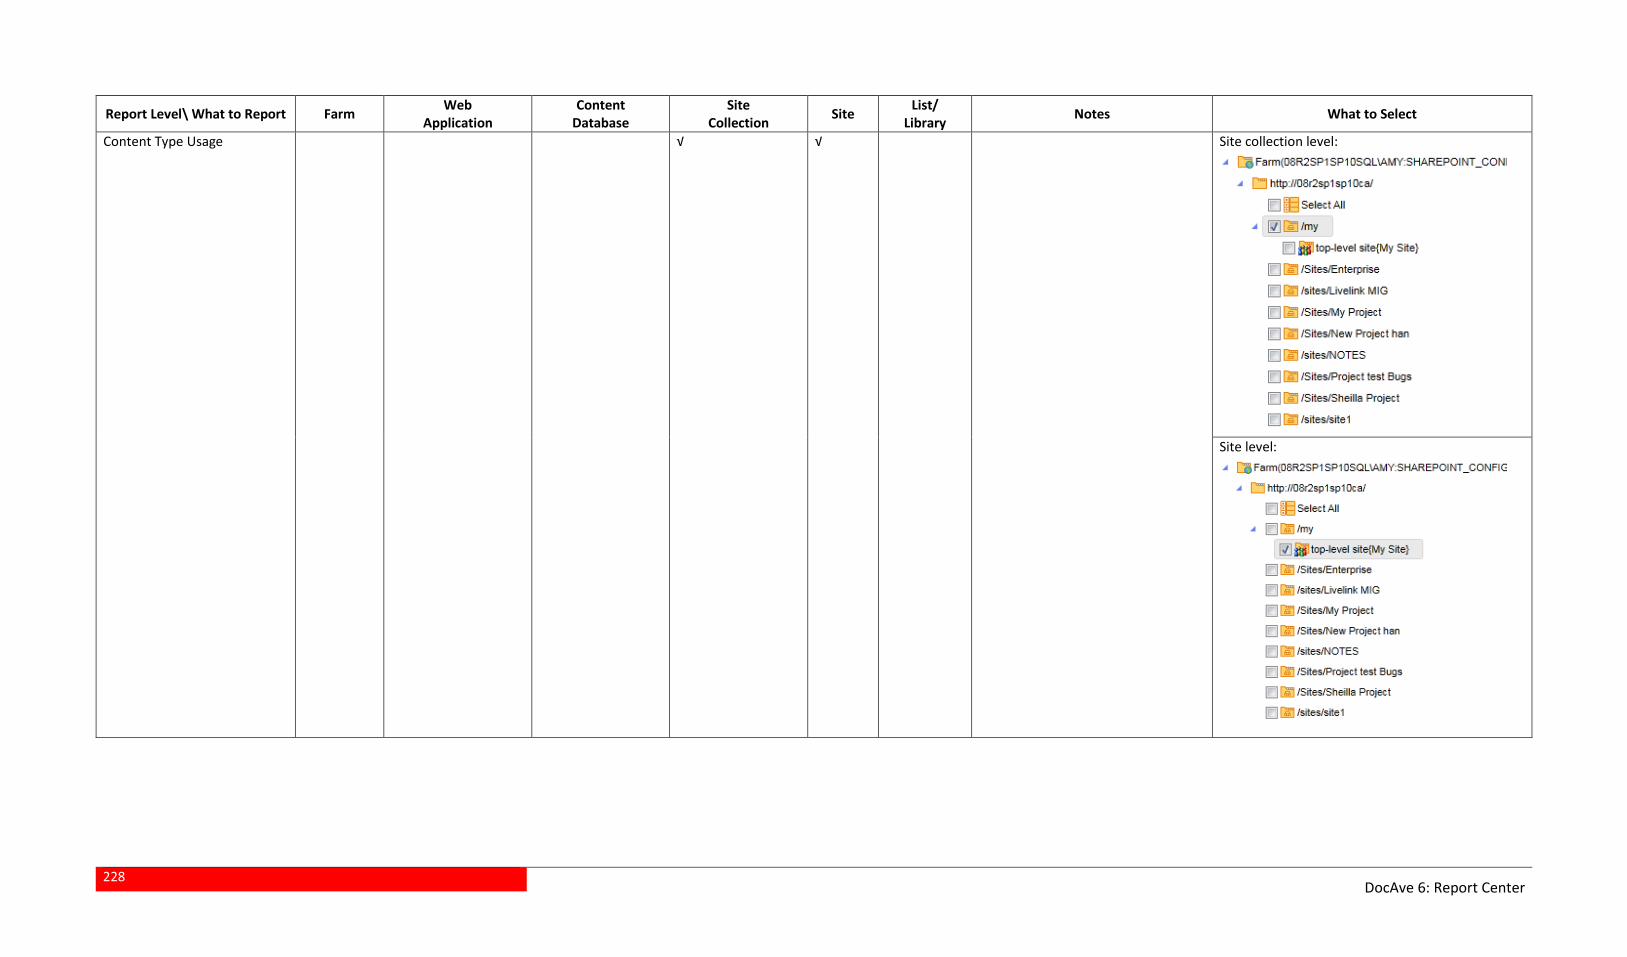
228
DocAve 6: Report Center
Report Level\ What to Report Farm Web
Application Content
Database Site
Collection Site
List/ Library
Notes What to Select
Content Type Usage √ √ Site collection level:
Site level:
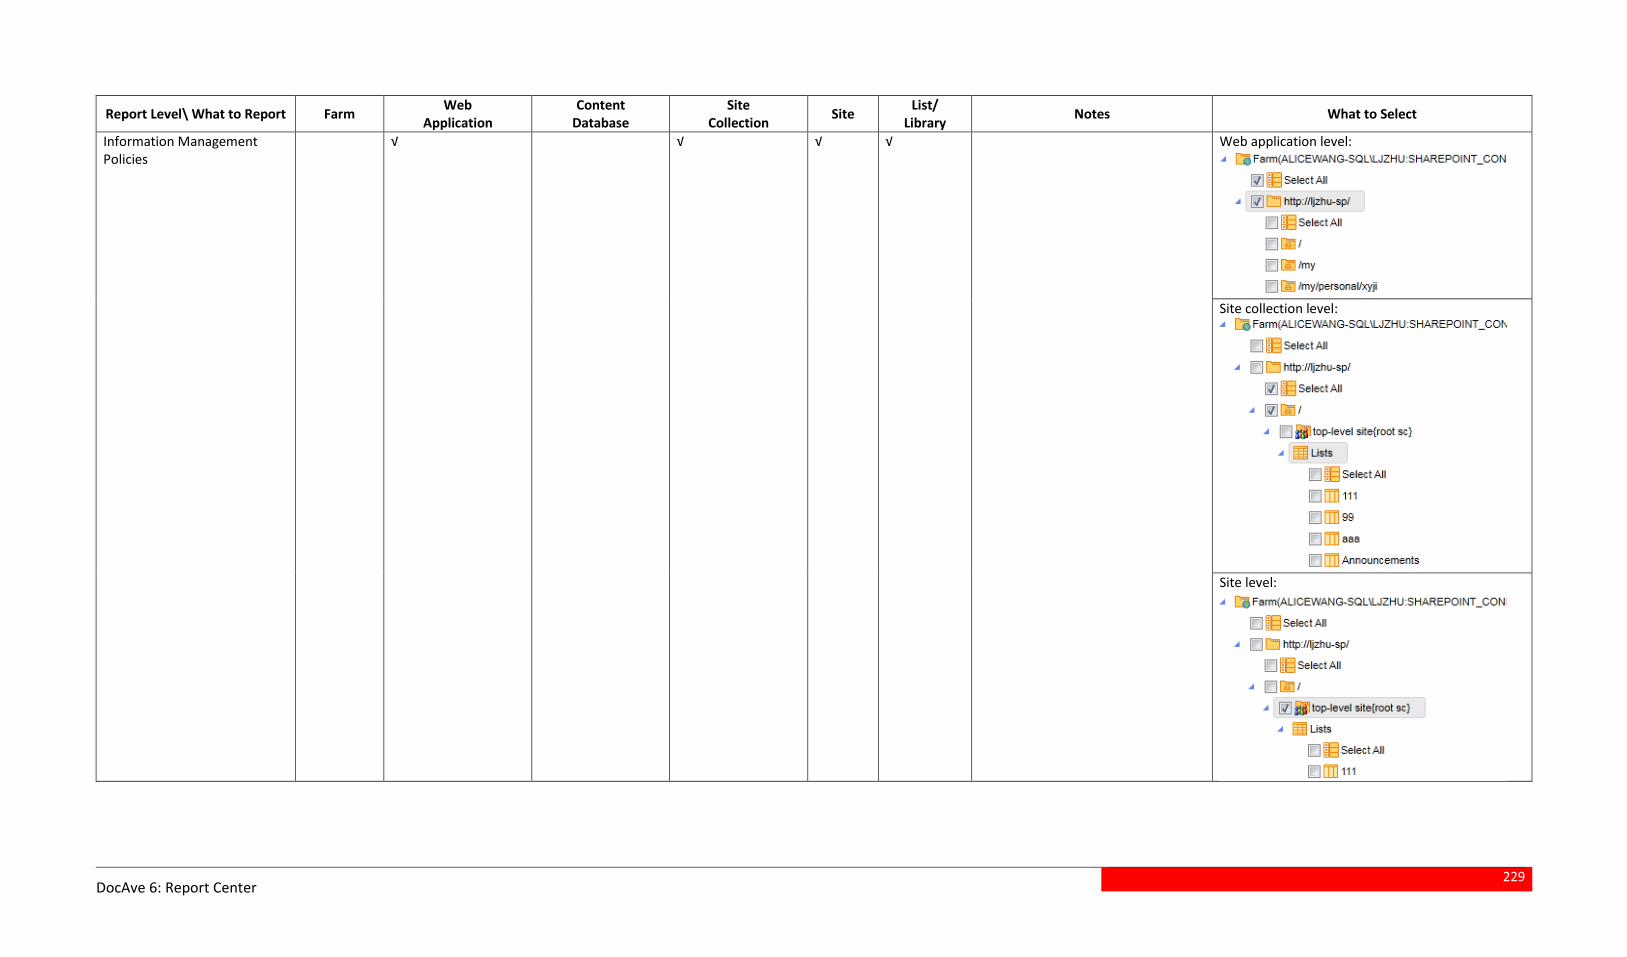
229
DocAve 6: Report Center
Report Level\ What to Report Farm Web
Application Content
Database Site
Collection Site
List/ Library
Notes What to Select
Information Management Policies
√ √ √ √ Web application level:
Site collection level:
Site level:
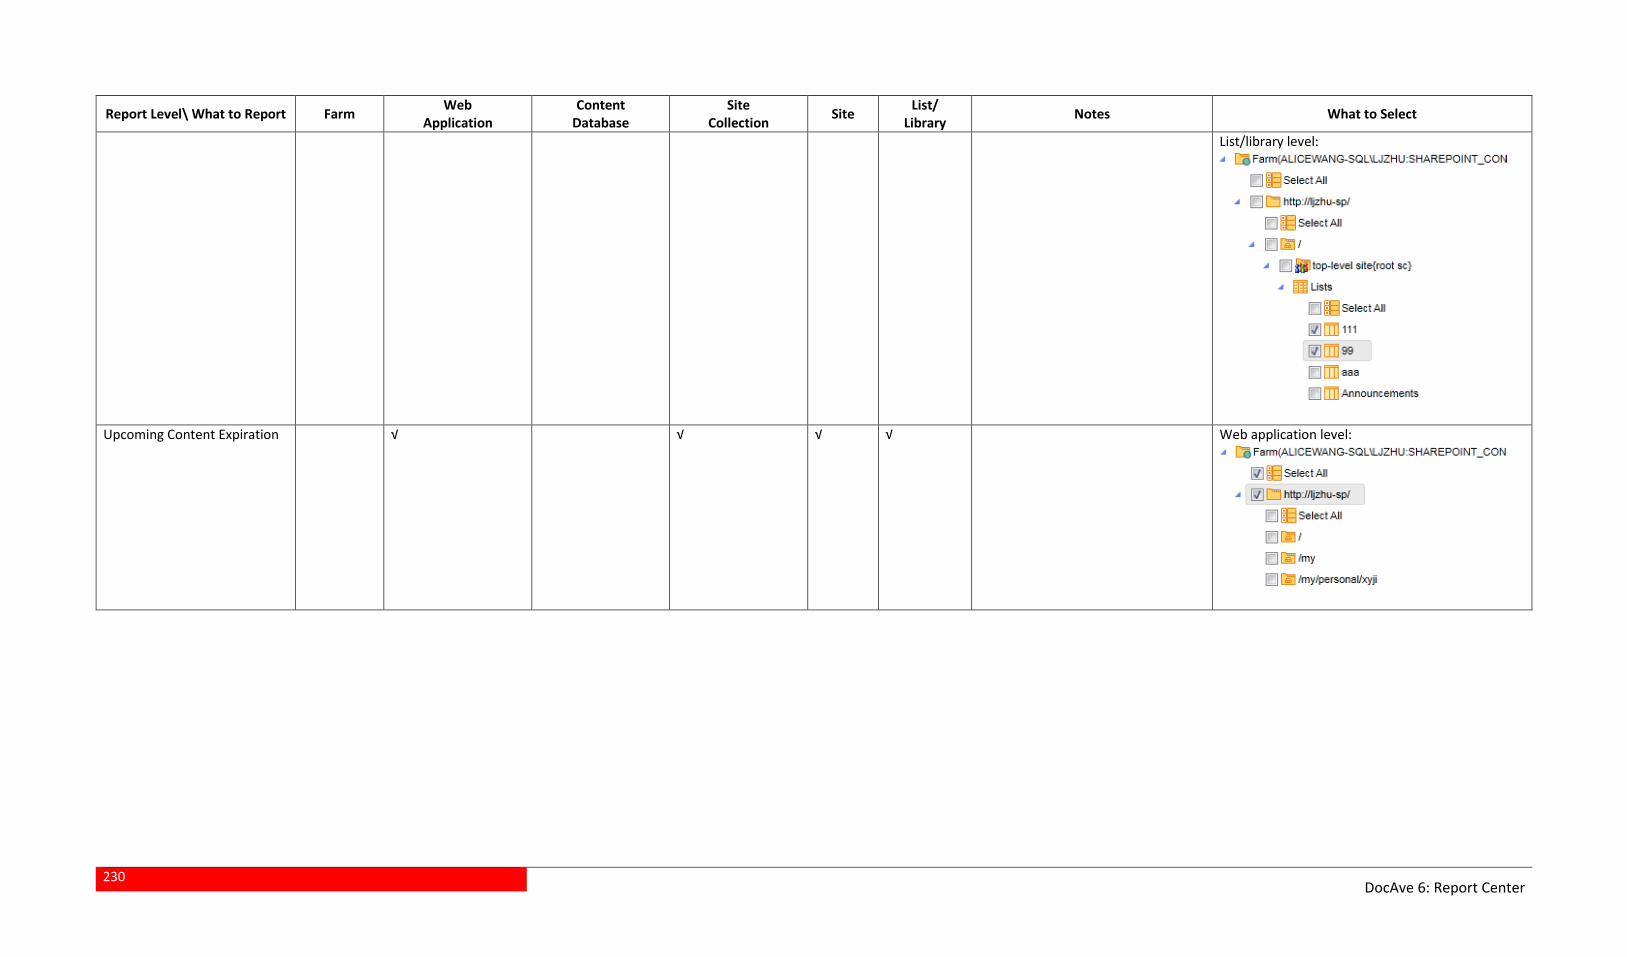
230
DocAve 6: Report Center
Report Level\ What to Report Farm Web
Application Content
Database Site
Collection Site
List/ Library
Notes What to Select
List/library level:
Upcoming Content Expiration √ √ √ √ Web application level:
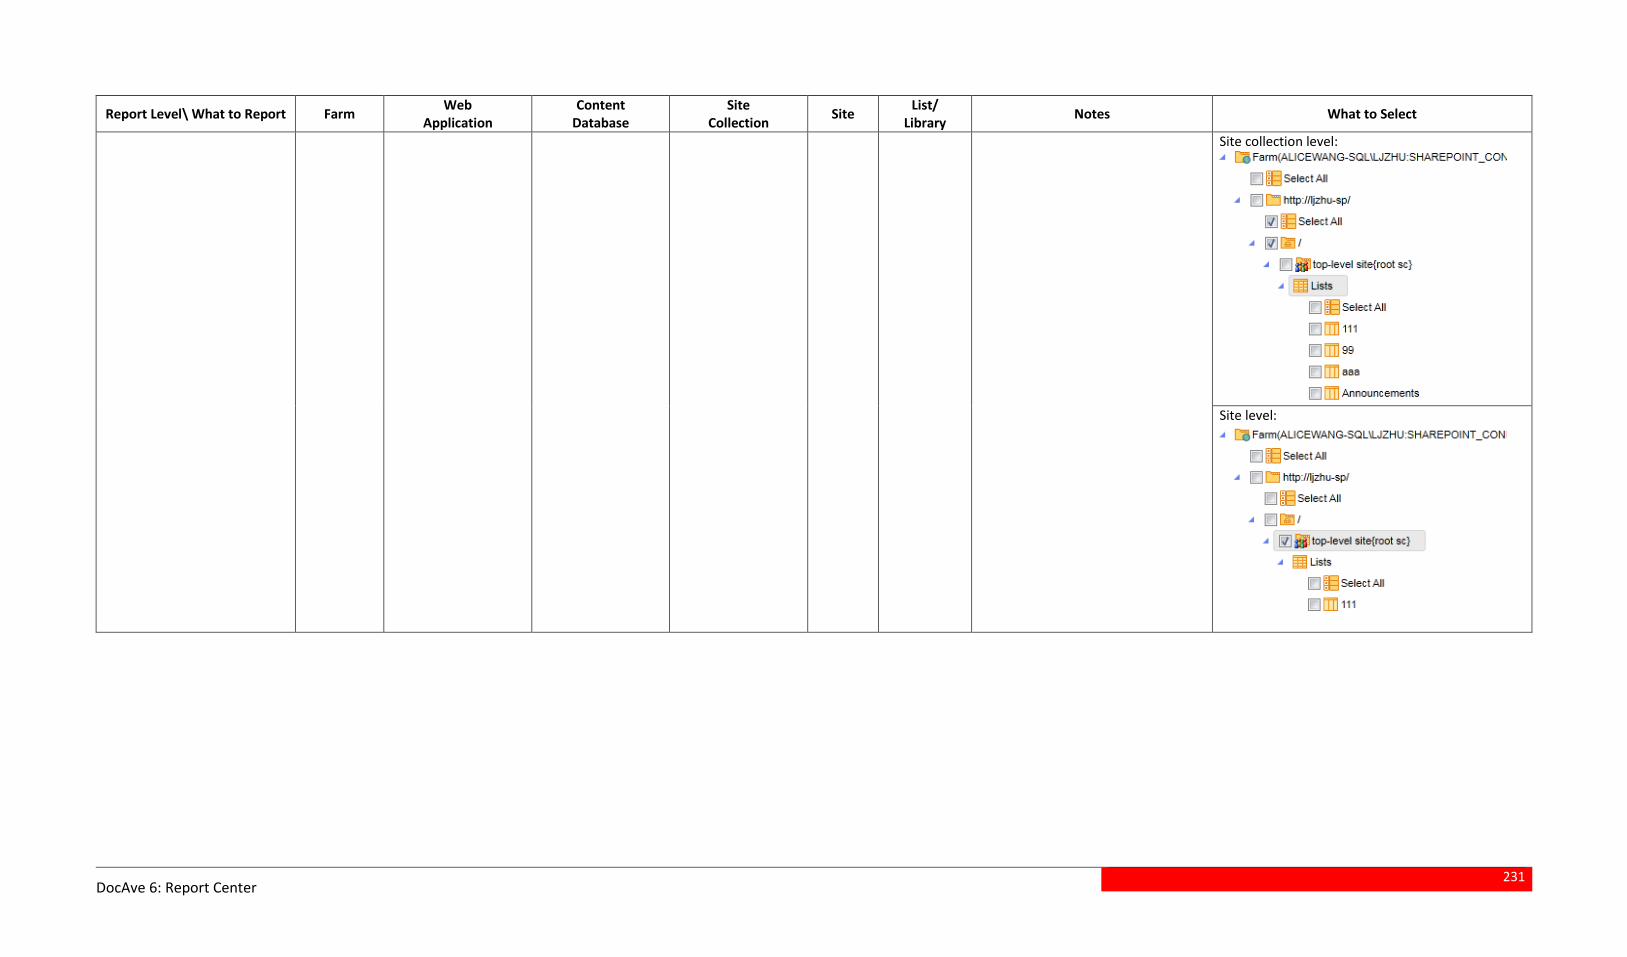
231
DocAve 6: Report Center
Report Level\ What to Report Farm Web
Application Content
Database Site
Collection Site
List/ Library
Notes What to Select
Site collection level:
Site level:
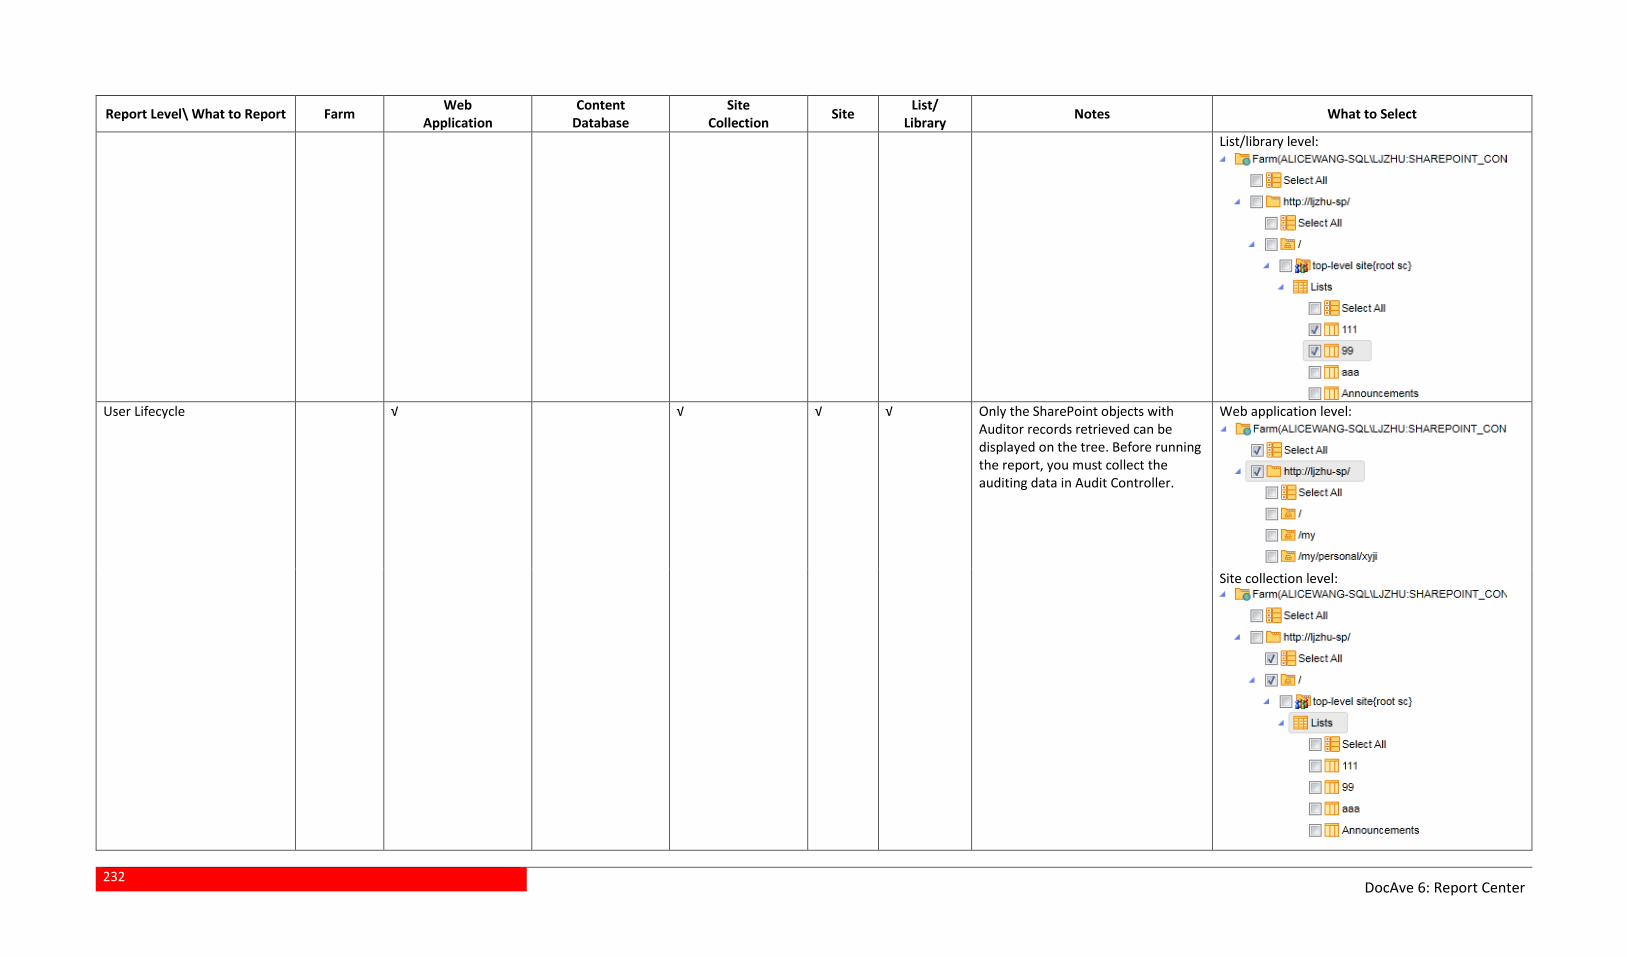
232
DocAve 6: Report Center
Report Level\ What to Report Farm Web
Application Content
Database Site
Collection Site
List/ Library
Notes What to Select
List/library level:
User Lifecycle √ √ √ √ Only the SharePoint objects with
Auditor records retrieved can be displayed on the tree. Before running the report, you must collect the auditing data in Audit Controller.
Web application level:
Site collection level:
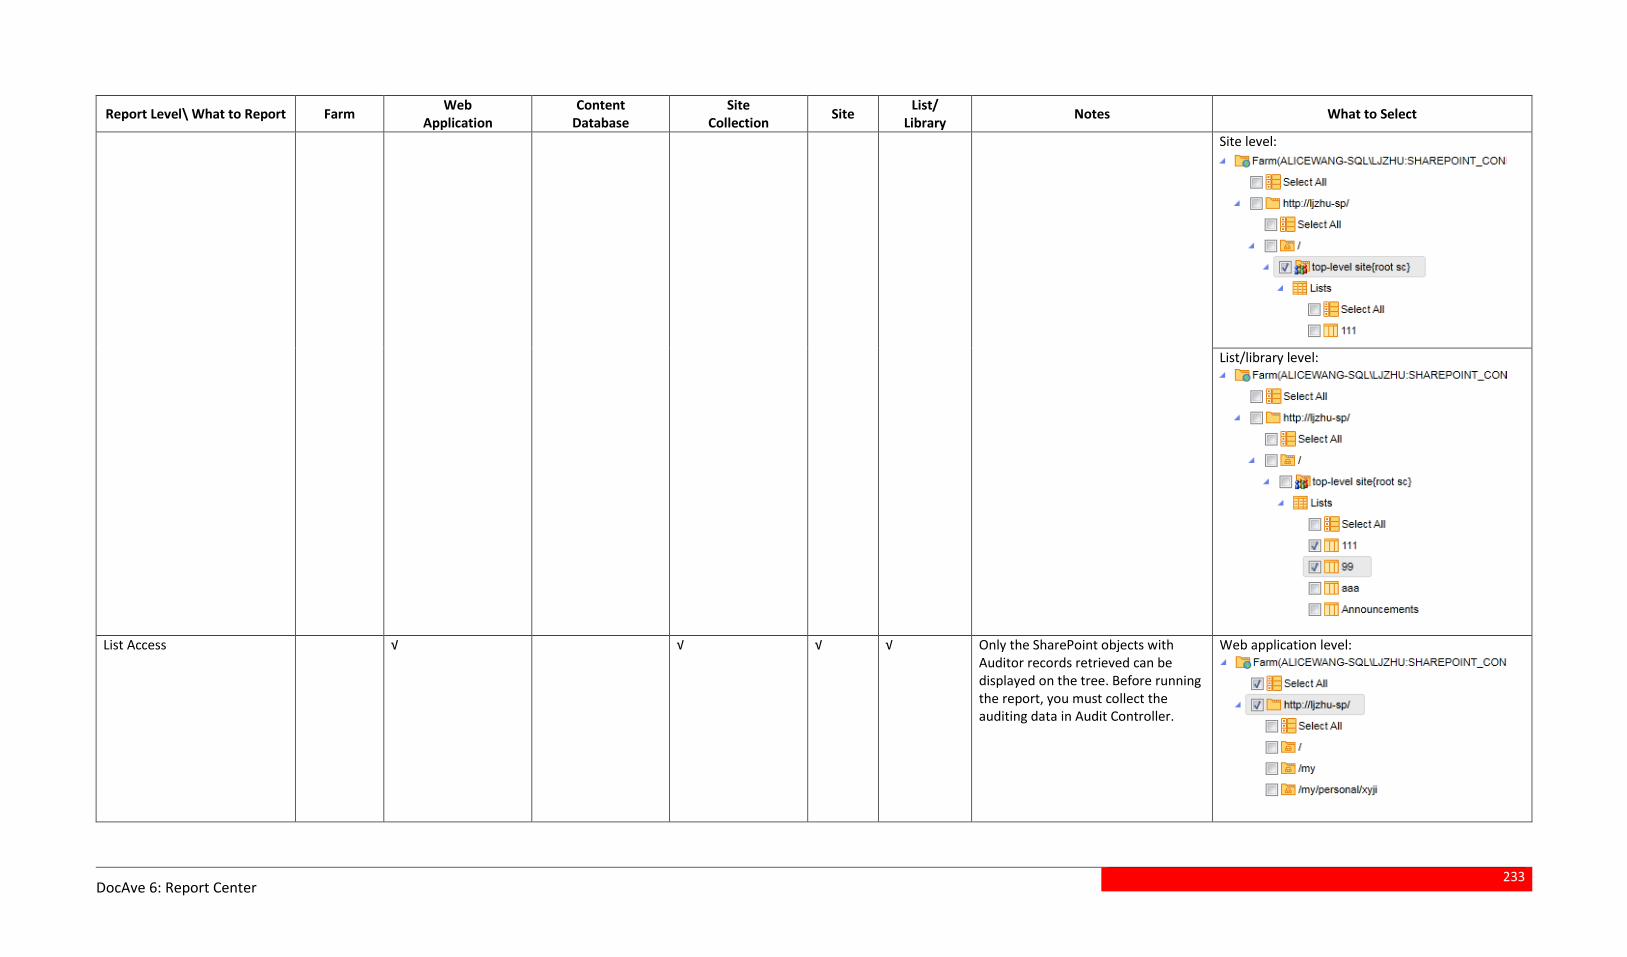
233
DocAve 6: Report Center
Report Level\ What to Report Farm Web
Application Content
Database Site
Collection Site
List/ Library
Notes What to Select
Site level:
List/library level:
List Access √ √ √ √ Only the SharePoint objects with Auditor records retrieved can be displayed on the tree. Before running the report, you must collect the auditing data in Audit Controller.
Web application level:
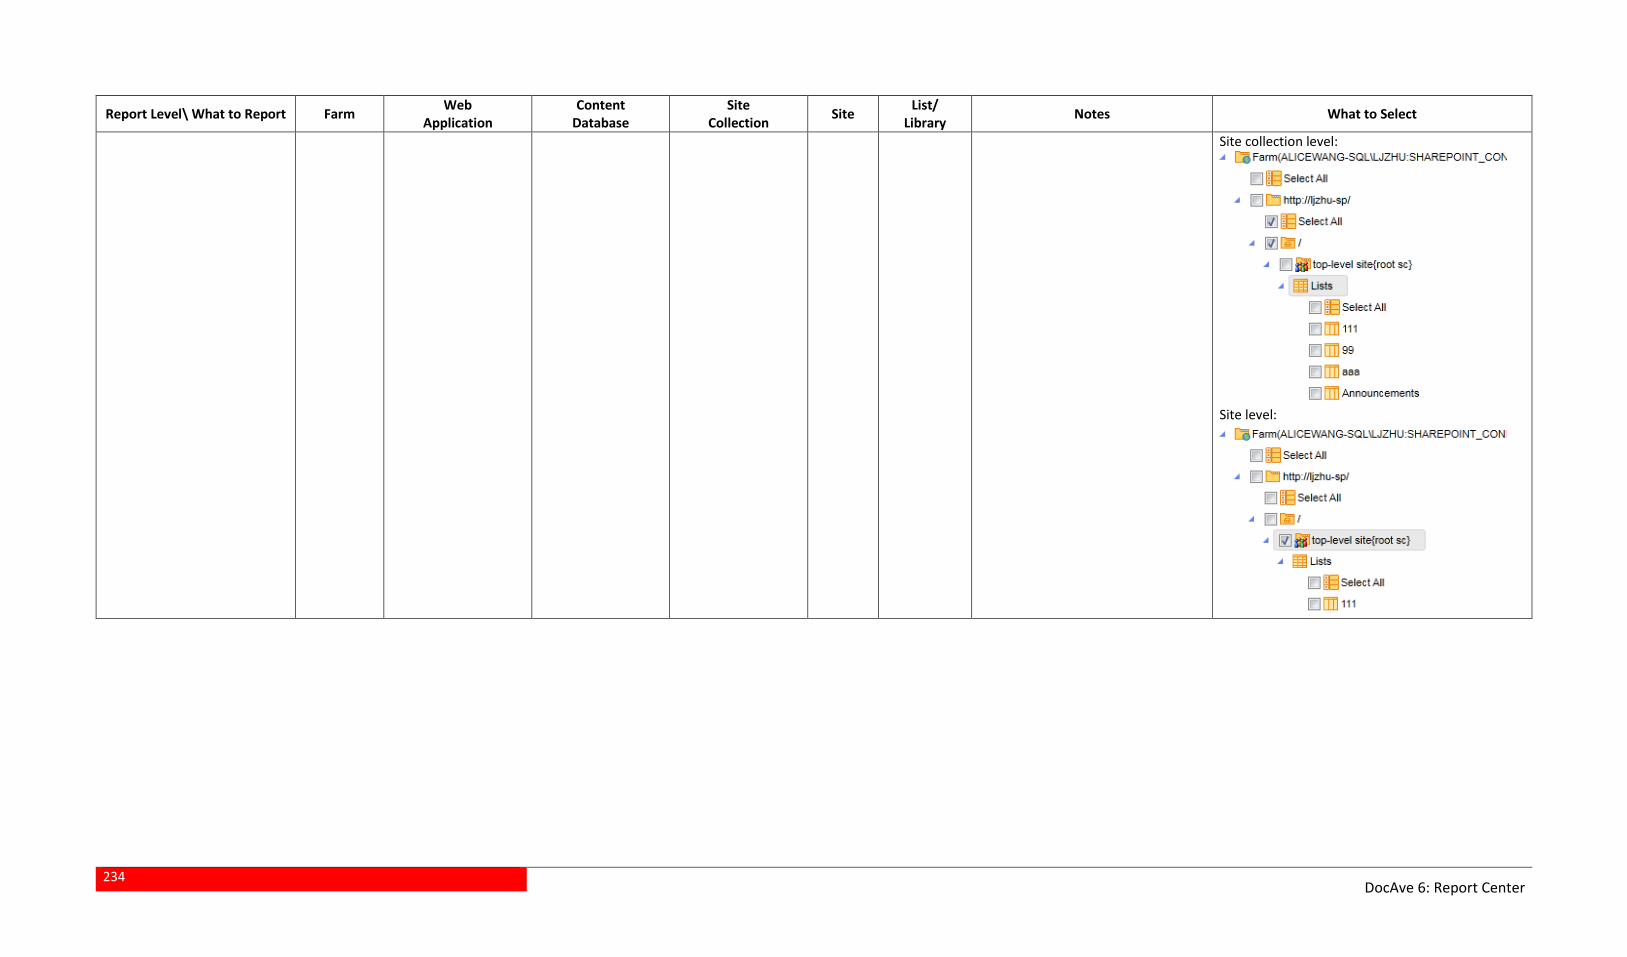
234
DocAve 6: Report Center
Report Level\ What to Report Farm Web
Application Content
Database Site
Collection Site
List/ Library
Notes What to Select
Site collection level:
Site level:
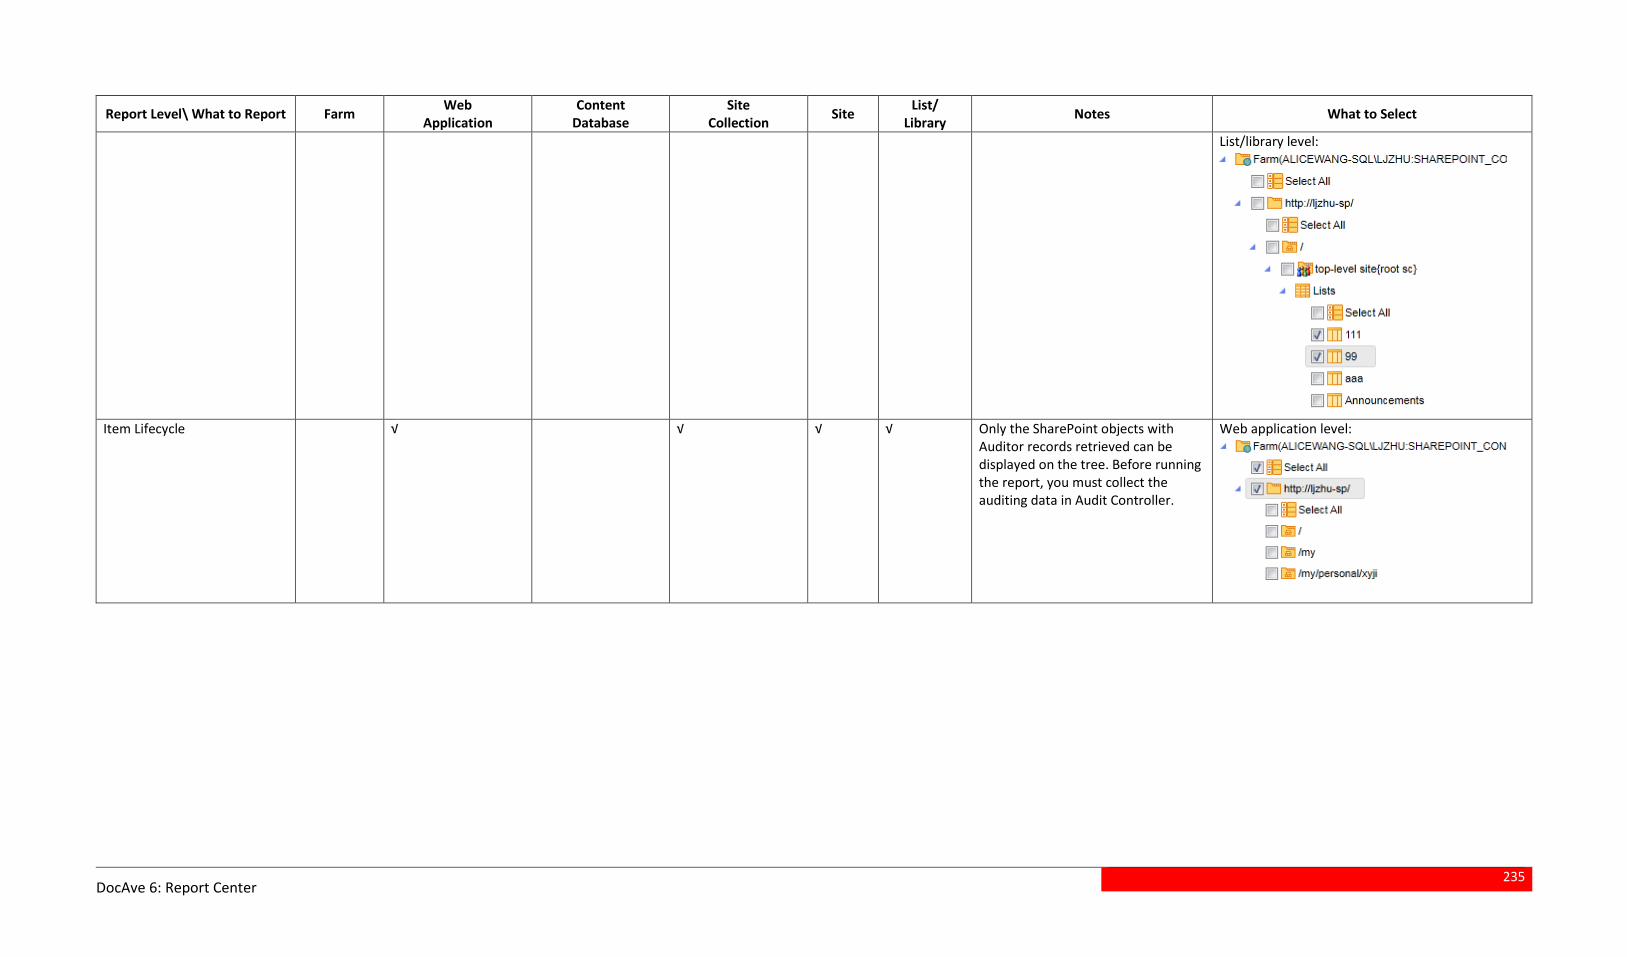
235
DocAve 6: Report Center
Report Level\ What to Report Farm Web
Application Content
Database Site
Collection Site
List/ Library
Notes What to Select
List/library level:
Item Lifecycle √ √ √ √ Only the SharePoint objects with Auditor records retrieved can be displayed on the tree. Before running the report, you must collect the auditing data in Audit Controller.
Web application level:
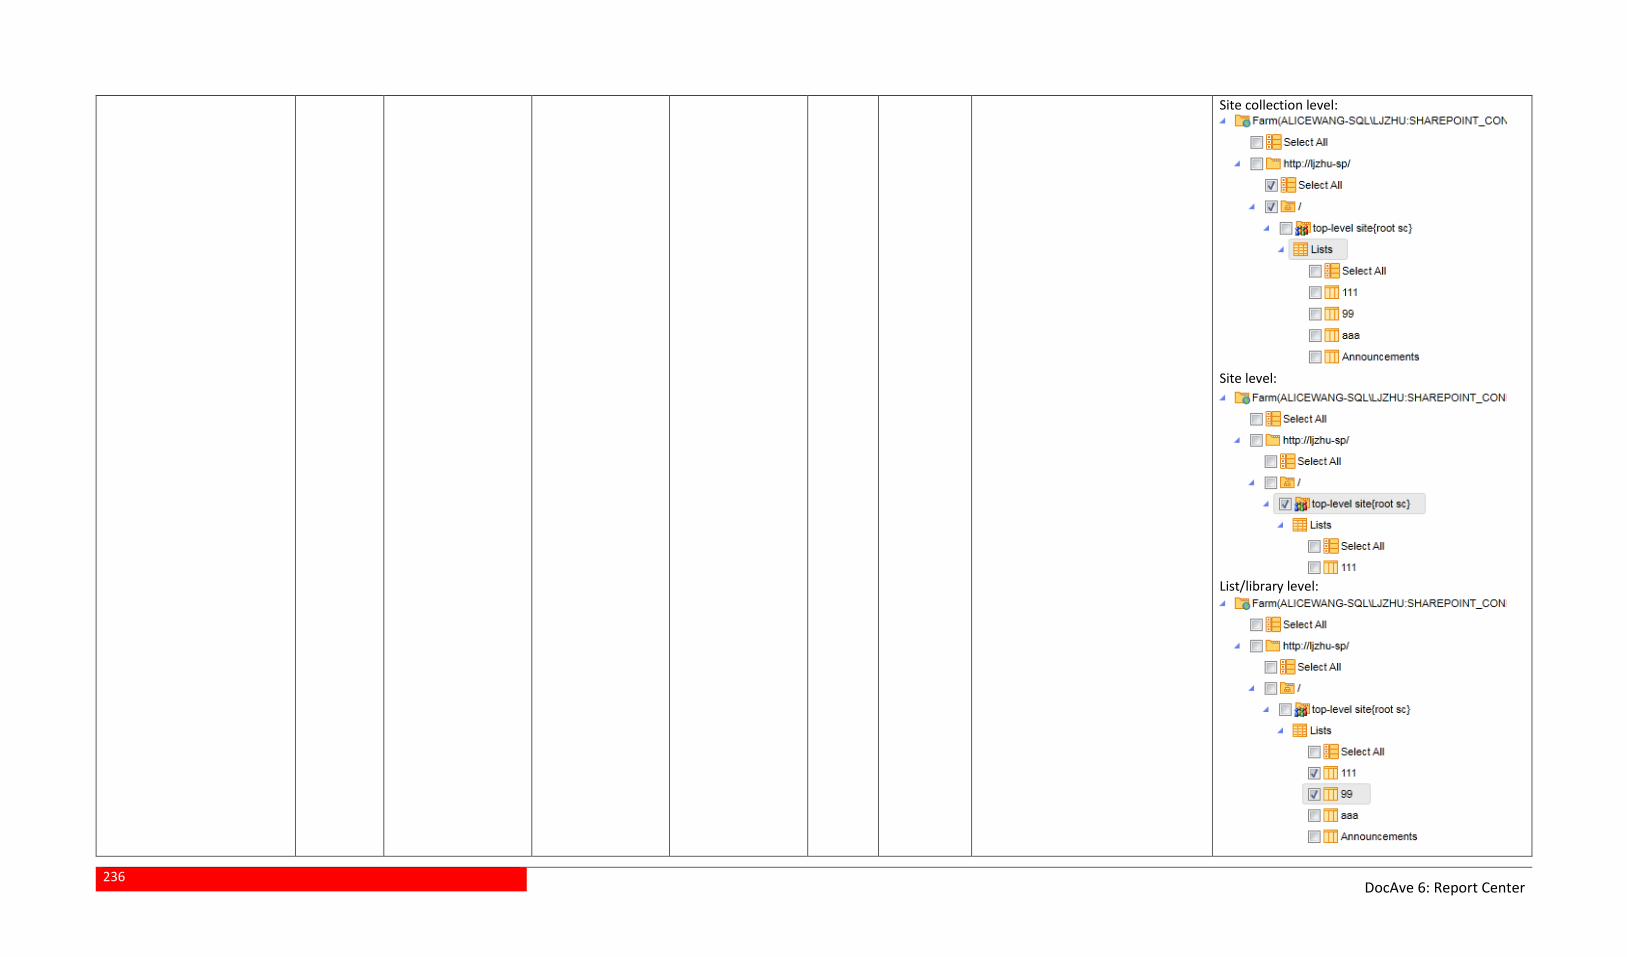
236
DocAve 6: Report Center
Site collection level:
Site level:
List/library level:
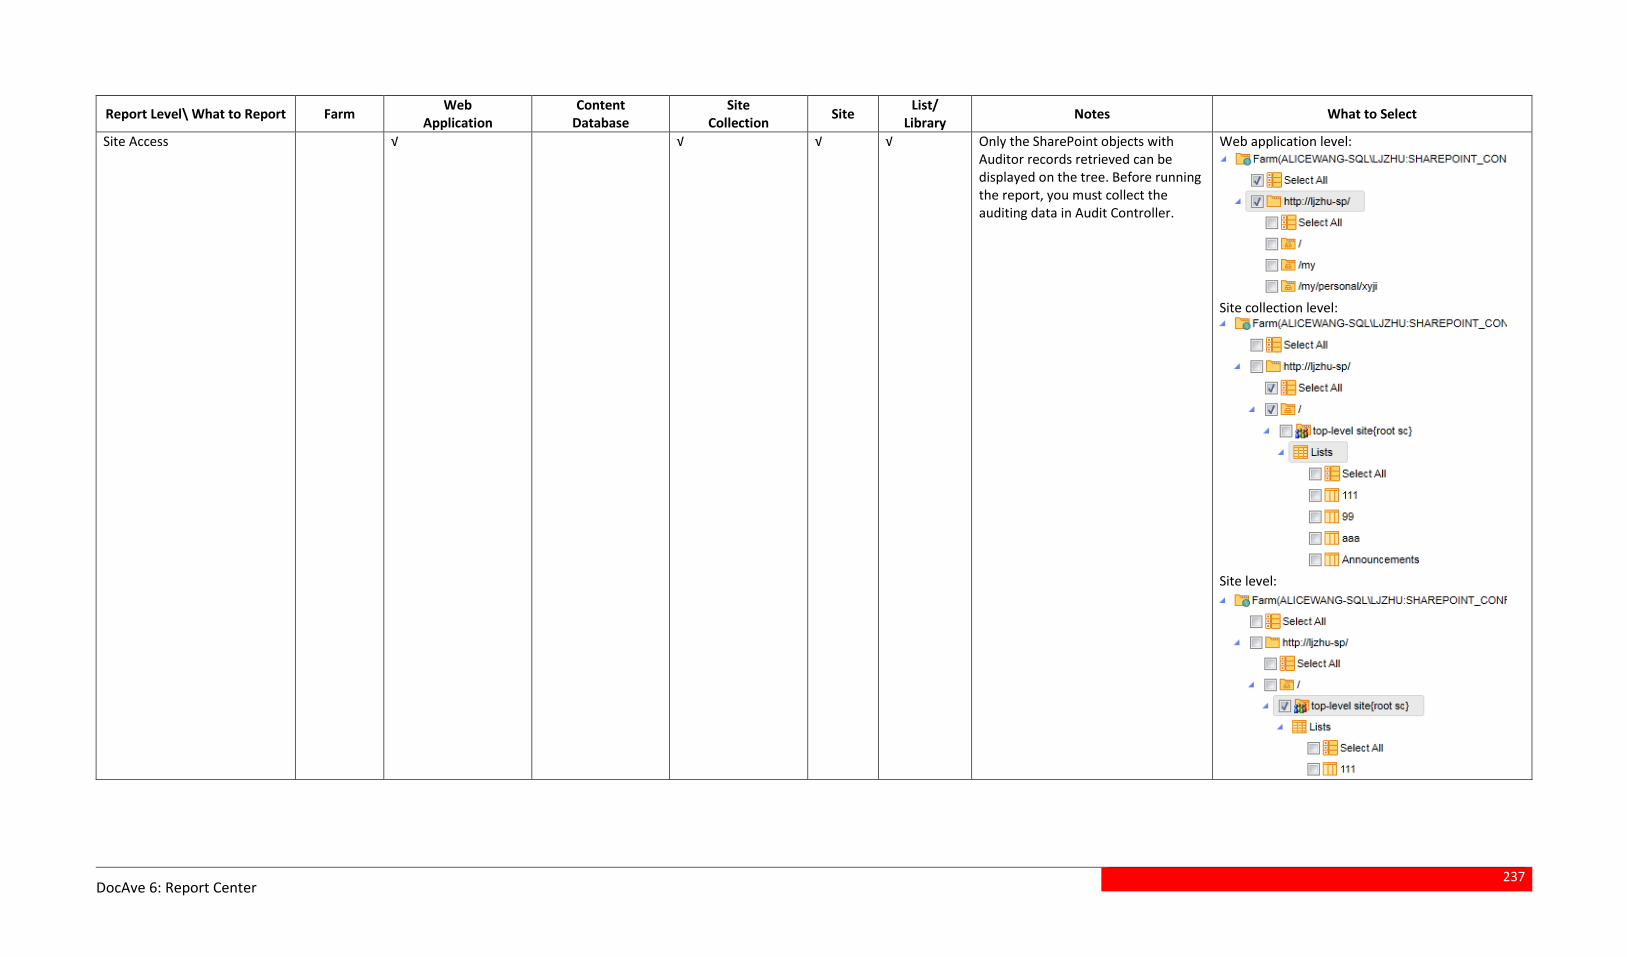
237
DocAve 6: Report Center
Report Level\ What to Report Farm Web
Application Content
Database Site
Collection Site
List/ Library
Notes What to Select
Site Access √ √ √ √ Only the SharePoint objects with Auditor records retrieved can be displayed on the tree. Before running the report, you must collect the auditing data in Audit Controller.
Web application level:
Site collection level:
Site level:
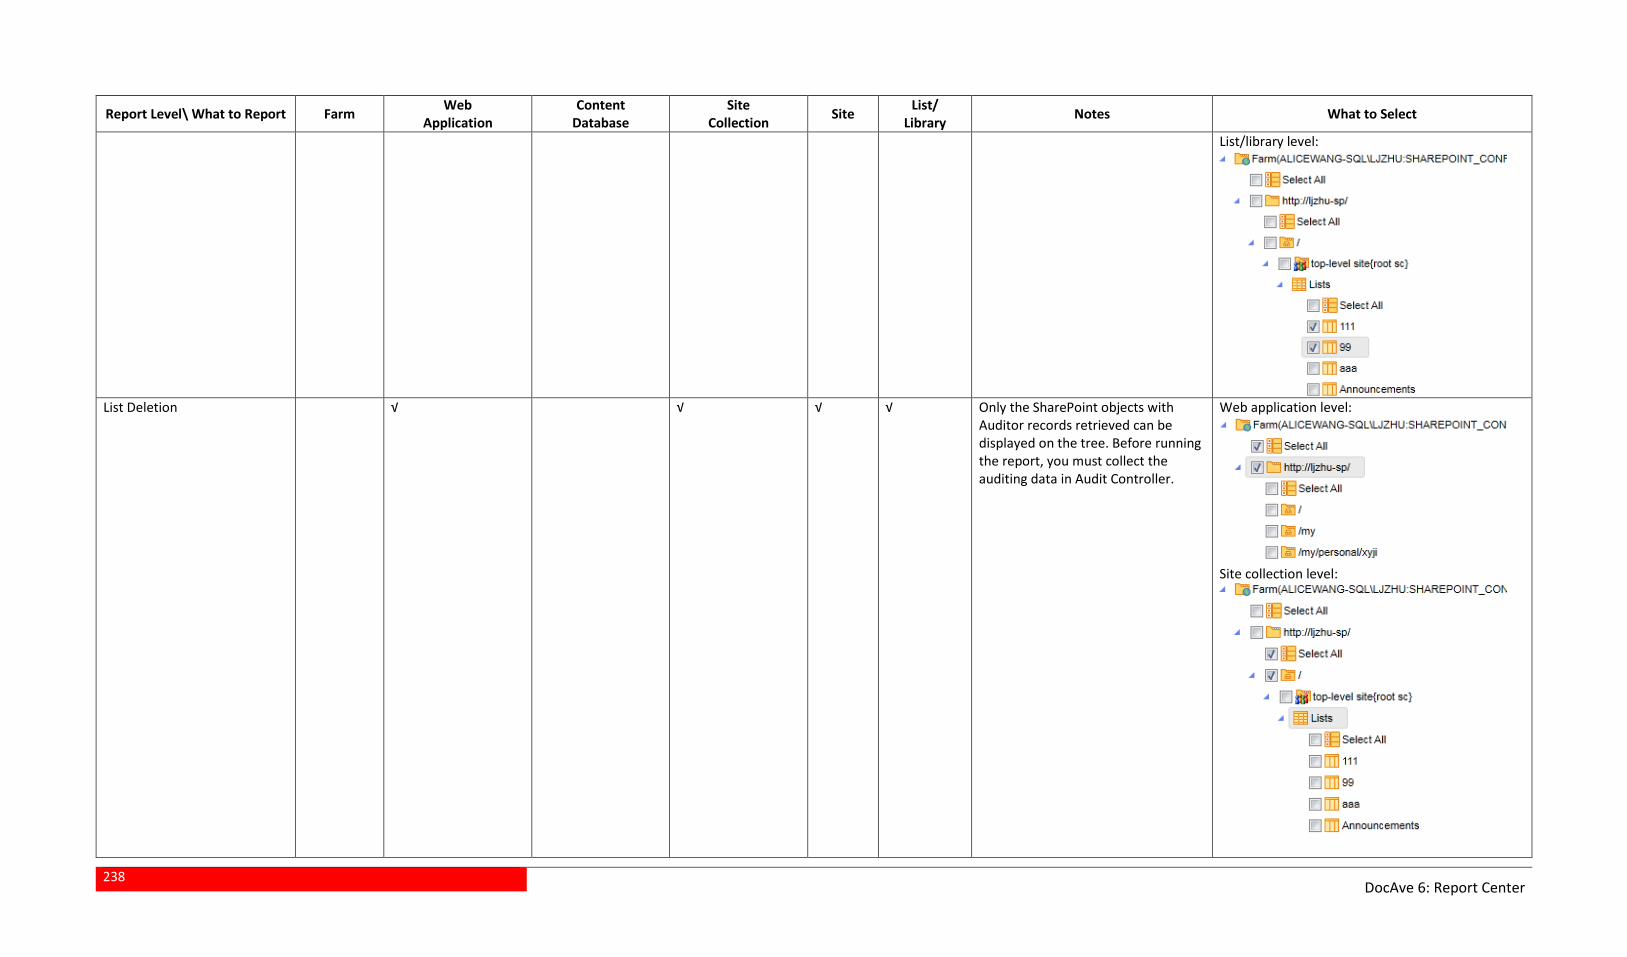
238
DocAve 6: Report Center
Report Level\ What to Report Farm Web
Application Content
Database Site
Collection Site
List/ Library
Notes What to Select
List/library level:
List Deletion √ √ √ √ Only the SharePoint objects with
Auditor records retrieved can be displayed on the tree. Before running the report, you must collect the auditing data in Audit Controller.
Web application level:
Site collection level:
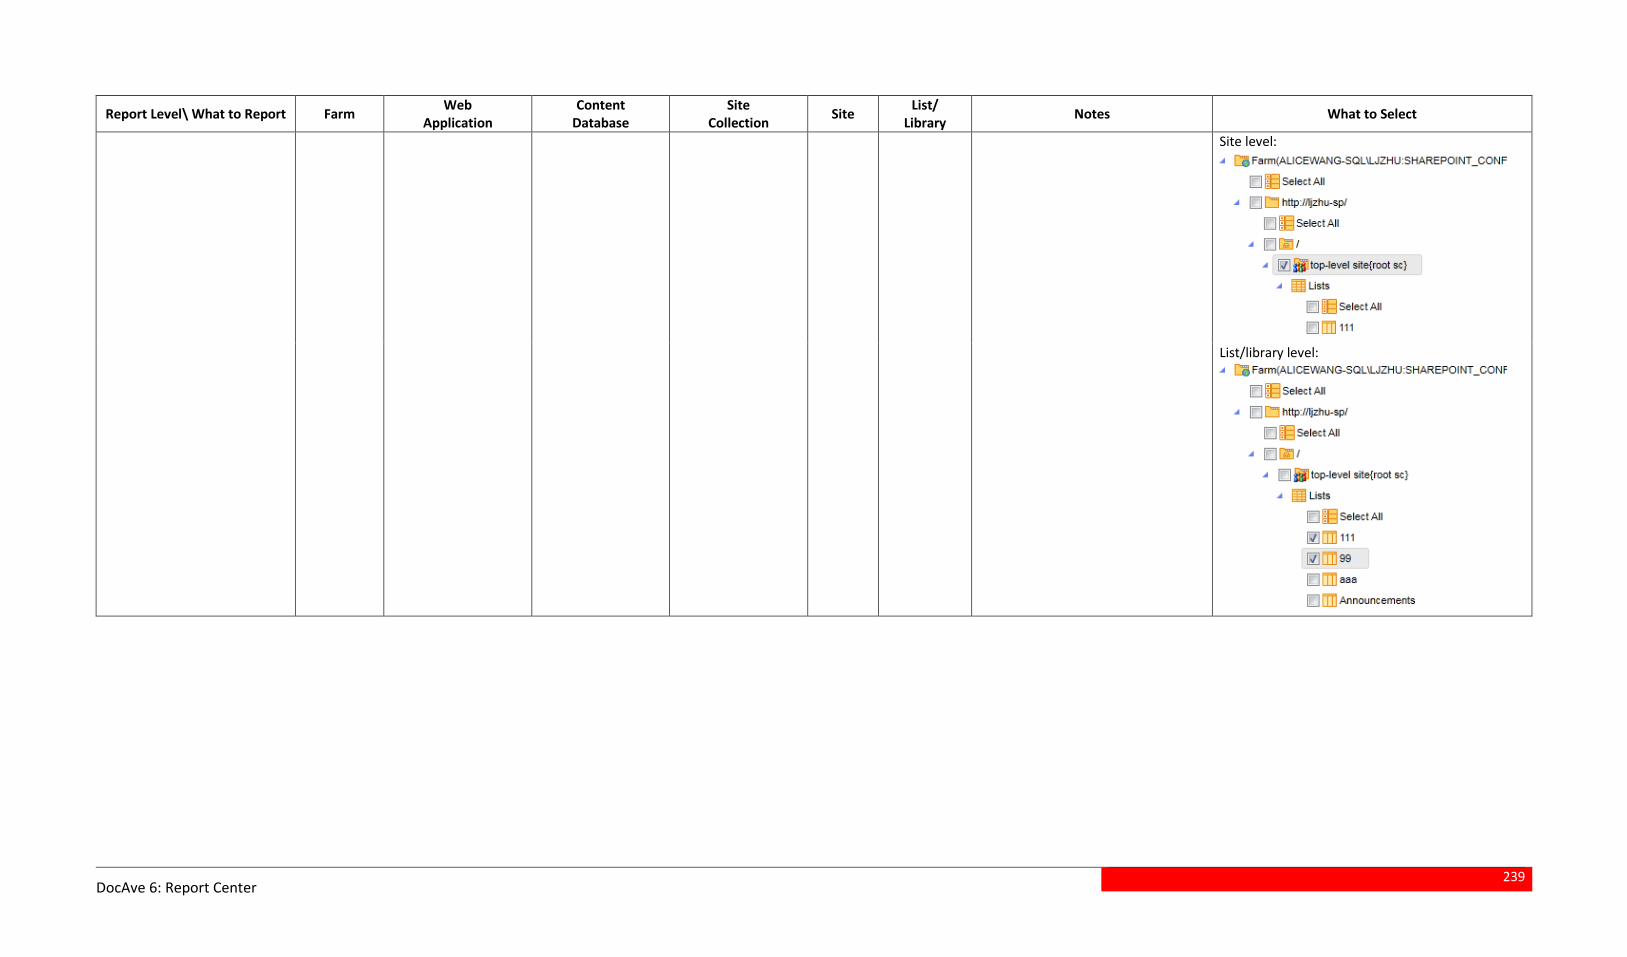
239
DocAve 6: Report Center
Report Level\ What to Report Farm Web
Application Content
Database Site
Collection Site
List/ Library
Notes What to Select
Site level:
List/library level:
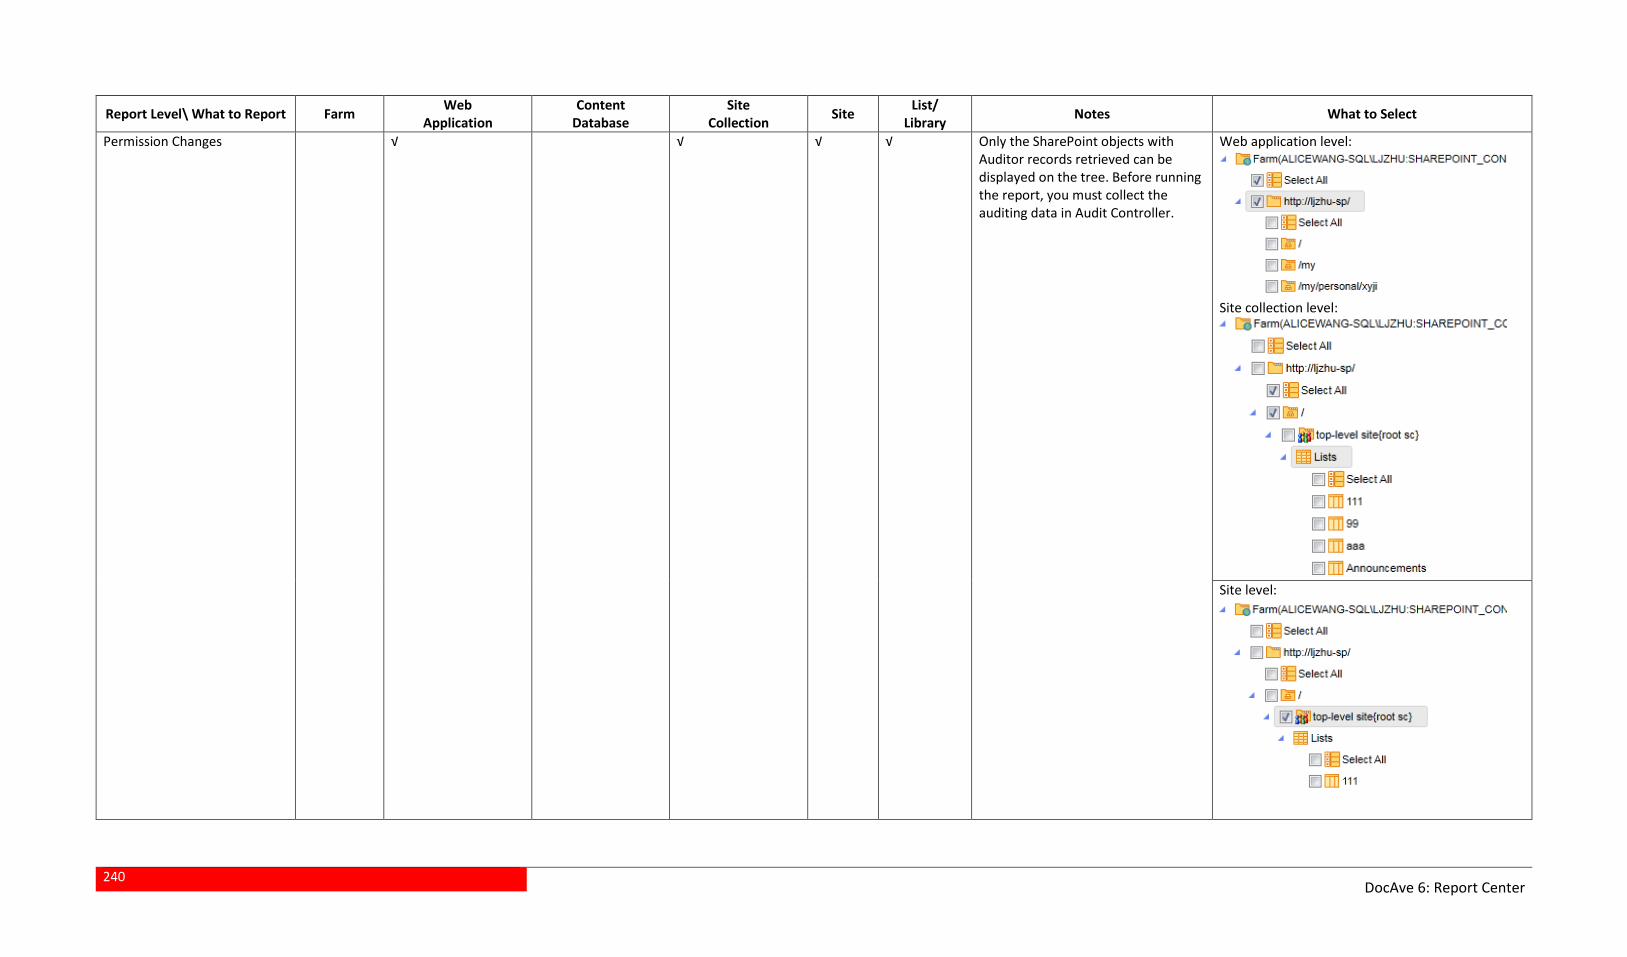
240
DocAve 6: Report Center
Report Level\ What to Report Farm Web
Application Content
Database Site
Collection Site
List/ Library
Notes What to Select
Permission Changes √ √ √ √ Only the SharePoint objects with Auditor records retrieved can be displayed on the tree. Before running the report, you must collect the auditing data in Audit Controller.
Web application level:
Site collection level:
Site level:
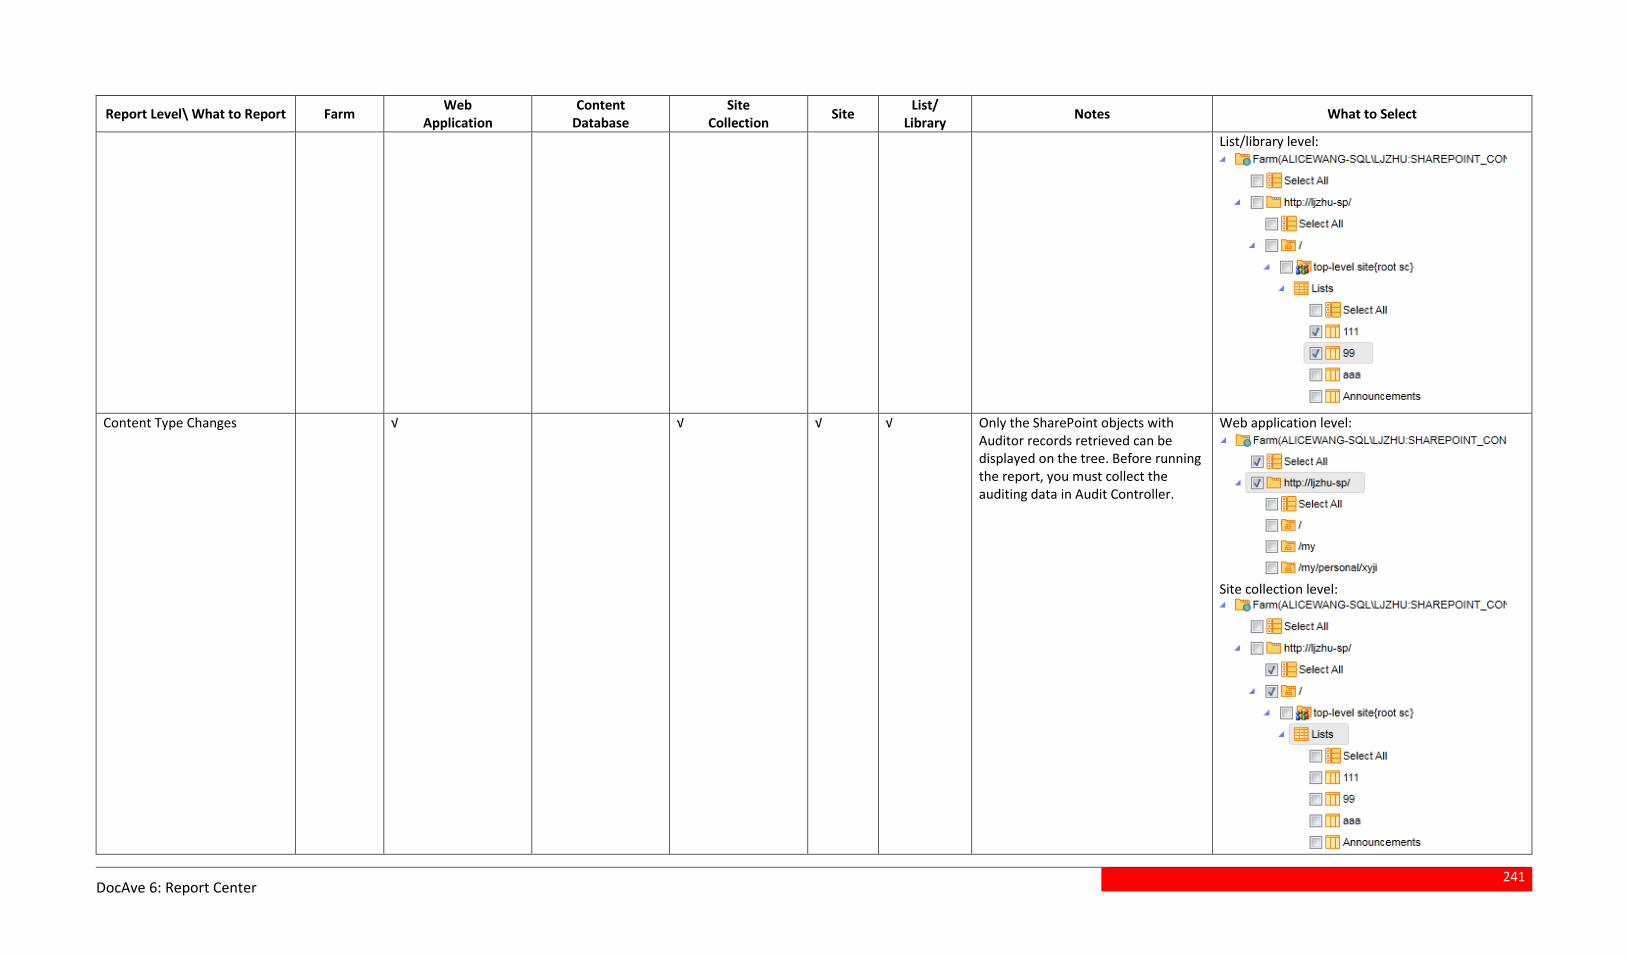
241
DocAve 6: Report Center
Report Level\ What to Report Farm Web
Application Content
Database Site
Collection Site
List/ Library
Notes What to Select
List/library level:
Content Type Changes √ √ √ √ Only the SharePoint objects with Auditor records retrieved can be displayed on the tree. Before running the report, you must collect the auditing data in Audit Controller.
Web application level:
Site collection level:
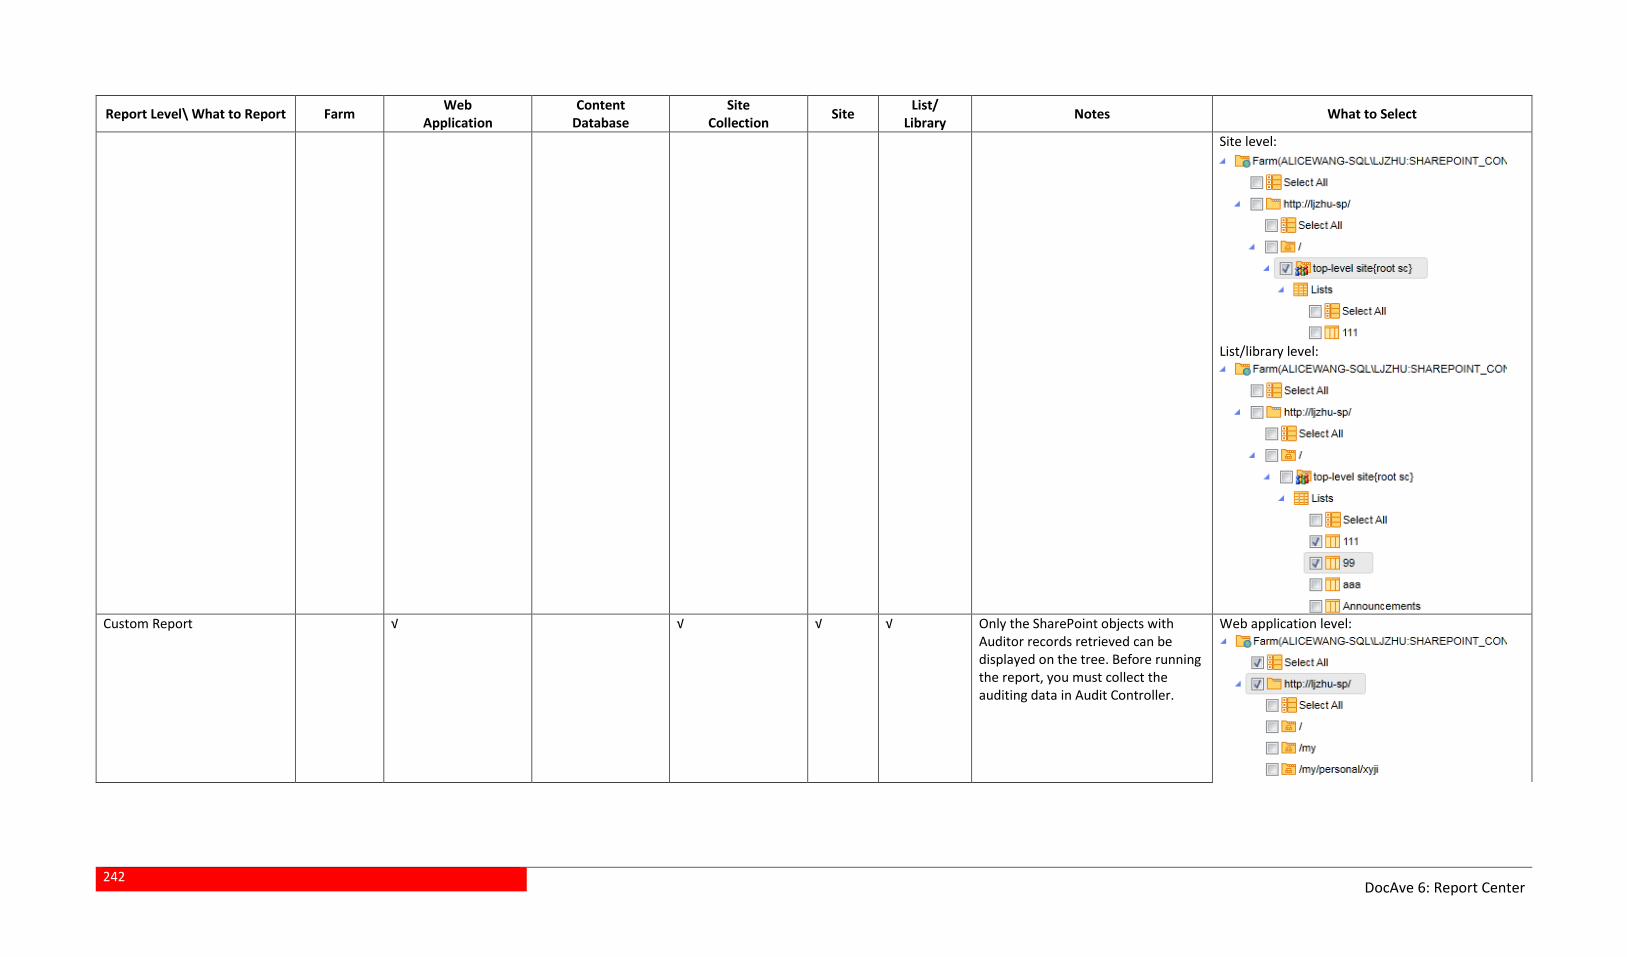
242
DocAve 6: Report Center
Report Level\ What to Report Farm Web
Application Content
Database Site
Collection Site
List/ Library
Notes What to Select
Site level:
List/library level:
Custom Report √ √ √ √ Only the SharePoint objects with
Auditor records retrieved can be displayed on the tree. Before running the report, you must collect the auditing data in Audit Controller.
Web application level:

243
DocAve 6: Report Center
Report Level\ What to Report Farm Web
Application Content
Database Site
Collection Site
List/ Library
Notes What to Select
Site collection level:
Site level:
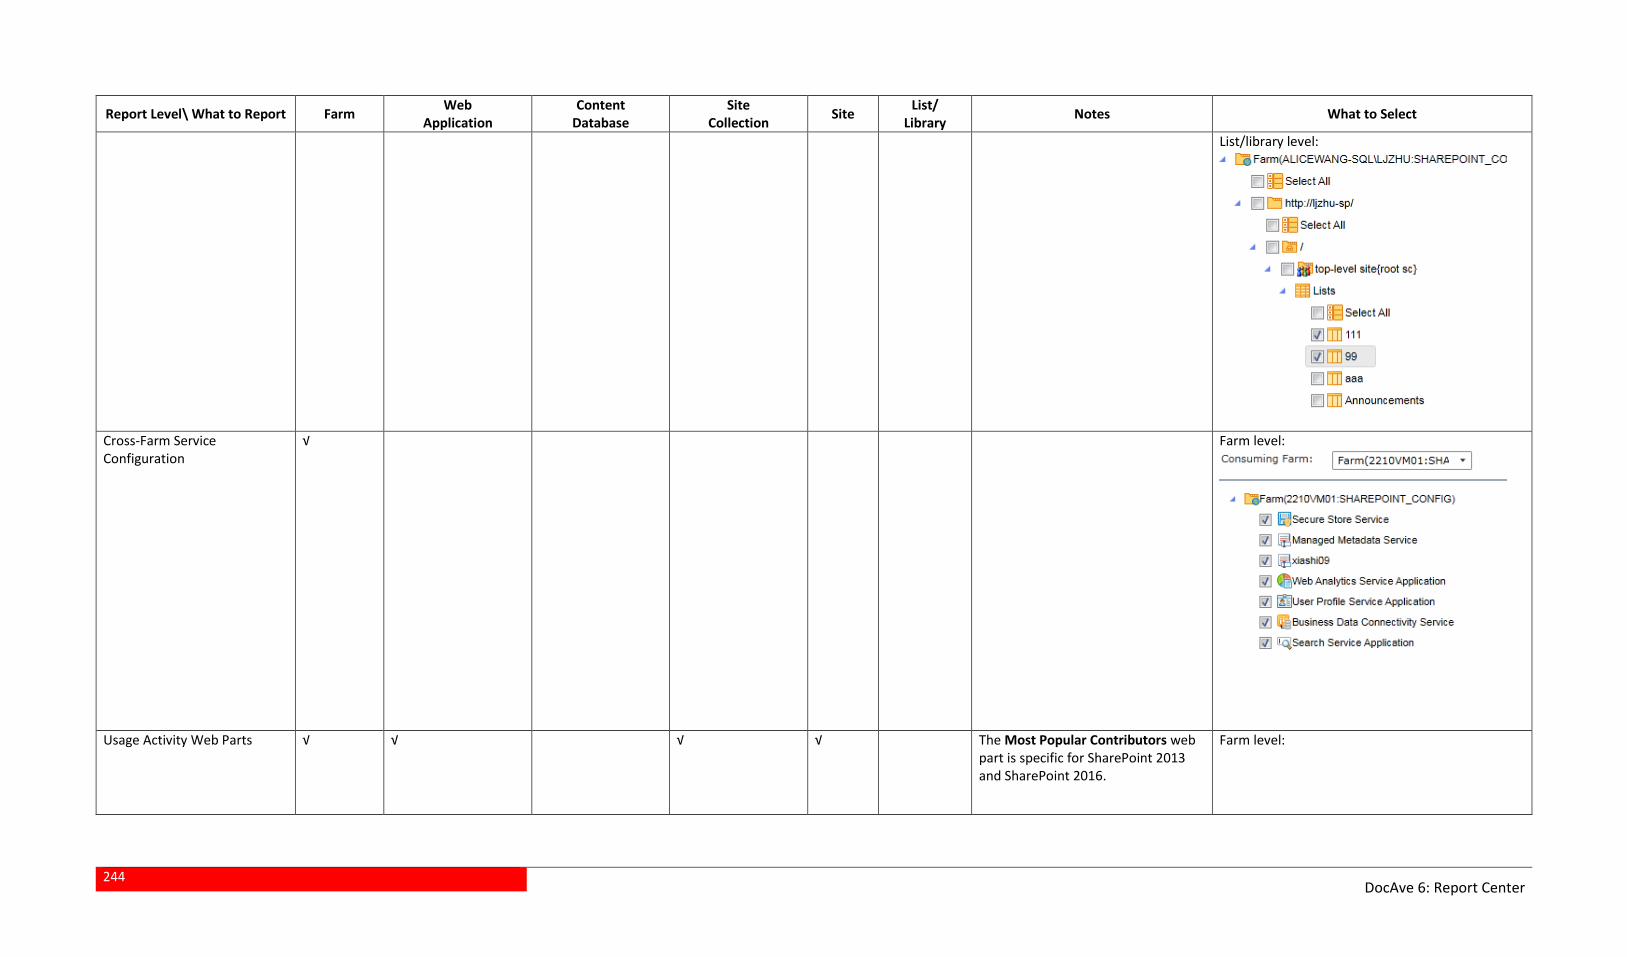
244
DocAve 6: Report Center
Report Level\ What to Report Farm Web
Application Content
Database Site
Collection Site
List/ Library
Notes What to Select
List/library level:
Cross-Farm Service Configuration
√ Farm level:
Usage Activity Web Parts √ √ √ √ The Most Popular Contributors web part is specific for SharePoint 2013 and SharePoint 2016.
Farm level:
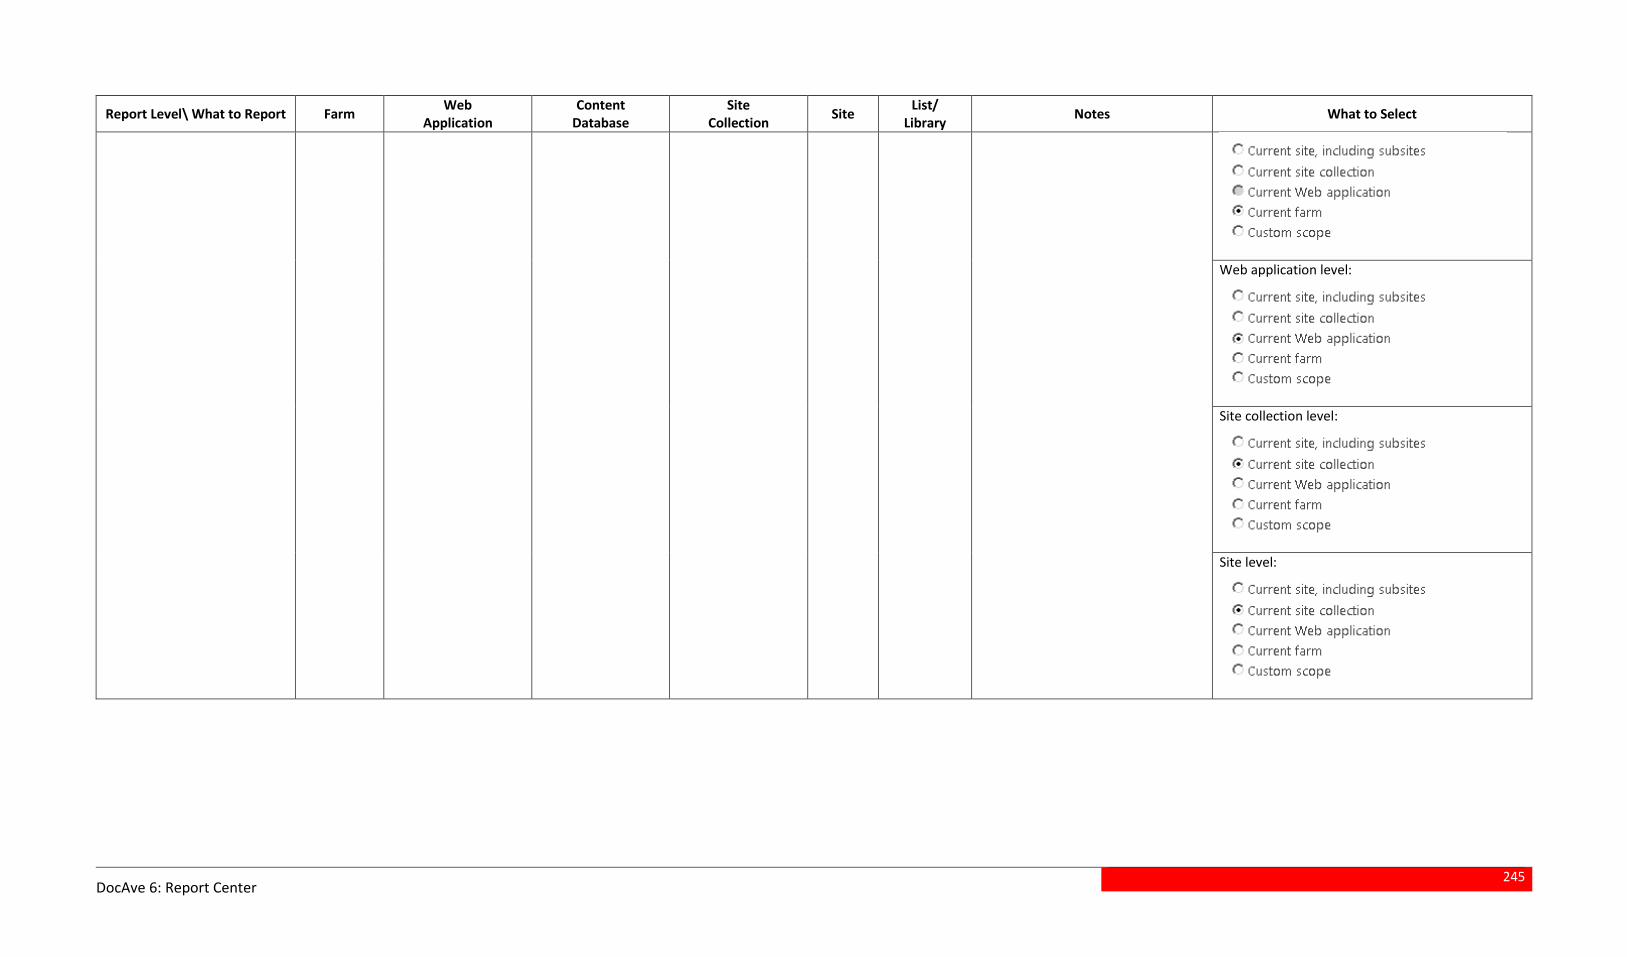
245
DocAve 6: Report Center
Report Level\ What to Report Farm Web
Application Content
Database Site
Collection Site
List/ Library
Notes What to Select
Web application level:
Site collection level:
Site level:
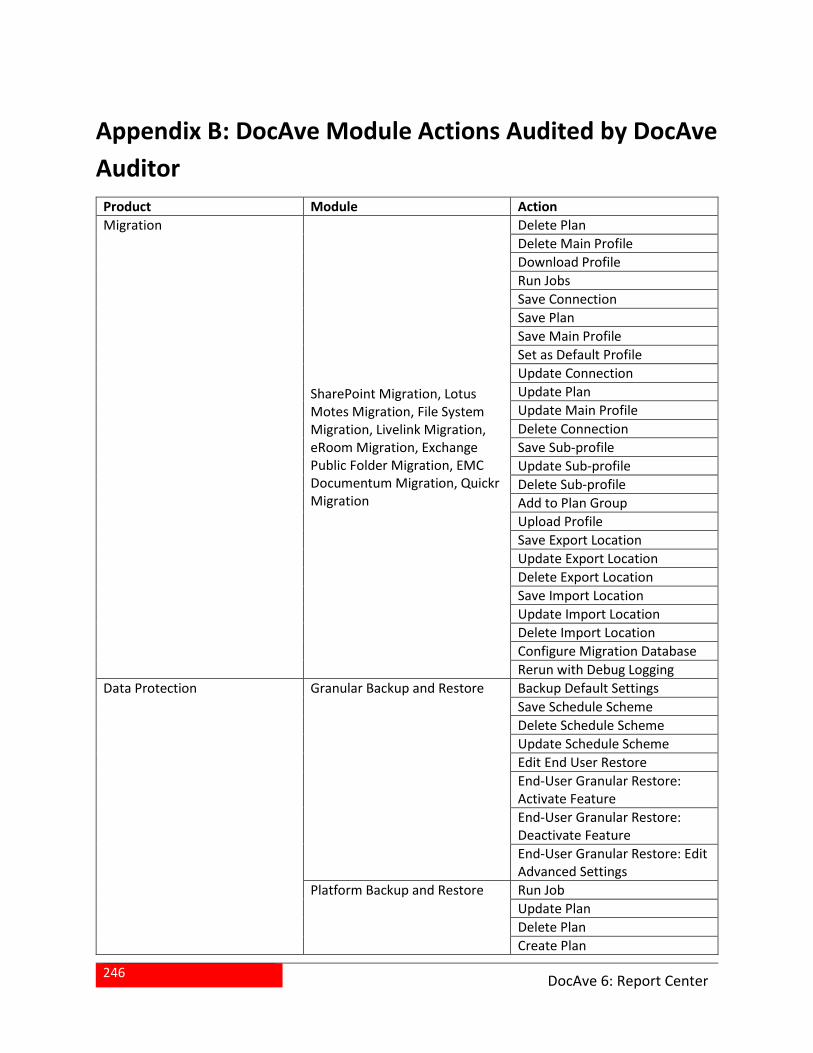
246
DocAve 6: Report Center
Appendix B: DocAve Module Actions Audited by DocAve
Auditor
Product Module Action
Migration
SharePoint Migration, Lotus Motes Migration, File System Migration, Livelink Migration, eRoom Migration, Exchange Public Folder Migration, EMC Documentum Migration, Quickr Migration
Delete Plan
Delete Main Profile
Download Profile
Run Jobs
Save Connection
Save Plan
Save Main Profile
Set as Default Profile
Update Connection
Update Plan
Update Main Profile
Delete Connection
Save Sub-profile
Update Sub-profile
Delete Sub-profile
Add to Plan Group
Upload Profile
Save Export Location
Update Export Location
Delete Export Location
Save Import Location
Update Import Location
Delete Import Location
Configure Migration Database
Rerun with Debug Logging
Data Protection
Granular Backup and Restore Backup Default Settings
Save Schedule Scheme
Delete Schedule Scheme
Update Schedule Scheme
Edit End User Restore
End-User Granular Restore: Activate Feature
End-User Granular Restore: Deactivate Feature
End-User Granular Restore: Edit Advanced Settings
Platform Backup and Restore Run Job
Update Plan
Delete Plan
Create Plan
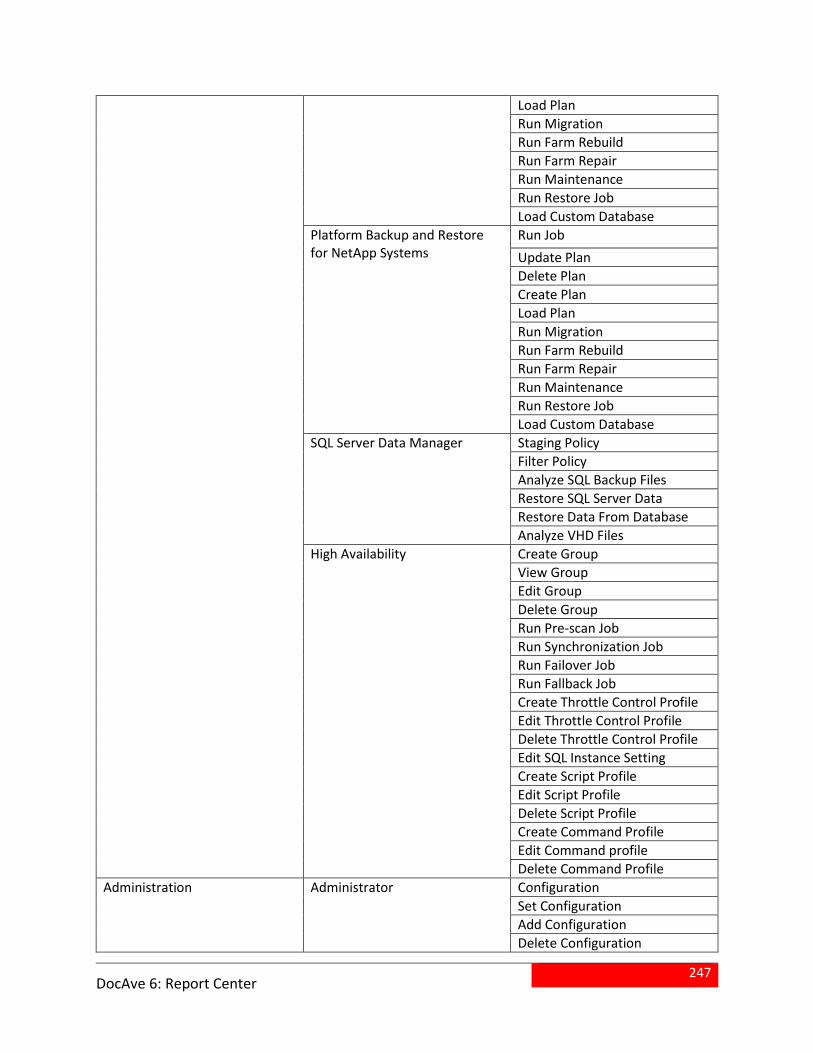
247
DocAve 6: Report Center
Load Plan
Run Migration
Run Farm Rebuild
Run Farm Repair
Run Maintenance
Run Restore Job
Load Custom Database
Platform Backup and Restore for NetApp Systems
Run Job
Update Plan
Delete Plan
Create Plan
Load Plan
Run Migration
Run Farm Rebuild
Run Farm Repair
Run Maintenance
Run Restore Job
Load Custom Database
SQL Server Data Manager Staging Policy
Filter Policy
Analyze SQL Backup Files
Restore SQL Server Data
Restore Data From Database
Analyze VHD Files
High Availability Create Group
View Group
Edit Group
Delete Group
Run Pre-scan Job
Run Synchronization Job
Run Failover Job
Run Fallback Job
Create Throttle Control Profile
Edit Throttle Control Profile
Delete Throttle Control Profile
Edit SQL Instance Setting
Create Script Profile
Edit Script Profile
Delete Script Profile
Create Command Profile
Edit Command profile
Delete Command Profile
Administration
Administrator
Configuration
Set Configuration
Add Configuration
Delete Configuration
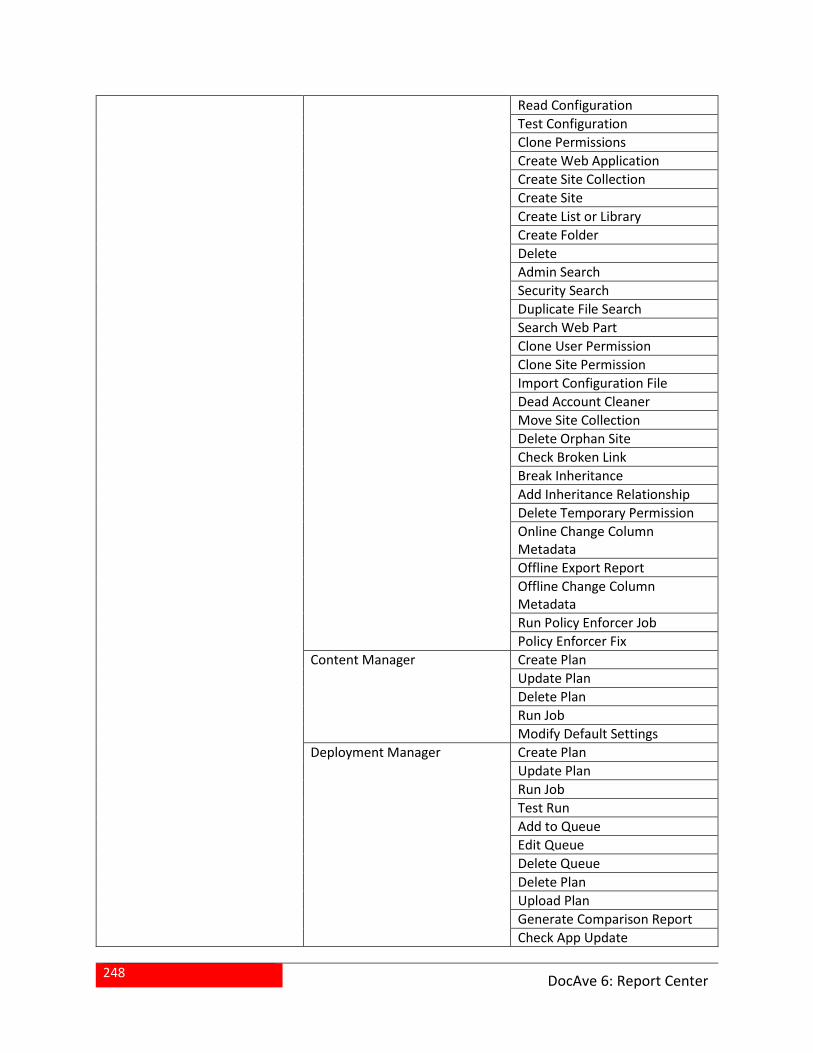
248
DocAve 6: Report Center
Read Configuration
Test Configuration
Clone Permissions
Create Web Application
Create Site Collection
Create Site
Create List or Library
Create Folder
Delete
Admin Search
Security Search
Duplicate File Search
Search Web Part
Clone User Permission
Clone Site Permission
Import Configuration File
Dead Account Cleaner
Move Site Collection
Delete Orphan Site
Check Broken Link
Break Inheritance
Add Inheritance Relationship
Delete Temporary Permission
Online Change Column Metadata
Offline Export Report
Offline Change Column Metadata
Run Policy Enforcer Job
Policy Enforcer Fix
Content Manager Create Plan
Update Plan
Delete Plan
Run Job
Modify Default Settings
Deployment Manager Create Plan
Update Plan
Run Job
Test Run
Add to Queue
Edit Queue
Delete Queue
Delete Plan
Upload Plan
Generate Comparison Report
Check App Update
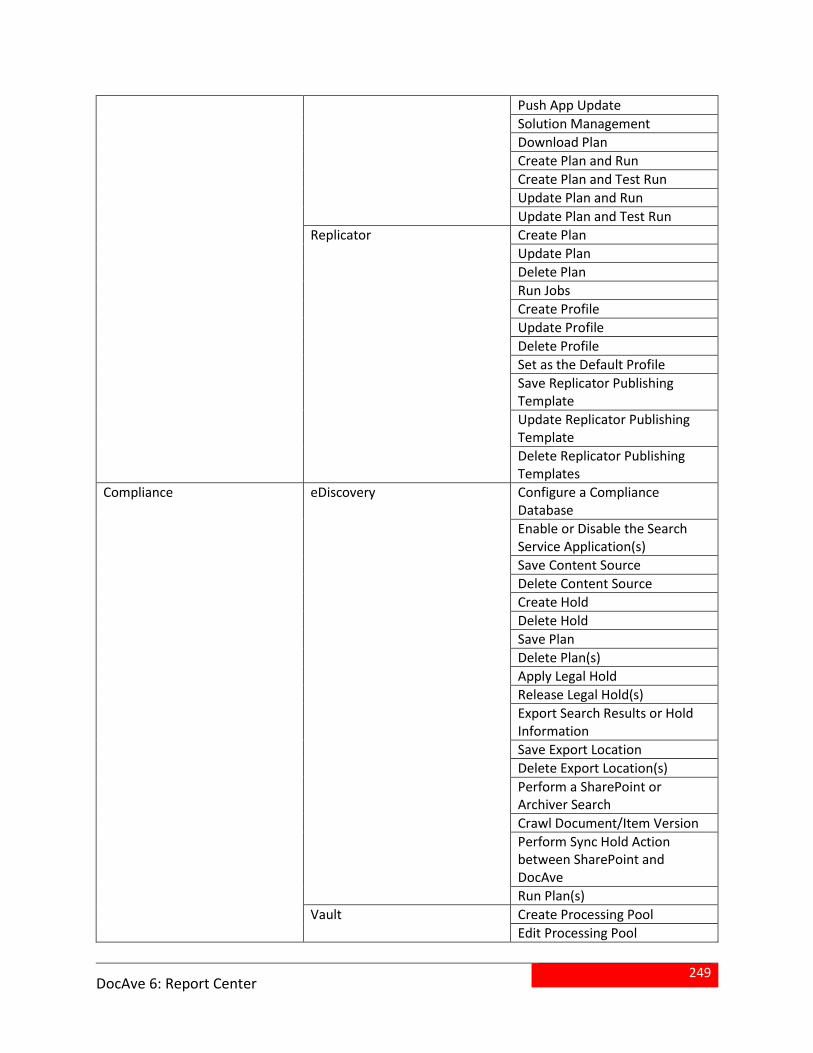
249
DocAve 6: Report Center
Push App Update
Solution Management
Download Plan
Create Plan and Run
Create Plan and Test Run
Update Plan and Run
Update Plan and Test Run
Replicator Create Plan
Update Plan
Delete Plan
Run Jobs
Create Profile
Update Profile
Delete Profile
Set as the Default Profile
Save Replicator Publishing Template
Update Replicator Publishing Template
Delete Replicator Publishing Templates
Compliance
eDiscovery Configure a Compliance Database
Enable or Disable the Search Service Application(s)
Save Content Source
Delete Content Source
Create Hold
Delete Hold
Save Plan
Delete Plan(s)
Apply Legal Hold
Release Legal Hold(s)
Export Search Results or Hold Information
Save Export Location
Delete Export Location(s)
Perform a SharePoint or Archiver Search
Crawl Document/Item Version
Perform Sync Hold Action between SharePoint and DocAve
Run Plan(s)
Vault Create Processing Pool
Edit Processing Pool
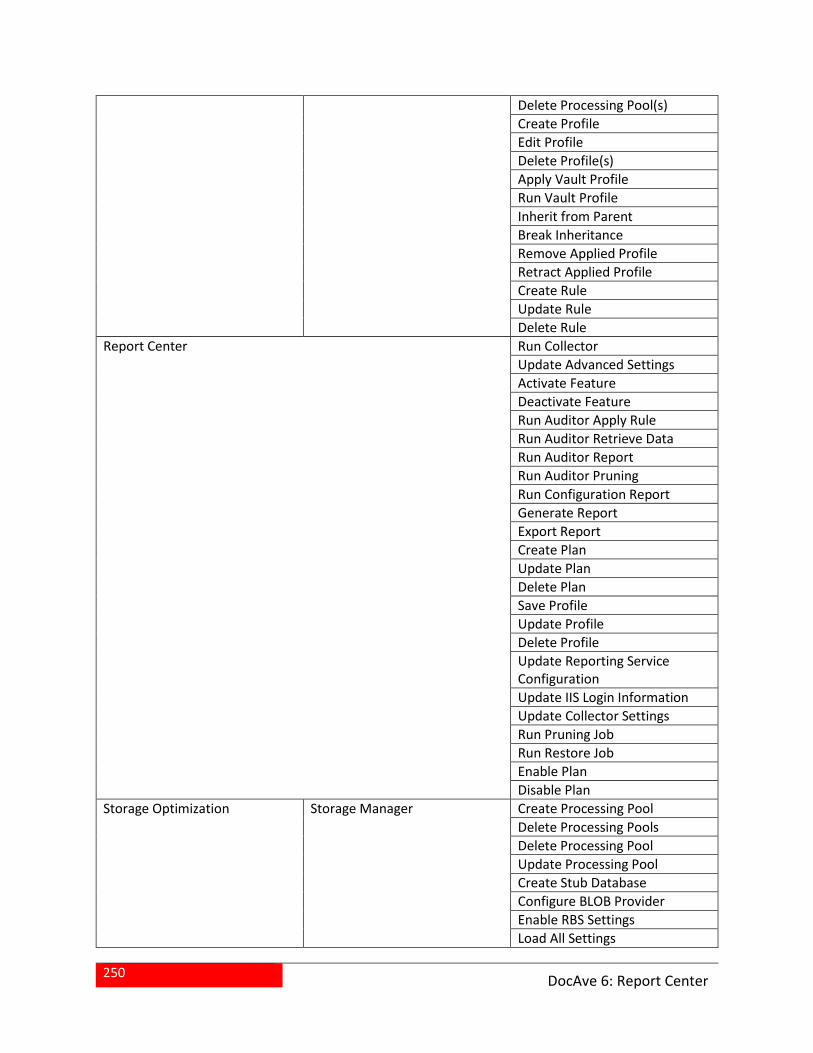
250
DocAve 6: Report Center
Delete Processing Pool(s)
Create Profile
Edit Profile
Delete Profile(s)
Apply Vault Profile
Run Vault Profile
Inherit from Parent
Break Inheritance
Remove Applied Profile
Retract Applied Profile
Create Rule
Update Rule
Delete Rule
Report Center
Run Collector
Update Advanced Settings
Activate Feature
Deactivate Feature
Run Auditor Apply Rule
Run Auditor Retrieve Data
Run Auditor Report
Run Auditor Pruning
Run Configuration Report
Generate Report
Export Report
Create Plan
Update Plan
Delete Plan
Save Profile
Update Profile
Delete Profile
Update Reporting Service Configuration
Update IIS Login Information
Update Collector Settings
Run Pruning Job
Run Restore Job
Enable Plan
Disable Plan
Storage Optimization
Storage Manager Create Processing Pool
Delete Processing Pools
Delete Processing Pool
Update Processing Pool
Create Stub Database
Configure BLOB Provider
Enable RBS Settings
Load All Settings
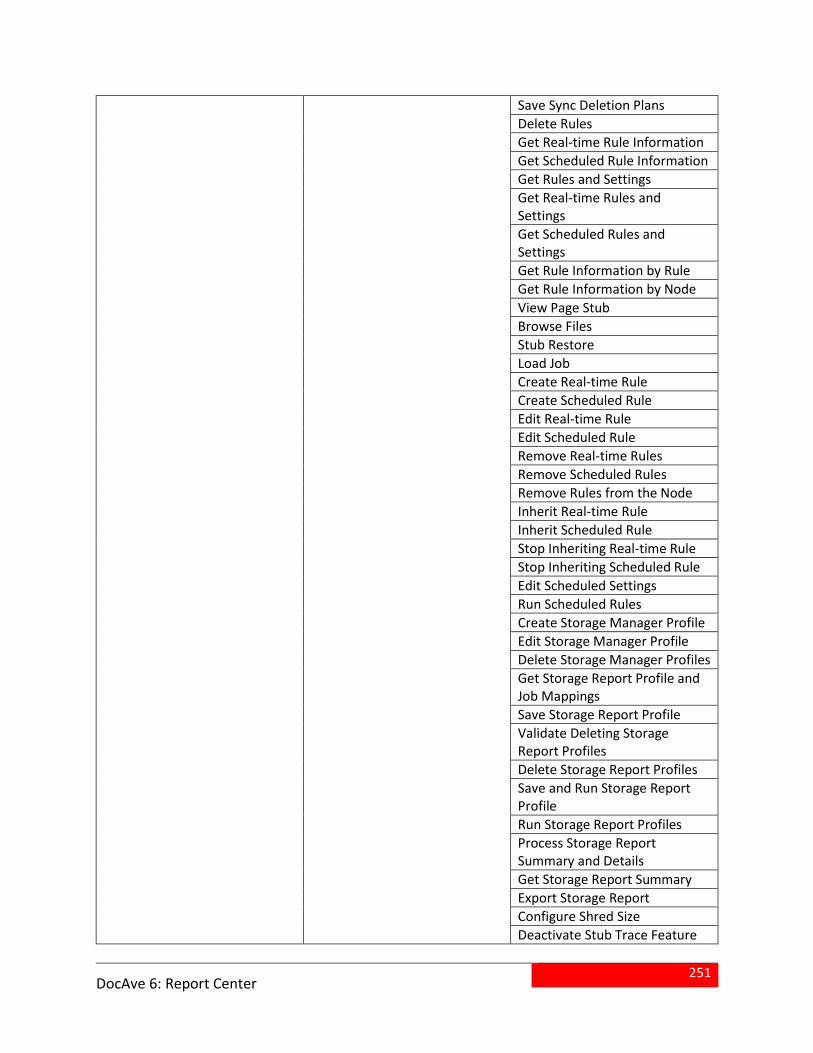
251
DocAve 6: Report Center
Save Sync Deletion Plans
Delete Rules
Get Real-time Rule Information
Get Scheduled Rule Information
Get Rules and Settings
Get Real-time Rules and Settings
Get Scheduled Rules and Settings
Get Rule Information by Rule
Get Rule Information by Node
View Page Stub
Browse Files
Stub Restore
Load Job
Create Real-time Rule
Create Scheduled Rule
Edit Real-time Rule
Edit Scheduled Rule
Remove Real-time Rules
Remove Scheduled Rules
Remove Rules from the Node
Inherit Real-time Rule
Inherit Scheduled Rule
Stop Inheriting Real-time Rule
Stop Inheriting Scheduled Rule
Edit Scheduled Settings
Run Scheduled Rules
Create Storage Manager Profile
Edit Storage Manager Profile
Delete Storage Manager Profiles
Get Storage Report Profile and Job Mappings
Save Storage Report Profile
Validate Deleting Storage Report Profiles
Delete Storage Report Profiles
Save and Run Storage Report Profile
Run Storage Report Profiles
Process Storage Report Summary and Details
Get Storage Report Summary
Export Storage Report
Configure Shred Size
Deactivate Stub Trace Feature
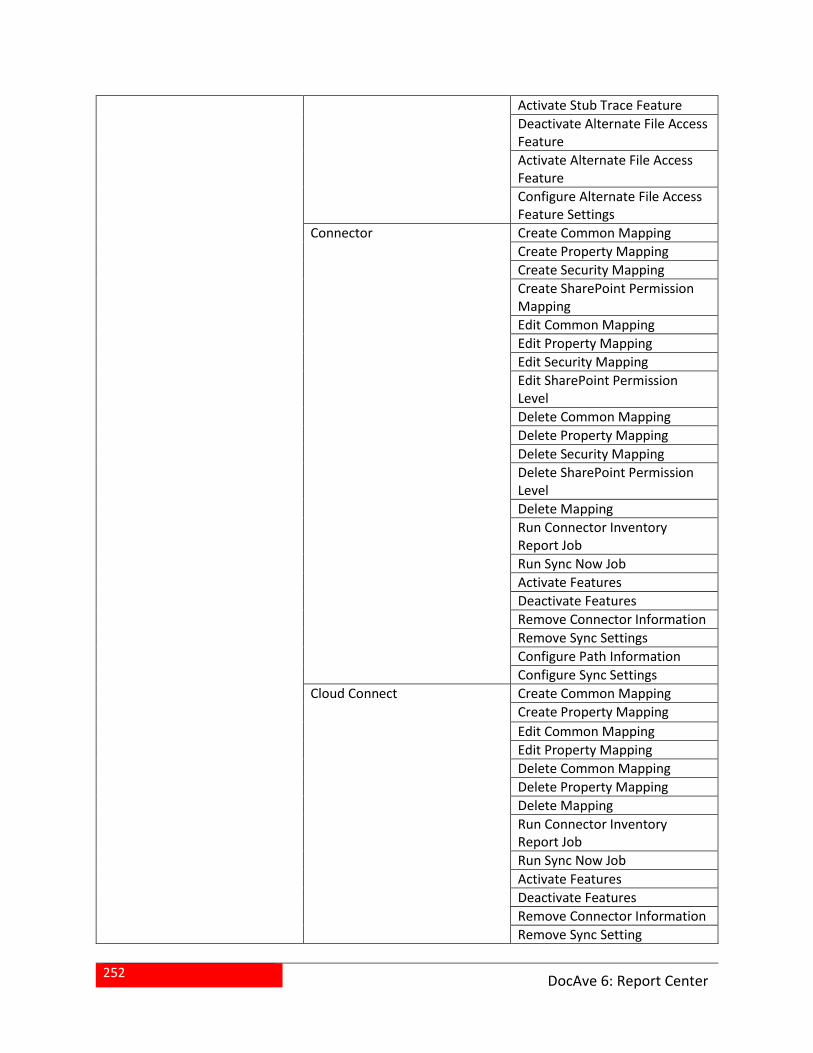
252
DocAve 6: Report Center
Activate Stub Trace Feature
Deactivate Alternate File Access Feature
Activate Alternate File Access Feature
Configure Alternate File Access Feature Settings
Connector Create Common Mapping
Create Property Mapping
Create Security Mapping
Create SharePoint Permission Mapping
Edit Common Mapping
Edit Property Mapping
Edit Security Mapping
Edit SharePoint Permission Level
Delete Common Mapping
Delete Property Mapping
Delete Security Mapping
Delete SharePoint Permission Level
Delete Mapping
Run Connector Inventory Report Job
Run Sync Now Job
Activate Features
Deactivate Features
Remove Connector Information
Remove Sync Settings
Configure Path Information
Configure Sync Settings
Cloud Connect Create Common Mapping
Create Property Mapping
Edit Common Mapping
Edit Property Mapping
Delete Common Mapping
Delete Property Mapping
Delete Mapping
Run Connector Inventory Report Job
Run Sync Now Job
Activate Features
Deactivate Features
Remove Connector Information
Remove Sync Setting
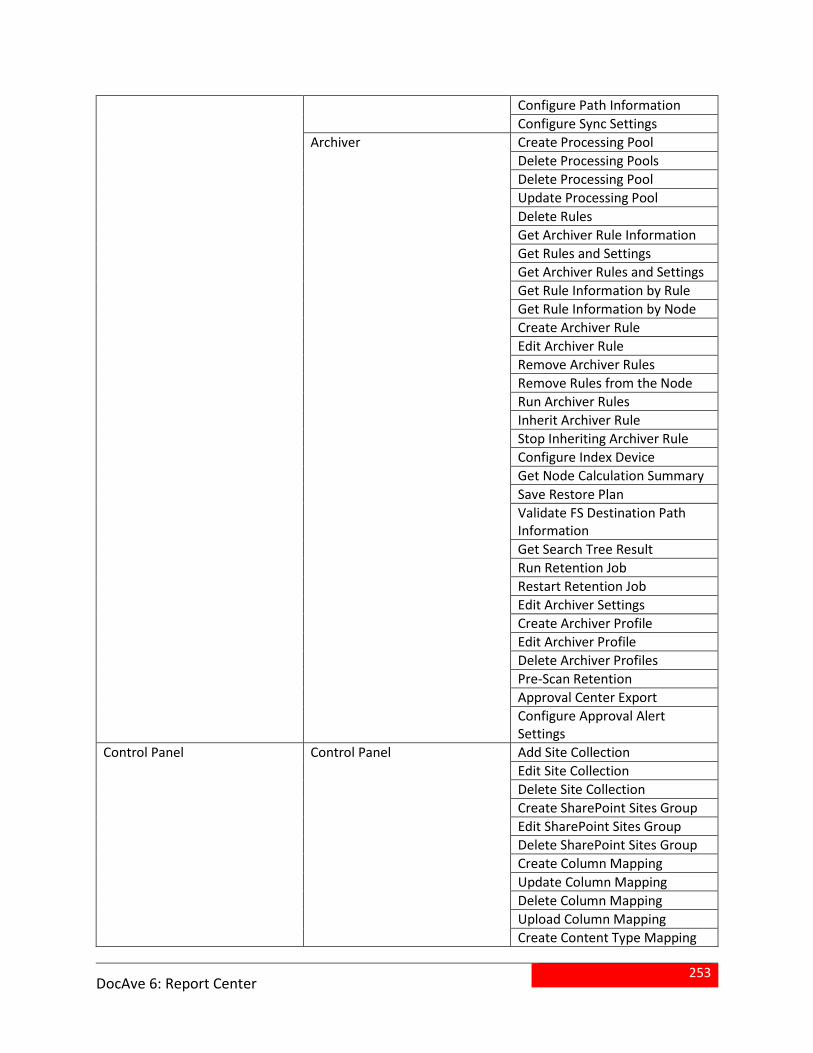
253
DocAve 6: Report Center
Configure Path Information
Configure Sync Settings
Archiver Create Processing Pool
Delete Processing Pools
Delete Processing Pool
Update Processing Pool
Delete Rules
Get Archiver Rule Information
Get Rules and Settings
Get Archiver Rules and Settings
Get Rule Information by Rule
Get Rule Information by Node
Create Archiver Rule
Edit Archiver Rule
Remove Archiver Rules
Remove Rules from the Node
Run Archiver Rules
Inherit Archiver Rule
Stop Inheriting Archiver Rule
Configure Index Device
Get Node Calculation Summary
Save Restore Plan
Validate FS Destination Path Information
Get Search Tree Result
Run Retention Job
Restart Retention Job
Edit Archiver Settings
Create Archiver Profile
Edit Archiver Profile
Delete Archiver Profiles
Pre-Scan Retention
Approval Center Export
Configure Approval Alert Settings
Control Panel
Control Panel Add Site Collection
Edit Site Collection
Delete Site Collection
Create SharePoint Sites Group
Edit SharePoint Sites Group
Delete SharePoint Sites Group
Create Column Mapping
Update Column Mapping
Delete Column Mapping
Upload Column Mapping
Create Content Type Mapping
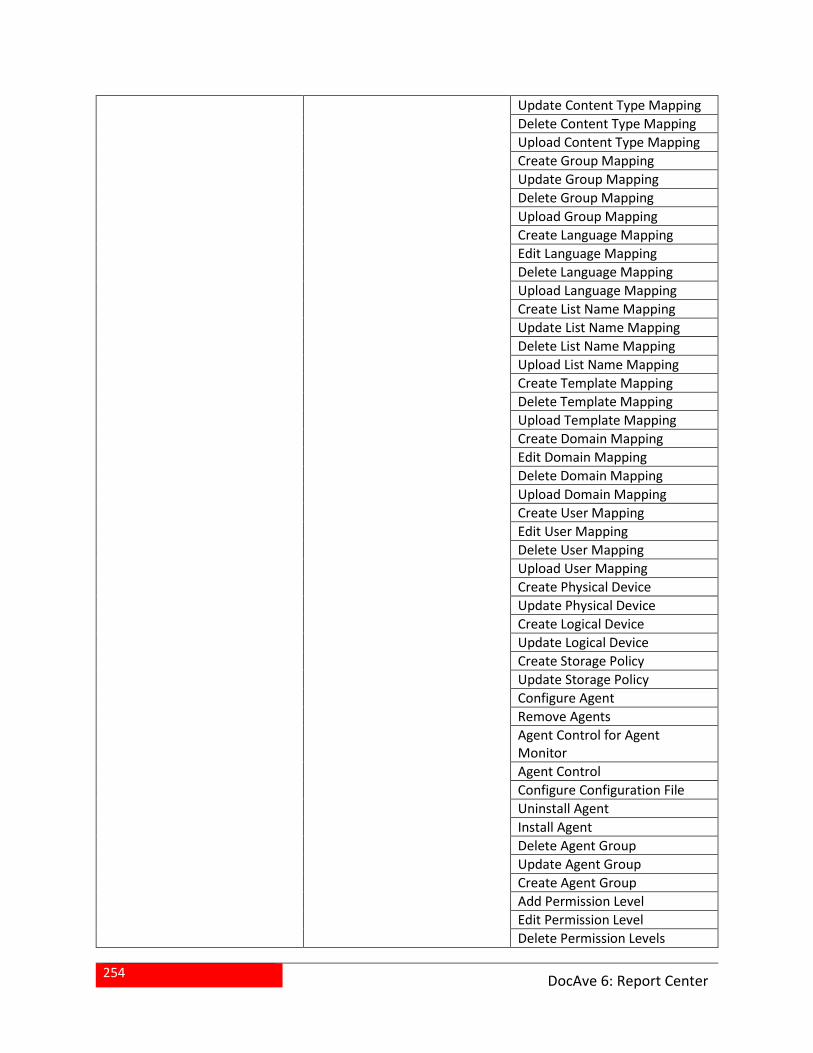
254
DocAve 6: Report Center
Update Content Type Mapping
Delete Content Type Mapping
Upload Content Type Mapping
Create Group Mapping
Update Group Mapping
Delete Group Mapping
Upload Group Mapping
Create Language Mapping
Edit Language Mapping
Delete Language Mapping
Upload Language Mapping
Create List Name Mapping
Update List Name Mapping
Delete List Name Mapping
Upload List Name Mapping
Create Template Mapping
Delete Template Mapping
Upload Template Mapping
Create Domain Mapping
Edit Domain Mapping
Delete Domain Mapping
Upload Domain Mapping
Create User Mapping
Edit User Mapping
Delete User Mapping
Upload User Mapping
Create Physical Device
Update Physical Device
Create Logical Device
Update Logical Device
Create Storage Policy
Update Storage Policy
Configure Agent
Remove Agents
Agent Control for Agent Monitor
Agent Control
Configure Configuration File
Uninstall Agent
Install Agent
Delete Agent Group
Update Agent Group
Create Agent Group
Add Permission Level
Edit Permission Level
Delete Permission Levels
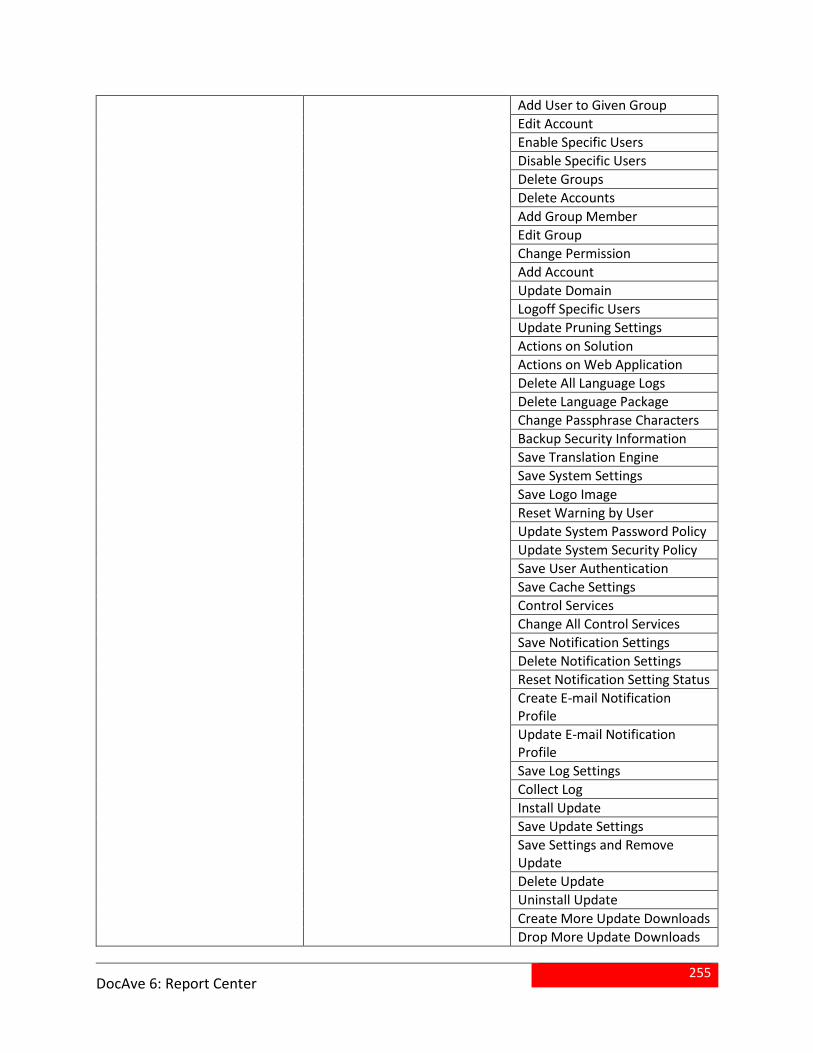
255
DocAve 6: Report Center
Add User to Given Group
Edit Account
Enable Specific Users
Disable Specific Users
Delete Groups
Delete Accounts
Add Group Member
Edit Group
Change Permission
Add Account
Update Domain
Logoff Specific Users
Update Pruning Settings
Actions on Solution
Actions on Web Application
Delete All Language Logs
Delete Language Package
Change Passphrase Characters
Backup Security Information
Save Translation Engine
Save System Settings
Save Logo Image
Reset Warning by User
Update System Password Policy
Update System Security Policy
Save User Authentication
Save Cache Settings
Control Services
Change All Control Services
Save Notification Settings
Delete Notification Settings
Reset Notification Setting Status
Create E-mail Notification Profile
Update E-mail Notification Profile
Save Log Settings
Collect Log
Install Update
Save Update Settings
Save Settings and Remove Update
Delete Update
Uninstall Update
Create More Update Downloads
Drop More Update Downloads
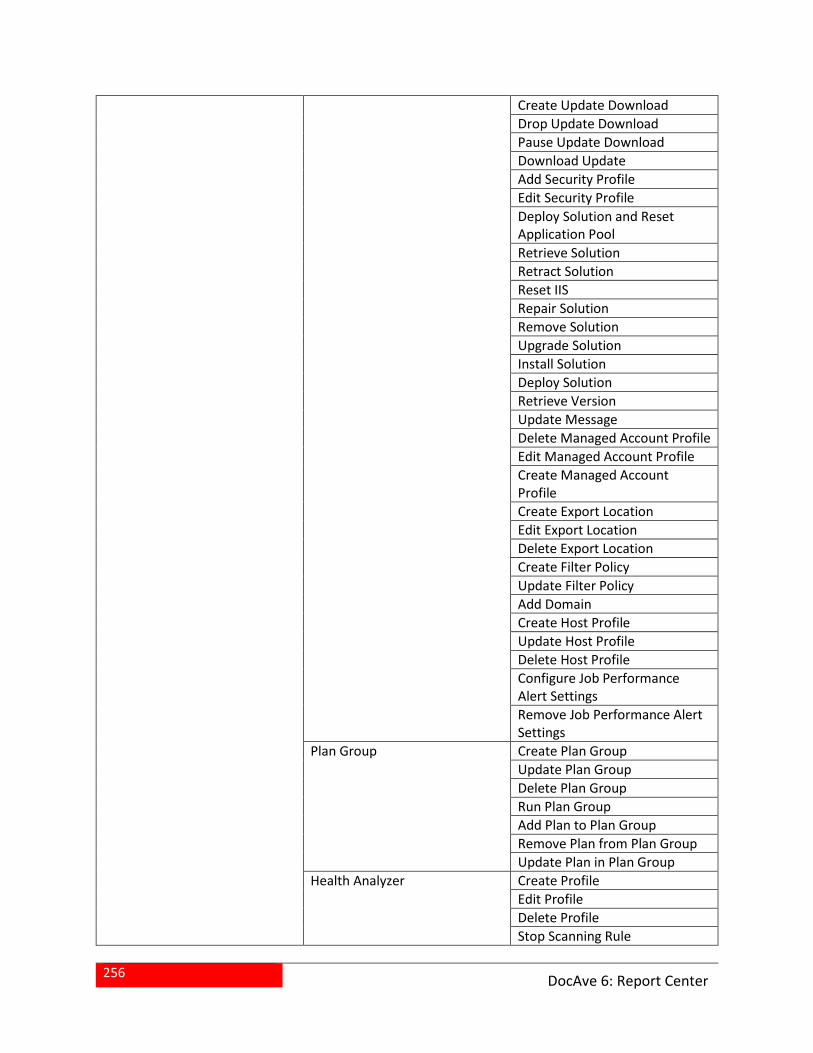
256
DocAve 6: Report Center
Create Update Download
Drop Update Download
Pause Update Download
Download Update
Add Security Profile
Edit Security Profile
Deploy Solution and Reset Application Pool
Retrieve Solution
Retract Solution
Reset IIS
Repair Solution
Remove Solution
Upgrade Solution
Install Solution
Deploy Solution
Retrieve Version
Update Message
Delete Managed Account Profile
Edit Managed Account Profile
Create Managed Account Profile
Create Export Location
Edit Export Location
Delete Export Location
Create Filter Policy
Update Filter Policy
Add Domain
Create Host Profile
Update Host Profile
Delete Host Profile
Configure Job Performance Alert Settings
Remove Job Performance Alert Settings
Plan Group Create Plan Group
Update Plan Group
Delete Plan Group
Run Plan Group
Add Plan to Plan Group
Remove Plan from Plan Group
Update Plan in Plan Group
Health Analyzer Create Profile
Edit Profile
Delete Profile
Stop Scanning Rule
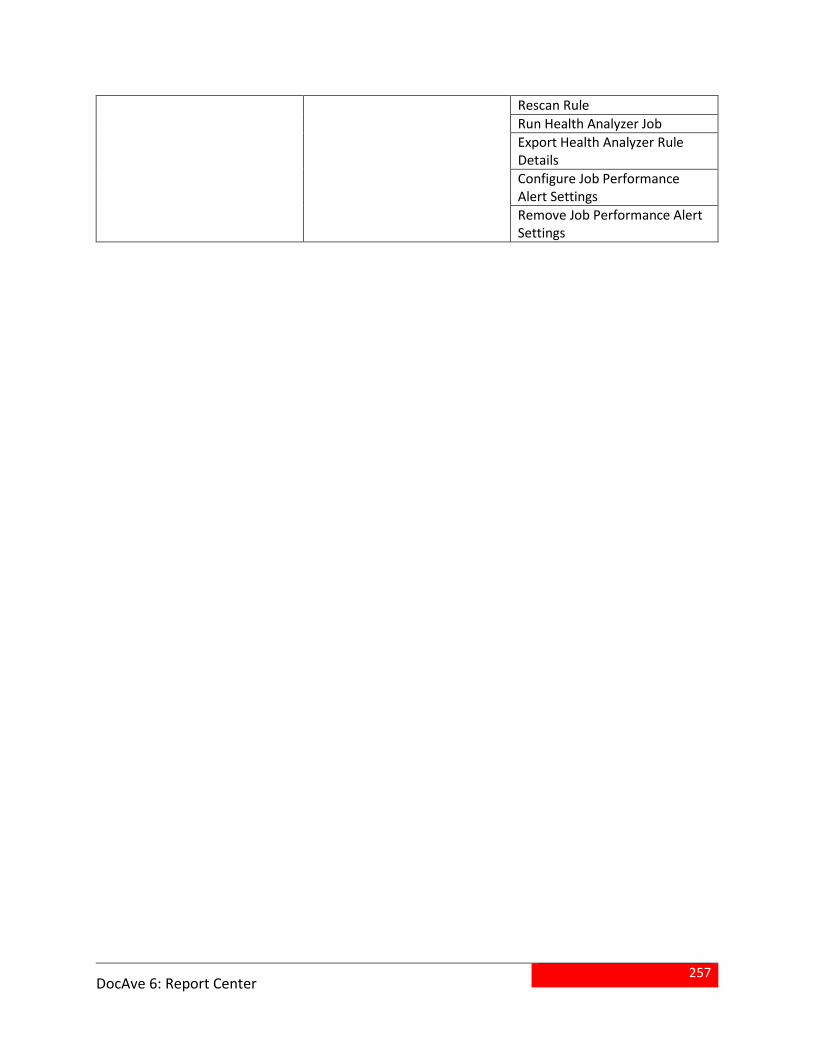
257
DocAve 6: Report Center
Rescan Rule
Run Health Analyzer Job
Export Health Analyzer Rule Details
Configure Job Performance Alert Settings
Remove Job Performance Alert Settings
258
DocAve 6: Report Center
Appendix C: Advanced Configurations
Customizing the Report Template
Report Template is used to standardize the formats of the different report types. To customize Report
Template, complete the following steps:
1. From Microsoft Windows, navigate to Start > All Programs > Microsoft SQL Server 2008 R2 > Configuration Tools > Reporting Service Configuration Manager, and then connect to your SQL Server. The Report Service Configuration Manager interface appears.
2. Click Report Manager URL tab in the left pane, and then click the corresponding URL link in the right pane to access it with your browser.
3. The browser displays the SQL Server Reporting Services Home page. In this page, double-click to open the DocAve6RDLFolder and find the report template you want to edit.
4. Hover your mouse over the template you want to edit, and click the downward arrow to open the drop-down menu. Click Download to save a local copy of the template in the specified location. After you have saved the copy of the specified template file, click Edit in Report Builder in the drop-down menu to edit the template file.
5. Perform the customization in Microsoft SQL Server Report Builder and save the modifications once you are satisfied with them.
Visualize the XLSX Report Data Using SharePoint Chart Web Part
The following configurations allow you to combine the SharePoint Chart Web Part functionality with the
publishing reports to SharePoint document library function of DocAve. After you have exported XLSX
report files to the SharePoint document library, you can use the chart Web part in SharePoint to
generate the chart and display the exported XLSX format report data.
To generate the chart for the XLSX format report, complete the following steps:
1. In SharePoint, navigate to Site Actions > Edit Page, and then click Insert on the ribbon. The Insert tab will appear. Make sure the chart Web part and the XLSX report used by the chart Web part are in the same Web application.
2. Click Web Part on the ribbon, or click the Add a Web Part area to add a Web part.
3. Select Business Data in the Categories list, and then select the Chart Web Part from the Web Parts group. Click Add, and then a chart Web part appears.
4. In the Chart Web Part area, click Data & Appearance to enter the Data Connection & Chart Appearance Wizards page.
259
DocAve 6: Report Center
5. Click Connect Chart to Data to enter the Data Connection Wizard page to help you connect your chart Web part to a data source, and complete the following steps:
Step 1: Choose a Data Source ─ Select the Connect to Excel Service radio button to connect the chart Web part to the data from an Excel workbook using Excel Services. Click Next to go to the next step.
Step 2: Connect to Data from Excel Services ─ Configure the Excel Services Connection. The Excel Web Service URL is entered by default.
Enter the XLSX report file’s full URL into the Excel Workbook Path text box, for example, http://avepoint:10000/sites/docave/DocAve Report Center Reports/Site Activity Ranking.XLSX. Then, enter the valid range into the Range Name text box. The First Row Contains Column Names checkbox was checked by default. Therefore, the values in the first row will be regarded as the table header, and they are not regarded as data. Click Next to go to the next step.
Step 3: Retrieve and Filter Data ─ You can view the data that is retrieved from Excel Services being displayed in the list. Optionally, you can add parameters to filter the data in the Filters area. Click Next to go the next step.
Step 4: Bind Chart to Data ─ Refer to the image in the left for the associations of the various chart elements. You can perform the configurations on the right to customize your chart, such as customize the Y field and X field.
Click Finish, and you can view the chart in the added chart Web part.
6. Once the latest XLSX report is exported to the specified location with the same name, the data in the chart will be refreshed. The added chart Web part always displays the newest data of the exported XLSX report.
Configuring the ReportCenterServiceCustomProperties.config File
By configuring the settings of nodes in the ReportCenterServiceCustomProperties.config file, you can
customize the default settings of some reports. To configure settings in this file, complete the steps
below:
*Note: If you have multiple Report services in your DocAve system, you must configure the same
settings in the ReportCenterServiceCustomProperties.config file on each Report service server.
1. Navigate to the …\AvePoint\DocAve6\Manager\Report\bin directory on the Report service server.
3. Locate and open the ReportCenterServiceCustomProperties.config using Notepad.
4. You can configure the following nodes to customize the corresponding settings:
<FileExtensionFilter> – This node allows you to configure a file extension filter to exclude the files of some types from the report of the Top Documents Web part. Add the file extensions of the file types you want to exclude into the value of this node, separating them with semicolons. Only when your DocAve is updated from DocAve 6 Service Pack 5, the default value of this node is master;aspx;css;jpg;png;js;gif;
260
DocAve 6: Report Center
otherwise, there will be no value for this node. For filtering what data to be displayed on Web parts, refer to Usage Activity Web Parts Settings for details.
<LastAccessedTimeUserFilter> – This node allows you to filter and exclude some users from the Last Accessed Time report in the Report Center Dashboard Web part. Add the login name (in the format: Domain\Username) of each user you want to exclude into the value of this node, separating each login name with a semicolon. For example: <LastAccessedTimeUserFilter> Domain\User1;Domain\User2</LastAccessedTimeUserFilter>.
*Note: This node only exists when your DocAve version is updated from DocAve 6
Service Pack 5, and it will not work after the update. To filter users for Last Accessed
Time Web part, navigate to Report Center > Settings > Usage Activity Web Parts
Settings. For details, refer to Usage Activity Web Parts Settings.
<LastAccessedTimetartTime> – This node allows you to configure the time range (in month) covered in the Last Accessed Time report in the Report Center Dashboard Web part. The default value of this node is 6, representing that the time range covered in the Last Accessed Time report is the current month and the last 6 months. To customize this time range, set the value to a desired integer to specify how many months in the past plus the current month you want to cover in the report. For example, if you want to report on the last accessed time data in the current month and the last 3 months, set the value of this node to 3. If today is October 28th, the Last Accessed Time report can report on the time range July 1st to October 28th.
<UserProfileCustomProperties> – This node allows you to configure the additional user properties you want to include in the exported Active Users report of a Usage Reports plan. Add each of the desired user properties as a sub node within this node in the format: < PropertyName>DisplayName</ PropertyName>.
o PropertyName – Enter the name of the desired user property defined in the your currently used User Profile service application.
o DisplayName – Enter a display name for the user property in the exported Active Users report. The entered display name will be the column name for the column that displays the values of this user property in the exported Active Users report.
For example, if you want to include a user property named AccountName in the report,
and display the property values in a column named Account Name in the report, add
the sub node <AccountName> Account Name</AccountName>.
<IISLogClientIPCustomFieldName> – This node allows you to designate a custom field in IIS logs for Auditor Controller collecting IP address information. Add the custom field name into the value of this node. For example: <IISLogClientIPCustomFieldName>Source Type</IISLogClientIPCustomFieldName>. By default, the value of this node is empty, and the Auditor Controller collects IP address information from the Client IP Address (c-ip) logging field.
5. Save the change and close the file.
261
DocAve 6: Report Center
Configuring the ReportCenterServiceProperties.config File
By configuring the ReportCenterServiceProperties.config file on each Report Service servers, you can
customize some advanced settings related to the data collection. To configure settings in this file,
complete the steps below:
1. Navigate to the …\AvePoint\DocAve6\Manager\Report\bin directory on the Report service server.
2. Locate and open the ReportCenterServiceProperties.config file using Notepad.
3. You can configure the following nodes to customize the corresponding settings:
<UserProfileSyncMode> – This node allows you to change the mode of User Profile Collector jobs:
o 0 – 0 is the default value, representing the default mode: Incremental. When the value is 0, you can run Incremental User Profile Collector jobs in Data Collection.
o 1 – 1 represents the Full mode. When the value is 1, you can run Full User Profile Collector jobs in Data Collection.
<UsageCollectorSetting> – This node allows you to configure the user filter and URL filter to exclude the specified users and SharePoint objects whose data you do not want to collect via the Usage Collector jobs.
o <UrlFilter></UrlFilter> – Add a <Url></Url> node under this node and then enter each keyword contained in the URLs of the objects you want to exclude into the <Url></Url> sub node. For example: <Url> forms/</Url>.
o <UserFilter></UserFilter> – Add a <User></User> node under this node and then enter the user’s login name to exclude this user from the Page Traffic Report. To exclude multiple users, you must add one <User></User> node for each of the users. Refer to the following examples for entering the user’s login name:
For Active Directory user, enter ADName\username, instead of i:0#.w|ADName\username.
For FBA user, enter aspnetsqlmembershipprovider|fbauser1, instead of i:0#.f| aspnetsqlmembershipprovider|fbauser1.
For ADFS user, enter newadfs-smal|[email protected], instead of i:05.t|newadfs-smal|[email protected]
Within the <UrlFilter> sub node under the <UsageCollectorSetting> node, you can configure a URL filter to exclude the SharePoint objects whose data you do not want to collect via the Usage Collector jobs. Add each keyword contained in the URLs of the objects you want to exclude into a <Url> sub node. For example: <Url> forms/</Url>.
262
DocAve 6: Report Center
<PageTrafficCollectorSetting> – This node allows you to configure the user filter and URL filter to exclude the specified users and URLs while collecting data for the Page Traffic Report.
o <UserFilter></UserFilter> – Add a <User></User> node under this node and then enter the user’s login name to exclude this user from the Page Traffic Report. To exclude multiple users, you must add one <User></User> node for each of the users. Refer to the following examples for entering the user’s login name:
For Active Directory user, enter ADName\username, instead of i:0#.w|ADName\username.
For FBA user, enter aspnetsqlmembershipprovider|fbauser1, instead of i:0#.f| aspnetsqlmembershipprovider|fbauser1.
For ADFS user, enter newadfs-smal|[email protected], instead of i:05.t|newadfs-smal|[email protected].
<LastAccessedTimerFilters> – This node allows you to configure the user filter to exclude the specified users while collecting data for the Last Accessed Time Report.
o <UserFilter></UserFilter> – Add a <User></User> node under this node and then enter the user’s login name to exclude this user from the Last Accessed Time Report. To exclude multiple users, you must add one <User></User> node for each of the users. Refer to the following examples for entering the user’s login name:
For Active Directory user, enter ADName\username, instead of i:0#.w|ADName\username.
For FBA user, enter aspnetsqlmembershipprovider|fbauser1, instead of i:0#.f| aspnetsqlmembershipprovider|fbauser1.
For ADFS user, enter newadfs-smal|[email protected], instead of i:05.t|newadfs-smal|[email protected].
4. Save the change and close the file.
5. Restart the Report service on the current server to make the configurations in the ReportCenterServiceProperties.config file take effect.
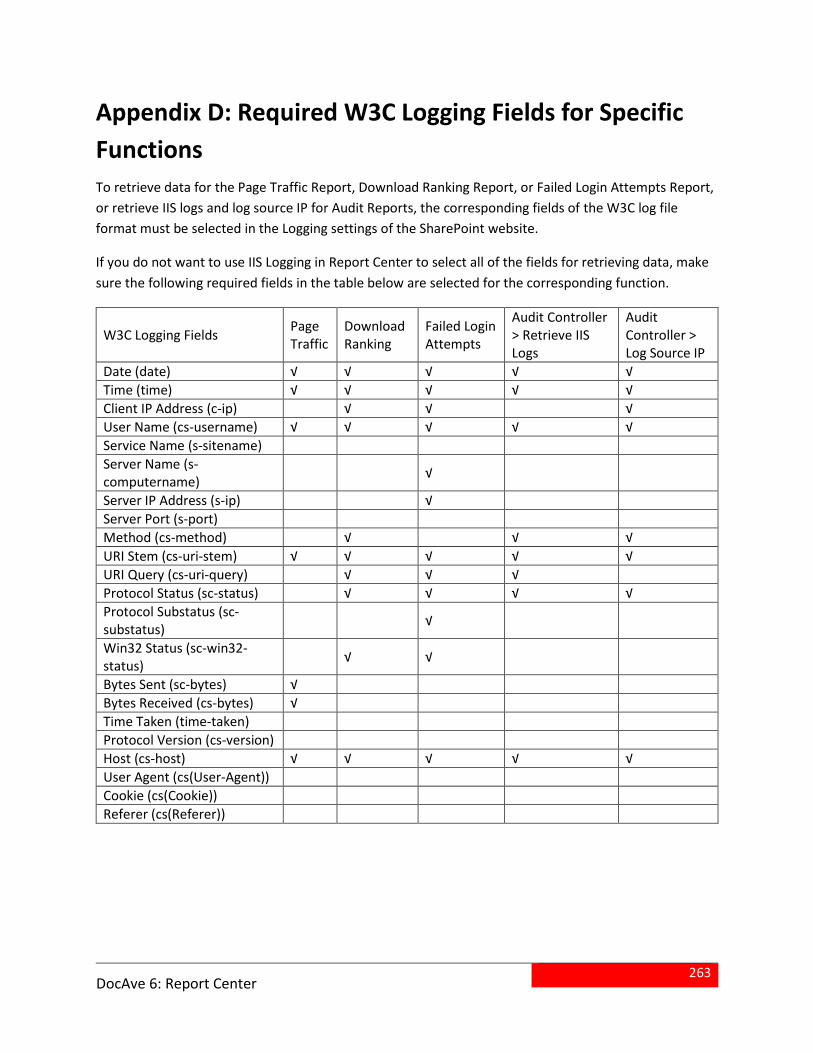
263
DocAve 6: Report Center
Appendix D: Required W3C Logging Fields for Specific
Functions
To retrieve data for the Page Traffic Report, Download Ranking Report, or Failed Login Attempts Report,
or retrieve IIS logs and log source IP for Audit Reports, the corresponding fields of the W3C log file
format must be selected in the Logging settings of the SharePoint website.
If you do not want to use IIS Logging in Report Center to select all of the fields for retrieving data, make
sure the following required fields in the table below are selected for the corresponding function.
W3C Logging Fields Page Traffic
Download Ranking
Failed Login Attempts
Audit Controller > Retrieve IIS Logs
Audit Controller > Log Source IP
Date (date) √ √ √ √ √
Time (time) √ √ √ √ √
Client IP Address (c-ip) √ √ √
User Name (cs-username) √ √ √ √ √
Service Name (s-sitename)
Server Name (s-computername)
√
Server IP Address (s-ip) √
Server Port (s-port)
Method (cs-method) √ √ √
URI Stem (cs-uri-stem) √ √ √ √ √
URI Query (cs-uri-query) √ √ √
Protocol Status (sc-status) √ √ √ √
Protocol Substatus (sc-substatus)
√
Win32 Status (sc-win32-status)
√ √
Bytes Sent (sc-bytes) √
Bytes Received (cs-bytes) √
Time Taken (time-taken)
Protocol Version (cs-version)
Host (cs-host) √ √ √ √ √
User Agent (cs(User-Agent))
Cookie (cs(Cookie))
Referer (cs(Referer))
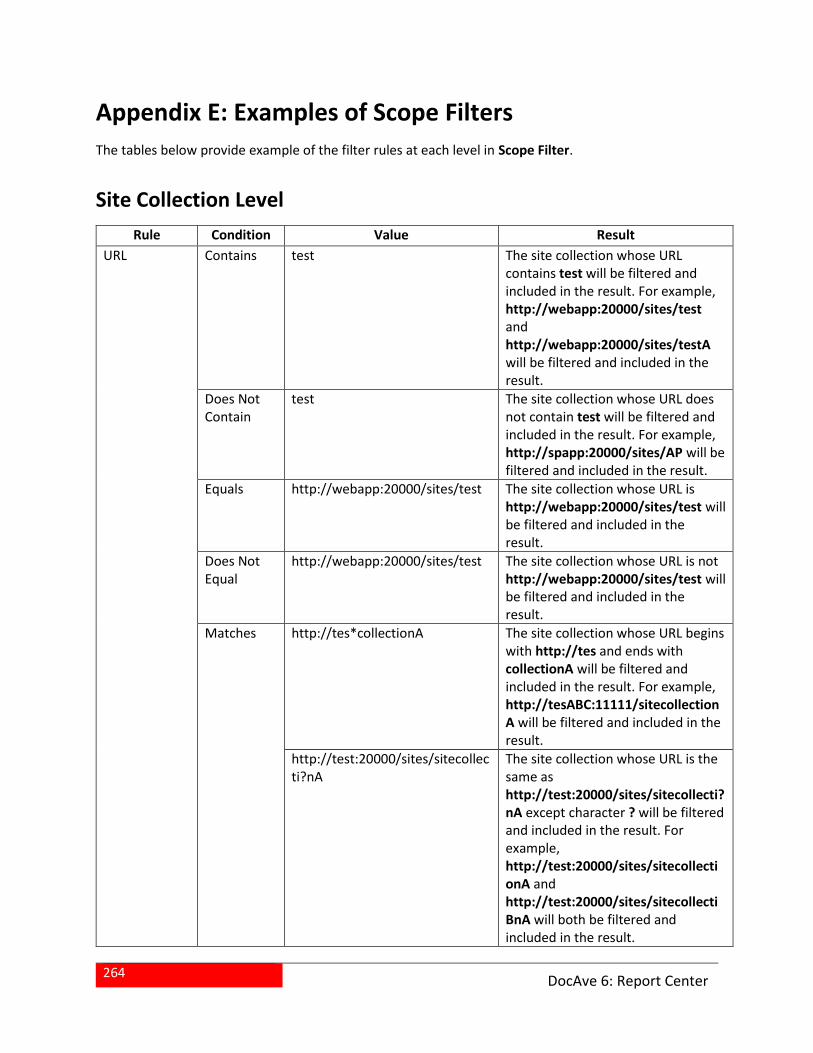
264
DocAve 6: Report Center
Appendix E: Examples of Scope Filters
The tables below provide example of the filter rules at each level in Scope Filter.
Site Collection Level
Rule Condition Value Result
URL Contains test The site collection whose URL contains test will be filtered and included in the result. For example, http://webapp:20000/sites/test and http://webapp:20000/sites/testA will be filtered and included in the result.
Does Not Contain
test The site collection whose URL does not contain test will be filtered and included in the result. For example, http://spapp:20000/sites/AP will be filtered and included in the result.
Equals http://webapp:20000/sites/test The site collection whose URL is http://webapp:20000/sites/test will be filtered and included in the result.
Does Not Equal
http://webapp:20000/sites/test The site collection whose URL is not http://webapp:20000/sites/test will be filtered and included in the result.
Matches http://tes*collectionA The site collection whose URL begins with http://tes and ends with collectionA will be filtered and included in the result. For example, http://tesABC:11111/sitecollectionA will be filtered and included in the result.
http://test:20000/sites/sitecollecti?nA
The site collection whose URL is the same as http://test:20000/sites/sitecollecti?nA except character ? will be filtered and included in the result. For example, http://test:20000/sites/sitecollectionA and http://test:20000/sites/sitecollectiBnA will both be filtered and included in the result.
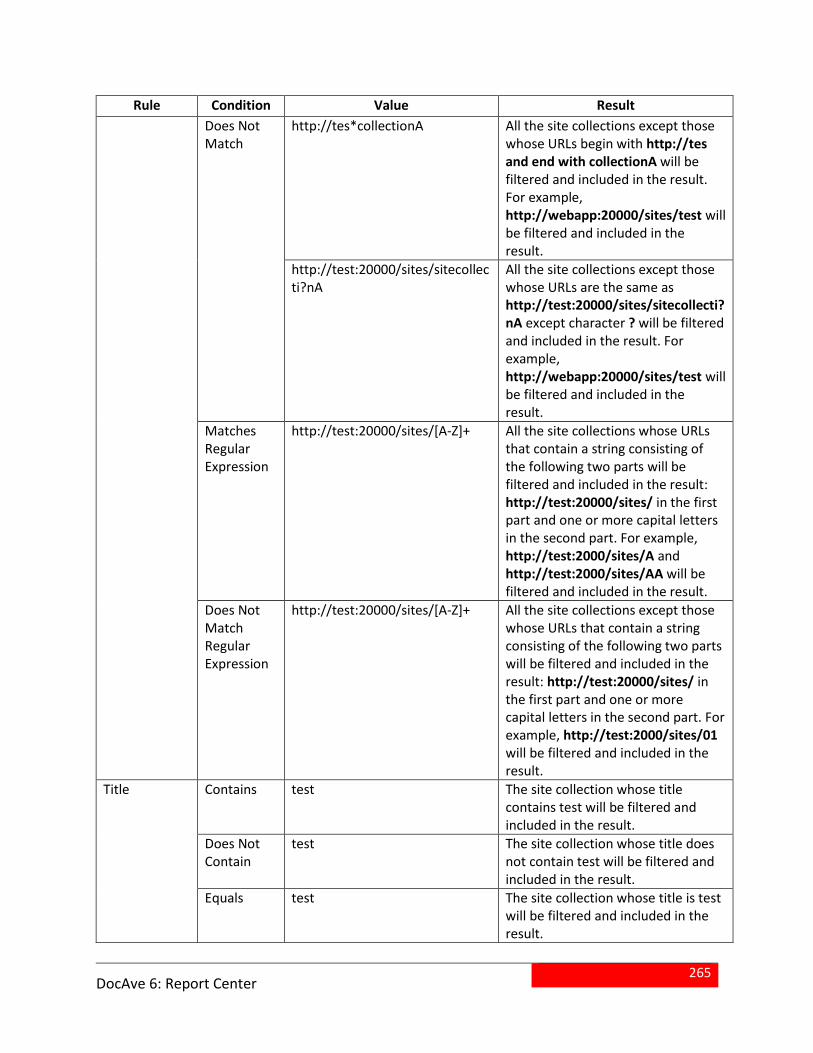
265
DocAve 6: Report Center
Rule Condition Value Result
Does Not Match
http://tes*collectionA All the site collections except those whose URLs begin with http://tes and end with collectionA will be filtered and included in the result. For example, http://webapp:20000/sites/test will be filtered and included in the result.
http://test:20000/sites/sitecollecti?nA
All the site collections except those whose URLs are the same as http://test:20000/sites/sitecollecti?nA except character ? will be filtered and included in the result. For example, http://webapp:20000/sites/test will be filtered and included in the result.
Matches Regular Expression
http://test:20000/sites/[A-Z]+ All the site collections whose URLs that contain a string consisting of the following two parts will be filtered and included in the result: http://test:20000/sites/ in the first part and one or more capital letters in the second part. For example, http://test:2000/sites/A and http://test:2000/sites/AA will be filtered and included in the result.
Does Not Match Regular Expression
http://test:20000/sites/[A-Z]+ All the site collections except those whose URLs that contain a string consisting of the following two parts will be filtered and included in the result: http://test:20000/sites/ in the first part and one or more capital letters in the second part. For example, http://test:2000/sites/01 will be filtered and included in the result.
Title Contains test The site collection whose title contains test will be filtered and included in the result.
Does Not Contain
test The site collection whose title does not contain test will be filtered and included in the result.
Equals test The site collection whose title is test will be filtered and included in the result.
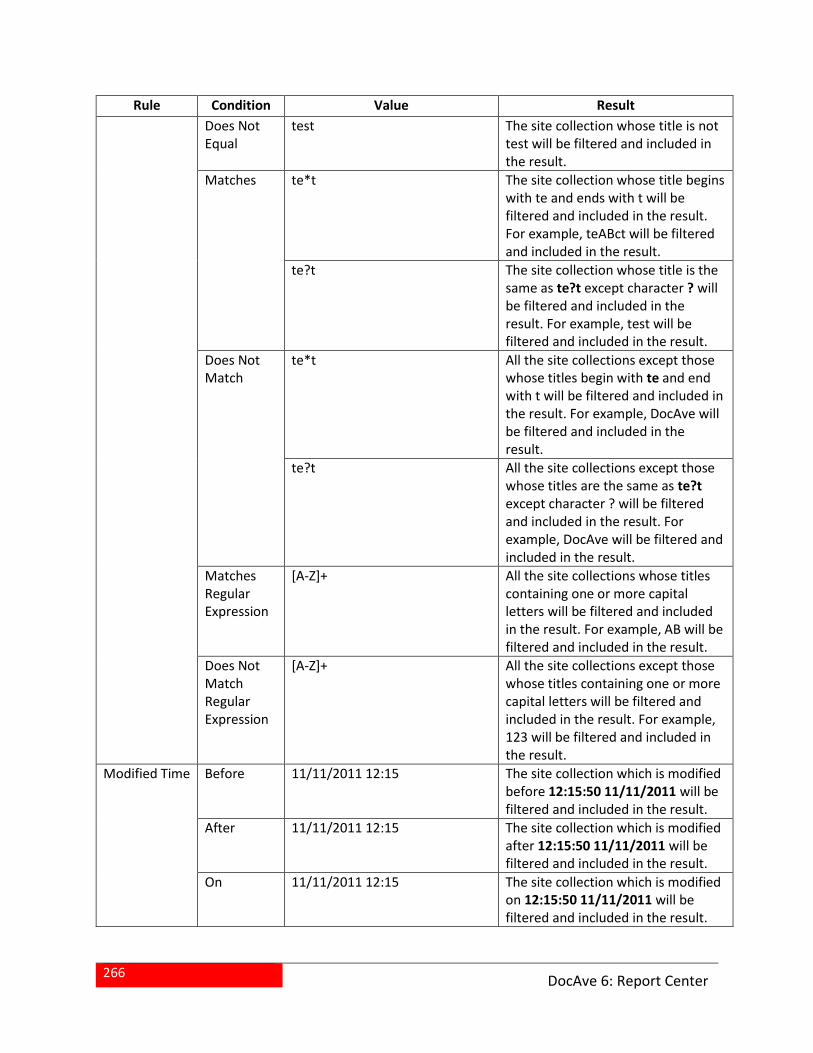
266
DocAve 6: Report Center
Rule Condition Value Result
Does Not Equal
test The site collection whose title is not test will be filtered and included in the result.
Matches te*t The site collection whose title begins with te and ends with t will be filtered and included in the result. For example, teABct will be filtered and included in the result.
te?t The site collection whose title is the same as te?t except character ? will be filtered and included in the result. For example, test will be filtered and included in the result.
Does Not Match
te*t All the site collections except those whose titles begin with te and end with t will be filtered and included in the result. For example, DocAve will be filtered and included in the result.
te?t All the site collections except those whose titles are the same as te?t except character ? will be filtered and included in the result. For example, DocAve will be filtered and included in the result.
Matches Regular Expression
[A-Z]+ All the site collections whose titles containing one or more capital letters will be filtered and included in the result. For example, AB will be filtered and included in the result.
Does Not Match Regular Expression
[A-Z]+ All the site collections except those whose titles containing one or more capital letters will be filtered and included in the result. For example, 123 will be filtered and included in the result.
Modified Time Before 11/11/2011 12:15 The site collection which is modified before 12:15:50 11/11/2011 will be filtered and included in the result.
After 11/11/2011 12:15 The site collection which is modified after 12:15:50 11/11/2011 will be filtered and included in the result.
On 11/11/2011 12:15 The site collection which is modified on 12:15:50 11/11/2011 will be filtered and included in the result.
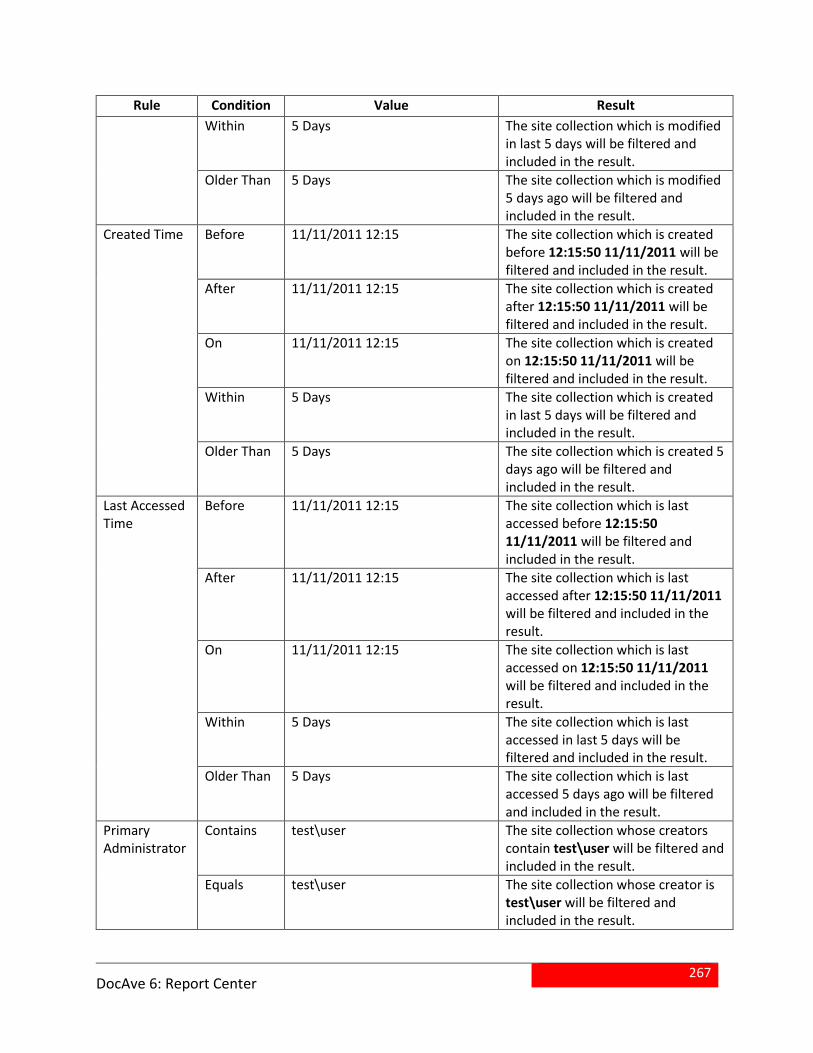
267
DocAve 6: Report Center
Rule Condition Value Result
Within 5 Days The site collection which is modified in last 5 days will be filtered and included in the result.
Older Than 5 Days The site collection which is modified 5 days ago will be filtered and included in the result.
Created Time Before 11/11/2011 12:15 The site collection which is created before 12:15:50 11/11/2011 will be filtered and included in the result.
After 11/11/2011 12:15 The site collection which is created after 12:15:50 11/11/2011 will be filtered and included in the result.
On 11/11/2011 12:15 The site collection which is created on 12:15:50 11/11/2011 will be filtered and included in the result.
Within 5 Days The site collection which is created in last 5 days will be filtered and included in the result.
Older Than 5 Days The site collection which is created 5 days ago will be filtered and included in the result.
Last Accessed Time
Before 11/11/2011 12:15 The site collection which is last accessed before 12:15:50 11/11/2011 will be filtered and included in the result.
After 11/11/2011 12:15 The site collection which is last accessed after 12:15:50 11/11/2011 will be filtered and included in the result.
On 11/11/2011 12:15 The site collection which is last accessed on 12:15:50 11/11/2011 will be filtered and included in the result.
Within 5 Days The site collection which is last accessed in last 5 days will be filtered and included in the result.
Older Than 5 Days The site collection which is last accessed 5 days ago will be filtered and included in the result.
Primary Administrator
Contains test\user The site collection whose creators contain test\user will be filtered and included in the result.
Equals test\user The site collection whose creator is test\user will be filtered and included in the result.
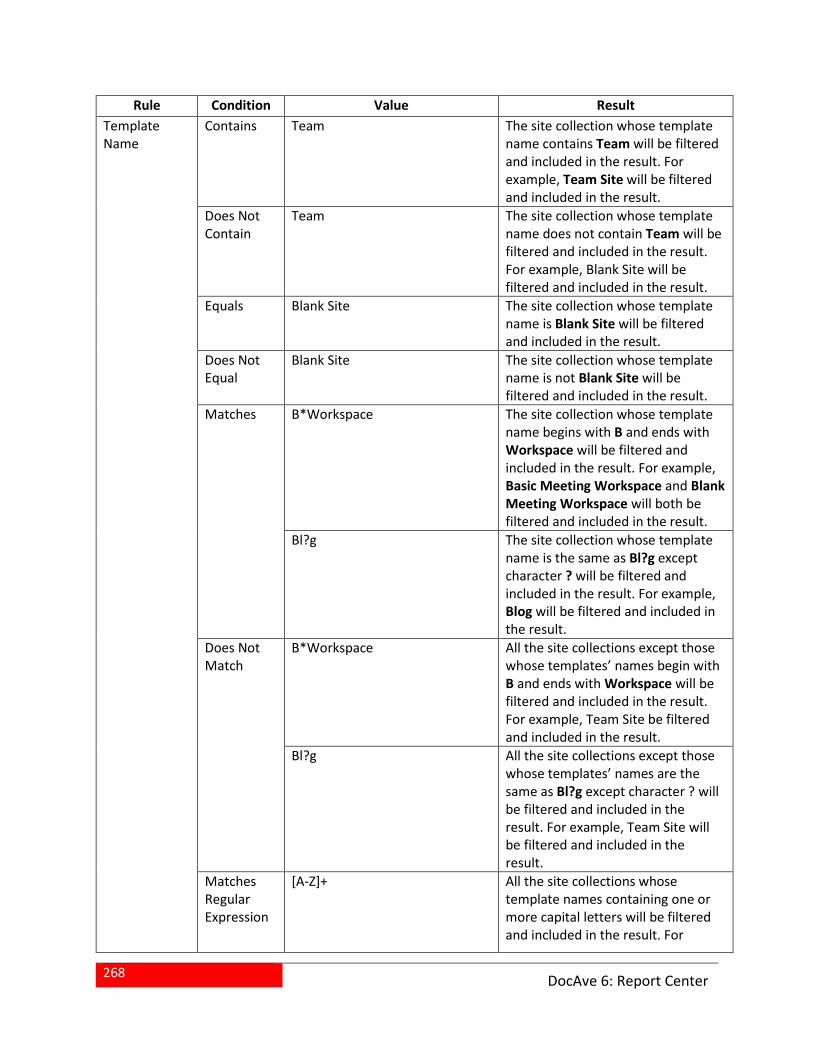
268
DocAve 6: Report Center
Rule Condition Value Result
Template Name
Contains Team The site collection whose template name contains Team will be filtered and included in the result. For example, Team Site will be filtered and included in the result.
Does Not Contain
Team The site collection whose template name does not contain Team will be filtered and included in the result. For example, Blank Site will be filtered and included in the result.
Equals Blank Site The site collection whose template name is Blank Site will be filtered and included in the result.
Does Not Equal
Blank Site The site collection whose template name is not Blank Site will be filtered and included in the result.
Matches B*Workspace The site collection whose template name begins with B and ends with Workspace will be filtered and included in the result. For example, Basic Meeting Workspace and Blank Meeting Workspace will both be filtered and included in the result.
Bl?g The site collection whose template name is the same as Bl?g except character ? will be filtered and included in the result. For example, Blog will be filtered and included in the result.
Does Not Match
B*Workspace All the site collections except those whose templates’ names begin with B and ends with Workspace will be filtered and included in the result. For example, Team Site be filtered and included in the result.
Bl?g All the site collections except those whose templates’ names are the same as Bl?g except character ? will be filtered and included in the result. For example, Team Site will be filtered and included in the result.
Matches Regular Expression
[A-Z]+ All the site collections whose template names containing one or more capital letters will be filtered and included in the result. For
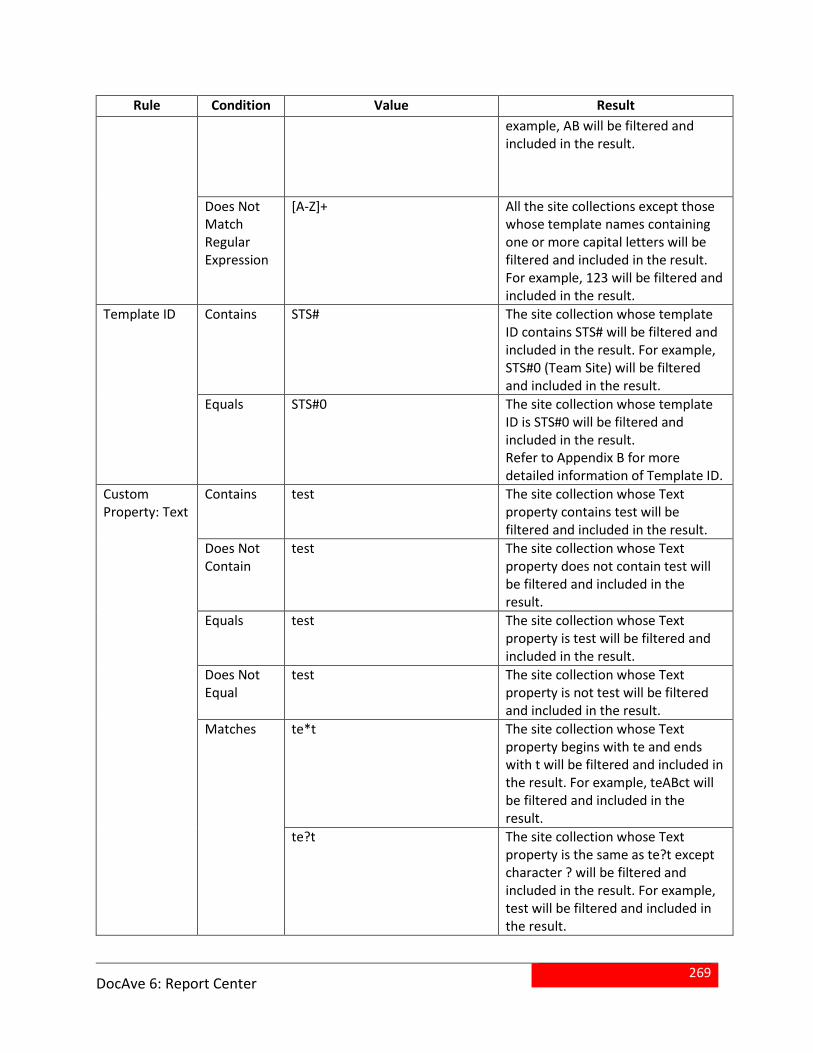
269
DocAve 6: Report Center
Rule Condition Value Result
example, AB will be filtered and included in the result.
Does Not Match Regular Expression
[A-Z]+ All the site collections except those whose template names containing one or more capital letters will be filtered and included in the result. For example, 123 will be filtered and included in the result.
Template ID Contains STS# The site collection whose template ID contains STS# will be filtered and included in the result. For example, STS#0 (Team Site) will be filtered and included in the result.
Equals STS#0 The site collection whose template ID is STS#0 will be filtered and included in the result. Refer to Appendix B for more detailed information of Template ID.
Custom Property: Text
Contains test The site collection whose Text property contains test will be filtered and included in the result.
Does Not Contain
test The site collection whose Text property does not contain test will be filtered and included in the result.
Equals test The site collection whose Text property is test will be filtered and included in the result.
Does Not Equal
test The site collection whose Text property is not test will be filtered and included in the result.
Matches te*t The site collection whose Text property begins with te and ends with t will be filtered and included in the result. For example, teABct will be filtered and included in the result.
te?t The site collection whose Text property is the same as te?t except character ? will be filtered and included in the result. For example, test will be filtered and included in the result.
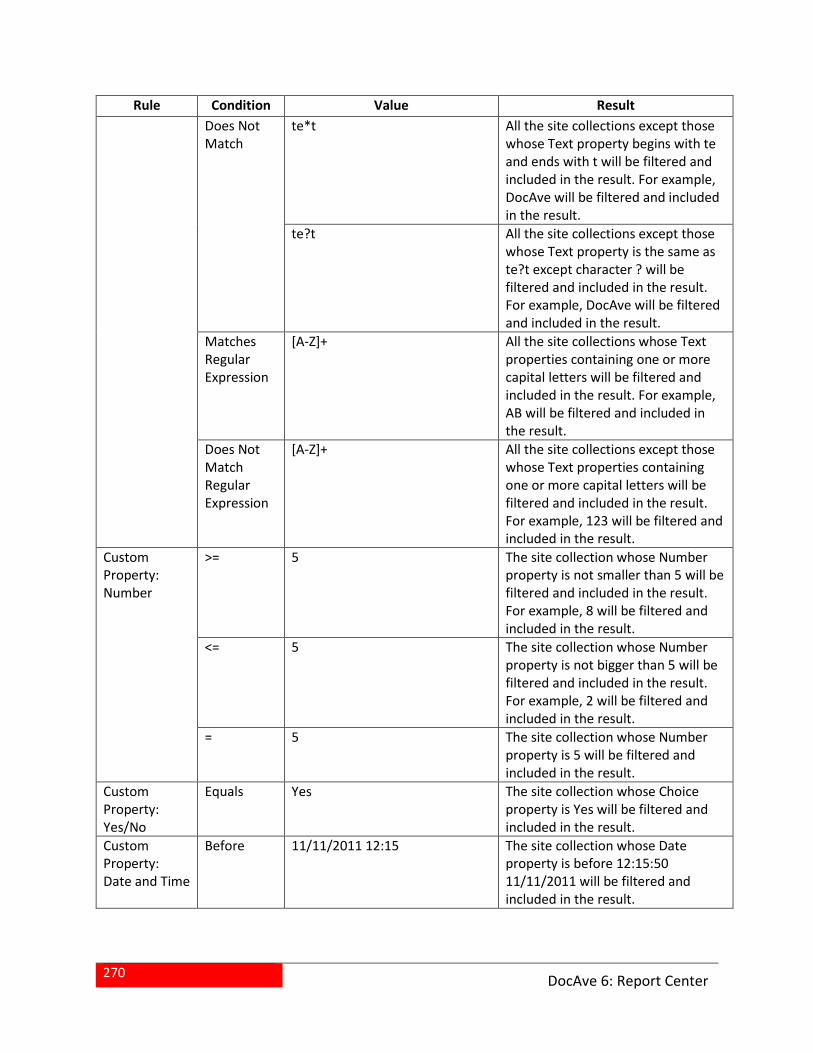
270
DocAve 6: Report Center
Rule Condition Value Result
Does Not Match
te*t All the site collections except those whose Text property begins with te and ends with t will be filtered and included in the result. For example, DocAve will be filtered and included in the result.
te?t All the site collections except those whose Text property is the same as te?t except character ? will be filtered and included in the result. For example, DocAve will be filtered and included in the result.
Matches Regular Expression
[A-Z]+ All the site collections whose Text properties containing one or more capital letters will be filtered and included in the result. For example, AB will be filtered and included in the result.
Does Not Match Regular Expression
[A-Z]+ All the site collections except those whose Text properties containing one or more capital letters will be filtered and included in the result. For example, 123 will be filtered and included in the result.
Custom Property: Number
>= 5 The site collection whose Number property is not smaller than 5 will be filtered and included in the result. For example, 8 will be filtered and included in the result.
<= 5 The site collection whose Number property is not bigger than 5 will be filtered and included in the result. For example, 2 will be filtered and included in the result.
= 5 The site collection whose Number property is 5 will be filtered and included in the result.
Custom Property: Yes/No
Equals Yes The site collection whose Choice property is Yes will be filtered and included in the result.
Custom Property: Date and Time
Before 11/11/2011 12:15 The site collection whose Date property is before 12:15:50 11/11/2011 will be filtered and included in the result.
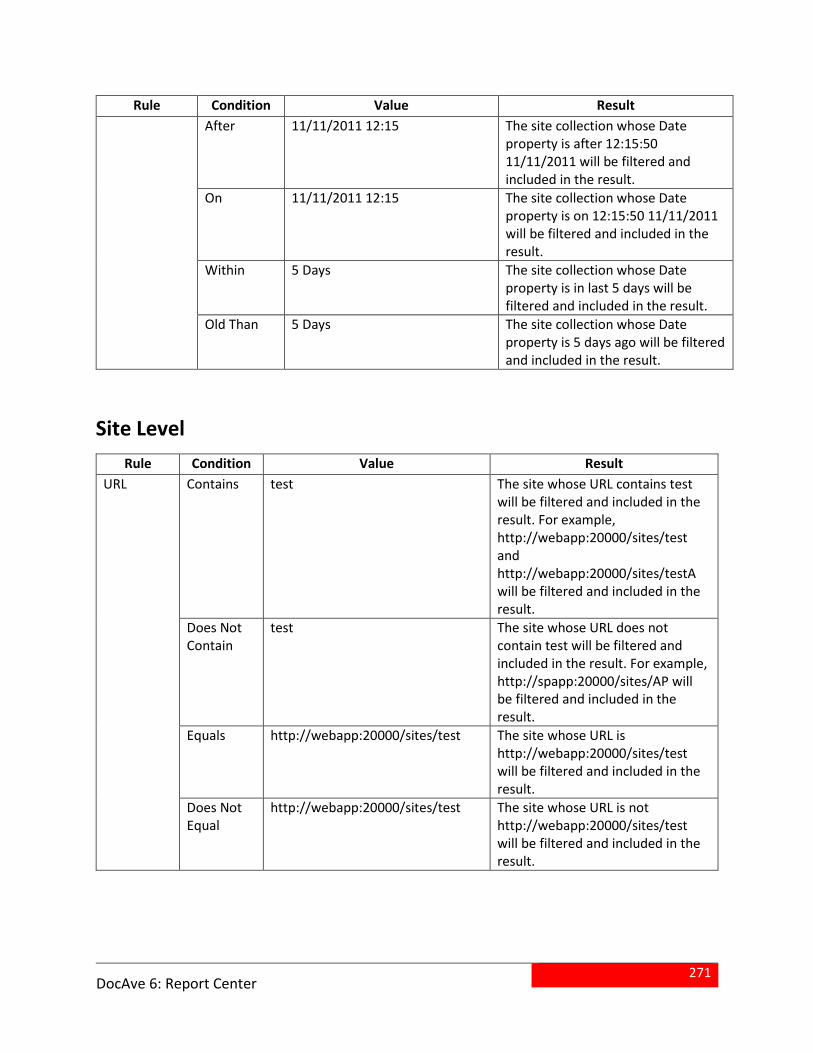
271
DocAve 6: Report Center
Rule Condition Value Result
After 11/11/2011 12:15 The site collection whose Date property is after 12:15:50 11/11/2011 will be filtered and included in the result.
On 11/11/2011 12:15 The site collection whose Date property is on 12:15:50 11/11/2011 will be filtered and included in the result.
Within 5 Days The site collection whose Date property is in last 5 days will be filtered and included in the result.
Old Than 5 Days The site collection whose Date property is 5 days ago will be filtered and included in the result.
Site Level
Rule Condition Value Result
URL Contains test The site whose URL contains test will be filtered and included in the result. For example, http://webapp:20000/sites/test and http://webapp:20000/sites/testA will be filtered and included in the result.
Does Not Contain
test The site whose URL does not contain test will be filtered and included in the result. For example, http://spapp:20000/sites/AP will be filtered and included in the result.
Equals http://webapp:20000/sites/test The site whose URL is http://webapp:20000/sites/test will be filtered and included in the result.
Does Not Equal
http://webapp:20000/sites/test The site whose URL is not http://webapp:20000/sites/test will be filtered and included in the result.
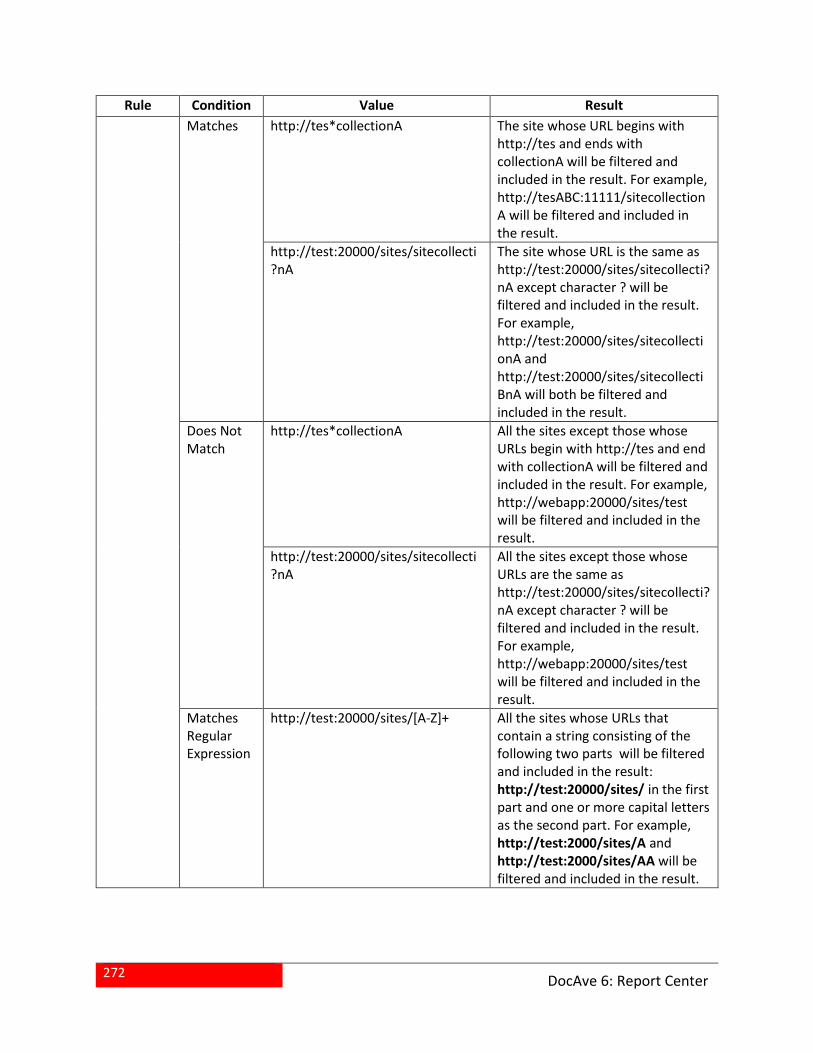
272
DocAve 6: Report Center
Rule Condition Value Result
Matches http://tes*collectionA The site whose URL begins with http://tes and ends with collectionA will be filtered and included in the result. For example, http://tesABC:11111/sitecollectionA will be filtered and included in the result.
http://test:20000/sites/sitecollecti?nA
The site whose URL is the same as http://test:20000/sites/sitecollecti?nA except character ? will be filtered and included in the result. For example, http://test:20000/sites/sitecollectionA and http://test:20000/sites/sitecollectiBnA will both be filtered and included in the result.
Does Not Match
http://tes*collectionA All the sites except those whose URLs begin with http://tes and end with collectionA will be filtered and included in the result. For example, http://webapp:20000/sites/test will be filtered and included in the result.
http://test:20000/sites/sitecollecti?nA
All the sites except those whose URLs are the same as http://test:20000/sites/sitecollecti?nA except character ? will be filtered and included in the result. For example, http://webapp:20000/sites/test will be filtered and included in the result.
Matches Regular Expression
http://test:20000/sites/[A-Z]+ All the sites whose URLs that contain a string consisting of the following two parts will be filtered and included in the result: http://test:20000/sites/ in the first part and one or more capital letters as the second part. For example, http://test:2000/sites/A and http://test:2000/sites/AA will be filtered and included in the result.
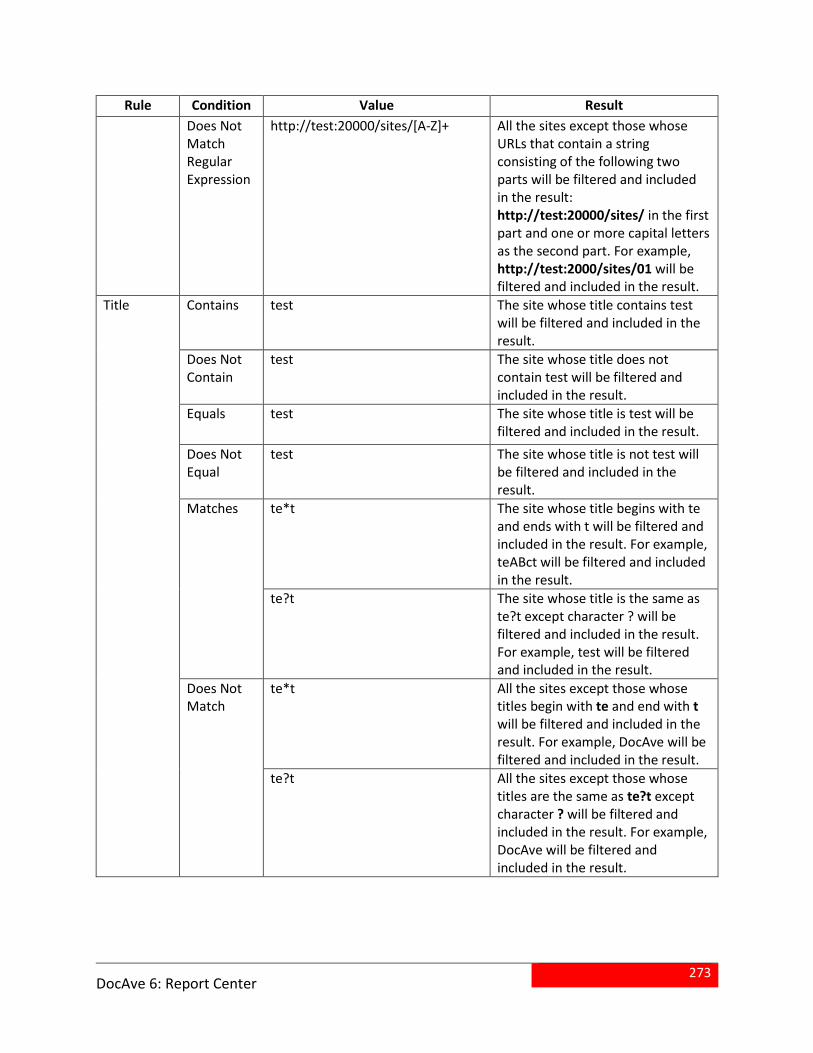
273
DocAve 6: Report Center
Rule Condition Value Result
Does Not Match Regular Expression
http://test:20000/sites/[A-Z]+ All the sites except those whose URLs that contain a string consisting of the following two parts will be filtered and included in the result: http://test:20000/sites/ in the first part and one or more capital letters as the second part. For example, http://test:2000/sites/01 will be filtered and included in the result.
Title Contains test The site whose title contains test will be filtered and included in the result.
Does Not Contain
test The site whose title does not contain test will be filtered and included in the result.
Equals test The site whose title is test will be filtered and included in the result.
Does Not Equal
test The site whose title is not test will be filtered and included in the result.
Matches te*t The site whose title begins with te and ends with t will be filtered and included in the result. For example, teABct will be filtered and included in the result.
te?t The site whose title is the same as te?t except character ? will be filtered and included in the result. For example, test will be filtered and included in the result.
Does Not Match
te*t All the sites except those whose titles begin with te and end with t will be filtered and included in the result. For example, DocAve will be filtered and included in the result.
te?t All the sites except those whose titles are the same as te?t except character ? will be filtered and included in the result. For example, DocAve will be filtered and included in the result.
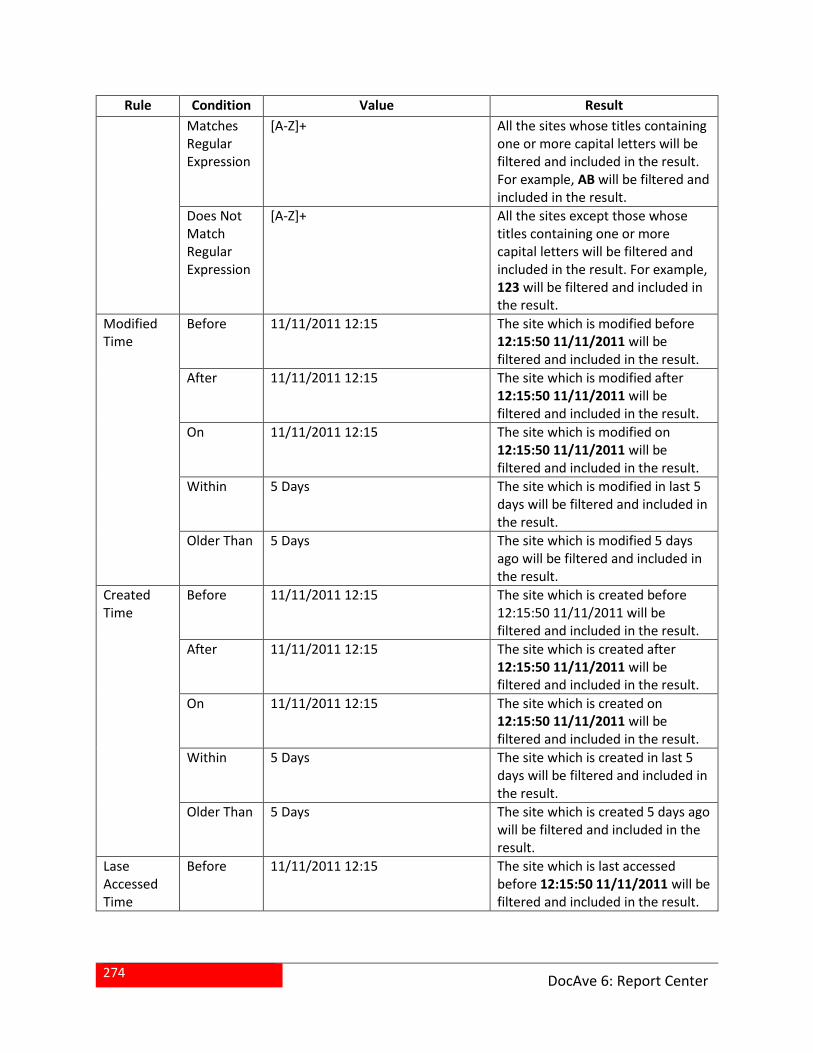
274
DocAve 6: Report Center
Rule Condition Value Result
Matches Regular Expression
[A-Z]+ All the sites whose titles containing one or more capital letters will be filtered and included in the result. For example, AB will be filtered and included in the result.
Does Not Match Regular Expression
[A-Z]+ All the sites except those whose titles containing one or more capital letters will be filtered and included in the result. For example, 123 will be filtered and included in the result.
Modified Time
Before 11/11/2011 12:15 The site which is modified before 12:15:50 11/11/2011 will be filtered and included in the result.
After 11/11/2011 12:15 The site which is modified after 12:15:50 11/11/2011 will be filtered and included in the result.
On 11/11/2011 12:15 The site which is modified on 12:15:50 11/11/2011 will be filtered and included in the result.
Within 5 Days The site which is modified in last 5 days will be filtered and included in the result.
Older Than 5 Days The site which is modified 5 days ago will be filtered and included in the result.
Created Time
Before 11/11/2011 12:15 The site which is created before 12:15:50 11/11/2011 will be filtered and included in the result.
After 11/11/2011 12:15 The site which is created after 12:15:50 11/11/2011 will be filtered and included in the result.
On 11/11/2011 12:15 The site which is created on 12:15:50 11/11/2011 will be filtered and included in the result.
Within 5 Days The site which is created in last 5 days will be filtered and included in the result.
Older Than 5 Days The site which is created 5 days ago will be filtered and included in the result.
Lase Accessed Time
Before 11/11/2011 12:15 The site which is last accessed before 12:15:50 11/11/2011 will be filtered and included in the result.
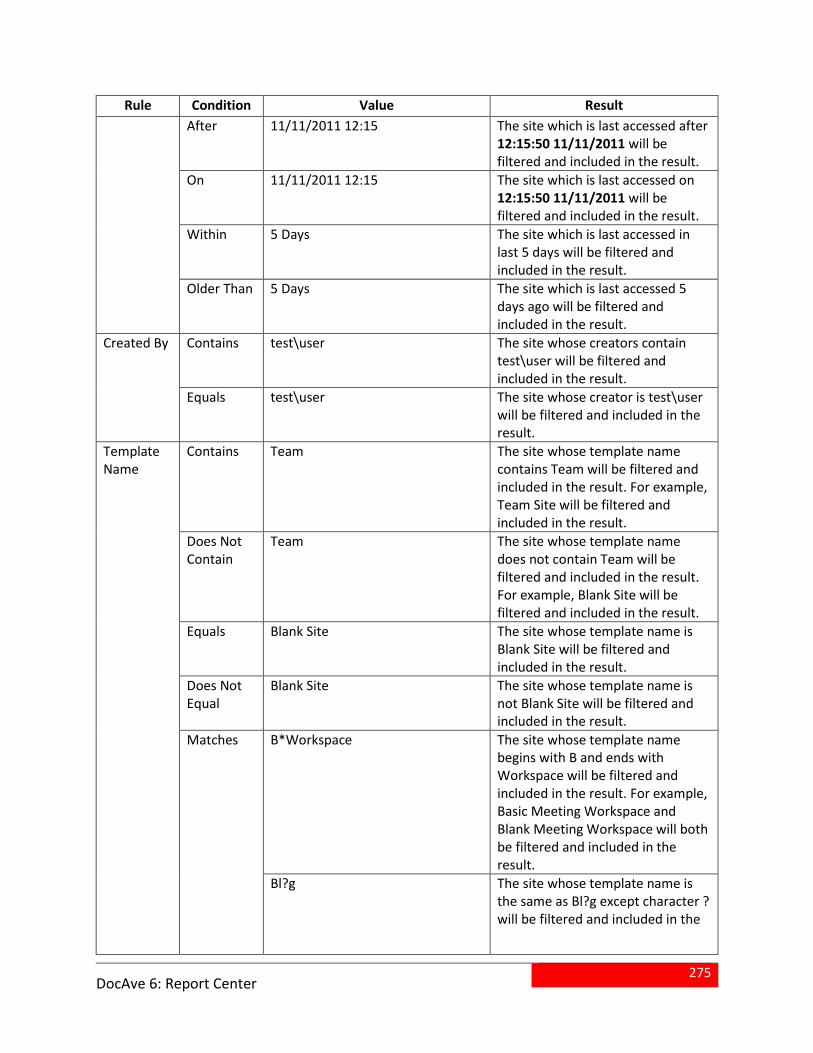
275
DocAve 6: Report Center
Rule Condition Value Result
After 11/11/2011 12:15 The site which is last accessed after 12:15:50 11/11/2011 will be filtered and included in the result.
On 11/11/2011 12:15 The site which is last accessed on 12:15:50 11/11/2011 will be filtered and included in the result.
Within 5 Days The site which is last accessed in last 5 days will be filtered and included in the result.
Older Than 5 Days The site which is last accessed 5 days ago will be filtered and included in the result.
Created By Contains test\user The site whose creators contain test\user will be filtered and included in the result.
Equals test\user The site whose creator is test\user will be filtered and included in the result.
Template Name
Contains Team The site whose template name contains Team will be filtered and included in the result. For example, Team Site will be filtered and included in the result.
Does Not Contain
Team The site whose template name does not contain Team will be filtered and included in the result. For example, Blank Site will be filtered and included in the result.
Equals Blank Site The site whose template name is Blank Site will be filtered and included in the result.
Does Not Equal
Blank Site The site whose template name is not Blank Site will be filtered and included in the result.
Matches B*Workspace The site whose template name begins with B and ends with Workspace will be filtered and included in the result. For example, Basic Meeting Workspace and Blank Meeting Workspace will both be filtered and included in the result.
Bl?g The site whose template name is the same as Bl?g except character ? will be filtered and included in the
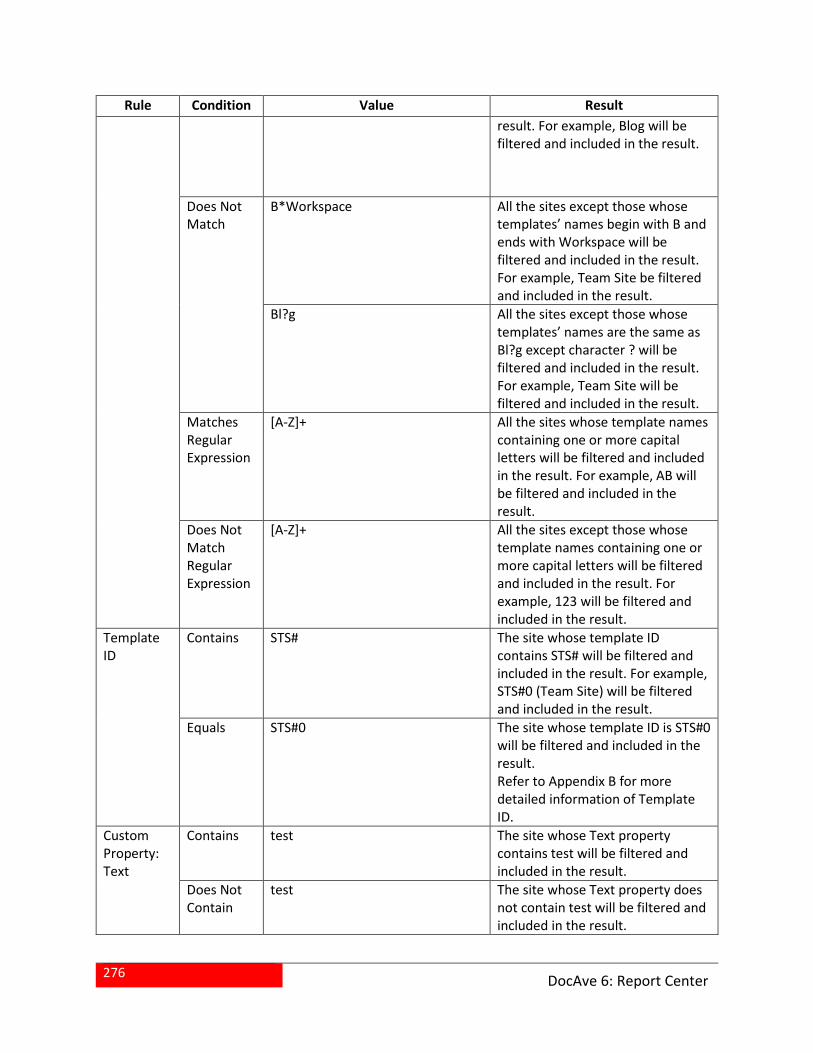
276
DocAve 6: Report Center
Rule Condition Value Result
result. For example, Blog will be filtered and included in the result.
Does Not Match
B*Workspace All the sites except those whose templates’ names begin with B and ends with Workspace will be filtered and included in the result. For example, Team Site be filtered and included in the result.
Bl?g All the sites except those whose templates’ names are the same as Bl?g except character ? will be filtered and included in the result. For example, Team Site will be filtered and included in the result.
Matches Regular Expression
[A-Z]+ All the sites whose template names containing one or more capital letters will be filtered and included in the result. For example, AB will be filtered and included in the result.
Does Not Match Regular Expression
[A-Z]+ All the sites except those whose template names containing one or more capital letters will be filtered and included in the result. For example, 123 will be filtered and included in the result.
Template ID
Contains STS# The site whose template ID contains STS# will be filtered and included in the result. For example, STS#0 (Team Site) will be filtered and included in the result.
Equals STS#0 The site whose template ID is STS#0 will be filtered and included in the result. Refer to Appendix B for more detailed information of Template ID.
Custom Property: Text
Contains test The site whose Text property contains test will be filtered and included in the result.
Does Not Contain
test The site whose Text property does not contain test will be filtered and included in the result.
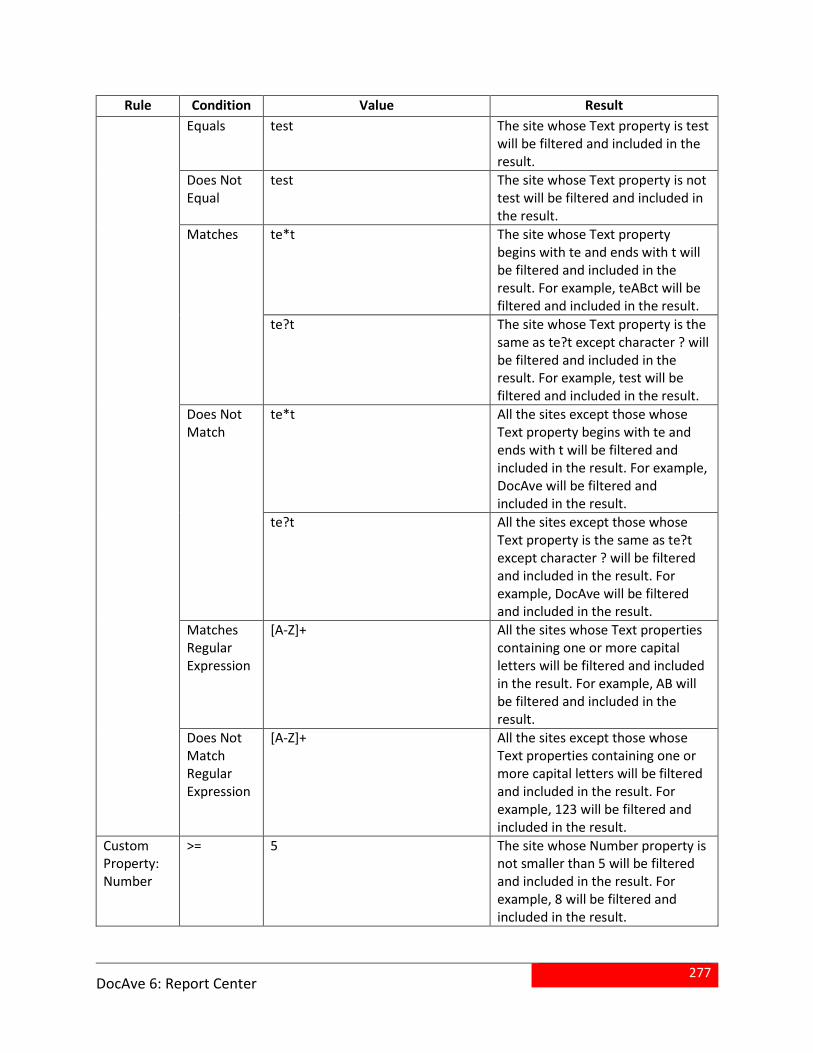
277
DocAve 6: Report Center
Rule Condition Value Result
Equals test The site whose Text property is test will be filtered and included in the result.
Does Not Equal
test The site whose Text property is not test will be filtered and included in the result.
Matches te*t The site whose Text property begins with te and ends with t will be filtered and included in the result. For example, teABct will be filtered and included in the result.
te?t The site whose Text property is the same as te?t except character ? will be filtered and included in the result. For example, test will be filtered and included in the result.
Does Not Match
te*t All the sites except those whose Text property begins with te and ends with t will be filtered and included in the result. For example, DocAve will be filtered and included in the result.
te?t All the sites except those whose Text property is the same as te?t except character ? will be filtered and included in the result. For example, DocAve will be filtered and included in the result.
Matches Regular Expression
[A-Z]+ All the sites whose Text properties containing one or more capital letters will be filtered and included in the result. For example, AB will be filtered and included in the result.
Does Not Match Regular Expression
[A-Z]+ All the sites except those whose Text properties containing one or more capital letters will be filtered and included in the result. For example, 123 will be filtered and included in the result.
Custom Property: Number
>= 5 The site whose Number property is not smaller than 5 will be filtered and included in the result. For example, 8 will be filtered and included in the result.
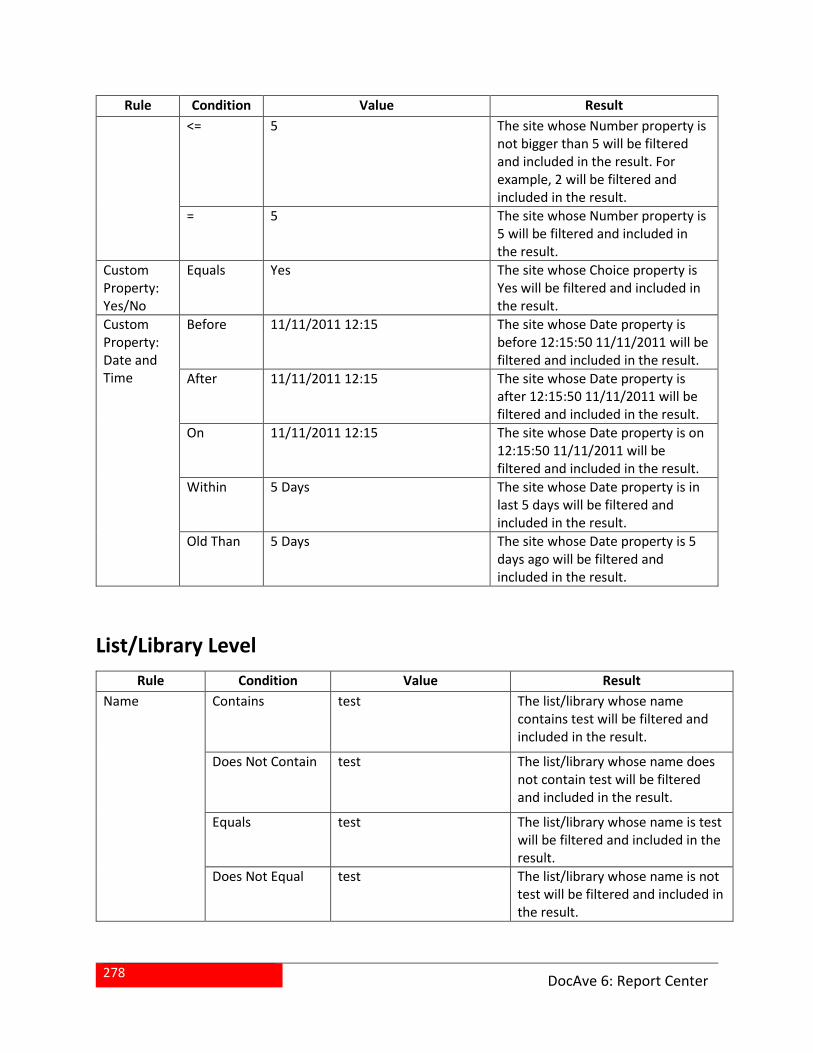
278
DocAve 6: Report Center
Rule Condition Value Result
<= 5 The site whose Number property is not bigger than 5 will be filtered and included in the result. For example, 2 will be filtered and included in the result.
= 5 The site whose Number property is 5 will be filtered and included in the result.
Custom Property: Yes/No
Equals Yes The site whose Choice property is Yes will be filtered and included in the result.
Custom Property: Date and Time
Before 11/11/2011 12:15 The site whose Date property is before 12:15:50 11/11/2011 will be filtered and included in the result.
After 11/11/2011 12:15 The site whose Date property is after 12:15:50 11/11/2011 will be filtered and included in the result.
On 11/11/2011 12:15 The site whose Date property is on 12:15:50 11/11/2011 will be filtered and included in the result.
Within 5 Days The site whose Date property is in last 5 days will be filtered and included in the result.
Old Than 5 Days The site whose Date property is 5 days ago will be filtered and included in the result.
List/Library Level
Rule Condition Value Result
Name Contains test The list/library whose name contains test will be filtered and included in the result.
Does Not Contain test The list/library whose name does not contain test will be filtered and included in the result.
Equals test The list/library whose name is test will be filtered and included in the result.
Does Not Equal test The list/library whose name is not test will be filtered and included in the result.
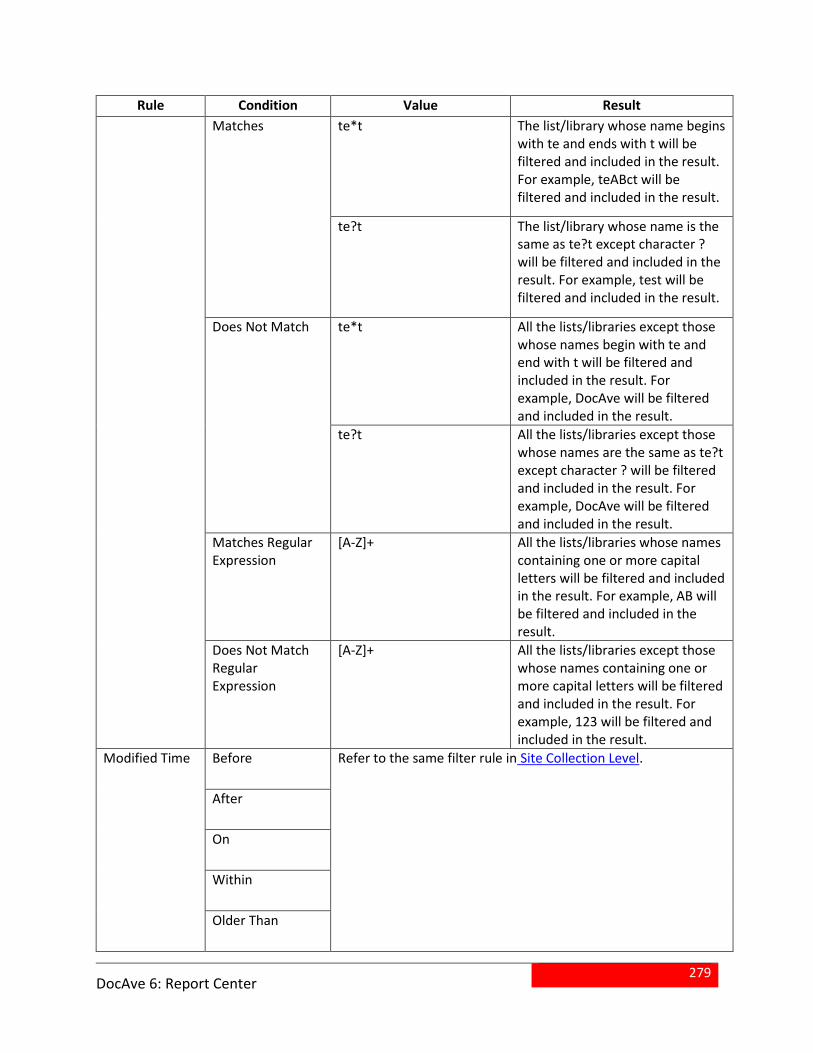
279
DocAve 6: Report Center
Rule Condition Value Result
Matches te*t The list/library whose name begins with te and ends with t will be filtered and included in the result. For example, teABct will be filtered and included in the result.
te?t The list/library whose name is the same as te?t except character ? will be filtered and included in the result. For example, test will be filtered and included in the result.
Does Not Match te*t All the lists/libraries except those whose names begin with te and end with t will be filtered and included in the result. For example, DocAve will be filtered and included in the result.
te?t All the lists/libraries except those whose names are the same as te?t except character ? will be filtered and included in the result. For example, DocAve will be filtered and included in the result.
Matches Regular Expression
[A-Z]+ All the lists/libraries whose names containing one or more capital letters will be filtered and included in the result. For example, AB will be filtered and included in the result.
Does Not Match Regular Expression
[A-Z]+ All the lists/libraries except those whose names containing one or more capital letters will be filtered and included in the result. For example, 123 will be filtered and included in the result.
Modified Time Before Refer to the same filter rule in Site Collection Level.
After
On
Within
Older Than
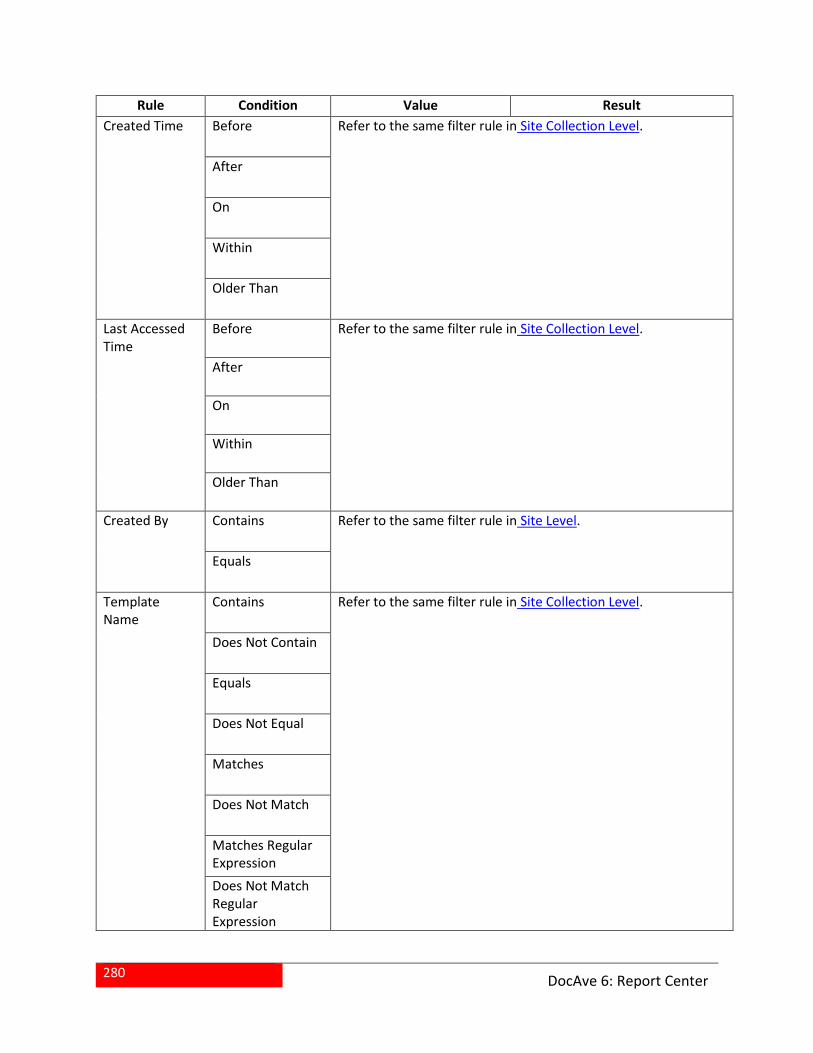
280
DocAve 6: Report Center
Rule Condition Value Result
Created Time Before Refer to the same filter rule in Site Collection Level.
After
On
Within
Older Than
Last Accessed Time
Before Refer to the same filter rule in Site Collection Level.
After
On
Within
Older Than
Created By Contains Refer to the same filter rule in Site Level.
Equals
Template Name
Contains Refer to the same filter rule in Site Collection Level.
Does Not Contain
Equals
Does Not Equal
Matches
Does Not Match
Matches Regular Expression
Does Not Match Regular Expression
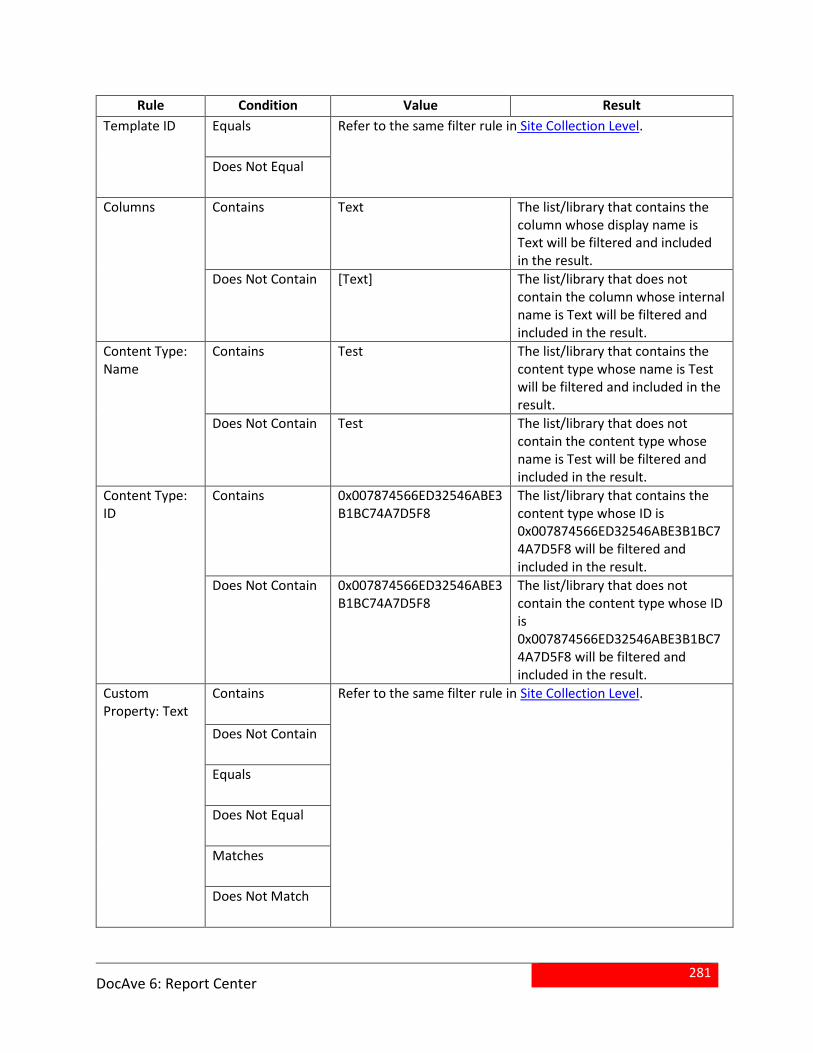
281
DocAve 6: Report Center
Rule Condition Value Result
Template ID Equals Refer to the same filter rule in Site Collection Level.
Does Not Equal
Columns Contains Text The list/library that contains the column whose display name is Text will be filtered and included in the result.
Does Not Contain [Text] The list/library that does not contain the column whose internal name is Text will be filtered and included in the result.
Content Type: Name
Contains Test The list/library that contains the content type whose name is Test will be filtered and included in the result.
Does Not Contain Test The list/library that does not contain the content type whose name is Test will be filtered and included in the result.
Content Type: ID
Contains 0x007874566ED32546ABE3B1BC74A7D5F8
The list/library that contains the content type whose ID is 0x007874566ED32546ABE3B1BC74A7D5F8 will be filtered and included in the result.
Does Not Contain 0x007874566ED32546ABE3B1BC74A7D5F8
The list/library that does not contain the content type whose ID is 0x007874566ED32546ABE3B1BC74A7D5F8 will be filtered and included in the result.
Custom Property: Text
Contains Refer to the same filter rule in Site Collection Level.
Does Not Contain
Equals
Does Not Equal
Matches
Does Not Match
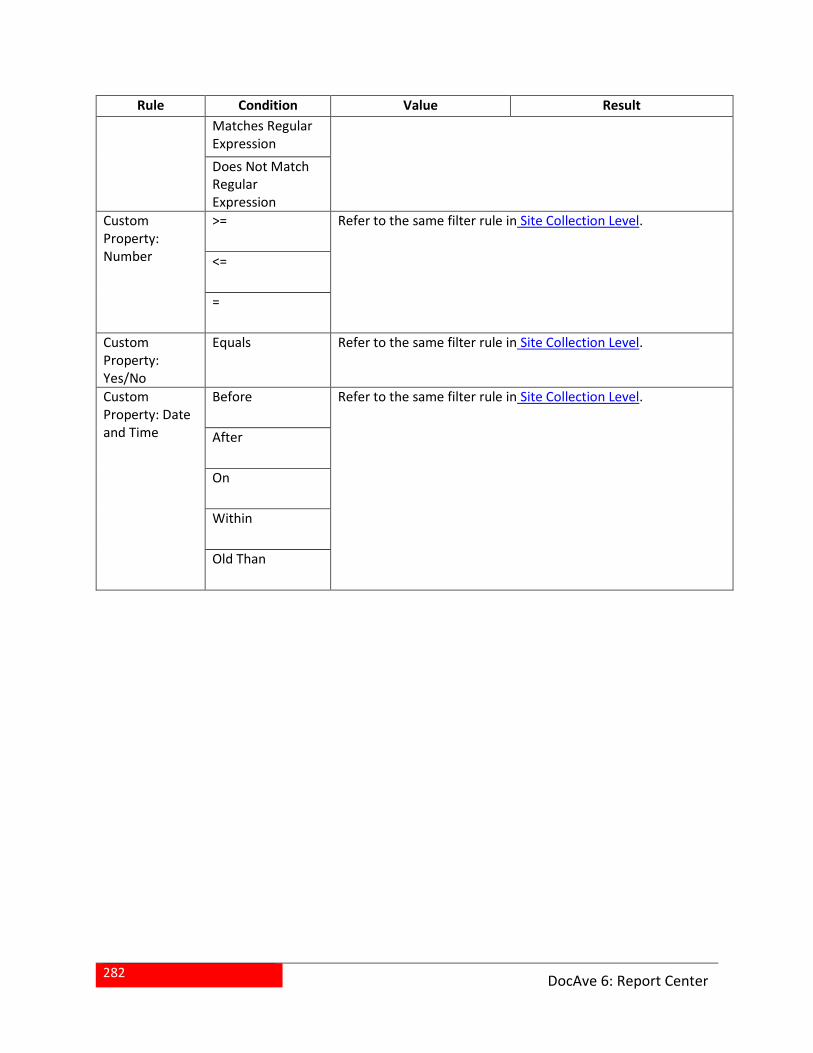
282
DocAve 6: Report Center
Rule Condition Value Result
Matches Regular Expression
Does Not Match Regular Expression
Custom Property: Number
>= Refer to the same filter rule in Site Collection Level.
<=
=
Custom Property: Yes/No
Equals Refer to the same filter rule in Site Collection Level.
Custom Property: Date and Time
Before Refer to the same filter rule in Site Collection Level.
After
On
Within
Old Than
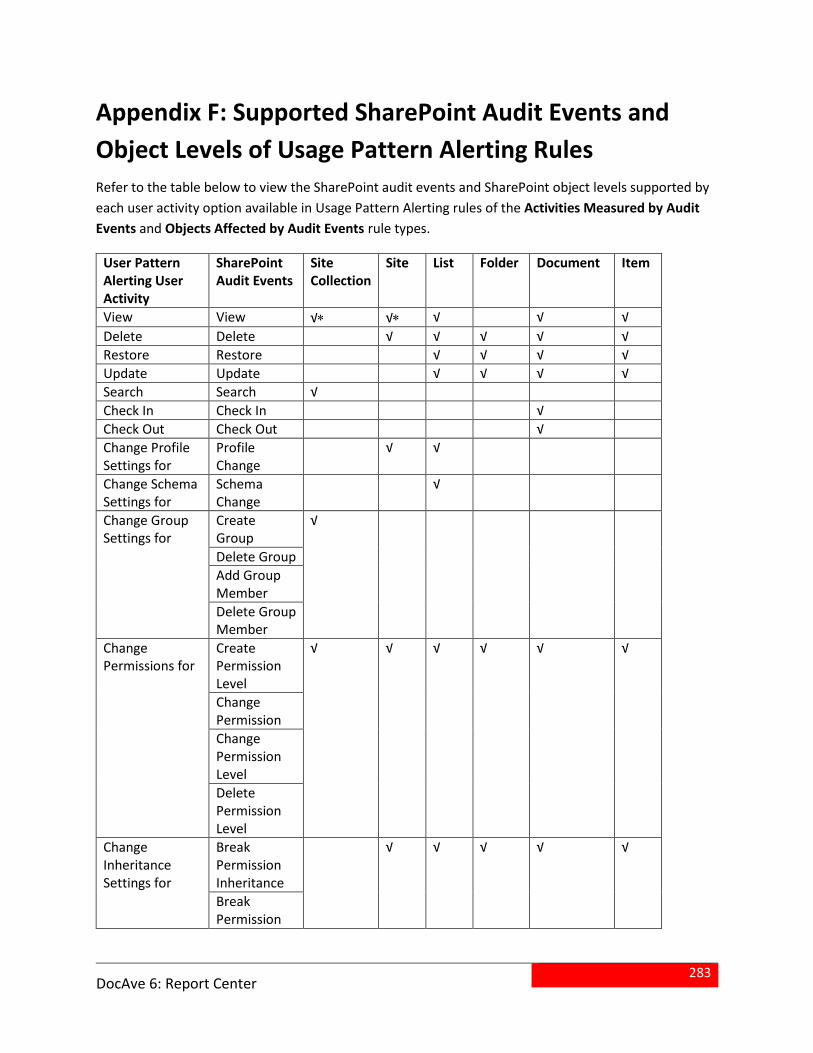
283
DocAve 6: Report Center
Appendix F: Supported SharePoint Audit Events and
Object Levels of Usage Pattern Alerting Rules
Refer to the table below to view the SharePoint audit events and SharePoint object levels supported by
each user activity option available in Usage Pattern Alerting rules of the Activities Measured by Audit
Events and Objects Affected by Audit Events rule types.
User Pattern Alerting User Activity
SharePoint Audit Events
Site Collection
Site List Folder Document Item
View View √ √ √ √ √
Delete Delete √ √ √ √ √
Restore Restore √ √ √ √
Update Update √ √ √ √
Search Search √
Check In Check In √
Check Out Check Out √
Change Profile Settings for
Profile Change
√ √
Change Schema Settings for
Schema Change
√
Change Group Settings for
Create Group
√
Delete Group
Add Group Member
Delete Group Member
Change Permissions for
Create Permission Level
√ √ √ √ √ √
Change Permission
Change Permission Level
Delete Permission Level
Change Inheritance Settings for
Break Permission Inheritance
√ √ √ √ √
Break Permission
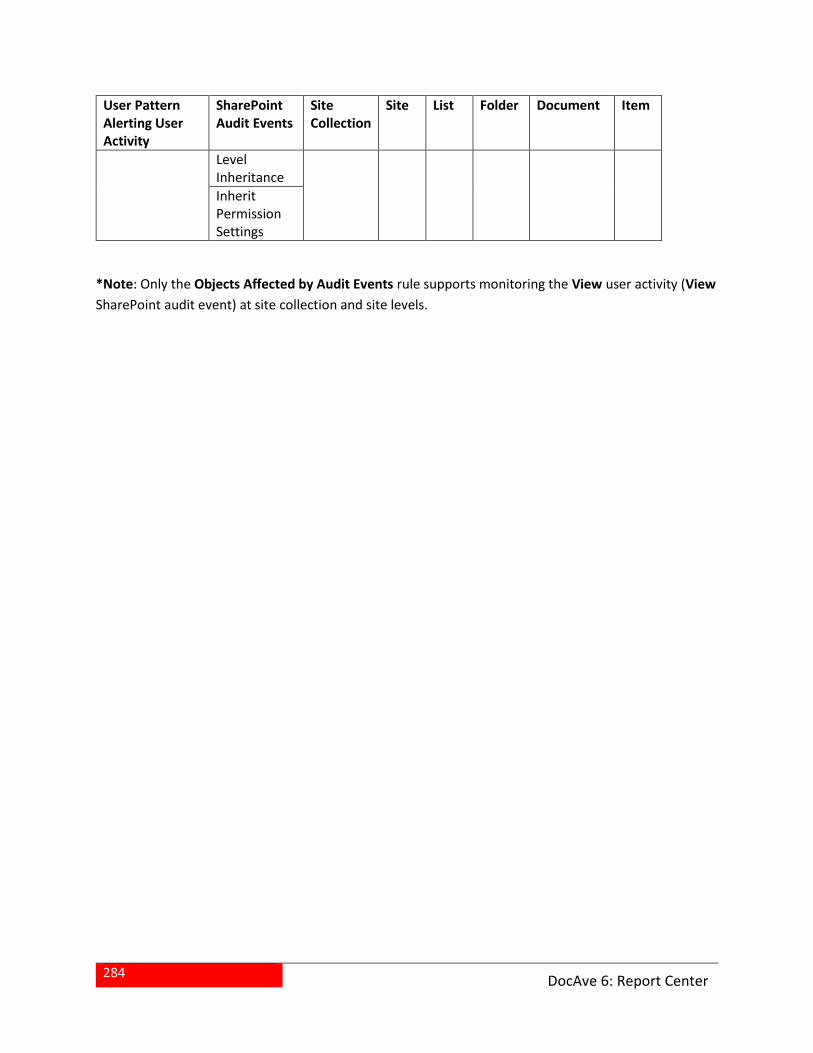
284
DocAve 6: Report Center
User Pattern Alerting User Activity
SharePoint Audit Events
Site Collection
Site List Folder Document Item
Level Inheritance
Inherit Permission Settings
*Note: Only the Objects Affected by Audit Events rule supports monitoring the View user activity (View
SharePoint audit event) at site collection and site levels.
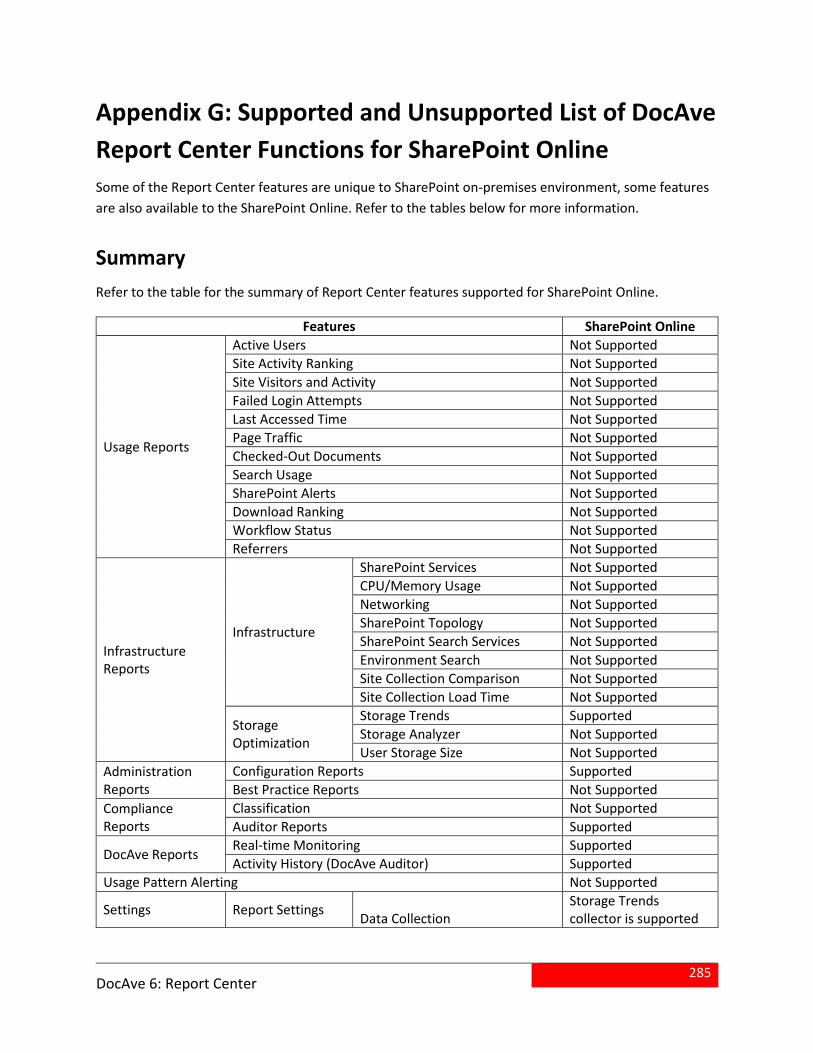
285
DocAve 6: Report Center
Appendix G: Supported and Unsupported List of DocAve
Report Center Functions for SharePoint Online
Some of the Report Center features are unique to SharePoint on-premises environment, some features
are also available to the SharePoint Online. Refer to the tables below for more information.
Summary
Refer to the table for the summary of Report Center features supported for SharePoint Online.
Features SharePoint Online
Usage Reports
Active Users Not Supported
Site Activity Ranking Not Supported
Site Visitors and Activity Not Supported
Failed Login Attempts Not Supported
Last Accessed Time Not Supported
Page Traffic Not Supported
Checked-Out Documents Not Supported
Search Usage Not Supported
SharePoint Alerts Not Supported
Download Ranking Not Supported
Workflow Status Not Supported
Referrers Not Supported
Infrastructure Reports
Infrastructure
SharePoint Services Not Supported
CPU/Memory Usage Not Supported
Networking Not Supported
SharePoint Topology Not Supported
SharePoint Search Services Not Supported
Environment Search Not Supported
Site Collection Comparison Not Supported
Site Collection Load Time Not Supported
Storage Optimization
Storage Trends Supported
Storage Analyzer Not Supported
User Storage Size Not Supported
Administration Reports
Configuration Reports Supported
Best Practice Reports Not Supported
Compliance Reports
Classification Not Supported
Auditor Reports Supported
DocAve Reports Real-time Monitoring Supported
Activity History (DocAve Auditor) Supported
Usage Pattern Alerting Not Supported
Settings Report Settings Data Collection
Storage Trends collector is supported
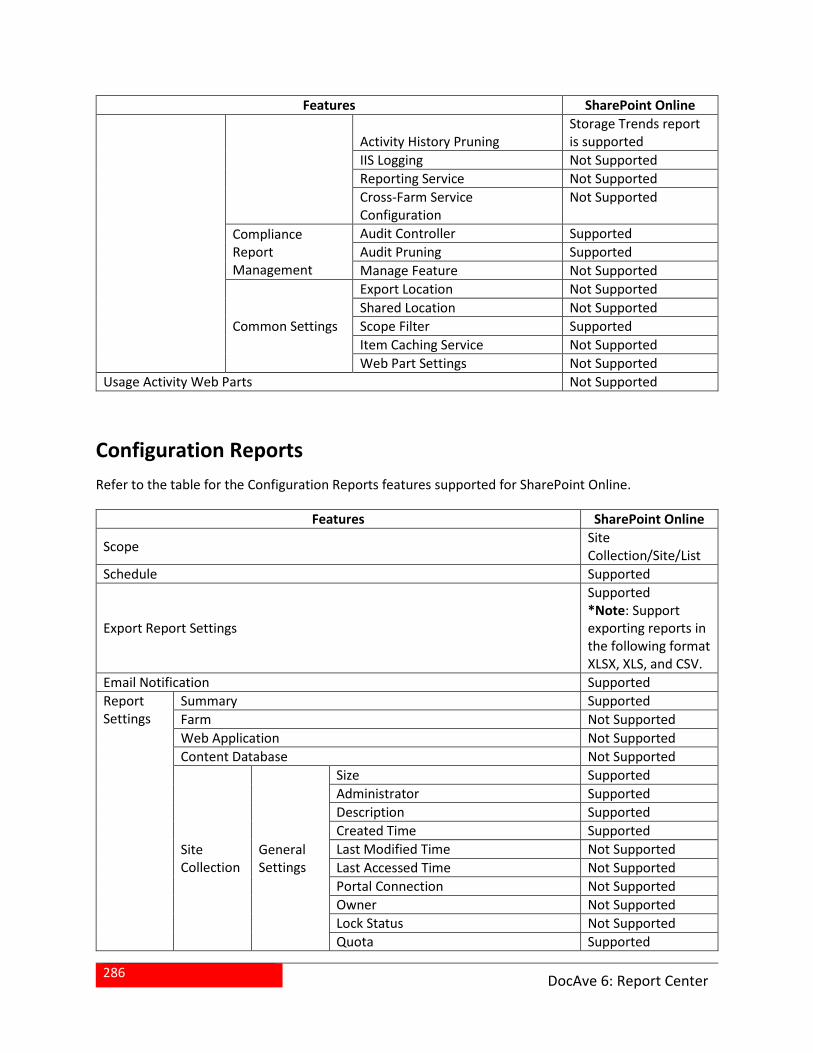
286
DocAve 6: Report Center
Features SharePoint Online
Activity History Pruning Storage Trends report is supported
IIS Logging Not Supported
Reporting Service Not Supported
Cross-Farm Service Configuration
Not Supported
Compliance Report Management
Audit Controller Supported
Audit Pruning Supported
Manage Feature Not Supported
Common Settings
Export Location Not Supported
Shared Location Not Supported
Scope Filter Supported
Item Caching Service Not Supported
Web Part Settings Not Supported
Usage Activity Web Parts Not Supported
Configuration Reports
Refer to the table for the Configuration Reports features supported for SharePoint Online.
Features SharePoint Online
Scope Site Collection/Site/List
Schedule Supported
Export Report Settings
Supported *Note: Support exporting reports in the following format XLSX, XLS, and CSV.
Email Notification Supported
Report Settings
Summary Supported
Farm Not Supported
Web Application Not Supported
Content Database Not Supported
Site Collection
General Settings
Size Supported
Administrator Supported
Description Supported
Created Time Supported
Last Modified Time Not Supported
Last Accessed Time Not Supported
Portal Connection Not Supported
Owner Not Supported
Lock Status Not Supported
Quota Supported
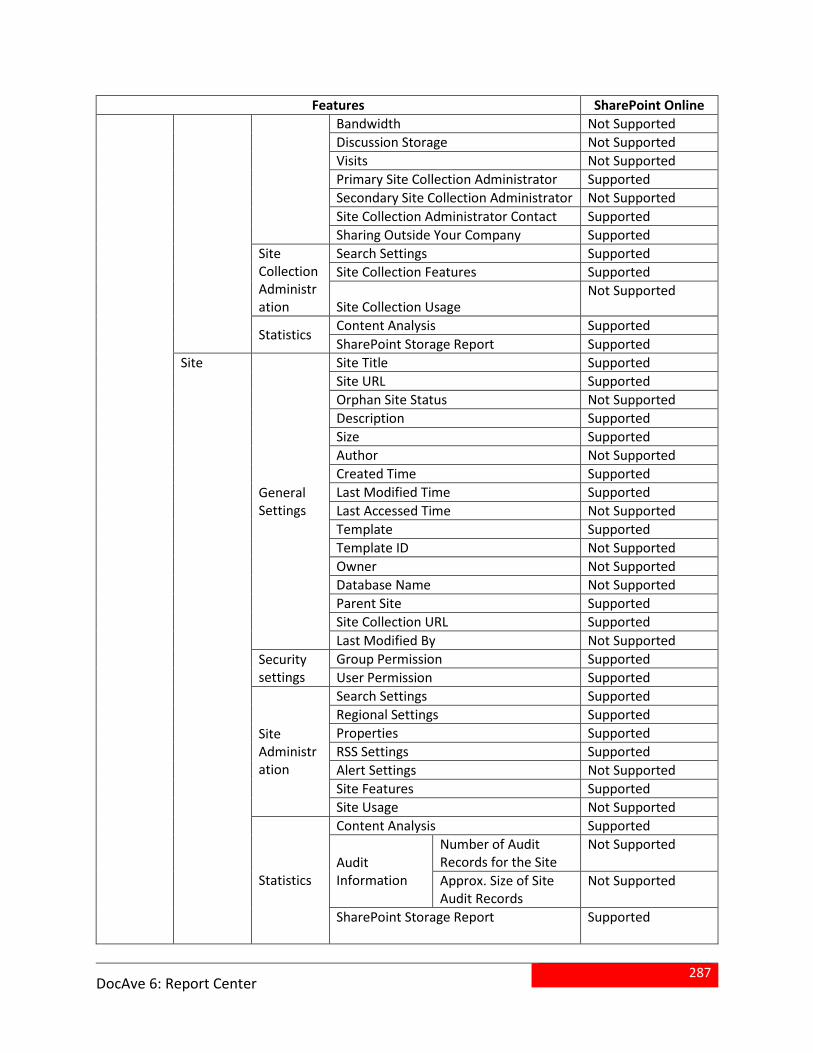
287
DocAve 6: Report Center
Features SharePoint Online
Bandwidth Not Supported
Discussion Storage Not Supported
Visits Not Supported
Primary Site Collection Administrator Supported
Secondary Site Collection Administrator Not Supported
Site Collection Administrator Contact Supported
Sharing Outside Your Company Supported
Site Collection Administration
Search Settings Supported
Site Collection Features Supported
Site Collection Usage Not Supported
Statistics Content Analysis Supported
SharePoint Storage Report Supported
Site
General Settings
Site Title Supported
Site URL Supported
Orphan Site Status Not Supported
Description Supported
Size Supported
Author Not Supported
Created Time Supported
Last Modified Time Supported
Last Accessed Time Not Supported
Template Supported
Template ID Not Supported
Owner Not Supported
Database Name Not Supported
Parent Site Supported
Site Collection URL Supported
Last Modified By Not Supported
Security settings
Group Permission Supported
User Permission Supported
Site Administration
Search Settings Supported
Regional Settings Supported
Properties Supported
RSS Settings Supported
Alert Settings Not Supported
Site Features Supported
Site Usage Not Supported
Statistics
Content Analysis Supported
Audit Information
Number of Audit Records for the Site
Not Supported
Approx. Size of Site Audit Records
Not Supported
SharePoint Storage Report
Supported
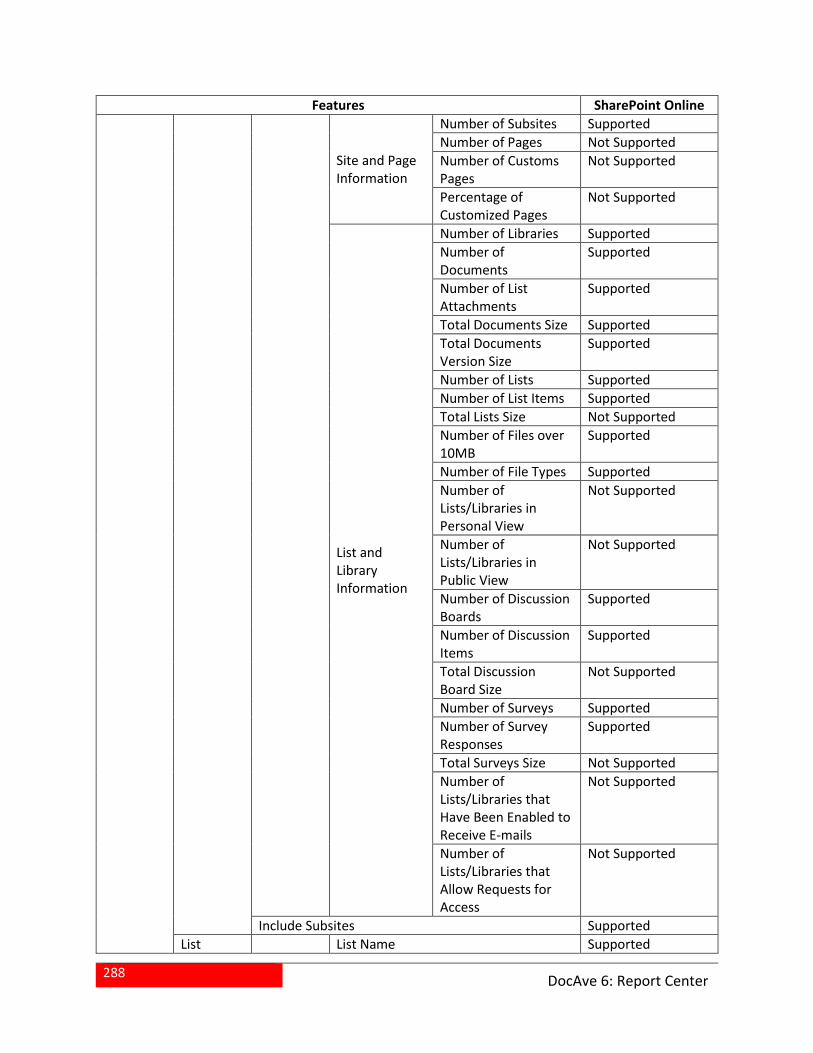
288
DocAve 6: Report Center
Features SharePoint Online
Site and Page Information
Number of Subsites Supported
Number of Pages Not Supported
Number of Customs Pages
Not Supported
Percentage of Customized Pages
Not Supported
List and Library Information
Number of Libraries Supported
Number of Documents
Supported
Number of List Attachments
Supported
Total Documents Size Supported
Total Documents Version Size
Supported
Number of Lists Supported
Number of List Items Supported
Total Lists Size Not Supported
Number of Files over 10MB
Supported
Number of File Types Supported
Number of Lists/Libraries in Personal View
Not Supported
Number of Lists/Libraries in Public View
Not Supported
Number of Discussion Boards
Supported
Number of Discussion Items
Supported
Total Discussion Board Size
Not Supported
Number of Surveys Supported
Number of Survey Responses
Supported
Total Surveys Size Not Supported
Number of Lists/Libraries that Have Been Enabled to Receive E-mails
Not Supported
Number of Lists/Libraries that Allow Requests for Access
Not Supported
Include Subsites Supported
List List Name Supported
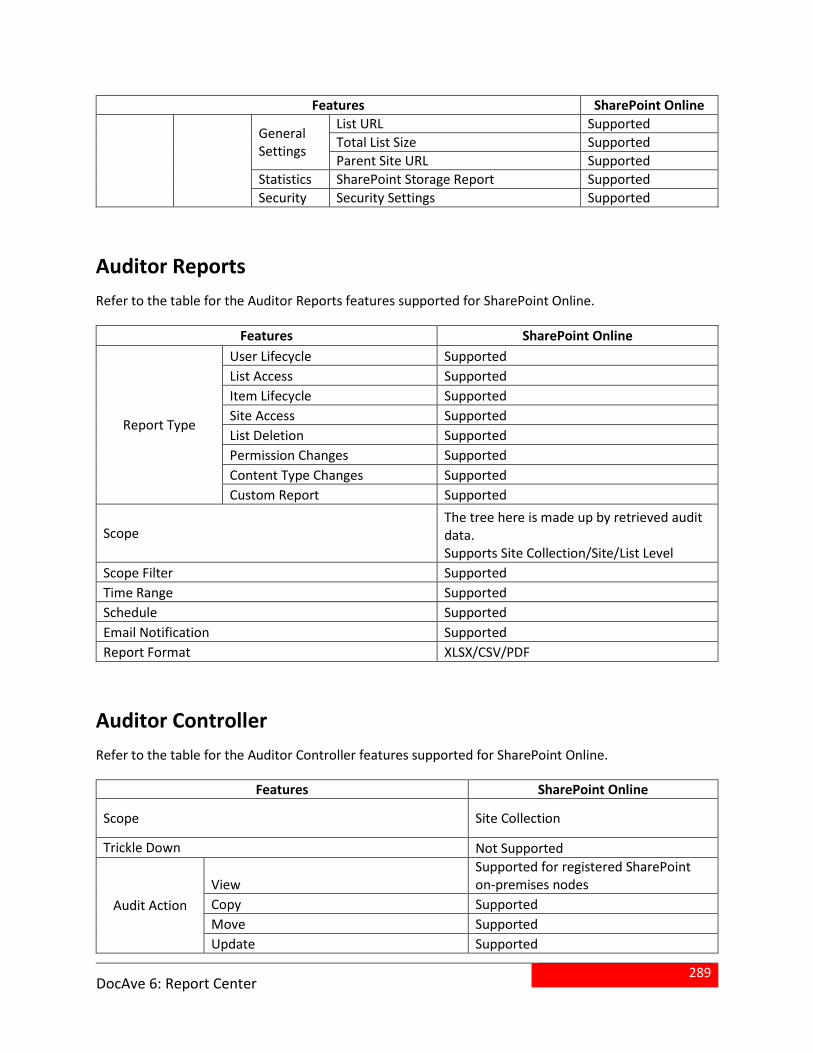
289
DocAve 6: Report Center
Features SharePoint Online
General Settings
List URL Supported
Total List Size Supported
Parent Site URL Supported
Statistics SharePoint Storage Report Supported
Security Security Settings Supported
Auditor Reports
Refer to the table for the Auditor Reports features supported for SharePoint Online.
Features SharePoint Online
Report Type
User Lifecycle Supported
List Access Supported
Item Lifecycle Supported
Site Access Supported
List Deletion Supported
Permission Changes Supported
Content Type Changes Supported
Custom Report Supported
Scope The tree here is made up by retrieved audit data. Supports Site Collection/Site/List Level
Scope Filter Supported
Time Range Supported
Schedule Supported
Email Notification Supported
Report Format XLSX/CSV/PDF
Auditor Controller
Refer to the table for the Auditor Controller features supported for SharePoint Online.
Features SharePoint Online
Scope Site Collection
Trickle Down Not Supported
Audit Action
View Supported for registered SharePoint on-premises nodes
Copy Supported
Move Supported
Update Supported
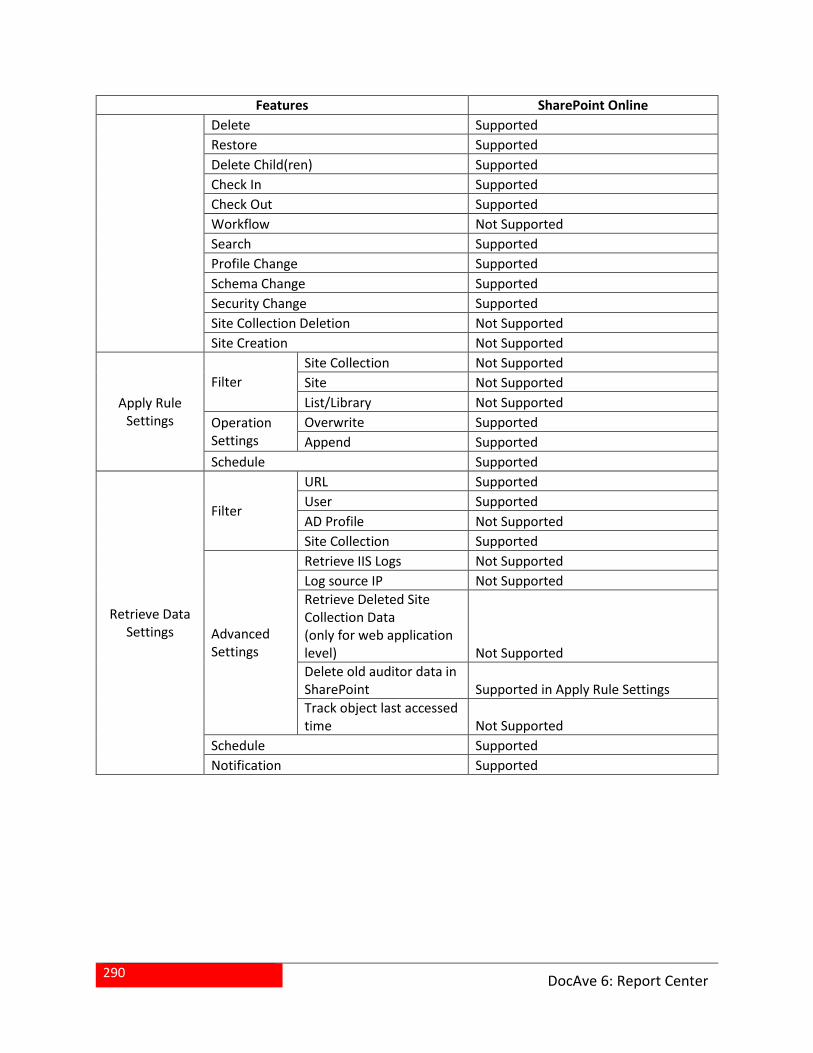
290
DocAve 6: Report Center
Features SharePoint Online
Delete Supported
Restore Supported
Delete Child(ren) Supported
Check In Supported
Check Out Supported
Workflow Not Supported
Search Supported
Profile Change Supported
Schema Change Supported
Security Change Supported
Site Collection Deletion Not Supported
Site Creation Not Supported
Apply Rule Settings
Filter
Site Collection Not Supported
Site Not Supported
List/Library Not Supported
Operation Settings
Overwrite Supported
Append Supported
Schedule Supported
Retrieve Data Settings
Filter
URL Supported
User Supported
AD Profile Not Supported
Site Collection Supported
Advanced Settings
Retrieve IIS Logs Not Supported
Log source IP Not Supported
Retrieve Deleted Site Collection Data (only for web application level) Not Supported
Delete old auditor data in SharePoint Supported in Apply Rule Settings
Track object last accessed time Not Supported
Schedule Supported
Notification Supported
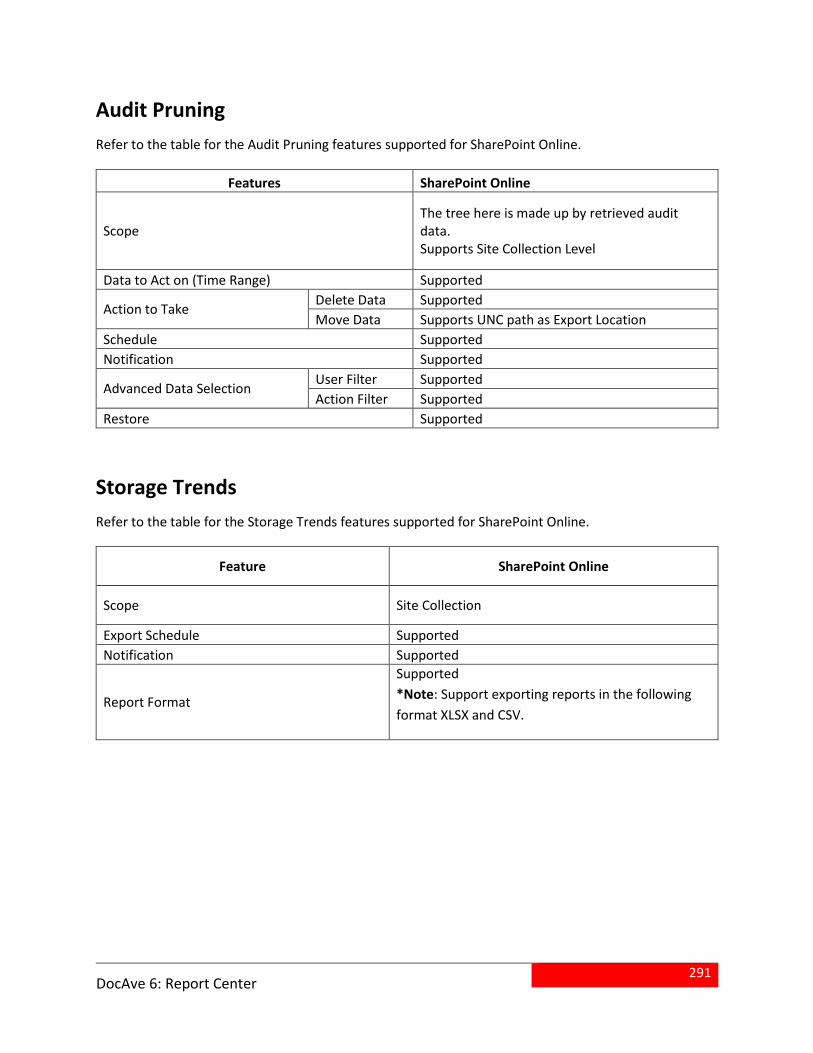
291
DocAve 6: Report Center
Audit Pruning
Refer to the table for the Audit Pruning features supported for SharePoint Online.
Features SharePoint Online
Scope The tree here is made up by retrieved audit data. Supports Site Collection Level
Data to Act on (Time Range) Supported
Action to Take Delete Data Supported
Move Data Supports UNC path as Export Location
Schedule Supported
Notification Supported
Advanced Data Selection User Filter Supported
Action Filter Supported
Restore Supported
Storage Trends
Refer to the table for the Storage Trends features supported for SharePoint Online.
Feature SharePoint Online
Scope Site Collection
Export Schedule Supported
Notification Supported
Report Format
Supported
*Note: Support exporting reports in the following
format XLSX and CSV.
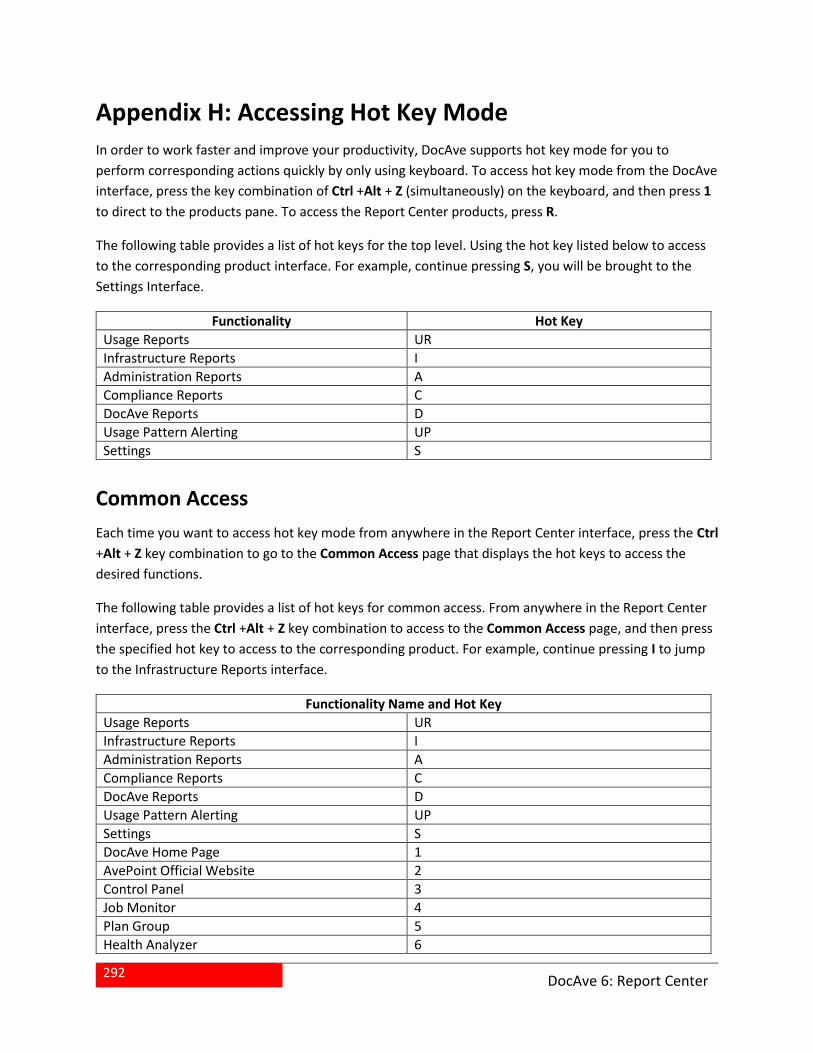
292
DocAve 6: Report Center
Appendix H: Accessing Hot Key Mode
In order to work faster and improve your productivity, DocAve supports hot key mode for you to
perform corresponding actions quickly by only using keyboard. To access hot key mode from the DocAve
interface, press the key combination of Ctrl +Alt + Z (simultaneously) on the keyboard, and then press 1
to direct to the products pane. To access the Report Center products, press R.
The following table provides a list of hot keys for the top level. Using the hot key listed below to access
to the corresponding product interface. For example, continue pressing S, you will be brought to the
Settings Interface.
Functionality Hot Key
Usage Reports UR
Infrastructure Reports I
Administration Reports A
Compliance Reports C
DocAve Reports D
Usage Pattern Alerting UP
Settings S
Common Access
Each time you want to access hot key mode from anywhere in the Report Center interface, press the Ctrl
+Alt + Z key combination to go to the Common Access page that displays the hot keys to access the
desired functions.
The following table provides a list of hot keys for common access. From anywhere in the Report Center
interface, press the Ctrl +Alt + Z key combination to access to the Common Access page, and then press
the specified hot key to access to the corresponding product. For example, continue pressing I to jump
to the Infrastructure Reports interface.
Functionality Name and Hot Key
Usage Reports UR
Infrastructure Reports I
Administration Reports A
Compliance Reports C
DocAve Reports D
Usage Pattern Alerting UP
Settings S
DocAve Home Page 1
AvePoint Official Website 2
Control Panel 3
Job Monitor 4
Plan Group 5
Health Analyzer 6
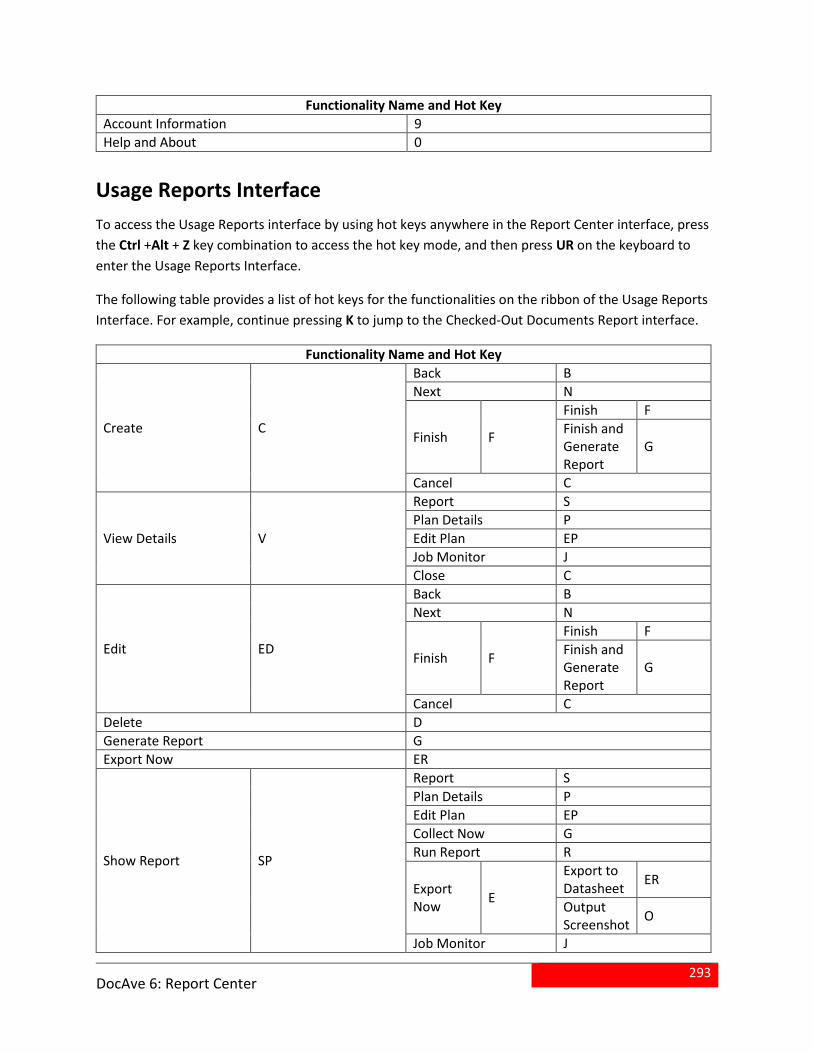
293
DocAve 6: Report Center
Functionality Name and Hot Key
Account Information 9
Help and About 0
Usage Reports Interface
To access the Usage Reports interface by using hot keys anywhere in the Report Center interface, press
the Ctrl +Alt + Z key combination to access the hot key mode, and then press UR on the keyboard to
enter the Usage Reports Interface.
The following table provides a list of hot keys for the functionalities on the ribbon of the Usage Reports
Interface. For example, continue pressing K to jump to the Checked-Out Documents Report interface.
Functionality Name and Hot Key
Create C
Back B
Next N
Finish F
Finish F
Finish and Generate Report
G
Cancel C
View Details V
Report S
Plan Details P
Edit Plan EP
Job Monitor J
Close C
Edit ED
Back B
Next N
Finish F
Finish F
Finish and Generate Report
G
Cancel C
Delete D
Generate Report G
Export Now ER
Show Report SP
Report S
Plan Details P
Edit Plan EP
Collect Now G
Run Report R
Export Now
E
Export to Datasheet
ER
Output Screenshot
O
Job Monitor J
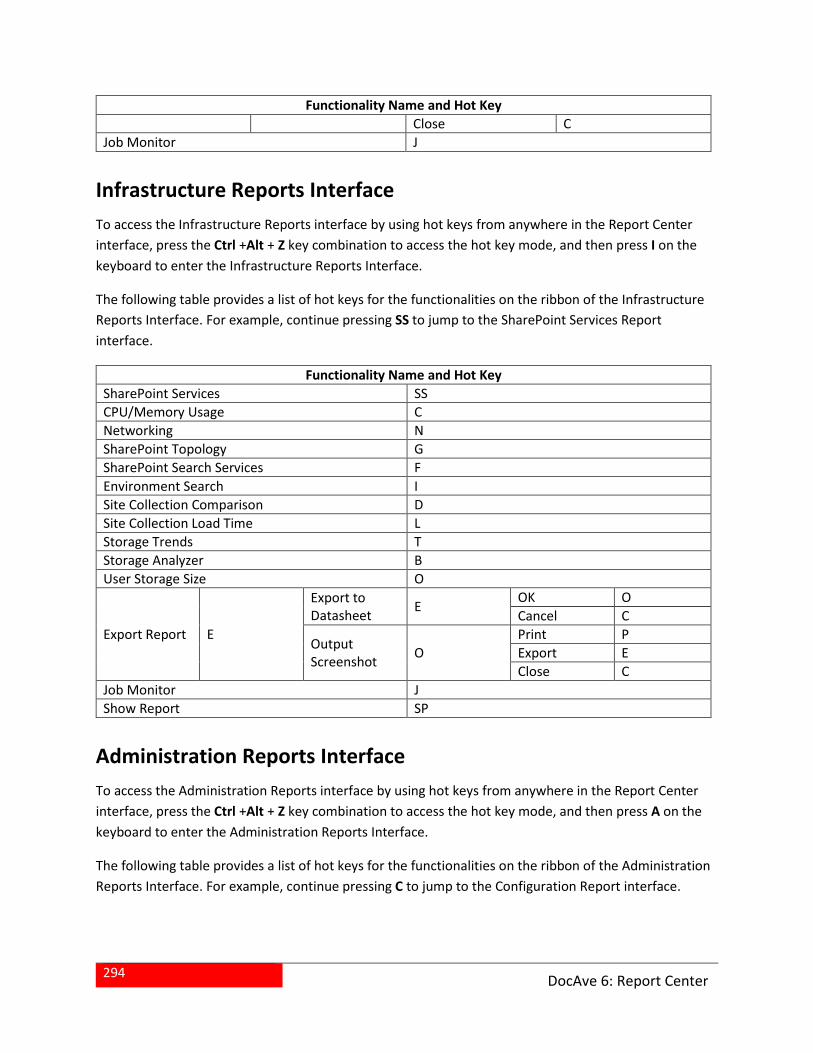
294
DocAve 6: Report Center
Functionality Name and Hot Key
Close C
Job Monitor J
Infrastructure Reports Interface
To access the Infrastructure Reports interface by using hot keys from anywhere in the Report Center
interface, press the Ctrl +Alt + Z key combination to access the hot key mode, and then press I on the
keyboard to enter the Infrastructure Reports Interface.
The following table provides a list of hot keys for the functionalities on the ribbon of the Infrastructure
Reports Interface. For example, continue pressing SS to jump to the SharePoint Services Report
interface.
Functionality Name and Hot Key
SharePoint Services SS
CPU/Memory Usage C
Networking N
SharePoint Topology G
SharePoint Search Services F
Environment Search I
Site Collection Comparison D
Site Collection Load Time L
Storage Trends T
Storage Analyzer B
User Storage Size O
Export Report E
Export to Datasheet
E OK O
Cancel C
Output Screenshot
O
Print P
Export E
Close C
Job Monitor J
Show Report SP
Administration Reports Interface
To access the Administration Reports interface by using hot keys from anywhere in the Report Center
interface, press the Ctrl +Alt + Z key combination to access the hot key mode, and then press A on the
keyboard to enter the Administration Reports Interface.
The following table provides a list of hot keys for the functionalities on the ribbon of the Administration
Reports Interface. For example, continue pressing C to jump to the Configuration Report interface.
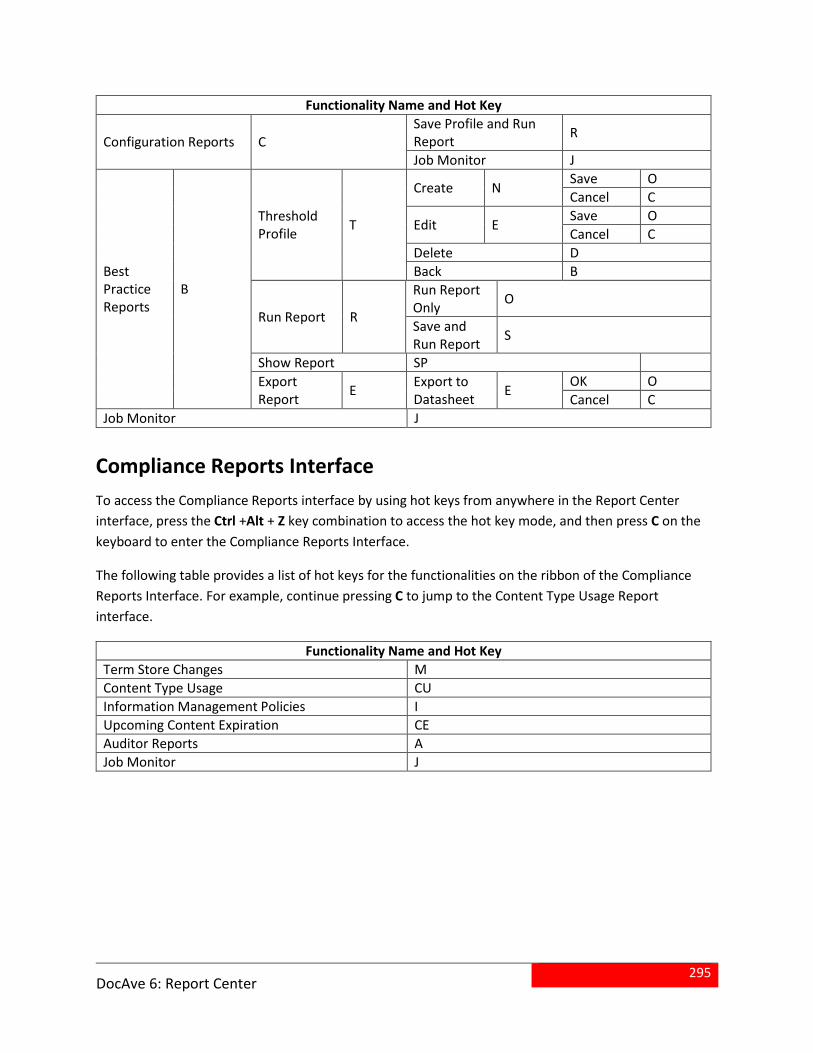
295
DocAve 6: Report Center
Functionality Name and Hot Key
Configuration Reports C Save Profile and Run Report
R
Job Monitor J
Best Practice Reports
B
Threshold Profile
T
Create N Save O
Cancel C
Edit E Save O
Cancel C
Delete D
Back B
Run Report R
Run Report Only
O
Save and Run Report
S
Show Report SP
Export Report
E Export to Datasheet
E OK O
Cancel C
Job Monitor J
Compliance Reports Interface
To access the Compliance Reports interface by using hot keys from anywhere in the Report Center
interface, press the Ctrl +Alt + Z key combination to access the hot key mode, and then press C on the
keyboard to enter the Compliance Reports Interface.
The following table provides a list of hot keys for the functionalities on the ribbon of the Compliance
Reports Interface. For example, continue pressing C to jump to the Content Type Usage Report
interface.
Functionality Name and Hot Key
Term Store Changes M
Content Type Usage CU
Information Management Policies I
Upcoming Content Expiration CE
Auditor Reports A
Job Monitor J
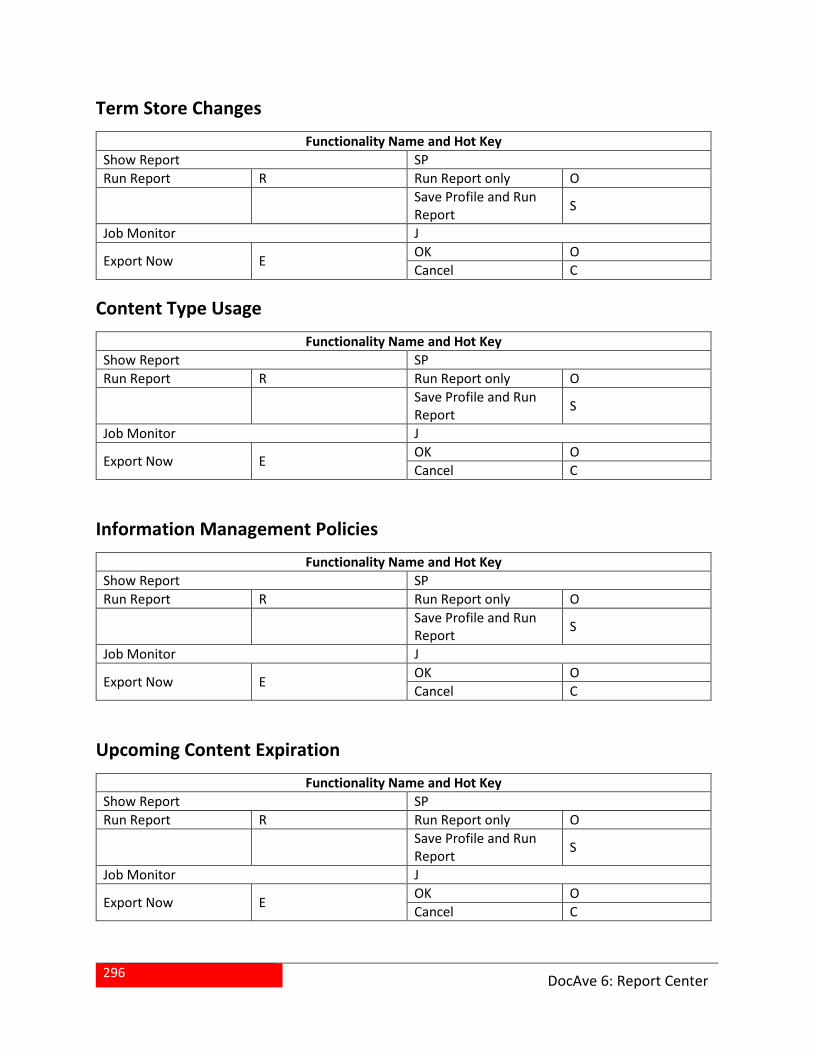
296
DocAve 6: Report Center
Term Store Changes
Functionality Name and Hot Key
Show Report SP
Run Report R Run Report only O
Save Profile and Run Report
S
Job Monitor J
Export Now E OK O
Cancel C
Content Type Usage
Functionality Name and Hot Key
Show Report SP
Run Report R Run Report only O
Save Profile and Run Report
S
Job Monitor J
Export Now E OK O
Cancel C
Information Management Policies
Functionality Name and Hot Key
Show Report SP
Run Report R Run Report only O
Save Profile and Run Report
S
Job Monitor J
Export Now E OK O
Cancel C
Upcoming Content Expiration
Functionality Name and Hot Key
Show Report SP
Run Report R Run Report only O
Save Profile and Run Report
S
Job Monitor J
Export Now E OK O
Cancel C
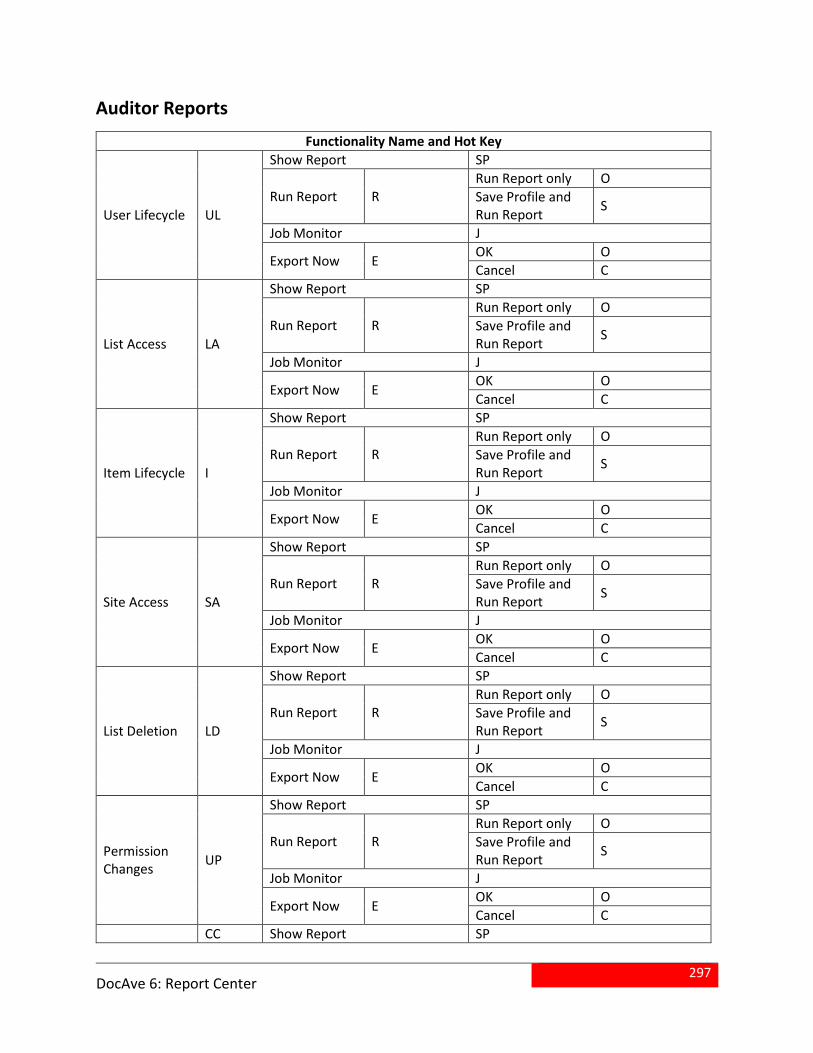
297
DocAve 6: Report Center
Auditor Reports
Functionality Name and Hot Key
User Lifecycle UL
Show Report SP
Run Report R Run Report only O
Save Profile and Run Report
S
Job Monitor J
Export Now E OK O
Cancel C
List Access LA
Show Report SP
Run Report R Run Report only O
Save Profile and Run Report
S
Job Monitor J
Export Now E OK O
Cancel C
Item Lifecycle I
Show Report SP
Run Report R Run Report only O
Save Profile and Run Report
S
Job Monitor J
Export Now E OK O
Cancel C
Site Access SA
Show Report SP
Run Report R Run Report only O
Save Profile and Run Report
S
Job Monitor J
Export Now E OK O
Cancel C
List Deletion LD
Show Report SP
Run Report R Run Report only O
Save Profile and Run Report
S
Job Monitor J
Export Now E OK O
Cancel C
Permission Changes
UP
Show Report SP
Run Report R Run Report only O
Save Profile and Run Report
S
Job Monitor J
Export Now E OK O
Cancel C
CC Show Report SP
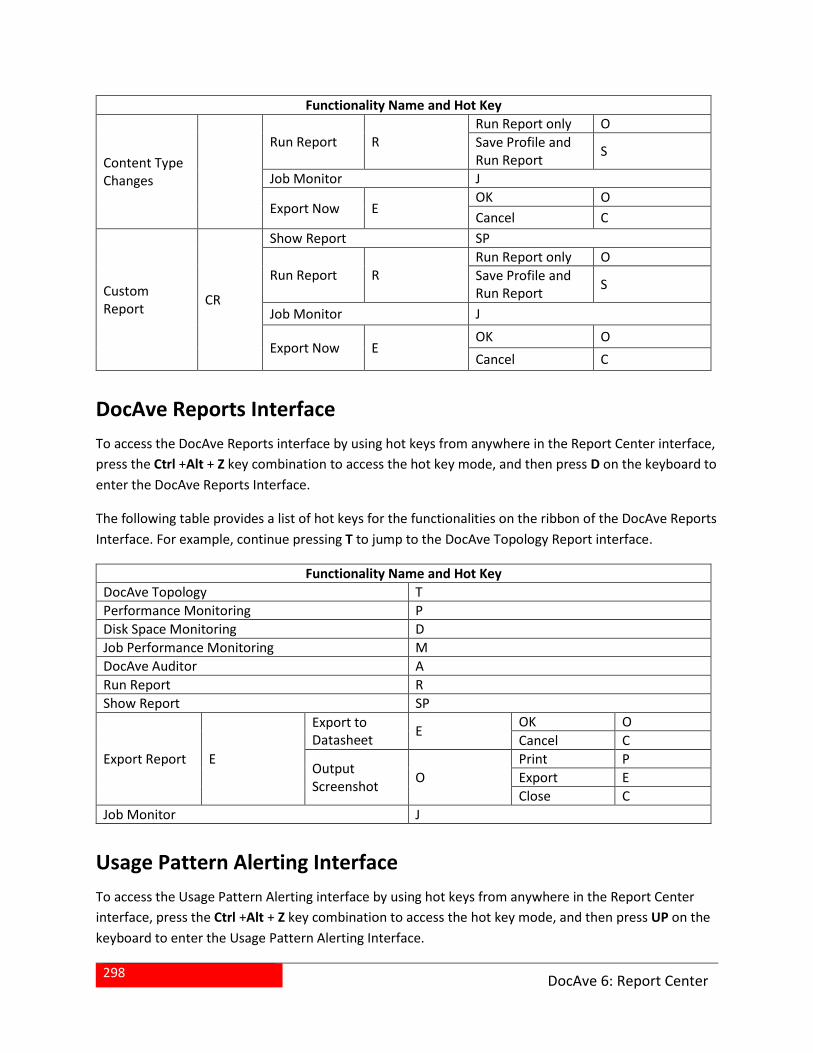
298
DocAve 6: Report Center
Functionality Name and Hot Key
Content Type Changes
Run Report R Run Report only O
Save Profile and Run Report
S
Job Monitor J
Export Now E OK O
Cancel C
Custom Report
CR
Show Report SP
Run Report R Run Report only O
Save Profile and Run Report
S
Job Monitor J
Export Now E OK O
Cancel C
DocAve Reports Interface
To access the DocAve Reports interface by using hot keys from anywhere in the Report Center interface,
press the Ctrl +Alt + Z key combination to access the hot key mode, and then press D on the keyboard to
enter the DocAve Reports Interface.
The following table provides a list of hot keys for the functionalities on the ribbon of the DocAve Reports
Interface. For example, continue pressing T to jump to the DocAve Topology Report interface.
Functionality Name and Hot Key
DocAve Topology T
Performance Monitoring P
Disk Space Monitoring D
Job Performance Monitoring M
DocAve Auditor A
Run Report R
Show Report SP
Export Report E
Export to Datasheet
E OK O
Cancel C
Output Screenshot
O
Print P
Export E
Close C
Job Monitor J
Usage Pattern Alerting Interface
To access the Usage Pattern Alerting interface by using hot keys from anywhere in the Report Center
interface, press the Ctrl +Alt + Z key combination to access the hot key mode, and then press UP on the
keyboard to enter the Usage Pattern Alerting Interface.
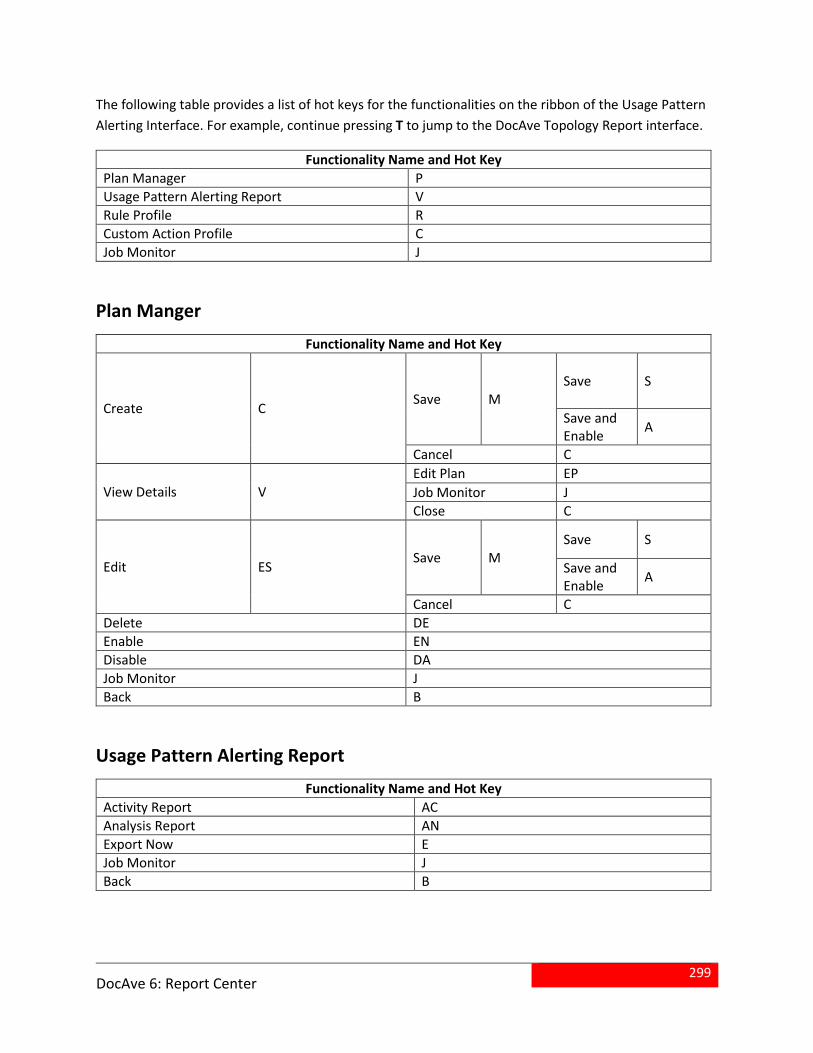
299
DocAve 6: Report Center
The following table provides a list of hot keys for the functionalities on the ribbon of the Usage Pattern
Alerting Interface. For example, continue pressing T to jump to the DocAve Topology Report interface.
Functionality Name and Hot Key
Plan Manager P
Usage Pattern Alerting Report V
Rule Profile R
Custom Action Profile C
Job Monitor J
Plan Manger
Functionality Name and Hot Key
Create C Save M
Save S
Save and Enable
A
Cancel C
View Details V
Edit Plan EP
Job Monitor J
Close C
Edit ES Save M
Save S
Save and Enable
A
Cancel C
Delete DE
Enable EN
Disable DA
Job Monitor J
Back B
Usage Pattern Alerting Report
Functionality Name and Hot Key
Activity Report AC
Analysis Report AN
Export Now E
Job Monitor J
Back B
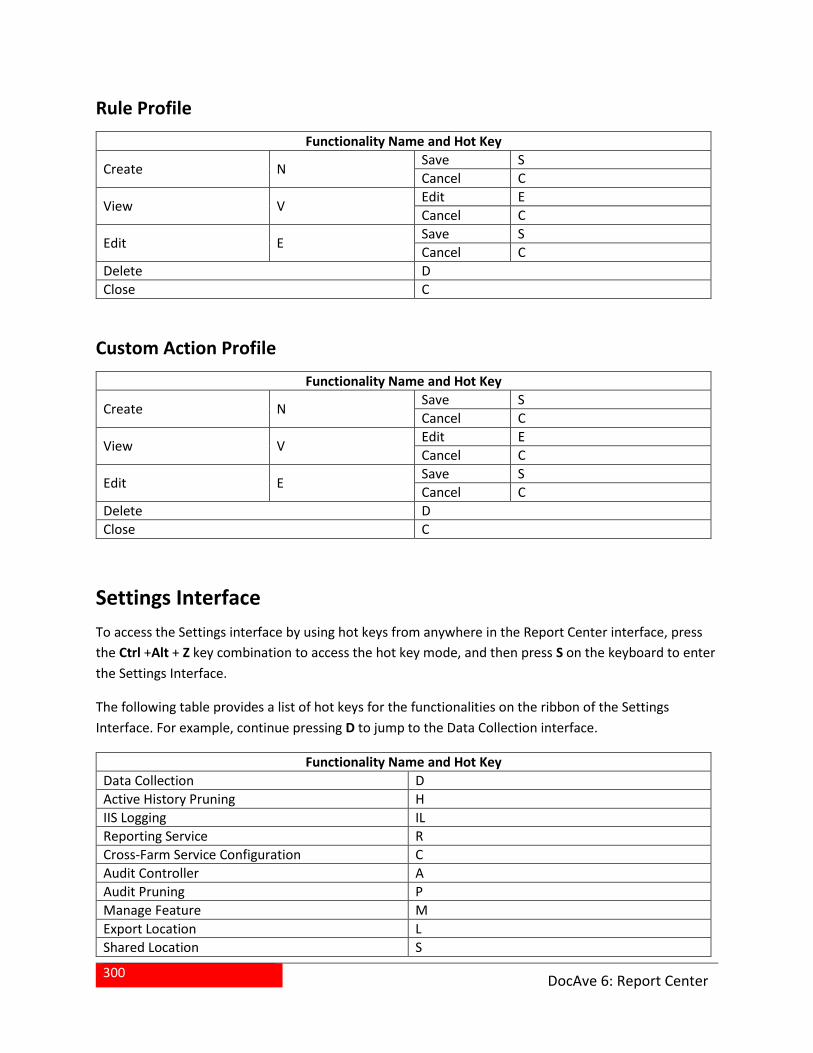
300
DocAve 6: Report Center
Rule Profile
Functionality Name and Hot Key
Create N Save S
Cancel C
View V Edit E
Cancel C
Edit E Save S
Cancel C
Delete D
Close C
Custom Action Profile
Functionality Name and Hot Key
Create N Save S
Cancel C
View V Edit E
Cancel C
Edit E Save S
Cancel C
Delete D
Close C
Settings Interface
To access the Settings interface by using hot keys from anywhere in the Report Center interface, press
the Ctrl +Alt + Z key combination to access the hot key mode, and then press S on the keyboard to enter
the Settings Interface.
The following table provides a list of hot keys for the functionalities on the ribbon of the Settings
Interface. For example, continue pressing D to jump to the Data Collection interface.
Functionality Name and Hot Key
Data Collection D
Active History Pruning H
IIS Logging IL
Reporting Service R
Cross-Farm Service Configuration C
Audit Controller A
Audit Pruning P
Manage Feature M
Export Location L
Shared Location S
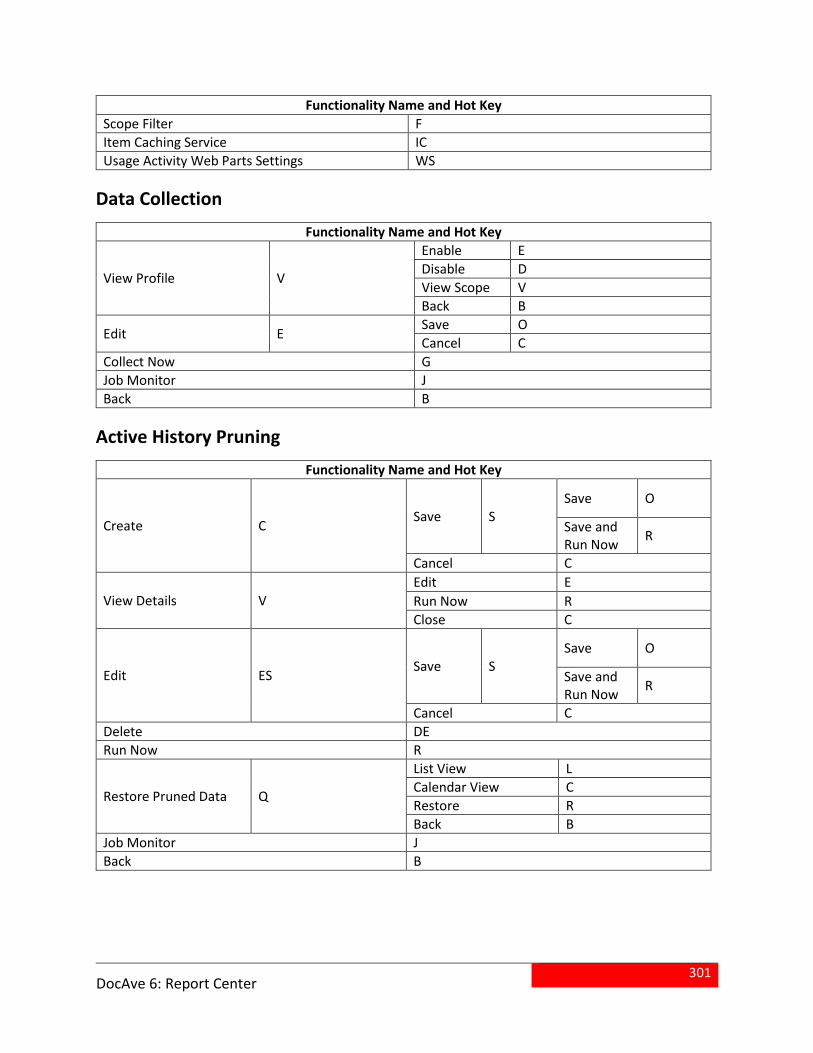
301
DocAve 6: Report Center
Functionality Name and Hot Key
Scope Filter F
Item Caching Service IC
Usage Activity Web Parts Settings WS
Data Collection
Functionality Name and Hot Key
View Profile V
Enable E
Disable D
View Scope V
Back B
Edit E Save O
Cancel C
Collect Now G
Job Monitor J
Back B
Active History Pruning
Functionality Name and Hot Key
Create C Save S
Save O
Save and Run Now
R
Cancel C
View Details V
Edit E
Run Now R
Close C
Edit ES Save S
Save O
Save and Run Now
R
Cancel C
Delete DE
Run Now R
Restore Pruned Data Q
List View L
Calendar View C
Restore R
Back B
Job Monitor J
Back B
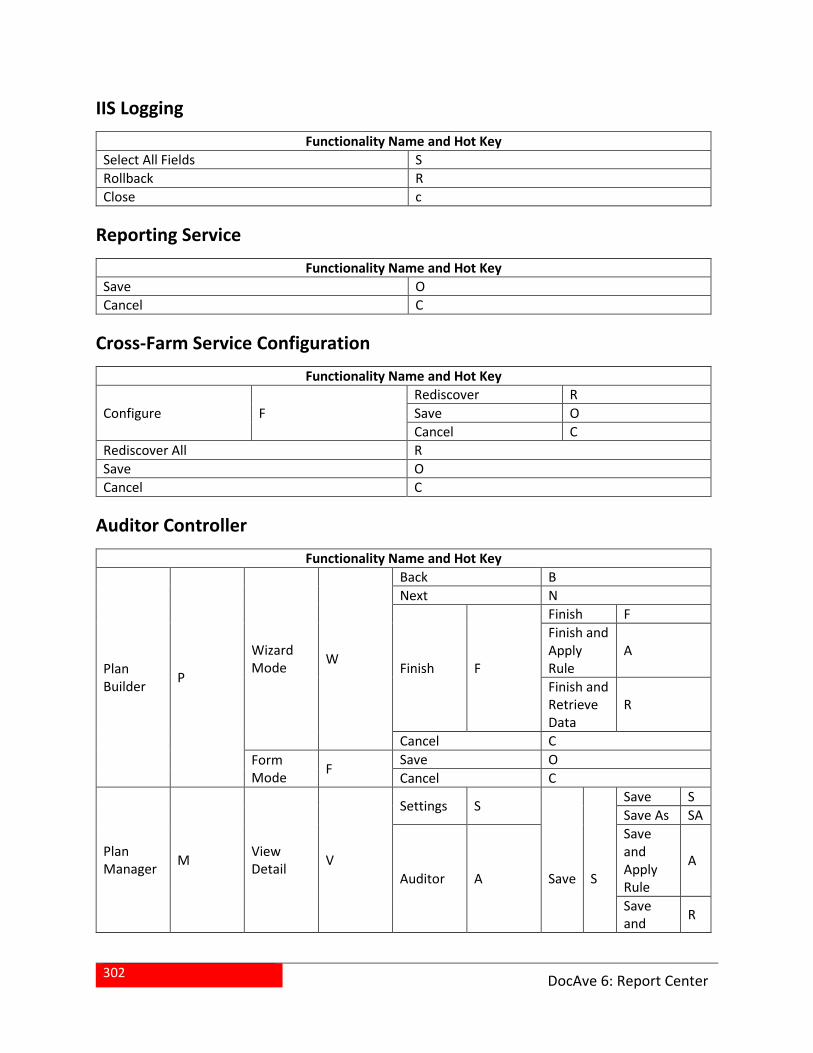
302
DocAve 6: Report Center
IIS Logging
Functionality Name and Hot Key
Select All Fields S
Rollback R
Close c
Reporting Service
Functionality Name and Hot Key
Save O
Cancel C
Cross-Farm Service Configuration
Functionality Name and Hot Key
Configure F
Rediscover R
Save O
Cancel C
Rediscover All R
Save O
Cancel C
Auditor Controller
Functionality Name and Hot Key
Plan Builder
P
Wizard Mode
W
Back B
Next N
Finish F
Finish F
Finish and Apply Rule
A
Finish and Retrieve Data
R
Cancel C
Form Mode
F Save O
Cancel C
Plan Manager
M View Detail
V
Settings S Save S
Save As SA
Auditor A Save S
Save and Apply Rule
A
Save and
R
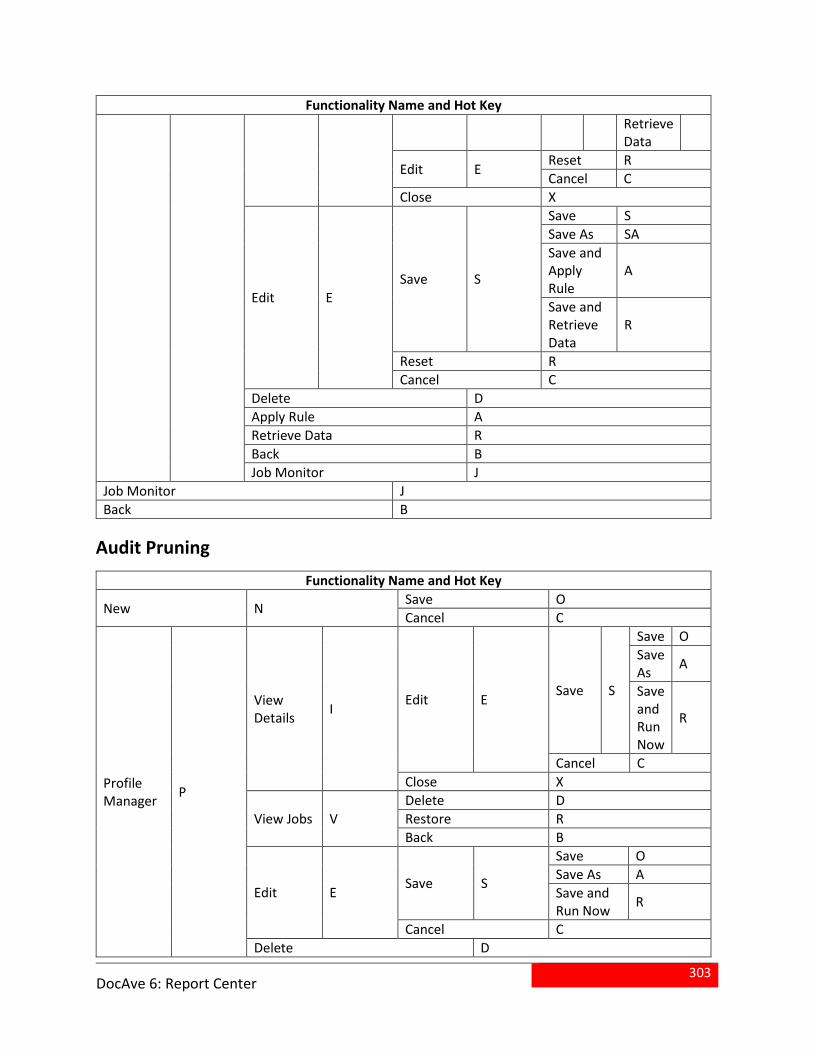
303
DocAve 6: Report Center
Functionality Name and Hot Key
Retrieve Data
Edit E Reset R
Cancel C
Close X
Edit E
Save S
Save S
Save As SA
Save and Apply Rule
A
Save and Retrieve Data
R
Reset R
Cancel C
Delete D
Apply Rule A
Retrieve Data R
Back B
Job Monitor J
Job Monitor J
Back B
Audit Pruning
Functionality Name and Hot Key
New N Save O
Cancel C
Profile Manager
P
View Details
I Edit E
Save S
Save O
Save As
A
Save and Run Now
R
Cancel C
Close X
View Jobs V
Delete D
Restore R
Back B
Edit E Save S
Save O
Save As A
Save and Run Now
R
Cancel C
Delete D
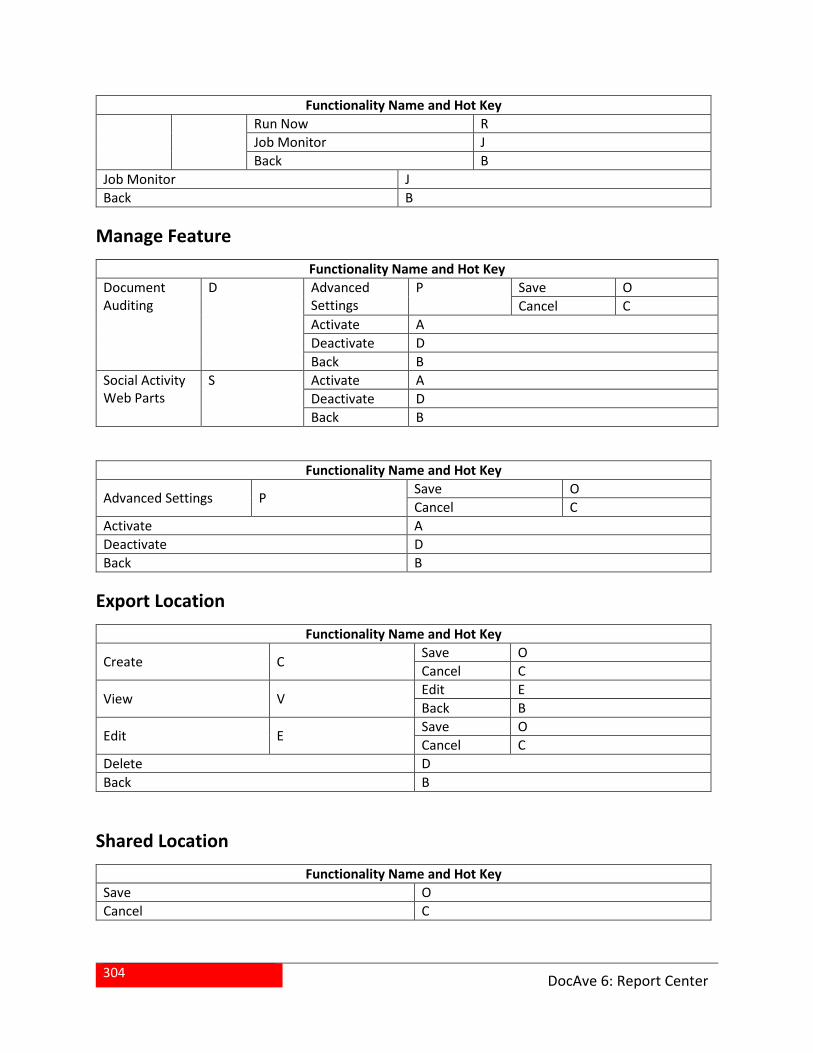
304
DocAve 6: Report Center
Functionality Name and Hot Key
Run Now R
Job Monitor J
Back B
Job Monitor J
Back B
Manage Feature
Functionality Name and Hot Key
Document Auditing
D Advanced Settings
P Save O
Cancel C
Activate A
Deactivate D
Back B
Social Activity Web Parts
S Activate A
Deactivate D
Back B
Functionality Name and Hot Key
Advanced Settings P Save O
Cancel C
Activate A
Deactivate D
Back B
Export Location
Functionality Name and Hot Key
Create C Save O
Cancel C
View V Edit E
Back B
Edit E Save O
Cancel C
Delete D
Back B
Shared Location
Functionality Name and Hot Key
Save O
Cancel C
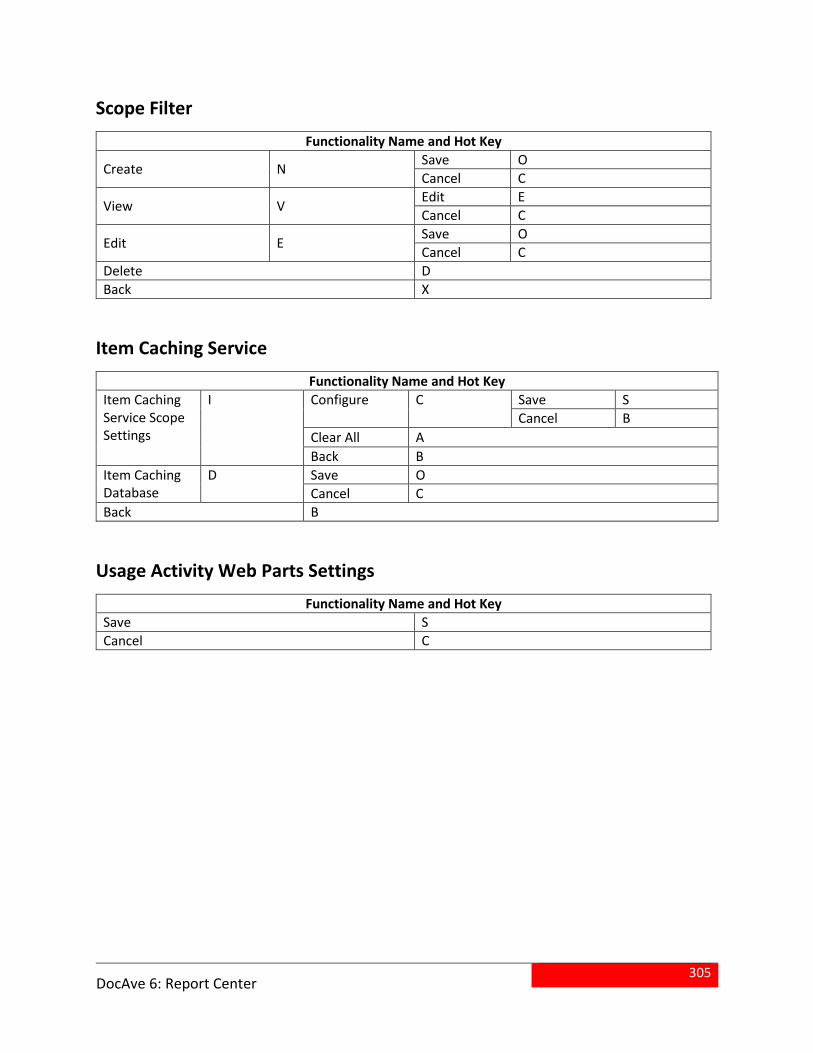
305
DocAve 6: Report Center
Scope Filter
Functionality Name and Hot Key
Create N Save O
Cancel C
View V Edit E
Cancel C
Edit E Save O
Cancel C
Delete D
Back X
Item Caching Service
Functionality Name and Hot Key
Item Caching Service Scope Settings
I Configure C Save S
Cancel B
Clear All A
Back B
Item Caching Database
D Save O
Cancel C
Back B
Usage Activity Web Parts Settings
Functionality Name and Hot Key
Save S
Cancel C
306
DocAve 6: Report Center
Notices and Copyright Information
Notice The materials contained in this publication are owned or provided by AvePoint, Inc. and are the property of AvePoint or its licensors, and are protected by copyright, trademark and other intellectual property laws. No trademark or copyright notice in this publication may be removed or altered in any way.
Copyright Copyright © 2012-2016 AvePoint, Inc. All rights reserved. All materials contained in this publication are protected by United States and international copyright laws and no part of this publication may be reproduced, modified, displayed, stored in a retrieval system, or transmitted in any form or by any means, electronic, mechanical, photocopying, recording or otherwise, without the prior written consent of AvePoint, 3 Second Street, Jersey City, NJ 07311, USA or, in the case of materials in this publication owned by third parties, without such third party’s consent. Notwithstanding the foregoing, to the extent any AvePoint material in this publication is reproduced or modified in any way (including derivative works and transformative works), by you or on your behalf, then such reproduced or modified materials shall be automatically assigned to AvePoint without any further act and you agree on behalf of yourself and your successors, assigns, heirs, beneficiaries, and executors, to promptly do all things and sign all documents to confirm the transfer of such reproduced or modified materials to AvePoint.
Trademarks
AvePoint®, DocAve®, the AvePoint logo, and the AvePoint Pyramid logo are registered trademarks of AvePoint, Inc. with the United States Patent and Trademark Office. These registered trademarks, along with all other trademarks of AvePoint used in this publication are the exclusive property of AvePoint and may not be used without prior written consent.
Microsoft, MS-DOS, Internet Explorer, Office, Office 365, SharePoint, Windows PowerShell, SQL Server, Outlook, Windows Server, Active Directory, and Dynamics CRM 2013 are either registered trademarks or trademarks of Microsoft Corporation in the United States and/or other countries.
Adobe Acrobat and Acrobat Reader are trademarks of Adobe Systems, Inc.
All other trademarks contained in this publication are the property of their respective owners and may not be used without such party’s consent.
Changes The material in this publication is for information purposes only and is subject to change without notice. While reasonable efforts have been made in the preparation of this publication to ensure its accuracy, AvePoint makes no representation or warranty, expressed or implied, as to its completeness, accuracy, or suitability, and assumes no liability resulting from errors or omissions in this publication or from the use of the information contained herein. AvePoint reserves the right to make changes in the Graphical User Interface of the AvePoint software without reservation and without notification to its users.
AvePoint, Inc. Harborside Financial Center, Plaza 10 3 Second Street, 9th Floor Jersey City, New Jersey 07311 USA

![Introduction - Microsoftinteroperability.blob.core.windows.net/.../[MS-XLSX]-170118.docx · Web view[MS-XLSX]: Excel (.xlsx) Extensions to the Office Open XML SpreadsheetML File Format.](https://static.documents.pub/doc/80x56/5aef07d07f8b9aa9168c0061/introduction-micro-ms-xlsx-170118docxweb-viewms-xlsx-excel-xlsx-extensions.jpg)

![interoperability.blob.core.windows.net · Web view2016-09-29 · [MS-XLSX]: Excel (.xlsx) Extensions to the Office Open XML SpreadsheetML File Format. Intellectual Property Rights](https://static.documents.pub/doc/80x56/5e7c3c6cb76e6842f9501201/web-view-2016-09-29-ms-xlsx-excel-xlsx-extensions-to-the-office-open-xml.jpg)


![interoperability.blob.core.windows.net · Web view2019. 1. 11. · [MS-XLSX]: Excel (.xlsx) Extensions to the Office Open XML SpreadsheetML File Format. Intellectual Property Rights](https://static.documents.pub/doc/80x56/5fe22ac72ef9fd25282d3262/web-view-2019-1-11-ms-xlsx-excel-xlsx-extensions-to-the-office-open-xml.jpg)


![Introduction · Web view[MS-XLSX]: Excel (.xlsx) Extensions to the Office Open XML SpreadsheetML File Format Intellectual Property Rights Notice for Open Specifications Documentation](https://static.documents.pub/doc/80x56/5d322a2488c9939a158cfff5/introduction-web-viewms-xlsx-excel-xlsx-extensions-to-the-office-open.jpg)

