NITROGEN METABOLISM AND SOLVENT PRODUCTION IN CLOSTRIDIUM BEIJERINCKII NRRL B593 by Murat Kasap Dissertation submitted to the Faculty of the Virginia Polytechnic Institute and State University in partial fulfillment of the requirements for the degree of DOCTOR OF PHILOSOPHY In Biochemistry APPROVED J. –S. Chen, Chairman W. E. Newton R. H. White E. M. Gregory G. W. Claus July, 2002 Blacksburg, Virginia Keywords: nif genes, Clostridium beijerinckii, solvent production, nitrogen fixation
Transcript
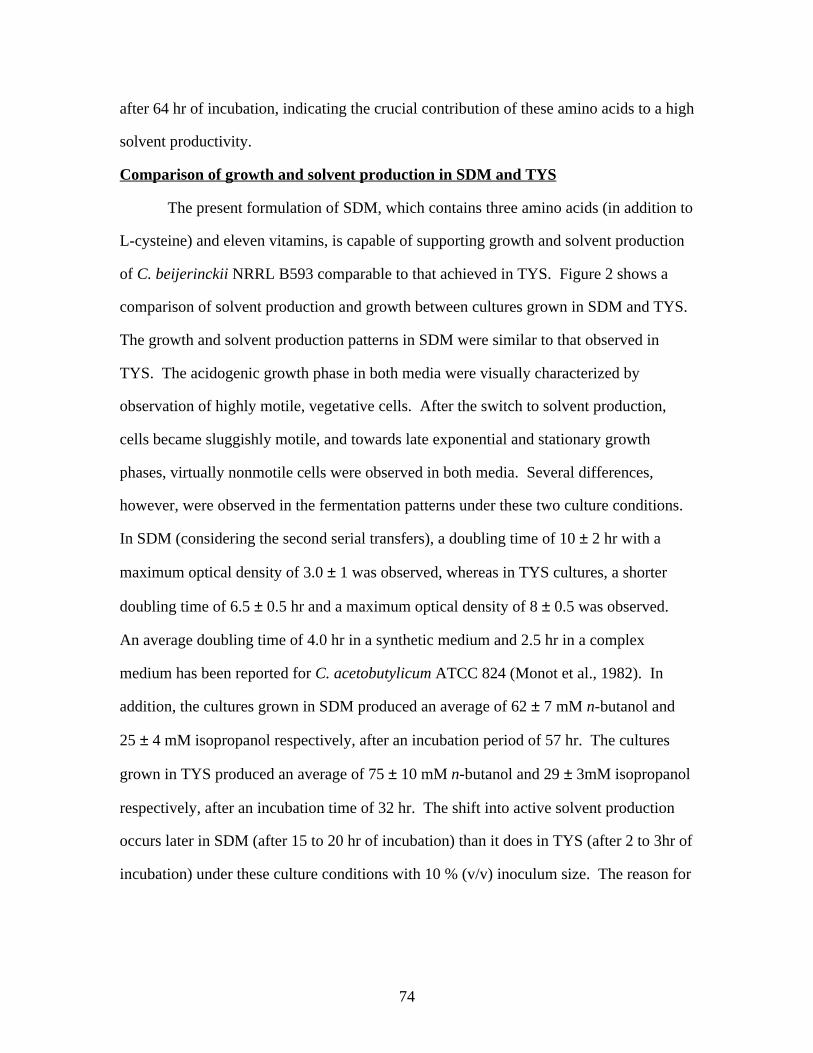
NITROGEN METABOLISM AND SOLVENT PRODUCTION INCLOSTRIDIUM BEIJERINCKII NRRL B593
by
Murat Kasap
Dissertation submitted to the Faculty of the
Virginia Polytechnic Institute and State University
in partial fulfillment of the requirements for the degree of
NITROGEN METABOLISM AND SOLVENT PRODUCTION IN CLOSTRIDIUMBEIJERINCKII NRRL B593
by
Murat Kasap
Committee Chairman: J.-S. ChenBiochemistry
(ABSTRACT)The onset of solvent production by the clostridia involves regulation at the
transcriptional level. The signal triggering the onset has not been identified, but redoxand energetic states have been suggested as possible factors. Because several solvent-producing clostridia, including Clostridium acetobutylicum and Clostridium beijerinckii,
are nitrogen-fixing organisms and both nitrogen-fixation and alcohol production (n-
butanol, isopropanol and ethanol) are reductant-dependent processes, the effect ofnitrogen fixation on the onset and progression of solvent production in C. beijerinckii
NRRL B593 and vice versa was investigated. For this purpose, a defined growth mediumcontaining three amino acids was developed for C. beijerinckii NRRL B593, and thismedium was used for growing solvent-producing and nitrogen-fixing cultures. Thenitrogen-fixing cultures produced solvents with a solventogenic shift, which appeared tocoincide with a decrease in nitrogen-fixing activity. Measurement of specific activities ofacetoacetate decarboxylase and aldehyde dehydrogenase and Northern blot analysis ofthe mRNA of the solvent-producing genes in samples harvested periodically from anitrogen-fixing culture of C. beijerinckii showed the presence of both enzyme activities
and the mRNA carrying the solvent-production genes throughout incubation. A 2.5-foldincrease in the specific activity of acetoacetate decarboxylase and a 4.5-fold increase inthe specific activity of aldehyde dehydrogenase were observed when the activities in thelatest cell-free extract was compared with the activities in the earliest cell-free extract.When C. beijerinckii was grown in the medium containing 4 mM ammonium acetate, theonset of nitrogen fixation coincided with the onset of solvent production and preventedaccumulation of solvents to high levels, which suggested competition between alcohol-producing enzymes and nitrogenase for the reductant.
Recently, a 20-kb region of the genomic DNA of C. beijerinckii NRRL B593 thatcontained the nif genes and ORFs with other putative functions was sequenced in ourlaboratory. An examination of the nif clusters of C. beijerinckii, C. acetobutylicum and
C. pasteurianum revealed apparent differences in the intervening ORFs which suggested
differences in the regulation of nitrogen fixation in these organisms. Transcriptionalanalysis of genes in the nif cluster of C. beijerinckii by Northern blotting revealed fourdifferent transcripts. The absence of mRNAs of the nif-associated ORFs in RNA samplesisolated from non-nitrogen-fixing cells indicated that the nif-associated ORFs areregulated in parallel to the nif genes. By studying the effect of ammonia addition on
nitrogen-fixing activities of C. beijerinckii and C. pasteurianum, significant differencesin the regulation of nitrogen-fixation in the two species were observed. C. beijerinckii
NRRL B593, but not C. pasteurianum, showed a rapid decrease in nitrogen-fixingactivity in vivo upon ammonium acetate addition. However, measurement of nitrogen-fixing activities in vitro before and after ammonium acetate addition showed the presenceof active nitrogenase throughout growth in both organisms. The results suggest that thenitrogenase activity in C. beijerinckii NRRL B593 is inhibited when ammonia isavailable.
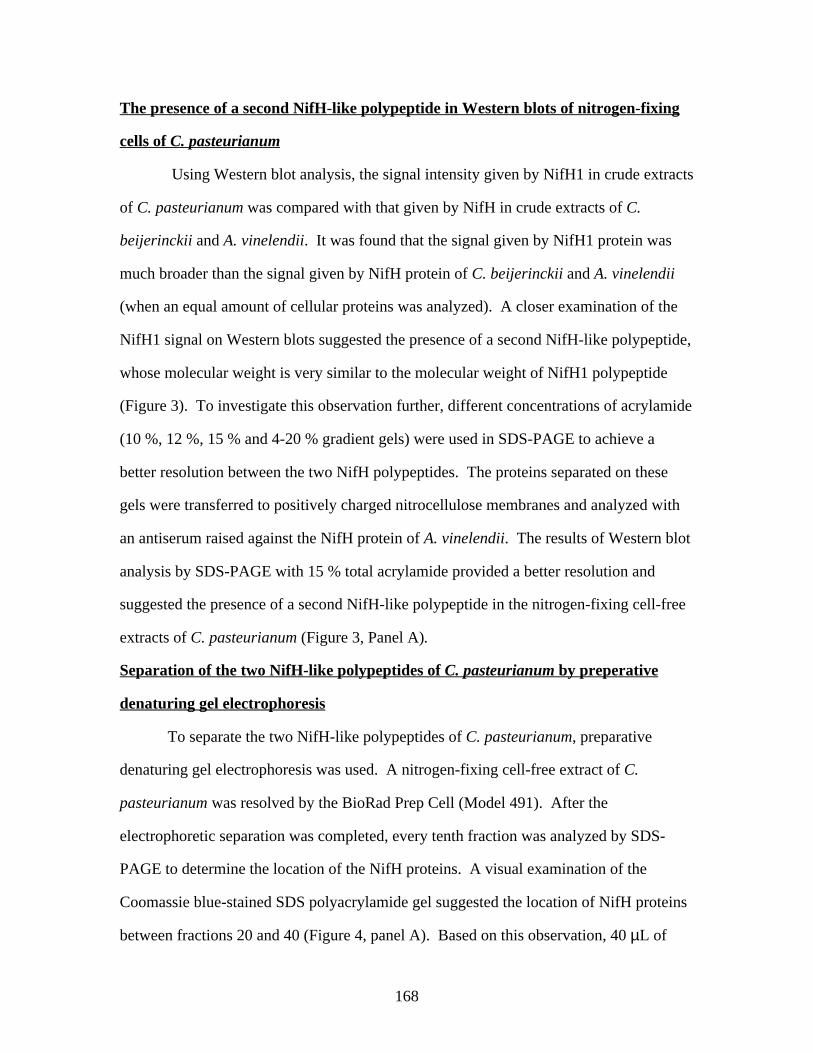
A second nifH-hybridizing mRNA was detected in Northern blots during studiesof the expression of nifH1 in C. pasteurianum. The mRNA was identified as that fromeither the nifH2 or nifH6 gene after sequencing the cDNA strands, which were generated
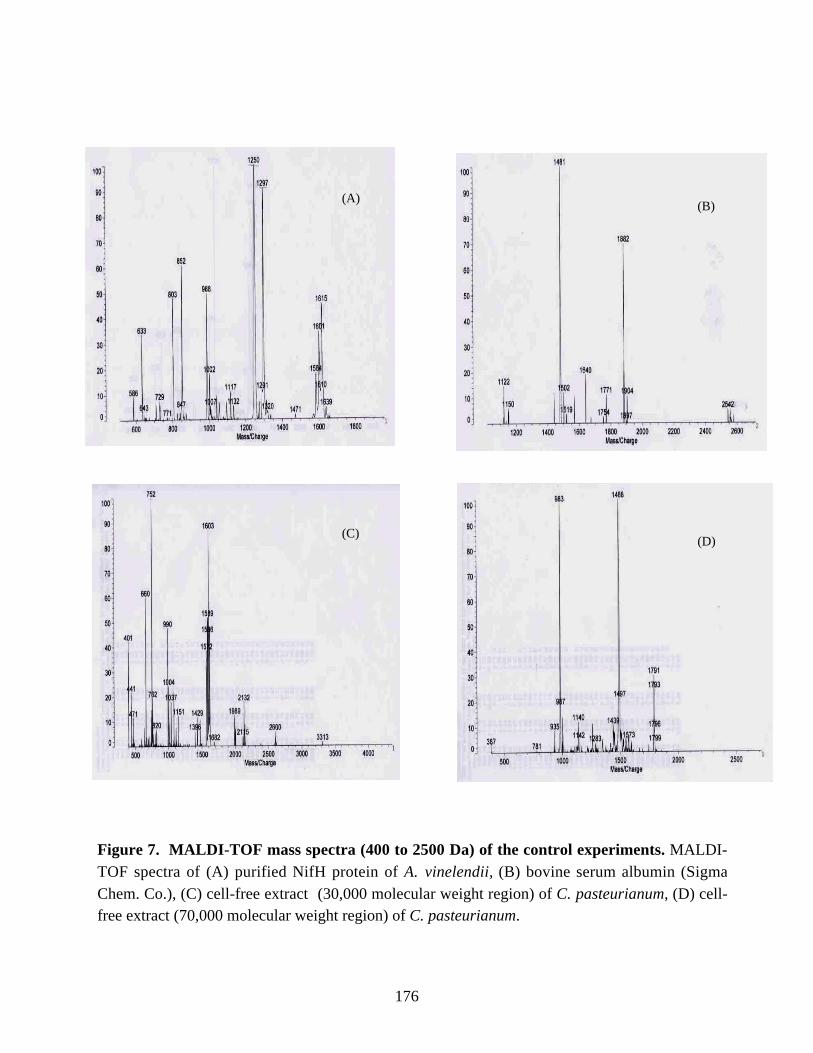
by RT (Reverse Transcriptase)-PCR. In addition, Western blot analysis of the cell-freeextracts of nitrogen-fixing cells of C. pasteurianum indicated the presence of a secondNifH-related polypeptide. The two NifH-related polypeptides were separated bypreparative gel electrophoresis and characterized by MALDI-TOF (Matrix-assisted LaserDesorption Ionization Time-Of-Flight) mass spectrometry. The results suggested theexpression of NifH2/H6 protein in nitrogen-fixing cells of C. pasteurianum. Thephysiological significance of the expression of the nifH2 or nifH6 gene or both is yet tobe determined.
ACKNOWLEDGEMENTS
I wish to express my appreciation to my advisor, Dr. J.-S. Chen, for his ideas,
patience, guidance, direction and coaching. His concerned mentorship has taught me
innumerable lessons, both within and beyond the boundaries of science. For this I am
grateful to him.
Sincere thanks are also in order for the members of my committee, namely, Dr.
W. E. Newton, Dr. E. M. Gregory, Dr. R. H. White, and Dr. G. W. Claus for their helpful
advice, comments, suggestions and assistance during my course of study and research.
Thanks are also expressed to Julianna Toth and Adnan Ismaiel for their
assistance. I am grateful for their friendship and support.
I acknowledge the contribution of my mother, my father, my brothers and my
sisters for their support and encouragement during my study.
I am grateful to Turkish Government for providing me this golden opportunity of
studying in America.
I would like to express my deepest appreciation to my wife, Sema Kasap and to
my son, E. Melih Kasap for their sacrifice, love, support and encouragement.
Most of all, I thank God for giving me the health and strength during my study.
IV
LIST OF ABBREVIATIONSADH Alcohol dehydrogenaseADP Adenosine diphosphateALDH Aldehyde dehydrogenaseATP Adenosine triphosphate
Bis N,N’-methylene-bis-acrylamideBLAST Basic local alignment search toolBSA Bovine serum albuminCHES 2-[N-cyclohexylethyl]-1-piperazineDBM Defined basal mediumDCM Defined combination mediumDEPC DiethylpyrocarbonatedNTP DeoxyribonucleosidetriphosphateDTT DitiothreitolECL Enhanced chemiluminescenceEDTA Ethylenediaminetetraacetic acid
EMS Ethhyl methane sulfonateFd FerredoxinHEPES N-[2-hydroxylethyl]piperazine-N’-[2-ethane sulfonic acid]MALDI-Tof Matrix-assisted laser desorption ionization mass spectrometry-time of
flightMMNG N-methyl-N’-nitro-N-nitrosoguanidineMOPS 3-[N-morpholino]propane sulfonic acidNAD(P)+ Nicotineamide adenine dinucletide (phosphate)ODx Optical denisity at x nmORF Open reading framePAGE Polyacrylamide gel electrophoresis
TABLE OF CONTENTSCover page IAbstract IIAcknowledgements IVList of abbreviations V
Table of Contents VIList of Figures IXList of Tables XIIChapter 1. Literature Review 1Part I 1Solvent fermentation by the clostridia 1
Introduction 1History of acetone-butanol fermentation 2Microorganisms 3Biochemistry and physiology 4Effects of environmental factors on solvent production 9
Events associated with the solventogenic switch 12Major drawbacks of solvent fermentation 17Genetic studies with the solventogenic clostridia 20Current use of solvents and their synthesis 27
Part II 28Nitrogen metabolism of the solvent-producing clostridia 28
Chapter 2. Materials and Methods 34Microorganisms 34Chemicals 34Medium compositions 35Media for nitrogen-fixing cultures of C. beijerinckii and C. pasteurianum 36
Preparation of the media 37Growth 37Omission experiments 38Measurement of solvent concentrations 39Preparation of cell-free extracts 39Protein determination 39Enzyme assays 39Isolation of genomic DNA 41Quantification of genomic DNA 42Isolation of plasmid DNA 42PCR amplification of the nifH gene fragment 43
Purification and concentration of PCR products 43
Agarose gel electrophoresis of DNA samples 44Southern analysis 44Hybridization conditions 44Labeling of DNA probes 45Detection of the ECL signal 45
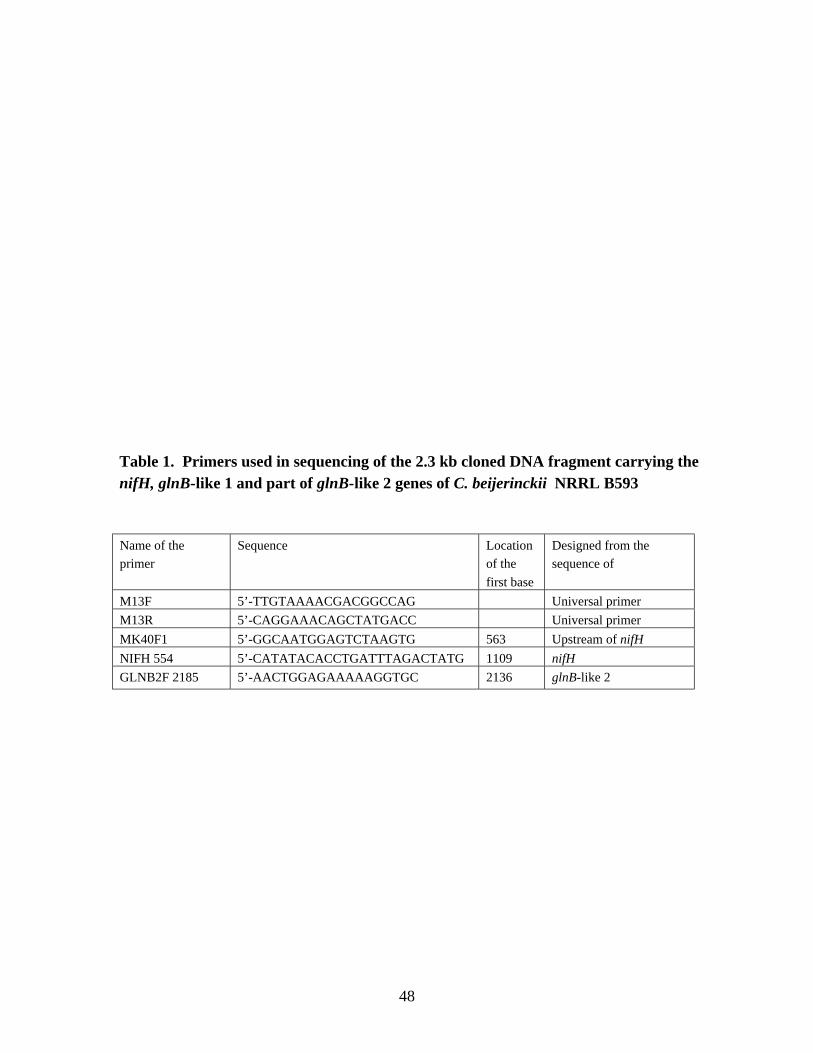
Estimation of the size of DNA fragments harboring the nifH gene 45Cloning of the nifH gene 46Sequencing of the 2.3 kb cloned DNA fragment carrying the nifH, glnB-like 1
and part of glnB-like 2 genes of C. beijerinckii 47Nucleotide sequence accession number 47RNA isolation 47Storage and thawing of RNA samples 51Quantification of RNA 51Agarose gel electrophoresis of RNA samples 51Quality control of the RNA preparations 51Northern transfer 51
Reprobing the Northern blots 52Generation of probes for the analysis of the nif and sol transcripts 52Northern hybridization and detection of transcripts 52Estimation of the size of RNA fragments 53Internal control used in Northern blots 53Western blots 56Non-denaturing PAGE 56Direct RT-PCR amplification of the nifH2/H6 supported on a Northern
mass spectrometry analysis of fractions obtained from preperativegel electrophoresis 57
In-gel digestion of the proteins with trypsin 58Recovery of the peptides 58Mass spectra 59
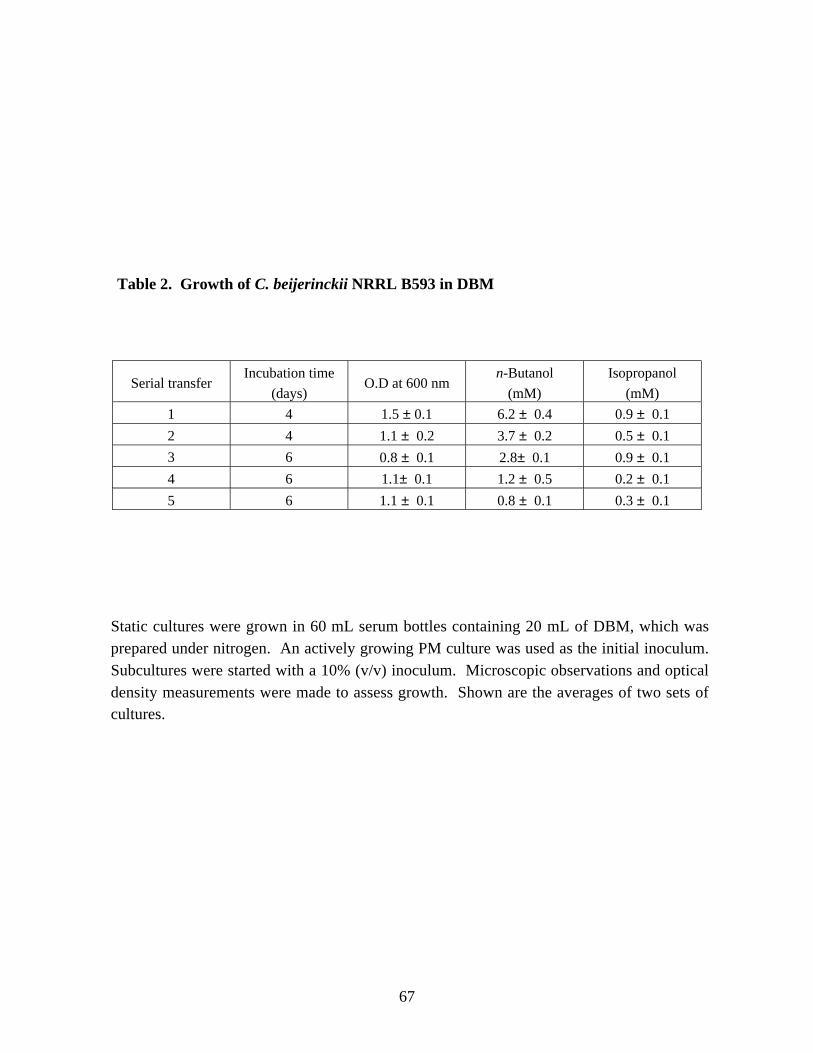
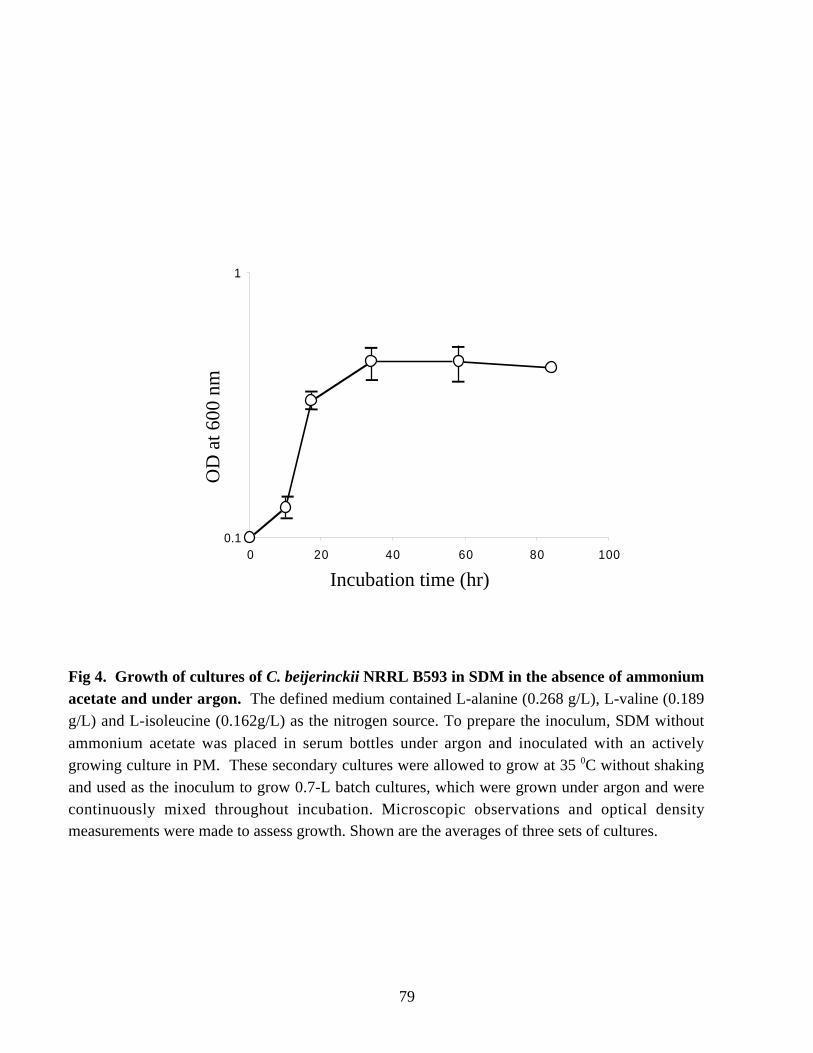
Chapter 3. Development of a defined growth medium for Clostridiumbeijerinckii NRRL B593 61Abstract 61Introduction 62Results 66Discussion 80
VI
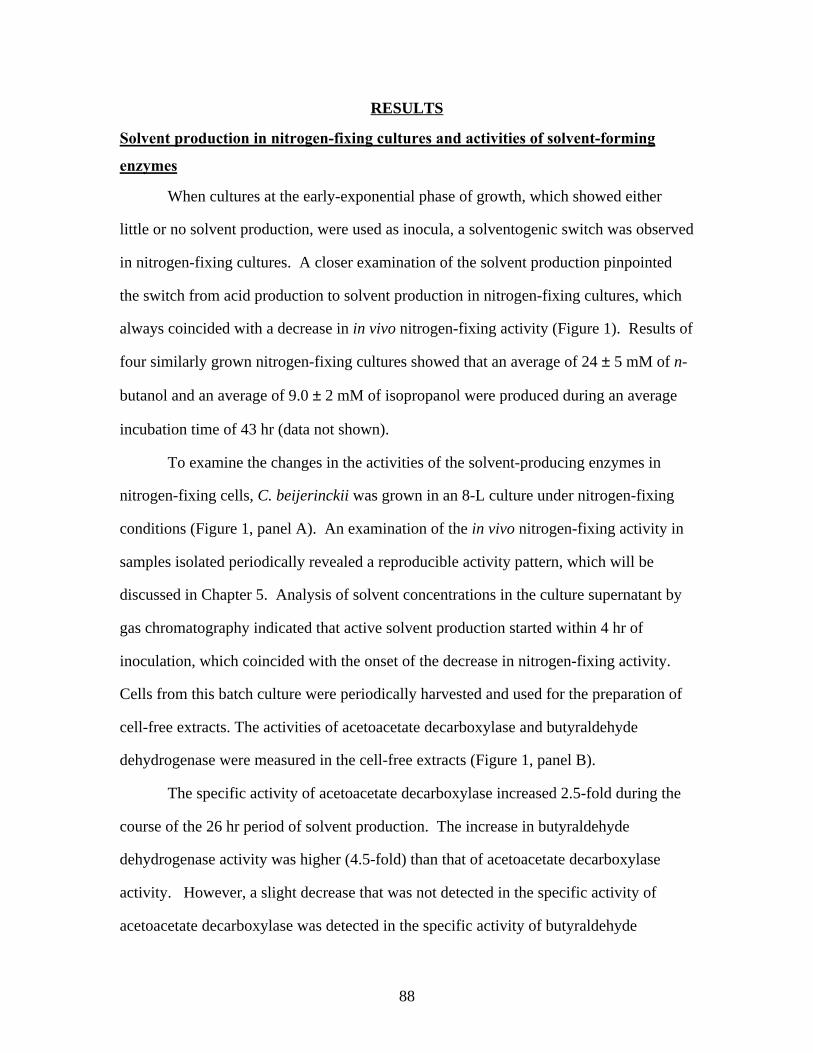
Chapter 4. Characterization of solvent production in nitrogen-fixingcultures of Clostridium beijerinckii NRRL B593 84Abstract 84Introduction 86Results 88
Discussion 109Chapter 5. Transcriptional analysis of genes in the nif cluster of
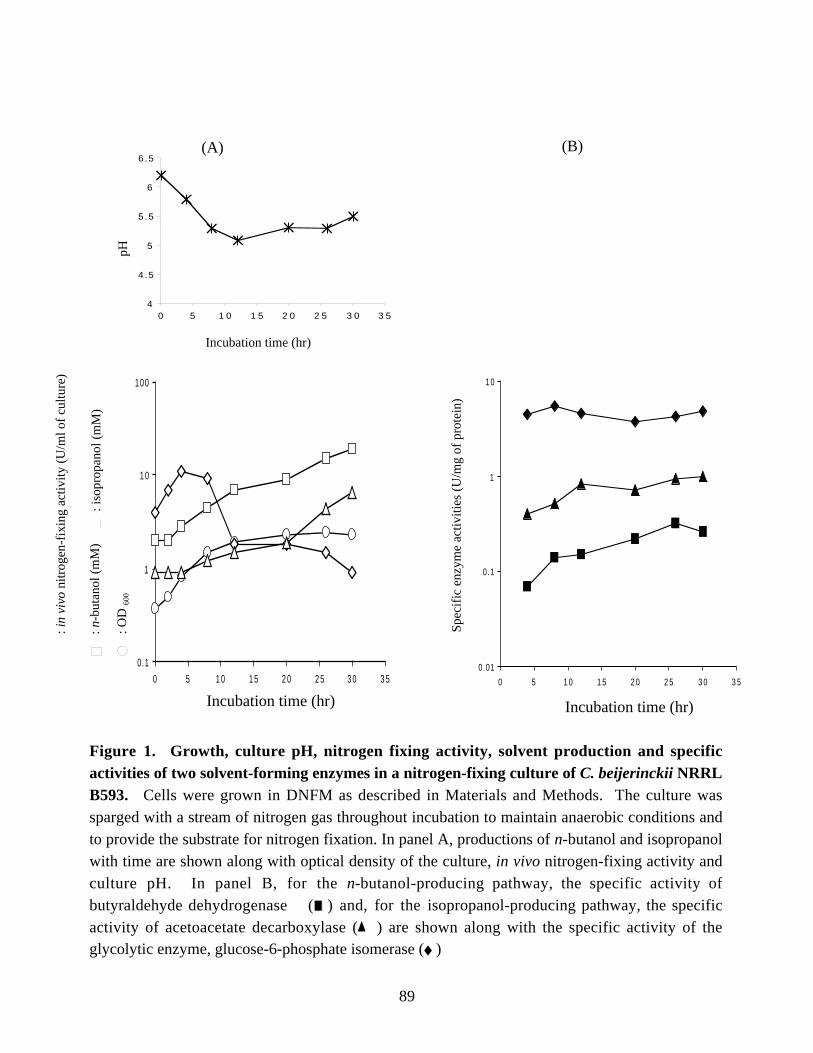
and specific activities of two solvent-forming enzymes in anitrogen-fixing culture of C. beijerinckii NRRL B593. 89
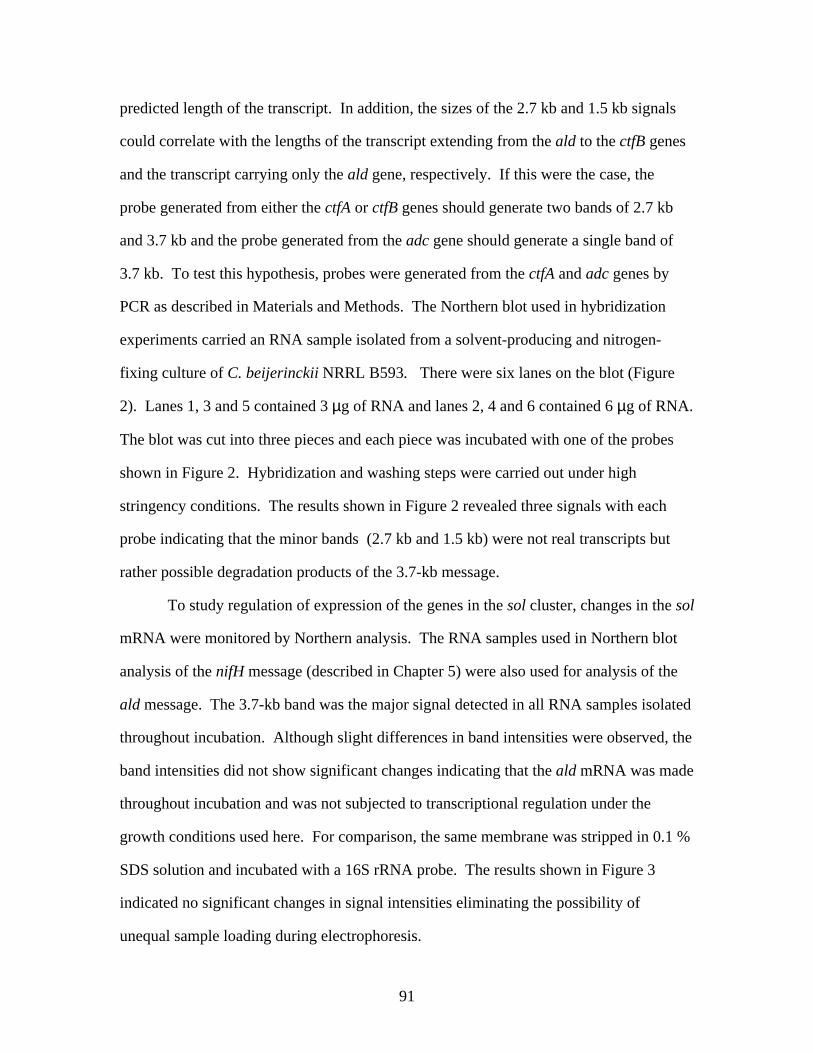
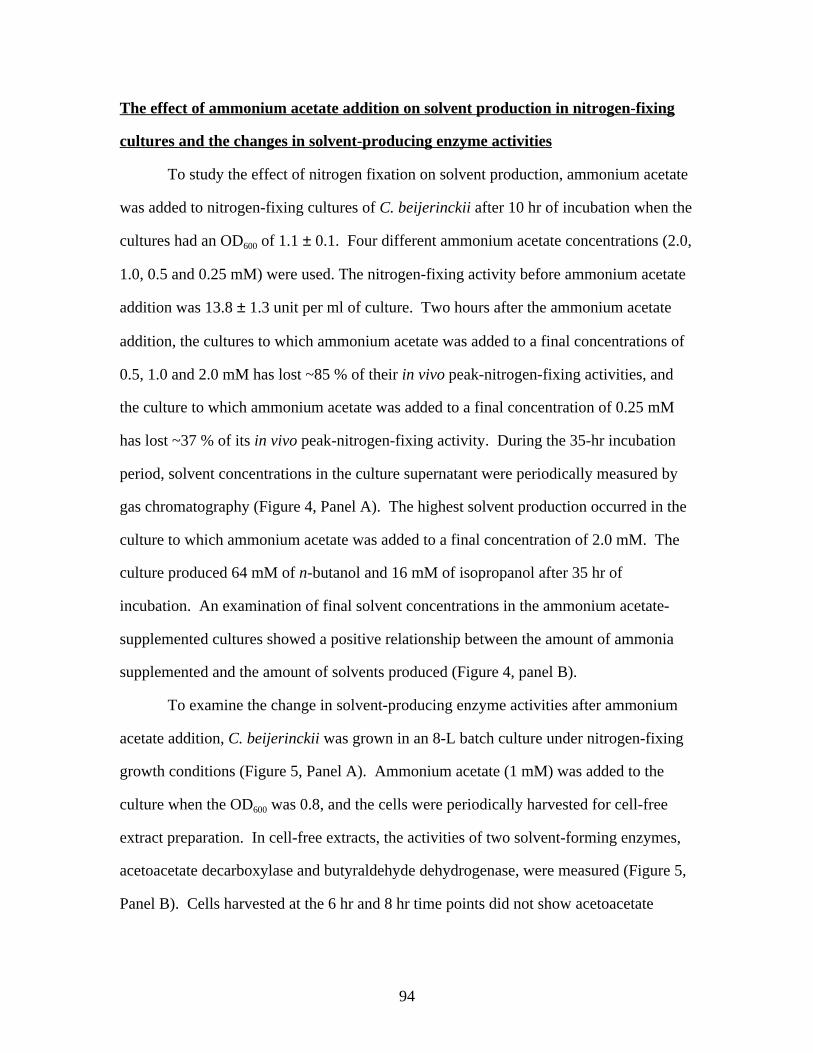
Figure 2. The physical map of the sol cluster of C. beijerinckii NRRL
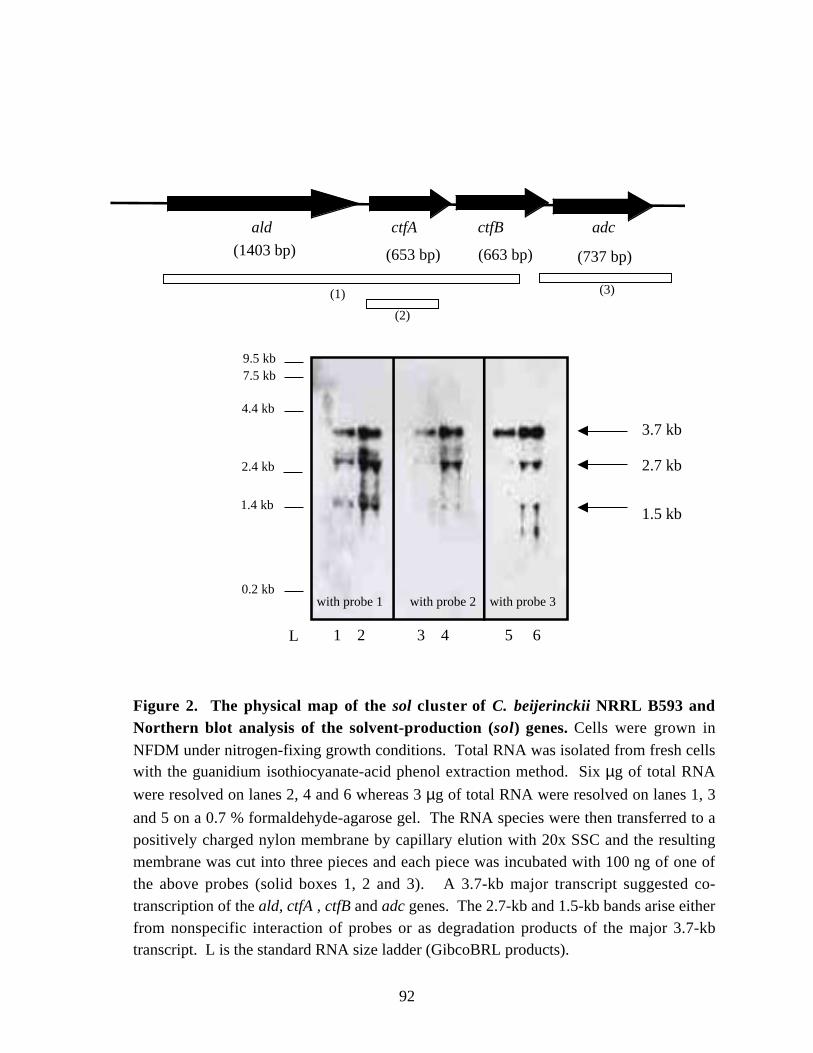
B593 and Northern blot analysis of the solvent-prodution (sol) genes. 92Figure 3. Northern blot analysis of the ald mRNA in periodically isolated samples of C. beijerinckii NRRL B593. 93Figure 4. The effect of ammonia addition on solvent production in
nitrogen-fixing cultures of C. beijerinckii NRRL B593. 95Figure 5. Growth, culture pH, nitrogen-fixing activity, solvent production
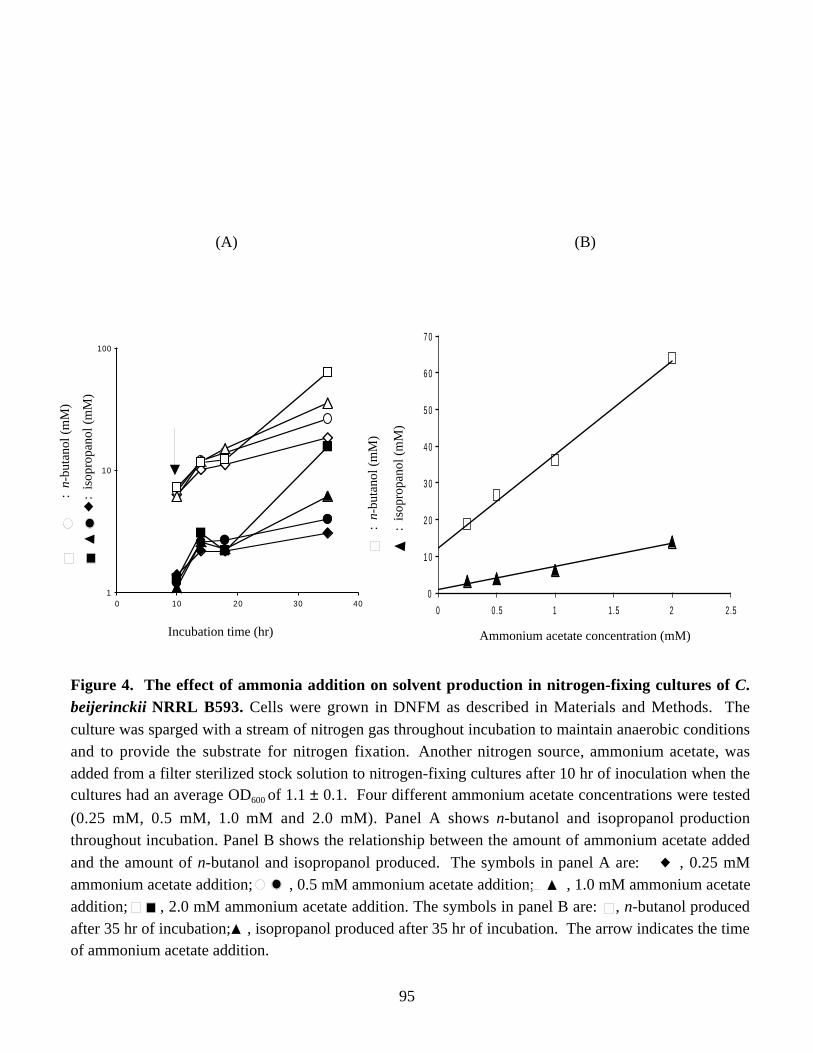
and specific activities of two solvent-forming enzymes in anammonia-supplemented nitrogen-fixing culture of C. beijerinckii
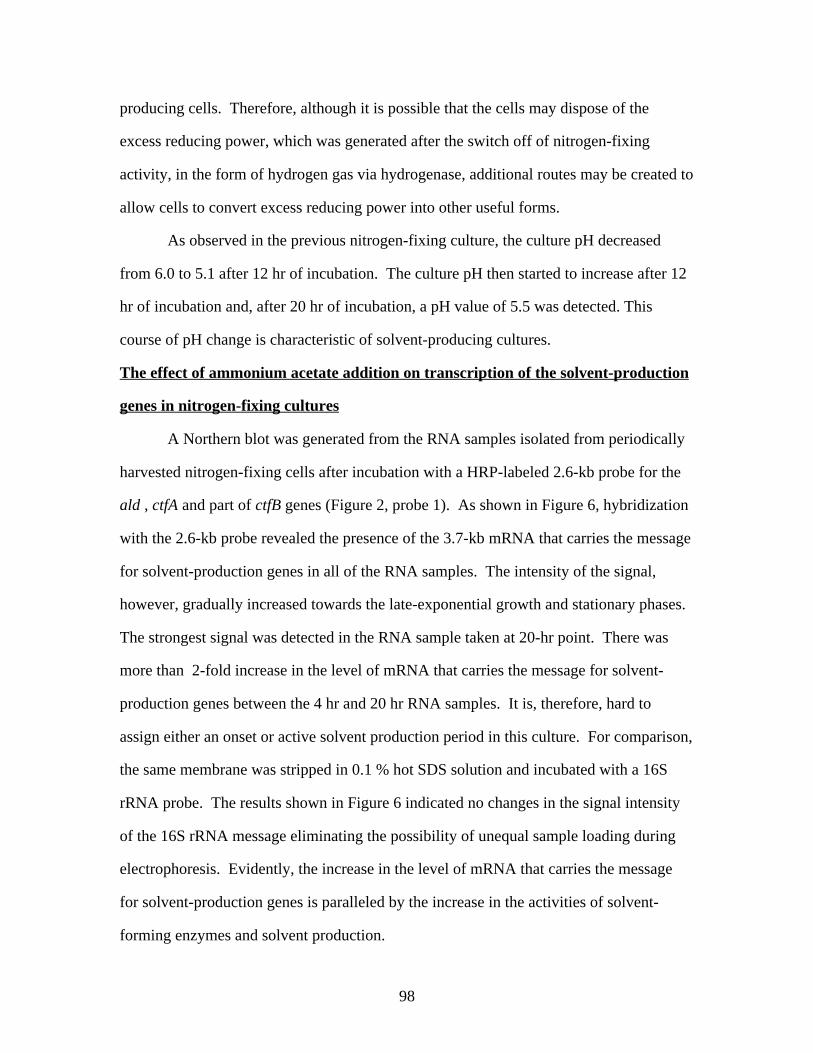
NRRL B593. 96Figure 6. Northern blot analysis of the ald mRNA expression in periodically isolated
samples of C. beijerinckii NRRL B593 after ammonium acetate
addition. 99
VIII
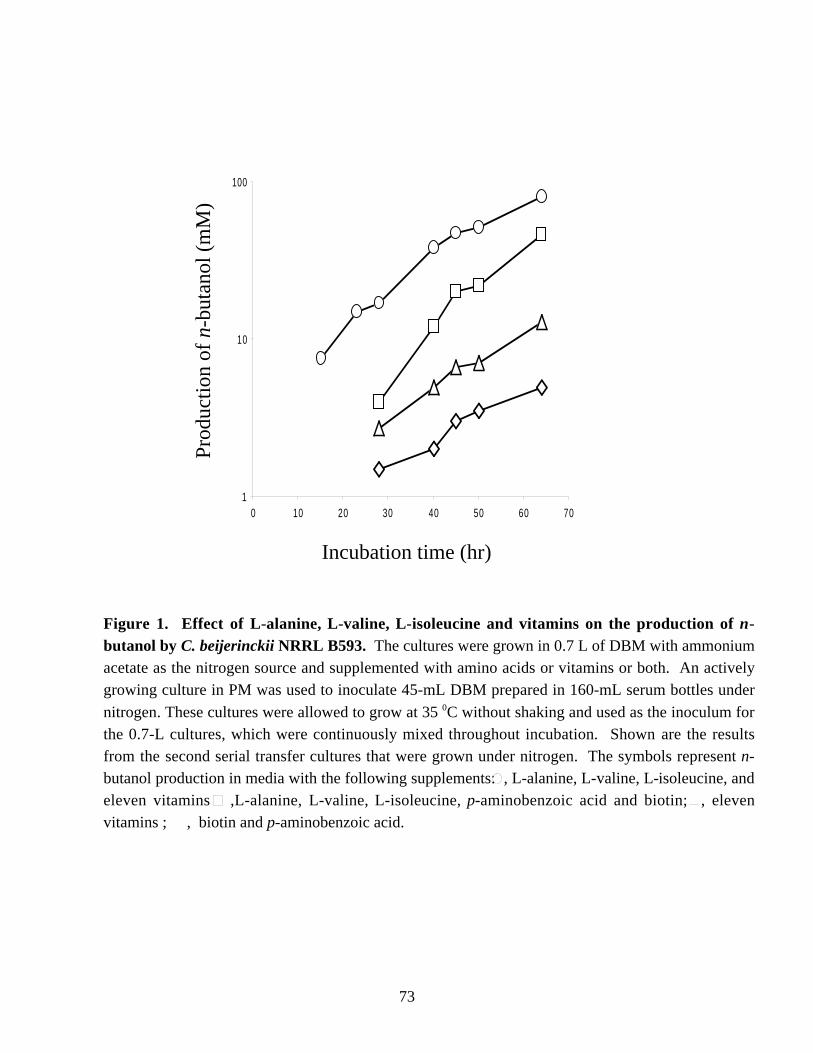
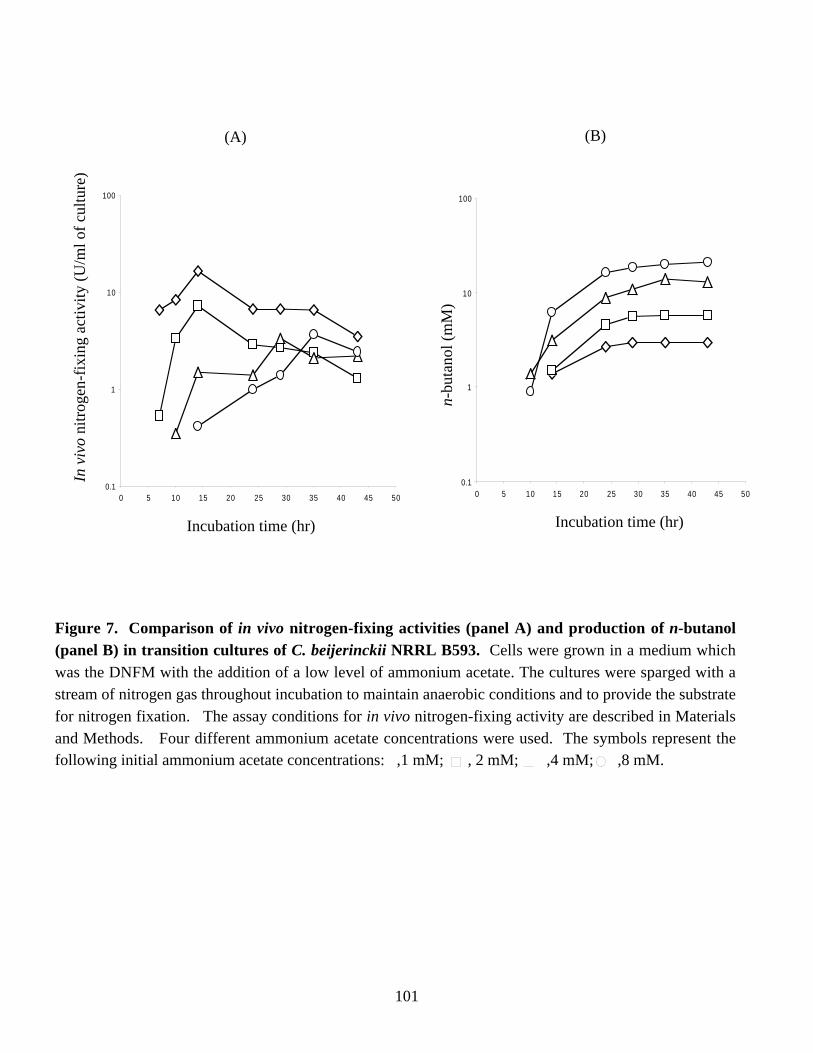
Figure 7. Comparison of in vivo nitrogen-fixing activities (panel A) andproduction of n- butanol (panel B) in transition cultures ofC. beijerinckii NRRL B593. 101
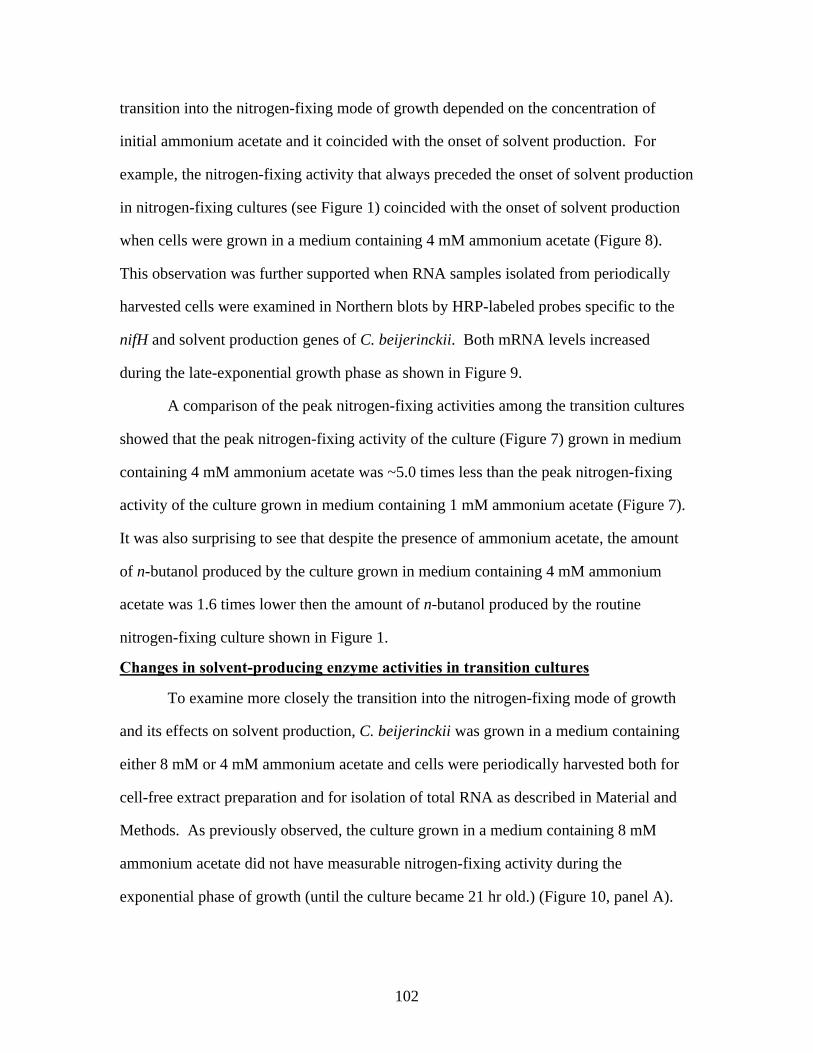
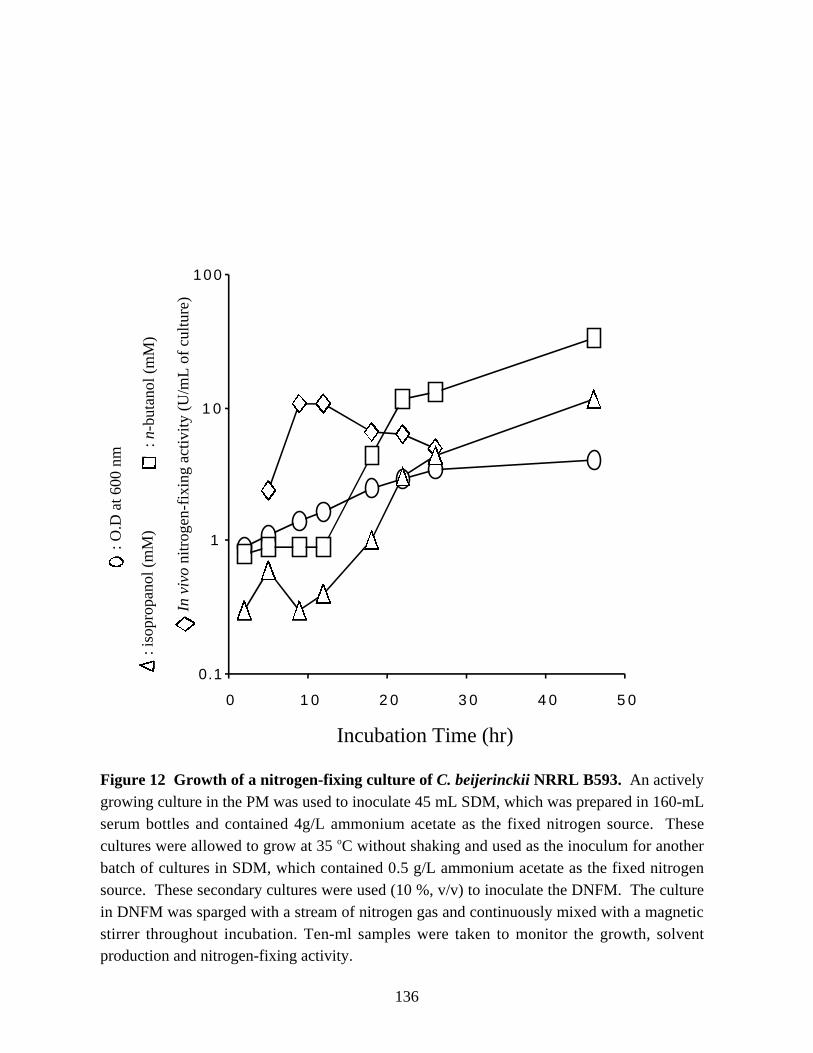
Figure 8. Growth, solvent production and nitrogen-fixing activity ofC. beijerinckii NRRL B593. 103
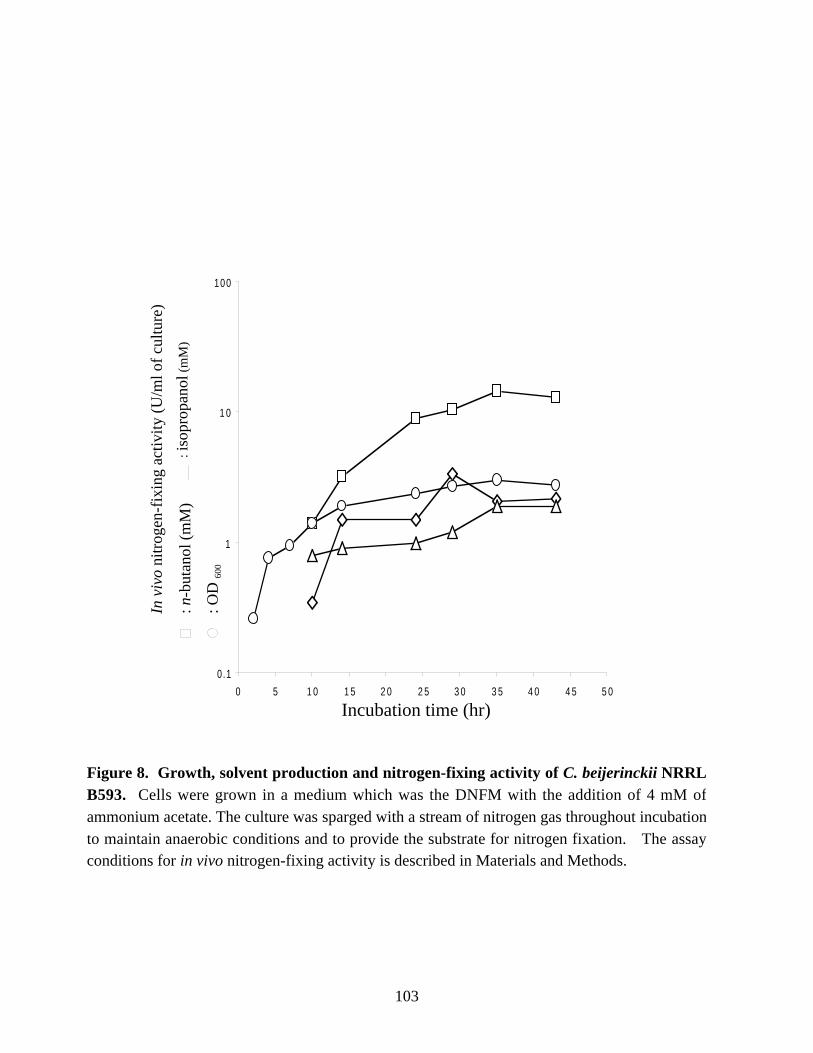
Figure 9. Northern blot analysis of the nifH and ald mRNAs ofC. beijerinckii NRRL B593. 104
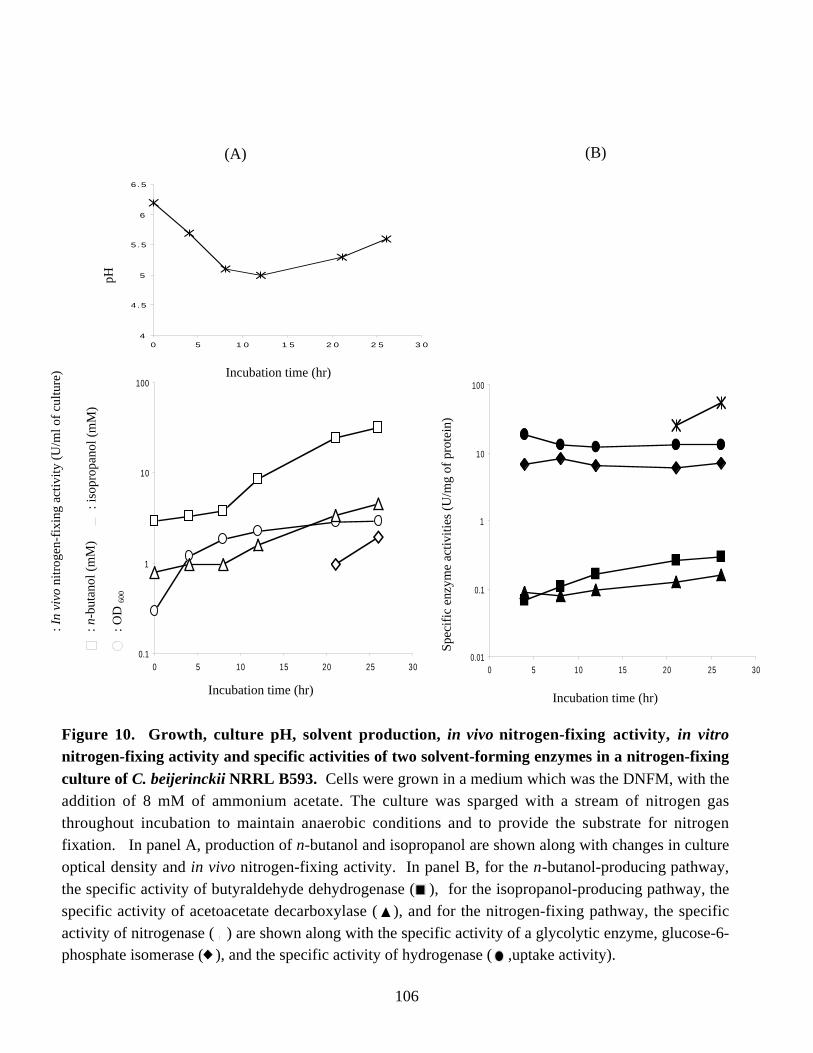
Figure 10. Growth, culture pH, solvent production, in vivo nitrogen-fixingactivity, in vitro nitrogen-fixing activity and specific activities oftwo solvent-forming enzymes in an 8-l nitrogen-fixing culture ofC. beijerinckii NRRL B593. 106
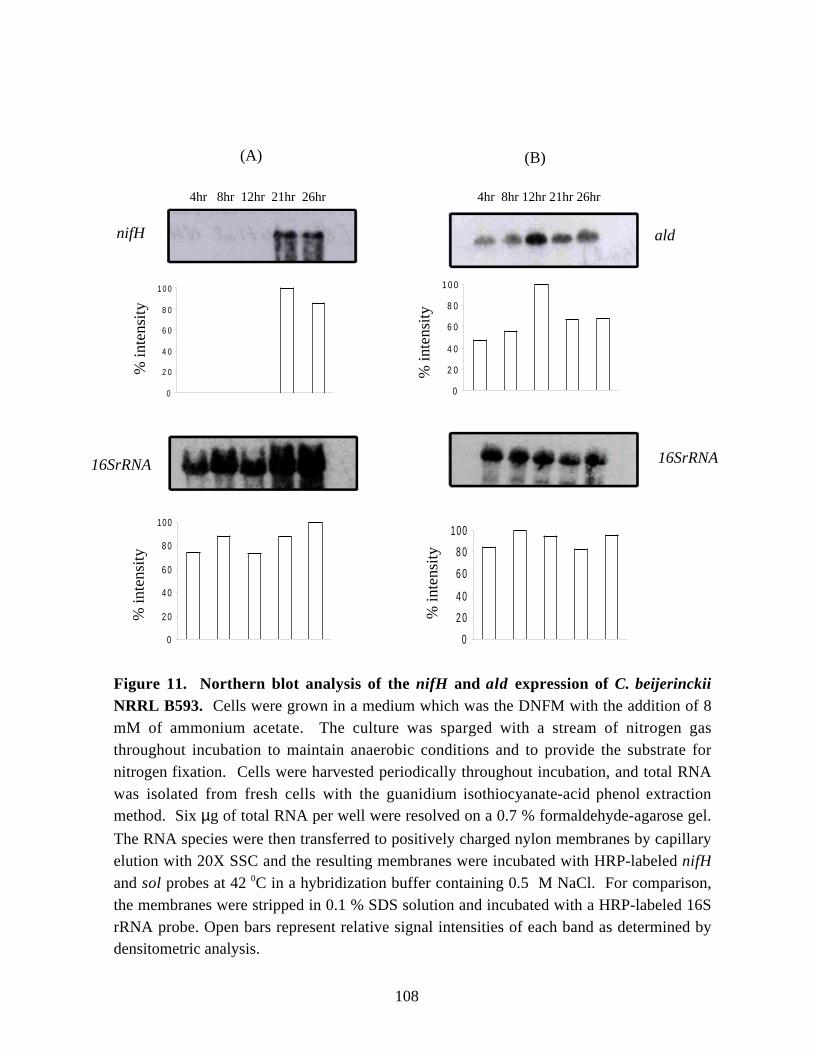
Figure 11. Northern blot analysis of the nifH and ald expression ofC. beijerinckii NRRL B593. 108
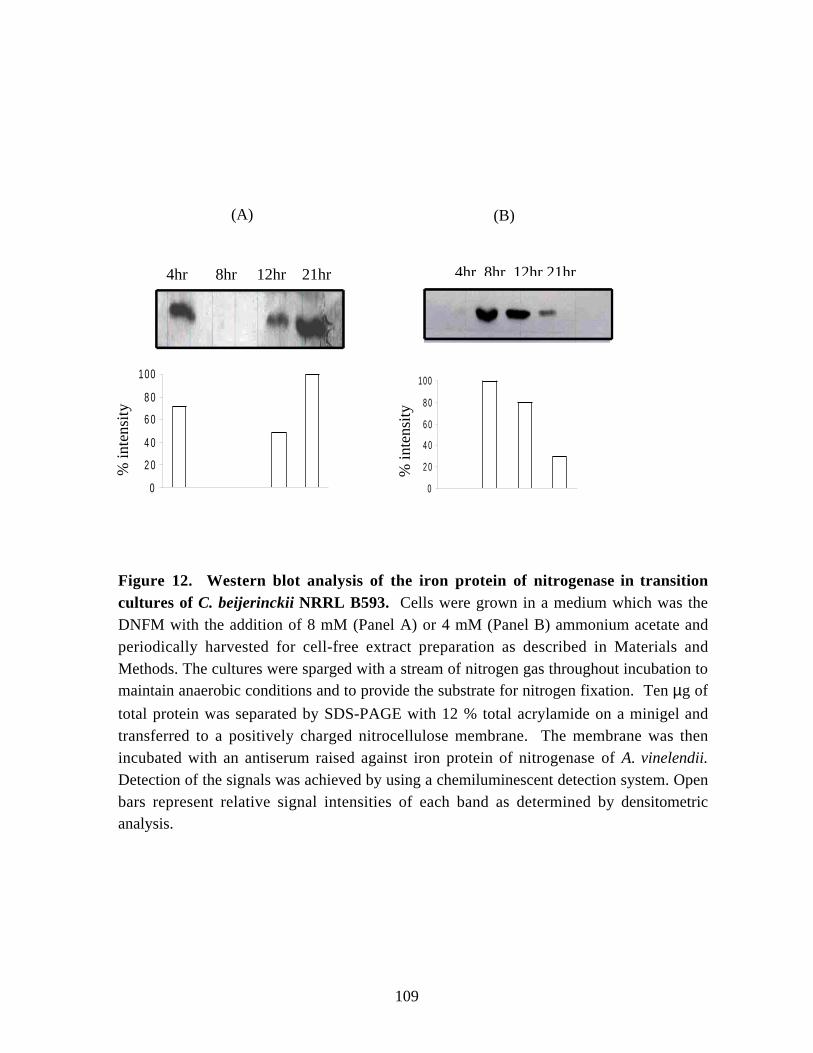
Figure 12. Western blot analysis of the iron protein of nitrogenase intransition cultures of C. beijerinckii NRRL B593. 109
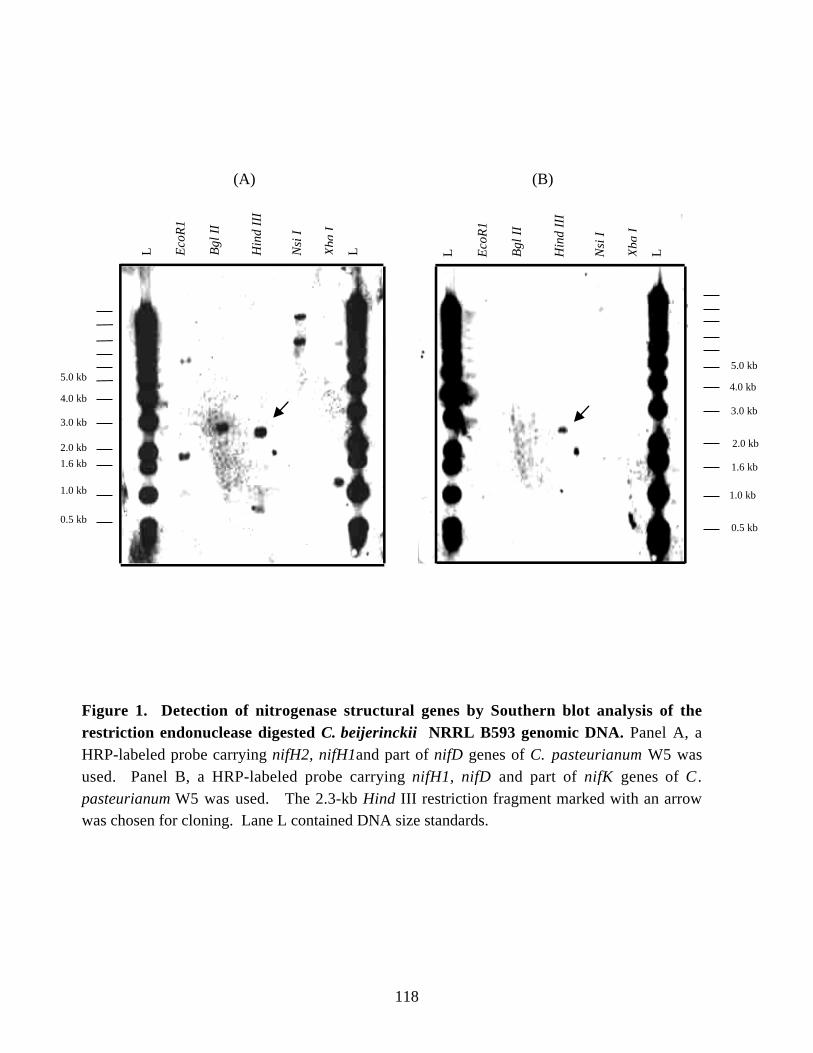
Chapter 5Figure 1. Detection of nitrogenase structural genes by Southern blot
analysis of the restriction endonuclease digested C. beijerinckii NRRL B593genomic DNA. 118
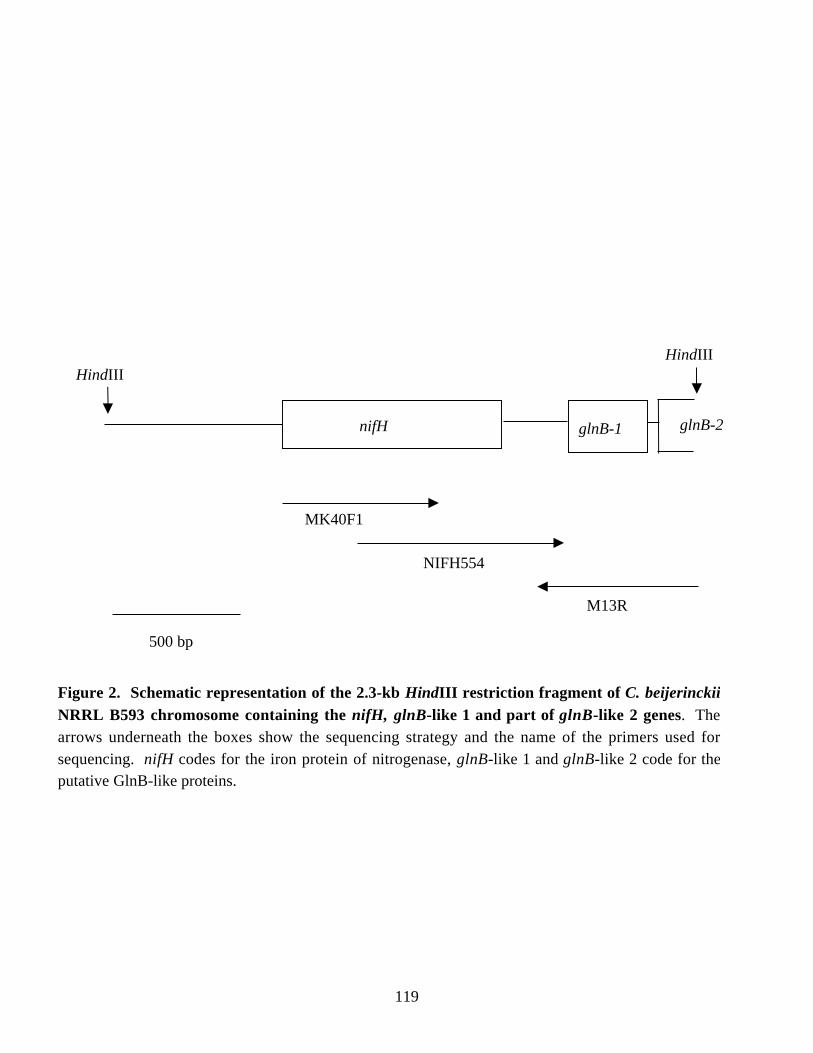
Figure 2. Schematic representation of the 2.3-kb HindIII restriction fragmentof C. beijerinckii NRRL B593 chromosome containing the nifH,
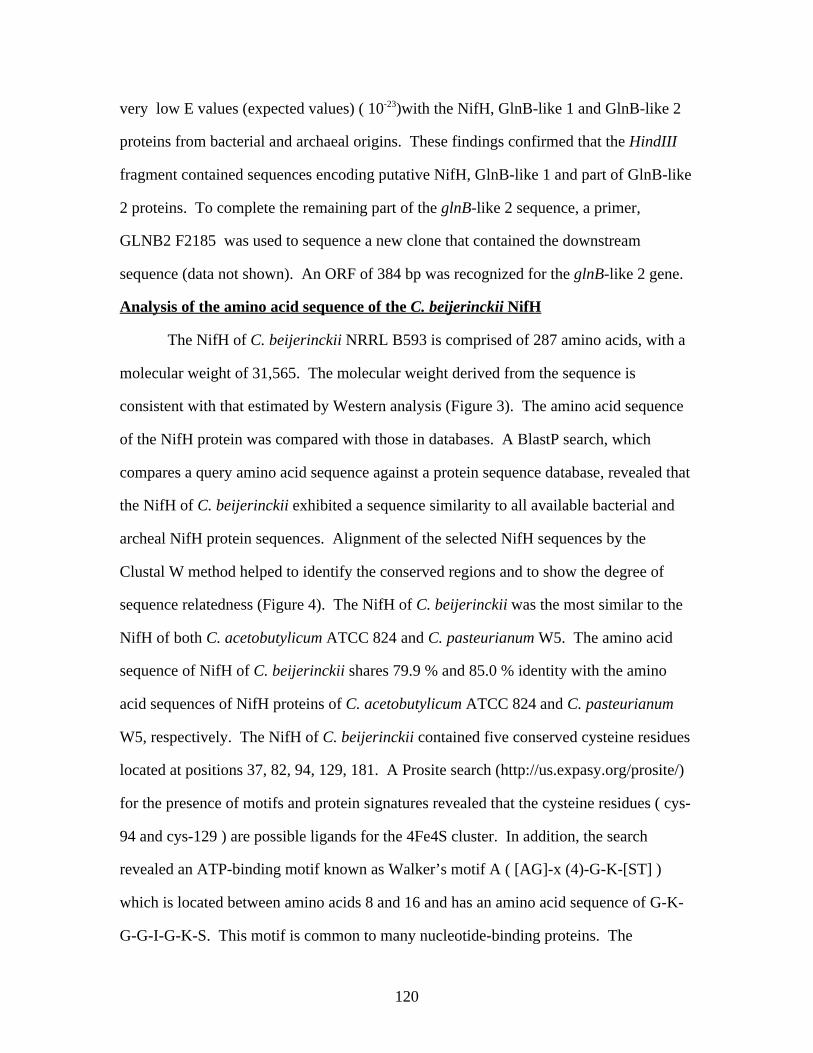
glnB-like 1 and part of glnB-like 2 genes. 119Figure 3. Estimation of the molecular weight of the iron protein of
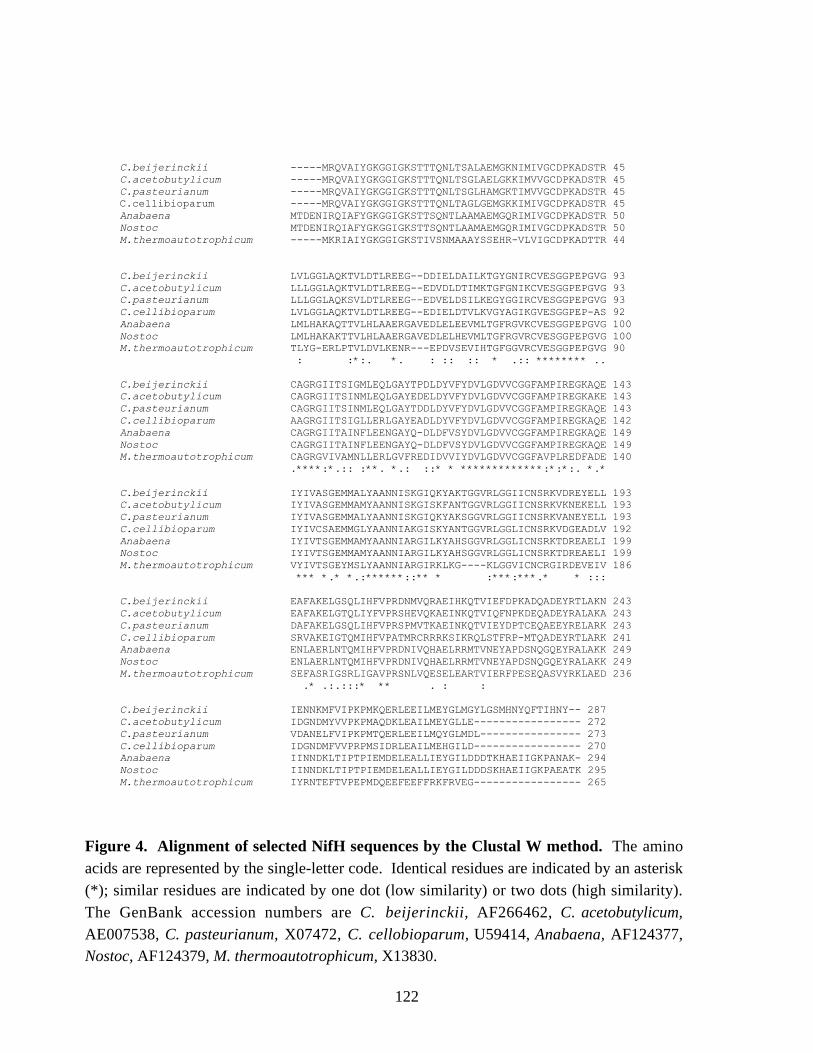
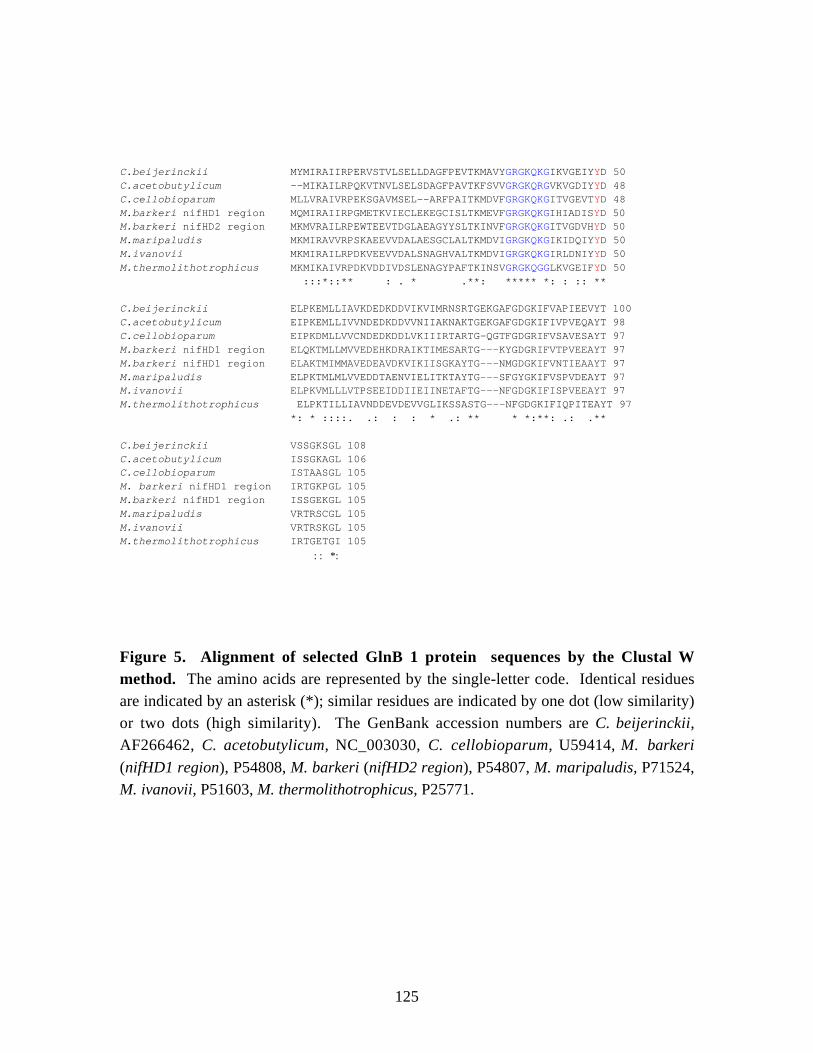
nitrogenase (NifH) of C. beijerinckii NRRL B593. 121Figure 4. Alignment of selected NifH sequences by the Clustal W method. 122Figure 5. Alignment of selected GlnB1 sequences by the Clustal W method. 125Figure 6. Alignment of selected GlnB2 sequences by the Clustal W method. 126
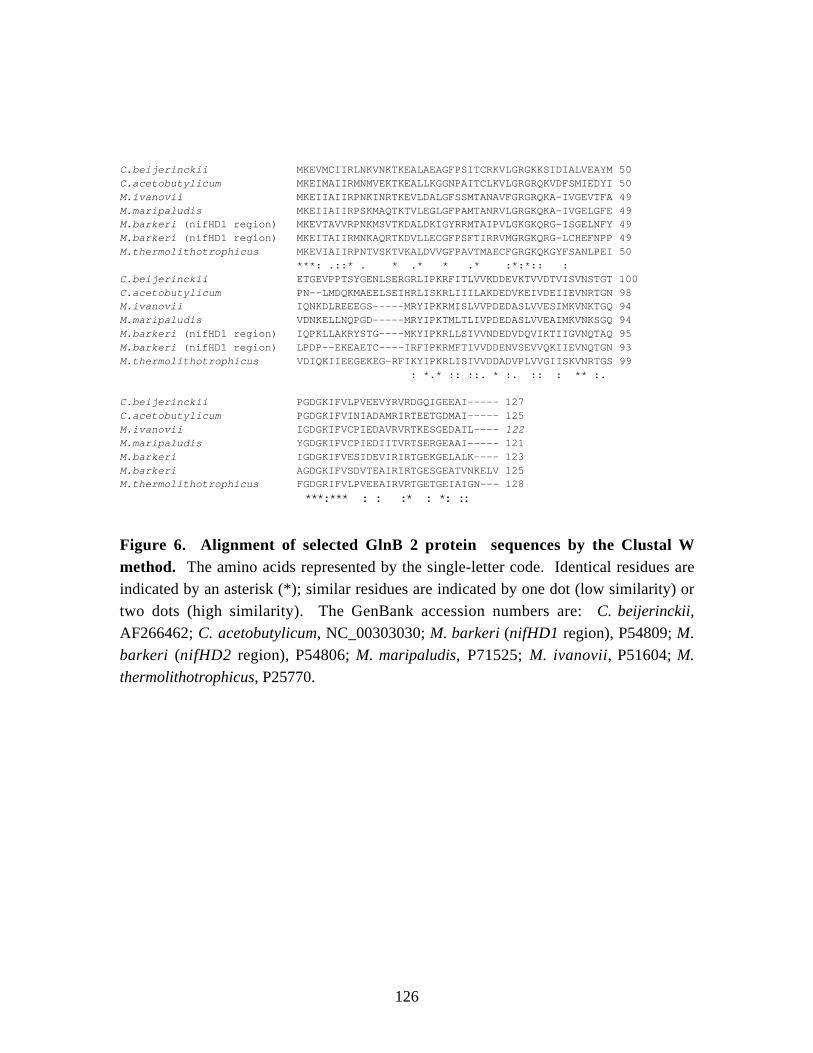
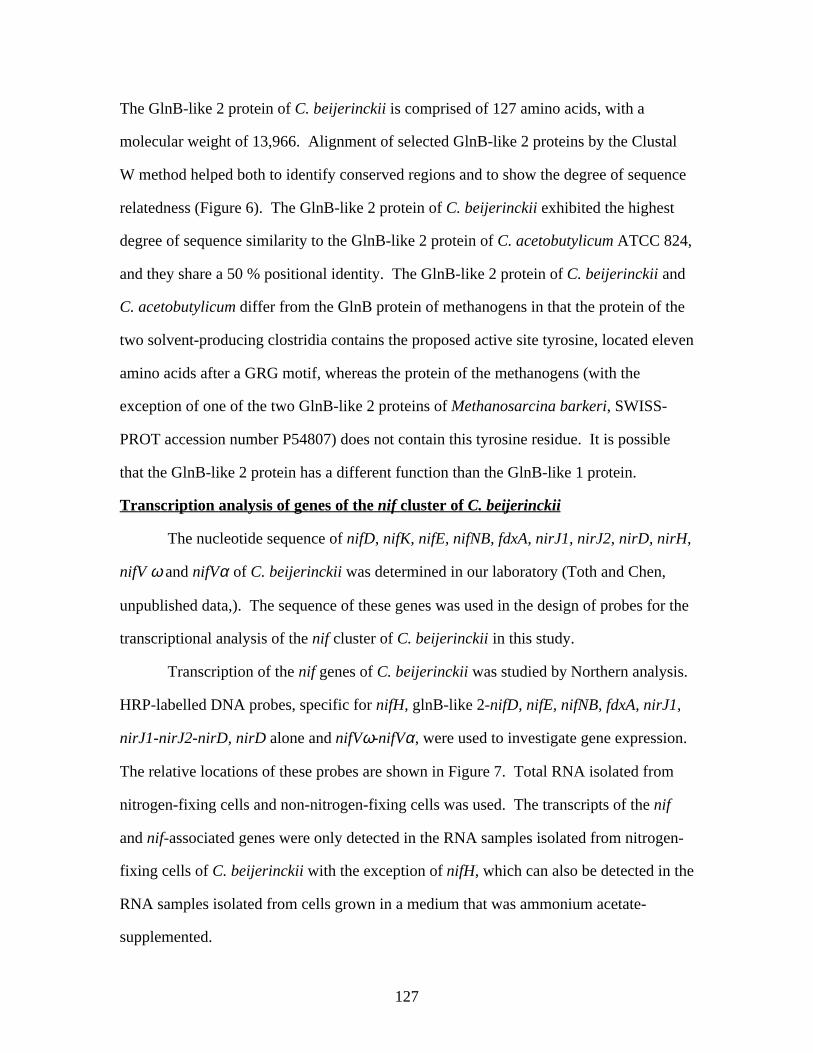
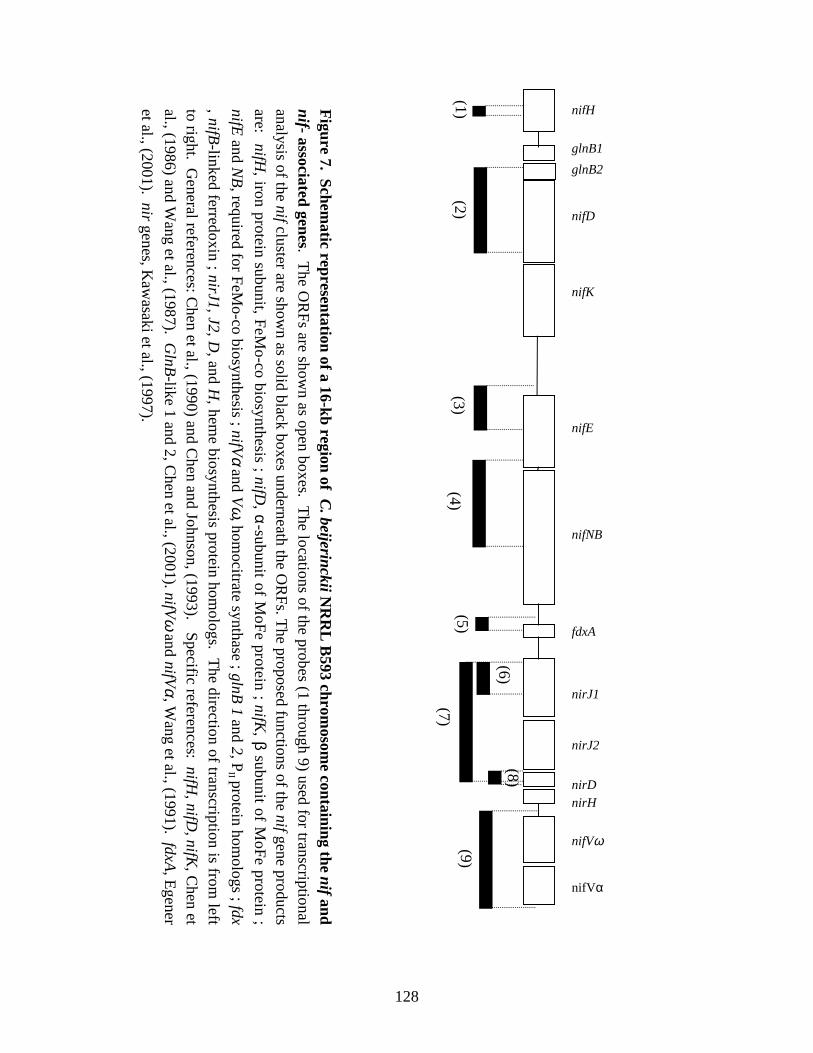
Figure 7. Schematic representation of a 16-kb region of C. beijerinckii NRRLB593 chromosome containing the nif and nif-associated genes. 128
Figure 8. Northern blot analysis of the nifH mRNA from nitrogen-fixingcells of C. beijerinckii NRRL B593. 131
Figure 9. Northern blot analysis of the nifV mRNA from nitrogen-fixingcells of C. beijerinckii NRRL B593. 132
Figure 10.Northern blot analysis of the nifNB mRNA from nitrogen-fixingcells of C. beijerinckii NRRL B593. 133
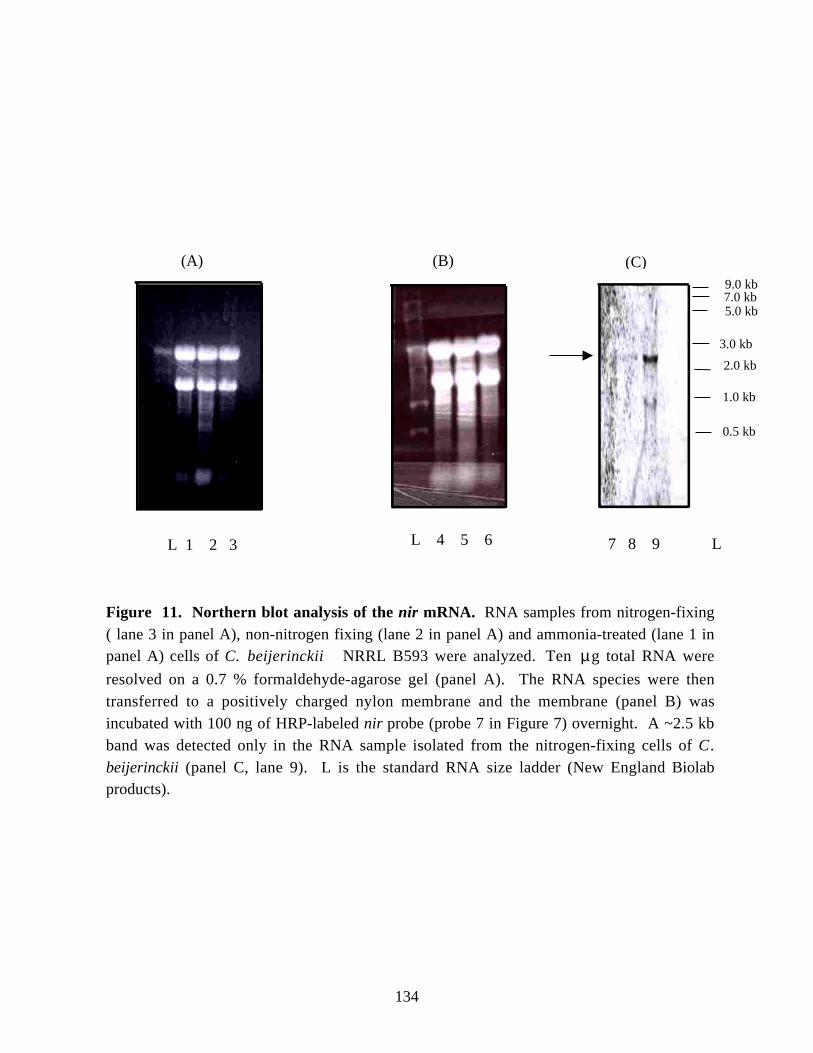
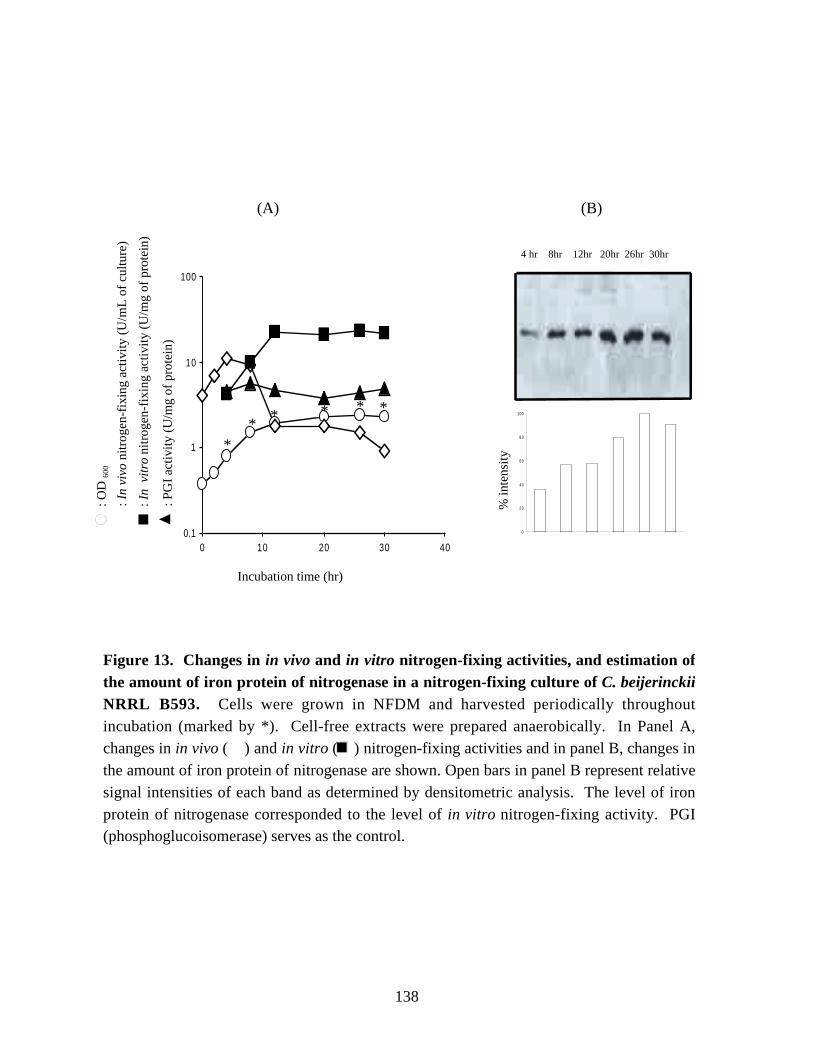
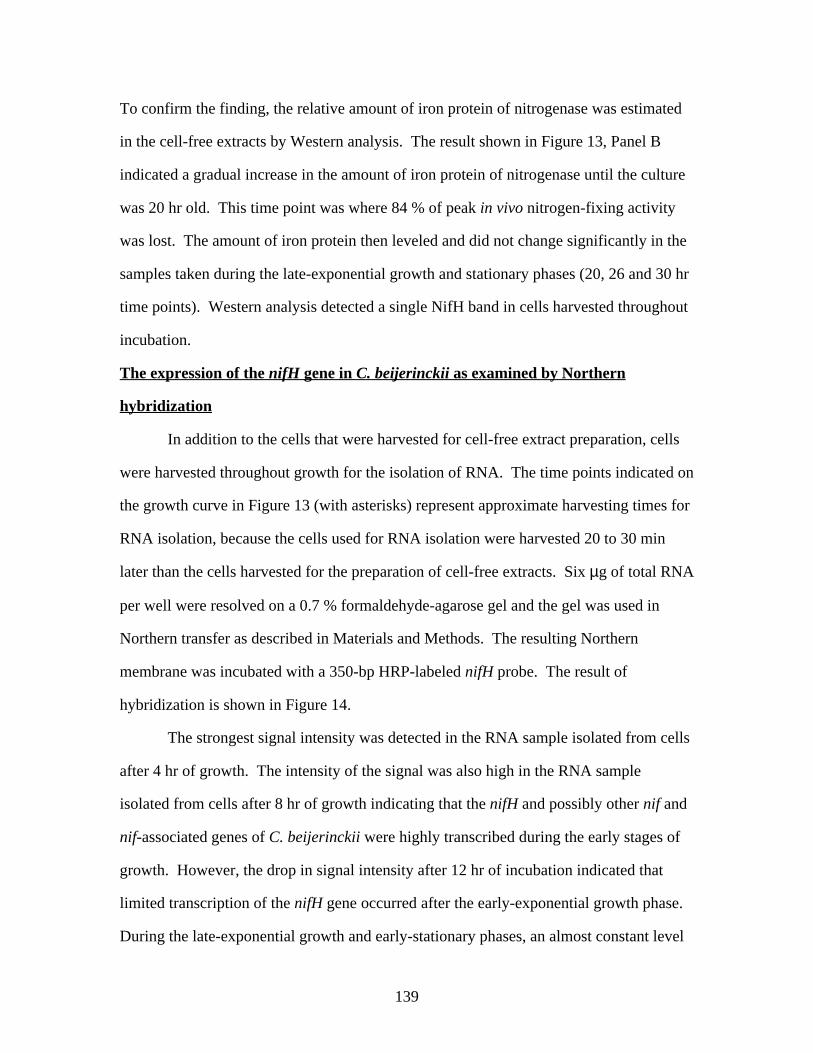
Figure 11. Northern blot analysis of the nir mRNA. 134Figure 12.Growth of a nitrogen-fixing culture of C. beijerinckii NRRL B593. 136Figure 13.Changes in in vivo and in vitro nitrogen-fixing activities, and
estimation of the amount of iron protein of nitrogenase in a
IX
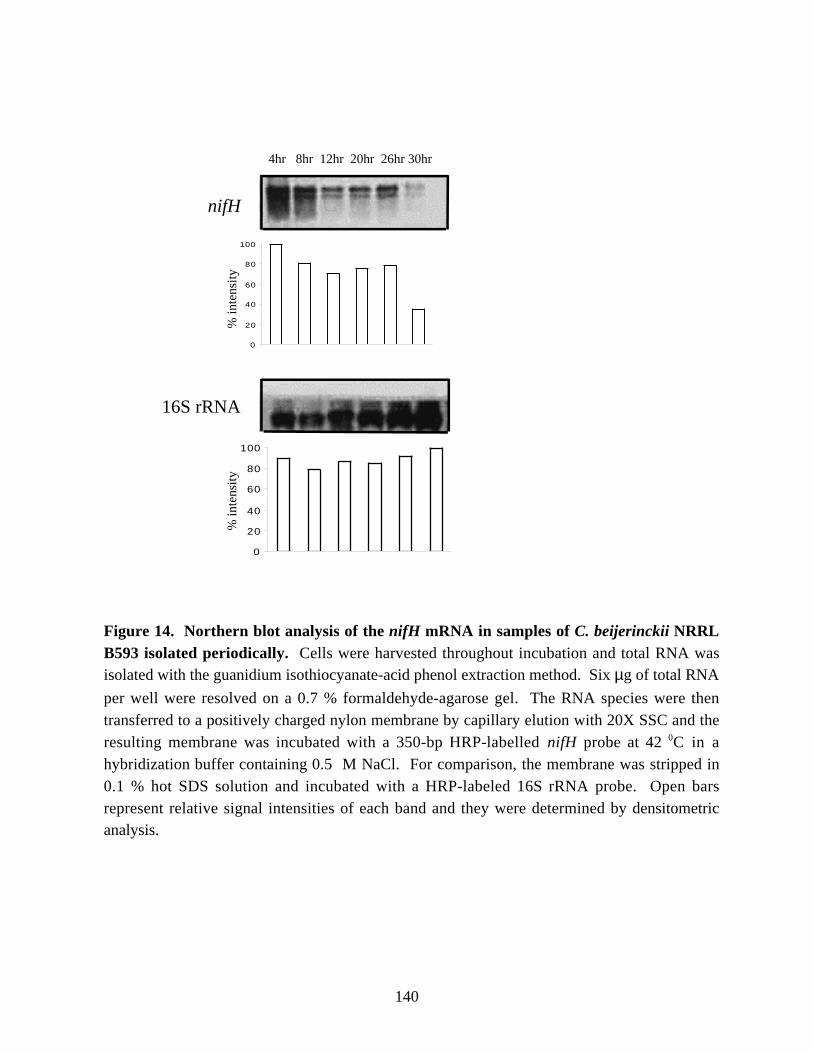
nitrogen-fixing culture of C. beijerinckii NRRL B593. 138Figure 14. Northern blot analysis of the nifH mRNA in samples
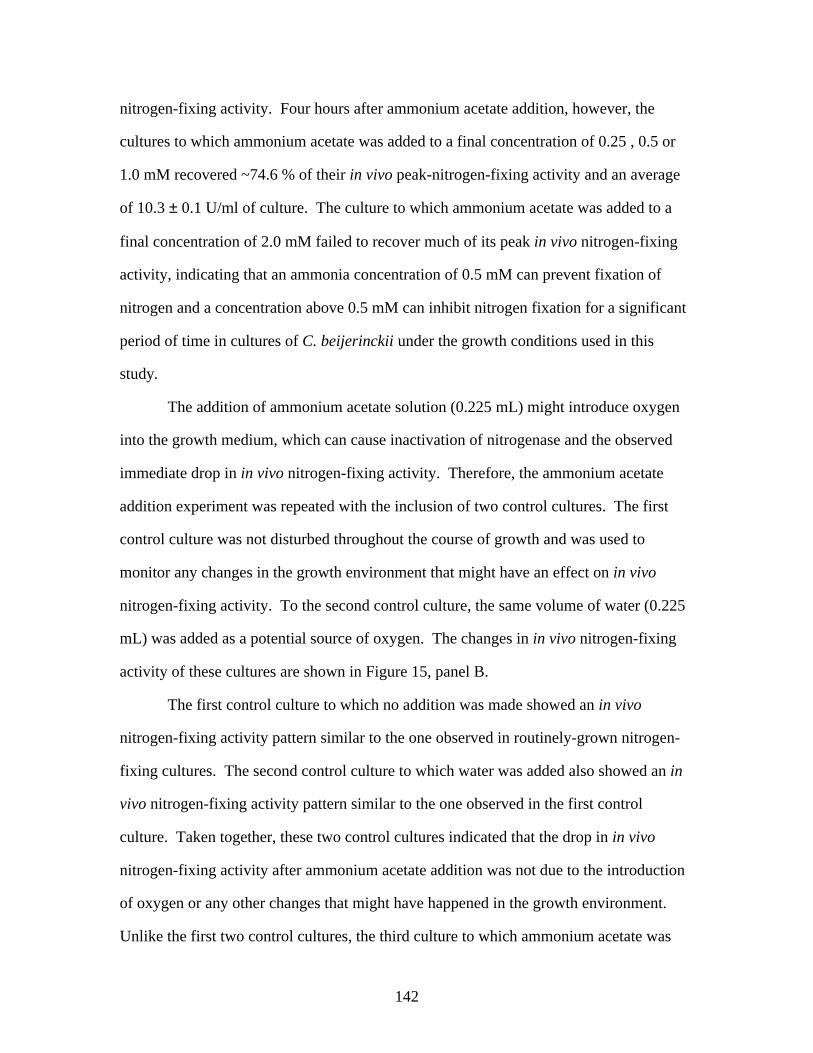
of C. beijerinckii NRRL B593 isolated periodically. 140Figure 15. The effect of ammonia addition on in vivo nitrogen-fixing
activity of C. beijerinckii NRRL B593. 144
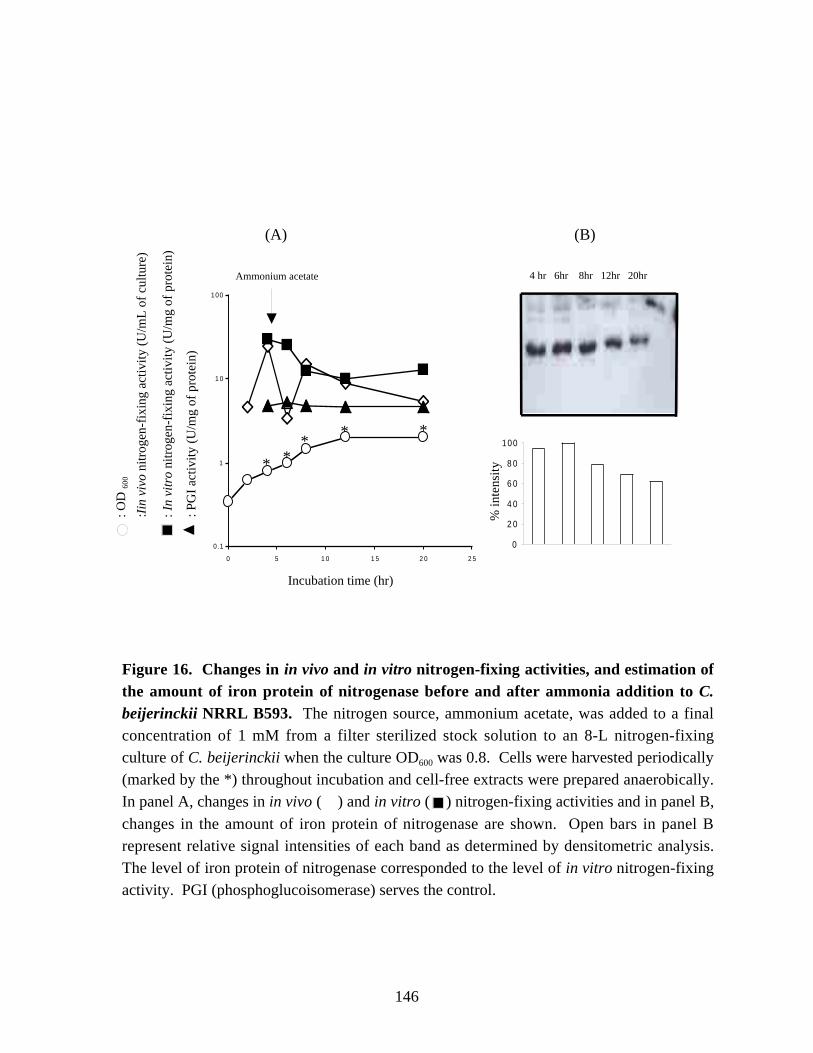
Figure 16. Changes in in vivo and in vitro nitrogen-fixing activities, andestimation of the amount of iron protein of nitrogenase before andafter ammonia addition in C. beijerinckii NRRL B593. 146
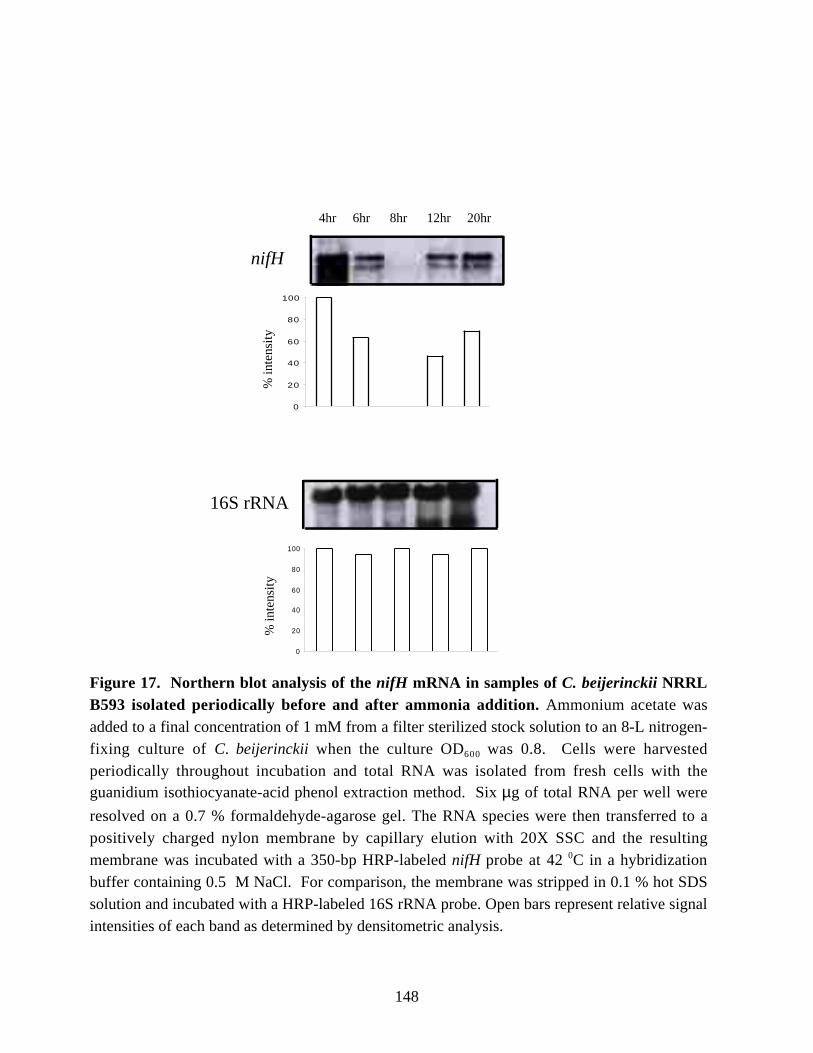
Figure 17. Northern blot analysis of the nifH mRNA in samplesof C. beijerinckii NRRL B593 isolated periodically before and after ammonia addition. 148
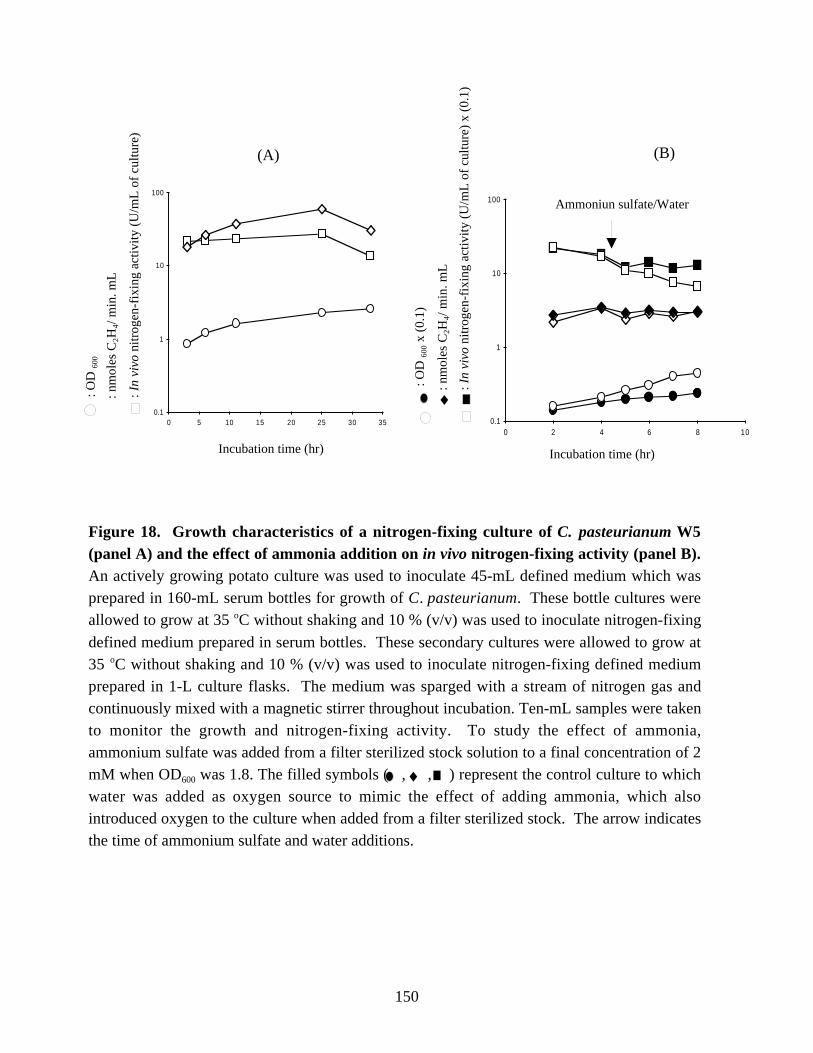
Figure 18. Growth characteristics of a nitrogen-fixing culture ofC. pasteurianum W5 and the effect of ammonia addition on in vivo
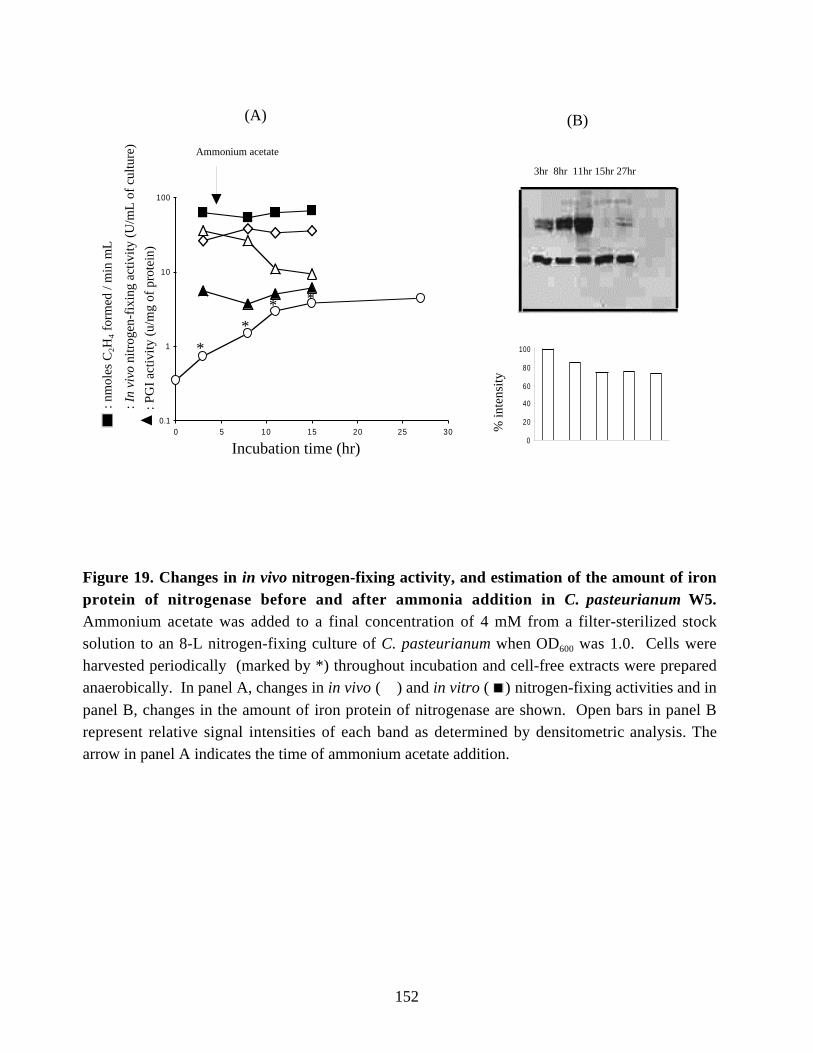
nitrogen-fixing activity. 150Figure 19. Changes in in vivo and in vitro nitrogen-fixing activities, and
estimation of the amount of iron protein of nitrogenase before and
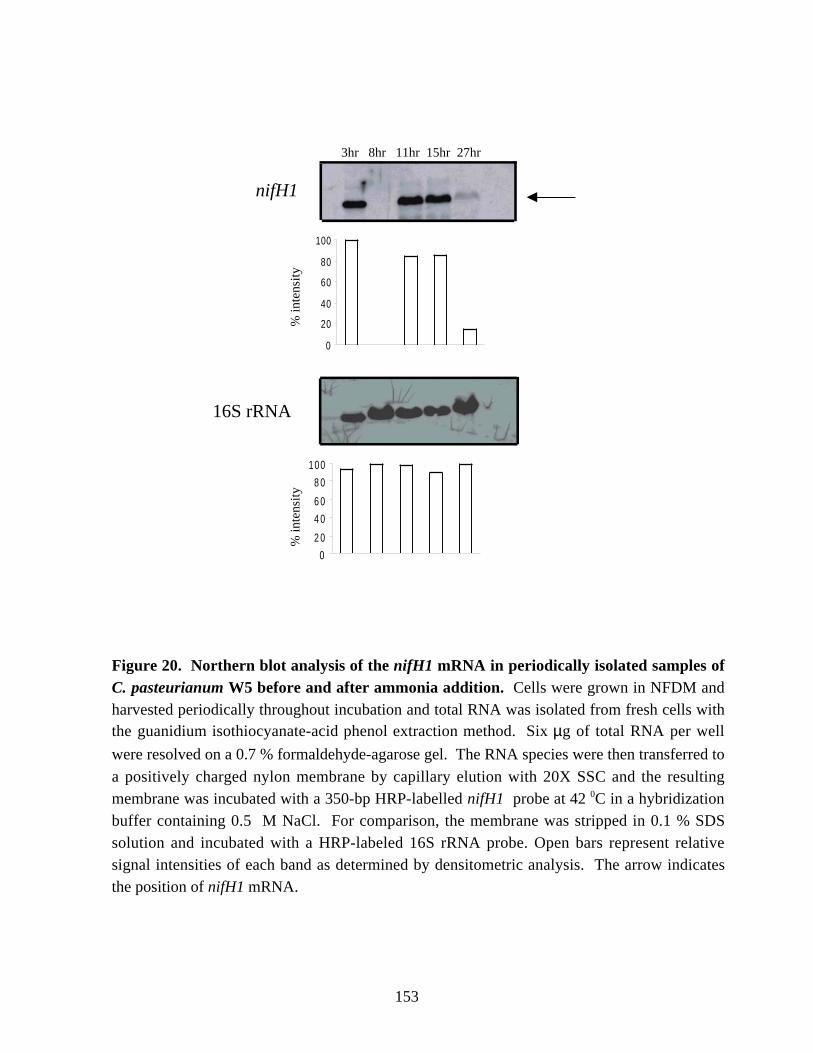
after ammonia addition in C. pasteurianum W5. 152Figure 20. Northern blot analysis of the nifH1 mRNA in periodically isolated samples
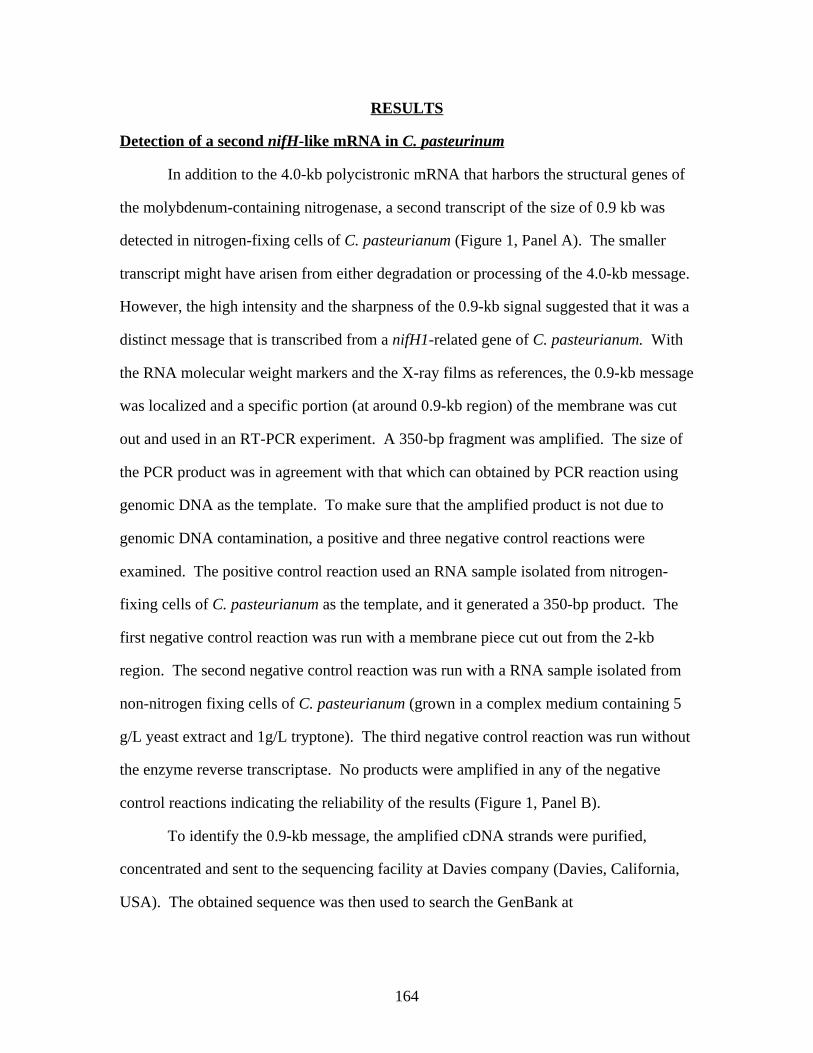
of C. pasteurianum W5 before and after ammonia addition. 153Chapter 6Figure 1. Detection and RT-PCR amplification of the 0.9 kb nifH-like
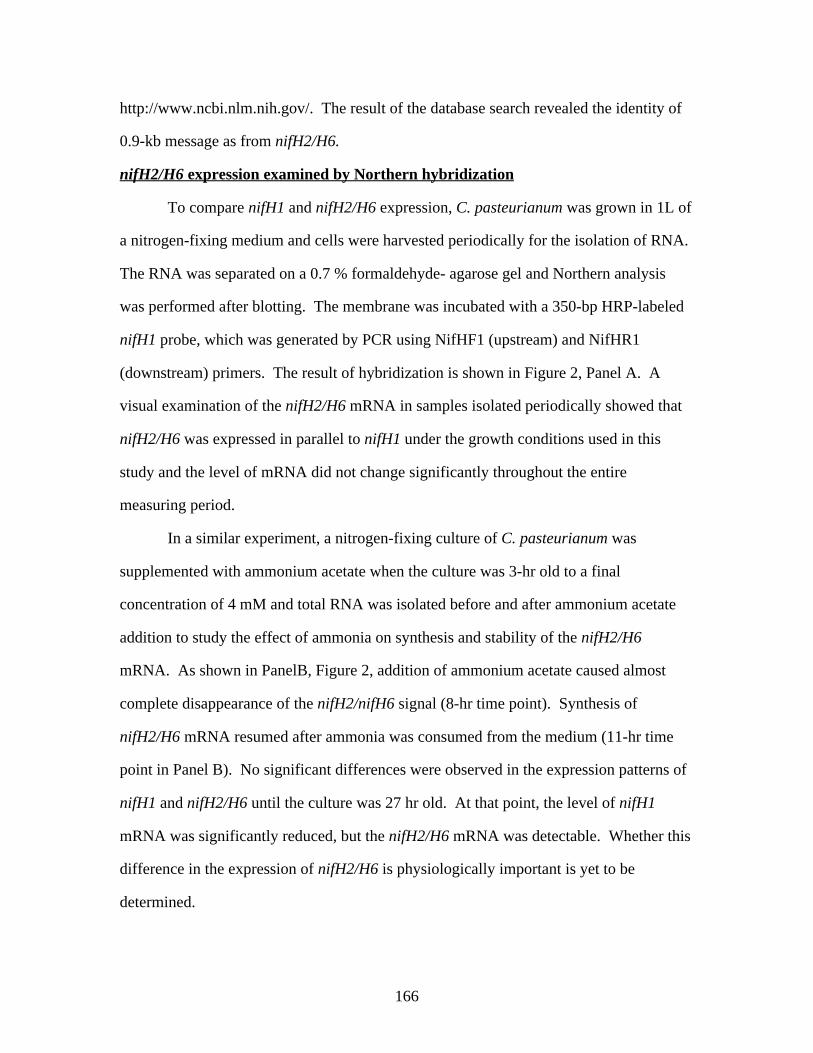
mRNA of C. pasteurianum. 165Figure 2. Northern blot analysis of the nifH1 and nifH2/H6 mRNAs in periodical
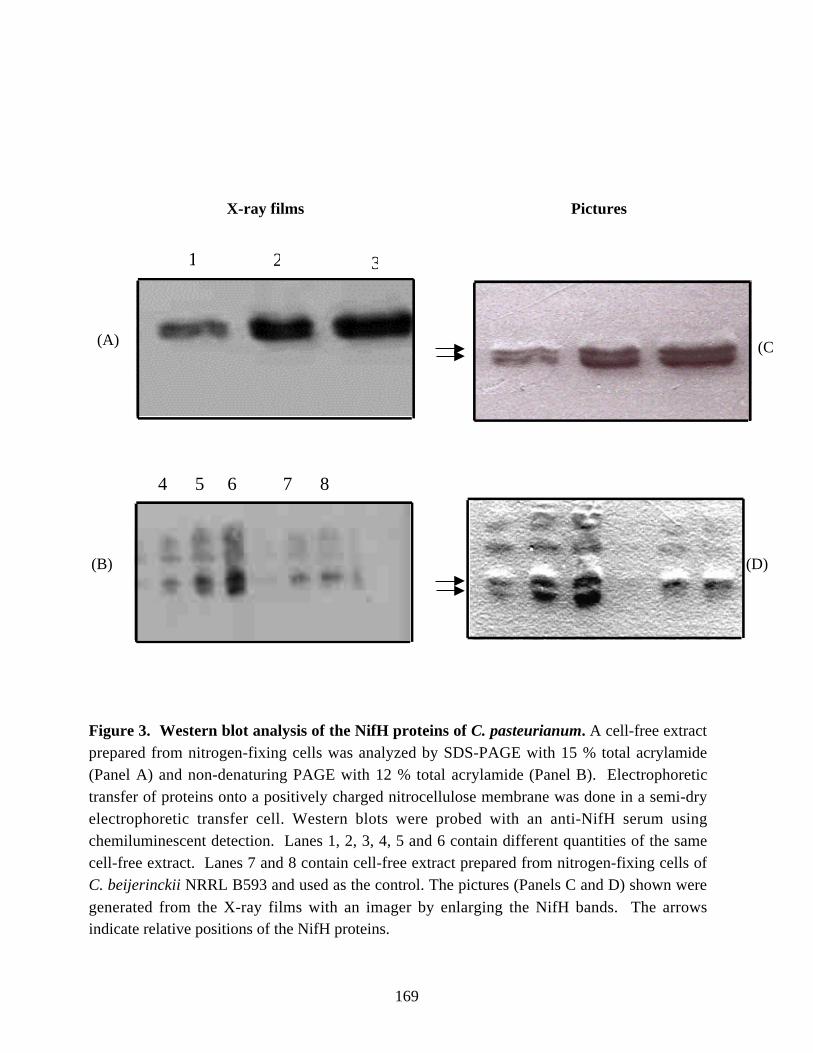
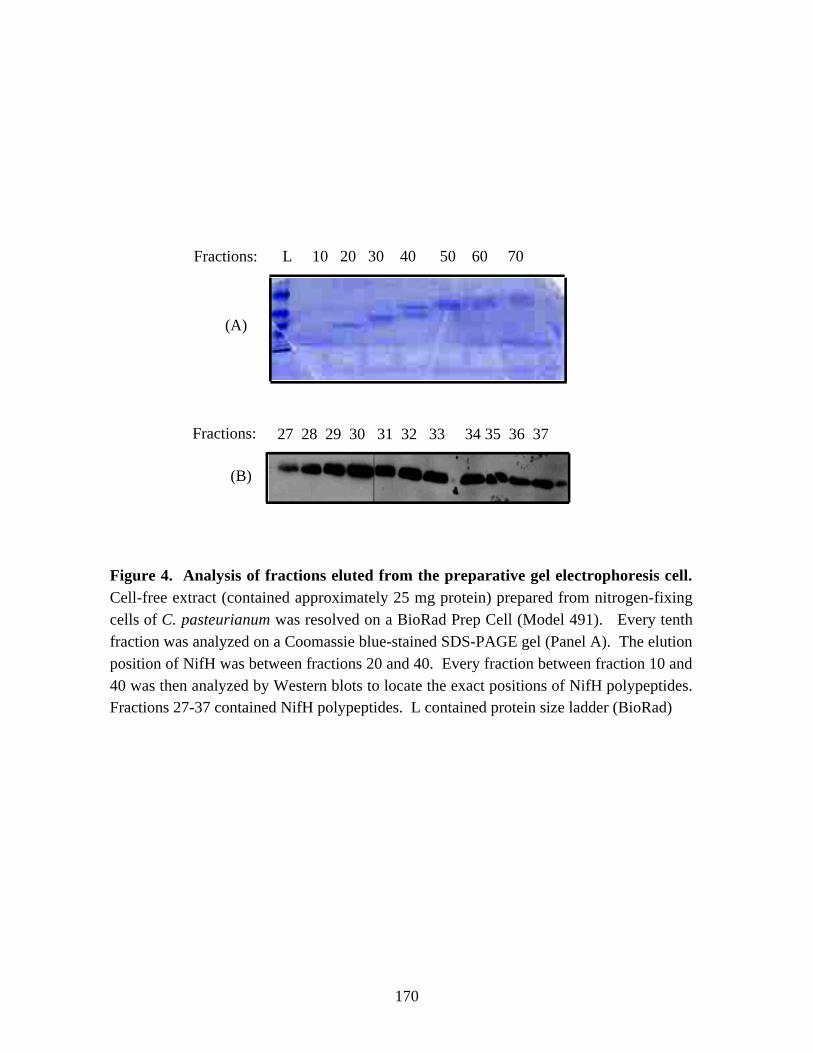
samples of C. pasteurianum W5. 167Figure 3. Western blot analysis of the NifH proteins of C. pasteurianum. 169Figure 4. Analysis of fractions eluted from the preparative gel electrophoresis cell. 170Figure 5. Western blot analysis of NifH polypeptides of C. pasteurinum after
separation by preparative gel electrophoresis sample fractionated byelectrophoresis. 172
Figure 6. MALDI-TOF mass spectra (400 to 2500 Da) of fractions 28, 31 and37 from the preparative gel electrophoresis. 175
Figure 7. MALDI-TOF mass spectra (400 to 2500 Da) of the control experiments. 176
X
LIST OF TABLESChapter 2Table 1. Primers used in sequencing of the 2.3 kb cloned DNA fragment
carrying the nifH, glnB-like1 and part of glnB-like 2 genes ofC. beijerinckii NRRL B593. 48
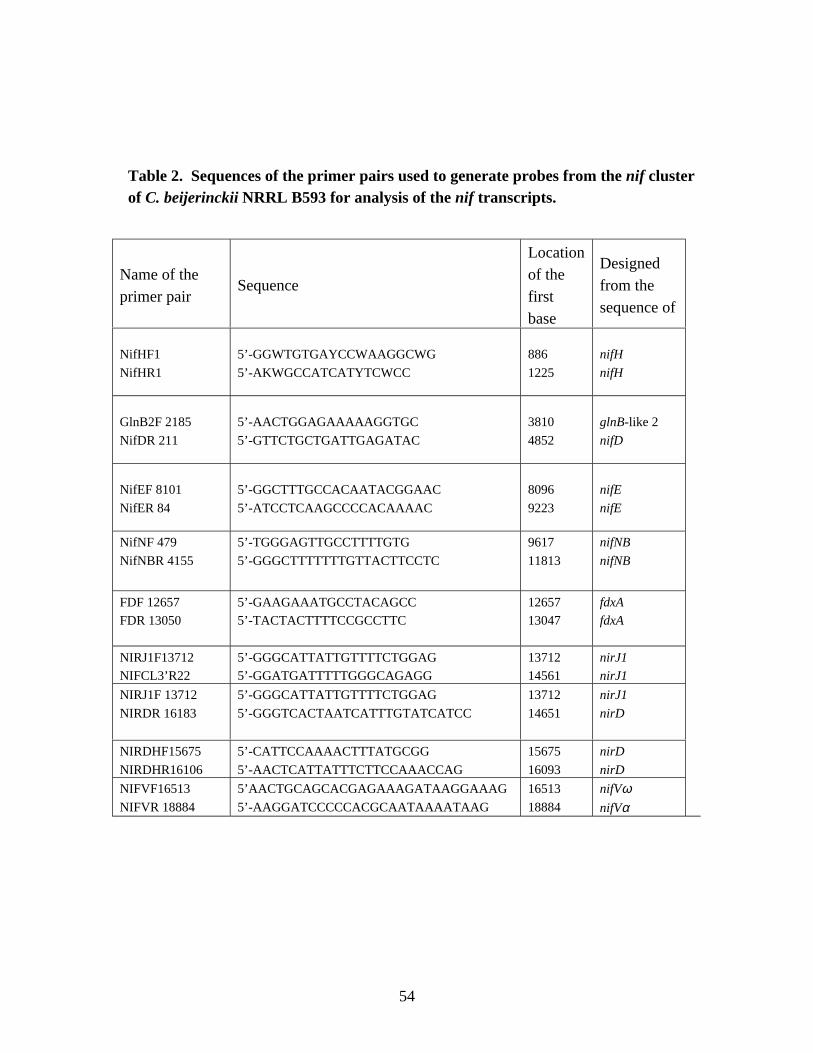
Table 2. Sequences of the primer pairs used to generate probes from thenif cluster of C. beijerinckii NRRL B593 for analysis of the nif
transcripts. 54Table 3. Sequences of the primer pairs used to generate probes from the
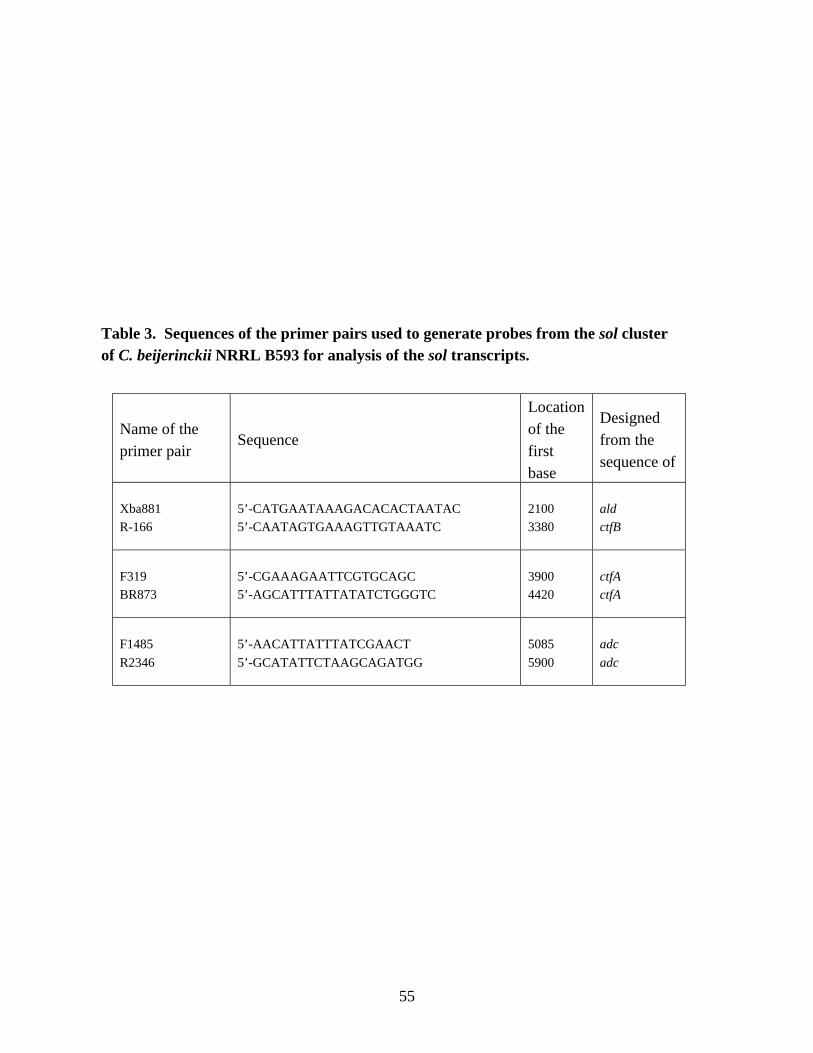
sol cluster of C. beijerinckii NRRL B593 for analysis of the sol
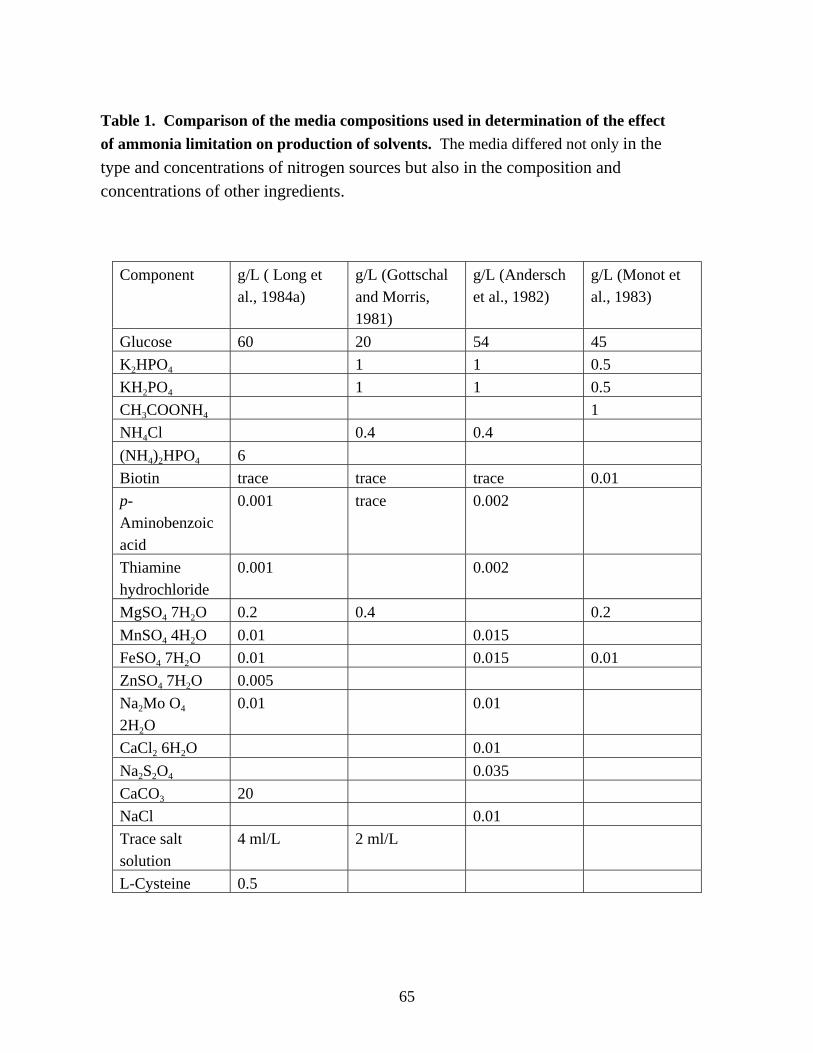
transcripts. 55Chapter 3Table 1. Comparison of the media compositions used in determination
of the effect of ammonia limitation on production of solvents. 65
Table 2. Growth of C. beijerinckii NRRL B593 in a DBM . 67Table 3. The effect of complex nutrient supplement on growth and solvent
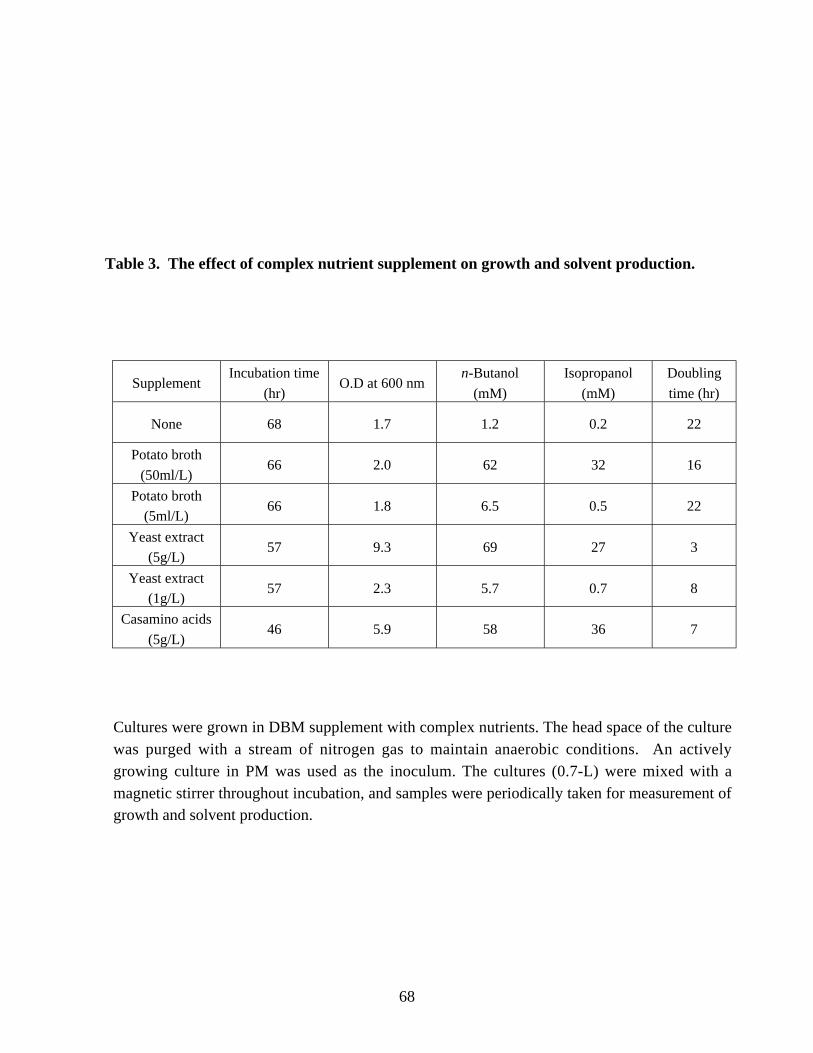
production. 68Table 4. Amino acid composition of commercial yeast extract and defined
combination medium. 69Chapter 5Table 1. The sizes of the ORFs in the nif cluster of C. beijerinckii
NRRL B593. 130
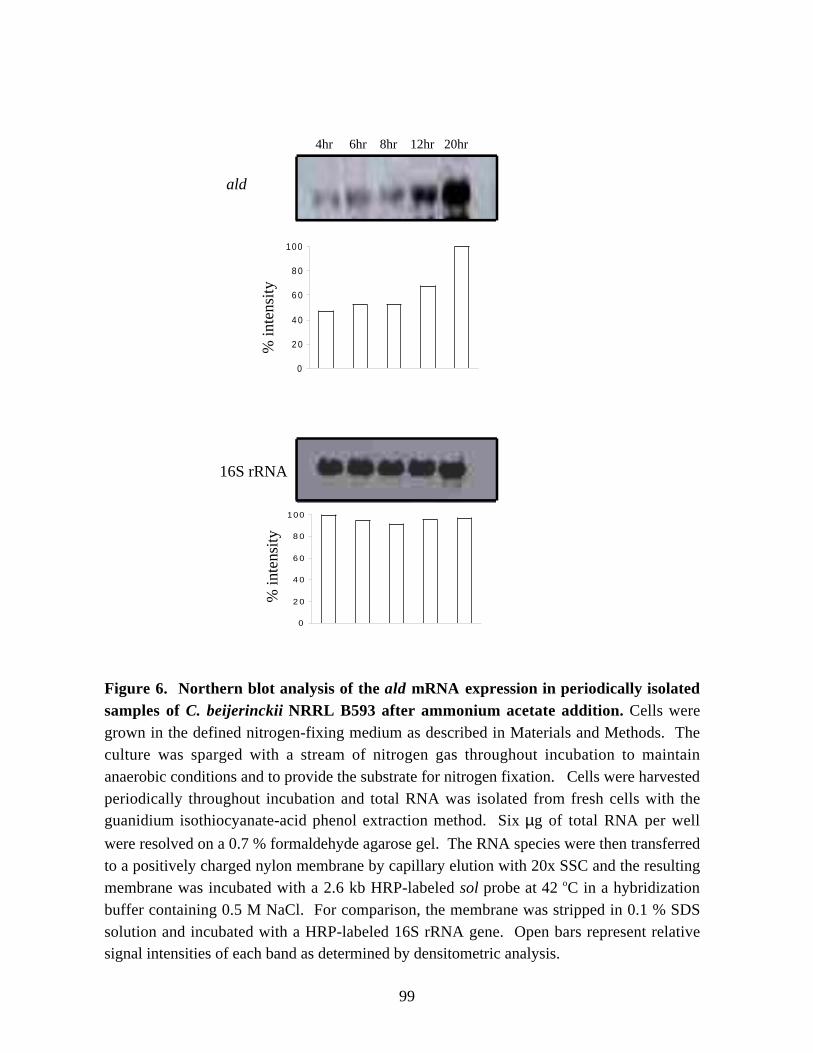
XIXII
1
CHAPTER 1
LITERATURE REVIEW
Part I.
Solvent fermentation by the clostridia
Introduction
Production of commercially important solvents (acetone and n-butanol) by
clostridia was a major industry during the first half of the 20th century, ranking second in
importance only to ethanol fermentation (Presscot and Dunn, 1959; Gibbs, 1983; Jones
and Woods, 1986). The interest in large-scale production of solvents by fermentation has
never ceased because of the benefits of using renewable biomass as the raw material,
which is strategically important for petroleum-importing countries. However, the
synthetic processes replaced fermentation for commercial production in the early 1960s.
Since then, solvent fermentation has not competed economically with the chemical
processes. However, solvent fermentation is considered viable in niche markets,
especially when the merits of resource conservation are also considered. In addition, the
acid- and solvent-producing pathways of the solvent-producing clostridia serve as a good
experimental system for studying the regulation of the enzymes and their genes involved
in branched metabolic pathways. These studies have revealed possible areas for the
improvement of solvent fermentation.
During the last two decades, considerable international effort has been placed on
understanding solvent fermentation, as illustrated by the workshops on the biochemistry
and genetics of solvent-producing clostridia held in Salisbury, UK (1990), Blacksburg,
VA, USA (1992), Evanston, IL, USA (1994), Ulm, Germany (1996), Toulouse, France
(1998), Urbana-Champaign, IL, USA (2000) and Rostock, Germany (2002). New
strategies for the regulation of expression of solvent-production genes and the flow of
metabolites have been discovered. Sequences of almost all the genes of solvent- and
2
acid-forming enzymes have been determined (Dürre, 1998). Physical maps of the
chromosomes of C. acetobutylicum ATCC 824, C. beijerinckii NCIMB 8052 and C.
saccharobutylicum NCP 262 have been constructed (Wilkinson and Young, 1995;
Cornillot et al., 1997a; Keis et al., 2001a). Taxonomic studies helped to correct
identification of the laboratory strains that were mislabeled as C. acetobutylicum
(Johnson et al., 1997; Keis et al., 2001b). Many of the solvent-forming enzymes from
either C. acetobutylicum or C. beijerinckii or both have been purified (Chen, 1993; Dürre,
1998). Most recently, the genome sequencing project of C. acetobutylicum ATCC 824
has been completed, and the genome sequence is now available for functional analysis
(Noelling et al., 2001).
History of acetone-butanol fermentation
At the beginning of the 20th century, a shortage of natural rubber caused a
dramatic increase in rubber prices, which ultimately led to the development of synthetic
rubber (Gabriel et al., 1930). At the time, n-butanol was considered the best feedstock
chemical for the synthesis of butadiene, the starting material for synthetic rubber
(Killeffer, 1927). The projected need for n-butanol initiated intensive research on
isolation of fermentative organisms, which could produce n-butanol. In 1911, Fernbach
isolated an acetone butanol-producing bacterium. However, Fernbach’s organism had
limited substrate range and low solvent yield (Jones and Woods, 1986). Between 1912
and 1914, Weizmann, working independently, isolated an organism that could ferment a
variety of starchy substances and produce much better yields of n-butanol and acetone
(Gabriel, 1928). Initially this organism was named “Bacillus granulobacter
pectinovorum” and given the nickname BY (B for bacteria or bacillus; Y for Weizmann),
but it was later renamed as Clostridium acetobutylicum by McCoy and his coworkers
(McCoy et al., 1926).
3
During World War I, the demand for acetone increased because acetone was used
as the solvent for nitrocellulose, which was used to manufacture smokeless gunpowder
for the British navy (Jones and Woods, 1986). Bacterial fermentation opened a way of
producing large quantities of acetone for England, which could not import acetone at the
time. After the war, there was no further demand for acetone. However, with the
introduction of new methods for automobile manufacturing, more and more cars were
produced, and a faster painting procedure was needed. n-Butanol was in demand,
because it was used to synthesize butyl acetate, which was a suitable solvent for lacquer
as automobile paints (Dürre, 1998). In 1927, solvent fermentation reached its peak
capacity and, in Peoria, IL, USA, 96 production fermentors with a volume of 50,000
gallons each were run (Gabriel, 1928). Solvent fermentation continued until the 1950s.
However, severe competition with the growing petrochemical industry and rising prices
of substrates caused a steep decline in solvent fermentation. All acetone and n-butanol are
currently produced from petroleum. However, the use of biomass as the raw material for
production of n-butanol and acetone is still appealing. The possibility of using cheaper
resources, such as cellulose, whey or corn byproducts, as the alternative substrates for
solvent fermentation over more expensive substrates, such as maize and molasses, and
the success in applying molecular biological techniques to acetone-butanol fermentation
revived interest in research on solvent production by fermentation.
Microorganisms
On the basis of DNA–DNA reassociation, industrial solvent-producing clostridia
have been assigned to four species: C. acetobutylicum, C. beijerinckii, C.
saccharoperbutylacetonicum and C. saccharobutylicum (Johnson et al., 1997, Keis et al.,
2001b). Recently, Keis et al. (2001b) studied these four species for phenotypical
characterization and identified several traits, such as rifampicin sensitivity, gelatin
hydrolyis and pectin utilization. Riboflavin production from milk is also a useful trait for
4
differentiation of C. acetobutylicum from other species (Johnson et al., 1997). C.
beijerinckii contains strains that can produce isopropanol in addition to n-butanol
(George et al., 1983; Chen and Hiu, 1986). It can also produce solvents from sugars
without requiring precise control of the culture pH (George and Chen, 1983). These
properties are not found in C. acetobutylicum.
Biochemistry and physiology
A. Carbon flow
In batch cultures of solvent-producing clostridia, two distinct growth phases are
present (Figure 1). During the early growth phase (acid-producing phase), mainly
acetate, butyrate, hydrogen and carbon dioxide are produced as metabolic end-products
which result in a decrease in the pH of the culture medium. As the culture continues to
grow, a shift in the metabolism occurs and n-butanol, acetone/isopropanol, and ethanol,
along with H2 and CO2, are produced (solvent-producing phase). The pH of the culture
medium increases during solvent production due to partial reutilization of previously
produced acid end-products.
Besides the glycolytic reactions, the acid- and solvent-producing pathways share a
sequence of reactions between pyruvate and butyryl-CoA. The branch points arise from
three key metabolic intermediates: acetyl-CoA, acetoacetyl-CoA and butyryl-CoA.
During the acid-producing phase, acetate and butyrate are produced from acetyl-CoA and
butyryl-CoA, respectively, by means of two analogous steps, which result in the
generation of one ATP molecule per each reaction. With the exception of
phosphotransacetylase (only partially purified from C. beijerinckii, Thompson, 1989), the
acid-forming enzymes (phosphotransbutyrylase, acetate kinase and butyrate kinase) were
purified and characterized from either C. acetobutylicum or C. beijerinckii or both
(Winzer et al., 1987; Hartmanis, M. G. 1987; Weisenborn et al., 1989; Thompson and
Chen, 1990). Some interesting features of these enzymes were revealed during
5
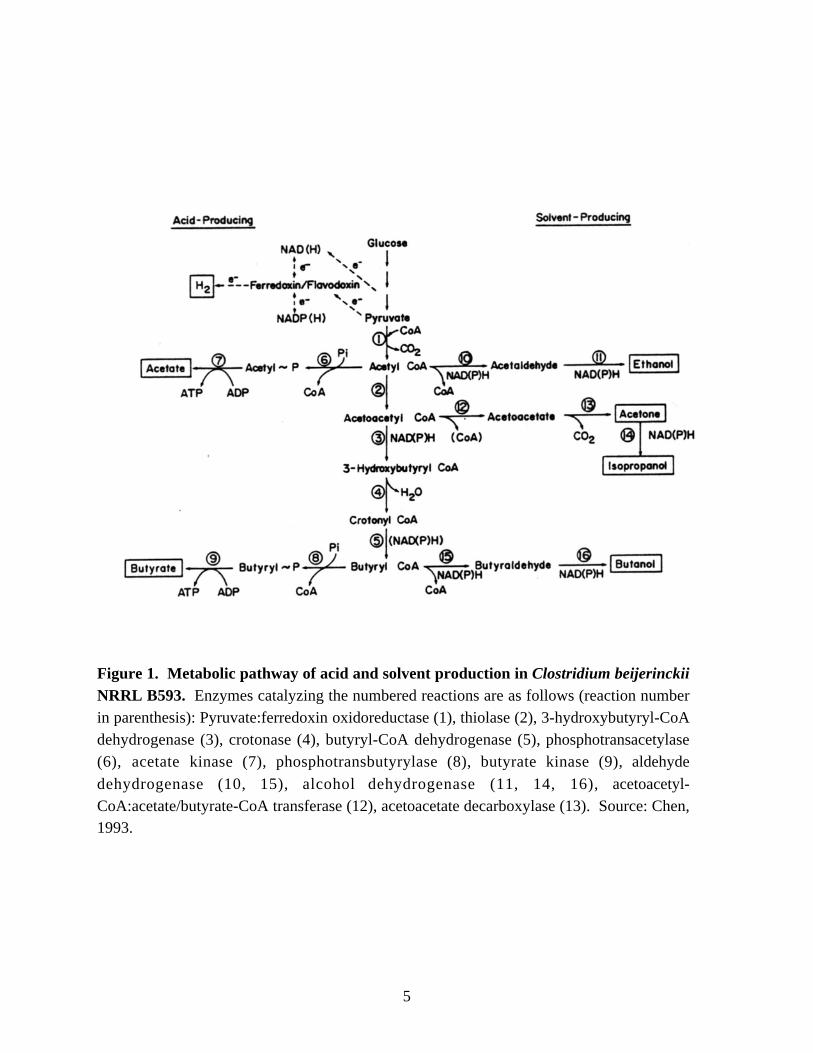
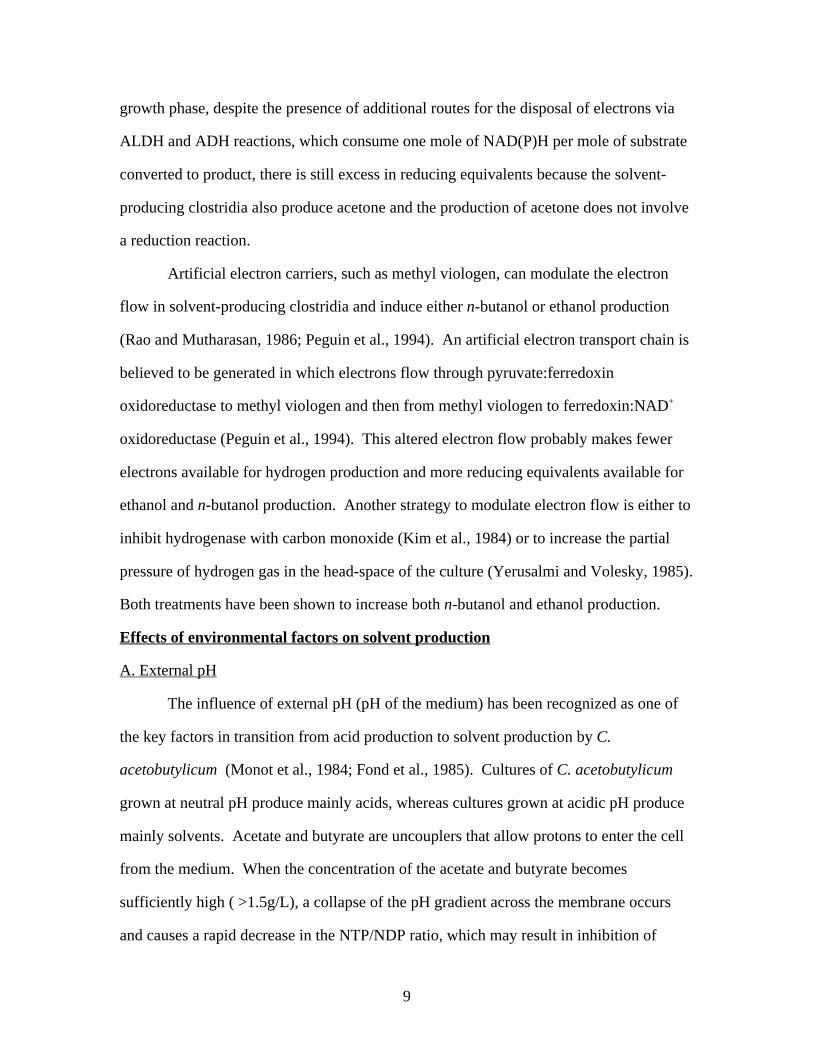
Figure 1. Metabolic pathway of acid and solvent production in Clostridium beijerinckiiNRRL B593. Enzymes catalyzing the numbered reactions are as follows (reaction numberin parenthesis): Pyruvate:ferredoxin oxidoreductase (1), thiolase (2), 3-hydroxybutyryl-CoAdehydrogenase (3), crotonase (4), butyryl-CoA dehydrogenase (5), phosphotransacetylase(6), acetate kinase (7), phosphotransbutyrylase (8), butyrate kinase (9), aldehyde
characterization of their kinetic properties. For instance, the enzyme
phosphotransbutyrylase, which catalyzes formation of butyryl phosphate (reaction 8 in
Figure 1), is very sensitive to pH changes. It is active only between pH values of 6 to 8
(Weisenborn et al., 1989; Thompson and Chen, 1990), which indicates that a change in
internal pH may be an important factor in the regulation of the activity of this enzyme.
Recently, a second butyrate kinase gene (bukII) was discovered in C. acetobutylicum
ATCC 824 (Huang et al., 2000).
During solvent production, acetyl-CoA and butyryl-CoA function as the key
intermediates for production of ethanol and n-butanol. Acetoacetyl-CoA is the key
intermediate for the synthesis of acetone. In some strains of C. beijerinckii, such as
NRRL B593, and in C. aurantibutyricum, acetone is further reduced to isopropanol.
Both aldehyde and alcohol dehydrogenases are needed for the formation of alcohols.
Activity measurements during purification of aldehyde dehydrogenase (ALDH) showed
that the enzyme is responsible for the synthesis of two aldehyde intermediates,
butyraldehyde and acetaldehyde, which are reqiuired for both n-butanol and ethanol
production in C. saccharobutylicum NRRL B643 (Palosaari and Rogers, 1988), C.
beijerinckii NRRL B592 (Yan and Chen, 1990) and C. beijerinckii NRRL B593 (Toth et
al., 1999). An NADH-dependent butyraldehyde dehydrogenase has recently been
purified from C. acetobutylicum (Dürre, 1998). C. acetobutylicum also contains an
additional aldehydyde-alcohol dehydrogenase (ALDH-ADH, encoded by aad/adhE
gene) (Fisher et al., 1993; Nair et al., 1994), and this enzyme has a higher aldehyde
dehydrogenase activity than alcohol dehydrogenase activity.
The solvent-producing clostridia contain multiple ADHs (Chen, 1995). In C.
acetobutylicum, besides BDH-I and -II (n-butanol dehydrogenases), which are NADH-
dependent (Welch et al., 1989; Peterson et al., 1991), a multifunctional aldehyde-alcohol
dehydrogenase has been identified (Nair et al., 1994). Each ADH seems to have a
7
different physiological function. BDH-II is responsible for bulk production of n-butanol
and is induced at the onset of solvent-producing growth phase, whereas BDH-I is
responsible for production of small quantities of n-butanol (Sauer and Dürre, 1995).
Recently, a gene (adhE2) encoding a second multifunctional NADH-dependent alcohol
dehydrogenase was identified in C. acetobutylicum ATCC 824 (Fontaine et al., 2002).
The ADHE2 protein is present in alcohologenic cells which are generated either by
addition of artificial dyes, such as methyl viologen, to the cultures grown at neutral pH
(Rao and Mutharasan, 1986) or by growing the cells with a more reduced substrate, such
as glycerol (Vasconcelos et al., 1994). The alcohologenic cells produce n-butanol and
ethanol but not acetone. The expression of adhE2 from a plasmid in a solvent-production
deficient mutant of C. acetobutylicum ATCC 824 restored n-butanol production and
provided elevated activities of NADH-dependent butyraldehyde and butanol
dehydrogenases (Fontaine et al., 2002). Three ADH isoenzymes have been purified from
C. beijerinckii NRRL B592 (Chen, 1995). The three isoenzymes have been designated
ADH1 (a homodimer of subunit α), ADH-2 (a heterodimer of subunits αβ) and ADH-3
(a homodimer of subunit β). The enzymes are responsible for n-butanol production. A
primary/secondary alcohol dehydrogenase, which is responsible for the production of n-
butanol and isopropanol has been purified from C. beijerinckii NRRL B593 (Ismaiel et
al., 1993).
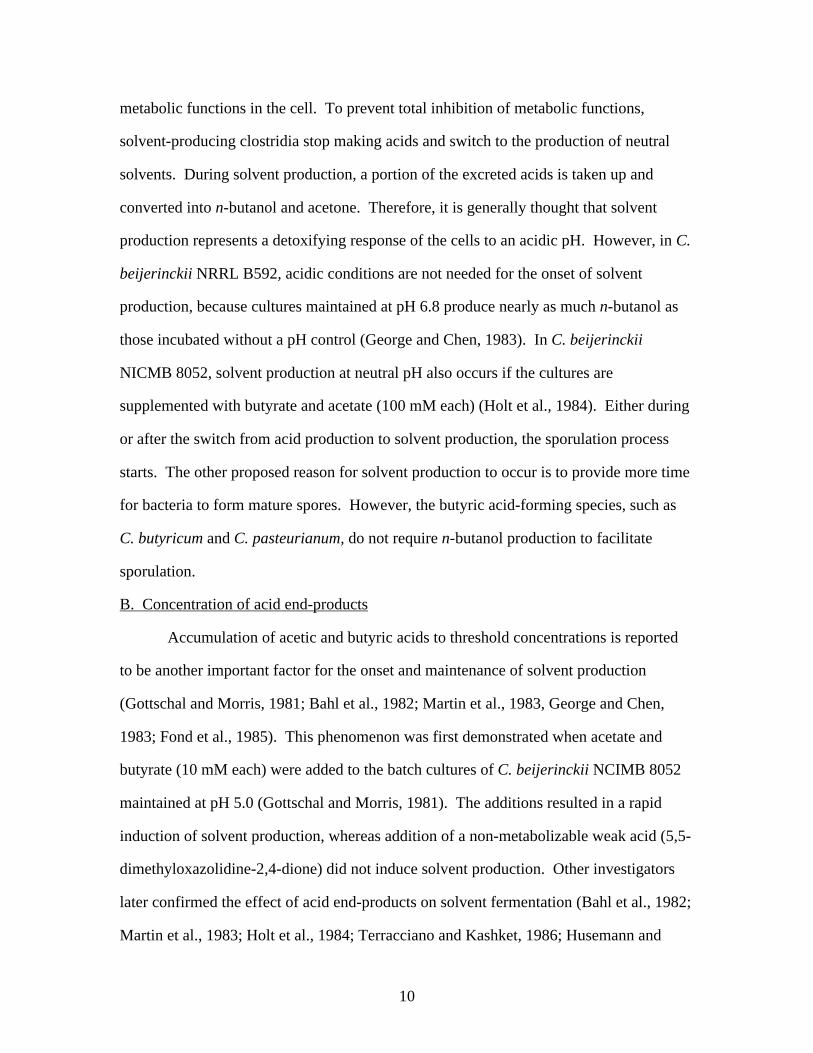
Electron flow
During the acid-producing growth phase, there is an excess of reducing
equivalents because only a portion of reducing equivalents produced by glycolyisis is
consumed during the reduction of acetoacetyl-CoA to butyryl-CoA (reactions 3 and 5 in
Figure 1). This excess in reducing equivalents is relieved by disposing of the electrons in
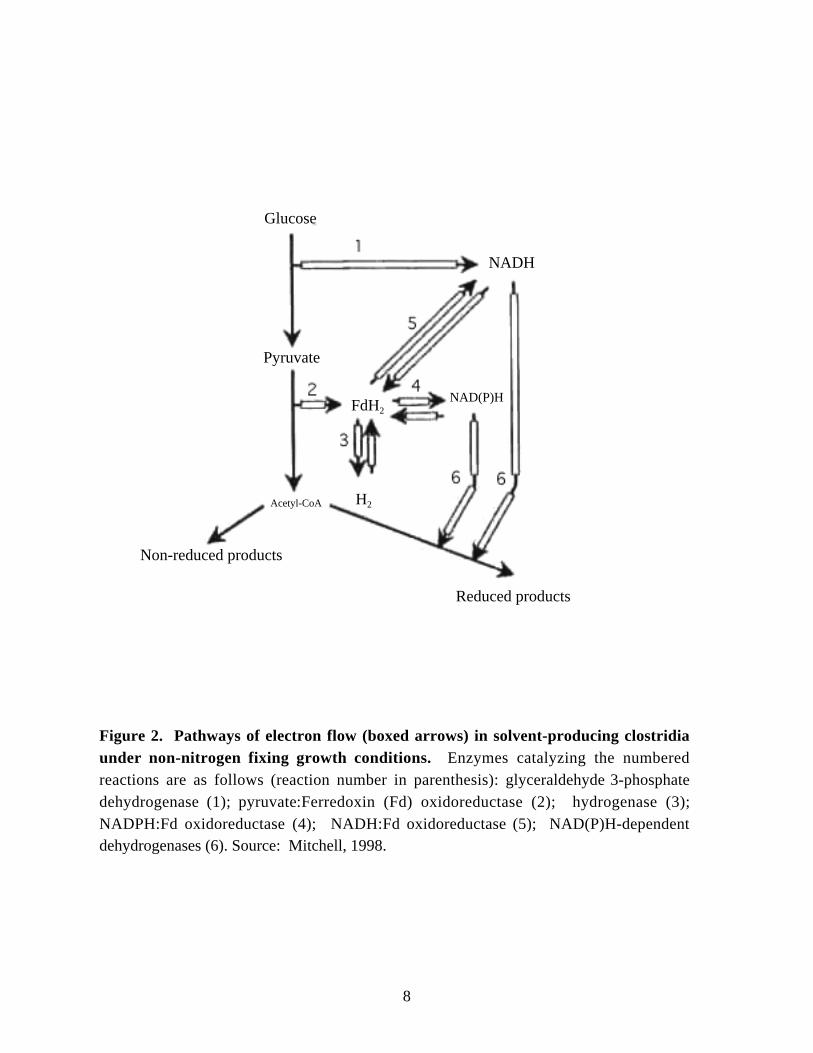
the form of hydrogen gas by hydrogenase (Figure 2). During the solvent-producing
8
Figure 2. Pathways of electron flow (boxed arrows) in solvent-producing clostridiaunder non-nitrogen fixing growth conditions. Enzymes catalyzing the numberedreactions are as follows (reaction number in parenthesis): glyceraldehyde 3-phosphatedehydrogenase (1); pyruvate:Ferredoxin (Fd) oxidoreductase (2); hydrogenase (3);NADPH:Fd oxidoreductase (4); NADH:Fd oxidoreductase (5); NAD(P)H-dependentdehydrogenases (6). Source: Mitchell, 1998.
Glucose
Pyruvate
Acetyl-CoA
Non-reduced products
Reduced products
NADH
FdH2
H2
NAD(P)H
9
growth phase, despite the presence of additional routes for the disposal of electrons via
ALDH and ADH reactions, which consume one mole of NAD(P)H per mole of substrate
converted to product, there is still excess in reducing equivalents because the solvent-
producing clostridia also produce acetone and the production of acetone does not involve
a reduction reaction.
Artificial electron carriers, such as methyl viologen, can modulate the electron
flow in solvent-producing clostridia and induce either n-butanol or ethanol production
(Rao and Mutharasan, 1986; Peguin et al., 1994). An artificial electron transport chain is
believed to be generated in which electrons flow through pyruvate:ferredoxin
oxidoreductase to methyl viologen and then from methyl viologen to ferredoxin:NAD+
oxidoreductase (Peguin et al., 1994). This altered electron flow probably makes fewer
electrons available for hydrogen production and more reducing equivalents available for
ethanol and n-butanol production. Another strategy to modulate electron flow is either to
inhibit hydrogenase with carbon monoxide (Kim et al., 1984) or to increase the partial
pressure of hydrogen gas in the head-space of the culture (Yerusalmi and Volesky, 1985).
Both treatments have been shown to increase both n-butanol and ethanol production.
Effects of environmental factors on solvent production
A. External pH
The influence of external pH (pH of the medium) has been recognized as one of
the key factors in transition from acid production to solvent production by C.
acetobutylicum (Monot et al., 1984; Fond et al., 1985). Cultures of C. acetobutylicum
grown at neutral pH produce mainly acids, whereas cultures grown at acidic pH produce
mainly solvents. Acetate and butyrate are uncouplers that allow protons to enter the cell
from the medium. When the concentration of the acetate and butyrate becomes
sufficiently high ( >1.5g/L), a collapse of the pH gradient across the membrane occurs
and causes a rapid decrease in the NTP/NDP ratio, which may result in inhibition of
10
metabolic functions in the cell. To prevent total inhibition of metabolic functions,
solvent-producing clostridia stop making acids and switch to the production of neutral
solvents. During solvent production, a portion of the excreted acids is taken up and
converted into n-butanol and acetone. Therefore, it is generally thought that solvent
production represents a detoxifying response of the cells to an acidic pH. However, in C.
beijerinckii NRRL B592, acidic conditions are not needed for the onset of solvent
production, because cultures maintained at pH 6.8 produce nearly as much n-butanol as
those incubated without a pH control (George and Chen, 1983). In C. beijerinckii
NICMB 8052, solvent production at neutral pH also occurs if the cultures are
supplemented with butyrate and acetate (100 mM each) (Holt et al., 1984). Either during
or after the switch from acid production to solvent production, the sporulation process
starts. The other proposed reason for solvent production to occur is to provide more time
for bacteria to form mature spores. However, the butyric acid-forming species, such as
C. butyricum and C. pasteurianum, do not require n-butanol production to facilitate
sporulation.
B. Concentration of acid end-products
Accumulation of acetic and butyric acids to threshold concentrations is reported
to be another important factor for the onset and maintenance of solvent production
(Gottschal and Morris, 1981; Bahl et al., 1982; Martin et al., 1983, George and Chen,
1983; Fond et al., 1985). This phenomenon was first demonstrated when acetate and
butyrate (10 mM each) were added to the batch cultures of C. beijerinckii NCIMB 8052
maintained at pH 5.0 (Gottschal and Morris, 1981). The additions resulted in a rapid
induction of solvent production, whereas addition of a non-metabolizable weak acid (5,5-
dimethyloxazolidine-2,4-dione) did not induce solvent production. Other investigators
later confirmed the effect of acid end-products on solvent fermentation (Bahl et al., 1982;
Martin et al., 1983; Holt et al., 1984; Terracciano and Kashket, 1986; Husemann and
11
Papoutsakis, 1987). The report (Holt et al., 1984), which showed that C. beijerinckii
NCIMB 8052 could produce solvents at neutral pH if acetate and butyrate were
supplemented, strongly suggested the necessity of acid end-products in the initiation of
solvent production. When acetate and butyrate were added to cultures of C. beijerinckii
NRRL B592 maintained at pH 6.8 at concentrations close to those present at the onset of
solvent production, acetate plus butyrate added together shortened the incubation time
required for n-butanol formation, and the final concentrations of n-butanol in butyrate-
supplemented fermentors were higher than in control fermentors (George and Chen,
1983). Terracciano and Kashket (1986) reported a value of 13 mM for butyric acid at the
onset of solvent production, and this finding was confirmed by Husemann and
Papoutsakis (1987) with the additional observation that an increase in concentration of
undissociated acetic acid does not correlate well with the initiation of solvent production.
However, when a copy of the gene (buk) encoding butyrate kinase in the ptb-buk operon
was inactivated in C. acetobutylicum ATCC 824 (Harris et al., 1999), cells failed to
accumulate butyrate to high levels at the onset of solvent production. Therefore, a
threshold butyrate concentration may not be necessary for the onset of solvent production
by C. acetobutylicum, but an elevated level of butyryl phosphate or butyryl-CoA may be
required for the onset of solvent production (Harris et al., 1999).
C. Nutrient limitation
Since the early studies with solvent-producing clostridia (McDaniel et al., 1939),
the influence of nutrient limitation on growth and solvent production has been well
recognized. Only acids are produced when carbon source is limited in the medium. At
least 10 g/L glucose must be present for solvent production to take place in cultures of C.
saccharobutylicum NCP 262 (Long et al., 1984a). When the concentration of glucose is
less than 10 g/L in batch cultures and 4 g/L per day in fed-batch cultures of C.
acetobutylicum (Fond et al., 1984), no shift to solvent production occurs. The lack of
12
solvent production in glucose-limited cultures was attributed to the inability to
accumulate the threshold concentrations of acid end-products.
Unlike carbon-limited cultures, solvents are produced by cultures grown in
phosphate- or sulfate-limited media (Bahl et al., 1982; Meinecke et al., 1984; Bahl et al.,
1985). However, despite these observations, no single growth-limiting nutrient that
specifically induces solvent production has been identified so far.
Events associated with the solventogenic switch
A. Changes in the expression of the solvent-production genes and acid- and solvent-
forming enzyme activities
Several laboratories investigated the changes in expression of both the solvent-
production genes (Gerischer and Dürre,1992; Fischer et al., 1993; Sauer and Dürre, 1995;
Chen and Blaschek, 1999b) and solvent- and acid-forming enzyme activities (Andersch et
al., 1983; Hartmanis and Gatenbeck, 1984; Hartmanis et al., 1984; Ballongue et al., 1985;
Dürre et al., 1987; Yan et al., 1988; Husemann and Papoutsakis, 1989; Ballongue et al.,
1989; Grupe and Gottschalk, 1992) during the shift to solvent production. The induction
of the genes for solvent-producing enzymes was measured by Northern blot analysis. An
induction of bdhI (encodes n-butanol dehydrogenase), bdhII (encodes n-butanol
dehydrogenase), adc (encodes acetoacetate decarboxylase) and the sol operon was
observed during the pH-induced shift in cultures of C. acetobutylicum DSM 1731 (Sauer
and Dürre, 1995). The order of induction of the three different n-butanol dehydrogenase
genes was found to be bdhI-sol operon (contains adhE)-bdhII. A closer examination of
the expression patterns suggested that the sol operon is highly expressed during the onset
of solvent production, whereas the expression of bdhII ensures continued production of
n-butanol.
Determination of the onset of solvent production is important because the
assigned time may help to determine the culture conditions which may have effect on the
13
possible triggering signals (Yan et al., 1988). To determine the culture conditions at the
onset of solvent production, cellular levels of solvent-producing enzymes can be
measured at frequent time intervals along with cell density, culture pH and the level of
fermentation products. The acid-forming enzyme activities are consistently higher in
acid-producing cells than in solvent-producing cells of C. acetobutylicum (Andersch et
al., 1983; Hartmanis et al., 1984; Hartmanis and Gatenbeck, 1984). In C. acetobutylicum
DSM 1732, after the solventogenic switch, a rapid decrease to 15 % of initial acid-
forming enzyme activities was observed (Andersch et al., 1983). Similar results were
obtained with C. acetobutylicum ATCC 824 with the exception of butyrate kinase whose
specific activity did not decrease rapidly after the onset of solvent production (Hartmanis
et al., 1984). ALDHs and ADHs of C. acetobutylicum DSM 1732 and ATCC 824 are
expressed before the initiation of n-butanol production (Dürre et al., 1987, Husemann and
Papoutsakis, 1989). In continuous cultures of C. acetobutylicum DSM 1732, a 14-fold
increase in the specific activity of acetoacetyl-CoA: acetate coenzyme-A transferase and
a 38-fold increase in the specific activity of acetoacetate decarboxylase were detected
after the switch to solvent production (Andersch et al., 1983). In batch cultures, a similar
increase was observed in the specific activity of acetoacetate decarboxylase (Andersch et
al., 1983).
In another study, induction of acetoacetate decarboxylase was shown when linear
organic acids from C1 to C4 were added to resting cells of C. acetobutylicum ATCC 824
(Ballongue et al., 1985). Acetoacetate decarboxylase activity was also detected in acid-
forming cells of C. acetobutylicum grown at pH 6.8, but the presence of the enzyme was
not accompanied by acetone production (Ballongue et al., 1989). Acetone formation and
the induction of acetoacetate decarboxylase occurred simultaneously in batch and
continuous cultures of C. acetobutylicum ATCC 824 (Husemann and Papoutsakis, 1989,
Ballongue et al., 1989). CoA-transferase activity increased in cultures of C.
14
acetobutylicum ATCC 824 after the switch to solvent production (Hartmanis et al., 1984).
Increases in solvent-producing enzyme activities during the transition from acid- to
solvent-producing growth phases were also observed in C. beijerinckii NRRL B592 and
B593 (Yan et al., 1988). Increases in solvent-producing enzyme activities started at least
40 min earlier than the onset of solvent production in C. beijerinckii NRRL B592.
However, the extent and the pattern of increase for each of these solvent-forming enzyme
activities were different in C. beijerinckii NRRL B592. A 124-fold increase in
acetoacetate decarboxylase, a 25-fold increase in butyraldehyde dehydrogenase and a 5-
fold increase in n-butanol dehydrogenase specific activities were measured (Yan et al.,
1988). A fast rise in the specific activities of solvent-producing enzymes was observed
near the mid-exponential growth phase in cultures of C. beijerinckii NRRL B593 (Yan et
al., 1988). The patterns of the levels of solvent-producing enzymes were different in C.
beijerinckii NRRL B593 than those in C. beijrinckii NRRL B592 (Yan et al., 1988).
B. Sporulation
The initiation of sporulation in solvent-producing clostridia is associated with the
switch from acid-forming to solvent-forming metabolism. Sporulation mutants
(asporogenous cells) of C. saccharobutylicum NCP 262 either failed to form spores and
produced no solvents or formed reduced number of spores and produced an intermediate
level of solvents (Jones et al., 1982). Although the signals for the initiation of both
sporulation and solvent production are tightly connected (Long et al., 1984a; Ross et al.,
1990), the mutants lacking individual pathways associated with sporulation indicated that
solvent production can function independently of sporulation, and mature spores are not
necessarily required for the overall development of solventogenic phase (Long et al.,
1984b, Meinecke et al., 1984). This result suggests that the asporogenous but solvent-
producing cells are blocked at an early stage of the sporulation process such that the shift
to solvent production is not affected.
15
The Spo0A protein, a response regulator, plays a pivotal role in the initiation of
sporulation in Bacillus subtilis (Errington, 1993). Spo0A has two domains. The N
terminal domain contains a conserved aspartic acid residue, which is phosphorylated by
one or more histidine protein kinases (Quisek et al., 2001). Phosphorylation controls the
activity of the C-terminal domain, which is responsible for DNA binding (Lewis et al.,
2001). Although Spo0A, even in the unphosphorylated form, can bind to DNA and
repress/activate transcription, its binding is enhanced by phosphorylation (Satola et al.,
1992). Counterparts of the B. subtilis spoOA gene have been detected in Clostridium
species (Brown et al., 1994). Ravagnani et al. (2000) recently reported that the spo0A
gene of C. beijerinckii NCIMB 8052 controls the switch from acid to solvent production,
because inactivation of the spo0A gene blocks the formation of solvents. Further
evidence was provided by in vitro gel retardation experiments using C. acetobutylicum
adc (encodes acetoacetate decarboxylase) and C. beijerinckii ptb (encodes
phosphotransbutyrylase) promoter fragments and the recombinant Spo0A protein of B.
subtilis and C. beijerinckii. Spo0A was able to bind fragments from the clostridial adc
and ptb promoters. Previously, Nair et al. (1999) reported that an open reading frame
(orf5/solR) located directly upstream of the sol operon of C. acetobutylicum encodes a
transcriptional repressor for the sol locus. The report was based on three observations: (i)
overexpression of solR resulted in a solvent-negative phenotype, (ii) insertional
inactivation of solR led to mutants with markedly improved solvent yields, and (iii) a
potential DNA-binding motif (helix-turn-helix) is present in the SolR protein. However,
later reports of Ravagnani et al. (2000) which showed the involvement of Spo0A in
control of expression of the sol operon in C. beijerinckii NCIMB 8052, and of Thormann
and Dürre (2001) and Thormann et al. (2002), which showed that solR is not a
transcriptional activator of the sol operon but it is a membrane protein involved in
16
glycosylation/deglycosylation reactions, the proposal that transcriptional regulation of the
sol operon is controlled by SolR is found to be incorrect.
C. Changes in NAD(P)H and ATP concentrations
An increase in availability of intracellular NAD(P)H concentration may have a
significant impact on alcohol production. This concept was demonstrated by lowering
the electron flow towards hydrogen gas production either by using carbon monoxide (the
inhibitor of hydrogenase) (Kim et al., 1984) or by growing the cells in an iron-deficient
medium (Junelles et al., 1988). When Meyer and Papoutsakis (1989) measured the
intracellular concentration of NADH in acidogenic (glucose-limited) and solventogenic
(glucose-sufficient) continuous cultures of C. acetobutylicum ATCC 824, they found that
the NADH level in glucose-sufficient cultures was 1.4-times higher than in glucose-
limited cultures. When glucose-limited cultures were sparged with carbon monoxide for
5 hours, an almost 400-fold increase in intracellular NADH level occurred resulting in
higher n-butanol production (10-fold). However, the results of batch culture experiments
grown at pH 4 and at pH 6 showed no apparent correlation between solvent production
and NADH levels. In a model, Grupe and Gottschalk (1992) proposed two triggering
signals for solvent production. One signal is the change in ATP and ADP levels, which
triggers acetone production, and the other is the increase in NAD(P)H level, which
triggers n-butanol production. However, this model has been questioned because the
genes for CoA transferase (for acetone production) and aldehyde-alcohol dehydrogenase
(for n-butanol production) are encoded from a common transcription unit (Fisher et al.,
1993).
The ratio of ATP/ADP may impose its effect by acting on DNA gyrase, which
controls DNA supercoiling by introducing negative supercoils. In support of this
suggestion, DNA from C. acetobutylicum becomes less negatively supercoiled when
17
entering the solventogenic stage and transcription of genes encoding solventogenic
enzymes is specifically induced after inhibition of DNA gyrase (Ullmann et al., 1996).
Major drawbacks of solvent fermentation
In order to revive an economically competitive fermentation process, three major
drawbacks must be overcome: (1) the high cost of substrate, (2) solvent toxicity and the
high product recovery costs, and (3) degeneration.
1. The high cost of substrate
Based on a recent estimate, substrate costs are among the dominant factors and
can account for about 70 % or more of the total manufacturing cost in fermentations
(Wilke, 1999). Conventional substrates for acetone-butanol fermentation are starch
(corn, wheat, millet etc.) and sugar (molasses). However, solvent-producing clostridia
can also utilize many different substrates (Mitchell, 1998). Therefore, cheaper substrates,
such as cheese whey and corn steep liquor, may be considered as replacements for
expensive substrates (Schouthens and Groot, 1985; Claassen et al., 2000). Alternatively,
solvent-producing clostridia may be engineered to utilize other abundant biomass, such as
cellulose. Although C. acetobutylicum is unable to grow in a medium containing
cellulose as the sole source of fermentable sugars, it produces extracellular cellulase and
it can hydrolyze carboxymethyl cellulose and acid-swollen cellulose to some extent
(Allock et al., 1981; Lee et al., 1985). Molecular cloning studies also showed the genetic
potential of C. acetobutylicum to produce endogluconase and β-glucosidase (Zappe et al.,
1985). A recent analysis of the C. acetobutylicum ATCC 824 genome sequence revealed
at least 11 proteins that are confidently identified as cellulosome components. Moreover,
most of the genes encoding these 11 proteins are organized in an operon-like cluster
(Noelling et al., 2001). A recent economic assessment of n-butanol production using C.
beijerinckii BA 101 as the organism and corn steep liquor as the substrate showed that, in
a worst case scenario, the n-butanol price would be US $1.07 / kg (Qureshi and Blaschek,
18
2001). Considering the current reported prices for petrochemically-derived n-butanol
(around US$1.21 / kg) (Chemical Market Reporter), fermentation-derived chemicals may
now be economically competitive with petroleum-based and chemically-manufactured
fuels (Qureshi and Blaschek, 2001).
2. Solvent toxicity and the high product recovery costs
It is generally thought that the limitation at 20 g/L in total solvent concentration
observed in acetone-butanol fermentation is due to the toxicity of solvents produced
(Moreira et al., 1981; Lapage et al., 1987). Among the main products of fermentation, n-
butanol was shown to be the most potent inhibitor of growth of C. acetobutylicum ATCC
824 as well as the rate of sugar uptake and of sugar incorporation into the cell membrane
(Ounine et al., 1985). It was proposed that n-butanol affects membrane fluidity by
partitioning in lipid bilayers and then interfering with lipid-lipid and lipid-protein
interactions (Moreira et al., 1981; Ingram and Buttke, 1984). n-Butanol, which was
added to the cultures during the exponential growth phase at a concentration of 14 g/L
completely inhibited growth of C. acetobutylicum ATCC 824 when the organism was
grown on glucose. A concentration of only 8g/L was completely inhibitory when the
organism was grown on xylose (Ounine et al., 1985). Large changes in lipid composition
of C. acetobutylicum were brought about by the addition of solvents to the culture
medium. Additions of n-butanol, ethanol and acetone caused a decrease in the
unsaturated/saturated fatty acid ratio of the membrane (Lapage et al., 1987).
Despite the early observations, Formanek et al. (1997) reported production of
higher levels of n-butanol (19 g/L) in a semi-defined medium with C. beijerinckii BA101,
a hyper-solvent producing mutant strain isolated from the parent strain C. beijerinckii
NCIMB 8052 following mutagenesis with N-methyl-N’-nitro-N-nitrosoguanidine
(Annous and Blaschek, 1991). Recently, Chen and Blaschek (1999a) reported 20.9 g/L
n-butanol and 32.6 g/L total solvent production with acetate-supplemented cultures of C.
19
beijerinckii BA 101, which confirmed the previous findings. In addition, a mutant strain
of C. acetobutylicum ATCC 824, in which the butyrate kinase gene in the ptb-buk operon
was inactivated, produced 16 g/L of n-butanol and 4.4 g/L of acetone, exceeding the
often quoted upper limit of n-butanol tolerance (Harris et al., 1999). Therefore, the
membrane-related hypothesis of alcohol inhibition should be reconsidered.
Traditionally, solvents were recovered from the fermentation broth by distillation,
which is a high cost process (Lenz and Moreira, 1980). Novel product recovery
techniques for clostridial solvent fermentation have been evaluated (Dürre, 1998).
Membrane-based systems are highly selective over liquid/liquid extraction methods and
gas stripping. However, they suffer from clogging and fouling. Emulsions that form
during liquid/liquid extraction makes the process less suitable and gas stripping results in
incomplete removal of solvents from the fermentation broth. Therefore, so far, no single
process has been found to be most suitable for extraction of solvents from the
fermentation broth.
3. Degeneration
Degeneration is the process whereby solvent-producing clostridia lose the
capacity to produce solvents. This phenomenon occurs in both batch (Kutzenok and
Aschner, 1952; Gapes et al., 1983; Hartmanis et al., 1986; Kashket and Cao, 1993) and
continuous cultures (Stephans et al., 1985; Wooley and Morris, 1990). The early study of
degeneration suggested the occurrence of mutants having enhanced amounts of acetate-
and butyrate-forming enzymes, but lacking the solvent-forming enzymes (Kutzenok and
Aschner, 1952). Later, investigators discussed the possibility of the loss of regulatory
elements, which would result in the failure of the organism to respond to factors that
trigger the switch to a solventogenic fermentation (George and Chen, 1983). Kashket
and Cao (1993) isolated a degeneration-resistant mutant of C. beijerinckii NCIMB 8052
by transposon mutation. In another study, a set of C. acetobutylicum ATCC 824 mutants
20
that are degenerate was examined and the results suggested the loss of a genetic region
encoding solvent-forming genes during subculturing (Stim-Herndon et al., 1996).
Cornillot et al. (1997b) later demonstrated that the genes for n-butanol and acetone
formation in C. acetobutylicum ATCC 824 reside on a large plasmid (pSOL1) whose loss
leads to degeneration of the strain. Among the methods described to prevent
degeneration, the use of CaCO3 as a buffering agent is the most successful one.
Hartmanis et al. (1986) achieved over 200 transfers without degeneration of C.
acetobutylicum ATCC 824 and DSM 792 in a complex medium that contained 3 g/L
CaCO3.
Genetic studies with the solventogenic clostridia
A. Gene cloning
A common strategy has been employed to clone the genes of solvent-producing
clostridia (Mitchell, 1998). Radioactively labeled synthetic oligonucleotides designed
from N-terminal sequences of purified enzymes were used as probes to screen genomic
DNA libraries (Peterson et al., 1990; Cary et al., 1990; Peretz et al., 1997). Non-
radioactively labeled probes which were generated by PCR were also used (Boynton et
al., 1996a; Toth et al., 1999; Chen et al., 2001). Most of the genes of solvent-producing
enzymes have been cloned (Youngleson et al., 1987; Youngleson et al., 1988; Peterson
and Bennett; 1990; Peterson et al., 1991a; Peterson et al., 1991b; Cary et al., 1990;
Walter et al., 1992; Fisher and Dürre, 1993; Nair et al., 1994; Peretz et al., 1997; Hong,
1999; Toth et al., 1999). In C. acetobutylicum ATCC 824 and DSM 792, the structural
genes encoding acetoacetyl-CoA: acetate/butyrate: CoA-transferase (ctfA and ctfB) and
an alcohol-aldehyde dehydrogenase (aad/adhE) form a transcriptional unit, which was
named as the sol operon (Fisher et al., 1993; Nair et al, 1994) (Figure 3). The sol operon
resides on pSOL1. Downstream of the sol operon, a previously cloned (Peterson and
21
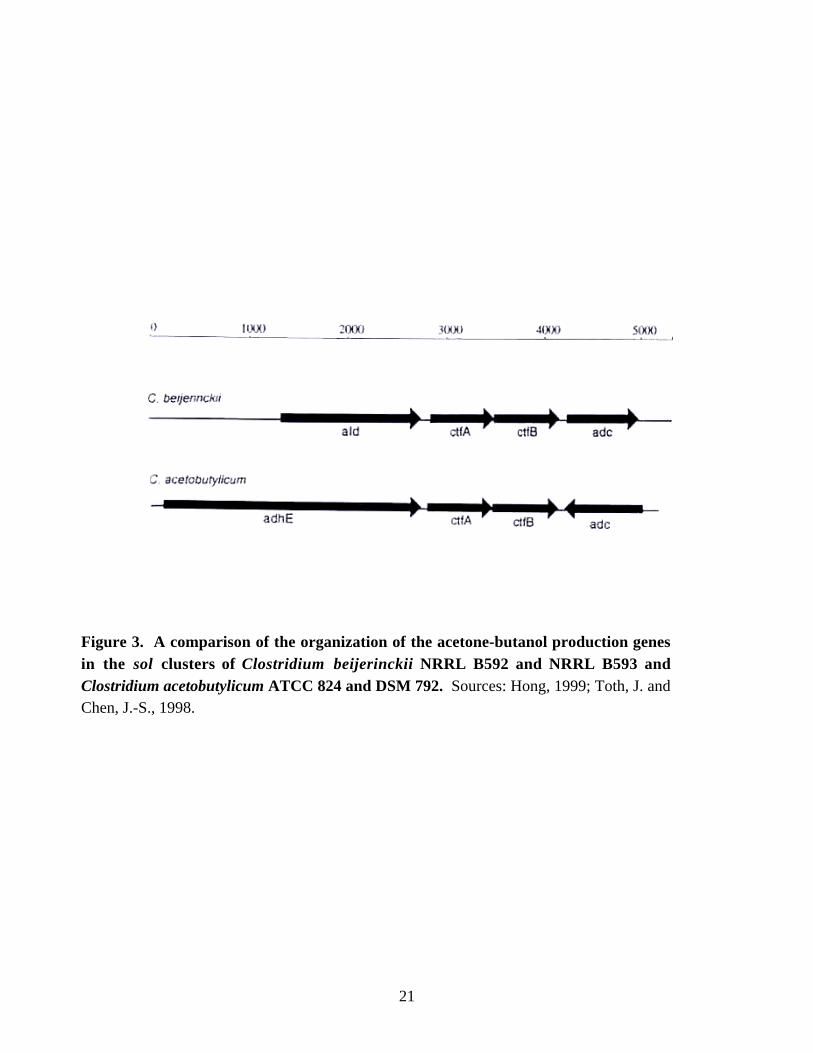
Figure 3. A comparison of the organization of the acetone-butanol production genesin the sol clusters of Clostridium beijerinckii NRRL B592 and NRRL B593 andClostridium acetobutylicum ATCC 824 and DSM 792. Sources: Hong, 1999; Toth, J. andChen, J.-S., 1998.
22
Bennet, 1990; Gerischer and Dürre, 1990) solvent-production gene, (adc) which encodes
acetoacetate decarboxylase, is located in an orientation opposite to the other three genes.
In C. beijerinckii NRRL B592 and NRRL B593, the sol operon consists of four genes: an
aldehyde dehydrogenase gene (ald), CoA-transferase genes (ctfA and ctfB), and an
acetoacetate decarboxylase gene (adc) (Toth and Chen, 1998; Hong, 1999) (The
GenBank accession number for C. beijerinckii NRRL B593 ald, ctfA, ctfB and partial adc
sequence is AF157306 and the GenBank accession number for complete adc sequence is
AF157305) (Figure 3).
The genes for the acid-forming enzymes have been cloned either from C.
acetobutylicum ATCC 824 or from C. beijerinckii NCIMB 8052 or from both (Cary et
al., 1988; Oultram et al., 1993; Walter et al., 1993 and Boynton et al., 1996a). The ptb
(encodes phosphotranscacetylase) and buk (encodes butyrate kinase) genes are clustered
in both organisms forming an operon. Similarly, pta (encodes phosphotransacetylase)
and ack (encodes acetate kinase) form an operon in C. acetobutylicum ATCC 824.
In addition to the specific acid- and solvent-forming genes, the genes that are
essential for both acid and solvent formation have also been cloned and sequenced
(Peterson and Bennett, 1991 and Boynton et al., 1996a). The thl gene encodes thiolase
(reaction 2 in Figure 1), the bhbd gene encodes 3-hydroxybutyryl-CoA dehydrogenase
(reaction 3 in Figure 1), the crt gene encodes crotonase (reaction 4 in Figure 1) and the
bcd gene encodes butyryl-CoA dehydrogenase (reaction 5 in Figure 1). A bcs (butyryl-
CoA synthesis) operon consisting of five genes encoding the three enzymes for butyryl-
CoA synthesis and two putative electron transfer flavoproteins is present in C.
acetobutylicum ATCC 824 (Boynton et al., 1996b) and C. beijerinckii NRRL B593
(GenBank accession number: AF494018).
23
B. Mutagenesis
Chemical mutagenesis has been successfully applied to the solvent-producing
clostridia. Among the mutagens, ethyl methane sulfonate (EMS) and N-methyl-N’-nitro-
N-nitrosguanidine (MMNG) are the most effective ones. UV irradiation is not an
effective way to mutagenize solvent-producing clostridia (Lemmel, 1984; Bowring and
Morris, 1985). By using EMS (2.5 % v/v), Allcock et al. (1981) generated a mutant
strain (lyt-1) of C. saccharobutylicum NCP 262 that is more resistant to autolysis than the
parent strain. In later studies, EMS was used again to isolate sporulation mutants that are
defective in sporulation, clostridial stage formation, granulose formation, capsule
formation and solvent production (Jones et al., 1982; Long et al., 1984b). Annous and
Blaschek (1991) isolated a mutant strain of C. beijerinckii NCIMB 8052 by using
MMNG. This strain has an enhanced amylolytic activity and produces more solvents
than does the parent strain. Clark et al. (1989) isolated a mutant strain (strain M5) of C.
acetobutylicum ATCC 824 after treatment of parent strain with MMNG. This mutant
strain and other mutant strains of C. acetobutylicum (e.g., DG1) were shown to be very
useful because complementation of these mutants provides the evidence for the
physiological role of the genes that are related to solvent production (Nair and
Papoutsakis, 1994).
Transposon mutagenesis is more useful than chemical mutagenesis because the
mutants can be selected by using selectable markers, such as tetracycline and
erythromycin resistance (Wooley et al., 1989), and the disrupted gene can be identified
(Bertram et al., 1990). An efficient method for transposon mutagenesis was developed
for C. acetobutylicum (Oultram and Young, 1985). By using transposon mutangenesis,
Bertram et al. (1990) identified a formerly unknown specific ethanol dehydrogenase in C.
acetobutylicum DSM 792 and Kashket and Cao (1993) were able to isolate a
degeneration-resistant mutant strain of C. beijerinckii NCIMB 8052. Other mutants
24
deficient in solvent production and sporulation have been obtained by transposon
mutagenensis (Babb et al., 1993; Mattson and Rogers, 1994).
C. Transformation of the solvent-producing clostridia
Initial work in this area was directed toward the development of protoplast
transformation systems. Allock et al., (1982) successfully produced protoplasts of C.
saccharobutylicum NCP 262 and showed regeneration of these protoplasts in a special
medium containing casein and gelatin. Lin and Blascheck (1984) also showed that
plasmids can be taken up and expressed by protoplasts of C. acetobutylicum SA-1. In
later studies, as an alternative to protoplast-mediated genetic exchange, conjugal transfer
of plasmids by the filter mating procedure was used (Oultram and Young, 1985).
However, these techniques are technically cumbersome, time consuming and limited in
the number of plasmid vectors they can accommodate. In 1988, a plasmid shuttle vector
(pMTL500E), which contained the erythromycin resistance gene and the replication
machinery of plasmid pAMβ1 from Streptococcus faecalis, was constructed and
introduced into C. beijerinckii NCIMB 8052 by electroporation (Oultram et al., 1988).
Plasmid pMTL500E was capable of replicating in E. coli and C. beijerinckii. In later
studies, more shuttle vectors were constructed either from the plasmids of other gram-
positive bacteria (Truffaunt et al., 1989) or from cryptic plasmids of clostridia (Yoshino
et al., 1990). During these studies, Mermelstein et al. (1992) found that shuttle vectors
that function in E. coli cannot function in C. acetobutylicum ATCC 824 due to the
presence of a novel restriction enzyme, Cac824I, which recognizes the sequence of 5’-
GCNGC-3’. Apparently this sequence occurs frequently in Escherichia coli plasmids,
such as pBR322 and pUC9, which were used in vector construction. To solve this
problem, the φ3t1 gene, which encodes a methyl transferase of the B. subtilis phage φ3T,
was expressed in E. coli through a plasmid, and shuttle vectors were methylated in this
strain of E. coli before electrotransformation into C. acetobutylicum ATCC 824
25
(Mermelstein and Poputsakis, 1993). Transformation of other strains of solvent-
producing clostridia has also been achieved by electroporation (Lee et al., 1992; Birrer et
al., 1994; Nakotte et al., 1998; Li, 1998).
After the advent of reliable and efficient transformation procedures,
nonreplicative integrational plasmids have been successfully used to achieve homologous
recombination, which seems to use Campbell-type mechanism in the solvent-producing
clostridia (Wilkinson and Young, 1994; Green and Bennett, 1996; Green et al., 1996;
Green and Bennett, 1998). Mutants generated by homologous recombination are more
useful than the mutants generated by either chemical mutagens or transposons because
specific genes can be targeted. However, mutations involving gene inactivation are
potentially lethal. Therefore, a method for down regulation of enzyme levels is more
desirable. To achieve down regulation of enzyme levels in solvent-producing clostridia,
Desai and Papoutsakis (1999) used plasmids coding for anti-sense RNA to down regulate
the expression of the genes for butyrate kinase (buk) and phosphotransbutyrylase (ptb) in
C. acetobutylicum ATCC 824. The study showed drastic decreases in acid-forming
enzyme activities; however, there were no changes in final acid concentrations, indicating
that the acid formation fluxes are not controlled by the levels of acid-forming enzymes.
Whether or not this approach is useful for the enhancement of solvent production remains
to be proven.
To study the expression of autologous and heterologous genes in the
solventogenic clostridia and to understand the regulation of the promoters for these
genes, reporter systems are necessary. Tumalla et al. (1999) developed a reporter system
in which the lacZ gene from Thermoanaerobacterium thermosulfurogenes EM1 was used
as the reporter gene in C. acetobutylicum ATCC 824. Detection of β-galactosidase
specific activity, after introduction of the reporter gene into C. acetobutylicum, showed
the functionality and sensitivity of the reporter system. By using this reporter system, the
26
same researchers characterized the promoters of the genes of phosphotransbutyrylase
(ptb), acetoacetate decarboxylase (adc) and thiolase (thl). They found that the ptb
promoter is an early-growth associated promoter, whereas the adc and thl promoters are
active in both acidogenic and solventogenic growth phases. A reporter system was
developed in our laboratory based on an adh gene encoding a primary-secondary alcohol
dehydrogenase (ADH), which was from C. beijerinckii NRRL B593 (Li., 1998). The
secondary ADH activity is not present in C. acetobutylicum ATCC 824 and C.
beijerinckii NRRL B592. After successful transformation of the plasmids carrying this
reporter gene into C. acetobutylicum ATCC 824 and C. beijerinckii NRRL B592,
production of isopropanol was observed in both strains suggesting the functionality of the
reporter system.
D. Metabolic engineering of solvent-producing clostrida
Metabolic engineering of solvent-producing clostridia is necessary in order to
alter the metabolism in a beneficial way, such as to circumvent limiting enzyme activities
for solvent production, low product concentrations and low product selectivities.
Enhancement of acetoacetate decarboxylase and CoA-transferase activities via expression
of the genes from a synthetic operon (the ace operon) was reported (Mermelstein et al.,
1993). The three acetone-formation genes (adc, ctfA and ctfB) were transcribed from the
adc promoter, and relative to the plasmid-free strain, the plasmid-carrying strain of C.
acetobutylicum ATCC 824 produced 95 % more acetone with 50 % higher yield (g/g) of
solvents on glucose.
Two of the acid-formation genes (buk and pta) of C. acetobutylicum ATCC 824
were knocked out by homologous recombination (Green et al., 1996). Despite the
absence of specific activities of phosphotransacetylase and butyrate kinase in cell-free
extracts, the mutant strains still produced butyrate and acetate at a lower level. Besides
suggesting the broad substrate range of the acid-forming enzymes, these results suggested
27
the presence of isoforms of phosphotransacetylase and butyrate kinase. Recently, another
buk gene (bukII) was discovered in C. acetobutylicum ATCC 824 (Huang et al., 2000).
Solvent analysis of the mutant strains showed that the pta- mutant strain produced
solvents comparable to the amounts produced by the wild type strain and maximum n-
butanol/acetone ratios were similar. However, the solvent ratios produced by the buk-
mutant strain were approximately twice as high and the mutant produced 10 % more n-
butanol and 50 % less acetone than the wild–type (Green et al., 1996).
Heterologous expression of clostridial genes in E. coli is also possible. A
synthetic operon (ace4) coding for adc, ctfA, ctfB and thl was successfully expressed in
E. coli under the control of the thl promoter. Up to 150 mM acetone was produced in the
fed-batch cultures of the recombinant strain (Bermejo et al., 1998). Expression of the
primary-secondary ADH of C. beijerinckii NRRL B593 in E. coli enabled the
transformant to produce isopropanol from added acetone (Peretz et al., 1997; Li, 1988).
Current use of solvents and their synthesis
n-Butanol:
Commercial derivatives of n-butanol (n-butylacrylate and methylacrylate) are
used in emulsion polymers for latex paints, in textile applications and in impact modifiers
for rigid polyvinyl chloride (Billig, 1999). n-Butanol is currently synthesized from n-
butyraldehyde, which is obtained from the Oxo reaction of propylene. Approximately 10
billion lbs. of n-butanol were produced worldwide by petrochemical processes (Chemical
and Engineering News, 1990).
B. Acetone:
Acetone is used as a carrier for acetylene, in the manufacture of a variety of
coatings and plastics, and as a raw material for the chemical synthesis of a wide range of
products such as ketene, bisphenol A, diacetone alcohol and isoprene (Howard, 1999).
Acetone is currently obtained as a coproduct of the process of phenol from cumene.
28
Isopropanol
Isopropanol is used for the production of acetone and other chemicals. It is an
excellent low-cost solvent. Many aerosol products contain isopropanol in their
formulations. It is also used as an antiseptic and disinfectant (Logsdon, 1999).
Isopropanol is currently synthesized from propylene by an indirect hydration reaction that
is based on a two-step reaction of propylene and sulfuric acid (Logsdon, 1999).
Based on a worldwide estimate made in 1997, acetone and isopropanol are listed
among the leading petrochemicals with 3 million tons of acetone/year being used and 2
million tons of isopropanol /year being used (Wilke, 1999).
Part II.
Nitrogen metabolism of the solvent-producing clostridia
A. Nitrogen requirement of the solvent-producing clostridia
The initial commercial solvent fermentation (the Weizmann process) used starchy
raw material and the organism C. acetobutylicum. When corn mash (8%, w/v) was the
fermentation medium, neither additional nutrients nor pH control was necessary. When
the fermentation was switched to use molasses as the carbon substrate, additional
nutrients, such as yeast-extract, malt sprouts and corn steep liquor, had to be added to the
molasses-based medium to satisfy the need for nitrogen and vitamins. Ammonia or its
salts, such as ammonium sulfate, ammonium chloride, ammonium nitrate, ammonium
acetate and ammonium hydroxide, were all used as additives to meet the need for
nitrogen in the molasses-based medium. In these studies, it was well established that the
nitrogen source strongly influences growth and solvent production. In an early study, for
instance, Tatum et al. (1935) isolated an active substance, which was asparagine, that
stimulated solvent production in complex medium cultures of C. beijerinckii.
After the 1980’s, research on nitrogen metabolism focused mainly on the effect of
nitrogen limitation on the onset of solvent production. Gottschal and Morris (1982)
29
reported that ammonium chloride-limited continuous cultures of C. beijerinckii NCIMB
8052 did not produce solvents at pH 5.7. However, low levels of solvent production by
C. acetobutylicum DSM 1731 in nitrogen-limited continuous cultures at pH values
between 5.4 and 4.3 were reported by Andersch et al. (1982). In a study using C.
saccharobutylicum NCP 262, Long et al. (1984b) observed that the concentration of
ammonia affected the consumption of glucose and, at low ammonia concentrations,
glucose utilization significantly decreased. At the end of fermentation, some glucose
remained in the medium and the cells failed to produce solvents. Studies by Monot et al.
(1983), Jobses et al. (1983) and Roos et al. (1984) also reported low levels of solvent
production in nitrogen-limited cultures but none of these studies revealed a clear
relationship between a limitation of nitrogen source and either the onset or maintenance
of solvent production.
B. Biological nitrogen fixation
Biological nitrogen fixation is catalyzed by the enzyme nitrogenase. With one
exception (Ribbe et al., 1997), all known nitrogenases are a complex of two
metalloproteins. Although some organisms contain more than one type of nitrogenase
(Newton, 2002), the extensively characterized conventional nitrogenase is a
molybdenum-containing enzyme and consists of the MoFe protein and the Fe protein.
The MoFe protein is also called component 1 or dinitrogenase and is an α2β2 tetramer,
which contains two types of metal centers, the FeMo-cofactor and the P-cluster (Kim and
Rees, 1993). The iron protein, also called component 2 or dinitrogenase reductase, is a
homodimer and contains 4 Fe atoms organized into a single Fe4S4 cluster (Georgiadis et
al.,1992). All nitrogenase activities require the presence of both components, and the N2
reduction site is believed to be located on the MoFe protein (Burris, 1991). In some
cases, purified MoFe protein from one bacterial species reconstitutes an enzymatically
active hybrid nitrogenase with the purified Fe protein from another species (Detroy et al.,
30
1967 ; Emerich and Burris, 1978). In addition, the amino acid sequences of the
component proteins of nitrogenase are highly conserved and there is an extensive
immunological cross-reactivity between different species (Rennie, 1976; Kessler, 2001).
These observations suggest that the structure of nitrogenase has been remarkably
conserved among evolutionarily different organisms.
The reduction of nitrogen to ammonia is usually described as:
N2 + 8 e- + 8 H+ + n MgATP → 2 NH3 + H2 + n MgADP + n Pi
The reaction requires a minimum of 16 MgATP under laboratory conditions. Under
physiological conditions, the requirement is closer to 20-30 MgATP (Burris, 1991).
Nitrogenase can also use alternative substrates, such as acetylene, hydrogen cyanide,
nitrous oxide and methylisocyanide (Burris, 1991). Among the alternative substrates,
acetylene is commonly used for the measurement of the specific in vivo and in vitro
activities of nitrogenase (Burris, 1972). The reduction of acetylene by two electrons to
ethylene can be easily detected by gas chromatography.
There are two other types of nitrogenase, which are closely related to Mo-
nitrogenase, but neither contains the Mo atom (Eady, 1996). All three nitrogenases are
composed of two separable proteins, component 1 and 2. Component 1 in these
alternative nitrogenases, contains either vanadium or iron instead of molybdenum (Pau,
1994). Alternative nitrogenases exhibit different catalytic properties from those of Mo-
nitrogenase (Bishop and Premarkur, 1992). For example, acetylene is a poor substrate for
the alternative nitrogenases and is reduced to ethane as well as to ethylene (Dilworth et
al., 1987). The production of ethane by alternative nitrogenases was used as a test for the
detection of V-nitrogenase (Dilworth, et al., 1988). V- nitrogenase is also more effective
in substrate reduction at lower temperatures than Mo-nitrogenase (Miller et al., 1988).
31
This result suggests a possible physiological function for V- nitrogenase. Component 1
of the alternative nitrogenases is hexameric with three types of subunits, α, β and δ rather
than the tetrameric form of Mo-nitrogenase with only two types of subunits, α and β
(Eady, 1996). Strains of A. vinelandii with mutations in genes coding for the δ are able to
reduce acetylene under appropriate growth conditions, suggesting that the δ of both the
V- and Fe-nitrogenases are not required for acetylene reduction (Waugh et al., 1995).
In addition to the structural genes (nifH for the Fe protein, nifD and nifK for the α
and β subunits of the MoFe protein), other genes and their products are required for the
maturation of the nitrogenase component proteins and for the regulation of the expression
of nitrogenase genes (Dean and Jacobson, 1992). Although amino acid sequences of the
nitrogenase component proteins are very much conserved between evolutionarily
different organisms, the arrangement of the nif genes can vary significantly among
different phylogenetic groups (Young, 1992; Jacobson et al., 1989). The structural genes
encoding alternative nitrogenase protein components have been designated as vnf
(vanadium nitrogen fixation) and anf (alternative nitrogen fixation) (Raina et al., 1988;
Robson et al., 1989).
C. Nitrogen fixation by the solvent-producing clostridia
Biological fixation of nitrogen by C. acetobutylicum and C. beijerinckii was
demonstrated by using 15N2 (Rosenblum and Wilson, 1949). However, no further study
has been done to understand the effect of nitrogen fixation on solvent production and
growth of these two solvent-producing organisms. Among the clostridial species, the
nitrogen-fixing ability of C. pasteurianum is one of the most well characterized. The first
consistent nitrogen fixation by cell-free preparations was obtained with this anaerobe
(Mortenson et al., 1965), and the sequences of the genes in the nif cluster of C.
pasteurianum have been determined (Chen and Johnson, 1993). The X-ray crystal
structure of the MoFe protein of C. pasteurianum was also determined at a resolution of
32
3.0 Å (Kim and Rees, 1993; Bolin et al., 1993). Mortenson and his coworkers (Daesch
and Mortenson, 1968; Daesch and Mortenson, 1972; Seto and Mortenson, 1974;
Upchurch and Mortenson, 1980) have studied the regulation of nitrogenase synthesis and
nitrogen-fixing activity in C. pasteurianum in batch and continuous cultures. No
nitrogen-fixing activity was found in cultures growing on excess ammonia (Daesch and
Mortenson, 1972). When a fixed nitrogen source is added to a nitrogen-fixing culture of
C. pasteurianum, even though the synthesis of nitrogenase is abruptly stopped, the
enzyme already present remains stable and functional for at least six hours after ammonia
addition. When sucrose catabolism and its relation to nitrogen fixation were studied, the
concentration of nitrogenase in whole cells was found to be two-fold greater than the
amount needed for the nitrogen actually fixed, provided that ATP was not limiting
(Daesch and Mortenson, 1968). When C. pasteurianum is grown on ammonia in the
presence of nitrogen, ammonia is preferentially used and nitrogenase is not synthesized
until the ammonia in the medium is consumed (Daesch and Mortenson, 1972). The in
vitro nitrogenase activity of C. pasteurianum was shown to be very sensitive to changes
in the ADP/ATP ratio (Upchurch and Mortenson, 1980). When nitrogen-fixing cells of
C. pasteurianum are given a good nitrogen source, such as ammonium acetate, the ratio
of ADP/ATP decreases significantly. This decrease in the ADP/ATP ratio in the cell
could cause an increase in the measured in vivo nitrogenase activity and a seemingly
constant level of nitrogenase activity (total units/ml) during the first 2.5 hr after the
addition of ammonia. However, normalization of the measured whole-cell nitrogenase
activity to the ADP/ATP ratio of nitrogen-fixing cells showed that the nitrogenase of C.
pasteurianum had a half life of 1.4 hrs after the addition of ammonia to a nitrogen-fixing
culture. Therefore, the true level of nitrogenase decreased steadily after the addition of
ammonia. The mechanism for the in vivo inactivation of C. pasteurianum nitrogenase is
not known.
33
In order to utilize the nitrogen-fixing activity as an experimental tool for the study
of the regulation of solvent production in the clostridia, a detailed study of the nitrogen-
fixing abilities of the currently recognized strains of C. acetobutylcium and C. beijerinckii
is needed. In this thesis, solvent production in the nitrogen-fixing cultures of C.
beijerinckii NRRL B593 was examined.
34
CHAPTER 2MATERIALS AND METHODS
Microorganisms
Clostridium beijerinckii (formerly known as Clostridium butylicum) NRRL B593
and Clostridium pasteurianum W5 were used in this study. Stock cultures were
maintained as spores in a potato medium at –70 0C. To start the cultures, spores (in 1.0-
mL aliquots) were heat-shocked in boiling water for 2 min, and cultures were grown
anaerobically at 35 0C.
Chemicals
All the inorganic salts, sucrose, glucose, ammonium acetate and ammonium
sulfate were from Fisher Scientific Co. (Pittsburg, PA). Yeast extract, casamino acids,
tryptone and pepticase were from Difco Laboratories (Detroit, MI). The amino acids and
nucleotide bases were either from Sigma Chemical Co. (St Louis, Mo) or from Fisher
Scientific Co. Other chemicals obtained from Fisher Scientific Co. were acids (sulfuric
Table 1. Primers used in sequencing of the 2.3 kb cloned DNA fragment carrying thenifH, glnB-like 1 and part of glnB-like 2 genes of C. beijerinckii NRRL B593
49
Treatment of solutions, laboratory plastics, and other apparatus with
diethylpyrocarbonate (DEPC)
The treatment of solutions, laboratory plastics, and other apparatus by autoclaving
did not ensure the complete elimination of RNAse activity. Therefore, buffers (described
below), stock solutions and water were treated directly with DEPC. Typically, DEPC
was added to solutions, buffers and water to a final concentration of 0.1 % (v/v) then
stirred vigorously with a magnetic stirrer for 20 to 30 min. Following incubation at 37 0C
overnight, DEPC was destroyed by autoclaving for 15 min at 121 0C.
Cleaning of glassware, centrifuge tubes and electrophoretic apparatus
Glassware and centrifuge bottles were soaked in 0.1 % DEPC solution for
overnight, and DEPC was destroyed by autoclaving for 15 min at 121 0C. The
electrophoretic apparatus was washed with 3 % hydrogen peroxide, rinsed with DEPC-
treated water and dried at room temperature. Following a final wash with 70 % ethanol,
the apparatus was dried at room temperature and used. In addition to this primary
treatment, before each use, the apparatus was wiped with RNAse-erase saturated paper
towel (Fisher Scientific Co.) and rinsed with ample amount of DEPC-treated water.
Preparation of buffers and solutions:
1. Cell suspension solution: 350 mM sucrose, 10 mM Tris.Cl, pH 7.6, 1 mM Na2-EDTA
and 5 mM 2-mercaptoethanol.
2. Lysing buffer: 4 M Guanidium isothiocyanate (GITC), 25 mM sodium citrate, 0.5 %
sarkosyl and 0.1 M 2-mercaptoethanol.
3. Lithium chloride solution: 6 M.
4. TE buffer: 10 mM Tris.Cl (pH 8.0), 1 mM Na2-EDTA.
5. TE-SDS solution: 10 mM Tris.Cl, (pH 8.0), 1 mM Na2-EDTA, 0.5% SDS.
6. Sodium acetate buffer: 3 M at pH 6.0.
50
The stock solutions 1, 2, 4 and 5 were prepared in DEPC-treated water and autoclaved for
15 min at 121 0C. The stock solutions 3 and 6 were prepared in distilled water and
treated with 0.1 % DEPC.
Procedure
Cells were harvested by centrifugation at 4200 x g for 10 min at 4 0C,
resuspended immediately in 3 mL of suspension buffer. After addition of a pinch of
lysozyme, the cell suspension buffer was incubated at 37 0C for 5 min and lysis was
achieved by addition of 15 mL of lysing solution. Following lysis, 15 mL of acid phenol
solution (pH 4.3) and 3 mL of chloroform were sequentially added to the lysate and the
mixture was vigorously shaken by hand under a hood for 3 min after each addition.
Separation of the aqueous phase from the organic phase was achieved by centrifugation
at 32,500 x g at 4 0C for 10 min, and nucleic acids were then precipitated from the
aqueous phase by addition of equal volume of isopropanol (~ 20 mL) and centrifugation
for 15 min at 32,500 x g at 4 0C. The pellet was then resuspended in 2.5 mL of TE buffer
and RNA was selectively precipitated by addition of 5 mL of 6 M LiCl and centrifugation
at 32,500 x g at 4 0C for 20 min. The subsequent pellet was then dissolved in 10 mL of
TE-SDS and 5 mL of chloroform was added to this solution. After vigorous shaking for
5 min, the aqueous phase was then separated from the organic phase, which contained
SDS precipitate. The RNA in the aqueous phase was precipitated by addition of 0.8 mL
of 3M sodium acetate (pH 6.0) and an equal volume of isopropanol. After 15 min of
centrifugation at 32,500 x g at 4 0C, the RNA pellet was washed with an ice-cold ethanol
(80%), dried at 37 0C and dissolved in 250 µL of DEPC-treated water containing 0.05 %
SDS.
51
Storage and thawing of RNA samples
The RNA samples were stored at –70 0C in 1.5-mL eppendorf vials in 50 µL
aliquotes. Before use, the samples were quickly thawed at 37 0C in a water bath and kept
on ice during preparation for gel electrophoresis.
Quantification of RNA
RNA concentration was determined by measuring the absorbance at 260 nm (1
A260 unit of ssRNA= 40 µg/mL). To assess the purity of the samples, absorbance at 280
nm was also measured and the ratio was calculated. Samples yielded A260/A280 ratio of
1.5 to 2.0.
Agarose gel electrophoresis of RNA samples
Samples of total RNA were routinely resolved using formaldehyde-agarose gel
electrophoresis. High melt agarose gels, 0.7 % (w/v), were prepared in 1X MOPS buffer
containing 0.4% ethidium bromide. RNA samples were prepared by mixing 1 volume
with 3 volumes of gel loading buffer which contained 10 µL of 10X MOPS buffer, 18 µL
of 36 % formaldehyde and 50 µL of diionized formamide (total volume is 78 µL) .
Electrophoresis was conducted at 45 V in 1X MOPS buffer.
Quality control of the RNA preparations
The integrity of the RNA samples was assessed by visual examination of ethidium
bromide-stained electrophoretically separated RNA spices under a UV light. The clear
observation of the ribosomal 23S (~2.9 kb) and 16S RNA (~ 1.5 kb) species
demonstrated the integrity of the samples.
Northern transfer
Following electrophoresis, the RNA species were routinely transferred to
positively charged nylon membranes (Hybond-N+) for 16 to 18 hr by capillary elution
with 20X SSC. The membranes were then dried at room temperature. Fixation of RNA
to the membrane was achieved by irradiation with UV light at 254 nm. Washing steps
52
suggested by the traditional procedures (Farrel, 1998) were not performed to prevent
degradation of the RNA species during or after the transfer as suggested by Darling and
Brickel (1994).
Reprobing the Northern blots
Stripping the membrane with 0.1 % hot (boiled) SDS solution caused either total
disappearance or a significant decrease in the signal intensity of the bands during
reprobing. Therefore, the Northern blots were not reprobed other than for the purpose of
detecting 16S rRNA species.
Generation of probes for analysis of the nif and sol transcripts
The probes for analysis of the nif and sol transcripts were generated by PCR using
the sequences in the nif and sol clusters of C. beijerinckii NRRL B593. The names of the
forward (upstream) and reverse (downstream) primers and their corresponding sequences
are listed in Table 2 and Table 3, respectively. PCR amplification of the gene fragments
was performed in a 50 µL reaction volume as described in the amplification of the nifH
gene.
Northern hybridization and detection of transcripts
Hydridization conditions, labeling of the probes and detection of the signals were
carried out as described in Southern experiments. However, when the standard procedure
recommended by ECL handbook was followed, extraneous dots, blotches and other types
of background were observed in Northern blots. To diminish the background formation
and randomly-formed spots, several methods have been tested. Replacement of gold
hybridization buffer with a traditionally used hybridization buffer (Anderson and Young,
1985), which contained 100 µg/mL denatured salmon sperm DNA did not decrease
background formation. Replacement of prehybridization buffer with a fresh batch after
completion of prehybridization also failed to remove background formation, randomly-
formed spots and blotches. However, among the tested alternatives, a simple technique
53
called multiple sandwich method (Jones and Jones, 1992), which involved the use of two
layers of filter paper effectively eliminated background formation, random spots and
blotches. Briefly, two pieces of filter paper (3 MM) were cut to a size slightly larger than
the membrane and saturated with hybridization solution. The membrane was then
sandwiched between the two pieces of filter paper and good contact was ensured by
rolling a 5-mL pipette over the filter paper. The sandwich was placed in a 50-mL conical
roller tube, which contained 5 to 10 mL of the hybridization buffer.
Estimation of the size of RNA fragments
The size of RNA fragments was estimated by using two different RNA ladders.
The RNA ladders were from New England Biolabs, Inc. (Beverly, MA, USA) and from
Gibco BRL Life Tech (Rockville, MD, USA). The ladder from New England Biolabs is
a set of seven RNA molecules produced by in vitro transcription of a mixture of seven
DNA templates. The ladder sizes are: 9000, 7000, 5000, 3000, 2000, 1000, and 500
bases. The 3000-base band is at a higher intensity to act as a reference. The ladder from
Gibco BRL Life Tech is a series of six synthetic poly(A)-tailed RNAs. The ladder sizes
are : 9490, 7460, 4400, 2370, 1350, and 240 bases.
Internal control used in Northern blots
To minimize misinterpretation of results, 16S rRNA genes was used as the
internal control in Northern blots, because the expression of 16S rRNA gene is less
subjected to biological variation (Correa et al., 1992 ; Farrell, 1998 ; Toshihide et al.,
2000). The probe for 16S rRNA species was generated by PCR using the primers 27f
(5’-AGAGTTTGATCCTGG CTCAG) and 1592r (5’-AAGGAGGTGATCCAGCCGCA)
(Johnson, 1994) and the PCR conditions were described for the amplification of the nifH
gene.
54
Name of theprimer pair
Sequence
Locationof thefirstbase
Designedfrom thesequence of
NifHF1
NifHR1
5’-GGWTGTGAYCCWAAGGCWG
5’-AKWGCCATCATYTCWCC
886
1225
nifH
nifH
GlnB2F 2185
NifDR 211
5’-AACTGGAGAAAAAGGTGC
5’-GTTCTGCTGATTGAGATAC
3810
4852
glnB-like 2
nifD
NifEF 8101
NifER 84
5’-GGCTTTGCCACAATACGGAAC
5’-ATCCTCAAGCCCCACAAAAC
8096
9223
nifE
nifE
NifNF 479
NifNBR 4155
5’-TGGGAGTTGCCTTTTGTG
5’-GGGCTTTTTTTGTTACTTCCTC
9617
11813
nifNB
nifNB
FDF 12657FDR 13050
5’-GAAGAAATGCCTACAGCC5’-TACTACTTTTCCGCCTTC
1265713047
fdxA
fdxA
NIRJ1F13712NIFCL3’R22
5’-GGGCATTATTGTTTTCTGGAG5’-GGATGATTTTTGGGCAGAGG
1371214561
nirJ1
nirJ1
NIRJ1F 13712
NIRDR 16183
5’-GGGCATTATTGTTTTCTGGAG
5’-GGGTCACTAATCATTTGTATCATCC
13712
14651
nirJ1
nirD
NIRDHF15675
NIRDHR16106
5’-CATTCCAAAACTTTATGCGG
5’-AACTCATTATTTCTTCCAAACCAG
15675
16093
nirD
nirD
NIFVF16513
NIFVR 18884
5’AACTGCAGCACGAGAAAGATAAGGAAAG
5’-AAGGATCCCCCACGCAATAAAATAAG
16513
18884
nifVωnifVα
Table 2. Sequences of the primer pairs used to generate probes from the nif clusterof C. beijerinckii NRRL B593 for analysis of the nif transcripts.
p-aminobenzoic acid, biotin and folic acid) in addition to the nutrients present in the
DBM. The growth characteristics in the SDM compared well with those in the complex
medium. C. beijerinckii produced solvents in the SDM over five successive transfers
indicating that the added amino acids and some of the vitamins were crucial to solvent
production, although the nature of the stimulatory effect on solvent production is not
known.
62
INTRODUCTION
The production of n-butanol and acetone or isopropanol by the solvent-producing
clostridia involves a metabolic switch from acid production to solvent production (Girbal
and Soucaille, 1998). The factors that might have an effect on the metabolic switch have
been extensively studied (reviewed in Jones and Woods, 1986 ; Girbal and Soucaille,
1998; Dürre, 1998). The ability of C. acetobutylicum to grow on chemically defined
media has facilitated the determination of the effect of media components on growth and
solvent production (Monot et al., 1982 ; Monot and Engasser, 1983 ; Jobses and Roels,
1983 ; Long et al., 1983; Bahl et al., 1986 ; Soni et al., 1987a). Both the initiation and the
maintenance of solvent production have been shown to depend on the availability of a
carbon and a nitrogen source. Investigation of the effects of varying glucose and
ammonium concentrations on solvent production by C. saccharobutylicum NCP 262 in a
defined medium showed that at low concentrations of glucose (less than 10 g/L) and
ammonium (less than 0.3 g/L of diammonium hydrogen phosphate), growth was limited,
the concentration of acid end-products was low, and solvent production did not occur
(Long et al., 1984a). In addition, the concentration of ammonium in the medium affected
glucose utilization and, at low ammonium concentrations, some glucose remained
unfermented. Similarly, the absence of solvent production in either glucose- or
ammonia-limited continuous cultures grown in a defined medium has been shown with
C. beijerinckii NCIB 8052 (Gottschal and Morris, 1981), C. acetobutylicum DSM 1731
(Andersch et al., 1982) and C. beijerinckii LMD 27.6 (Jobses and Roels, 1983).
However, the ammonium-limited cultures of C. beijerinckii NCIB 8052 fermented
considerably more glucose than is required for growth and, at the growth limiting
concentration of ammonium, practically no glucose remained in the medium. This result
is contrary to those obtained in batch cultures of C. saccharobutylicum NCP 262, and in
continuous cultures of either C. acetobutylicum DSM 1731 or C. beijerinckii LMD 27.6.
63
Contrary to the results obtained with C. saccharobutylicum NCP 262 (Long et al.,
1984a), C. beijerinckii NCIMB 8052 (Gottschal and Morris, 1981) and C. acetobutylicum
DSM 1731 (Andersch et al., 1982), the production of significant levels of acetone and n-
butanol (total of 8.5 g/L solvents) in a defined medium by C. acetobutylicum ATCC 824,
when grown in ammonium-limited either continuous or batch cultures was reported
(Monot and Engasser, 1983). The reason for the discrepancy among the reported data
may be explained by a close examination of the medium compositions, which differed
not only in the type and concentrations of nitrogen sources but also in the composition
and concentrations of other ingredients (Table 1). In addition, because these are different
organisms, their genetic make up may be another factor contributing to the difference in
results.
By using defined media, either phosphate or sulfate limitation has been shown to
be a suitable growth-limiting factor for inducing solvent production in continuous
cultures (Bahl and Gottschalk, 1982). The use of magnesium limitation gave variable
results and iron limitation induced a shift to lactate production (Bahl et al., 1981). A
defined minimal medium was used to study sporulation in C. saccharobutylicum NCP
262 (Long et al., 1983). A detailed investigation using a defined medium revealed the
requirement for p-aminobenzoic acid for high solvent production in continuous cultures
of C. acetobutylicum ATCC 824 (Soni et al., 1987b).
The growth medium for C. beijerinckii (formerly C. butylicum ) is normally
supplemented with yeast extract, tryptone, or similar complex nutrients. The complex
growth medium is not suitable for a study of nitrogen metabolism and solvent production.
There were efforts toward the use of defined media to identify critical nutrients for C.
beijerinckii. In an early study, several vitamins, asparagine and tryptophan were added to
a defined medium and tested to determine the growth-stimulating nutrients for C.
beijerinckii (McDaniel et al., 1939). Although the study failed to identify the growth-
64
stimulating nutrients, it highlighted the need for complex nutrient sources for satisfactory
growth of this species. As a trait for differentiating C. butyricum from C. beijerinckii,
strains of C. beijerinckii (e.g., VPI 5481 [ATCC 25752] and VPI 4420 [ATCC 17778] )
are unable to grow after three serial transfers in a glucose-mineral salts-biotin medium
which does not contain both iron and molybdenum (Cummins and Johnson, 1971).
However, earlier studies in our laboratory showed that, although C. beijerinckii NRRL
B593 cannot produce solvents in a defined basal medium, sustained growth occurred if
additional mineral salts were added to the glucose-mineral salts-biotin medium
(Gunatilake M. K. and Chen J.-S. 1991, unpublished data).
In this study, a defined medium for C. beijerinckii NRRL B593 was developed for
the study of nitrogen metabolism and solvent production. The medium contained three
amino acids and eleven vitamins in addition to the components of the defined basal
medium. Growth of C. beijerinckii NRRL B593 in the defined medium was comparable
to that observed in complex media.
65
Component g/L ( Long etal., 1984a)
g/L (Gottschaland Morris,1981)
g/L (Anderschet al., 1982)
g/L (Monot etal., 1983)
Glucose 60 20 54 45
K2HPO4 1 1 0.5
KH2PO4 1 1 0.5
CH3COONH4 1
NH4Cl 0.4 0.4
(NH4)2HPO4 6
Biotin trace trace trace 0.01
p-Aminobenzoicacid
0.001 trace 0.002
Thiaminehydrochloride
0.001 0.002
MgSO4 7H2O 0.2 0.4 0.2
MnSO4 4H2O 0.01 0.015
FeSO4 7H2O 0.01 0.015 0.01
ZnSO4 7H2O 0.005
Na2Mo O4
2H2O0.01 0.01
CaCl2 6H2O 0.01
Na2S2O4 0.035
CaCO3 20
NaCl 0.01
Trace saltsolution
4 ml/L 2 ml/L
L-Cysteine 0.5
Table 1. Comparison of the media compositions used in determination of the effect
of ammonia limitation on production of solvents. The media differed not only in thetype and concentrations of nitrogen sources but also in the composition andconcentrations of other ingredients.
66
RESULTSGrowth of C. beijerinckii in a defined basal medium (DBM)
The growth and solvent production of C. beijerinckii NRRL B593 in DBM was
measured for each of five serial transfers (Table 2). An average optical density of 1.1 ±
0.4 at 600 nm was reached within two days in each serial-transfer culture. To allow for
production of solvents, the cultures were further incubated for up to six days. Poor
solvent production (less than 10 mM) was observed in all serial-transfer cultures. The
lack of good solvent production in DBM reflected the requirement for previously
undefined nutritional factors that enhance solvent fermentation by C. beijerinckii NRRL
B593.
Substitution of yeast extract with amino acids and vitamins
A starting point for formulating a chemically defined medium that will allow
good solvent production by C. beijerinckii is to test complex nutrient sources in the
defined medium for enhancement of solvent production. Potato broth (PB), casamino
acids and yeast extract were individually tested as an additive to DBM at various
concentrations for stimulatory effects (Table 3). The addition of potato broth (50 ml/L)
enhanced solvent production. Production of 62 mM of n-butanol and 32 mM of
isopropanol was observed after 66 hr of incubation. However, the growth in potato
supplemented DBM was slow with a doubling time of 16 hr and the maximum optical
density of 2.0. The addition of casamino acids also enhanced solvent production in
DBM. The growth in casamino acid-supplemented medium was much faster than the
growth in potato supplemented medium. With a doubling time of 7 hr and the maximum
optical density of 5.9, 58 mM of n-butanol and 36 mM of isopropanol were produced
within 46 hr of incubation. However, the most vigorous growth was observed when yeast
extract (DIFCO laboratories, Detroit, Michigan) was added to the DBM at a
concentration of 5 g/L. With a doubling time of 3 hr, the organism reached a maximum
67
Serial transferIncubation time
(days)O.D at 600 nm
n-Butanol
(mM)
Isopropanol
(mM)
1 4 1.5 ± 0.1 6.2 ± 0.4 0.9 ± 0.1
2 4 1.1 ± 0.2 3.7 ± 0.2 0.5 ± 0.1
3 6 0.8 ± 0.1 2.8± 0.1 0.9 ± 0.1
4 6 1.1± 0.1 1.2 ± 0.5 0.2 ± 0.1
5 6 1.1 ± 0.1 0.8 ± 0.1 0.3 ± 0.1
Table 2. Growth of C. beijerinckii NRRL B593 in DBM
Static cultures were grown in 60 mL serum bottles containing 20 mL of DBM, which wasprepared under nitrogen. An actively growing PM culture was used as the initial inoculum.Subcultures were started with a 10% (v/v) inoculum. Microscopic observations and opticaldensity measurements were made to assess growth. Shown are the averages of two sets ofcultures.
68
SupplementIncubation time
(hr)O.D at 600 nm
n-Butanol
(mM)
Isopropanol
(mM)
Doubling
time (hr)
None 68 1.7 1.2 0.2 22
Potato broth
(50ml/L)66 2.0 62 32 16
Potato broth
(5ml/L)66 1.8 6.5 0.5 22
Yeast extract
(5g/L)57 9.3 69 27 3
Yeast extract
(1g/L)57 2.3 5.7 0.7 8
Casamino acids
(5g/L)46 5.9 58 36 7
Table 3. The effect of complex nutrient supplement on growth and solvent production.
Cultures were grown in DBM supplement with complex nutrients. The head space of the culturewas purged with a stream of nitrogen gas to maintain anaerobic conditions. An activelygrowing culture in PM was used as the inoculum. The cultures (0.7-L) were mixed with amagnetic stirrer throughout incubation, and samples were periodically taken for measurement ofgrowth and solvent production.
69
Amino acidIn Difco Yeast
Extract (mg/g)In DCM (g/L) Amino acid
In Difco Yeast
Extract (mg/g)
In DCM
(g/L)
L-alanine 53.6 0.26 L-phenylalanine 25.3 0.12
L-arginine 30.2 0.15 L-proline 26.0 0.13
L-aspartic acid 66.9 0.33 L-serine 28.4 0.14
L-glutamic acid 142.0 0.71 L-threonine 29.5 0.15
L-glycine 32.5 0.16 L-tryptophan 13.6 0.07
L-histidine 12.0 0.06 L-tyrosine 12.0 0.06
L-isoleucine 32.3 0.16 L-valine 37.9 0.19
L-leucine 46.9 0.23 L-glutamine 0.05
L-lysine 51.5 0.25 L-asparagine 0.05
L-methionine 10.5 0.05 L-cysteine 0.5
Table 4. Amino acid composition of commercial yeast extract (Difco Laboratories, Detroit,MI) and DCM.
70
optical density of 9.3 and produced 69 mM of n-butanol and 27 mM of isopropanol.
Therefore, a DCM containing twenty amino acids, four nucleotide bases and eleven
vitamins was prepared as described in Materials and Methods. This medium also
permitted vigorous growth with high solvent production. The organism reached a
maximum optical density of 10 and produced 60 mM of n-butanol and 25 mM of
isopropanol during 23 hr of incubation. To simplify and optimize DCM, the four
nucleotide bases (adenine, guanine, cytosine and uracil) were systematically eliminated
from the medium, and ammonium acetate substituted for ammonium sulfate.
To further simplify the medium, the amino acids beneficial for growth and solvent
production were determined in omission studies. In these experiments, amino acids were
added to the partly optimized medium at a concentration equivalent to what are present in
5 g/L of yeast extract (Table 4). In each test medium, one amino acid was omitted to
study the effect of that amino acid on growth and solvent production. A medium that
contained all of the tested amino acids (positive control producing 80 ± 7 mM of n-
butanol) and a medium that did not contain any of the tested amino acids (negative
control producing 12.1 ± 1.7 mM of n-butanol) were included as controls. Static cultures
were incubated for 84 hr at 35oC and analyzed for solvent production. The omission of
any of the following seven amino acids (L-tyrosine, L-methionine, L-leucine, L-lysine,
L-glutamic acid, L-arginine and L-histidine) did not decrease the level of solvent
production (an average of 79 ± 7 mM of n-butanol was produced). Omission of L-
tryptophan, L-aspartic acid, L-serine, L-threonine, L-asparagine and L-glutamine caused
a slight decrease in solvent production (an average of 57 ± 8 mM of n-butanol was
produced). Omission of L-proline, L-glycine, L-phenylalanine, L-alanine, L-valine and
L-isoleucine caused a significant decrease in solvent production (an avarage of 18 ± 10
mM of n-butanol). However, the most significant drop was always observed when either
L-alanine or L-valine or L-isoleucine were omitted from the medium (an average of 11.7
71
± 2.6 mM of n-butanol was produced). Therefore, L-alanine, L-valine and L-isoleucine
were considered to be effective in stimulating solvent production by C. beijerinckii
NRRL B593 grown in defined medium.
Verification of the effect of L-alanine, L-valine and L-isoleucine on solvent
production
The identification of there amino acids that affect solvent production was based
on the traditional omission method (Niven, 1944, Jensen and Hammer, 1993, Cocaign-
Bousquet et al., 1995). Although the omission method is simple in principle, it is tedious
and has been shown to be unreliable, particularly for organisms that require multiple
nutrients whose absence limit the growth (van Neil and Hahn-Hagerdal, 1999).
Therefore, it is necessary to verify the results of the omission studies by additional
experiments.
Two sets of experiments were performed. In the first set, the omission study was
repeated with a total of five amino acids (L-alanine, L-valine, L-isoleucine, L-leucine and
L-proline); three of which had been determined in the preceding omission studies to have
a stimulating effect on solvent production. Two control cultures, one of which contained
all of the five amino acids and the other contained none of the five amino acids, were
included. The growth and solvent production in these cultures were measured through
four serial transfers and, in each serial transfer culture, solvent concentrations were
measured after six days of incubation. Except for the medium that did not contain any of
the tested amino acids, all the other media supported good solvent production (more than
40 mM of n-butanol) after the initial transfer. This result may have been caused by
nutrient carryover from the inoculum. After the first serial transfer, however, solvent
production dropped sharply and, by the fourth serial transfer, the media lacking either L-
alanine or L-valine or L-isoleucine supported the production of 11± 6 mM of n-butanol.
This level of solvent production is approximately equal to the level of solvent production
72
observed in the previous omission experiments. In addition, the lowest solvent
production was again obtained with the medium that lacked all of the tested amino acids.
In the fourth serial transfer, the cultures grown in the medium that lacked all of the tested
amino acids produced 4.0 ± 0.4 mM of n-butanol, whereas the positive control cultures
grown in the medium that contained all of the tested amino acids produced 34 ± 3 mM of
n-butanol.
In the second set, cultures were grown in DBM with ammonium acetate as the
nitrogen source. The formulation was manipulated by either including or omitting the
amino acids and vitamins (Figure 1). Among the formulations, the medium
supplemented with three amino acids (L-alanine, L-valine and L-isoleucine) and eleven
inositol, folic acid, p-aminobenzoic acid and biotin) supported the production of the
highest concentrations of solvents. With a doubling time of 7 hr and a maximum optical
density of 4.0, the culture produced 81 mM n-butanol and 22 mM isopropanol during 64
hr of incubation. When amino acids (L-alanine, L-valine and L-isoleucine) and vitamins
(except biotin and p-aminobenzoic acid) were omitted from the medium, a 16-fold
decrease in n-butanol and a 13-fold decrease in isopropanol concentrations were
observed. With a doubling time of 8 hr and a maximum optical density of 1.3, the culture
produced 5.0 mM of n-butanol and 1.6 mM of isopropanol after 64 hr of incubation.
When only amino acids (L-alanine, L-valine and L-isoleucine) were omitted from the
medium, an average of 6-fold decrease in n-butanol and isopropanol production was
observed. With a doubling time of 7 hr and a maximum optical density of 1.7, 13 mM n-
butanol and 4.0 mM isopropanol were produced
73
1
10
100
0 10 20 30 40 50 60 70
Prod
uctio
n of
n-b
utan
ol (
mM
)
Incubation time (hr)
Figure 1. Effect of L-alanine, L-valine, L-isoleucine and vitamins on the production of n-butanol by C. beijerinckii NRRL B593. The cultures were grown in 0.7 L of DBM with ammoniumacetate as the nitrogen source and supplemented with amino acids or vitamins or both. An activelygrowing culture in PM was used to inoculate 45-mL DBM prepared in 160-mL serum bottles under
nitrogen. These cultures were allowed to grow at 35 0C without shaking and used as the inoculum forthe 0.7-L cultures, which were continuously mixed throughout incubation. Shown are the resultsfrom the second serial transfer cultures that were grown under nitrogen. The symbols represent n-butanol production in media with the following supplements: , L-alanine, L-valine, L-isoleucine, andeleven vitamins ,L-alanine, L-valine, L-isoleucine, p-aminobenzoic acid and biotin; , elevenvitamins ; , biotin and p-aminobenzoic acid.
74
after 64 hr of incubation, indicating the crucial contribution of these amino acids to a high
solvent productivity.
Comparison of growth and solvent production in SDM and TYS
The present formulation of SDM, which contains three amino acids (in addition to
L-cysteine) and eleven vitamins, is capable of supporting growth and solvent production
of C. beijerinckii NRRL B593 comparable to that achieved in TYS. Figure 2 shows a
comparison of solvent production and growth between cultures grown in SDM and TYS.
The growth and solvent production patterns in SDM were similar to that observed in
TYS. The acidogenic growth phase in both media were visually characterized by
observation of highly motile, vegetative cells. After the switch to solvent production,
cells became sluggishly motile, and towards late exponential and stationary growth
phases, virtually nonmotile cells were observed in both media. Several differences,
however, were observed in the fermentation patterns under these two culture conditions.
In SDM (considering the second serial transfers), a doubling time of 10 ± 2 hr with a
maximum optical density of 3.0 ± 1 was observed, whereas in TYS cultures, a shorter
doubling time of 6.5 ± 0.5 hr and a maximum optical density of 8 ± 0.5 was observed.
An average doubling time of 4.0 hr in a synthetic medium and 2.5 hr in a complex
medium has been reported for C. acetobutylicum ATCC 824 (Monot et al., 1982). In
addition, the cultures grown in SDM produced an average of 62 ± 7 mM n-butanol and
25 ± 4 mM isopropanol respectively, after an incubation period of 57 hr. The cultures
grown in TYS produced an average of 75 ± 10 mM n-butanol and 29 ± 3mM isopropanol
respectively, after an incubation time of 32 hr. The shift into active solvent production
occurs later in SDM (after 15 to 20 hr of incubation) than it does in TYS (after 2 to 3hr of
incubation) under these culture conditions with 10 % (v/v) inoculum size. The reason for
75
Figure 2. Growth, n-butanol and isopropanol production in cultures of C. beijerinckii NRRLB593 grown in SDM (A) and TYS (B). SDM contained ammonium acetate (4g/L), L-alanine(0.268 g/L), L-valine (0.189 g/L) and L-isoleucine (0.162 g/L) as the nitrogen source. TYS containedyeast extract (5g/L) and tryptone (1g/L). An actively growing culture in PM was used to inoculatethe media in serum bottles. These cultures were allowed to grow without shaking and used as theinoculum for 0.7-L cultures which were grown under nitrogen and continuously mixed throughoutincubation. Shown are the averages of three sets of cultures grown in SDM and two sets of culturesgrown in TYS.
(A)
0.1
1
10
100
0 10 20 30 40 50 600.1
1
10
100
0 10 20 30 40
: n-b
utan
ol (
mM
)
: Iso
prop
anol
(m
M)
: O.D
600
: n-b
utan
ol (
mM
)
: Iso
prop
anol
(m
M)
: O.D
600
Incubation time (hr)
(B)
76
the slower growth in the defined medium can be attributed to the need for de novo
synthesis of other amino acids.
Determination of sustained growth in SDM
To make sure of the sustained growth and solvent production in SDM, growth and
solvent production was followed through 5 successive transfers in SDM. The results
showed no significant changes in growth (an average doubling time of 11.5 ± 1.5 hr and
an average final cell densities of 2.6 ± 0.4 ), demonstrating that SDM was able to sustain
growth of C. beijerinckii NRRL B593 for at least 5 serial transfers (Figure 3). However,
decreases (up to 2.2 fold when the second serial transfer cultures were compared with the
fifth serial transfer cultures) were observed in final solvent concentrations after each
serial transfer. To rule out that the decrease in solvent production is due to the gradual
exhaustion of the nutrients present in the original inoculum, at the fifth serial transfer an
additional flask was included, which contained 5 g/L yeast extract-added SDM. The
culture grown in yeast extract-added SDM also produced the lower level of solvents (30
mM of n-butanol and 10 mM of isopropanol after 67 hr of incubation) supporting the
possibility of degeneration (the loss of solvent-producing ability). Similar observations
were made with C. beijerinckii NRRL B592 (formerly known as C. butylicum NRRL
B592) in batch cultures grown in a complex medium (Gapes et al., 1983) and with C.
beijerinckii LMD 27.6 in continuous cultures grown in a defined medium (Jobses and
Roels, 1983). In batch cultures, after the third serial transfer, C. beijerinckii NRRL B592
degenerated rapidly and, by the sixth serial transfer, no solvent production occurred.
Amino acids as the nitrogen source
To test whether the three amino acids, L-alanine, L-isoleucine and L-valine, could
serve as the sole nitrogen source to support growth and solvent production, cultures of C.
beijerinckii were grown in SDM without ammonium acetate (Figure 4). To prevent the
77
0.1
1
1 0
1 0 0
0 1 0 2 0 3 0 4 0 5 0 6 0
Incubation time (hr) Incubation time (hr)
(A) (B)
0.1
1
10
100
0 20 40 60 80 0.1
1
10
100
0 20 40 60 80
Incubation time (hr)Incubation time (hr)
(C) (D)
: OD
6000
:n-b
utan
ol (
mM
):i
sopr
opan
ol (
mM
)
: OD
6000
:n-b
utan
ol (
mM
):i
sopr
opan
ol (
mM
)
: OD
6000
:n-b
utan
ol (
mM
):i
sopr
opan
ol (
mM
)
: OD
6000
:n-b
utan
ol (
mM
):i
sopr
opan
ol (
mM
)
0.1
1
1 0
100
0 1 0 2 0 3 0 4 0 5 0 6 0 7 0
Figure 3. Serial transfer experiment for assessment of sustained growth and solventproduction of C. beijerinckii NRRL B593 in SDM. An actively growing culture in PMwas used to inoculate SDM in serum bottles under nitrogen. These cultures were allowed
to grow at 35 0C without shaking and used as the inoculum for 0.7-L cultures, which weregrown under nitrogen and continuously mixed throughout incubation. Shown are theaverages of two sets of cultures for the second (A), third (B), fourth (C) and fifth (D) serial
transfers.
78
organism from fixing nitrogen, the head space of the cultures was sparged with argon in
place of nitrogen. An average optical density of 0.5 ± 0.1 was reached after 84 hr of
incubation without a significant level of solvent production. Although growth was slow
(an average doubling time of 15 ± 2 hr) and no significant level of solvent production
occurred, microscopic observations, foam formation at surface, gas production during
exponential growth phase, and an increase in optical density revealed growth and
indicated that the amino acids L-alanine, L-isoleucine and L-valine can be utilized by C.
beijerinckii as the sole nitrogen source for growth. The cultures grown on these three
amino acids were apparently deficient in nitrogen. This low-nitrogen medium may be
useful for the identification of a threshold concentration of ammonium acetate for normal
growth and solvent production, and the nature of this stimulation may be investigated.
79
Fig 4. Growth of cultures of C. beijerinckii NRRL B593 in SDM in the absence of ammoniumacetate and under argon. The defined medium contained L-alanine (0.268 g/L), L-valine (0.189g/L) and L-isoleucine (0.162g/L) as the nitrogen source. To prepare the inoculum, SDM without
ammonium acetate was placed in serum bottles under argon and inoculated with an activelygrowing culture in PM. These secondary cultures were allowed to grow at 35 0C without shakingand used as the inoculum to grow 0.7-L batch cultures, which were grown under argon and werecontinuously mixed throughout incubation. Microscopic observations and optical densitymeasurements were made to assess growth. Shown are the averages of three sets of cultures.
Incubation time (hr)
0.1
1
0 20 40 60 80 100
OD
at 6
00 n
m
80
DISCUSSIONInitial studies indicated that C. beijerinckii produces solvents poorly when it is
grown in a basal medium containing either sucrose or glucose, plus inorganic salts,
inorganic nitrogen, biotin and p-aminobenzoic acid (Gunatilaka, M. and J.-S. Chen, 1991;
this study). Addition of L-alanine, L-valine and L-isoleucine to this chemically defined
medium, which already contained an ammonium salt as the nitrogen source, significantly
enhanced solvent production and growth. Further supplementation of the medium with
eleven vitamins caused an additional increase in solvent production in comparison to the
control medium, which contained L-alanine, L-valine, L-isoleucine, p-aminobenzoic acid
and biotin (Figure 1). At present, it is not known which vitamin(s), besides p-
aminobenzoic acid and biotin, are responsible for the increase in solvent production.
Similar observations about the effect of amino acids on solvent production were
previously reported in other solvent-producing clostridia. When amino acids were added
to an ammonium acetate-containing defined medium in groups from the same
biosynthetic pathways, in all cases the addition of amino acids shifted the solvent ratio to
higher n-butanol production at the expense of both acetone (except for the glutamic acid
group) and ethanol (except for histidine). The highest level of solvents was obtained
when L-histidine was added to the medium (Masion et al.,1987). A more commonly
used method (single omission approach) was used in this study to elucidate the effect of
each amino acid on solvent production in a defined medium. Three amino acids were
identified that cause increases in solvent production. Because some amino acids seem to
have a positive effect on solvent fermentation of C. acetobutylicum and C. beijerinckii, it
is reasonable to suggest that these amino acids may be preferentially metabolized. Welsh
et al. (1986) investigated such a possibility and found that C. acetobutylicum ATCC 824
can utilize organic nitrogen sources, such as L- glutamic acid and L-glutamine, more
readily than inorganic nitrogen sources, such as ammonium chloride and ammonium
81
sulfate. In addition to this finding, they showed that the use of a combination of
ammonium chloride with L-glutamic acid caused an increase in solvent production rate.
Different amino acids have been reported to enhance solvent production. In a
study with C. acetobutylicum ATCC 824 (Masion et al.,1987), cultures with the addition
of amino acids in the glutamic acid family (L-glutamic acid, L-glutamine, L-proline and
L-arginine) produced less than 50% of solvent level obtained with the control culture
which did not contain added amino acids, whereas in another study with C.
acetobutylicum ATCC 824 (Welsh et al., 1987), addition of L-glutamic acid alone (up to
30 mM) caused an increase in both total solvent concentration and the solvent-production
rate. In addition to the differences in experimental methods, the difference in
observations could be partly due to the effect of other nitrogen sources (ammonium
acetate versus ammonium chloride) in combination with amino acids. The anion of a
nitrogen source could have either an enhancing or limiting effect on metabolism and
solvent formation. Total solvent concentration was reported to be much higher in the
presence of ammonium acetate than in the presence of either ammonium chloride or
ammonium sulfate in the same defined medium cultures of C. acetobutylicum ATCC 824
(Welsh et al., 1986). The reason for the increase in solvent production may be due to an
increase in buffering capacity of the medium, which was provided by an increase in
concentration of acetate anion. Bryent and Blaschek (1988) reported this finding by
comparing solvent production in cultures of C. acetobutylicum ATCC 824 containing
different types of ammonium salts. They provided different levels of buffering capacities
to a defined medium by changing the concentration of phosphate buffer and showed that
cultures grown under low buffering capacity produced n-butanol and acetone. The
increase in solvent production in highly buffered medium is due to maintenance of an
elevated pH, which favors the formation of the less toxic butyrate anion. By preventing
82
the accumulation of undissociated butyric acid, an environment more suitable for growth
is maintained.
Amino acids that cause an increase in solvent production may also differ among
different species of solvent producing clostridia, because different species of clostridia
can use different amino acids as nitrogen sources. For instance, C. pasteurianum, C.
butyricum and C. aceticum can all transport in various amino acids during growth in a
yeast extract-supplemented medium (Szech, 1988), yet their ability to catabolize them as
N sources varies considerably when the amino acids were supplied as single nitrogen
sources. C. butyricum can catabolize ten amino acids and C. pasteurianum can catabolize
three amino acids, whereas C. aceticum cannot catabolize any amino acid even though it
takes up seventeen of them. Although the results in our study showed that addition of L-
alanine, L-valine, and L-isoleucine enhances solvent production by C. beijerinckii NRRL
B593 in defined media, addition of similar amino acids may not have any effect on
solvent production and growth in other strains. In fact, amino acids in the pyruvate
family (L-valine, L-leucine and L-alanine) do not have an effect on solvent production in
cultures of C. acetobutylicum ATCC 824 grown in a defined medium (Masion et al,
1987).
The medium developed in this study can facilitate the study of nitrogen
metabolism and solvent production in C. beijerinckii NRRL B593. The supplemented
defined medium can be used to identify the threshold concentration of ammonium acetate
for normal growth and solvent production. After determining the threshold ammonium
acetate concentration, a relationship between the amount of ammonium acetate and
solvent production may be established for C. beiejrinckii NRRL B593 by gradually
increasing the concentration of ammonium acetate in the medium and studying the
changes in solvent production. The supplemented defined medium can also be used to
study the effect of various nitrogen sources, such as ammonium nitrate, ammonium
83
sulfate and ammonium chloride, on growth and solvent production. The changes in the
concentrations of acetate and butyrate anions, the pH of the culture medium and solvent
ratios can also be monitored for determining the effect of different ammonium sources on
metabolism by C. beijerinckii NRRL B593. Because C. beijerinckii NRRL B593 is a
nitrogen-fixing organism (Rosenblum and Wilson, 1949), the nitrogen-fixing growth
characteristics can also be analyzed in this defined medium. Finally, the effect of other
medium ingredients, such as vitamins and minerals, can be studied to determine the
nutritional requirements of C. beijerinckii NRRL B593 and to further optimize the
medium.
84
CHAPTER 4
Characterization of solvent production in nitrogen-fixing cultures of Clostridium
beijerinckii NRRL B593.
ABSTRACT
n-Butanol, acetone and isopropanol (solvent) production occurs late during
growth in batch cultures of solvent-producing clostridia, and the onset of solvent
production involves regulation at the transcriptional level. Because several solvent-
producing, clostridia including Clostridium acetobutylicum and Clostridium beijerinckii,
are nitrogen-fixing organisms and both nitrogen-fixation and alcohol production
(production of ethanol, n-butanol and isopropanol) are reductant-dependent processes, the
question of how nitrogen fixation might either affect or be affected by the onset and
progression of solvent production in C. beijerinckii NRRL B593 was investigated. The
results showed that the metabolic shift to solvent production occurred early in nitrogen-
fixing cultures and appeared to coincide with a gradual decrease in nitrogen-fixing
activity. Nitrogen-fixing cultures produced an average of 24 ± 5 mM of n-butanol and an
average of 9.0 ± 2 mM of isopropanol within an incubation time of 43 hr. The
production of n-butanol and isopropanol indicates the in vivo activities of solvent-
producing enzymes under nitrogen-fixing growth conditions, but it does not indicate the
levels of these enzymes in the cell. Therefore, the in vitro activities of two solvent-
producing enzymes, butyraldehyde dehydrogenase for the n-butanol-producing pathway
and acetoacetate decarboxylase for the isopropanol-producing pathway, were measured in
cell-free extracts prepared from periodically harvested nitrogen-fixing cells. The
synthesis of the solvent-forming enzymes started early during growth and continued
throughout incubation under nitrogen-fixing conditions. A 2.5-fold increase in the
specific activity of acetoacetate decarboxylase and a 4.5-fold increase in the specific
activity of butyraldehyde dehydrogenase were observed during the first 26 hr of growth.
85
A decrease in culture pH from 6.2 to 5.3 occurred during the first 12 hr period and it was
followed by an increase to 5.5. Northern blot analysis with probes specific for genes
encoding aldehyde dehydrogenase, CoA transferase and acetoacetate decarboxylase
revealed the presence of a 3.7-kb mRNA in cells that both fixing nitrogen and producing
solvents. The intensity of this message did not change significantly throughout the
growth of a nitrogen-fixing culture. When ammonium acetate was added to nitrogen-
fixing cultures, a positive relationship between the amount of supplemented ammonium
acetate and the final concentration of solvents was observed. When C. beijerinckii was
grown in a medium with a limited amount of ammonium acetate, nitrogen fixation did
not occur during the early exponential phase of growth. Depletion of ammonia forced the
cells to fix nitrogen during the later stages of growth. When an initial ammonium acetate
concentration of 4 mM was used, the onset of solvent production coincided with the onset
of nitrogen fixation. A closer examination of solvent concentrations, enzyme activities
and changes in the transcription of the solvent-production and nitrogen-fixation genes
indicated competition for the reducing equivalents by the alcohol-producing enzymes and
nitrogenase.
86
INTRODUCTION
C. beijerinckii NRRL B593 can produce acetic and butyric acids, hydrogen gas
and carbon dioxide during the exponential growth phase. When appropriate growth
conditions are provided, the metabolism of the cells undergoes a shift, and commercially
important amounts of neutral solvents (n-butanol, acetone, isopropanol and ethanol) are
produced. The shift from acid production to solvent production in C. beijerinckii, C.
acetobutylicum and other species of solvent-producing clostridia has been the subject of
many studies (Jones and Woods, 1986; Dürre and Bahl, 1998; Dürre et al., 2002). So far,
these studies have not identified a single factor that triggers the shift from acid production
to solvent production. This situation is partly because the regulation of solvent
production is embedded in a complex network, including sporulation, pH, the
concentration of acid end-products, and the nutrient status of the cell.
C. acetobutylicum and C. beijerinckii were shown to be nitrogen fixers based on
the incorporation of 15N2 into ammonia (Rosenblum and Wilson, 1949). However, their
nitrogen-fixing abilities have not been thoroughly investigated. Recently, the sequencing
of the genome of C. acetobutylicum ATCC 824 revealed a cluster of nif genes (Noelling
et al., 2001, Chen et al., 2001). Similarly, a cluster of nif genes was found in a 16-kb
region of the genomic DNA of C. beijerinckii NRRL B593, which was sequenced in our
laboratory (Toth and Chen, unpublished data).
Both nitrogen fixation and alcohol production (production of ethanol, n-butanol
and isopropanol) are reductant-dependent processes. If both metabolic processes occur
simultaneously, competition for the reducing equivalents between the two processes may
be expected. However, if C. beijerinckii could fix nitrogen during acid-producing phase
of growth, nitrogen gas may serve as a less expensive nitrogen source for solvent
production. Furthermore, the nitrogen-fixing reaction is energy intensive. The ATP-
producing reactions (substrate-level phosphorylation) in the fermentative anaerobes
87
generate, as by-products, a large amount of excess reductant, which may be sufficient for
both nitrogen fixation and solvent production. In the present study, experiments were
carried out to study solvent production in nitrogen-fixing cultures of C. beijerinckii
NRRL B593. Several questions were asked. First, solvent production is considered to be
a stress-induced response and can be initiated under artificially created stress conditions.
Because the nitrogen-fixing growth condition is a stress to the cell, will the initiation of
solvent production occur earlier under nitrogen-fixing growth conditions? Second,
Bryant and Blaschek (1999) reported that the addition of ammonium salts to either a
defined or a complex medium could be detrimental to solvent production unless enough
buffering capacity was provided. Under nitrogen-fixing growth conditions, the medium
contains very little ammonium. Will nitrogen-fixing growth circumvent the detrimental
effect of a pH drop due to ammonia consumption? Third, a negative relationship was
observed between the growth rate and the onset of solvent production (Ahmed et al.,
1989) as fast growing cultures fail to produce solvents. Because the growth rate of
nitrogen-fixing cultures is slower than that of the non-nitrogen-fixing cultures, would the
nitrogen-fixing growth condition favor an earlier onset of solvent production? Fourth,
because both nitrogen fixation and alcohol production (production of n-butanol,
isopropanol and ethanol) are reductant-dependent processes, will there be a competition
for the reductant between the two processes? Will the transition into the nitrogen-fixing
mode of growth affect the onset and maintenance of solvent production? Will solvent
production affect nitrogen fixation? Fifth, when a fixed nitrogen source is added to
nitrogen-fixing cultures, how will this change in nitrogen status of the medium affect
solvent production? Answers to some of these questions were obtained during this study.
88
RESULTS
Solvent production in nitrogen-fixing cultures and activities of solvent-forming
enzymes
When cultures at the early-exponential phase of growth, which showed either
little or no solvent production, were used as inocula, a solventogenic switch was observed
in nitrogen-fixing cultures. A closer examination of the solvent production pinpointed
the switch from acid production to solvent production in nitrogen-fixing cultures, which
always coincided with a decrease in in vivo nitrogen-fixing activity (Figure 1). Results of
four similarly grown nitrogen-fixing cultures showed that an average of 24 ± 5 mM of n-
butanol and an average of 9.0 ± 2 mM of isopropanol were produced during an average
incubation time of 43 hr (data not shown).
To examine the changes in the activities of the solvent-producing enzymes in
nitrogen-fixing cells, C. beijerinckii was grown in an 8-L culture under nitrogen-fixing
conditions (Figure 1, panel A). An examination of the in vivo nitrogen-fixing activity in
samples isolated periodically revealed a reproducible activity pattern, which will be
discussed in Chapter 5. Analysis of solvent concentrations in the culture supernatant by
gas chromatography indicated that active solvent production started within 4 hr of
inoculation, which coincided with the onset of the decrease in nitrogen-fixing activity.
Cells from this batch culture were periodically harvested and used for the preparation of
cell-free extracts. The activities of acetoacetate decarboxylase and butyraldehyde
dehydrogenase were measured in the cell-free extracts (Figure 1, panel B).
The specific activity of acetoacetate decarboxylase increased 2.5-fold during the
course of the 26 hr period of solvent production. The increase in butyraldehyde
dehydrogenase activity was higher (4.5-fold) than that of acetoacetate decarboxylase
activity. However, a slight decrease that was not detected in the specific activity of
acetoacetate decarboxylase was detected in the specific activity of butyraldehyde
89
0.1
1
1 0
100
0 5 1 0 1 5 2 0 2 5 3 0 3 5
4
4 .5
5
5 .5
6
6.5
0 5 1 0 1 5 2 0 2 5 3 0 3 5
0.01
0.1
1
1 0
0 5 1 0 1 5 2 0 2 5 3 0 3 5
: in
vivo
nitr
ogen
-fix
ing
activ
ity (
U/m
l of c
ultu
re)
: n-b
utan
ol (
mM
):
isop
ropa
nol (
mM
)
: OD
600
Spe
cific
enz
yme
activ
ities
(U
/mg
of p
rote
in)
Incubation time (hr)
pH
(A) (B)
Incubation time (hr) Incubation time (hr)
Figure 1. Growth, culture pH, nitrogen fixing activity, solvent production and specificactivities of two solvent-forming enzymes in a nitrogen-fixing culture of C. beijerinckii NRRLB593. Cells were grown in DNFM as described in Materials and Methods. The culture wassparged with a stream of nitrogen gas throughout incubation to maintain anaerobic conditions andto provide the substrate for nitrogen fixation. In panel A, productions of n-butanol and isopropanolwith time are shown along with optical density of the culture, in vivo nitrogen-fixing activity andculture pH. In panel B, for the n-butanol-producing pathway, the specific activity ofbutyraldehyde dehydrogenase ( ) and, for the isopropanol-producing pathway, the specificactivity of acetoacetate decarboxylase ( ) are shown along with the specific activity of theglycolytic enzyme, glucose-6-phosphate isomerase ( )
90
dehydrogenase when cells entered into stationary phase. The activity of a glycolytic
enzyme, glucose-6-phosphate isomerase, was measured for comparison, and this activity
remained relatively constant throughout incubation. Therefore, the observed changes in
the activity of the solvent-forming enzymes were not caused by experimental procedures
used to extract and assay the enzymes.
Changes in pH of the culture medium were also monitored throughout
incubation. The starting pH of the medium immediately after inoculation was 6.2. A
significant decrease in pH occurred during the first 12 hr of incubation. The pH dropped
to 5.3, which was the lowest pH value for the entire experimental period. The culture pH
started to increase after 12 hr of incubation and at the end of incubation, a pH value of 5.5
was detected. This course of pH changes is characteristic of solvent-producing cultures.
Based on the changes in pH of the culture medium, the first 12 hr may be considered as
the acid-producing phase of growth. However, the increases both in solvent
concentrations (3.2-fold in n-butanol and 2.1-fold in isopropanol) and in specific
activities of the two solvent-forming enzymes (2.1-fold) during the first 12 hr indicate
that the solvent-producing phase also started in this period, but the rate of solvent
production could not match that of acid production, hence causing the pH drop. This
experiment showed that, under nitrogen-fixing growth conditions, active solvent
production could coincide with growth.
Northern analysis of the expression of the solvent-producing genes in nitrogen-fixing
cultures
Initial Northern analysis of C. beijerinckii NRRL B593 RNA with a 2.6-kb probe
harboring the ald, ctfA and part of ctfB genes (Figure 2, probe 1) revealed a major and
two minor bands with the sizes of ~3.7 kb, ~2.7 kb and ~1.5 kb (Figure 2). The presence
of a major transcript of 3.7 kb may indicate that the ald, ctfA, ctfB, and adc genes are
transcribed as a distinct unit because the length of 3.7 kb band correlates closely with the
91
predicted length of the transcript. In addition, the sizes of the 2.7 kb and 1.5 kb signals
could correlate with the lengths of the transcript extending from the ald to the ctfB genes
and the transcript carrying only the ald gene, respectively. If this were the case, the
probe generated from either the ctfA or ctfB genes should generate two bands of 2.7 kb
and 3.7 kb and the probe generated from the adc gene should generate a single band of
3.7 kb. To test this hypothesis, probes were generated from the ctfA and adc genes by
PCR as described in Materials and Methods. The Northern blot used in hybridization
experiments carried an RNA sample isolated from a solvent-producing and nitrogen-
fixing culture of C. beijerinckii NRRL B593. There were six lanes on the blot (Figure
2). Lanes 1, 3 and 5 contained 3 µg of RNA and lanes 2, 4 and 6 contained 6 µg of RNA.
The blot was cut into three pieces and each piece was incubated with one of the probes
shown in Figure 2. Hybridization and washing steps were carried out under high
stringency conditions. The results shown in Figure 2 revealed three signals with each
probe indicating that the minor bands (2.7 kb and 1.5 kb) were not real transcripts but
rather possible degradation products of the 3.7-kb message.
To study regulation of expression of the genes in the sol cluster, changes in the sol
mRNA were monitored by Northern analysis. The RNA samples used in Northern blot
analysis of the nifH message (described in Chapter 5) were also used for analysis of the
ald message. The 3.7-kb band was the major signal detected in all RNA samples isolated
throughout incubation. Although slight differences in band intensities were observed, the
band intensities did not show significant changes indicating that the ald mRNA was made
throughout incubation and was not subjected to transcriptional regulation under the
growth conditions used here. For comparison, the same membrane was stripped in 0.1 %
SDS solution and incubated with a 16S rRNA probe. The results shown in Figure 3
indicated no significant changes in signal intensities eliminating the possibility of
unequal sample loading during electrophoresis.
92
Figure 2. The physical map of the sol cluster of C. beijerinckii NRRL B593 andNorthern blot analysis of the solvent-production (sol) genes. Cells were grown in
NFDM under nitrogen-fixing growth conditions. Total RNA was isolated from fresh cellswith the guanidium isothiocyanate-acid phenol extraction method. Six µg of total RNA
were resolved on lanes 2, 4 and 6 whereas 3 µg of total RNA were resolved on lanes 1, 3
and 5 on a 0.7 % formaldehyde-agarose gel. The RNA species were then transferred to apositively charged nylon membrane by capillary elution with 20x SSC and the resultingmembrane was cut into three pieces and each piece was incubated with 100 ng of one ofthe above probes (solid boxes 1, 2 and 3). A 3.7-kb major transcript suggested co-transcription of the ald, ctfA , ctfB and adc genes. The 2.7-kb and 1.5-kb bands arise eitherfrom nonspecific interaction of probes or as degradation products of the major 3.7-kbtranscript. L is the standard RNA size ladder (GibcoBRL products).
0.2 kb
1.4 kb
2.4 kb
4.4 kb
7.5 kb9.5 kb
1 2 3 4 5 6
(1) (3)
1.5 kb
2.7 kb
3.7 kb
L
(1403 bp) (653 bp) (663 bp) (737 bp)
(2)
ald ctfA ctfB adc
with probe 1 with probe 2 with probe 3
93
Figure 3. Northern blot analysis of the ald mRNA in periodically isolated samples of C.beijerinckii NRRL B593. Cells were grown in NFDM under nitrogen-fixing growthcondition and harvested periodically throughout the incubation. Total RNA was isolatedfrom fresh cells with the guanidium isothiocyanate-acid phenol extraction method. Six µg of
total RNA per well were resolved on a 0.7 % formaldehyde-agarose gel. The RNA specieswere then transferred to a positively charged nylon membrane by capillary elution with 20xSSC and the resulting membrane was incubated with a 2.6 kb HRP-labeled sol probe (probe1 in Figure 2) at 42 oC in a hybridization buffer containing 0.5 M NaCl. For comparison, themembrane was stripped in 0.1 % hot SDS solution and incubated with a HRP-labeled 16SrRNA gene. Open bars represent relative intensities of each signal as determined bydensitometric analysis.
0
2 0
4 0
6 0
8 0
100
1 2 3 4 5 6
0
2 0
4 0
6 0
8 0
100
1 2 3 4 5 6
ald
16S rRNA
4hr 8hr 12hr 20hr 26hr 30hr
% in
tens
ity%
inte
nsity
94
The effect of ammonium acetate addition on solvent production in nitrogen-fixing
cultures and the changes in solvent-producing enzyme activities
To study the effect of nitrogen fixation on solvent production, ammonium acetate
was added to nitrogen-fixing cultures of C. beijerinckii after 10 hr of incubation when the
cultures had an OD600 of 1.1 ± 0.1. Four different ammonium acetate concentrations (2.0,
1.0, 0.5 and 0.25 mM) were used. The nitrogen-fixing activity before ammonium acetate
addition was 13.8 ± 1.3 unit per ml of culture. Two hours after the ammonium acetate
addition, the cultures to which ammonium acetate was added to a final concentrations of
0.5, 1.0 and 2.0 mM has lost ~85 % of their in vivo peak-nitrogen-fixing activities, and
the culture to which ammonium acetate was added to a final concentration of 0.25 mM
has lost ~37 % of its in vivo peak-nitrogen-fixing activity. During the 35-hr incubation
period, solvent concentrations in the culture supernatant were periodically measured by
gas chromatography (Figure 4, Panel A). The highest solvent production occurred in the
culture to which ammonium acetate was added to a final concentration of 2.0 mM. The
culture produced 64 mM of n-butanol and 16 mM of isopropanol after 35 hr of
incubation. An examination of final solvent concentrations in the ammonium acetate-
supplemented cultures showed a positive relationship between the amount of ammonia
supplemented and the amount of solvents produced (Figure 4, panel B).
To examine the change in solvent-producing enzyme activities after ammonium
acetate addition, C. beijerinckii was grown in an 8-L batch culture under nitrogen-fixing
growth conditions (Figure 5, Panel A). Ammonium acetate (1 mM) was added to the
culture when the OD600 was 0.8, and the cells were periodically harvested for cell-free
extract preparation. In cell-free extracts, the activities of two solvent-forming enzymes,
acetoacetate decarboxylase and butyraldehyde dehydrogenase, were measured (Figure 5,
Panel B). Cells harvested at the 6 hr and 8 hr time points did not show acetoacetate
95
1
10
100
0 10 20 30 40
Figure 4. The effect of ammonia addition on solvent production in nitrogen-fixing cultures of C.beijerinckii NRRL B593. Cells were grown in DNFM as described in Materials and Methods. The
culture was sparged with a stream of nitrogen gas throughout incubation to maintain anaerobic conditionsand to provide the substrate for nitrogen fixation. Another nitrogen source, ammonium acetate, wasadded from a filter sterilized stock solution to nitrogen-fixing cultures after 10 hr of inoculation when thecultures had an average OD600 of 1.1 ± 0.1. Four different ammonium acetate concentrations were tested
(0.25 mM, 0.5 mM, 1.0 mM and 2.0 mM). Panel A shows n-butanol and isopropanol productionthroughout incubation. Panel B shows the relationship between the amount of ammonium acetate added
and the amount of n-butanol and isopropanol produced. The symbols in panel A are: , 0.25 mMammonium acetate addition; , 0.5 mM ammonium acetate addition; , 1.0 mM ammonium acetateaddition; , 2.0 mM ammonium acetate addition. The symbols in panel B are: , n-butanol producedafter 35 hr of incubation; , isopropanol produced after 35 hr of incubation. The arrow indicates the timeof ammonium acetate addition.
0
1 0
2 0
3 0
4 0
5 0
6 0
7 0
0 0.5 1 1.5 2 2.5
(A) (B)
Incubation time (hr) Ammonium acetate concentration (mM)
: n-
buta
nol (
mM
)
: is
opro
pano
l (m
M)
: n-
buta
nol (
mM
)
: is
opro
pano
l (m
M)
96
0.1
1
10
100
0 5 10 15 20 25
0.1
1
10
100
0 5 10 15 20 25
4
4 .5
5
5 .5
6
6.5
0 5 1 0 1 5 2 0 2 5
Incubation time (hr) Incubation time (hr)
: In
vivo
nitr
ogen
-fix
ing
activ
ity (
U/m
l of c
ultu
re)
: n-b
utan
ol (
mM
):
isop
ropa
nol (
mM
)
: OD
600
Incubation time (hr)
pH
Spe
cific
enz
yme
activ
ities
(U
/mg
of p
rote
in)
(A) (B)
Figure 5. Growth, culture pH, nitrogen-fixing activity, solvent production and specific activities oftwo solvent-forming enzymes in an ammonia-supplemented nitrogen-fixing culture of C.beijerinckii NRRL B593. Cells were grown in DNFM as described in Materials and Methods. Theculture was sparged with a stream of nitrogen gas throughout incubation to maintain anaerobic conditionsand to provide the substrate for nitrogen fixation. In panel A, productions of n-butanol and isopropanolare shown along with changes in culture optical density and in vivo nitrogen-fixing activity. In panel B,for the n-butanol-producing pathway, the specific activity of butyraldehyde dehydrogenase ( ) and, forthe isopropanol-producing pathway, the specific activity of acetoacetate decarboxylase ( ) are shownalong with the specific activity of a glycolytic enzyme, glucose-6-phosphate isomerase ( ) and thespecific activities of hydrogenase ( ,uptake activity; ,evolution activity) is also indicated. The arrowindicates the time of ammonium acetate addition.
97
decarboxylase and butyraldehyde dehydrogenase activities. Both enzyme activities were
detected in the cells harvested at the 12 hr and 20 hr time points. Therefore, a
solventogenic switch must have occurred at least 3 hr after ammonium acetate addition.
Comparison of the specific activities of enzymes in 12-hr and 20-hr cell-free extracts
showed a 1.2-fold increase in butyraldehyde dehydrogenase and a 3.8-fold increase in
acetoacetate decarboxylase activities in the 20-hr extract. The activity of a glycolytic
enzyme, glucose-6-phosphate isomerase, remained relatively constant throughout the
incubation.
The switch-off of nitrogen-fixing activity after ammonium acetate addition
prevents the use of electrons by nitrogenase and may allow accumulation of reducing
power in the cell for a short period of time. These excess electrons may be used either
for the synthesis of alcohols or disposed of in the form of hydrogen gas. In vitro
hydrogenase activity was measured in both hydrogen-uptake and hydrogen-evolution
directions to obtain information about the fate of electrons after the switch-off of
nitrogen-fixing activity. An average of 1.6-fold increase in specific hydrogen-uptake
activity and 1.3-fold increase in specific hydrogen-evolution activity were detected
within ~3 hr after ammonium acetate addition. The hydrogenase activities then gradually
decreased after the onset of solvent production. The increase in hydrogenase activity in
both directions may not be significant because, in ammonia-grown cells of C. beijerinckii
and C. acetobutylicum, similar increases were also observed in specific in vivo and in
vitro hydrogenase activities during the acid-producing growth phase. For example, Kim
and Zeikus (1984) found that the in vivo specific activity of hydrogenase in acid-
producing cells of C. acetobutylicum ATCC 4259 was about 50 % higher than the
specific activity of hydrogenase in solvent-producing cells. Other studies by George and
Chen (1983) with C. beijerinckii NRRL B592 and Gorwa et al., (1996) with C.
acetobutylicum ATCC 824 showed higher in vitro specific hydrogenase activity in acid-
98
producing cells. Therefore, although it is possible that the cells may dispose of the
excess reducing power, which was generated after the switch off of nitrogen-fixing
activity, in the form of hydrogen gas via hydrogenase, additional routes may be created to
allow cells to convert excess reducing power into other useful forms.
As observed in the previous nitrogen-fixing culture, the culture pH decreased
from 6.0 to 5.1 after 12 hr of incubation. The culture pH then started to increase after 12
hr of incubation and, after 20 hr of incubation, a pH value of 5.5 was detected. This
course of pH change is characteristic of solvent-producing cultures.
The effect of ammonium acetate addition on transcription of the solvent-production
genes in nitrogen-fixing cultures
A Northern blot was generated from the RNA samples isolated from periodically
harvested nitrogen-fixing cells after incubation with a HRP-labeled 2.6-kb probe for the
ald , ctfA and part of ctfB genes (Figure 2, probe 1). As shown in Figure 6, hybridization
with the 2.6-kb probe revealed the presence of the 3.7-kb mRNA that carries the message
for solvent-production genes in all of the RNA samples. The intensity of the signal,
however, gradually increased towards the late-exponential growth and stationary phases.
The strongest signal was detected in the RNA sample taken at 20-hr point. There was
more than 2-fold increase in the level of mRNA that carries the message for solvent-
production genes between the 4 hr and 20 hr RNA samples. It is, therefore, hard to
assign either an onset or active solvent production period in this culture. For comparison,
the same membrane was stripped in 0.1 % hot SDS solution and incubated with a 16S
rRNA probe. The results shown in Figure 6 indicated no changes in the signal intensity
of the 16S rRNA message eliminating the possibility of unequal sample loading during
electrophoresis. Evidently, the increase in the level of mRNA that carries the message
for solvent-production genes is paralleled by the increase in the activities of solvent-
forming enzymes and solvent production.
99
Figure 6. Northern blot analysis of the ald mRNA expression in periodically isolatedsamples of C. beijerinckii NRRL B593 after ammonium acetate addition. Cells weregrown in the defined nitrogen-fixing medium as described in Materials and Methods. Theculture was sparged with a stream of nitrogen gas throughout incubation to maintainanaerobic conditions and to provide the substrate for nitrogen fixation. Cells were harvestedperiodically throughout incubation and total RNA was isolated from fresh cells with theguanidium isothiocyanate-acid phenol extraction method. Six µg of total RNA per well
were resolved on a 0.7 % formaldehyde agarose gel. The RNA species were then transferredto a positively charged nylon membrane by capillary elution with 20x SSC and the resultingmembrane was incubated with a 2.6 kb HRP-labeled sol probe at 42 oC in a hybridizationbuffer containing 0.5 M NaCl. For comparison, the membrane was stripped in 0.1 % SDSsolution and incubated with a HRP-labeled 16S rRNA gene. Open bars represent relativesignal intensities of each band as determined by densitometric analysis.
0
2 0
4 0
6 0
8 0
100
1 2 3 4 5
0
2 0
4 0
6 0
8 0
100
1 2 3 4 5
ald
16S rRNA
4hr 6hr 8hr 12hr 20hr
% in
tens
ity%
inte
nsity
100
The effect of “transition into nitrogen-fixing mode of growth” on solvent production
To study the transition into the nitrogen-fixing mode of growth and its effects on
solvent production in C. beijerinckii, cells were grown in the defined nitrogen-fixing
medium in which a low level of ammonium acetate was initially present to repress
nitrogen fixation during the early-exponential growth phase. However, exhaustion of
ammonia from the medium forced cells to fix nitrogen during later stages of growth.
Four different initial ammonium acetate concentrations were tested (1.0 , 2.0 , 4.0 and 8
mM). The highest nitrogen-fixing activity was detected in the culture grown in 1 mM
ammonium acetate-containing medium (Figure 7, panel A). The other cultures showed
peak nitrogen-fixing activities at different stages of growth. For instance, cells grown in
medium containing 4 mM ammonium acetate displayed the highest nitrogen-fixing
activity during the late-exponential phase of growth, whereas cells grown in medium
containing 8 mM ammonium acetate displayed nitrogen-fixing activity during the early-
stationary phase. In a separate experiment, higher ammonium acetate concentrations (10,
20, 40 and 60 mM) were tested (data not shown). In these cultures, transition into the
nitrogen-fixing mode of growth was observed only in cells grown in medium containing
10 mM ammonium acetate.
As observed in ammonium acetate-addition experiments, final solvent
concentrations were dependent on the concentration of initial ammonium acetate used in
the transition cultures. A positive relationship was observed between the amount of
initial ammonium acetate (up to 10 mM) used and the amount of solvents produced. The
lowest solvent production occurred in the culture grown in medium containing 1 mM
ammonium acetate. In this particular culture (1 mM ammonium acetate), although the
onset of nitrogen fixation was during the early-exponential growth phase, the nitrogen-
fixing activity peaked during the late-exponential growth and stationary phases. An
examination of the other transition cultures showed that the timing of the onset of
101
0.1
1
10
100
0 5 10 15 20 25 30 35 40 45 50
In v
ivo
nitr
ogen
-fix
ing
activ
ity (
U/m
l of c
ultu
re)
n-bu
tano
l (m
M)
Figure 7. Comparison of in vivo nitrogen-fixing activities (panel A) and production of n-butanol(panel B) in transition cultures of C. beijerinckii NRRL B593. Cells were grown in a medium whichwas the DNFM with the addition of a low level of ammonium acetate. The cultures were sparged with astream of nitrogen gas throughout incubation to maintain anaerobic conditions and to provide the substratefor nitrogen fixation. The assay conditions for in vivo nitrogen-fixing activity are described in Materialsand Methods. Four different ammonium acetate concentrations were used. The symbols represent thefollowing initial ammonium acetate concentrations: ,1 mM; , 2 mM; ,4 mM; ,8 mM.
0.1
1
10
100
0 5 10 15 20 25 30 35 40 45 50
Incubation time (hr) Incubation time (hr)
(A) (B)
102
transition into the nitrogen-fixing mode of growth depended on the concentration of
initial ammonium acetate and it coincided with the onset of solvent production. For
example, the nitrogen-fixing activity that always preceded the onset of solvent production
in nitrogen-fixing cultures (see Figure 1) coincided with the onset of solvent production
when cells were grown in a medium containing 4 mM ammonium acetate (Figure 8).
This observation was further supported when RNA samples isolated from periodically
harvested cells were examined in Northern blots by HRP-labeled probes specific to the
nifH and solvent production genes of C. beijerinckii. Both mRNA levels increased
during the late-exponential growth phase as shown in Figure 9.
A comparison of the peak nitrogen-fixing activities among the transition cultures
showed that the peak nitrogen-fixing activity of the culture (Figure 7) grown in medium
containing 4 mM ammonium acetate was ~5.0 times less than the peak nitrogen-fixing
activity of the culture grown in medium containing 1 mM ammonium acetate (Figure 7).
It was also surprising to see that despite the presence of ammonium acetate, the amount
of n-butanol produced by the culture grown in medium containing 4 mM ammonium
acetate was 1.6 times lower then the amount of n-butanol produced by the routine
nitrogen-fixing culture shown in Figure 1.
Changes in solvent-producing enzyme activities in transition cultures
To examine more closely the transition into the nitrogen-fixing mode of growth
and its effects on solvent production, C. beijerinckii was grown in a medium containing
either 8 mM or 4 mM ammonium acetate and cells were periodically harvested both for
cell-free extract preparation and for isolation of total RNA as described in Material and
Methods. As previously observed, the culture grown in a medium containing 8 mM
ammonium acetate did not have measurable nitrogen-fixing activity during the
exponential phase of growth (until the culture became 21 hr old.) (Figure 10, panel A).
103
0.1
1
1 0
100
0 5 1 0 1 5 2 0 2 5 3 0 3 5 4 0 4 5 5 0
Figure 8. Growth, solvent production and nitrogen-fixing activity of C. beijerinckii NRRLB593. Cells were grown in a medium which was the DNFM with the addition of 4 mM ofammonium acetate. The culture was sparged with a stream of nitrogen gas throughout incubationto maintain anaerobic conditions and to provide the substrate for nitrogen fixation. The assayconditions for in vivo nitrogen-fixing activity is described in Materials and Methods.
In v
ivo
nitr
ogen
-fix
ing
activ
ity (
U/m
l of c
ultu
re)
: n-b
utan
ol (
mM
): i
sopr
opan
ol (m
M)
: OD
600
Incubation time (hr)
104
Figure 9. Northern blot analysis of the nifH and ald mRNAs of C. beijerinckii NRRLB593. Cells were grown in a medium which was the DNFM with the addition of 4 mM ofammonium acetate. The culture was sparged with a stream of nitrogen gas throughoutincubation to maintain anaerobic conditions and to provide the substrate for nitrogen fixation.Cells were harvested periodically throughout incubation, and total RNA was isolated fromfresh cells with the guanidium isothiocyanate-acid phenol extraction method. Six µg of total
RNA per well were resolved on a 0.7 % formaldehyde-agarose gel. The RNA species werethen transferred to positively charged nylon membranes by capillary elution with 20X SSCand the resulting membranes were incubated with HRP-labeled nifH and sol probes at 42 0Cin a hybridization buffer containing 0.5 M NaCl. For comparison, the membranes werestripped in 0.1 % SDS solution and incubated with a HRP-labeled 16S rRNA probe. Openbars represent relative signal intensities of each band as determined by densitometric analysis.
0
2 0
4 0
6 0
8 0
1 0 0
1 2 3 40
2 0
4 0
6 0
8 0
1 0 0
1 2 3 4
0
2 0
4 0
6 0
8 0
100
1 2 3 4 0
2 0
4 0
6 0
8 0
100
1 2 3 4
4hr 8hr 12hr 20hr 4hr 8hr 12hr 20hr
nifH
16SrRNA 16SrRNA
ald
(A) (B)
% in
tens
ity
% in
tens
ity
% in
tens
ity
% in
tens
ity
105
Depletion of ammonia from the medium forced the cells to go into the nitrogen-fixing
mode of growth during the early stationary phase. Under this particular growth
condition, the onset of solvent production occurred much earlier than the onset of
nitrogen fixation.
This conclusion was drawn from an examination of the increases in:
(i) Solvent concentrations: As shown in Figure 10, Panel A, an increase in n-butanol and
isopropanol concentrations occurred after 8 hr of incubation, whereas the in vivo
nitrogen-fixing activity was detected only after 21 hr of incubation indicating that the
onset of nitrogen-fixation was after the onset of solvent production.
(ii) Specific activities of acetoacetate decarboxylase and butyraldehyde dehydrogenase:
The specific activities of both solvent-forming enzymes were assayed in cell free-extracts
prepared from periodically-harvested cells. Although the activities were detectable in all
cell-free extract preparations, a gradual increase in both enzyme activities occurred
towards the late-exponential growth and stationary phases (Figure 10, panel B). The
specific activity of acetoacetate decarboxylase increased 4-fold, whereas a 1.8-fold
increase was detected in the specific activity of butyraldehyde dehydrogenase. As
previously observed in the routine nitrogen-fixing cultures, the degree of increase in the
two enzyme activities differed.
(iii) ald mRNA: Northern blot analysis of the mRNA carrying solvent-production genes
revealed 3.7-kb message throughout growth (Figure 11, Panel B). Comparison of signal
intensities among the RNA samples showed a significant increase after 12 hr of
incubation indicating the onset of active solvent production. However, the signal
intensity later decreased showing the presence of a down regulation in transcription of the
solvent-production genes.
106
0.1
1
10
100
0 5 10 15 20 25 300.01
0.1
1
10
100
0 5 10 15 20 25 30
4
4 .5
5
5 .5
6
6.5
0 5 1 0 1 5 2 0 2 5 3 0
Figure 10. Growth, culture pH, solvent production, in vivo nitrogen-fixing activity, in vitronitrogen-fixing activity and specific activities of two solvent-forming enzymes in a nitrogen-fixingculture of C. beijerinckii NRRL B593. Cells were grown in a medium which was the DNFM, with theaddition of 8 mM of ammonium acetate. The culture was sparged with a stream of nitrogen gasthroughout incubation to maintain anaerobic conditions and to provide the substrate for nitrogenfixation. In panel A, production of n-butanol and isopropanol are shown along with changes in cultureoptical density and in vivo nitrogen-fixing activity. In panel B, for the n-butanol-producing pathway,the specific activity of butyraldehyde dehydrogenase ( ), for the isopropanol-producing pathway, thespecific activity of acetoacetate decarboxylase ( ), and for the nitrogen-fixing pathway, the specificactivity of nitrogenase ( ) are shown along with the specific activity of a glycolytic enzyme, glucose-6-phosphate isomerase ( ), and the specific activity of hydrogenase ( ,uptake activity).
Incubation time (hr)
: In
vivo
nitr
ogen
-fix
ing
activ
ity (
U/m
l of c
ultu
re)
: n-b
utan
ol (
mM
):
isop
ropa
nol (
mM
)
: OD
600
Incubation time (hr)
pH
Spe
cific
enz
yme
activ
ities
(U
/mg
of p
rote
in)
Incubation time (hr)
(A) (B)
107
An examination of the nifH gene expression in samples isolated periodically
revealed that the nifH gene and possibly other nif and nif-associated genes were not
transcribed during the early-exponential growth phase, when 8 mM of ammonium acetate
was initially present in the medium (Figure 11, panel A). However, Western blot
analysis of the cell-free extracts showed the presence of NifH protein in the earliest cell-
free extract even though the nitrogenase activity was not detected in either in vivo or in
vitro assays (Figure 12, panel A). This result may indicate that the inoculum was already
in the nitrogen-fixing mode of growth when it was used and, after inoculation into
medium containing 8mM ammonium acetate, the synthesis of nitrogenase stopped and
the pre-existing enzyme was degraded. A similar observation was made when C.
beijerinckii was grown in a medium, which initially contained 4 mM of ammonium
acetate (Figure 12, panel B). Although an examination of the appearance of NifH in
samples isolated periodically by Western blot analysis showed the existence of NifH in
the earliest cell-free extract (when an overnight-exposed autoradiogram was analyzed)
(data not shown), a significant increase in the level of NifH was detected only after 8 hr
of incubation.
108
0
2 0
4 0
6 0
8 0
1 0 0
1 2 3 4 5
0
2 0
4 0
6 0
8 0
1 0 0
1 2 3 4 5
0
2 0
4 0
6 0
8 0
100
1 2 3 4 50
2 0
4 0
6 0
8 0
100
1 2 3 4 5
4hr 8hr 12hr 21hr 26hr 4hr 8hr 12hr 21hr 26hr
nifH
16SrRNA 16SrRNA
ald
% in
tens
ity
% in
tens
ity
% in
tens
ity
% in
tens
ity
Figure 11. Northern blot analysis of the nifH and ald expression of C. beijerinckiiNRRL B593. Cells were grown in a medium which was the DNFM with the addition of 8mM of ammonium acetate. The culture was sparged with a stream of nitrogen gasthroughout incubation to maintain anaerobic conditions and to provide the substrate fornitrogen fixation. Cells were harvested periodically throughout incubation, and total RNAwas isolated from fresh cells with the guanidium isothiocyanate-acid phenol extractionmethod. Six µg of total RNA per well were resolved on a 0.7 % formaldehyde-agarose gel.
The RNA species were then transferred to positively charged nylon membranes by capillaryelution with 20X SSC and the resulting membranes were incubated with HRP-labeled nifH
and sol probes at 42 0C in a hybridization buffer containing 0.5 M NaCl. For comparison,the membranes were stripped in 0.1 % SDS solution and incubated with a HRP-labeled 16SrRNA probe. Open bars represent relative signal intensities of each band as determined bydensitometric analysis.
(A) (B)
109
0
2 0
4 0
6 0
8 0
100
1 2 3 4 5
0
2 0
4 0
6 0
8 0
100
1 2 3 4
Figure 12. Western blot analysis of the iron protein of nitrogenase in transitioncultures of C. beijerinckii NRRL B593. Cells were grown in a medium which was theDNFM with the addition of 8 mM (Panel A) or 4 mM (Panel B) ammonium acetate andperiodically harvested for cell-free extract preparation as described in Materials andMethods. The cultures were sparged with a stream of nitrogen gas throughout incubation tomaintain anaerobic conditions and to provide the substrate for nitrogen fixation. Ten µg of
total protein was separated by SDS-PAGE with 12 % total acrylamide on a minigel andtransferred to a positively charged nitrocellulose membrane. The membrane was thenincubated with an antiserum raised against iron protein of nitrogenase of A. vinelendii.
Detection of the signals was achieved by using a chemiluminescent detection system. Openbars represent relative signal intensities of each band as determined by densitometricanalysis.
(A) (B)
4hr 8hr 12hr 21hr
% in
tens
ity
% in
tens
ity
4hr 8hr 12hr 21hr
110
DISCUSSION
Previously, Yan et al. (1988) examined changes in the specific activity of
acetoacetate decarboxylase, butanol dehydrogenase and isopropanol dehydrogenase in
cell-free extracts of C. beijerinckii NRRL B593 grown in a complex medium and
reported a fast rise in activities of solvent-forming enzymes near the mid-exponential
phase of growth. In this study specific activities of two solvent-forming enzymes
increased with time. However, the extent and the pattern of increases in these enzyme
activities differed between cultures grown under nitrogen-fixing growth conditions and in
a nitrogen-rich complex medium. When C. acetobutylicum ATCC 824 was grown in a
defined medium at pH 4.8, acetoacetate decarboxylase activity appeared during the acid-
producing phase of growth and its activity increased throughout incubation (Ballongue et
al., 1989). When the medium pH was kept at 6.8 to generate an acid-producing culture,
acetoacetate decarboxylase activity was still detected although no acetone was produced.
This result is contradictory to the observation made by Husemann and Papoutsakis
(1989a) who reported that acetoacetate decarboxylase activity cannot be detected in
either batch or continuous cultures of C. acetobutylicum kept above pH 6.0. In another
study, Husemann and Papoutsakis (1989b) showed changes in acetoacetate decarboxylase
activity in batch cultures of C. acetobutylicum ATCC 824 maintained at pH values of 4.2,
5.0 and 6.0. In all fermentations, an increase in the specific activity of acetoacetate
decarboxylase paralleled an increase in the production of acetone . Although this result is
contrary to the observation made by Ballongue et al. (1989), it agrees with the data
presented here and the data reported by Yan et al (1988) and Dürre et al. (1987).
When Northern blot analysis was carried out to determine whether the observed
differences in enzyme activities were related to changes in the mRNA levels of the
corresponding genes, the nitrogen-fixing culture was found to have a constant level of
expression of the solvent-producing genes. This observation suggests that the increase in
111
specific activities of aldehyde dehyrogenase and acetoacetate decarboxylase was the
result of continuous expression of the corresponding genes rather than a rapid induction.
However, it is likely that the inoculum for this culture was already in the solvent-
producing phase and it continued to express the solvent-producing genes after inoculation
into the fresh medium. In C. beijerinckii NCIMB 8052, Chen and Blaschek (1999a)
observed a similar gene expression pattern in which the sol operon was expressed at high
levels throughout growth. Unlike C. beijerinckii, C. acetobutylicum DSM 792 displayed
a clear start of transcription of the adc, ctfA and ctfB genes (Gerischer and Dürre, 1991).
The multiple bands observed during the Northern blot analysis of mRNA of the
solvent-production genes do not correspond to either processed products of the primary
transcript or multiple primary transcripts because Northern analysis with the ctfA and adc
probes gave rise to at least three bands. Similar multiple bands were observed when total
RNA from the C. beijerinckii BA 101 and C. beijerinckii NCIMB 8052 was subjected to
Northern analysis with a probe generated from ctfA and ctfB genes (Chen and Blaschek,
1999a and 1999b). Those authors suggest that the secondary bands are the results of
processing of the primary transcript. However, the lack of Northern analysis with the ald
and adc genes of C. beijerinckii BA 101 and C. beijerinckii NCIMB 8052 makes their
interpretation less conclusive. Because the sol clusters of C. beijerinckii NRRL B593
and C. beijerinckii NCIMB 8052 are similar, it is reasonable to expect same the type of
expression patterns in these organisms. In C. acetobutylicum DSM 792, two major bands
at the sizes of 670 bp and 850 bp were detected in Northern blots with the adc gene as the
probe (Gerischer and Durre, 1992). The 850-bp RNA band represented a full-length adc
transcript, whereas the 670 bp band was shown to be a degradation product. Although the
sol loci of C. beijerinckii and C. acetobutylicum differ in organization and the direction of
transcription, the multiple bands observed in both organisms can be attributed to the
existence of active nucleases in both organisms. In a separate study, with aad/adhE-
112
spesific probes, a single signal of 4.1 kb to 4.2 kb was detected in solventogenic cells of
C. acetobutylicum DSM 792, indicating that the aad/adhE, ctfA and ctfB genes were
transcribed as a unit and the transcript was not degraded (Fisher et al., 1993).
The presence of limited ammonium acetate in nitrogen-fixing media caused a
shift in timing of nitrogen-fixing activity. When solvent production coincided with
nitrogen-fixing activity, the cells produced less amount of solvents and the peak of
nitrogen-fixing activity decreased. The decrease in solvent production and nitrogen-
fixing activity may be caused by limited supply of reducing equivalents which are needed
for both processes. Evidently, the routing of carbon through the alternative solvent-
producing pathways is affected by the availability of reducing power in solvent-
producing clostridia.
113
CHAPTER 5
Transcriptional analysis of genes in the nif cluster of Clostridium beijerinckii NRRL
B593.
ABSTRACT
Clostridium beijerinckii NRRL B593 is a free-living nitrogen fixer. The cloning
of its nifH gene, encoding the iron protein of nitrogenase, in this study allowed the
subsequent determination of the sequence and organization of the other nif and nif-
associated genes in our laboratory (Toth and Chen, unpublished data). The nifH gene
occurs on a 2.3-kb HindIII fragment. Sequence analysis of this fragment revealed two
glnB-like ORFs downstream from the nifH gene in the same orientation. The nif genes of
C. beijerinckii NRRL B593 occupy a region of about 16 kilobases. Besides the two
glnB-like genes, five other genes are interspersed between the nifNB and the nifVω genes.
Northern blot analysis revealed the presence of four different transcripts. Two of these
transcripts had the predicted sizes (4.9 kb and 1.7 kb) spanning from nifH to nifK and
from nifVω to nifVα, respectively. The other two transcripts did not have the expected
sizes, but they suggested the presence of two other polycistronic mRNAs consisting of
nifE-nifNB and nirJ1-nirJ2- nirD-nirH, respectively. The absence of the nif and nif-
associated mRNAs in RNA samples isolated from non-nitrogen-fixing cells indicated that
nif-associated genes are regulated in parallel to nif genes. Examination of in vivo
acetylene-reduction activity at various times during growth of cultures grown in a defined
nitrogen-fixing medium revealed a distinctive pattern. An increase in nitrogen-fixing
activity during the early-exponential phase of growth was followed by a gradual decrease
during the late-exponential growth and stationary phases. In addition, the results of
Northern blot analysis of samples taken periodically from a nitrogen-fixing culture of C.
beijerinckii revealed that the level of nifH mRNA was proportional to that of in vivo
nitrogen-fixing activity. However, a gradual decrease was not detected in the in vitro
114
nitrogen-fixing activity, indicating the presence of active nitrogenase throughout the
entire measuring period. The addition of ammonium acetate caused an immediate but
reversible drop in in vivo nitrogen-fixing activity by C. beijerinckii. However, a
posttranslational modification of the iron protein of nitrogenase by ADP-ribosylation was
not detected after ammonia addition. The immediate drop in in vivo nitrogen-fixing
activity after ammonia addition was not accompanied by a drop in the in vitro nitrogen-
fixing activity. Evidently, the mechanism of the ammonia-triggered switch-off of
nitrogenase in C. beijerinckii is different from that involving ADP-ribosylation.
Ammonia addition had a marked effect on nifH transcription and the stability of nifH
mRNA in C. beijerinckii. In C. pasteurianum, however, a response to ammonia addition
was only observed at the transcriptional level, because C. pasteurianum did not switch
off its in vivo nitrogen-fixing activity after ammonia addition.
115
INTRODUCTION
The reduction of N2 to ammonia (nitrogen fixation) is a trait widely distributed
among representatives of the eubacteria and methanogenic archea (Young, 1992). For
those bacteria and methanogenic archea that are able to grow diazotrophically, the
fixation of atmospheric nitrogen can be a major route of nitrogen assimilation. However,
due to the high energy and reductant requirement for the process of nitrogen fixation, the
nitrogen-fixing activity of diazotrophs is regulated in response to both the redox and
nitrogen status of the cell, so that nitrogen fixation occurs only when it is both favorable
and necessary (Halbleib and Ludden, 2000). The primary mode of regulation of nitrogen
fixation is by control of transcription of the nif genes. Some organisms also regulate the
activity of the nitrogenase enzyme at a posttranslational level in response to ammonia and
other fixed nitrogen sources (Ludden and Roberts, 1989). Posttranslational regulation,
which prevents nitrogen fixation during energy-limiting or nitrogen-sufficient conditions,
occurs by ADP-ribosylation of the iron protein of nitrogenase (NifH) and it is reversible.
In eubacteria and methanogens, the organization and expression of the nif genes
have been described for several species (Burris and Roberts, 1993). The Mo-nitrogenase
structural genes nifH, nifD and nifK are typically found together in a single operon and
are physically adjacent to other nif or nif-associated genes as part of a larger nif regulon.
The genes nifD and nifK encode the subunits of the molybdenum-iron (MoFe) protein or
dinitrogenase, an α2β2 heterotetramer. The nifH gene codes for the iron protein or
dinitrogenase reductase. Downstream of nifK, the genes nifE, niN and nifV are often
found in separate operons. The genes nifE and nifN encode subunits of a scaffold
structure upon which the essential iron-molybdenum cofactor (FeMoCo) for nitrogenase
is assembled, and the gene nifV encodes homocitrate synthase, which catalyzes the
synthesis of homocitrate, the organic component of the iron-molybdenum cofactor (see
e.g., Chen, et al., 1990).
116
In C. pasteurianum, three consecutive groups of nif genes are present. The first
group consists of structural genes (nifH1, nifD and nifK) for Mo-nitrogenase. The second
group contains nifE and the fused nifN-B genes and the third group contains the split
nifVω and nifVa genes for FeMo biosynthesis. There are two intervening open reading
frames (modA and modB) present between nifN-B and nif Vω and their protein products
are possibly involved in molybdate transport (Chen et al., 1990).
The nitrogen-fixing activity of C. beijerinckii, a potential candidate for industrial
production of n-butanol and isopropanol, was reported in 1949 (Rosenblum and Wilson).
However, no significant study has been conducted to understand the biochemistry and
genetics of nitrogen fixation in this organism. An analysis of the nif genes and the
diazotrophic growth characteristics of C. beijerinckii NRRL B593 may be useful for the
realization of the biotechnological potential of this organism. In this study, a
transcriptional analysis of the nif genes was performed with probes generated from
various regions of the nif cluster. The growth characteristics of nitrogen-fixing cultures
of C. beijerinckii NRRL B593 were also examined. Differences in response to ammonia
supplementation were observed in the nitrogen-fixing activity of C. beijerinckii NRRL
B593 and C. pasteurianum W5.
117
RESULTS
Isolation of DNA fragments harboring nifH, glnB-like 1 and part of glnB-like 2
genes
Southern blotting experiments, using the insert of pCP 114 (harboring nifH2,
nifH1 and part of nifD genes of C. pasteurianum) and pCP 124 (harboring nifD and part
of nifK genes of C. pasteurianum) as probes, revealed a 2.3-kb HindIII restriction
fragment, which contained the nifH, nifD and nifK genes of C. beijerinckii (Figure 1).
However, initial cloning experiments using colony hybridization as a method for
detecting positive clones were unsuccessfull because of the nonspecific association
between the probe and the vector. A low level of contaminating vector DNA in the probe
may have contributed to the high background. Therefore, a homologous probe was
generated by PCR as described in Material and Methods using degenerate primers that
were designed according to the conserved regions of NifH sequences.
Low-stringency screening of clones with the homologous nifH probe gave 82
positive colonies. Out of 82 colonies, one single positive colony was isolated following
secondary and tertiary screenings. The plasmid DNA was isolated from the positive
clone, purified and digested with HindIII. A Southern blotting experiment using part of
the nifH gene as a probe revealed a strong hybridization signal suggesting that the
recombinant plasmid harbored sequences homologous to nifH. A primer–walking
strategy was then used to obtain the nucleotide sequence of HindIII fragment (Figure 2).
An analysis of the nucleotide sequence of the HindIII fragment revealed the
presence of two complete and one incomplete open reading frames of 864, 327, and 138
bp. After BLAST (Basic Local Alignment Search Tool) searches at
http://www.ncbi.nlm.nih.gov/, the putative amino acid sequences of the ORFs showed
118
Eco
R1
Bgl
II
Hin
d II
I
Nsi
I
Xba
I
L L Eco
R1
Bgl
II
Hin
d II
I
Nsi
I
Xba
I
L L
0.5 kb
1.0 kb
1.6 kb
2.0 kb
3.0 kb
4.0 kb
5.0 kb
0.5 kb
1.0 kb
1.6 kb
2.0 kb
3.0 kb
4.0 kb
5.0 kb
Figure 1. Detection of nitrogenase structural genes by Southern blot analysis of therestriction endonuclease digested C. beijerinckii NRRL B593 genomic DNA. Panel A, aHRP-labeled probe carrying nifH2, nifH1and part of nifD genes of C. pasteurianum W5 wasused. Panel B, a HRP-labeled probe carrying nifH1, nifD and part of nifK genes of C.
pasteurianum W5 was used. The 2.3-kb Hind III restriction fragment marked with an arrowwas chosen for cloning. Lane L contained DNA size standards.
(A) (B)
119
Figure 2. Schematic representation of the 2.3-kb HindIII restriction fragment of C. beijerinckiiNRRL B593 chromosome containing the nifH, glnB-like 1 and part of glnB-like 2 genes. Thearrows underneath the boxes show the sequencing strategy and the name of the primers used forsequencing. nifH codes for the iron protein of nitrogenase, glnB-like 1 and glnB-like 2 code for theputative GlnB-like proteins.
HindIII
nifH glnB-1 glnB-2
500 bp
MK40F1
NIFH554
M13R
HindIII
120
very low E values (expected values) ( 10-23)with the NifH, GlnB-like 1 and GlnB-like 2
proteins from bacterial and archaeal origins. These findings confirmed that the HindIII
fragment contained sequences encoding putative NifH, GlnB-like 1 and part of GlnB-like
2 proteins. To complete the remaining part of the glnB-like 2 sequence, a primer,
GLNB2 F2185 was used to sequence a new clone that contained the downstream
sequence (data not shown). An ORF of 384 bp was recognized for the glnB-like 2 gene.
Analysis of the amino acid sequence of the C. beijerinckii NifH
The NifH of C. beijerinckii NRRL B593 is comprised of 287 amino acids, with a
molecular weight of 31,565. The molecular weight derived from the sequence is
consistent with that estimated by Western analysis (Figure 3). The amino acid sequence
of the NifH protein was compared with those in databases. A BlastP search, which
compares a query amino acid sequence against a protein sequence database, revealed that
the NifH of C. beijerinckii exhibited a sequence similarity to all available bacterial and
archeal NifH protein sequences. Alignment of the selected NifH sequences by the
Clustal W method helped to identify the conserved regions and to show the degree of
sequence relatedness (Figure 4). The NifH of C. beijerinckii was the most similar to the
NifH of both C. acetobutylicum ATCC 824 and C. pasteurianum W5. The amino acid
sequence of NifH of C. beijerinckii shares 79.9 % and 85.0 % identity with the amino
acid sequences of NifH proteins of C. acetobutylicum ATCC 824 and C. pasteurianum
W5, respectively. The NifH of C. beijerinckii contained five conserved cysteine residues
located at positions 37, 82, 94, 129, 181. A Prosite search (http://us.expasy.org/prosite/)
for the presence of motifs and protein signatures revealed that the cysteine residues ( cys-
94 and cys-129 ) are possible ligands for the 4Fe4S cluster. In addition, the search
revealed an ATP-binding motif known as Walker’s motif A ( [AG]-x (4)-G-K-[ST] )
which is located between amino acids 8 and 16 and has an amino acid sequence of G-K-
G-G-I-G-K-S. This motif is common to many nucleotide-binding proteins. The
121
51,800
34,700
30,000
22,000
80,000
L
Figure 3. Estimation of the molecular weight of the iron protein of nitrogenase (NifH) of C .beijerinckii NRRL B593. Ten µg of crude extract was separated by SDS-PAGE with 12 % total
acrylamide on a minigel and transferred to a positively charged nitrocellulose membrane. The membranewas then incubated with an antiserum raised against NifH of Azotobacter vinelandii (A). Detection ofthe signal was achieved by using a chemiluminescent detection system. L stands for the ladder of pre-
stained SDS-PAGE standards (BioRad Lab, Hercules, CA, USA). The molecular weights of the pre-stained standards were the calibrated value for this lot given by the manufacturer. The molecular weightof the NifH protein was estimated as 32,900 (B).
Figure 4. Alignment of selected NifH sequences by the Clustal W method. The aminoacids are represented by the single-letter code. Identical residues are indicated by an asterisk(*); similar residues are indicated by one dot (low similarity) or two dots (high similarity).The GenBank accession numbers are C. beijerinckii, AF266462, C. acetobutylicum,
AE007538, C. pasteurianum, X07472, C. cellobioparum, U59414, Anabaena, AF124377,Nostoc, AF124379, M. thermoautotrophicum, X13830.
123
involvement of this region of Fe protein in nucleotide binding was initially recognized by
sequence analysis (Robson, 1984). Later, site directed mutagenesis of the residues in this
sequence confirmed the findings. In addition, the crystallographic data identified an ADP
molecule partially occupying this location (Georgiadis, 1992).
Analysis of amino acid sequences of the C. beijerinckii GlnB-like 1 and GlnB-like 2
proteins
The GlnB-like 1 protein of C. beijerinckii is comprised of 108 amino acids, with a
molecular weight of 12,000. The amino acid sequence of the GlnB-like 1 protein was
compared with some of the GlnB-like 1 protein sequences available in databases.
Alignment of the selected GlnB-like 1 protein sequences by the Clustal W method helped
to identify conserved regions and to show the degrees of sequence relatedness (Figure 5).
The GlnB-like 1 protein of C. beijerinckii exhibited the highest degree of sequence
similarity to the GlnB-like 1 protein of C. acetobutylicum ATCC 824. They share 62.6 %
of positional identity at the amino acid level. In addition, the alignment of eight
sequences revealed two highly conserved regions which are believed to be present in all
known GlnB-like proteins (Jiang et al., 1997). In C. beijerinckii, the region 1 is located
between amino acids 36 and 49, and contains a motif of G-x-G-x-x-x-G, which precedes
the active site tyrosine residue that may be involved in nucleotide binding. Comparison
of the SWISS-PROT protein signatures of E. coli GlnB protein with GlnB-like 1 protein
of C. beijerinckii showed that the spacing (seven versus nine residues) between the G-x-
G-x-x-x-G motif (blue residues in Figure 5) and the tyrosine residue (red residue in
Figure 5) as well as the hydrophobicity of the intervening amino acid residues differ
considerably, suggesting that GlnB-like 1 protein of C. beijerinckii may function
differently and may be subjected to a different kind of regulation than the E. coli protein
(Chen et al., 2001). The GlnB protein (PII ) of E. coli is urydylated on a tyrosine residue
to form GlnB-UMP, which allows deadenylation of glutamine synthetase, thus activating
124
the enzyme (Jiang et al., 1997). There are known GlnB-like proteins that are believed to
have a different role in regulation of nitrogen metabolism and be subjected to a different
kind of regulation than GlnB protein of E. coli. For example, the GlnB protein of
Synechococcus sp. is regulated by phosphorylation rather than urydylylation and has a
role in sensing nitrogen status, which is normally done by the Gln D protein
(Forchhammer, 1995). The phosphorylation site in this protein exhibits a R-x-S motif, a
characteristic recognition sequence for a cyclic AMP-dependent protein kinase. It is
interesting to note that the Swiss Prot database search for possible modification sites on
the GlnB-like protein 1 of C. beijerinckii revealed a consensus motif of K-x-x-E-x-x-Y
between amino acids 43 and 49. This pattern is known to be a possible tyrosine kinase
phosphorylation site.
It is well known that many organisms, e.g., Methanobacterium
thermoautotrophicum and Methanococcus jannaschii, do not have glnD homologues in
their genome, suggesting that the modification of GlnB in these organisms is not by
urydylylation (Arcondeguy, 2001). It would be interesting to see if there is (are) a GlnD
homologue(s) in the genome of C. beijerinckii, because GlnD is the protein that is
responsible for urydylylation of GlnB. A BLAST search of the genome sequence of C.
acetobutylicum ATCC 824 with the GlnD sequence of E. coli as the query did not reveal
a GlnD homologue. It is possible that C. beijerinckii also lacks a GlnD homologue
because the location and the organization of the glnB-like genes in C. acetobutylicum
ATCC 824 and C. beijerinckii NRRL B593 are similar.
The GlnB-like 1 protein of C. beijerinckii has a motif of G-D-G-K-I-F-V-x-x-I
located between amino acids 86 and 96. In E. coli, this motif forms part of the protein’s
T-loop and is important in interactions with small-molecule effectors and/or protein
Figure 5. Alignment of selected GlnB 1 protein sequences by the Clustal Wmethod. The amino acids are represented by the single-letter code. Identical residuesare indicated by an asterisk (*); similar residues are indicated by one dot (low similarity)or two dots (high similarity). The GenBank accession numbers are C. beijerinckii,
AF266462, C. acetobutylicum, NC_003030, C. cellobioparum, U59414, M. barkeri
(nifHD1 region), P54808, M. barkeri (nifHD2 region), P54807, M. maripaludis, P71524,M. ivanovii, P51603, M. thermolithotrophicus, P25771.
Figure 6. Alignment of selected GlnB 2 protein sequences by the Clustal Wmethod. The amino acids represented by the single-letter code. Identical residues areindicated by an asterisk (*); similar residues are indicated by one dot (low similarity) ortwo dots (high similarity). The GenBank accession numbers are: C. beijerinckii,
AF266462; C. acetobutylicum, NC_00303030; M. barkeri (nifHD1 region), P54809; M.
barkeri (nifHD2 region), P54806; M. maripaludis, P71525; M. ivanovii, P51604; M.
thermolithotrophicus, P25770.
127
The GlnB-like 2 protein of C. beijerinckii is comprised of 127 amino acids, with a
molecular weight of 13,966. Alignment of selected GlnB-like 2 proteins by the Clustal
W method helped both to identify conserved regions and to show the degree of sequence
relatedness (Figure 6). The GlnB-like 2 protein of C. beijerinckii exhibited the highest
degree of sequence similarity to the GlnB-like 2 protein of C. acetobutylicum ATCC 824,
and they share a 50 % positional identity. The GlnB-like 2 protein of C. beijerinckii and
C. acetobutylicum differ from the GlnB protein of methanogens in that the protein of the
two solvent-producing clostridia contains the proposed active site tyrosine, located eleven
amino acids after a GRG motif, whereas the protein of the methanogens (with the
exception of one of the two GlnB-like 2 proteins of Methanosarcina barkeri, SWISS-
PROT accession number P54807) does not contain this tyrosine residue. It is possible
that the GlnB-like 2 protein has a different function than the GlnB-like 1 protein.
Transcription analysis of genes of the nif cluster of C. beijerinckii
The nucleotide sequence of nifD, nifK, nifE, nifNB, fdxA, nirJ1, nirJ2, nirD, nirH,
nifV ω and nifVα of C. beijerinckii was determined in our laboratory (Toth and Chen,
unpublished data,). The sequence of these genes was used in the design of probes for the
transcriptional analysis of the nif cluster of C. beijerinckii in this study.
Transcription of the nif genes of C. beijerinckii was studied by Northern analysis.
HRP-labelled DNA probes, specific for nifH, glnB-like 2-nifD, nifE, nifNB, fdxA, nirJ1,
nirJ1-nirJ2-nirD, nirD alone and nifVω-nifVα, were used to investigate gene expression.
The relative locations of these probes are shown in Figure 7. Total RNA isolated from
nitrogen-fixing cells and non-nitrogen-fixing cells was used. The transcripts of the nif
and nif-associated genes were only detected in the RNA samples isolated from nitrogen-
fixing cells of C. beijerinckii with the exception of nifH, which can also be detected in the
RNA samples isolated from cells grown in a medium that was ammonium acetate-
supplemented.
128
Figure 7. Schem
atic representation of a 16-kb region of C. beijerinckii N
RR
L B
593 chromosom
e containing the nif andnif- associated genes. T
he
OR
Fs a
re sh
ow
n a
s op
en
bo
xes. T
he
lo
catio
ns o
f the
pro
be
s (1
through 9) used for transcriptionalanalysis of the nif cluster are show
n as solid black boxes underneath the OR
Fs. T
he proposed functions of the nif gene products
are: nifH, iro
n p
rote
in su
bu
nit, F
eM
o-co
bio
synth
esis ;
nifD, α
-sub
un
it of M
oF
e p
rote
in ; nifK
, β sub
un
it of M
oF
e p
rote
in ;
nifE and N
B, required for F
eMo-co biosynthesis ;
nifVα and Vω
, homocitrate synthase ;
glnB 1 and 2, P
II protein homologs ; fdx
, nifB-lin
ked
ferre
do
xin ; nirJ1, J2, D
, an
d H
, he
me
bio
synth
esis p
rote
in h
om
olo
gs. T
he
dire
ction
of tra
nscrip
tion
is from
left
to right. General references: C
hen et al., (1990) and Chen and Johnson, (1993). S
pecific references: nifH
, nifD, nifK
, Chen et
al., (1986) and Wang et al., (1987).
GlnB
-like 1 and 2, Chen et al., (2001).
nifVω and nifVα
, Wang et al., (1991).
fdxA, E
gener
et al., (2001). nir genes, Kaw
asaki et al., (1997).
nifH
glnB1
glnB2
nifD
nifK
nifE
nifNB
fdxA
nirJ1
nirJ2
nirDnirH
nifVω
nifVα
(1)(2)
(3)(4)
(5)
(6)
(7)
(8)
(9)
129
As shown in Figure 8, hybridizations with nifH (probe 1 in Figure 7) and glnB-like 2-nifD
(data not shown) DNA probes generated a distinct band with an estimated size of ~4.9
kb. The presence of a major transcript of 4.9 kb suggests that nifH, glnB-like 1, glnB-like
2, nifD and nifK are expressed as a unit. The length of the 4.9-kb band correlates closely
with the predicted length of the transcript extending from nifH to nifK (Table 1). When
total RNA isolated from the nitrogen-fixing cells was tested with a nifVω - nifVα probe
(probe 9 in Figure 7), a major band of ~1.7 kb was detected, suggesting that nifVω and
nifVα are also contained on a single message (Figure 9). The size of 1.7 kb also
correlates closely to the predicted length of a transcript extending from nifVω to nifVα
(Table 1).
A clear band of 2.5 kb was detected when a 2.5 kb probe (probe 4 in Figure 7)
covering part of nifNB gene was used (Figure 10). It is possible that the 2.5-kb message
only contains the nif NB mRNA. If this were the case, then one would expect to detect
another transcript when nifE was used as the probe in Northern hybridization. However,
efforts to detect the nifE message failed when a DNA probe (probe 3 in Figure 7)
covering part of the nifE gene was used. Therefore, it is possible that the 2.7-kb signal
arose from degradation of a larger transcript, which extends from nifE to nifNB, and the
nifE region was more susceptible to nuclease action.
To examine the transcription of nif-associated genes in the nif cluster, DNA
probes generated from fdxA (probe 5 in Figure 7), nirJ1(probe 6 in Figure 7) and nirD
(probe 8 in Figure 7) genes were used. These probes failed to detect a transcript from
RNA samples isolated from either nitrogen-fixing or non-nitrogen-fixing cells of C.
beijerinckii. Therefore, a larger probe (2.5 kb) covering nirJ2, most of nirJ1 and part of
nirD (probe 7 in Figure 7) genes was used in Northern blot analysis. The blot revealed a
weak but distinct 2.5 kb signal only in the RNA samples isolated from nitrogen-fixing
130
Name of the ORF Size of the ORF (bp)nifH 864
glnB-like 1 327
glnB-like 2 384
nifD 1587
nifK 1365
nifE 1365
nifNB 2691
fdxA 309
nirJ1 1170
nirJ2 984
nirD 469
nirH 468
nifVω 915
nifVα 783
Table 1. The size of the ORFs in the nif cluster of C. beijerinckii NRRL B593.
131
L 1 2 L 3 4 5 6 L
5.0 kb
0.5 kb
1.0 kb
2.0 kb
3.0 kb
9.0 kb7.0 kb
Figure 8. Northern blot analysis of the nifH mRNA from nitrogen-fixing cells of C.beijerinckii NRRL B593. Six µg of total RNA isolated from nitrogen-fixing cells of C.
beijerinckii were resolved on a 0.7 % formaldehyde-agarose gel (panel A). The RNA specieswere then transferred to a positively charged nylon membrane, and the membrane (panel B) wasincubated with 100 ng of a HRP-labeled nifH probe (probe1 in Figure 7) overnight. A ~4.9 kbsignal (panel C) suggested co-transcription of nifH, nifD and nifK together with glnB-like 1 and2. L is the standard RNA size ladder (New England Biolab products).
(A) (B) (C)
132
(A) (B)
0.2 kb
1.4 kb
2.4 kb
4.4 kb
7.5 kb9.5 kb
L 1 2 3 L 4 5 6 7 8 9 L
(C)
Figure 9. Northern blot analysis of the nifV mRNA from nitrogen-fixing cells of C.beijerinckii NRRL B593. Total RNA isolated from nitrogen-fixing cells of C. beijerinckiiwas resolved (12 µg in lane 1, 6 µg in lane 2, and 3µg in lane 3) on a 0.7 % formaldehyde-
agarose gel (panel A). The RNA species were then transferred to a positively charged nylonmembrane and the membrane (panel B) was incubated with 100 ng of a HRP-labeled nifV
probe (probe 9 in Figure 7) overnight. A ~1.6 kb signal (panel C, lanes 7, 8 and 9) suggestedco-transcription of nifVω and nifVα. L is the standard RNA size ladder (GibcoBRL
products).
133
5.0 kb
0.5 kb
1.0 kb
2.0 kb
3.0 kb
9.0 kb
7 8 9 LL 4 5 6L 1 2 3
Figure 10. Northern blot analysis of the nifNB mRNA from nitrogen-fixing cells of C.beijerinckii NRRL B593. Total RNA isolated from nitrogen-fixing cells of C. beijerinckiiwas resolved (2.1 µg in lane1, 1.4 µg in lane 2, and 0.7µg in lane 3) on a 0.7 %
formaldehyde-agarose gel (panel A). The RNA species were then transferred to apositively charged nylon membrane and the membrane (panel B) was incubated with 100ng of a HRP-labeled nifNB probe (probe 4 in Figure 7) overnight. A ~2.5 kb band (panelC) suggests the transcription of nifNB. L is the standard RNA size ladder (New EnglandBiolab products).
(A) (B) (C)
134
0.5 kb
1.0 kb
3.0 kb
(A) (B) (C)
L 1 2 3 L 4 5 6 7 8 9 L
9.0 kb7.0 kb5.0 kb
2.0 kb
Figure 11. Northern blot analysis of the nir mRNA. RNA samples from nitrogen-fixing( lane 3 in panel A), non-nitrogen fixing (lane 2 in panel A) and ammonia-treated (lane 1 inpanel A) cells of C. beijerinckii NRRL B593 were analyzed. Ten µg total RNA were
resolved on a 0.7 % formaldehyde-agarose gel (panel A). The RNA species were thentransferred to a positively charged nylon membrane and the membrane (panel B) wasincubated with 100 ng of HRP-labeled nir probe (probe 7 in Figure 7) overnight. A ~2.5 kbband was detected only in the RNA sample isolated from the nitrogen-fixing cells of C.
beijerinckii (panel C, lane 9). L is the standard RNA size ladder (New England Biolabproducts).
135
cells (Figure 11). The absence of this signal in RNA samples isolated from non-nitrogen-
fixing cells suggested that fdxA and nir genes may only be expressed under nitrogen-
fixing conditions. In addition, the absence of the signal in RNA samples isolated from
cells grown in ammonia-supplemented defined nitrogen-fixing medium indicated that
their expression might be regulated in parallel with the nif genes.
Nitrogen-fixing cultures of C. beijerinckii
An examination of cultures of C. beijerinckii grown in the defined nitrogen-fixing
medium for different lengths of time showed acetylene-reduction activity. However, a
comparison of the results indicated that the nitrogen-fixing activity fluctuated, suggesting
that active nitrogen fixation does not occur throughout growth and is subject to
regulation. To more closely examine the changes in nitrogen-fixing activity, larger
cultures (1 L) were grown and sampled periodically. Nitrogen-fixing activity in the
samples was measured by the whole-cell acetylene-reduction assay as described in
Materials and Methods.
In Figure 12, the growth characteristics of a nitrogen-fixing culture of C.
beijeirinckii are shown. In this particular culture, the whole cell acetylene-reducing
activity was measurable within two hours of inoculation and continued to increase for
seven hours. When the culture was nine hours old, the activity peaked and it was
approximately 15 U/ml of culture. After 19 hours of incubation, 56 % of the peak
nitrogen-fixing activity was lost and the activity was 6.6 U/ml of culture. A microscopic
examination of the culture showed highly motile, vegetative cells during the first nine
hours of growth. Parallel to the onset of the drop in nitrogen-fixing activity, cell
morphology had changed and some sluggishly motile and some nonmotile cells were
observed. At the end of growth, some cells formed mature spores but the number of
spores was not as high as that typically observed in cultures grown in complex media.
Although the microscopic observation detected actively growing cells, the growth rate
136
0.1
1
1 0
100
0 1 0 2 0 3 0 4 0 5 0
Figure 12 Growth of a nitrogen-fixing culture of C. beijerinckii NRRL B593. An activelygrowing culture in the PM was used to inoculate 45 mL SDM, which was prepared in 160-mLserum bottles and contained 4g/L ammonium acetate as the fixed nitrogen source. Thesecultures were allowed to grow at 35 oC without shaking and used as the inoculum for anotherbatch of cultures in SDM, which contained 0.5 g/L ammonium acetate as the fixed nitrogensource. These secondary cultures were used (10 %, v/v) to inoculate the DNFM. The culturein DNFM was sparged with a stream of nitrogen gas and continuously mixed with a magneticstirrer throughout incubation. Ten-ml samples were taken to monitor the growth, solventproduction and nitrogen-fixing activity.
Incubation Time (hr)
: n-b
utan
ol (
mM
)
: O.D
at 6
00 n
m
In v
ivo
nitr
ogen
-fix
ing
activ
ity (
U/m
L of
cul
ture
)
: iso
prop
anol
(m
M)
137
was slower in the defined nitrogen-fixing medium than in the non-nitrogen-fixing media
(a doubling time of 10±2 hr in SDM and 6 ± 0.5 hr in TYS versus a doubling time on
14±1 hr in the defined nitrogen-fixing medium). The conditions used in this experiment
(Figure 12) were used for other nitrogen-fixing cultures of C. beijerinckii. In each
growth study, the nitrogen-fixing activity showed a similar pattern: it increased during
the early-exponential growth phase and then decreased during the late-exponential
growth and stationary phases.
Nitrogen-fixing activity in cell-free extracts of C. beijerinckii NRRL B593
To examine the changes in in vitro nitrogen-fixing activity in relation to the
changes in in vivo nitrogen-fixing activity throughout growth, an 8-L culture of C.
beijerinckii was grown. The growth characteristics of this culture are shown in Figure
13, Panel A. An examination of in vivo nitrogen-fixing activities in samples isolated
periodically revealed a pattern similar to the one observed in the culture shown in Figure
12. At the time points indicated on the growth curve (with asterisk’s), up to 1L of the
culture was collected and the cell paste harvested and frozen in liquid nitrogen for
preparation of cell-free extracts. In cell-free extracts, the acetylene-reduction activity of
nitrogenase was measured as described in Materials and Methods.
The in vitro nitrogen-fixing activity pattern was different from the in vivo
nitrogen-fixing activity pattern. The level of in vitro nitrogen-fixing activity in the cell-
free extracts prepared from either the late-exponential phase or the early stationary phase
cells did not show a decrease with time. An average of 22 ± 1 nmoles of ethylene formed
per (min mg of protein). Evidently, the gradual decrease in in vivo nitrogen-fixing
activity towards the late-exponential phase of growth was not due to active destruction of
existing nitrogenase. It is perhaps a regulatory phenomenon that prevents the action of
nitrogenase when it is not needed.
138
Incubation time (hr)
(A)
0
20
40
60
80
100
1 2 3 4 5 6
4 hr 8hr 12hr 20hr 26hr 30hr
(B)
0.1
1
10
100
0 10 20 30 40
: In
vit
ro n
itrog
en-f
ixin
g ac
tivity
(U
/mg
of p
rote
in)
: In
vivo
nitr
ogen
-fix
ing
activ
ity (
U/m
L of
cul
ture
)
: OD
600
: PG
I act
ivity
(U
/mg
of p
rote
in)
% in
tens
ity
Figure 13. Changes in in vivo and in vitro nitrogen-fixing activities, and estimation ofthe amount of iron protein of nitrogenase in a nitrogen-fixing culture of C. beijerinckiiNRRL B593. Cells were grown in NFDM and harvested periodically throughoutincubation (marked by *). Cell-free extracts were prepared anaerobically. In Panel A,changes in in vivo ( ) and in vitro ( ) nitrogen-fixing activities and in panel B, changes inthe amount of iron protein of nitrogenase are shown. Open bars in panel B represent relativesignal intensities of each band as determined by densitometric analysis. The level of ironprotein of nitrogenase corresponded to the level of in vitro nitrogen-fixing activity. PGI(phosphoglucoisomerase) serves as the control.
**
* * * *
139
To confirm the finding, the relative amount of iron protein of nitrogenase was estimated
in the cell-free extracts by Western analysis. The result shown in Figure 13, Panel B
indicated a gradual increase in the amount of iron protein of nitrogenase until the culture
was 20 hr old. This time point was where 84 % of peak in vivo nitrogen-fixing activity
was lost. The amount of iron protein then leveled and did not change significantly in the
samples taken during the late-exponential growth and stationary phases (20, 26 and 30 hr
time points). Western analysis detected a single NifH band in cells harvested throughout
incubation.
The expression of the nifH gene in C. beijerinckii as examined by Northern
hybridization
In addition to the cells that were harvested for cell-free extract preparation, cells
were harvested throughout growth for the isolation of RNA. The time points indicated on
the growth curve in Figure 13 (with asterisks) represent approximate harvesting times for
RNA isolation, because the cells used for RNA isolation were harvested 20 to 30 min
later than the cells harvested for the preparation of cell-free extracts. Six µg of total RNA
per well were resolved on a 0.7 % formaldehyde-agarose gel and the gel was used in
Northern transfer as described in Materials and Methods. The resulting Northern
membrane was incubated with a 350-bp HRP-labeled nifH probe. The result of
hybridization is shown in Figure 14.
The strongest signal intensity was detected in the RNA sample isolated from cells
after 4 hr of growth. The intensity of the signal was also high in the RNA sample
isolated from cells after 8 hr of growth indicating that the nifH and possibly other nif and
nif-associated genes of C. beijerinckii were highly transcribed during the early stages of
growth. However, the drop in signal intensity after 12 hr of incubation indicated that
limited transcription of the nifH gene occurred after the early-exponential growth phase.
During the late-exponential growth and early-stationary phases, an almost constant level
140
Figure 14. Northern blot analysis of the nifH mRNA in samples of C. beijerinckii NRRLB593 isolated periodically. Cells were harvested throughout incubation and total RNA wasisolated with the guanidium isothiocyanate-acid phenol extraction method. Six µg of total RNA
per well were resolved on a 0.7 % formaldehyde-agarose gel. The RNA species were thentransferred to a positively charged nylon membrane by capillary elution with 20X SSC and theresulting membrane was incubated with a 350-bp HRP-labelled nifH probe at 42 0C in ahybridization buffer containing 0.5 M NaCl. For comparison, the membrane was stripped in0.1 % hot SDS solution and incubated with a HRP-labeled 16S rRNA probe. Open barsrepresent relative signal intensities of each band and they were determined by densitometricanalysis.
nifH
16S rRNA
4hr 8hr 12hr 20hr 26hr 30hr
0
20
40
60
80
100
1 2 3 4 5 6
0
20
40
60
80
100
1 2 3 4 5 6
% in
tens
ity%
inte
nsity
141
of nifH message was maintained as shown by the signal intensities in 12-, 20- and 26-hr
RNA samples being approximately equal. However, after 30 hr of incubation, there was
a considerable decrease in the intensity of the nifH signal indicating that the transcription
of the nif and possibly nif-associated genes was turned off as stationary phase was
approached. A closer examination of the changes in signal intensities by densitometric
analysis revealed a pattern similar to the one observed in in vivo nitrogen-fixing activity
(see Figure 13, Panel A).
For comparison, the same membrane was stripped in 0.1 % hot SDS solution and
incubated with a HRP-labeled 16S rRNA probe. This control experiment served the
purpose of determining whether the observed differences in the nifH signal intensity were
real or were due to inconsistencies during the determination of RNA concentration during
sampling application for electrophoresis and transfer of RNA species to the membrane.
The results showed that, although there were some minor differences in the signal
intensity of the 16S rRNA message, the changes were not significant and do not hinder
the interpretation of the changes in the intensity of the nifH signals.
The effect of ammonium acetate addition on in vivo nitrogen-fixing activity of C.
beijerinckii
To study the regulation of nitrogen fixation in C. beijerinckii, a filter-sterilized
stock solution of ammonium acetate was added to the nitrogen-fixing cultures during the
exponential growth phase (Figure 15, Panel A). Four different ammonium acetate
concentrations (2.0, 1.0 , 0.5 and 0.25 mM) were used. The addition was made when the
cultures were 10 hr old and the nitrogen-fixing activity was relatively high at 13.8 ± 1.3
U/ ml of culture. Two hours after the ammonium acetate addition, the cultures to which
ammonium acetate was added to a final concentration of 0.5, 1.0 or 2.0 mM lost ~85 %
of their peak in vivo nitrogen-fixing activities, and the culture to which ammonium
acetate was added to a final concentration of 0.25 mM lost ~37 % of its in vivo peak-
142
nitrogen-fixing activity. Four hours after ammonium acetate addition, however, the
cultures to which ammonium acetate was added to a final concentration of 0.25 , 0.5 or
1.0 mM recovered ~74.6 % of their in vivo peak-nitrogen-fixing activity and an average
of 10.3 ± 0.1 U/ml of culture. The culture to which ammonium acetate was added to a
final concentration of 2.0 mM failed to recover much of its peak in vivo nitrogen-fixing
activity, indicating that an ammonia concentration of 0.5 mM can prevent fixation of
nitrogen and a concentration above 0.5 mM can inhibit nitrogen fixation for a significant
period of time in cultures of C. beijerinckii under the growth conditions used in this
study.
The addition of ammonium acetate solution (0.225 mL) might introduce oxygen
into the growth medium, which can cause inactivation of nitrogenase and the observed
immediate drop in in vivo nitrogen-fixing activity. Therefore, the ammonium acetate
addition experiment was repeated with the inclusion of two control cultures. The first
control culture was not disturbed throughout the course of growth and was used to
monitor any changes in the growth environment that might have an effect on in vivo
nitrogen-fixing activity. To the second control culture, the same volume of water (0.225
mL) was added as a potential source of oxygen. The changes in in vivo nitrogen-fixing
activity of these cultures are shown in Figure 15, panel B.
The first control culture to which no addition was made showed an in vivo
nitrogen-fixing activity pattern similar to the one observed in routinely-grown nitrogen-
fixing cultures. The second control culture to which water was added also showed an in
vivo nitrogen-fixing activity pattern similar to the one observed in the first control
culture. Taken together, these two control cultures indicated that the drop in in vivo
nitrogen-fixing activity after ammonium acetate addition was not due to the introduction
of oxygen or any other changes that might have happened in the growth environment.
Unlike the first two control cultures, the third culture to which ammonium acetate was
143
added to a final concentration of 1 mM showed a 4.4-fold decrease in its peak in vivo
nitrogen-fixing activity two hours after the addition confirming the previously obtained
results.
Changes in in vitro nitrogen-fixing activity after ammonium acetate addition in
nitrogen-fixing cultures of C. beijerinckii
To examine the changes in in vitro nitrogen-fixing activity after ammonium
acetate addition, an 8-L culture of C. beijerinckii was grown and periodically sampled.
The growth characteristics of this culture are shown in Figure 16, Panel A. An
examination of in vivo nitrogen-fixing activities in samples harvested periodically
revealed a pattern that is similar to the one observed in the culture shown in Figure 15.
Ammonium acetate was added to the growth medium to a final concentration of 1 mM
during the exponential growth phase. Two hours after ammonium acetate addition, the
culture lost ~86 % of its peak in vivo nitrogen-fixing activity. After 2 more hr of
incubation, ~75 % of the original peak in vivo nitrogen-fixing activity was recovered to
approximately 15 U/mL of culture. At the time points indicated on the growth curve
(with asterisks), one liter of culture was collected and the cell pastes were frozen in liquid
nitrogen for preparation of cell-free extracts. In cell-free extracts, the acetylene-reduction
activity of nitrogenase was measured. The results shown in Figure 16, panel A showed
that the immediate drop (7.5-fold) observed in in vivo nitrogen-fixing activity after
ammonium acetate addition was not observed in in vitro nitrogen-fixing activity. Only
13 % of the in vitro activity was lost after ammonium acetate addition.
144
1
10
100
0 5 10 15 20 25 30 35 401
10
100
0 5 10 15 20 25 30 35
(A) (B)
Iin
vivo
nitr
ogen
-fix
ing
activ
ity (
U/m
L of
cul
ture
)
Incubation time (hr) Incubation time (hr)
Ammonium acetate Ammonium acetate/water
Figure 15. The effect of ammonia addition on in vivo nitrogen-fixing activity of C.beijerinckii NRRL B593. The nitrogen source, ammonium acetate, was added from a filtersterilized stock solution to nitrogen-fixing cultures (0.7 L) when the cultures had an average OD600
of 1.1 ± 0.1. In panel A, the effect of addition of four different ammonium acetate concentrations
on in vivo nitrogen-fixing activity is shown. The symbols represent: , 0. 25 mM final ammoniumacetate; , 0.5 mM final ammonium acetate; , 1.0 mM ammonium acetate; , 2.0 mM ammonium
acetate concentration. In panel B, the ammonia-addition study was repeated with two controlexperiments. In the first control experiment ( ), water was added as a possible source of residualoxygen to mimic the effect of oxygen which might be introduced into the medium whenammonium acetate was added. In the second control experiment ( ), the culture was not disturbedexcept during sampling to monitor the changes in nitrogen-fixing activity. To the third culture,ammonium acetate was added to a final concentration of 1 mM ( ). The arrows indicate the timeof addition of ammonium acetate or water.
Iin
vivo
nitr
ogen
-fix
ing
activ
ity (
U/m
L of
cul
ture
)
145
To confirm the presence of nitrogenase in ammonia-supplemented cells, the
amount of iron protein of nitrogenase was estimated in the cell-free extracts by western
analysis (Figure 16, panel B). The protein level on the Western blot corresponded to the
level of in vitro nitrogen-fixing activity. One significant observation made from the
result of Western analysis was the absence of posttranslational modification of iron
protein of nitrogenase after ammonium acetate addition. A single NifH band was
detected in all of the samples taken throughout incubation. In a number of nitrogen-
fixing bacteria, nitrogenase is posttranslationally regulated by reversible ADP-
ribosylation of the iron protein of nitrogenase. This modification can produce a mobility
shift during gel electrophoresis that is detectable by Western blotting (Grunwald et al.,
2000). Apparently, C. beijerinckii does not use this mechanism to regulate its nitrogen-
fixing activity.
The effect of ammonium acetate addition on transcription of the nifH gene
In addition to the cells that were harvested for cell-free extract preparation, cells
were harvested before and after ammonium acetate addition for the isolation of RNA. As
described previously, a Northern blot was generated and incubated with a 350-bp HRP-
labeled nifH probe. The result of the hybridization study is shown in Figure 17. The
strongest signal intensity was detected in the RNA sample isolated from cells after 4 hr of
growth. This time point was where in vivo nitrogen-fixing activity peaked. Two hours
after the addition of ammonium acetate, a significant decrease in the intensity of the nifH
signal was observed. Four hours after the addition of ammonium acetate, the nifH signal
completely disappeared indicating that the cells either stopped or considerably decreased
the transcription of the nifH gene and degraded the previously made mRNA. For
146
Incubation time (hr)
(A)
4 hr 6hr 8hr 12hr 20hr
(B)
0.1
1
1 0
100
0 5 1 0 1 5 2 0 2 5
: In
vitr
o ni
trog
en-f
ixin
g ac
tivity
(U
/mg
of p
rote
in)
: OD
600
: PG
I act
ivity
(U
/mg
of p
rote
in)
0
2 0
4 0
6 0
8 0
100
1 2 3 4 5
% in
tens
ity
Figure 16. Changes in in vivo and in vitro nitrogen-fixing activities, and estimation ofthe amount of iron protein of nitrogenase before and after ammonia addition to C.beijerinckii NRRL B593. The nitrogen source, ammonium acetate, was added to a finalconcentration of 1 mM from a filter sterilized stock solution to an 8-L nitrogen-fixingculture of C. beijerinckii when the culture OD600 was 0.8. Cells were harvested periodically(marked by the *) throughout incubation and cell-free extracts were prepared anaerobically.In panel A, changes in in vivo ( ) and in vitro ( ) nitrogen-fixing activities and in panel B,
changes in the amount of iron protein of nitrogenase are shown. Open bars in panel Brepresent relative signal intensities of each band as determined by densitometric analysis.The level of iron protein of nitrogenase corresponded to the level of in vitro nitrogen-fixingactivity. PGI (phosphoglucoisomerase) serves the control.
* **
* *
Ammonium acetate
:Iin
viv
o ni
trog
en-f
ixin
g ac
tivity
(U
/mL
of c
ultu
re)
147
comparison, the same membrane was stripped in 0.1 % hot SDS solution and incubated
with a HRP-labeled 16S rRNA probe. Although there were some minor differences in
signal intensities of 16S rRNA message, the changes were not significant and do not
hinder the interpretation of the results.
Nitrogen-fixing cultures of C. pasteurianum
Nitrogen-fixing cultures of C. pasteurianum were routinely grown in a defined nitrogen-
fixing medium in 1-L culture flasks for the purpose of comparison. The growth
characteristics of a 1-L nitrogen-fixing culture of C. pasteurianum are shown in Figure
18, panel A. To start the culture, an inoculum (10 % v/v) grown in a defined nitrogen-
fixing medium was used. When the culture was 3 hr old, the nitrogen-fixing activity was
already 1.4 times higher than the peak nitrogen-fixing activity observed in the nitrogen-
fixing culture of C. beijerinckii (Figure 12) and approximately 22 U/ml of culture. Four
more samples were taken and assayed for nitrogen-fixing activity. Unlike C. beijerinckii
which showed a sharp decrease in nitrogen-fixing activity towards the late-exponential
phase of growth, the nitrogen-fixing activity of C. pasteurianum remained reasonably
constant during the first 25-hr measuring period.
The effect of ammonium sulfate and ammonium acetate additions on in vivo
nitrogen-fixing activity of C. pasteurianum
Unlike the nif clusters of C. beijerinckii and C acetobutylicum, the nif cluster of C.
pasteurianum does not contain glnB-like genes whose protein products may serve an
important function in the regulation of nitrogen fixation. In addition, our efforts to show
the presence of glnB-like genes in the genome of C. pasterianum by Southern analysis
(by Julianna Toth) and to show the presence of glnB-like mRNA by Northern analysis
(by me, performed with the RNA samples isolated from nitrogen-fixing, non-nitrogen-
fixing and ammonia-supplemented cells) have not produed a positive signal (data not
148
4hr 6hr 8hr 12hr 20hr
Figure 17. Northern blot analysis of the nifH mRNA in samples of C. beijerinckii NRRLB593 isolated periodically before and after ammonia addition. Ammonium acetate wasadded to a final concentration of 1 mM from a filter sterilized stock solution to an 8-L nitrogen-fixing culture of C. beijerinckii when the culture OD600 was 0.8. Cells were harvestedperiodically throughout incubation and total RNA was isolated from fresh cells with theguanidium isothiocyanate-acid phenol extraction method. Six µg of total RNA per well were
resolved on a 0.7 % formaldehyde-agarose gel. The RNA species were then transferred to apositively charged nylon membrane by capillary elution with 20X SSC and the resultingmembrane was incubated with a 350-bp HRP-labeled nifH probe at 42 0C in a hybridizationbuffer containing 0.5 M NaCl. For comparison, the membrane was stripped in 0.1 % hot SDSsolution and incubated with a HRP-labeled 16S rRNA probe. Open bars represent relative signalintensities of each band as determined by densitometric analysis.
0
20
40
60
80
100
1 2 3 4 5
0
20
40
60
80
100
1 2 3 4 5
nifH
16S rRNA
% in
tens
ity%
inte
nsity
149
shown). It is possible that C. pasteurianum does not have glnB-like genes in its genome.
Therefore, it is reasonable to expect differences in the regulation of nitrogen fixation
between C. pasteurianum and C. beijerinckii or C. acetobutylicum.
To study the regulation of nitrogen fixation in C. pasteurianum, either ammonium acetate
(to a final concentration of 4 mM) or ammonium sulfate (to a final concentration of 2
mM) was added to 1-L nitrogen-fixing cultures during the exponential growth phase.
The growth characteristics of a culture to which ammonium sulfate was added to a final
concentration of 2 mM are shown in Figure 18, panel B. Addition of ammonium sulfate
did not affect the already present in vivo nitrogen-fixing activity. However, the synthesis
of nitrogenase stopped after the addition of ammonium sulfate and the specific in vivo
nitrogenase activity dropped (Figure 18, Panel B) due to cellular dilution of nitrogenase.
Repeated experiments using either ammonium sulfate or ammonium acetate as the
nitrogen source confirmed the findings (data not shown).
In vitro nitrogen-fixing activity after ammonium acetate addition in nitrogen-fixing
cultures of C. pasteurianum
To examine the in vitro nitrogen-fixing activity after ammonium acetate addition,
an 8-L culture of C. pasteurianum was grown in a defined medium (Figure 19, panel A).
An examination of in vivo nitrogen-fixing activities in samples isolated periodically
revealed a pattern that is similar to the one observed in the culture shown in Figure 18.
At each time point indicated with an asterisk on the growth curve, one liter of culture was
harvested and the cell paste was frozen in liquid nitrogen for the preparation of cell-free
extracts, in which the nitrogenase activity was measured. The addition of ammonium
acetate did not affect in vitro nitrogen-fixing activity of C. pasteurianum. It averaged of
59 ± 5 nmoles of ethylene formed per (min mg of protein) both before and after
ammonium acetate addition. When the amount of iron protein of nitrogenase was
150
: In
vivo
nitr
ogen
-fix
ing
activ
ity (
U/m
L of
cul
ture
)
: nm
oles
C 2H
4/ m
in. m
L
Incubation time (hr)
0.1
1
10
100
0 2 4 6 8 10
: OD
600
0.1
1
10
100
0 5 10 15 20 25 30 35
Incubation time (hr)
Ammoniun sulfate/Water
Figure 18. Growth characteristics of a nitrogen-fixing culture of C. pasteurianum W5(panel A) and the effect of ammonia addition on in vivo nitrogen-fixing activity (panel B).An actively growing potato culture was used to inoculate 45-mL defined medium which wasprepared in 160-mL serum bottles for growth of C. pasteurianum. These bottle cultures wereallowed to grow at 35 oC without shaking and 10 % (v/v) was used to inoculate nitrogen-fixing
defined medium prepared in serum bottles. These secondary cultures were allowed to grow at35 oC without shaking and 10 % (v/v) was used to inoculate nitrogen-fixing defined mediumprepared in 1-L culture flasks. The medium was sparged with a stream of nitrogen gas andcontinuously mixed with a magnetic stirrer throughout incubation. Ten-mL samples were takento monitor the growth and nitrogen-fixing activity. To study the effect of ammonia,ammonium sulfate was added from a filter sterilized stock solution to a final concentration of 2mM when OD600 was 1.8. The filled symbols ( , , ) represent the control culture to whichwater was added as oxygen source to mimic the effect of adding ammonia, which alsointroduced oxygen to the culture when added from a filter sterilized stock. The arrow indicatesthe time of ammonium sulfate and water additions.
(A) (B)
: OD
600 x
(0.
1)
: nm
oles
C 2H
4/ m
in. m
L
: In
vivo
nitr
ogen
-fix
ing
activ
ity (
U/m
L of
cul
ture
) x
(0.1
)
151
estimated in the cell-free extracts by Western analysis (Figure 19, panel B), the protein
level corresponded to the level of in vitro nitrogen-fixing activity.
The effect of ammonium acetate addition on the transcription of the nifH1 gene of
C. pasteurianum
In addition to the cells that were harvested for cell-free extract preparation, cells were
harvested both before and after ammonium acetate addition for the isolation of RNA. As
described previously, a Northern blot was generated and incubated with a 350-bp HRP-
labeled nifH1 probe. The result of the hybridization experiment is shown in Figure 20. A
distinct 4.0-kb signal indicated the presence of a polycistronic mRNA harboring the
transcripts of nifH1, nifD and nifK. A closer examination of the signal intensities
revealed the effect of ammonium acetate on transcription of the nif genes of C.
pasteurianum. The 4.0-kb signal completely disappeared three hours after ammonium
acetate addition (as shown in the 8-hr lane in Figure 20). Ammonium acetate was added
to the culture after 5 hr of incubation. Reappearance of the 4.0-kb signal later indicated
the depletion of ammonium acetate from the medium. For comparison, the same
membrane was stripped in 0.1 % hot SDS solution and incubated with a HRP-labeled 16S
rRNA probe. The results showed that, although there were some minor differences in
signal intensities of 16S rRNA message, the changes were not significant and do not
hinder the interpretation of the intensities of the nifH1 signals.
152
0
20
40
60
80
100
1 2 3 4 5
Ammonium acetate
: nm
oles
C 2H
4 fo
rmed
/ m
in m
L(A)
3hr 8hr 11hr 15hr 27hr
0.1
1
10
100
0 5 10 15 20 25 30
: PG
I act
ivity
(u/
mg
of p
rote
in)
(B)
Figure 19. Changes in in vivo nitrogen-fixing activity, and estimation of the amount of ironprotein of nitrogenase before and after ammonia addition in C. pasteurianum W5.Ammonium acetate was added to a final concentration of 4 mM from a filter-sterilized stocksolution to an 8-L nitrogen-fixing culture of C. pasteurianum when OD600 was 1.0. Cells wereharvested periodically (marked by *) throughout incubation and cell-free extracts were preparedanaerobically. In panel A, changes in in vivo ( ) and in vitro ( ) nitrogen-fixing activities and in
panel B, changes in the amount of iron protein of nitrogenase are shown. Open bars in panel Brepresent relative signal intensities of each band as determined by densitometric analysis. Thearrow in panel A indicates the time of ammonium acetate addition.
**
* *
% in
tens
ity
: In
vivo
nitr
ogen
-fix
ing
activ
ity (
U/m
L of
cul
ture
)
Incubation time (hr)
153
3hr 8hr 11hr 15hr 27hr
% in
tens
ity%
inte
nsity
nifH1
16S rRNA
Figure 20. Northern blot analysis of the nifH1 mRNA in periodically isolated samples ofC. pasteurianum W5 before and after ammonia addition. Cells were grown in NFDM andharvested periodically throughout incubation and total RNA was isolated from fresh cells withthe guanidium isothiocyanate-acid phenol extraction method. Six µg of total RNA per well
were resolved on a 0.7 % formaldehyde-agarose gel. The RNA species were then transferred to
a positively charged nylon membrane by capillary elution with 20X SSC and the resultingmembrane was incubated with a 350-bp HRP-labelled nifH1 probe at 42 0C in a hybridizationbuffer containing 0.5 M NaCl. For comparison, the membrane was stripped in 0.1 % SDSsolution and incubated with a HRP-labeled 16S rRNA probe. Open bars represent relativesignal intensities of each band as determined by densitometric analysis. The arrow indicatesthe position of nifH1 mRNA.
0
2 0
4 0
6 0
8 0
100
1 2 3 4 5
0
20
40
60
80
100
1 2 3 4 5
154
DISCUSSION
Organization of the nif and nif-associated genes
It is well known that nitrogenase genes and proteins are conserved across a broad
range of phylogenetically diverse nitrogen-fixing organisms. Despite the conservation in
nitrogenase genes, the organization of nitrogenase genes is more diverse than the
diversity in nitrogenase genes themselves. Such diversity may indicate distinct control
elements to coordinate the expression of nif genes of different types of nif clusters. In C.
pasteurianum, three consecutive groups of nif genes are present. The first group consists
of structural genes (nifH1, nifD and nifK) for nitrogenase. The second group contains
nifE and the fused nifN-B genes and the third group contains the split nifVω and nifVa
genes. There are two intervening open reading frames (modA and modB) present
between nifN-B and nif Vω and their protein products are possibly involved in molybdate
transport (Chen et al., 1990). In C. acetobutylicum, a similar organization is observed
with two major differences. The first difference is the absence of mod genes between
nifNB and nifVω, and the second difference is the presence of two open reading frames
(glnB-like 1 and glnB-like 2) between nifH and nifD. In C. beijerinckii, however, in
addition to the glnB-like 1 and glnB-like 2 genes observed between nifH and nifD, the
major nif cluster contains five more nif-associated ORFs. These five ORFs potentially
encode a two-iron ferredoxin (fdxA) (Mulligan et al., 1988) and four proteins (nirJ-1,
nirJ-2, nirD, nirH) for nitrite metabolism (Kawasaki et al., 1997). It appears from the
comparison of nif clusters of these three clostridial species that the fused nifNB and the
split nifVω and nifVα genes are the landmarks of the clostridial nitrogen-fixing system.
In eubacteria, the nitrogenase structural genes are usually contiguous. However,
in all known nif clusters of methanogens, two open reading frames (the nifH proximal-
ORF and the nifH distal-ORF) resembling glnB are located between nifH and nifD. Like
methanogens, the presence of two glnB-like genes between nifH and nifD in C.
155
beijerinckii and C. acetobutylicum is observed suggesting that similar regulatory control
mechanisms may coordinate the expression of nif genes in these organisms.
Transcriptional analysis of genes in the nif cluster of C. beijerinckii
The use of nine different probes revealed the presence of four different
transcripts. Two of these transcripts had the predicted sizes. The first predicted
transcript (4.9 kb) harbors the messages for the nifH, glnB-like 1, glnB-like 2, nifD and
nifK genes and was easily detected with the probes generated from the nifH and the glnB-
like 2-nifD gene regions. The transcriptional linkage of the glnB-like genes with the
nitrogenase structural genes may imply a role for the glnB genes in the regulation of
nitrogen fixation in C. beijerinckii. The second predicted transcript (1.7 kb) was a
mRNA harboring the nifVω and nifVα genes. However, the signals detected by the DNA
probes specific for nifNB genes and nirJ2, nirD, nirH and part of nirJ1were weak and
the sizes (2.5 kb) were smaller than the predicted (4.0 kb and 3.2 kb, respectively).
Either degradation of mRNA during isolation or poor specificity of the DNA probes may
have caused the detection of transcripts of a smaller size. However, defined mRNA
bands of expected sizes were detected when the same RNA preparations were
characterized with other DNA probes. Therefore, the smaller transcripts might not be
due to the degradation of mRNA during isolation. Partial degradation of a transcript,
which may have a short half-life, may generate hybridizing bands of a smaller size on the
blots. Therefore, it may be speculated that the transcripts of the nifE, nifNB, fdxA and nir
genes are relatively unstable and can be degraded shortly after translation. By examining
the organization of the nif cluster and the spacing between genes, it is possible to predict
that the nifE and nifNB genes may be on a polycistronic mRNA and the nir genes may be
on another polycistronic mRNA. However, the fdxA gene can be cotranscribed either
with the nir genes or the nifE and nifNB genes or be transcribed by itself.
156
Similar results were obtained when expression of the nif genes was examined in
the cyanobacterium Synechococcus sp. (Huang et al., 1999). The signals detected by the
DNA probes specific for either the nifE or nifN genes of Synechococcus sp were smaller
in size than the predicted sizes. In addition, Northern hybridizations with a probe
generated from the fdx gene did not yield a clear signal, making it difficult to study the
expression of this gene.
In Methanosarcina barkeri and Methanococcus thermolithotrophicus,
hybridization with the nifH probe revealed a single polycistronic mRNA encompassing
the nifH, glnB-like 1, glnB-like 2, nifD and nifK genes (Souillard and Sibold, 1989 ;
Chein and Zinder, 1996). However, in Methanococcus maripaludis, although the nifH
and glnB-like genes were cotranscribed, the transcript did not include the nitrogenase
structural genes nifD and nifK (Kessler et al., 1998). Additional transcripts carrying nifD,
nifK and both were found when probes generated from internal fragments of these genes
were used. In addition, an independent transcript carrying only the glnB-like genes was
detected with probes generated from internal fragments of the glnB-like genes.
Therefore, the regulation of nitrogen fixation in M. maripaludis may differ significantly
from C. beijerinckii and other methanogens. The presence of independent nifD and nifK
transcripts is not unique to M. maripaludis. In Azotobacter vinelandii (Jacobson et al.,
1989) and Azospirillum brasilense (de Zamaroczy et al., 1989), mRNA containing just
nifH or containing nifH with nifD or with both nifD and nifK were observed.
The gradual decrease in in vivo nitrogen-fixing activity in cultures of C. beijerinckii
The growth characteristics of nitrogen-fixing cultures of C. beijerinckii and C.
pasteurianum differed significantly. In C. beijerinckii, the in vivo nitrogen-fixing activity
gradually dropped towards the late-exponential growth and stationary phases, whereas in
C. pasteurianum, the activity did not change significantly throughout incubation.
Because nitrogen fixation is dependent on the available energy and reductant, the drop in
157
nitrogen-fixing activity in C. beijerinckii may be due to changes in energy and redox
status. During early stages of growth (acid producing phase), like C. pasteurianum, C.
beijerinckii produces acetate and butyrate. Although production of butyrate is redox
neutral, production of acetate results in a net production of 2 moles of NADH. Also
oxidation of pyruvate to acetyl-CoA generates reduced ferredoxin. Because only a
portion of acetyl~CoA is converted to butyrate, there is always an excess in NAD(P)H
during the acid-producing growth phase. In ammonia-grown cells, this NAD(P)H can be
disposed of through ferredoxin (Fd) via the NAD(P)H-Fd oxidoreductase and the
reduced Fd can provide electrons to hydrogenase for hydrogen gas production. Under
nitrogen-fixing conditions, part of the excess NADH may be directed to nitrogen fixation
to satisfy the need for electrons. As the culture continues to grow, however, a shift from
acid production to solvent production occurs in metabolism of C. beijerinckii (but not in
C. pasteurianum) and additional routes for the use of reducing equivalents open via
aldehyde- and alcohol-dehydrogenase reactions, which may limit the amount of electrons
available for the nitrogen-fixing reaction.
In addition to the changes in redox balances, changes in available ATP occur after
the metabolic shift. During the acid-producing phase of growth, C. beijerinckii can
satisfy the ATP requirement of the nitrogen-fixing reaction because there is a net of 3.25
moles of ATP production per glucose molecule consumed (Jones and Woods, 1986).
However, after the switch to solvent-producing phase of growth, apart from the ATP
produced during glycolysis, ATP production via the synthesis of acetate and butyrate
decreases and the ATP balance drops to below 3.25 moles of ATP per mole of glucose
consumed. This situation implies that a more limited supply of ATP is available for
nitrogenase reaction during the solvent-producing phase of growth, which may limit the
nitrogen-fixing activity.
158
Regulation of nitrogen fixation in C. beijerinckii and the presence of ammonia
switch-off
Nitrogen fixation requires an ample amount of energy and hence is rigorously
regulated. For every electron that flows to dinitrogen, at least two ATP molecules are
hydrolyzed (Burris, 1991). In several diazotrophs, when a fixed-nitrogen source is
supplied to a nitrogen-fixing culture, nitrogen fixation is immediately stopped. The
immediate cessation of nitrogen fixation is called ammonia switch-off (Kessler et al.,
2001). In rhodobacteria, ammonia switch-off is often achieved by posttranslational
modification (ADP-ribosylation) of the iron protein of nitrogenase (Pierrard et al., 1993).
The results of this study revealed the presence of ammonia switch-off in C. beijerinckii.
The in vivo characteristics of the switch-off in C. beijerinckii are similar to those
of other bacteria and methanogens. It occurs quickly and it is reversible. However,
evidence provided in this study indicated that the mechanism of ammonia switch-off in
C. beijerinckii appears to be different than the well-known ADP-ribosylation system.
The appearance of a single band in Western blots suggested that the switch-off in C.
beijerinckii does not involve ADP ribosylation of the iron protein of nitrogenase. It is
possible that the switch-off is caused by some type of modification that was not
detectable by a change in mobility on the SDS-PAGE used here. It is also possible that
the switch-off is caused either by a noncovalent association of the iron protein of
nitrogenase with another factor or reversible covalent modification of a Nif protein other
than the iron protein of nitrogenase. However, the similarity in rates of in vitro
acetylene-reducing activity in samples isolated periodically taken before and after the
ammonia switch-off suggest that C. beijerinckii may achieve ammonia switch-off not by
modifying the enzyme but by preventing electron flow to nitrogenase. As originally
proposed by Lanne et al. (1980) for A. vinalendii, a similar hypothesis was previously
159
proposed by other investigators that the immediate switch-off is due to an unknown effect
of ammonia on electron flow to nitrogenase.
Unlike C. beijerinckii, the results obtained in this study and the results reported by
Mortenson and his coworkers (Daesch and Mortenson, 1972; Seto and Mortenson, 1974;
Upchurch and Mortenson, 1980) indicate that C. pasteurianum does not have an
ammonia switch-off mechanism. When nitrogen-fixing cells of C. pasteurianum are
given a good nitrogen source, such as ammonium acetate, the measured in vivo
nitrogenase activity remains constant after ammonia addition. However, ammonia acts to
repress nitrogenase synthesis in C. pasteurianum because Northern blot analysis showed
complete disappearance of the nifH1 mRNA after ammonia addition. Therefore, the loss
of nitrogen-fixing activity of C. pasteurianum after ammonia addition is solely due to the
dilution of the cellular enzyme level rather than active destruction or inhibition of the
existing protein.
Ammonia switch-off does not affect transcription and mRNA stability of the nif
genes in M. maripaludis (Kessler et al., 2001) suggesting that, in some methanogens,
ammonia switch-off may have no marked effect on either nif gene transcription or nifH
mRNA stability. The results of Northern analysis in this study, however, showed that
transcription of the nif genes and the stability of the nifH mRNA are altered during
ammonia switch-off in C. beijerinckii..
Despite the lack of knowledge regarding the mechanism of different types of
ammonia switch-off, there is genetic evidence about the genes that are required. In M.
maripaludis, in-frame deletions and genetic complementation analysis showed that both
the glnB-like 1 and 2 genes are required for ammonia switch-off. It is possible that the
glnB-like 1 and 2 genes of C. beijerinckii have a similar function to those of M.
maripaludis, becasue the position of these genes in the nif clusters of both organisms is
the same. Such a rapid switch-off mechanism also occurs in Azoarcus sp. without a
160
modification of iron protein of nitrogenase (Egener et al., 2001). Surprisingly, this
organism lacks the glnB-like genes in its nif cluster. However, a fdxN gene encoding a
4Fe4S ferredoxin was located downstream of the nifHDK operon. Deletion studies
involving the nif cluster of Azoarcus sp. showed that the fdxN gene is required for rapid
switch-off of nitrogen-fixing activity and the mutant strains lacking the fdxN gene did not
cease to reduce acetylene after introduction of ammonia to nitrogen-fixing cultures. In C.
beijerinckii, a nifB-adjacent fdxA gene, which may encode a 2Fe2S ferredoxin, was
identified (Toth and Chen, unpublished results). However, the physiological function of
this gene is not known. Similarly, in other organisms where a nifB-adjacent fdx gene was
identified, the function of the fdx gene also remains to be determined.
161
CHAPTER 6
Presence of a second NifH-like polypeptide in Clostridium pasteurianum
ABSTRACT
Clostridium pasteurianum possesses six nifH-like sequences. Among them, nifH1
encodes the functional iron protein of the nitrogenase enzyme complex. Previously, with
the exception of nifH3, the transcripts of all of these nifH sequences were detected in
nitrogen-fixing cells by S1-nuclease mapping and primer extension analysis. However,
aspects pertaining to the size of the transcripts, the expression level and the presence of
the protein products of these nifH-like sequences were not thoroughly investigated. In
the present study, the presence of nifH2/H6 mRNA was demonstrated by Northern blot
analysis and Reverse Transcription (RT)-PCR with nitrogen-fixing cells of C.
pasteurianum. Northern blot analysis of RNA isolated from periodically collected cell
samples showed that nifH1 and nifH2/H6 mRNAs were expressed throughout growth.
Addition of ammonium acetate affected the transcription of these genes similarly.
Western blot analysis detected two NifH-like bands in nitrogen-fixing cell-free extracts
when an antibody raised against NifH protein of Azotobacter vinelendii was used. The
two polypeptides were separated by preparative gel electrophoresis and characterized by
MALDI-TOF (Matrix-Assisted Laser Desorption Ionization Time-Of-Flight mass
spectrometry) analysis. The results suggested the expression of NifH2/H6 protein in
addition to NifH1 in nitrogen-fixing cells of C. pasteurianum. Whether or not the
NifH2/H6 protein plays a role in nitrogen fixation remains to be determined.
162
INTRODUCTION
C. pasteurianum is a gram positive, anaerobic, free-living nitrogen-fixing
bacterium. This species has historical importance in nitrogen-fixation studies because it
was the first free-living nitrogen-fixing organism isolated, and the first consistent cell-
free nitrogen fixation was demonstrated with this organism (Mortenson, 1965).
Extensive nitrogen fixation studies have been performed with C. pasteurianum and
information that is relevant to the regulation of nitrogen fixation (Deasch and
Moertenson, 1972 ; Upchurch and Mortenson, 1980), identification of the structural
genes of nitrogenase component proteins (Fe- and MoFe-proteins) (Wang et al., 1988),
solution of the X-ray crystal structure of MoFe protein (Kim and Rees, 1993; Bolin et al.,
1993), the sequences of the nif and nif-associated genes, their organization and putative
functions (Chen et al., 1990) has been obtained. Among the distinctinctive properties of
C. pasteurianum nif genes is the presence of multiple nifH-like sequences. Previously,
Chen et al. (1986) identified multiple nifH-like sequences in C. pasteurianum by using a
cloned DNA fragment (nifHDK) of Klebsiella pneumonia as the probe and obtained
nucleotide sequences of three of these nifH-like genes. Subsequent cloning studies
revealed the nucleotide sequences of the remaining three nifH-like genes (Wang et al.,
1988). The nifH1 gene encodes a polypeptide of 273 amino acids (Chen et al., 1986),
which are identical to those determined from the isolated iron protein (Tanaka et al.,
1977). The nifH2 gene is located upstream of the nifH1 gene and encodes a polypeptide
of 272 amino acids; 23 of which are different from those of NifH1. NifH3 is the most
distinct among the six NifH-like polypeptides of C. pasteurianum because it has 97
different amino acids from NifH1 and is believed to belong to an alternative nitrogen-
fixing system (Chen et al., 1990). There are only two amino acid differences between
NifH5 and NifH1, whereas NifH2 and NifH6 differ from each other by only one amino
acid (Ala↔Gly), which is caused by a single nucleotide change.
163
With the exception of nifH3, transcripts of nifH-like genes were identified by S1-
nuclease mapping and primer extension analysis in nitrogen-fixing cells (Wang et al.,
1988). The amino acid sequencing results of the NifH1 protein, however, showed that
the purified NifH1 protein does not contain any measurable amount of the products from
the other nifH-like sequences. During this study, in an attempt to study nifH1 expression
in samples isolated periodically from nitrogen-fixing cells of C. pasteurianum, a second
nifH-like mRNA of the size of 0.9 kb was detected in Northern blot analysis. The
message was identified as nifH2/H6 by sequencing the cDNA strands, which were
generated by RT- PCR. This observation strengthened the possibility of the presence of
the NifH2/H6 polypeptide in nitrogen-fixing cells. SDS-PAGE and Western blot
analyses were then used to identify NifH-like polypeptides in cell-free extracts. Two
different NifH-like polypeptides were detected.
164
RESULTS
Detection of a second nifH-like mRNA in C. pasteurinum
In addition to the 4.0-kb polycistronic mRNA that harbors the structural genes of
the molybdenum-containing nitrogenase, a second transcript of the size of 0.9 kb was
detected in nitrogen-fixing cells of C. pasteurianum (Figure 1, Panel A). The smaller
transcript might have arisen from either degradation or processing of the 4.0-kb message.
However, the high intensity and the sharpness of the 0.9-kb signal suggested that it was a
distinct message that is transcribed from a nifH1-related gene of C. pasteurianum. With
the RNA molecular weight markers and the X-ray films as references, the 0.9-kb message
was localized and a specific portion (at around 0.9-kb region) of the membrane was cut
out and used in an RT-PCR experiment. A 350-bp fragment was amplified. The size of
the PCR product was in agreement with that which can obtained by PCR reaction using
genomic DNA as the template. To make sure that the amplified product is not due to
genomic DNA contamination, a positive and three negative control reactions were
examined. The positive control reaction used an RNA sample isolated from nitrogen-
fixing cells of C. pasteurianum as the template, and it generated a 350-bp product. The
first negative control reaction was run with a membrane piece cut out from the 2-kb
region. The second negative control reaction was run with a RNA sample isolated from
non-nitrogen fixing cells of C. pasteurianum (grown in a complex medium containing 5
g/L yeast extract and 1g/L tryptone). The third negative control reaction was run without
the enzyme reverse transcriptase. No products were amplified in any of the negative
control reactions indicating the reliability of the results (Figure 1, Panel B).
To identify the 0.9-kb message, the amplified cDNA strands were purified,
concentrated and sent to the sequencing facility at Davies company (Davies, California,
USA). The obtained sequence was then used to search the GenBank at
165
0.5 kb
1.0 kb
2.0 kb
3.0 kb
5.0 kb
7.0kb
9.0kb
(A) (B)
Figure 1. Detection and RT-PCR amplification of the 0.9 kb nifH-like mRNA of C.pasteurianum. In panel A, a Northern blot of mRNA from nitrogen-fixing cells of C.
pasteurianum is shown. Total RNA was hybridized with a HRP-labeled nifH1 specific probe.Two mRNA bands at the sizes of 4.0 kb and 0.9 kb are clearly visualized (arrows). With theRNA markers and the X-ray films as references, the 0.9-kb message was localized and a
specific portion (shown as dotted sequare) of the membrane was cut out from the running trackof the sample and used in a RT-PCR experiment. In panel B, separation of RT-PCR productsin a 1 % agarose gel is shown. Lane 1, DNA ladder. Lane 2, positive control with genomicDNA as the template. Lane 3, RT-PCR product. Lane 4, negative control with a membranepiece cut from 2.0-kb region. Lane 5, RT-PCR with the RNA isolated from a non-nitrogenfixing culture. Lane 6. Negative control (without the enzyme reverse transcriptase).
0.5 kb
2.0 kb
1 2 3 4 5 6
1.0 kb
166
http://www.ncbi.nlm.nih.gov/. The result of the database search revealed the identity of
0.9-kb message as from nifH2/H6.
nifH2/H6 expression examined by Northern hybridization
To compare nifH1 and nifH2/H6 expression, C. pasteurianum was grown in 1L of
a nitrogen-fixing medium and cells were harvested periodically for the isolation of RNA.
The RNA was separated on a 0.7 % formaldehyde- agarose gel and Northern analysis
was performed after blotting. The membrane was incubated with a 350-bp HRP-labeled
nifH1 probe, which was generated by PCR using NifHF1 (upstream) and NifHR1
(downstream) primers. The result of hybridization is shown in Figure 2, Panel A. A
visual examination of the nifH2/H6 mRNA in samples isolated periodically showed that
nifH2/H6 was expressed in parallel to nifH1 under the growth conditions used in this
study and the level of mRNA did not change significantly throughout the entire
measuring period.
In a similar experiment, a nitrogen-fixing culture of C. pasteurianum was
supplemented with ammonium acetate when the culture was 3-hr old to a final
concentration of 4 mM and total RNA was isolated before and after ammonium acetate
addition to study the effect of ammonia on synthesis and stability of the nifH2/H6
mRNA. As shown in PanelB, Figure 2, addition of ammonium acetate caused almost
complete disappearance of the nifH2/nifH6 signal (8-hr time point). Synthesis of
nifH2/H6 mRNA resumed after ammonia was consumed from the medium (11-hr time
point in Panel B). No significant differences were observed in the expression patterns of
nifH1 and nifH2/H6 until the culture was 27 hr old. At that point, the level of nifH1
mRNA was significantly reduced, but the nifH2/H6 mRNA was detectable. Whether this
difference in the expression of nifH2/H6 is physiologically important is yet to be
determined.
167
7.0 kb
5.0 kb
3.0 kb
2.0 kb
1.0 kb
0.5 kb
Figure 2. Northern blot analysis of the nifH1 and nifH2/H6 mRNAs of C. pasteurianumW5. Cells were grown in NFDM under a stream of nitrogen gas and collected periodicallythroughout incubation. Total RNA was isolated from fresh cells. Six µg of total RNA per well
were resolved on a 0.7 % formaldehyde-agarose gel. The RNA species were then transferredto positively charged nylon membranes by capillary elution with 20X SSC and the resultingmembranes were incubated with a 350-bp HRP-labelled nifH1 probe at 42 0C in ahybridization buffer containing 0.5 M NaCl. For comparison, the membranes were stripped in0.1 % SDS solution and incubated with a HRP-labeled 16S rRNA probe. In Panel A, theexpression of nifH1 and nifH2/H6 from a routine nitrogen-fixing culture, and in Panel B, theexpression of nifH1 and nifH2/H6 from an ammonia-supplemented nitrogen-fixing culture areshown.
3hr 8hr 11hr 15hr 27hr 3hr 6hr 11hr 25hr 33hr
(A) (B)
nifH1
nifH1/H6
16SrRNA
168
The presence of a second NifH-like polypeptide in Western blots of nitrogen-fixing
cells of C. pasteurianum
Using Western blot analysis, the signal intensity given by NifH1 in crude extracts
of C. pasteurianum was compared with that given by NifH in crude extracts of C.
beijerinckii and A. vinelendii. It was found that the signal given by NifH1 protein was
much broader than the signal given by NifH protein of C. beijerinckii and A. vinelendii
(when an equal amount of cellular proteins was analyzed). A closer examination of the
NifH1 signal on Western blots suggested the presence of a second NifH-like polypeptide,
whose molecular weight is very similar to the molecular weight of NifH1 polypeptide
(Figure 3). To investigate this observation further, different concentrations of acrylamide
(10 %, 12 %, 15 % and 4-20 % gradient gels) were used in SDS-PAGE to achieve a
better resolution between the two NifH polypeptides. The proteins separated on these
gels were transferred to positively charged nitrocellulose membranes and analyzed with
an antiserum raised against the NifH protein of A. vinelendii. The results of Western blot
analysis by SDS-PAGE with 15 % total acrylamide provided a better resolution and
suggested the presence of a second NifH-like polypeptide in the nitrogen-fixing cell-free
extracts of C. pasteurianum (Figure 3, Panel A).
Separation of the two NifH-like polypeptides of C. pasteurianum by preperative
denaturing gel electrophoresis
To separate the two NifH-like polypeptides of C. pasteurianum, preparative
denaturing gel electrophoresis was used. A nitrogen-fixing cell-free extract of C.
pasteurianum was resolved by the BioRad Prep Cell (Model 491). After the
electrophoretic separation was completed, every tenth fraction was analyzed by SDS-
PAGE to determine the location of the NifH proteins. A visual examination of the
Coomassie blue-stained SDS polyacrylamide gel suggested the location of NifH proteins
between fractions 20 and 40 (Figure 4, panel A). Based on this observation, 40 µL of
169
Figure 3. Western blot analysis of the NifH proteins of C. pasteurianum. A cell-free extractprepared from nitrogen-fixing cells was analyzed by SDS-PAGE with 15 % total acrylamide(Panel A) and non-denaturing PAGE with 12 % total acrylamide (Panel B). Electrophoretictransfer of proteins onto a positively charged nitrocellulose membrane was done in a semi-dryelectrophoretic transfer cell. Western blots were probed with an anti-NifH serum usingchemiluminescent detection. Lanes 1, 2, 3, 4, 5 and 6 contain different quantities of the samecell-free extract. Lanes 7 and 8 contain cell-free extract prepared from nitrogen-fixing cells ofC. beijerinckii NRRL B593 and used as the control. The pictures (Panels C and D) shown were
generated from the X-ray films with an imager by enlarging the NifH bands. The arrowsindicate relative positions of the NifH proteins.
4 5 6 7 8
PicturesX-ray films
(B)
(A)
1 2 3
(C
(D)
170
Figure 4. Analysis of fractions eluted from the preparative gel electrophoresis cell.Cell-free extract (contained approximately 25 mg protein) prepared from nitrogen-fixingcells of C. pasteurianum was resolved on a BioRad Prep Cell (Model 491). Every tenthfraction was analyzed on a Coomassie blue-stained SDS-PAGE gel (Panel A). The elutionposition of NifH was between fractions 20 and 40. Every fraction between fraction 10 and40 was then analyzed by Western blots to locate the exact positions of NifH polypeptides.Fractions 27-37 contained NifH polypeptides. L contained protein size ladder (BioRad)
(A)
(B)
L 10 20 30 40 50 60 70
27 28 29 30 31 32 33 34 35 36 37
Fractions:
Fractions:
171
fractions 10 through 37 were analyzed by Western blots. The results of revealed the
exact location of the NifH polypeptides and they were located between fractions 27 and
37 (Figure 4, panel B). A closer examination of the results suggested that fractions 27,
28, 36 and 37 contained only one of the NifH proteins because a single NifH band was
observed, whereas fractions 29-35 contained a mixture of both polypeptides. When
fractions 27, 28, 29, 31, 32, 36 and 37 were compared again by Western blotting using a
SDS-PAGE with 15 % total acrylamide, the results clearly indicated the presence of two
different NifH bands with a slight molecular weight difference (Figure 5)
Tentative identification of the two NifH polypeptides of C. pasteurinum
To identify the two NifH-like polypeptides of C. pasteurianum, MALDI-TOF
mass spectrometry was used. Figure 6 illustrates the MALDI-TOF mass spectra of
fractions 28, 31 and 37. By using the peptide masses, a database search was done at
http://us.expasy.org/cgi-bin/peptident.p1. The database search results revealed 22
possible matching proteins for fraction 28. Among the matching proteins, five of them
were NifH. Among these NifH proteins, NifH1, NifH4 and NifH5 of C. pasteurianum
were identified. The other two NifH proteins were from Desulfovibrio gigas and
Rhodobacter capsulatus. The identified NifH peptides (SPMVTK, EGYGGIR,
LGGIICNSR, CVESGGPEPGVGCAGR) may result from tryptic digests of both NifH1
and NifH5 polypeptides. However, they are most likely from NifH1 becuase the
presence of NifH1, but not NifH5, was also shown in MALDI-TOF analysis of fraction
31. The peak representing mass/charge ratio of 1761 can only result from digestion of
NIFH4 polypeptide with trypsin. However, examination of the spectrum revealed that
the peak representing the mass/charge ratio of 1761 was very weak and it was not
detected in repeated experiments. Therefore, fraction 28 most likely contained only
NifH1 protein of C. pasteurianum. The database search result revealed 4 matching
proteins for fraction
172
Figure 5. Western blot analysis of NifH polypeptides of C. pasteurinum afterseparation by preparative gel electrophoresis. Cell-free extract (containedapproximately 25 mg protein) prepared from nitrogen-fixing cells of C. pasteurianum wasresolved on a BioRad Prep Cell (Model 491). Fractions 27, 28, 29, 31, 32 and 36 wereanalyzed by SDS-PAGE with 15 % total acrylamide. Electrophoretic transfer of proteinsonto a positively charged nitrocellulose membrane was done in a semi-dry electrophoretictransfer cell. Western blots were probed with an anti-NifH serum using chemiluminescent
detection. The arrows indicate relative positions of the NifH polypeptides. Fractions 27and 28 contained one of the NifH polypeptide, fractions 29, 31 and 32 contained both ofthe NifH polypeptides and fractions 36 and 37 contained the other NifH polypeptide. The
arrows indicate the relative positions of NifH polypeptides.
27 28 29 31 32 36 37Fractions:
173
37. Among the matching proteins, NifH2/H6 was identified with the highest score
suggesting that fraction 37 most likely contained NifH2/H6 polypeptide of C.
pasteurianum. Four peptide peaks representing mass/charge ratios of 1004, 1397, 1588
and 1618 were detected in tryptic digests of fraction 31. These mass/charge ratios can
result from tryptic peptides of NifH1 and NifH2/H6. In addition to these peaks, two
additional peaks representing molecular mass/charge ratios of 752 and 991 were detected.
The peak representing mass/charge ratio of 752 may have resulted from trypsin digested
NifH1 protein, and the peak representing mass/charge ratio of 991 may have resulted
from trypsin digested NifH2/H6 polypeptide. Therefore, fraction 31 most likely contains
both NifH1 and NifH2/H6 polypeptides. Western blot analysis of this fraction revealed
two NifH bands supporting the results of MALDI-TOF analysis.
A series of control experiments was performed with (i) purified NifH protein of
A. vinelendii, (ii) BSA from a commercial source (Sigma Chemical Co., St Louis, Mo),
(iii) nitrogen-fixing cell-free extract of C. pasteurinum (with the protein markers as a
reference, a specific portion (30000 molecular weight region) was cut out of the running
track of the SDS-PAGE and analyzed), (iv) nitrogen-fixing cell-free extract of C.
pasteurinum (with the protein markers as a reference, a specific portion (70000 molecular
weight region) was cut out of the running track of the SDS-PAGE and analyzed), and (v)
a SDS-polyacrylamide gel piece, which did not contain protein. Figure 7 illustrates the
MALDI-TOF mass spectra showing the trypsin digestion products of these control
experiments. To identify the proteins present in these fractions, a database search was
performed at http://us.expasy.org/cgi-bin/peptident.p1. The search results revealed 47
matches for MALDI-TOF mass spectrum of NifH protein of A. vinelendii. Among the
proteins, nitrogenase iron proteins of Klebsiella pneumonia and Azotobacter vinelendii
were present with five matching peptides. A similar search was also performed with
BSA’s peptide mass map. The search results revealed 298 matches. The highest score
174
was given to Chain 1 of bovine serum albumin with 10 matching peptides. These two
control experiments confirmed the reliability of the MALDI-TOF experiments performed
with fractions 28, 31 and 37. The search performed with the peptide map of cell-free
extract containing ~30000 molecular weight range proteins revealed 33 matches. Among
the identified proteins, nitrogenase iron protein 3 of Clostridium pasteurianum and C.
perfringens was given the highest score of 0.22 with 5 matching peptides. In addition to
NifH3, NifH proteins of Azotobacter chroococcum, Azotobacter vinelendii and
Rhodobacter capsulatus were listed with a score of 0.17. Although the analysis of the
cell-free extract with MALDI-TOF was not very reliable in terms of revealing identities
of NifH proteins in cell-free extracts of C. pasteurianum, the results were suggestive.
Unlike this positive control experiment, the gel piece cut from ~ 70000 molecular weight
region did not reveal the presence of any NifH protein.
175
(A) (B)
(C) (D)
Figure 6. MALDI-TOF mass spectra (400 to 2500 Da) of fractions 28 (panel A), 31 (panel B)and 37 (panel C) from the preparative gel electrophoresis. In panel D, MALDI-TOF spectrumof a gel piece which was cut from a region without proteins is shown as the negative control .
176
Figure 7. MALDI-TOF mass spectra (400 to 2500 Da) of the control experiments. MALDI-TOF spectra of (A) purified NifH protein of A. vinelendii, (B) bovine serum albumin (SigmaChem. Co.), (C) cell-free extract (30,000 molecular weight region) of C. pasteurianum, (D) cell-free extract (70,000 molecular weight region) of C. pasteurianum.
(A)(B)
(C)(D)
176
DISCUSSION
Mortenson and his coworkers previously purified and determined the amino acid
sequence of NifH1 protein of C. pasteurianum (Tanaka et al., 1977 (Tryptic peptides) ;
Tanaka et al., 1977 (Cyanogen bromide peptides) and Tanaka et al., 1977 (The N and C
terminal sequences)). Analysis of the core protein sequencing data (Wang et al., 1988)
showed that the purified iron protein sample could not have more than trace amounts of
proteins from the nifH-like sequences. However, this conclusion does not rule out the
possibility that other NifH-related products are excluded during purification. During the
present study, the observation of the nifH2/H6 mRNA throughout growth strongly
suggested the presence of the NifH2/H6 polypeptide. Later experiments showed that C.
pasteurianum contains two NifH-like polypeptides (NifH1 and NifH2) in nitrogen-fixing
cell-free extracts.
Wang et al. (1988) previously proposed the possibility that, under certain
physiological conditions, some products from the nifH-like sequences might serve to
modulate (such as down regulate) nitrogenase activity by acting as an inhibitor of the
MoFe protein. Their proposal was based on the earlier studies, which showed that an
incompatible Fe protein could act as an inhibitor of nitrogenase activity. However, the
proposed function may not be true for NifH2/H6 because Northern blot analysis of
nifH2/H6 mRNA in this study indicated that nifH2/H6 is expressed throughout growth in
parallel to nifH1, and ammonia addition affected expression of both genes similarly.
Perhaps NifH2/H6 is required for the synthesis of either the MoFe cofactor or maturation
of the α and β subunits of the MoFe protein. Such functions of the NifH protein have
already been demonstrated in A. vinelendii (Ludden et al., 1993 ; Rangaraj et al., 1997).
Multiple copies of nifH or nifH-related sequences have also been observed in
other organisms. In Rhizobium ORS571, two copies of the nifH gene were characterized
(Norel and Elmerich, 1987). One copy, nifH1, was localized with nifDK in an operon
176
whereas the other, nifH2, was localized elsewhere in the genome. From mutants carrying
either a single nifH1 or nifH2 deletion, it appeared that both genes are functional.
However, measurement of specific nitrogenase activities (ex planta) showed that nifH1
accounts for about 70 % of the nitrogen-fixing activity, whereas nifH2 accounts only for
30 %. In another soil bacterium, Rhizobium phaseoli, three nifH genes (nifHa , nifHb and
nifHc ) were identified (Morett et al., 1988). Site-directed mutagenesis of each of the
three nifH genes indicated that none is indispensable for nitrogen fixation and at least two
are functionally expressed. In Rhodopseudomonas capsulata, at least four copies of
sequences related to the structural genes of nitrogenase were identified (Scolnick and
Haselkorn, 1984). However, in this organism, only one nifH gene is functionally active
but a second copy can be activated when the first one is mutated. It is possible that
NifH2/H6 of C. pasteurinaum has a supplementary function in nitrogen fixation and it
may be responsible for part of the nitrogen-fixing activity of C. pasteurianum. The
significance of NifH2/H6 and its physiological function in C. pasteurianum may be
determined if mutants lacking either nifH1 or nifH2/H6 or both can be generated.
177
CHAPTER 7
CONCLUDING REMARKS
The present study demonstrated the possibility of solvent production under
nitrogen-fixing growth conditions, even though the final concentrations of solvents did
not reach high values in nitrogen-fixing cultures when compared with the ammonia-
supplemented culture. The onset of solvent production in nitrogen-fixing cultures always
occurred between the mid-exponential growth and the early stationary phases and
coincided with a decrease in in vivo specific nitrogen-fixing activity. The timing of the
onset of solvent production was not affected by the timing of the onset of nitrogen-
fixation, but the nitrogen-fixing activity affected the maintenance of solvent production.
When the onset of nitrogen-fixation coincided with the onset of solvent production in
ammonia-limited cultures, the duration of active solvent-production was shortened and
cultures accumulated less solvents than the routine nitrogen-fixing cultures despite the
presence of fixed nitrogen source. A competition between the alcohol-producing
enzymes and nitrogenase for reductant may be responsible for downregulation of solvent-
production. Under the nitrogen-fixing growth conditions, increases in solvent-producing
enzyme activities towards the late-exponential growth phase were demonstrated by
measuring the butyraldehyde dehydrogenase and acetoacetate decarboxylase activities in
periodically-harvested cells. The results of Northern blot analysis of the message
carrying the solvent-production genes showed that the gradual increases in specific
activities of solvent-forming enzymes in nitrogen-fixing cultures were the result of
continuous expression of the solvent-production genes.
The nif regulon of C. beijerinckii NRRL B593 contains at least four operons as
shown by Northern blot analysis. The absence of the nif-associated mRNAs in RNA
samples isolated from non-nitrogen fixing cells suggested that the nif-associated genes
are regulated in parallel to nif genes. Results pertinent to the regulation of nitrogen-
178
fixation in C. beijerinckii revealed the presence of ammonia-triggered switch-off of
nitrogen-fixing activity. However, posttranslational modification of the iron protein of
nitrogenase by ADP-ribosylation was not observed in C. beijerinckii. The similar rates of
in vitro acetylene-reducing activity in samples taken before and after ammonia-triggered
switch-off suggested the presence of a regulatory mechanism which does not involve
covalent modifications.
The mechanism of regulation of nitrogen-fixation in C. pasteurianum differs from
that of C. beijerinckii. C. pasteurianum lacks the two GlnB-like proteins in its nif cluster
and does not switch off its nitrogen-fixing activity in response to ammonia, which
suggests that the GlnB-like proteins of C. beijerinckii have a function in the ammonia-
triggered switch-off of nitrogen fixation in C. beijerinckii. In addition, nitrogen-fixing
cell-free extracts of C. pasteurianum contain two NifH-like polypeptides. The
physiological function of the second NifH-like polypeptide is yet to be determined.
179
REFERENCES
Ahmed, I., Ross, R.A., Mathur, V. K. and Chesbro, W. R. (1989) Growth ratedependence of solventogenesis and solvents produced by C. beijerinckii. Appl MicrobiolBiotech 28:182-187.
Allcock, E. R., Reid, S. J., Jones, D. T. and Woods, D. R. (1982) Clostridium
acetobutylicum protoplast formation and regeneration. Appl Environ Microbiol43(3):719-721.
Allock, E. R. and Woods, D. R. (1981) Carboxymethyl cellulase and cellobiase
production by Clostridium acetobutylicum in an industrial fermentation medium. ApplEnviron Microbiol 41(2):539-541.
Allock, E. R., Reid, S. J., Jones, D. T. and Woods, D. R. (1981) Autolytic activity andan autolysis-deficient mutant of Clostridium acetobutylicum. Appl Environ Microbiol42(6):929-935.
Andersch, W., Bahl, H. and Gottschalk, G. (1983) Level of enzymes involved inacetate, butyrate, acetone and butanol formation by Clostridium acetobutylicum. Eur JAppl Microbiol Biotechnol 18:327-332.
Andersch, W., Bahl, H. and Gottschalk, G. (1982) Acetono-butanol production byClostridium acetobutylicum in an ammonium-limited chemostat at low pH values.Biotech Lett 4:29-32.
Anderson, M. L. M. and Young, B. D. (1985) Quantitative filter hybridization. InNucleic acid hybridization: a practical approach. Hames and Higgins (eds). IRL Press,Washington DC, USA.
Annous , B. A. and Blaschek, H. P. (1991) Isolation and characterization ofClostridium acetobutylicum mutants with enhanced amylolytic activity. Appl EnvironMicrobiol 56:2544-2548.
Arcondeguy, T., Jack, R. and Merrick, M. (2001) PII signal transduction proteins,pivotal players in microbial nitrogen control. Microbiol Mol Biol Rev 65(1):80-105.
180
Babb, B. L., Collett, H. J. Reid, S. and Woods, D. R. (1993) Transposon mutagenesisof Clostridium acetobutylicum P262: isolation and characterization of solvent deficientand metranidazole resistant mutants. FEMS Microbiol Lett 114:343-348.
Bahl, H and Gottschalk, G. (1985) Parameters affecting solvent production by
Clostridium acetobutylicum in continuous culture. Biotechnol Bioeng 514:217-223.
Bahl, H., Andersch, W. and Gottschalk, G. (1982) Continuous production of acetoneand butanol by Clostridium acetobutylicum in a two–stage phosphate limited chemostat.Eur J Appl Microbiol Biotechnol 15:201-205.
Bahl, H., Gottwald, M., Kuhn, A., Rale, V., Andersch, W. and Gottschalk, G. (1986)Nutritional factors affecting the ratio of solvents produced by Clostridium
acetobutylicum. Appl Environ Microbiol 52:169-172.
Ballongue, J., Amine, J., Masion, E., Petitdemange, H. and Gay, R. (1985) Induction
of acetoacetate decarboxylase in Clostridium acetobutylicum. FEMS Microbiol Rev29:273-277.
Ballongue, J., Janati-Idrissi, R., Petitdemange, H. and Gay, R. (1989) Correlationbetween solvent production and level of solventogenic enzymes in Clostridium
acetobutylicum. J Appl Bacteriol 67:611-617.
Bermejo, L. L., Welker, N. E. and Papoutsakis, E. T. (1998) Expression ofClostridium acetobutylicum ATCC 824 genes in Escherichia coli for acetone productionand acetate detoxification. 64(3):1079-1085.
Bertram, J., Kuhn, A. and Dürre, P. (1990) Tn916-induced mutants of Clostridium
acetobutylicum defective in regulation of solvent formation. Arch Microbiol 153:373-377.
Billig, E. (1999) Butyl alcohols. In Concise encyclopedia of chemical technology. 4th
edition. Krochwitz J. I. (ed). A Wiley Interscience Publication. John Wiley and SonsInc. pp:298-299.
Birrer, G. A., Chesbro, W. R. and Zsigray, M. R. (1994) Electro-transformation ofClostridium beijerinckii NRRL B592 with shuttle plasmid pHR106 and recombinantderivatives. Appl Microbiol Biotech 41:32-38.
181
Bishop, P. E. and Premarkur, R. (1992) Alternative nitrogen fixation systems. In:Biological nitrogen fixation. Stacey, G., Burris, R. H. and Evans, H. J. (Eds). pp:736-762. Chapman&Hall, New York, London.
Bolin, J. T., Campobasso, N., Muchmore, S. W., Minor, W., Morgan, T. V. andMortenson, L. E. (1993) The crystal structure of the nitrogenase MoFe protein fromClostridium pasteurianum. In New horizons in nitrogen fixation. Palacios, et al. (Eds)pp:89-94. Kluwer Academic Publishers, Netherlands.
Bowring, S. N. and Morris, J. G. (1985) Mutagenesis of Clostridium acetobutylicum.J Appl Bacteriol 58:577-584.
Boynton, Z. L., Bennett, G. N. and Rudolph, F. B. (1996a) Cloning, sequencing andexpression of genes encoding phosphotransacetylase and acetate kinase from Clostridium
acetobutylicum ATCC 824. Appl Environ Microbiol 62(8):2758-2766.
Boynton, Z. L., Bennett, G. N. and Rudolph, F. B. (1996b) Cloning, sequencing, andexpression of clustered genes encoding β-hydroxybutyryl-coenzyme A (CoA)
dehydrogenase, crotonase and butyryl-CoA dehydrogenase from Clostridium
Bradford, M. M. (1976) A rapid and sensitive method for the quantification of
microgram quantities of protein utilizing the principle of protein-dye binding. AnalBiochem 72:248-254.
Brown, D. P., Genova-Raeva, L., Green, B. D., Wilkinson, S. R., Young, M. andYoungman, P. (1994) Characterization of spo0A homologues in diverse Bacillus andClostridium species identifies a probable DNA-binding domain. Mol Microbiol14(3):411-426.
Bryant, D. and Blaschek, P. H. (1988) Buffering as a means for increasing growth andbutanol production by Clostridium acetobutylicum. J Ind Microbiol 3:49-55.
Burris, R. H. (1972) Nitrogen fixation: assay methods and techniques. In Methods ofenzymology. Vol XXIV. Photosynthesis and nitrogen fixation, Part B. Pietro, S. P. (ed)pp:415-431.
Burris, R. H. (1991) Nitrogenases. J Biol Chem 266(15):9339-9342.
182
Burris, R. H. and Roberts, G. P. (1993) Biological nitrogen fixation. Annu Rev Nutr13:317-335.
Carr, P. D., Cheah, E., Suffolk, P. M., Vasudevan, S. G., Dixon, N. E. and Ollis, D.L. (1996) X-ray structure of the signal transduction protein PII from Escherichia coli at
1.9 Å. Acta Crytallogr Sect D 52:93-104.
Cary, J. W., Peterson, D. J., Papoutsakis E. T. and Bennett, G. N. (1990) Cloningand expression of Clostridium acetobutylicum ATCC 824 acetoacetyl-coenzyme A:acetate/butyrate:coenzyme A-transferase in Escherichia coli. Appl Environ Microbiol56(6):1576-1583.
Cary, J. W., Peterson, D. J., Papoutsakis, E. T. and Bennett, G. W. (1988) Cloningand expression of Clostridium acetobutylicum phosphotransbutyrylase and butyratekinase genes in Escherichia coli. J Bacteriol 170(10):4613-4618.
Chein, Y. and Zinder, S. H. (1996) Cloning, functional organization, transcript studies,and phylogenetic analysis of the complete nitrogenase structural genes in archaeonMethanosarcina barkeri. J bacteriol 178:143-148.
Chen, C.-K. and Blaschek, H. P. (1999a) Acetate enhances solvent production andprevents degeneration in Clostridium beijerinckii BA101. Appl Microbiol Biotechnol52:170-173.
Chen, C.-K. and Blaschek, H. P. (1999b) Effect of acetate on molecular andphysiological aspects of Clostridium beijerinckii NCIMB 8052 solvent production andstrain degeneration. Appl Environ Microbiol 65(2)499-505.
Chen, C.-K. K., Chen, J.-S. and Johnson, J. L. (1986) Structural features of multiplenifH-like sequences and very biased codon usage in nitrogenase genes of Clostridium
pasteurianum. J Bacteriol 166(1):162-172.
Chen, J.-S, Wang, S-Z. and Johnson, J. L. (1990) Nitrogen fixation genes ofClostridium pasteurianum. In Nitrogen fixation: Achievements and objectives.Gresshoff, Roth, Stacey & Newton (eds). Chapman and Hall. New York –London.
Chen, J.-S. (1993) Properties of acid- and solvent-forming enzymes of clostridia. InWoods D. R. (ed) The clostridia and Biotechnology. Butterworth-Heinemann,
Stoneham, pp 51-76.
183
Chen, J.-S. (1995) Alcohol dehydrogenase: multiplicity and relatedness in the solvent-producing clostridia. FEMS Microbiol Rev 17:263-273.
Chen, J.-S. and Hiu, S. F. (1986) Acetone-butanol-isopropanol production by
Clostridium beijerinckii (synonym Clostridium butylicum). Biotech Lett 8:371-376.
Chen, J.-S. and Johnson, J. L. (1993) Molecular biology of nitrogen fixation in theclostridia. In The clostridia and biotechnology. Woods, D. R. (Ed). pp:371-392.Butterworth-Heinemann, Boston, USA.
Chen, J.-S. and Mortenson, L. E. (1974) Purification and properties of hydrogenasefrom Clostridium pasteurianum W5. Bichim Biophys Acta 371:282-298.
Chen, J.-S., Toth, J. and Kasap, M. (2001) Nitrogen-fixation genes and nitrogenaseactivity in C. acetobutylicum and C. beijerinckii. J Ind Microbiol Biotech 27:281-286.
Chen, J.-S., Wang, S-Z. and Johnson, J. L. (1990) Nitrogen fixation genes ofClostridium pasteurianum. In: Nitrogen fixation: Achievements and objectives.
Claassen, P. A., Budde, M. A., Lopez-Contresas, A. M. (2000) Acetone, butanol andethanol production from domestic organic waste by solventogenic clostridia. J MolMicrobiol Bitechnol 2(1):39-44.
Clark, S. W., Bennett, G. N. and Rudolph, F. B. (1989) Isolation and characterizationof mutants of Clostridium acetobutylicum ATCC 824 deficient in acetoacetyl-coenzymeA:acetate/butyrate:coenzyme A-transferase (EC 2.8.3.9) and other solvent pathway
enzymes. Appl Environ Microbiol 55:970-976.
Cocaign-Bousquet, M., Garrigues, C., Novak, L., Lindley, N. D. and Loubiere, P.(1995) Rational development of a simple synthetic medium for the sustained growth ofLactococcus lactic. J Appl Bacteriol 79:108-116.
Cornillot, E., Croux, C. and Soucaille, P. (1997a) Physical and genetic map of theClostridium acetobutylcium ATCC 824 chromosome. J Bacteriol 179(23):7426-7434.
Cornillot, E., Nair, R., Papoutsakis, E. T. and Soucaille, P. (1997) The genes forbutanol and acetone formation in Clostridium acetobutylicum ATCC 824 reside on a
large plasmid whose loss leads to degeneration of the strain. J Bacteriol 179:5442-5447.
184
Correa, R., Mariash, C. and Rosenberg, M. E. (1992) Loading and transfer controlfor northern hybridization. Biotechniques 12(2):154-158.
Cummins, C. S. and Johnson, J. L. (1971) Taxonomy of the clostridia: wall
composition and DNA homologies in Clostridium butyricum and other butyric acid-producing clostridia. J Gen Microbiol 67:33-46.
Daesch, G. and L. E. Mortenson (1968) Sucrose catabolism in C. pasteurianum and itsrelation to N2 fixation. J Bacteriol 96:346-351.
Daesch, G. and Mortenson, L. E. (1972) Effect of ammonia on the synthesis andfunction of the nitrogen-fixing enzyme system in C. pasteurianum. J Bacteriol 110:103-109.
Darling, C. D. and Brickell, P. M. (1994) Nucleic acid blotting: the basics. IRL press
New York, USA.
Davies, R. (1943) Studies on the acetone-butanol fermentation. Acetoacetatedecarboxylase of Clostridium acetobutylicum (BY). Biochem J 37:230-238.
De Zamarochy, D. M. F. and Elmerich, C. (1989) Regulation of transcription andpromoter mapping of the structural genes for nitrogenase (nifHDK) of Azospirullum
brasilense Sp7. Mol Gen Genet 220:88-94.
Dean, D. R. and Jacobson, M. R. (1992) Biochemical genetics of nitrogenase. InBiological nitrogen fixation. Stacey, G., Burris, R. H. and Evans, H. J. (eds). New York
Chapmen & Hall. pp 763-834.
Desai, R. P. and Papoutsakis, E. T. (1999) Antisense RNA strategies for metabolicengineering of Clostridium acetobutylicum. Appl Environ Microbiol 65(3):936-945.
Detroy, R. W., Parejko, R. A. and Wilson, P. W. (1967) Complementary functioningof two components required for the reduction of N2 from four nitrogen fixing bacteria.Science 158:526-527.
Dilworth, M. J., Eady, R. R. and Eldridge, M. E. (1988) The vanadium nitrogenase ofAzotobacter chroococcum: reduction of acetylene and ethylene to ethane. J Biochem
249:745-751.
185
Dilworth, M. J., Eady, R. R., Robson, R. L. and Miller, R. W. (1987) Ethane as apotential test for vanadium nitrogenase in vivo. Nature(London) 327:167-168.
Dürre P, Bohringer M, Nakotte S, Schaffer S, Thormann K, Zickner B (2002)
Transcriptional regulation of solventogenesis in Clostridium acetobutylicum. J MolMicrobiol Biotechnol 4(3):295-300.
Dürre P. (1998) New insights and novel developments in clostridialacetone/butanol/isopropanol fermentation. Appl Microbiol Biotechnol. 49:639-648.
Dürre, P. and Bahl, H. (1998) Microbiol production of acetone/butanol/isopropanol.In Biotechnology, 2nd edition, vol 6. Roehr M (ed). VHC, Weinheim, pp 229-268.
Dürre, P., Kuhn, A., Gottwald, M. and Gottschalk, G. (1987) Enzymaticinvestigations on butanol dehydrogenase and butyraldehyde dehydrogenase in extracts of
Eady, R. R. (1996) Structure-function relationships of alternative nitrogenases.96:3013-3030.
Egener, T., Martin, D. E., Sarkar, A. and Reinhold-Hurek, B. (2001) Role of aferredoxin gene cotranscribed with the nifHDK operon in N2 fixation and nitrogenaseswitch-off of Azoarcus sp. strain BH72. J Bacteriol 183(12):3752-3760.
Emerich, D. W. and Burris, R. H. (1978) Complementary functioning of thecomponent proteins of nitrogenase from several bacteria. J bacteriol 134:936-943.
Errington, J. (1993) Bacillus subtilis sporulation: Regulation of gene expression andcontrol of morphogenesis. Microbiol Rev 57(1):1-33.
Farrell, R. E. Jr. (1998) RNA methodologies: a loboratory guide for isolation andcharacterization. 2nd edition. Academic Press. San Diego, CA, USA.
Fischer, R. J. Helms, J. and Dürre, P. (1993) Cloning, sequencing, and molecularanalysis of the sol operon of Clostridium acetobutylicum, a chromosomal locus involvedin solventogenesis. J Bacteriol 175(21):6959-6969.
186
Fond, O., G. Matta-Ammouri, H. Petitdemange, and J.M. Engasser (1985) The roleof acids on the production of acetone and butanol by Clostridium acetobutylicum. ApplMicrobiol Biotech 22:195-200.
Fond, O., Petitdemange, E., Petitdemange, H. and Gay, R. (1984) Effect of glucose
flow on the acetone butanol fermentation in fed batch culture. Biotechnol Lett 6:13-18.
Fontaine, L., Meynial-Salles, I., Girbal, L., Yang, X., Croux, C., and Soucaille, P.(2002) Molecular characterization and transcriptional analysis of adhE2, the geneencoding the NADH-dependent aldehyde/alcohol dehydrogenase responsible for butanolproduction in alcohologenic cultures of Clostridium acetobutylicum ATCC 824. JBacteriol 184(3):821-830.
Forchhammer, K. and Marsac, N. T. (1995) Phosphorylation of the PII protein (glnB
gene product) in the Cyanobacterium Syenchococcus sp. Strain PCC 7942: analysis of invitro kinase activity. J Bacteriol 177(20):5812-5817.
Formanek, J., Mackie, R. and Blaschek, H. P. (1997) Enhanced butanol productionby Clostridium beijerinckii BA101 grown in semidefined P2 medium containing 6percent maltodextrin or glucose. Appl Environ Microbiol 63(6):2306-2310.
Gabriel, C. L. (1928) Butanol fermentation process. Ind Eng Chem 20:1063-1067.
Gabriel, C. L., and Crawford, F. M. (1930) Development of the butyl-acetonicfermentation industry. Ind Eng Chem 22:1163-1165.
Gapes, J. R., Larsen, V. F. and Maddox, I. S. (1983) A note on procedures for
inoculum development for the production of solvents by a strain of Clostridium
butylicum. J Appl Bacteriol 55:363-365.
George, H. A. and Chen, J.-S. (1983) Acidic conditions are not obligatory for the onsetof butanol formation by Clostridium beijerinckii (synonym, C. butylicum). Appl EnvironMicrobiol 46:321-327.
George, H. A., Johnson, J. L., Moore, W. E. C., Holdeman, L. V. and J.-S. Chen(1983) Acetone, isopropanol and butanol production by Clostridium beijerinckii (syn. C.
butylicum) and Clostridium aurantibutyricum. Appl Environ Microbiol 45:1160-1163.
187
Georgiadis, M. M., Komiya, H., Chakrabarti, P., Wooo, D., Kornuc, J. J. and Rees,D. C. (1992) Crystallographic structure of the nitrogenase iron protein from Azotobacter
vinelandii. Science 257:1653-1658.
Gerischer, U. and Dürre, P. (1990) Cloning, sequencing, and molecular analysis of the
acetoacetate decarboxylase gene region from Clostridium acetobutylicum. J Bacteriol174:426-433.
Gerischer, U. and Dürre, P. (1992) mRNA analysis of the acetoacetate decarboxylasegene region from Clostridium acetobutylicum. J Bacteriol 172:6907-6918.
Gibbs, D. F. (1983). The rise and fall (….and rise?) of acetone/butanol fermentations.Trends Biotechnol 1:12-15.
Girbal, L. and Soucaille, P. (1998) Regulation of solvent production in Clostridium
acetobutylicum. Trends Biotechnol 16(1):11-16.
Gorwa, M-F., Croux, C. and Soucaille, P. (1996) Molecular characterization andtranscriptional analysis of the putative hydrogenase gene of Clostridium acetobutylicum
ATCC 824. J Bacteriol 178:2668-2675.
Gottschal, J. C. and Morris, J. G. (1982) Non-production of acetone and butanol by C.
acetobutylicum during glucose- and ammonium-limitation in continuos culture. BiotechLett 3:525-530.
Gottschal, J.C. and Morris, J. G. (1981) The induction of acetone and butanolproduction in cultures of Clostiridium acetobutylicum by elevated concentrations of
acetate and butyrate. FEMS Microbiol Lett. 12:385-389.
Green, E. M. and Bennett, G. N. (1996) Inactivation of an aldehyde/alcoholdehydrogenase gene from Clostridium acetobutylicum ATCC 824. Appl BiochemBiotechnol 58:213-221.
Green, E. M. and Bennett, G. N. (1998) Genetic manipulation of acid and solventformation in Clostridium acetobutylicum ATCC 824. Biotech Bioeng 58(2):215-221.
Green, E. M., Boynton, Z. L., Harris, L. M., Rudolph, F. B. and Papoutsakis, E. T.(1996) Genetic manipulation of acid formation pathways by gene inactivation in
Grunwald, S. K., Ryle, M. J., Lanzilota, W. N. and Ludden, P. W. (2000) ADP-ribosylation of variants of Azotobacter vinelandii dinitrogenase reductase byRhodospirillum rubnum dinitrogenase reductase ADP-ribosyltransferase. J Bacteriol182(9):2597-2603.
Grupe, H. and Gottschalk, G. (1992) Physiological events in Clostridium
acetobutylcium during the shift from acidogenesis to solventogenesis in continuousculture and presentation of a model for shift induction. Appl Environ Microbiol58(12):3896-3902.
Halbleib, C. M. and Ludden, P. W. (2000) Regulation of biological nitrogen fixation.Recent Adv J Nutr 130:1081-1084.
Harris, L. M., Desai, R. P., Welker, N. E. and Papoutsakis, E. T. (1999)Characterization of recombinant strains of the Clostridium acetobutylicum butyratekinase inactivation mutant: Need for new phenomenological models for solventogenesis
and butanol inhibition? Biotech Bioeng 67(1):1-11.
Hartmanis, G. N., Henrik, A. and Gatenbeck, S. (1986) Stability of solvent formationin Clostridium acetobutylicum during repeated subculturing. Appl Microbiol Biotech23:369-371.
Hartmanis, M. G. N. (1987) Butyrate kinase from Clostridium acetobutylicum. J BiolChem 262:617-621.
Hartmanis, M. G. N. and Gatenbech, S. (1984) Intermediary metabolism inClostridium acetobutylicum: Levels of enzymes involved in the formation of acetate and
butyrate. Appl Environ Microbiol 47(6):1277-1283.
Hartmanis, M. G. N., Klason, T. and Gatenbeck, S. (1984) Uptake and activation ofacetate and butyrate in Clostridium acetobutylicum. Appl Microbiol Biotechnol 20:66-71.
Holt, R. A., Stephens, G. M. and Morris, J. G. (1984) Production of solvents byClostridium acetobutylicum cultures maintained at neutral pH. Appl Environ Microbiol48:1166-1170.
Hong, R. (1999) The cloning of a putative regulatory gene and the sol region from
Clostridium beijerincki. Master Thesis. Virginia Tech, Blacksburg, Virginia.
189
Howard, W. L. (1999) Acetone In Concise encyclopedia of chemical technology. 4th
edition. Krochwitz J. I. (ed). A Wiley Interscience Publication. John Wiley and SonsInc. pp:10.
Huang, K. X., Huang, S., Rudolph, F. B. and Bennett, G. N. (2000) Identification and
characterization of a second butyrate kinase from Clostridium acetobutylicum ATCC824. J Mol Microbiol Biotechnol 2(1):33-38.
Huang, T-C., Lin, R-F., Chu, M-K and Chen, H-M. (1999) Organization andexpression of nitrogen fixation genes in the aerobic nitrogen-fixing unicellularcyanobacterium Synechoccus sp. strain RF-1. Microbiology 145:743-753.
Husemann, M. H. W. and Papoutsakis, E. T. (1987) Solventogenesis in Clostridium
acetobutylicum fermentations related to carboxylic acid and proton concentrations.Biotech Bioeng 32:843-852.
Husemann, M. H. W. and Papoutsakis, E. T. (1989b) Comparison between in vivo andin vitro enzyme activities in continuous and batch fermentations of Clostridium
Husemann, M. H. W. and Papoutsakis, T. (1989a) Enzymes limiting butanol andacetone formation in continuous and batch cultures of Clostridium acetobutylicum. ApplMicrobiol Biotechnol 31:435-444.
Ingram, O. L. and Buttke, T. M. (1984) Effects of alcohols on micro-organisms. InAdvances in microbiol physiology. Rose and Tempest (eds) Academic Press. Vol 25.pp:253-300.
Ismaiel, A. A., Zhu, C. X., Colby, G. D. and Chen, J.-S. (1993) Purification andcharacterization of a primary-secondary alcohol dehydrogenase from two strains ofClostridium beijerinckii. J Bacteriol 175(16):5097-5105.
Jacobson, M. R., Brigle, K. E. Bennett, L. T., Setterquist, R. A., Wilson, M. S., Cash,V. L., Newton, W. E. and Dean, D. R. (1989) Physical and genetic map of the majornif gene cluster from Azotobacter vinelandii. J Baceteriol 171(2):1017-1027.
Jensen, P. R. and Hammer, K. (1993) Minimal requirements for exponential growth ofLactococcus lactis. Appl Environ Microbiol 59: 4363-4366.
190
Jiang, P., Zucker, P., Atkinson, M. R., Kamberov, E. S., Tirasophon, W., Chandran,P., Schefke, B. R. and Ninfa, A. J. (1997) Structure/Function analysis of the PII signaltransduction protein of Escherichia coli: genetic separation of interactions with proteinreceptors. J Bacteriol 179(13):4342-4353.
Jobses, I. M. and Roels, J. A. (1983) Experience with solvent production byClostridium beijerinckii in continuous culture. Biotech and Bioeng 15:1187-1194.
Johnson, J. L. (1994) Similarity analysis of rRNAs. In Methods for general andmolecular bacteriology.
Johnson, J. L. Toth, J., Santiwatanakul, S. and Chen, J.-S. (1997) Cultures ofClostridium acetobutylicum from various collections comprise Clostridium
acetobutylcium, Clostridium beijerinckii and two other distinct types based on DNA-DNA reassociation. Int J Sys Bacteriol 47(2):420-424.
Jones, D. T. and Woods, D. R. (1986) Acetone-butanol fermentation revisited.Microbiol rev 50(4):481-524.
Jones, D. T., Westhuizen, A., Long, S., Allock, E. R., Reid, S. J. and Woods, D. R.(1982) Solvent production and morphological changes in Clostridium acetobutylicum.Appl Environ Microbiol 43(6)1434-1439.
Jones, R. W. and Jones, M. J. (1992) Simplified filter paper sandwich blot providesrapid, background-free northern blots. Biotechniques 12(5):684-688.
Junelles, A. M., Janati-Idrissi, R., Petitdemange, H. and Gay, R. (1988) Iron effect
on acetone-butanol fermentation. Curr Microbiol 17:299-303.
Kashket, E. R. and Cao, Z.-Y. (1993) Isolation of a degeneration-resistant mutant ofClostridium acetobutylicum NCIMB 8052. Appl Environ Microbiol 59(12):4198-4202.
Kawasaki, S., Arai, H., Kodama, T. and Igarashi, Y. (1997) Gene cluster fordissimilatory nitrate reductase (nir) from Pseudomonas aeroginosa: sequencing andidentification of a locus for heme d1 biosynthesis. J Bacteriol 179(1):235-242.
Keis, S. Shahneen, R. and Jones, D. (2001b) Emended descriptions of Clostridium
acetobutylicum and Clostridium beijerinckii, and descriptions of Clostridium
191
saccharoperbutylacetonicum sp. nov. and Clostridium saccharobutylicum sp. nov. Int JSys Evol Microbiol 51:2095-2103.
Keis, S., Sullivan, J. T. and Jones, D. T. (2001a) Physical and genetic map of theClostridium saccharobutylicum (formerly Clostridium acetobutylicum) NCP 262
chromosome. Microbiology 147(7):1909-1922.
Kessler, P. S., Blank, C. and Leigh, J. A. (1998) The nif gene operon of themethanogenic archeon Methanococcus maripaludis. J Bacteriol 180(6):1504-1511.
Kessler, P. S., Daniel, C., Leigh, J. A. (2001) Ammonia switch-off of nitrogen fixationin the methanogenic archeon Methanococcus maripaludis: mechanistic features andrequirement for the novel GlnB homologues, NifI1 and NifI2. J Bacteriol 183(3):882-889.
Killeffer, D. H. (1927) Butanol and acetone from corn. A description of thefermentation process. Ind Eng Chem 19:46-50.
Kim, B. H., Bellows, P., Datta, R. and Zeikus, J. G. (1984) Control of carbon andelectron flow in Clostridium acetobutylicum fermentations: utilization of carbonmonoxide to inhibit hydrogen production and to enhance butanol yields. Appl EnvironMicrobiol 48:764-770.
Kim, J. D. and Rees, D. C. (1993) X-ray crystal structure of the nitrogenasemolybdenum-iron protein from Clostridium pasteurianum at 3.0-Å resolution.Biochemistry 32:7104-7115.
Kutzenek, A. and Aschner, M. (1952) Degenerative processes in a strain of
Clostridium butylicum. J Bacteriol 64:829-836.
Laemmli, U. (1970) Cleavage of structural proteins during the assembly of the head ofbacteriophage T4 . Nature (London) 227:680-685.
Lanne, C., Krone, W., Konings, W., Haaker, H. and Veeger, C. (1980) Short-termeffect of ammonium chloride on nitrogen fixation by Azotobacter vinelandii and bybacteroides of Rhizobium leguminosarum. Eur J Biochem 103:39-46.
Lee, S. F., Forsberg, C. W. and Gibbins, L. N. (1985) Cellulolytic activity ofClostridium acetobutylicum. Appl Environ Microbiol 50(2):220-228.
192
Lee, S. Y., Bennett, G. N. and Papoutsakis, E. T. (1992) Construction of Escherichia
coli-Clostridium acetobutylicum shuttle vectors and transformation of Clostridium
acetobutylicum strains, Biotech Lett 14(5):427-432.
Lemmel, S. A. (1984) Mutagenesis in Clostridium acetobutylicum. Biotech Lett
7(10):711-716.
Lenz, G. T. and Moreira, R. (1980) Economic evaluation of the acetone-butanolfermentation. Ind Eng Chem Prod Dev 19:478-483.
Lepage, C., Fayolle, F. M. and Vandecasteele, J.-P. (1987) Changes in membranelipid composition of Clostridium acetobutylicum during acetone-butanol fermentation:Effects of solvents, growth temperature and pH. J General Microbiol 133:103-110.
Lewis, R. J., Scott, D. J., Brannigan, J. A. et al. (2001) Dimer formation andtranscription activation in the sporulation response regulator Spo0A. J Mol Biol
316(2):235-245.
Li, G-S. (1998) Development of a reporter system for the study of gene expression forsolvent production in Clostridium beijerinckii NRRL B592 and Clostridium
acetobutylicum ATCC 824. PhD Thesis. Virginia Tech, Blacksburg, Virginia.
Lin, Y-L, Blaschek, H. P. (1984) Transformation of heat-treated Clostridium
acetobutylicum protoplasts with pUB110 plasmid DNA. Appl Environ Microbiol48(4):737-742.
Logsdon, J. E. (1999) Isopropyl alcohols. In Concise encyclopedia of chemical
technology. 4th edition. Krochwitz J. I. (ed). A Wiley Interscience Publication. JohnWiley and Sons Inc. pp:1654-1656.
Long, S., D. T. Jones, and D. R. Woods (1984b) Initiation of solvent production,clostridial stage and endospore formation in Clostridium acetobutylicum P262 (nowknown as Clostridium sp. P262). Appl Microbiol Biotechnol 20:256-261.
Long, S., Jones, D. T. and Woods, D. R. (1983) Sporulation of C. acetobutylicum P262in a defined medium. Appl Environ Microbiol 45(4):1389-1393.
Long, S., Jones, D. T. and Woods, D. R. (1984a) The relationship between sporulation
and solvent production in Clostridium acetobutylicum P262. Biotech Lett 6(8):529-534.
193
Ludden, P. W. and Roberts, G. P. (1989) Regulation of nitrogenase activity byreversible ADP ribosylation. Curr Top Cell Regul. 30:23-56.
Ludden, P. W., Shah, V. K., Roberts, G. P., Homer, M., Allen, R., Paustin, T., Roll,J., Chatterjee, R., Madden, M. and Allen, J. (1993) Biosynthesis of the iron-molybdenum cofactor of nitrogenase. ACS symposium series 535: 196-215.
Magni, C., Marini, P. and Mendoza, D. (1995) Extraction of RNA from gram-positivebacteria. Biotechniques 19(6):880-884.
Marmur, J. (1961) A procedure for the isolation of deoxyribonucleic acid frommicroorganisms. J Mol Biol 3:208-218.
Martin. J. R., Petitdemange, H., Ballongue, J. and Gay, R. (1983) Effects of aceticand butyric acids on solvent production by Clostridium acetobutylicum. Biotechnol Lett
5:89-94.
Masion, E., Amine, J. and Marczak, R. (1987) Influence of amino acid supplementson the metabolism of Clostridium acetobutylicum ATCC 824. FEMS Microbiol Lett43:269-274.
Mattson, D. M. and Rogers, P. (1994) Analysis of Tn916-induced mutants ofClostridium acetobutylicum altered in solventogenesis and sporulation. J IndusMicrobiol 13:258-268.
McCoy, E., Fred, E. B., Peterson, W. H. and Hasting, E. G. (1926) A cultural study
of the acetone butyl alcohol organism. J Infect Dis 39:457-483.
McDaniel, L. E., Wooley, D.W. and Peterson, W.H. (1939) Growth factors forbacteria: Nutrient requirements of certain butyl-alcohol producing bacteria. J Bacteriol37:259-268.
Meinecke, B., Bahl, H. and Gottschalk, G. (1984) Selection of an asporogeneous strainof Clostridium acetobutylicum in continuous culture under phosphate limitation. ApplEnviron Microbiol 48:1064-1065.
Mermelstein, L. D. and Papoutsakis, E. T. (1993) In vivo methylation in Escherichiacoli by the Bacillus subtilis phage Φ3T I methyltransferase to protect plasmids from
194
restriction upon transformation of Clostridium acetobutylicum ATCC 824. Appl EnvironMicrobiol 59(4):1077-1081.
Mermelstein, L. D., Papoutsakis, E. T., Peterson, D. J. and Bennett, G. N. (1993)Metabolic engineering of Clostridium acetobutylicum ATCC 824 for increased solvent
production by enhancement of acetone formation enzyme activities using a syntheticacetone operon. Biotech Bioeng 42:1053-1060.
Mermelstein, L. D., Welker, N. E., Bennett, G. N. and Papoutsakis, E. T. (1992)Expression of cloned homologous fermentative genes in Clostridium acetobutylicum
ATCC 824. Bio/Technology 10:190-195.
Meyer, C. L. and Papoutsakis, E. T. (1989) Increased levels of ATP and NADH areassociated with increased solvent production in continuous cultures of Clostridium
Miller, R. W. and Eady, R. R. (1988) Molybdenum and vanadium nitrogenases ofAzotobacter chroococcum :low temperature favours N2 reduction by vanadiumnitrogenase. J Biochem 256:429-432.
Mitchell, W. J. (1998) Phsiology of carbohydrate to solvent conversion by clostridia.Adv Microbial Physiol 39:31-130.
Monot, F. and Engasser, J. M. (1983) Production of acetone and butanol by batch andcontinuous cultures of Clostridium acetobutylicum under nitrogen limitation. BiotechLett 5:213-218.
Monot, F., Engasser, J. M. and Petitdemange, H. (1984) Influence of pH andundissocited butyric acid on production of acetone and butanol in batch cultures of C.
Monot, F., Martin, J-R., Petitdemange, H. and Gay, R. (1982) Acetone and butanolproduction by Clostridium acetobutylicum in a synthetic medium. Appl EnvironMicrobiol 44(6):1318-1324.
Moreira, A. R., Ulmer, D. C. and Linden, J. C. (1981) Butanol toxicity in the butylicfermentation. Biotech Bioeng Symp 11:567-579.
195
Morett, E., Moreno, S. and Espin, G. (1988) Transcription analysis of the three nifH
genes of Rhizobium phaseoli with gene fusions. Mol Gen Genet 213:499-504.
Mortenson, L. E. (1965) Nitrogen fixation in extracts of Clostridium pasteurianum. InNonheme iron proteins: Role in energy conversion. Pietro, A. S. (ed). The Antioch
Press & Yellow Springs, Ohio. pp:243-259.
Mulligan, M. E., Buikemia, W. J. and Haselkorn, R. (1988) Bacterial-type ferredoxingenes in the nitrogen fixation regions of the cyanobacterium Anabaena sp. strain PCC7120 and Rhizobium meliloti. J Bacteriol 170(9):4406-4410.
Nair, R. V. and Papoutsakis, E. T. (1994) Expression of plasmid-encoded aad inClostridium acetobutylicum M5 restores vigorous butanol production. J Bacteriol176:5843-5846.
Nair, R. V., Bennett, G. N. and Papoutsakis, E. T. (1994) Molecular characterization
of an aldehyde/alcohol dehydrogenase gene from Clostridium acetobutylicum ATCC 824.J Bacteriol 176(3):871-885.
Nair, R. V., Green, E. M., Watson, D. E., Bennett, G. N. and Papoutsakis, E. T.(1999) Regulation of the sol locus genes for butanol and acetone formation inClostridium acetobutylicum ATCC 824 by a putative transcriptional repressor. JBacteriol 181:319-330.
Nakotte, S., Schaffer, S., Bohringer, M. and Dürre, P. (1998) Electroporation of,plasmid isolation from and plasmid conservation in Clostridium acetobutylicum DSM792. Appl Microbiol Biotechnol 50:564-567.
Newton, W. E. (2002) Nitrogen fixation and the enzyme nitrogenase. In Handbook ofFood Enzymology. W.E. Newton in J.R. Witaker, A.G.J. Voragen, D. Wang, and G.Beldman(eds.) Marcel Dekker Inc., New York, NY, in press.
Niven, C. F. JR. (1944) Nutrition of Streprococcus lactis. J Bacteriol 47:343-350.
Noelling, J., Breton, G., Omelchenko, M. V., Makarova, K. S., Zeng, Q., Gibson, R.,Lee, H. M., Dubois, J., Qiu, D., Hitti, J., Production, GSC; Teams, F. B; Wolf, YI.,Tatusov, RL; et al. (2001) Genome Sequence and Comparative analysis of the solvent-producing bacterium Clostridium acetobutylicum J Bacteriol 183(16):4823-4838.
196
Norel, F. and Elmerich, C. (1987) Nucleotide sequence and functional analysis of thetwo nifH copies of rhizobium ORS571. J Gen Microbiol 133:1563-1576.
Oultram, J. D. and Young, M. (1985) Conjugal transfer of plasmid pAMβ1 from
Streptococcus lactis and Bacillus subtilis to Clostridium acetobutylicum. FEMSMicrobiol Lett 27:129-134.
Oultram, J. D., Burr, I. D., Elmore, M. J. and Minton, N. P. (1993) Cloning andsequence analysis of the genes encoding phosphotransbutyrylase and butyrate kinasefrom Clostridium acetobutylicum. Gene 131:107-112.
Oultram, J. D., Loughlin, M., Swinfield, T-J., Brehm, J. K., Thompson, D. E. andMinton, N. P. (1988) Introduction of plasmid into whole cells of Clostridium
acetobutylicum by electroporation. FEMS Microbiol Lett 56:83-88.
Ounine, K., Petitdemange, H., Raval, G. and Gay, R. (1985) Regulation and butanolinhibition of D-xylose and D-glucose uptake in Clostridium acetobutylicum. ApplEnviron Microbiol 49(4):874-878.
Pablo, A. and Scolnick, R. (1984) Activation of extra copies of genes coding fornitrogenase in Rhodopseudomonas capsulata. Nature(London) 307:289-292.
Palosaari, N. R. and Rogers, P. (1988) Purification and properties of the induciblecoenzyme A-linked butyraldehyde dehydrogenase from Clostridium acetobutylicum
NRRL B643. J Bacteriol 170(7):2971-2976.
Pau, R. N. (1994) Metals and nitrogenase. In: Advances in inorganic biochemistry.Eichhron, G. L., Marzilli, L. G. (Eds). Vol 10, pp: 49-70. New Jersey, PTR PrenticeHall.
Peguin, S., Goma, G., Delorme, P. and Soucaille, P. (1994) Metabolic flexibility ofClostridium acetobutylicum in response to methyl viologen addition. Appl MicrobiolBiotechnol 42:611-616.
Peretz, M., Bogin, S., Cohen, A., Li, G. S., Chen, J.-S. and Burstein, Y. (1997)Molecular cloning, nucleotide sequencing, and expression of genes encoding alcoholdehydrogenases from termophile Thermoanaerobacter brockii and the mesophileClostridium beijerinckii. Anaerobe 3:259-270.
197
Peterson, D. J. and Bennett, G. N. (1990) Purification of acetoacetate decarboxylasefrom Clostridium acetobutylicum ATCC 824 and cloning of the acetoacetatedecarboxylase gene in Escherichia coli. Appl Environ Microbiol 56(11):3491-3498.
Peterson, D. J. and Bennett, G. N. (1991) Cloning of the Clostridium acetobutylicum
Peterson, D. J., Welch, R. W., Rudolph, F. B. and Bennett, G. N. (1991a) Molecularcloning of an alcohol (butanol) dehydrogenase gene cluster from Clostridium
Peterson, D. J., Welch, R. W., Walter, K. A., Mermelstein, L. D., Papoutsakis, E. T.,Rudolph, F. B. and Bennett, G. N. (1991b) Cloning of an NADH-dependent butanoldehydrogenase gene from Clostridium acetobutylicum. Annuals NY Acad Sci 649:94-98.
Pierrard, J., Ludden, P. W. and Roberts, G. P. (1993) Posttranslational regulation ofnitrogenase in Rhodobacter capsulatus: existence of two independent regulatory effectsof ammonium. J Bacteriol 175(5):1358-1366.
Prescott, S. C. and Dunn, C. G. (1959). Industrial microbiology. 3rd edition, pp.250-283. McGraw-Hill book Co., New York.
Quisel, J. D., Burkholder, W. F. and Grossman, A. D. (2001) In vivo effects ofsporulation kinases on mutants Spo0A proteins in Bacillus subtilis. J Bacteriol183(22):6573-6578.
Qureshi, N. and Blaschek, H. P. (2001) ABE fermentation from corn: a recenteconomic evaluation. J Ind Microbiol Biotech 27:292-297.
Raina, R., Reddy, M. A., Ghosal, D. and Das, H. K. (1988) Characterization of thegene for the iron-protein of the vanadium dependent alternative nitrogenase ofAzotobacter vinelandii and construction of a Tn5 mutant. Mol Gen Genet 214:121-127.
Rangaraj, P., Shah, V. K. and Ludden, P. W. (1997) Apo NifH functions in iron-molybdenum cofactor synthesis and apodinitrogenase maturation. Proc Natl Acad SciUSA. 94(21):11250-11255.
198
Rao, G. and Mutharasan, R. (1986) Alcohol production by Clostridium
acetobutylicum (now known as Clostridium beijerinckii NRRL B591) induced by methylviologen. Biotechnol Lett 8:893-896.
Ravagnani, A., Jennert, K.C.B., Steiner, E., Grunberg, R., Jefferies, J.R.,Wilkonson, S.R., Young, D.I., Tidswell, E.C., Brown, D.P., Youngman, P., Morris,J.G. and Young, M. (2000) Spo0A directly controls the switch from acid to solventproduction in solvent-forming clostridia. Molecular Microbiol. 37(5):1172-1185.
Rennie, R. J. (1976) Immunofluoresence detection of nitrogenase proteins in wholecells. J Gen Microbiol 97:289-296.
Ribbe, M., Gadkari, D. and Meyers, O. (1997) N2 fixation by Streptomyces
thermoautotrophicus involves a molybdenum-dinitrogenase and a manganase-superoxideoxidoreductase that couple N2 reduction to the oxidation of superoxide produced from O2
by a molybdenum-CO dehydrogenase. J Biol Chem 272(42):26627-26633.
Ricardo, C-R., Cary, N. M. and Mark, E. R. (1992) Loading and transfer control fornorthern hybridization. Biotechniques 12(2):154-158.
Robson, R. L. (1984) Identification of possible nucleotide-binding sites in nitrogenaseFe- and MoFe-proteins by amino acid sequence comparison. FEBS Letters 173(2):394-398.
Robson, R. L., Woodley, P. R., Pau, R. N. and Eady, R. R. (1989) Structural genesfor the vanadium nitrogenase from Azotobacter chroococcum. EMBO 8:1217-1224.
Roos, J.W., McLaughlin, J. and Papoutsakis, E.T. (1984) The effect of pH onnitrogen supply, cell lysis and solvent production in fermentation of Clostridium
acetobutylicum. Biotechnol Bioeng. 27:681-694.
Rosenblum, E. D. and Wilson, P. W. (1949) Fixation of isotopic nitrogen byclostridium. J Bacteriol. 57:413-414.
Ross, R., John, D., Mooney, R. and Chesbro, W. (1990) Nutrient limitation of twosaccharolytic clostridia: secretion, sporulation and solventogenesis. FEMS MicrobiolEcology 74:153-164.
199
Sambrook, J., Fritsch, E. F. and Maniatis, T. (1989) Molecular cloning: a laboratorymanual. 2nd edition. Cold Spring Harbor Laboratory Press. New York, USA.
Satola, S., Kirchman, P. A. and Moran, C. P. (1992) Spo0A binds to a promoter usedsigma A RNA polymerase during sporulation in Bacillus subtilis. Proc Natl Acad Sci
USA. 88:4533-4537.
Sauer, U. and Dürre, P. (1995) Differential induction of genes related to solventformation during the shift from acidogenesis to solventogenesis in continuous culture ofClostridium acetobutylicum. FEMS Microbiol Lett 125:115-120.
Schoutens, G. H. and Groot, W. J. (1985) Economic feasibility of the production ofisopropanol-butanol-ethanol fuels from whey permeate. Process Biochem 20:117-121.
Scolnick, P. A. and Haselkorn, R. (1984) Activation of extra copies of genes codingfor nitrogenase in Rhodopseudomonas capsulata. Nature 307:289292.
Seto, B. and Mortenson, L. E. (1974) In vivo kinetics of nitrogenase formation inClostridium pasteurianum. J Bacteriol 120(2):822-830.
Soni, B. K., Soucaille, P. and Goma, G. (1987a) Continuous acetone-butanolfermentation: a global approach for the improvement in the solvent productivity insynthetic medium. Appl Microbiol Biotech 25:317-321.
Soni, B. K., Soucaille, P. and Goma, G. (1987b) Continuous acetone-butanolfermentation: influence of vitamins on the metabolic activity of Clostridium
acetobutylicum Appl Microbiol Biotech 27:1-5.
Souillard, N., and Sibold, L. (1989) Primary structure, functional organization andexpression of nitrogenase structural genes of the thermophillic archaebacteriumMethanococcus thermolithotrophicus. Mol Microbbiol 3:541-551.
Stephens, G. M., Holt, R. A., Gottschal, J. C. and Morris, J. G. (1985) Studies on thestability of solvent production by Clostridium acetobutylicum in continuous culture. JAppl Bacteriol 59:597-605.
Stim-Herndon, K. P., Nair, R., Papoutsakis, E. T. and Bennett, G. N. (1996)Analysis of degenerate varients of Clostridium acetobutylicum ATCC 824. Anaerobe
2:11-18.
200
Szech, U., Manfred, B. and Kleiner, D. (1988) Uptake and excretion of amino acids bysaccharolytic clostridia. FEMS Microbiol Lett 58:11-14.
Tanaka., M., Haniu, M., Yasunobu, T. and Mortenson, L. E. (1977) The amino acid
sequence of Clostridium pasteurianum iron protein, a component of nitrogenase. JBacteriol 252(20):7089-7092.
Tatum, E. L., Peterson, W. H. and Fred, E. B. (1935) Identification of asparagine asthe substance stimulating the production of butylalcohol by certain bacteria. J Bacteriol29(5):563-572.
Terracciano, J. S. and Kashket, E. R. (1986) Intracellular conditions required forinitiation of solvent production by Clostridium acetobutylicum. Appl Environ Microbiol52(1):86-91.
Thompson, D. K. (1989) Acetoacetyl coenzyme A-reacting enzymes in solvent-producing Clostridium beijerinckii NRRL B593. PhD Thesis. Virginia Tech,Blacksburg, Virginia.
Thompson, D. K. and Chen, J.-S. (1990) Purification and properties of an acetoacetylcoenzyme A-reacting phophotransbutyrylase from Clostridium beijerinckii (Clostridium
butylicum) NRRL B593. Appl Environ Microbiol 56(3):607-613.
Thormann, K. and Dürre, P. (2001) Orf5/SolR: a transcriptional repressor of the sol
operon of Clostridium acetobutylicum? J Ind Microbiol Biotechnol 27:307-313.
Thormann, K., Feustel, L., Lorenz, K., Nakotte, S. and Dürre, P. (2002) Control ofbutanol formation in Clostridium acetobutylicum by transcriptional activation. JBacteriol 184(7):1966-1973.
Toshihide, S., Suzuki, P. J., Paul, J. H. and Dana, R. C. (2000) Control selection forRNA quantification. Biotechniques 29(2):332-337.
Toth, J., Ismaiel, A. A. and Chen, J.-S. (1999) The ald gene, encoding a coenzyme A-acylating aldehyde dehydrogenase, distinguishes Clostridium beijerinckii and two othersolvent-producing clostridia from Clostridium acetobutylicum. Appl Environ Microbiol65(11):4973-4980.
201
Toth, J. and Chen, J.-S. (1998) Organization of the acetone-butanol production genesin Clostridium beijerinckii NRRL B593. Abstr. 98th Gen. Meet. Am. Soc. Microbiol. O-39. p:399.
Truffaunt, N., Hubert, J. and Reyset, G. (1989) Construction of shuttle vectors useful
for transforming Clostridium acetobutylicum. FEMS Microbiol Lett 58:15-20.
Tumalla, S. B., Welker, N. E. and Papoutsakis, E. T. (1999) Development andcharacterization of a gene expression reporter system for Clostridium acetobutylicum
ATCC 824. Appl Environ Microbiol 65(9):3793-3799.
Ullmann, S., Kuhn, A. and Dürre, P. (1996) DNA topology and gene expression inClostridium acetobutylicum: Implications for the regulation of solventogenesis. BiotechLett 18(12):1413-1418.
Upchurch, G. R. and Mortenson, L. E. (1980) In vivo energetics and control of
nitrogen fixation: changes in the adenylate charge and adenosine 5’-diphosphate/adenosine 5’-triphosphateratio of cells during growth on dinitrogen versusgrowth on ammonia. J Bacteriol 143:274-284.
Valderrama, B., Davalos, A., Girard, L., Morett, E. and Mora, J. (1996) Regulatoryproteins and cis-acting elements involved in the transcriptional control of Rhizobium etli
Van Niel, E. W. and Hahn-Hagerdal, B. (1999) Nutrient requirements of lactococci indefined growth media Appl Microbiol Biotechnol 52:617-627.
Vasconcelos, I., Girbal, L. and Soucaille, P. (1994) Regulation of carbon and electronflow in Clostridium acetobutylicum grown in chemostat culture at neutral pH on mixtureof glucose and glycerol. J Bacteriol 176:1443-1450.
Walter, K. A., Bennett, G. N. and Papoutsakis, E. T. (1992) Molecularcharacterization of two Clostridium acetobutylicum ATCC 824 butanol dehydrogenaseisoenzyme genes. J Bacteriol 174(22):7149-7158.
Walter, K. A., Nair, R. V., Cary, J. W., Bennett, G. W. and Papoutsakis, E. T.(1993) Sequence and arrangement of two genes of the butyrate-synthesis pathway ofClostridium acetobutylicum ATCC 824.
202
Wang, S.-Z., Chen, J.-S. and Johnson, J. L. (1988) The presence of five nifH-likesequences in C. pasteurianum: sequence divergence and transcriptional properties.Nucleic Acids Research 16(2):439-453.
Wang, S-Z, Dean, R. D., Chen, J.-S. and Johnson, J. L. (1991) The N-terminal and
C- terminal portions of NifV are encoded by two different genes in Clostridium
pasteurianum. J Bacteriol 173(10):3041-3046.
Wang, S-Z., Chen, J.-S. and Johnson, J. L. (1987) Nucleic acid Res 15:3935.
Wang, S-Z., Chen, J.-S., and Johnson, J. L. (1990) A nitrogen-fixation gene (nifC) inClostridium pasteurianum with sequence similarity to chlJ of Escherichia coli. BiochemBiophys Res Commun 169(3):1122-1128.
Waugh, S. I., Paulsen, D. M., Mylona, P. V., Maynard, R. H., Premarkur, R. andBishop, P. E. (1995) The genes encoding the delta subunits of dinitrogenase 2 and 3 are
required for mo-independent diizotrophic growth by Azotobacter vinelendii. J Bacteriol.177(6): 1505-1510.
Welch, R. W., Rudolph, F. B. and Papoutsakis, E. T. (1989) Purification andcharacterization of the NADH-dependent butanol dehydrogenase from Clostridium
Welsh, F. W., Ross, E.W. and Veliky, I. A. (1987) Organic and inorganic nitrogensource effects on the metabolism of Clostridium acetobutylicum. Appl MicrobiolBiotechnol 26:369-372.
Welsh, F. W., Williams, R. E. and Veliky, I. A. (1986) A note on the effect of nitrogensource on growth of and solvent production by Clostridium acetobutylicum J ApplBacteriol 61:413-419.
Wiesenborn, D. P., Rudolph, F. B. and Papoutsakis, E. T. (1989)Phosphotransbutyrylase from Clostridium acetobutylicum ATCC 824 and its role inacidogenesis. Appl Environ Microbiol 55(2):317-322.
Wilke, D. (1999) Chemicals from biotechnology:molecular plant genetics willchallenge the chemical and the fermentation industury. Appl Microbiol Biotechnol52:135-145.
203
Wilkinson, S. R. and Young, M. (1994) Targeted integration of genes into theClostridium acetobutylicum chromosome. Microbiology 140:89-95.
Wilkinson, S. R. and Young, M. (1995) Physical map of the Clostridium beijerinckii
Winzer, K., Lorenz, K., Dürre, P. (1987) Acetate kinase from Clostridium
acetobutylicum: a highly specific enzyme that is actively transcribed during acidogenesisand solventogenesis. Microbiology 143:3279-3286.
Woolley, R. C. and Morris, J. G. (1990) Stability of solvent production by Clostridium
acetobutylicum in continuous culture: strain differences. J Appl Bacteriol 69:718-728.
Woolley, R. C., Pennock, A., Ashton, R. J., Davies, A. and Young, M. (1989)Transfer of Tn1545 and Tn916 to Clostridium acetobutylicum. Plasmid 22:169-174.
Yan, R. T. and Chen, J.-S. (1990) Coenzyme A-acylating aldehyde dehydrogenasefrom Clostridium beijerinckii NRRL B592. Appl Environ Microbiol 56:2591-2599.
Yan, R.-T., Zhu, C.-X., Golemboski, C. and Chen, J.-S. (1988) Expression ofsolvent-forming enzymes and onset of solvent production in batch cultures ofClostridium beijerinckii (Clostridium butylicum). Appl Environ Microbiol 54(3):642-648.
Yerushalmi, L. and Volesky, B. (1985) Importance of agitation in acetone-butanolfermentation by Clostridium acetobutylicum. Biotechnol Bioeng 27:1297-1305.
Yoshino S., Yoshino, T., Hara, S., Ogata, S. and Hayashida, S. (1990) Constructionof shuttle vector plasmid between Clostridium acetobutylicum and Escherichia coli.Agric Biol Chem 54(2):437-441.
Young, J. P. W. (1992) Phylogenetic classification of nitrogen-fixing organisms. InBiological nitrogen fixation. Stacey, G., Burris, R. H. and Evans, H. J. (eds). New YorkChapmen & Hall. pp. 43-86.
Youngleson, J. S., Jones, W. A., Jones, D. T. and Woods, D. R. (1988) Molecularanalysis and nucleotide sequence of the adh1 gene encoding an NADPH-dependent
204
butanol dehydrogenase in the gram-positive anaerobe Clostridium acetobutylicum. Gene78:355-364.
Youngleson, J. S., Santangelo, J. D., Jones, D. T. and Woods, D. R. (1987) Cloningand expression of a Clostridium acetobutylicum alcohol dehydrogenase gene in
Escherichia coli. Appl Environ Microbiol 54(1):676-682.
Zappe, H., Jones, D. T. and Woods, D. R. (1985) Cloning and expression ofClostridium acetobutylicum endogluconase, cellobiase and amino acid biosynthesis genesin Escherichia coli. J General Microbiol 132:1367-1373.
CURRICULUM VITAE
Murat KasapDepartment of Biochemistry
Virginia Polytechnic Institute and State University (Virginia Tech)
313 Engel Hall, Blacksburg, Virginia 24061Tel: (540) 231-3525 Fax: (540) 231-9070
EducationPh.D. in Biochemistry (8/97-7/2002) Department of Biochemistry,
Virginia Tech, Blacksburg, VA.Advisor: Prof. J-S ChenThesis: Nitrogen metabolism and solvent production in Clostridium
beijerinckii NRRL B593.M. S. (8/1995-8/1997) Department of Biochemistry, Virginia Tech,Blacksburg, VA.Advisor: Prof. J-S ChenThesis: Hydrogenase of Clostridium acetobutylicum ATCC 824.B.S. (8/89-8/93) Department of Chemistry, Istanbul Technical University,Istanbul, Turkey.Short Course Attended:
Inorganic Biochemistry Summer Workshop.Center for Metalloenzyme Studies (CMS). (1998) The University ofGeorgia, Athens, GA. Various spectroscopic techniques and theirapplications in biochemistry are covered.
Research InterestsMicrobiology: Understanding the factors that can affect growth, productformation and product pattern in organisms that can ferment variouscarbohydrates to commercially valuable products.Biochemistry: Understanding modulation of electron flow in fermentativebacteria and using this as a tool to manipulate the growth and yield ofproduct formation
Molecular biology: Cloning and expression of the genes involved innitrogen metabolism and understanding their functional properties,physiological roles and regulation.
Professional ExperiencesGraduate teaching assistant (Spring semester, 1997) Prof. Malcom Potts.
Department of Biochemistry, Virginia Tech, Blacksburg, Virginia.Assisted in teaching the undergraduate biochemistry course offered tobiochemistry senior students.Graduate teaching assistant (Fall semester, 1998) Prof. James O.Glenville. Department of Chemistry, Virginia Tech, Blacksburg, Virginia.Assisted in teaching the undergraduate general chemistry laboratorycourse offered to science majors.Graduate research assistant (Summer of 1996, 1997, 1998) Prof. J-S.Chen. Department of Biochemistry, Virginia Tech, Blacksburg, VirginiaGraduate research assistant (1999-present) Prof. J-S. Chen. Department ofBiochemistry, Virginia Tech, Blacksburg, Virginia.
Responsibilities include primary doctoral research of investigating (a) theeffect of nitrogen metabolism on acetone-butanol-isopropanolfermentation by C. beijerinckii NRRL B593, (b) identification of thegrowth stimulating factors and development of a defined medium that canbe used to study nitrogen metabolism (c) cloning of nitrogen fixationgenes and studying their regulation.
Professional SkillsBiochemistry: Purification and characterization of oxygen sensitiveenzymes, liquid chromatography, SDS-polyacrylamide gel electrophoresis(PAGE), non-denaturing gel electrophoresis and staining for enzymeactivities, preparative gel electrophoresis, western blot analysis, MALDI-
Tof mass spectroscopy.Molecular Biology: Isolation of genomic DNA from gram-positivebacteria, isolation of plasmid DNA from gram negative bacteria, isolationof intact RNA from gram-positive and gram-negative bacteria (byconventional procedures), Southern blot analysis, northern blot analysis,PCR, RT-PCR, cloning of genomic DNA fragments into plasmid vectors,screening of recombinant clones, sequencing and identification of thecloned genes, electroporationMicrobiology: Growth of anaerobic bacteria on various scales andanalysis of growth characteristics and fermentation products.Instrumentation: Gas chromatography, spectrophotometry, phase contrast
microscopy, manometry, vacuum manifold for anaerobic operations.
Academic Honor and Success-Graduated from the Chemistry Department of Istanbul Technical
University with the ranking of first out of 80 students-Ranked fifth in a national exam in Chemistry in Turkey in 1994 andawarded to study Biochemistry in the United States with full support fromTurkish government.-Honor student award in 1999 by Turkish government for successfulrepresentation of Turkey in science.-Member of Sigma-Xi
PublicationsChen, J-S., Toth, J. and Kasap, M. (2001) Nitrogen-fixation genes andnitrogenase activity in Clostridium acetobutylicum and Clostridium
beijerinckii. Journal of Industrial Microbiology and Biotechnology. 26:1-
6.Toth, J., Kasap, M., Chen, J-S. (2001) Organization of nitrogen fixationgenes in Clostridium beijerinckii NRRL B593. Abstr. 101st Gen. Meet.Am. Soc. Microbiol. K-108, p.466.
PresentationsDepartmental: Department of Biochemistry, Virginia Tech, Blacksburg,VA (1997, 1998).
-Hydrogenase of Clostridium acetobutylicum.
-Hydrogen metabolism in prokaryotes.International conference:
Clostridium 2000. (2000) Nitrogen metabolism and solvent
production in C. beijerinckii NRRL B593 (Poster). The Universityof Illinois at Urbana-Champaign, IL.