A STUDY ON MEDIATING EFFECTS ON SERVICE LOYALTY IN MOBILE SERVICE PROVIDERS IN CAUVERY DELTA DISTRICTS IN TAMILNADU Thesis submitted to BHARATHIDASAN UNIVERSITY, TIRUCHIRAPALLI Partial fulfillment of the requirements for the award of the degree of DOCTOR OF PHILOSOPHY IN MANAGEMENT SUBMITTED BY K. KEERTHI, M.B.A., UNDER THE GUIDANCE OF Dr. A. ARULRAJ, M.A., M.Phil., PGDBA, M.B.A., Ph.D., RESEARCH DEPARTMENT OF BUSINESS ADMINISTRATION, RAJAH SERFOJI GOVERNMENT COLLEGE, (AUTONOMOUS), THANJAVUR – 613 005, TAMILNADU, INDIA. JANUARY 2014
Transcript
A STUDY ON MEDIATING EFFECTS ON SERVICE LOYALTY IN MOBILE SERVICE PROVIDERS IN CAUVERY DELTA DISTRICTS IN TAMILNADU
Thesis submitted to
BHARATHIDASAN UNIVERSITY, TIRUCHIRAPALLI
Partial fulfillment of the requirements for the award of the degree of
DOCTOR OF PHILOSOPHY IN MANAGEMENT
SUBMITTED BY
K. KEERTHI, M.B.A.,
UNDER THE GUIDANCE OF
Dr. A. ARULRAJ, M.A., M.Phil., PGDBA, M.B.A., Ph.D.,
RESEARCH DEPARTMENT OF BUSINESS ADMINISTRATION,
RAJAH SERFOJI GOVERNMENT COLLEGE, (AUTONOMOUS),
THANJAVUR – 613 005, TAMILNADU, INDIA.
JANUARY 2014
CERTIFICATE
This to certify that the thesis entitled “A STUDY ON MEDIATING EFFECTS
ON SERVICE LOYALTY IN MOBILE SERVICE PROVIDERS IN CAUVERY
DELTA DISTRICTS IN TAMILNADU” is submitted by Mrs. K.KEERTHI, a
Full time Ph.D scholar in the Research Department of Business
Administration, Rajah Serfoji Government College, (Autonomous)
Thanjavur – 613 005. The thesis is the outcome of the personal research
done by the candidate under my supervision and guidance and I certify
that the thesis has not formed the basis for the award of any degree or any
other similar title.
Date: (Dr. A. ARULRAJ)
Place:
DECLARATION
I hereby declare that the work embodied in this thesis has been originally
carried out by me under the supervision of Dr. A. ARULRAJ, M.A., M.B.A.,
M.Phil., PGDBA., PhD., Assistant Professor, PG & Research Department of
Economics, Rajah Serfoji Government College (Autonomous), Thanjavurand
this work has not been submitted either in whole or in part for any other
degree or diploma at any university.
Date: Research Scholar
Place:
(K.KEERTHI)
ACKNOWLEDGEMENTS
The completion of this thesis would not have been possible without support
from several respected persons. First of all, I want to thank my research
advisor, Dr.A.ARULRAJ, M.A., M.Phil., PGDBA., M.B.A., Ph.D, for constructive
comments in guiding me through the process of writing the thesis. I thank
him for profusely encouragement from the very beginning and I am grateful
to him for step-by-step guidance and support.
I extend my heartiest thanks to our beloved Principal
Dr.(Mrs.)K.ANBU, M.Sc., M.Phil., Ph.D, Rajah Serfoji Government College,
(Autonomous) Thanjavur – 613 005, for her encouragement and support.
I am also thankful to my doctoral committee members,
Dr.A.ANANTH & Dr.B.PRABAHARAN for their, knowledge, expertise, and
insightful suggestions. And also my special thanks to Dr.A.ANANTH, who
gave first and most important seeds of my interest in this field and gave
opportunity to serve.
I extend my thanks to my research colleagues Prof.J.SWAMINATHAN,
Mr.M.SAKTHIVEL and Mr.R.ILAVENIL who were instrumental in the process of
completing this degree.
I take this opportunity to express the profound gratitude from my deep heart
to my beloved parents in my life and in research, Mr.T.KARTHIKEYAN, and
to my mother, Mrs.K.ARTHY, whose constant support brought me where I
am today and to many thanks to my Husband, Mr.M.SENTHIL KUMAR, for his
continued enduring source of strength and encouragement and I express my
whole heart full thanks to ever supporting my father in Law & Mother in
Law, Mr.R.MURUGAPPA & Mrs.M.VIJAYALAKSHMI.
I would like thank my colleagues & friends Mr.U.GOWRISHANKER, & Mr.K.R.RAMPRAKASH & Mrs.R.RENUKADEVI for his valuable support at the time of data collection that helped me to carry out this thesis.
I extend my deepest thanks to those who indirectly contributed in this research, your kindness means a lot to me. Thank you very much.
K.KEERTHI
CONTENTS List of Tables
List of Figures
S. No. Chapterisation Page No.
1. Chapter I
Introduction
1.1. Telecommunication Sector 1
1.2. Growth and Development of Indian Telecom Industry
2
1.3. Service Quality in Indian Telecom Sector 9
1.4. Performance of Indian Telecom Sector Post Liberalized Period
10
1.5. Background for the Study 17
1.6. Statement of the Problem 25
1.7. Research Objectives 26
1.8. Research Questions 27
1.9. Proposed Conceptualized Research Model 27
1.10. Significance of the Study 29
1.11. Limitation of Study 29
1.12. Structure of the Thesis 29
1.13. Conclusion
31
2. Chapter II
Literature Review
2.1. Introduction 32
2.2. Studies Related on Growth and Development of Telecom Industry in Global and India
32
2.3. Studies Related Customer Relationships in Telecom Industry
39
2.4. Service Quality of Mobile Phone Service Provider
48
2.5. Service Loyalty 59
2.6. Customer Loyalty 62
2.7. Conclusion
72
3. Chapter III
Research Methodology
3.1. Introduction 73
3.2. Service Quality Measurement – Recent trends
73
3.3. Reflective Research Formation Studies 74
3.4. Formative Research Foundation Studies 77
3.5. Research Design 80
3.6. Procedure for Data Analysis 86
3.7. Hypotheses Development 90
3.8. Conclusion
93
4. Chapter IV
Analyses & Interpretation of Data
4.1. Introduction 94
4.2. Trend analysis in Mobile Service Provider 95
4.3. The Regression “Mobile QUAL” Overall Model
121
4.4. Conclusion
158
5. Chapter V
Findings, Strategic Planning & Conclusions
5.1. Introduction 159
5.2. Findings and Conclusion for the Study 159
5.3. Strategic Planning For Improving Mobile Service Provider Loyalty
170
5.4. Limitations and Directions for Further Research
171
5.5. Conclusion 173
References Questionnaire English
List of Tables
S. No. Particulars P. No.
3.1. Reflective Formation Models and Contributors - 75
3.2. Literature review showed the reflective models on mobile telecommunication Industry
- 76
3.3. Formative Formation Models and Contributors - 77
3.3. Sample Size across the Delta Districts of Tamilnadu - 83
3.4. The Sample Size Across The Difference Demographic Variables
- 85
4.1. Growth of Telephones over the years in Telecom Sector in India (2007-2011)
- 95
4.2. Tele Density in Telecom Sector in India (2007-2011) - 100
4.3. Cumulative FDI and Status of Disbursements made and availability of Fund in Telecom Sector in India (2007-2011)
- 104
4.4. Telecom Equipment and Production in India (2007-2011) - 109
4.5. Growth of Telecom Networks in India (2007-2011) - 112
4.6. Fault Rate in Telecom Sector in India (2007-2011) - 115
4.7. Public Sector – Requirement in Telecom Sector in India (2007-2011)
- 117
4.8. Bayesian Convergence Distribution for “Mobile QUAL” Regression Model
- 124
4.9. Summary of the Various Goodness of Fit Statistics and Other Values Corresponding To the Over All Mediated Mobile QUAL Mediated Structural Equation Model
- 137
4.10. Bayesian Convergence Distribution for “Over All Mediated Mobile QUAL” Structural Model
- 138
List of Figures
S. No.
Particulars Page No.
1.1. Conceptual Model for studying Service loyalty in Mobile Service Providers
- 28
3.1. Proposed Hypothetical Model of “Mobile QUAL Model” - 91
4.1. Trend Analysis plot of Wire line phones in Growth of Telecom Sector in India From (2007-2011)
- 96
4.2. Trend Analysis plot of Wireless phones in Growth of Telecom Sector in India From (2007-2011)
- 97
4.3. Trend Analysis plot of Gross total in Growth of Telecom Sector in India From (2007-2011)
- 98
4.4. Trend Analysis plot of Rural Tele Density of Telecom Sector in India From (2007-2011)
- 101
4.5. Trend Analysis plot of Urban Tele Density of Telecom Sector in India From (2007-2011)
- 102
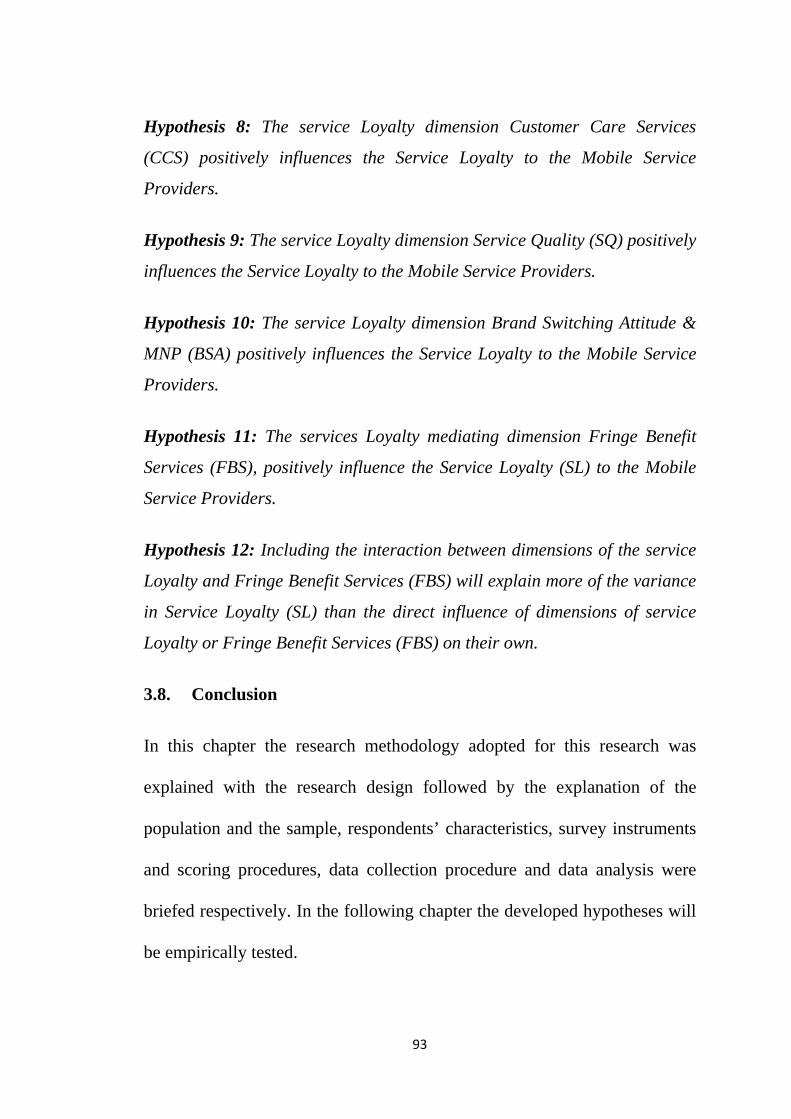
4.6. Trend Analysis plot of Total Tele Density of Telecom Sector in India From (2007-2011)
- 103
4.7. Trend Analysis plot of FDI in Telecom Sector in India From (2007-2011)
- 105
4.8. Trend Analysis plot of Funds Collected as USL in Telecom Sector in India From (2007-2011)
- 106
4.9. Trend Analysis plot of Funds Allocated in Telecom Sector in India From (2007-2011)
- 107
4.10. Trend Analysis plot of Telecom Equipment in Telecom Sector in India From (2007-2011)
- 110
4.11. Trend Analysis plot of Telecom Equipment production in Telecom Sector in India From (2007-2011)
- 111
4.12. Trend Analysis plot of Public Sector Units Telecom network in India From (2007-2011)
- 112
4.13. Trend Analysis plot of Private Sector Units in Telecom network in India From (2007-2011)
- 113
4.14. Trend Analysis plot of Total Telecom Networks in India From (2007-2011)
- 114
4.15. Trend Analysis plot of Fault Rate in New Delhi unit in Telecom Sector in India From (2007-2011).Customer Loyalty
- 115
4.16. Trend Analysis plot of Fault Rate in Mumbai unit in Telecom Sector in India From (2007-2011)
- 116
4.17. Trend Analysis plot of BSNL- Fund Requirement in Telecom Sector in India From (2007-2011)
- 117
4.18. Trend Analysis plot of MTNC- Fund Requirement in Telecom Sector in India From (2007-2011).
- 118
4.19. Shows the AMOS Output with Regression Weights of “Mobile QUAL” Mediated Model
- 122
4.20. Posterior frequency polygon distribution of the Mediating Factor Service Loyalty (SL) and Fringe Benefit Services (FBS) regression weight (W11)
- 125
4.21. Posterior frequency histogram distribution of the Mediating Factor Service Loyalty (SL) and Fringe Benefit Services (FBS) regression weight (W11)
- 126
4.22. Posterior frequency trace plot of the Mediating Factor Service Loyalty (SL) and Fringe Benefit Services (FBS) regression weight (W11
- 127
4.23. Posterior frequency autocorrelation plot of the Mediating Factor Service Loyalty (SL) and Fringe Benefit Services (FBS) regression weight (W11)
- 128
4.24. Two-dimensional surface plot of the marginal posterior distribution of the mediating factor Fringe Benefit Services (FBS) with SQ and SNC
- 129
4.25. Two-dimensional histogram plot of the marginal posterior distribution of the mediating factor Fringe Benefit Services (FBS) with SQ and SNC
- 129
4.26. Two-dimensional contour plot of the marginal posterior distribution of the mediating factor Fringe Benefit Services (FBS) with SQ and SNC
- 130
4.27. Shows AMOS path diagram output for the overall ‘Over All Mediated Mobile QUAL’ Structural Equation Model
- 135
4.28. Posterior frequency polygon distribution of the mediating factor Fringe Benefit Services (FBS) and Service Loyalty (SL) (W49)
- 142
4.29. Posterior frequency histogram distribution of the mediating factor Fringe Benefit Services (FBS) and Service Loyalty (SL) (W49)
- 142
4.30. Posterior trace plot of the Over All Mediated Mobile QUAL s for the mediated factor Fringe Benefit Services (FBS) and Service Loyalty (SL) (W49)
- 143
4.31. Posterior autocorrelation plot of the Over All Mediated Mobile QUAL for the mediated factor Fringe Benefit Services (FBS) and Service Loyalty (SL) (W49)
- 144
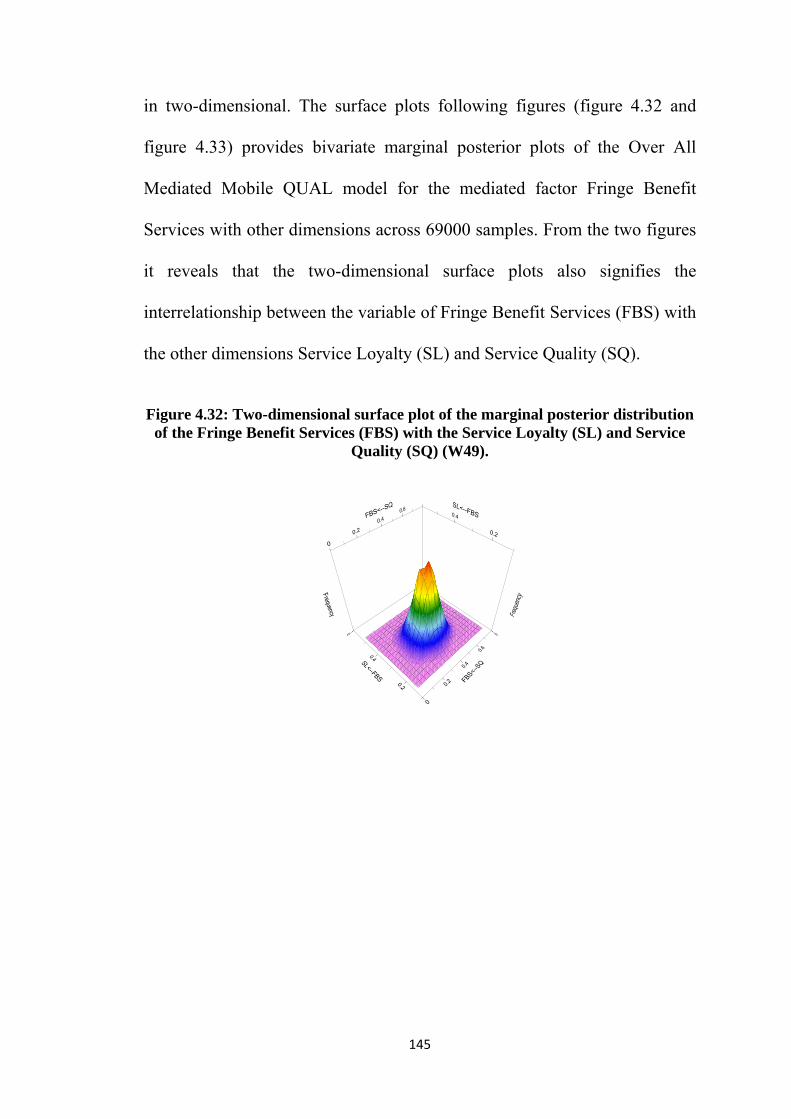
4.32. Two-dimensional surface plot of the marginal posterior distribution of the Fringe Benefit Services (FBS) with the Service Loyalty (SL) and Service Quality (SQ) (W49)
- 145
4.33. Two-dimensional histogram plot of the marginal posterior distribution of the Fringe Benefit Services (FBS) with the Service Loyalty (SL) and Service Quality (SQ) (W49).
- 146
4.34. Two-dimensional contour plot of the marginal posterior distribution of the Fringe Benefit Services with the Service Loyalty (SL) and Service Quality (SQ) (W49)
- 146
5.1. Conceptual Model Research Model - 169
5.2. Strategic Planning for The Mobile Service Provider Loyalty - 170
CHAPTER I
Introduction
1
CHAPTER – I
INTRODUCTION
1.1. Telecommunication Sector
The development of world class telecommunication infrastructure is the key
to rapid economic growth and to bring social change of the country. The
service quality is a playing a vital role in developing in Indian telecom
sector Indian telecommunication sector has undergone a major process of
transformation through significant policy reforms, particularly beginning
with the announcement of National Telecom Policy( NTP) 1994 and was
subsequently re-emphasized and carried forward under NTP 1999. Driven
by various policy initiatives, the Indian telecom sector witnessed a complete
transformation in the last decade. It has achieved a phenomenal growth
during the last few years and is poised to take a big leap in the future also.
Such rapid growth in the communication sector has become necessary for
further modernization of Indian economy through rapid development
in Information Technology. Indian Telecommunication sector is playing a
vital role in development of economic and social change in rural India.
Nowadays, the rural India depends upon the mobile services for the rural
people communication for their livelihood developments and other
agriculture activities. The service quality is very essential for the
sustainability for telecommunication in India.
2
Mobile phone services are the fast growing services in telecommunication
industry in India. This sector is showing an inspiring growth in last few
years. Land phone market has no competency to compete with mobile phone
market. Land phone market faces some problems such as weak and
inadequate infrastructure, corruption, long procedures, limited income of
consumers etc. But mobile phone service charges in India were high before
2005 because of weak regulatory systems, restricted openness, and
concentrated market orientation. Effective regulation, more openness, and
entrance of competitive firms including launching a new state owned mobile
phone service company foster competition in this sector since 2005. It is
assumed that, currently the number of mobile phone subscriber is more than
46 million and expected it will cross 60 million by 2012.
Telecommunication sector of a country can tremendously affect the society
with different products and services.
1.2. Growth and Development of Indian Telecom Industry
The history of the Indian Telecom sector goes way back to 1851, when
the first operational landlines were laid by The British Government in
Calcutta. With independence, all foreign telecommunication companies
were nationalized to form Post, Telephone and Telegraph, a monopoly
run by the Government of India. DoT (Department of
Telecommunications) was formed in 1985 when the Department of Posts
3
and Telecommunications was separated into Department of Posts and
Department of Telecommunications. Till 1986, it was the only telecom
service provider in India. It played a role beyond service provider by
acting as a policy maker, planner, developer as well as an implementing
body. In spite of being profitable, non-corporate entity status ensured
that it did not have to pay taxes. DoT depends on Government of India
for its expansion plans and funding.
1.2.1. Telecom Regulatory Authority of India (TRAI)
TRAI was founded to act as an independent regulatory body supervising
telecom development in India. This became important, as DoT was a
regulator and a player as well. Founded by an Act of Parliament, the
main functions of the body was to finalize toll rates and settle disputes
between players. An independent regulator is critical at the present
s i t u a t i o n a s t h e sector witness’s competition. The operations of this
sector are determined as under the Indian Telegraph Act of 1885 – A
document buried in the sands of time. The next major policy document,
which was produced, was the National Telecom Policy of 1994, a
consequence of the ongoing process of liberalization.
4
1.2.2. The Telecom Commission
The Telecom Commission was set up by the government of India vide
Notification dated April 11, 1989 with administrative and financial
powers of the government of India to deal with various
aspects of Telecommunications. The Telecom Commission and the DoT
are responsible for policy formulation, licensing, wireless spectrum
management, administrative monitoring of PSUs, research and
development and standardization or validation of equipment, etc. The
multi-pronged strategies followed by the Telecom Commission have not
only transformed the very structure of this sector, but also have
motivated all the partners to contribute in accelerating the growth of the
sector. The other entities in the sector under the control of MoC
are the two public sector telecom equipment manufacturers, namely
Indian Telephone Industries (ITI) and Hindustan Tele printers Ltd.
(HTL). Both these companies are facing financial problems because of
product obsolescence, poor management and over staffing.
Telecommunications Consultants India Ltd. (TCIL), another PSU was
founded in 1978 to undertake consultancy services in the field of
telecom.
5
1.2.3. Private Participation in Telecom
For the provision of basic services, the entire country was divided into 21
telecom circles, excluding Delhi and Mumbai (Singh et. al. 1999). with
telecom markets opened to competition, DoT and MTNL were joined by
private operators but not in all parts of the country. By mid-2001, all
six of the private operators in the basic segment had started operating.
The number of village public telephones issued by private licensees
by 2002.After a recent licensing exercise in 02, there competition in
most service areas. However, the market is still dominated by the
i n c u m b e n t . In December 2002, the private sector provided
approximately 10 million telephones in fixed, WLL (Wireless Local
Loop) and cellular lines compared to 0.88 million cellular lines in March
1998 DoT Annual Report, (2002). 72 per cent of the total private
investment in telecom has been in cellular mobile services followed
by 22 percent in basic services. After the recent changes, the stage is
now set for greater competition in most service areas for cellular
mobile over time; the rise in coverage of cellular mobile will imply
increased competition even for the basic service market because of
competition among basic and cellular mobile services.
6
1.2.4. Tele density and Village Public Phones (VPTS)
India's rapid population increase coupled with its progress in telecom
provision has landed India's telephone network in the sixth position in the
world and second in Asia (ITU). The much publicized statistic
about telecom development in India is that in the last five years, the
lines added for basic services is 1.5 times those added in the last five
decades! The annual growth rate for basic services has been 22 percent
and over 100 percent for internet and cellular services. As Dossani
(2002) argues, the comparison of teledensity of India with other regions
of the world should be made keeping in mind the affordability issues.
Assuming households have a per capita income of $350 and are willing
to spend 7 percent of that total income on communications, then only
about 1.6 percent of households will be able to afford $30 (for a $1000
investment per line). Teledensity has risen to 4.9 phones per 100 persons
in India compared to the average 7.3 mainlines per 100 people around the
world. The government has made efforts to connect villages through
village public telephones (VPT) and Direct Exchange Lines (DEL).
This coverage increased from 4.6 lakhs in March 2002 to 5.10 lakhs
in December 2002 for VPT and from 90.1 lakhs in March to 106.6 lakhs
in December 2002 for DELs. BSNL has been mainly responsible for
providing VPTs; more than 84 percent of the villages were connected by
7
503610 VPTs with private sector also providing 7123 VPTs. The overall
telecom growth rate is likely to be high for some years, given the increase
in demand as income levels rise and as the share of services in overall
GDP increases. The growth rate will be even higher due to the price
decrease resulting from a reduction in cost of providing telecom services.
A noteworthy feature of the growth rate is the rapid rate at which
the subscriber base for cellular mobile has increased in the last few years
of the 1990s, which is not surprising in view of the relatively lower
subscriber base for cellular mobile.
1.2.5. Foreign Participation
India has opened its telecom sector to foreign investors up to 100 percent
holding in manufacturing of telecom equipment, internet services, and
infrastructure providers (e-mail and voice mail), 74 percent in radio-
paging services, internet (international gateways) and 49 percent in
national long distance, basic telephone, cellular mobile, and other value
added services (FICCI, 2003). Since 1991, foreign direct investment
(FDI) in the telecom sector is second only to power and oil - 858 FDI
proposals were received during 1991-2002 totaling Rs. 56,279 crores
(DoT Annual Report, 2002). Foreign investors have been active
participants in telecom reforms even though there was some
frustration due to initial dithering by the government. Until now, most of
8
the FDI has come in the cellular mobile sector partly due to the fact that
there have been more cellular mobile operators than fixed service
operators. For instance, during the period 1991-2001, about 44 percent of
the FDI was in cellular mobile and about 8 percent in basic service
segment. This total FDI includes the categories of manufacturing and
consultancy and holding companies.
1.2.6. Tariff-Setting
An essential ingredient of the transition from a protected market to
competition is the alignment of tariffs to cost-recovery prices. In basic
telecom for example, pricing of the kind that prevailed in I n d i a
p r i o r t o the reforms, led to a high degree of cross-subsidization and
introduced inefficient decision-making by both consumers and service-
providers. Traditionally, DoT tariffs cross-subsidized the costs of access
(as reflected by rentals) with domestic and international long distance
usage charges (Singh et. al. 1999). Therefore, re-balancing of tariffs
- reducing tariffs that are above costs and increasing those below costs -
was an essential pre- condition to promoting competition among g
different service providers and efficiency in general. TRAI issued its first
directive regarding tariff-setting following NTP 99 aimed at re-balancing
tariffs and to user in an era of competitive service provision.
Subsequently, it conducted periodic reviews and made changes in the
9
tariff levels, if necessary. Re-balancing led to a reduction in cross-
subsidization in the fixed service sector. Cost based pricing, a major
departure from the pre-reform scenario, also provides a basis for
making subsidies more transparent and better targeted to specific
social objectives.
1.3. Service Quality in Indian Telecom Sector
One of the main reasons for encouraging private participation in the
provision of infrastructure rests on its ability to provide superior quality
of service. In India, as in many developing countries, low teledensity
resulted in great emphasis being laid on rapid expansion often at the
cost of quality of service. One of the benefits expected from the private
sector's entry into telecom is an improvement in the quality of
service to international standards. Armed with financial and technical
resources, and greater incentive to make profits, private operators are
expected to provide consumers value for their money. Telephone faults
per 100 main lines came down to 10.32 and 19.14 in Mumbai and Delhi
respectively in 2002-03 compared to 11.72 and 26.6 in 1997-98. Quality
of service was identified as an important reform agenda and TRAI has
devised QOS (Quality of Service) norms that are applicable across the
board to all operators (Singh et. al. 99).
10
1.4. Performance of Indian Telecom Sector Post Liberalized Period
National Telecom Policy (1999) projected a target 75 million telephone lines
by the year 2005 and 175 million telephone lines by 2010 has been set.
Indian telecom sector has already achieved 100 million lines. With over 100
million telephone connections and an annual turnover of Rs. 61,000 crores,
our present teledensity is around 9.1%. The growth of Indian telecom
network has been over 30% consistently during last 5 years.
According to Wellenius and Stern (2001) information is regarded today as a
fundamental factor of production, alongside capital and labor. The
information economy accounted for one-third to one-half of gross domestic
product (GDP) and of employment in Organization for Economic
Cooperation and Development (OECD) countries in the 1980s and is
expected to reach 60 percent for the European Community in the year 2000.
Information also accounts for a substantial proportion of GDP in the newly
industrialized economies and the modern sectors of developing countries.
Videsh Sanchar Nigam Limited (VSNL) 16th Annual Report (2002) India
like many other countries has adopted a gradual approach to telecom sector
reform through selective privatization and managed competition in different
segments of the telecom sector. India introduced private competition in
value-added services in 1992 followed by opening up of cellular and basic
services for local area to competition. Competition was also introduced in
11
National Long Distance (NLD) and International Long Distance (ILD) at the
start of the current decade.
World Telecommunication Development Report (2002) explains that
network expression in India was accompanied by an increase in productivity
of telecom staff measured in terms of ratio of number of main lines in
operation to total number of staff.
Indian Telecommunication Statistics (2002) in its study showed the long run
trend in supply and demand of Direct Exchange Lines (DEL). Potential
demand for telecom services is much more than its supply. In eventful
decade of sect oral reforms, there has been significant growth in supply of
DEL.
Economic Survey, Government of India (2002-2003) has mentioned two
very important goals of telecom sector as delivering low-cost telephony to
the largest number of individuals and delivering low cost high speed
computer networking to the largest number of firms. The number of phone
lines per 100 persons of the population which is called teledensity, has
improved rapidly from 43.6 in March 2001 to 4.9 in December 2002.
Adam Braff, Passmore and Simpson (2003) focus those telecom service
providers even in United States face a sea of troubles. The outlook for US
wireless carriers is challenging. They can no longer grow by acquiring new
12
customers; in fact, their new customers are likely to be migrated from other
carriers. Indeed, churning will account for as much as 80% of new
customers in 2005. At the same time, the carrier’s Average Revenue per
User (ARPU) is falling because customers have.
Dutt and Sundram (2004) studied that in order to boost communication for
business, new modes of communication are now being introduced in various
cities of the country. Cellular Mobile Phones, Radio Paging, E-mail, Voice-
mail, Video, Text and Video-Conferencing now operational in many cities,
are a boon to business and industry. Value- added hi-tech services, access to
Internet and Introduction of Integrated Service Digital Network are being
introduced in various places in the country.
T.V. Ramachandran (2005) analysed performance of Indian Telecom
Industry which is based on volumes rather than margins. The Indian
consumer is extremely price sensitive. Various socio-demographic factors-
high GDP growth, rising income levels, booming knowledge sector and
growing urbanization have contributed towards tremendous growth of this
sector. The instrument that will tie these things together and deliver the
mobile revolution to the masses will be 3 Generation (3G) services.
Rajan Bharti Mittal (2005) explains the paradigm shift in the way people
communicate. There are over 1.5 billion mobile phone users in the world
today, more than three times the number of PCOs. India today has the sixth
13
largest telecom network in the world up from 14th in 1995, and second
largest among the emerging economies. It is also the world’s 12th biggest
market with a large pie of $ 6.4 billion. The telecom revolution is propelling
the growth of India as an economic powerhouse while bridging the
developed and the developing economics.
ASEAN India Synergy Sectors (2005) point out that high quality of
telecommunication infrastructure is the pillar of growth for information
technology (IT) and IT enabled services. Keeping this in view, the focus of
telecom policy is vision of world class telecommunication services at
reasonable rates. Provision of telecom services in rural areas would be
another thrust area to attain the goal of accelerated economic development
and social change. Convergence of services is a major new emerging area.
Aisha Khan and Ruche Chaturvedi (2005) explain that as the competition in
telecom area intensified, service providers took new initiatives to customers.
Prominent among them were celebrity endorsements, loyalty rewards,
discount coupons, business solutions and talk time schemes. The most
important consumer segments in the cellular market were the youth segment
and business class segment. The youth segment at the inaugural session of
cellular summit, 2005, the Union Minister for Communications and
Information Technology, Dayanidhi Maran had proudly stated that Indian
telecom had reached the landmark of 100 million telecom subscribers of
14
which 50% were mobile phone users. Whereas in African countries like
Togo and Cape Verde have a coverage of 90% while India manages a
merely mobile coverage of 20 per cent.
In overview in Indian infrastructure Report (2005) explains India’s rapidly
expanding telecom sector is continuing to witness stiff competition. This has
resulted in lower tariffs and better quality of services. Various telecom
services-basic, mobile, internet, national long distance and international long
distance have seen tremendous growth in year 2005 and this growth trend
promises to continue electronics and home appliances businesses each of
which are expected to be $ 2.5 bn in revenues by that year. So, driving
forces for manufacturing of handsets by giants in India include-sheer size of
India market, its frantic growth rates and above all the fact that its conforms
in global standards.
Marine and Blanchard (2005) identifies the reasons for the unexpected boom
in mobile networks. According to them, cell phones, based on Global
System for Mobile Communication (GSM) standard require less investment
as compared to fixed lines. Besides this, a wireless infrastructure has more
mobility, sharing of usage, rapid profitability. Besides this, usage of prepaid
cards is the extent of 90% simplifies management of customer base.
Moreover, it is suitable to people’s way of life-rural, urban, and sub-urban
subscribers.
15
According to Oliver Stehmann (2005) the telecommunications industry is
characterized by rapid innovation in the service and the transmission market.
The legally protected public or private monopolist does not have the same
incentive to foster innovation that would exist in a competitive environment.
Thus, state intervention based on the natural monopoly argument neglects
dynamic aspects, which are crucial in the telecommunications sector.
According Economic Times (2005) Indian mobile phone market is set to
surge ahead since urban India has a teledensity of 30 whereas rural India has
a teledensity of 1.74. It indicates that the market is on ascent, with more than
85000 villages yet is come under teleconnectivity.
According to a paper released by the Associated Chambers of commerce
and Industry of India (2005), it is stated that 30% of the new mobile
subscribers added by the operators worldwide will come from India by
2009.10% of the third generation (3G) subscribers will be from India by
2011, Indian handset segment could be between US $ 13 billion and US $
15 billion by 2016.It offers a great opportunity for equipment vendors to
make India a manufacturing hub. Indian infrastructure capital expenditure
on cellular equipment will be between 10 to 20% of the investment that will
be made by international operators by 2015. The other proposals included
setting up of hardware manufacturing cluster parks, conforming to global
standards and fiscal incentives for telecom manufacturing among others.
16
Virat Bahri (2006) explains the viewpoint of Sam Pitroda the Chairman of
Worldtel that identifies opportunities for investments in
telecommunications. He analyses that there is an increasing role for telecom
in e-governance in India. According to him, technology can be leveraged to
take India’s development to next level.
According to Rohit Prasad & V.Sridhar (2007) this is one of the first such
attempts to analyse the tradeoffs between low market power and economics
of scale for sustained growth of mobile services in the country. Our analysis
of the data on mobile services in India indicates the existence of economies
of scale in this sector. We also calculate the upper bound on the optimal
number of operators in each license service area so that policies that make
appropriate tradeoffs between competition and efficiency can be formulated.
Narinder K Chhiber ( 2008) the mobile telecommunication technology is
evolving rapidly in the world as more people demand mobile services with
longer bandwidth and new innovative services like connectivity anywhere,
anytime for feature like T.V., Multimedia, Interoperability and seamless
connectivity with all types of protocols and standards, while the 3G services
are yet to fully come up.
17
1.5. Background for the Study
Within the last two decades, service quality has become a main concern in
the business world especially in services sector. The key to success in
winning the global battle now and in future is to have high standards of
service. Hence, it is helpful for service organizations to know the customer
service quality perceptions in order to overcome the competitors and attract
and retain the customers. Because of the globalization and liberalization of
Indian economy, Indian service sector has been opened for Multinational
companies. In order to overcome the competition and to retain the world
class service standards, Indian companies have been forced to adopt quality
management programs.
Services are defined as: the activities, which are involved in producing
intangible products as education, entertainment, food and lodging,
transportation, insurance, trade, government, financial, real estate, medical,
consultancy, repair and maintenance like occupation.
Quality has become a strategic tool in obtaining efficiency in operations and
improved performance in business. This is true for both the goods and
services sectors. Quality has been defined differently by various authors.
Some prominent definitions include ‘conformance to requirements’ (Crosby,
1990), ‘fitness for use’ or ‘one that satisfies the customer’. According to
production philosophy of Japan, quality has been defined as ‘zero defects’ in
18
the firm’s offerings. Quality has become a strategic tool for obtaining
efficiency in operations and improved business performance (Babakus and
Boller, 1992).
This is true for the services sector too. Several authors have discussed the
unique importance of quality to service firms and have demonstrated its
positive relationship with profits, increased market share, return on
investment, customer satisfaction, and future purchase intentions (Rust and
Oliver, 1994). One obvious conclusion of these studies is that firms with
superior quality products outperform those marketing inferior quality
products.
In services marketing literature, service quality has been concisely defined
as the overall assessment of a service by the customers. Service quality is
playing an increasingly important role in the present environment where
there is no further scope for the companies to differentiate themselves other
than the quality of the service provided by them. Delivering superior service
quality than the competitors is the key for the success of any organization.
But, the companies face difficulties in measuring the quality of services
offered to the customers.
Because unlike measuring the quality of goods, the measurement of the
quality of services offered by the companies is difficult due to the three
unique features of services viz. intangibility, heterogeneity, and
19
inseparability. Hence the only way of measuring the quality of services
offered by the service provider is the measurement of the customers’
perceptions of the quality of service they are experiencing from their service
providers.
Though initial efforts in defining and measuring service quality emanated
largely from the goods sector, a solid foundation for research work in the
area was laid down in the mid-eighties by Parasuraman, Zeithaml and Berry,
(1985). They were amongst the earliest researchers to emphatically point out
that the concept of quality prevalent in the goods sector is not extendable to
the services sector. Being inherently and essentially intangible,
heterogeneous, perishable and entailing simultaneity and inseparability of
production and consumption, services require a distinct framework for
quality explication and measurement.
As against the goods sector where tangible cues exist to enable consumers to
evaluate product quality, quality in the service context is explicated in terms
of parameters that largely come under the domain of ‘experience’ and
‘credence’ properties and are as such difficult to measure and evaluate
(Parasuraman, Zeithaml and Berry, 1985). One major contribution of
Parasuraman, Zeithaml and Berry (1988) was to provide a concise definition
of service quality. According to these authors, service quality means relating
the superiority of the service with the global judgement of a person about it
20
and explicated it as involving evaluations of the outcome (i.e., what the
customer actually receives from service) and process of service act (i.e., the
manner in which service is delivered).
In line with the propositions put forward by Gronroos (1984) and
Parasuraman, Zeithaml and Berry (1985, 1988) posited and operationalized
service quality as a difference between consumer expectations of ‘what they
want’ and their perceptions of ‘what they get.’ Based on this
conceptualization and operationalization, they proposed a service quality
measurement scale called ‘SERVQUAL’. Nerurkar (2000) analyzed the
SERVQUAL (a service quality measurement scale developed by
Parasuraman, Zeithaml, and Berry, 1985) dimensions in India and concluded
that service quality should form the basis for all customer retention
strategies.
With a large population, low telephone penetration levels, a considerable
rise in consumers’ income, and spending owing to strong economic growth,
India has emerged as an attractive business market in the world. In case of
India, the mobile telecommunication industry turned highly competitive
since the government deregulated this sector. This decision of regulation
opened the doors for private and foreign players to operate in the Indian
market. The growth of operators in the Indian market has accelerated rapidly
from one operator in public sector to fifteen operators in all over India.
21
Consequently, the competition among these telecommunication players in
India in obtaining and maintaining customers remains critical in spite of the
fact that the customers have been very selective now in determining their
choices based on the costs paid to receive the services and benefits obtained.
In order to attract new customers and to retain the existing customers,
mobile telecommunication service providers in Indian market are employing
a variety of ways such as providing customers with excellent services,
modern looking equipments, courteous, skilful, well trained personnel, and
supportive operative systems. Service providers expect that with excellent
service, customers will be satisfied and if satisfied, they will become loyal
customers for the organization.
The significant growth of service providers in the field of mobile
telecommunication sector has caused the appearance of buyer’s market.
Buyer’s market is that type of market, where supply exceeds demand. In this
situation of buyer’s market, the customers get more bargaining power.
Therefore in this situation, the service providers have to be very effective
and efficient in their operations because customers now have choices in
determining the service provider they want. In the context of customers, the
need for excellent services always keeps on changing. With the passage of
time, the level of service quality also varies.
22
There is no guarantee that what is excellent service quality today is also
applicable for tomorrow or day after tomorrow. Besides this, in the last two
decades the use of technology in the delivery of services has also changed
significantly. The use of latest world class innovative technology in terms of
various value added services has also increased the war among service
providers. To win the battle of global competition in the service industries
and to be able to exist, these service providers will need to bring into play
new contemporary strategies in providing service that will satisfy the
continuous demanding customers. Because of this reason services marketing
and telecommunication marketing gaining prominence in marketing
literature (Kotler, 2001).
The interest in services marketing research on service quality and customer
satisfaction has grown tremendously. A good number of researches have
been conducted by applying related theories and methods in the service
industry. SERVQUAL and SERVPERF (an unweighted performance only
measure of service quality developed by Cronin and Taylor, 1992)
frameworks have been tested by various researchers in different service
setups to get reliability and validity, and also to suggest the superiority of
one scale over other. Many researchers from all over the world tried to
develop different scales to measure service quality and customer satisfaction
in different service environments.
23
Still there are continuing demands for refining the existing theories that are
suitable for multifaceted service setup. One way for refining the theories is
to consider variables within the existing model which are potentially
powerful in making prediction about the dependent variable. As a stepping
stone to this notion of refining the theories, Cronin, Brady, and Hult (2000)
conducted an empirical study to assess the effects of service quality, value,
and customer satisfaction on behavioural intentions in the context of
different service industries. They suggested in their findings that there is
need to include additional decision-making variables like tangibility aspect
of service quality, customers’ expectations and quality of service
environment. Also, suggested replication of similar study in another service
setting.
Caruana (2002) attempted to examine the model in which service quality is
linked to service loyalty via customer satisfaction. After examining this
model, he suggested the need to consider the role of customer value and
reputation of the company in predicting loyalty. The present study will try to
address the doubts raised by the researchers like Cronin, Brady, and Hult
(2000), Caruana (2002) etc.
The telecommunications sector in India was liberalized in the early 1990s.
Attack of private as well as foreign direct investment in the sector started
afterwards. With taut margins and ephemeral customer loyalty, the mobile
24
phone service providers are now operating in a highly competitive
environment. Profitability of the service providers is being curbed by factors
like; revenue leakage, customer churn, and ineffective customer service. The
Indian mobile telecommunication services operators are facing a number of
significant challenges, because of changing dynamics:
First, retaining existing customers mainly in a pre-paid and high
churn market has become more difficult and costly.
Second, new customer acquisition is becoming more elusive than ever
as potential customers have more options to choose from and mobile
phone operators offer attractive deals to lure prospect customers.
Third, as mobile phone operators have had to incur additional cost in
keeping existing customers and acquiring new ones, their
AverageRevenue Per User (ARPU) has declined, leading to
worsening of their financial performance.
In light of above mentioned challenges, mobile telecommunication services
providers need to make customer satisfaction a strategic priority. Moreover,
satisfied customers have a higher propensity to stay with their existing
service provider than the less satisfied ones (Cronin et al., 2000) and are
more likely to recommend the service provider to others, leading to
improved bottom line for the company. Thus, it is very important that Indian
mobile telecommunication services operators gain a better understanding of
25
the relationship between the performance of service quality attributes,
customer value, satisfaction, and loyalty.
1.6. Statement of the Problem
In the last ten years, the mobile revolution has truly change the socio
economic landscape of India and played a pivotal role in the growth and
development of economy. According to cellular operator Association of
India (COAI) states that India ranks between the top ten telecommunication
in the world and second largest in Asia. India is also one of the fastest
growing markets in mobile communications. India is home to a number of
Global mobile operators’ working with local companies and mobile market
has consistently experienced very high annual growth rates.
The telecommunication sector, especially the mobile phone sector, in India
is one of the fastest growing business segments of the country which provide
a lot of value additional to the society with its service and creation of
employment opportunities. At present there are fifteen mobile phone
operators in the country – Bharati Airtel Limited (bharti) , Reliance
Moreover, SERVQUAL or SERVPERF, as very general instruments, are
inadequate to measure mobile service qualities in making satisfactory
service related decisions because the dimensions of service quality
depends on the type of service offered (Babakus & Boller, 1992). For
example, Wang and Lo (2002) employed a modified version of
SERVQUAL model to measure service quality of mobile phone operators
in China. They added network quality dimension to the model based on
focus group discussions and expert opinions. According to their findings
based on structural equation modeling, the most important service quality
dimensions in predicting customers‟ overall satisfaction was assurance,
followed by reliability and network quality. But they found no evidence to
70
support the influence of responsiveness and empathy on customer
satisfaction (Wang & Lo, 2002).
Similarly, Negi (2009) tried to modify SERVQUAL scale to best fit in the
context of mobile telecommunication market in Ethiopia. In a pilot study,
respondents were asked about additional service quality dimensions by
using open-ended questions. Three additional dimensions were derived
including network quality, compliant handling and service convenience.
According to regression analysis, network quality scored the highest in
predicting overall customer satisfaction followed by reliability, empathy
and assurance (Negi, 2009).
Some researches in mobile telecommunication industry extended the
traditional definition of service quality and incorporated aspects
particularly relevant to mobile services. For example, Eshghi et al. (2008)
used literature review to identify thirty two attributes relevant to mobile
telecommunication industry. Six factors were derived using factor analysis
including relational quality, competitiveness, reliability, reputation,
customer support and transmission quality. These factors were taken as
service quality dimensions. Based on regression analysis, competitiveness
and reliability had the greatest effect on customer satisfaction followed by
relational quality and transmission quality. Also, a regression analysis
was done to identify most important service quality dimensions in
71
predicting repurchase intension of customers. Results indicated that
relational quality and reliability are the most determinant factors in
customers‟ purchase decisions (Eshghi et al., 2008).
In another study on the perceptions of mobile phone operators‟ service
quality, Santouridis and Trivellas (2010) suggested that customers evaluate
service quality of their mobile phone operators based on quality of six
dimensions including network, value-added services, mobile devices,
customer service, pricing structure and billing system. This scale was
administered to two hundred five residential non-business mobile phone
users in Greece. Their findings show that customer service, pricing
structure and billing system are the service quality dimensions that have
the most significant positive effect on customer satisfaction, which in turn
have significant positive impact on customer loyalty (Santouridis &
Trivellas, 2010).
Moreover, Lu et al. (2009) developed a multidimensional and hierarchical
model to measure mobile service quality. They proposed that mobile
service quality was composed of three primary dimensions, which are
interaction quality, environment quality and outcome quality. Each primary
dimensions further included sub-dimensions. An instrument was
developed and empirically tested using data collected from four hundred
thirty eight mobile brokerage service users (Lu et al., 2009). Also
72
recently, Zhao et al. (2012) used this model to assess the effect of mobile
telecommunication service quality on customer satisfaction and the
continuance intention of mobile value-added services. Their findings
showed that all three dimensions of service quality have significant and
positive effect on customers‟ satisfaction and continuance intention (Zhao
et al., 2012). The review of literatures reveal that the service quality and
service loyalty are key factor for sustainable mobile communication
industry in global as well as India.
2.7. Conclusion
This chapter has covered a review of relevant literature regarding the
constructs of the proposed model. The chapter began with reviews of the
Empirical Studies of Service Quality, followed by Service Loyalty and with
Patients Satisfaction. In the next chapter deals with research designing data
gathering procedures and development of Hypothesis Model etc,.
Chapter III
Research
Methodology
73
CHAPTER – III
RESEARCH METHODOLOGY
3.1. Introduction
The purpose of this chapter is to address the methodology adopted in this
study. Items that will be addressed include the research design, population
and sample, instrumentation, reliability and validity of the instrumentation,
scoring techniques, data gathering procedures and the development of the
model for the measurement of Service Loyalty for mobile service providers.
3.2. Service Quality Measurement – Recent trends
Based on this perspective, Parasuraman et al. (1988, 1991) developed a scale
for measuring service quality, which is mostly popular as SERVQUAL. This
scale operationalizes service quality by calculating the difference between
expectations and perceptions, evaluating both in relation to the 22 items that
represent five service quality dimensions known as ‘tangibles’, ‘reliability’,
‘responsiveness’, ‘assurance’ and ‘empathy’. The SERVQUAL scale has
been tested and/or adapted in a great number of studies conducted in various
service settings, cultural contexts and geographic locations like the quality
of service offered by a hospital (Babakus and Mangold, 1992), a CPA firm
(Bojanic, 1991), a dental school patient clinic, business school placement
center, tire store, and acute care hospital (Carman, 1990), pest control, dry
cleaning, and fast food (Cronin and Taylor, 1992), banking (Cronin and
74
Taylor, 1992; Spreng and Singh, 1993; Sharma and Mehta, 2004) and
discount and departmental stores (Finn and Lamb, 1991; Teas, 1993;
Dabholkar et al., 1996, Mehta et al., 2000, Vazquez et al., 2001; Kim and
Byoungho 2002). All these studies do not support the factor structure
proposed by Parasuraman et al. (1988). The universality of the scale and its
dimensions has also been the subject of criticisms (Lapierre et al., 1996) and
it is suggested that they require customization to the specific service sector
in which they are applied (Vazquez et al., 2001). Senthilkumar.N and
Arulaj.A (2011) empirically studied the service quality and service
measurement through employability in education institutional in India.
These research studies are empirically studied for the sustainability of the
markets. The authors have developed a new approach for measurement
service quality in their home country consumer’s behaviours.
3.3. Reflective Research Formation Studies
The following table (table 3.1) conducted a comprehensive study to review
19 models of reflective research formations of service quality used till now
in different studies in order to measure the service quality in different
service environment. These studies showed that there is a significant
association between service quality and customer satisfaction.
75
Table 3.1: Reflective Formation Models and Contributors Sl.No Service Quality Model Author
1. Technical and Functional Quality Model Gro’nroos, 1984 2. GAP Model Parasurman et. al. 1985 3. Attribute Service Quality Model Haywood-Farmer, 1988 4. Synthesized Model of Service Quality Brogowiczet, al., 1990 5. Performance Only Model (SERVPERF) Cronin and Taylor, 1992 6. Ideal Value Model of Service Quality Mattsson, 1992 7. Evaluated Performance and Normed Quality
Model Teas 1993
8. IT Alignment Model Berkley and Gupta, 1994 9. Attribute and Overall Affect Model Dabholkar, 1996 10. Model of Perceived Service Quality and
Satisfaction Spreng and Mackoy 1996
11. PCP Attribute Model Philip and Hazlett 1997 12. Retail Service Quality and Perceived Value
Model Sweeney et al., 1997
13. Service Quality, Customer Value and Customer Satisfaction Model
Oh, 1999
14. Antecedents and Mediator Model Dabholkar, et.al 2000 15. Internal Service Quality Model Frost and Kumar, 2000 16. Internal Service Quality DEA Model Soteriouand Stavrinides,
2000 17. Internet banking model Broderick and
Vachirapornpuk, 2002 18. IT Based Model Zhu, et.al. 2002 19. Model of e service quality Santos, 2003
Source: See References The above table 3.1 shows the comprehensive study to review 19 models of
reflective research formations of service quality used till now in different
studies in order to measure the service quality in different service
environment. These studies showed that there is a significant association
between service quality and customer satisfactions for the sustainability of
market economy. The researcher has reviewed above stated models on
service quality before constructions of questionnaires and a developed
proposed conceptual model in this research.
76
Table 3.2: Literature review showed the reflective models on mobile telecommunication Industry
Sl.No Dimensions Researches 1) Net Work Quality Wang and Lo (2002); M. K. Kim et al.
(2004); H. S. Kim & Yoon (2004); Kassim (2006); Lim et al. (2006); Eshghi (2008); Ling & De Run (2009); Negi (2009); Pezeshki, Mousavi & Grant (2009); Santouridis & Trivellas (2010); Wong (2010);Gunjan et al. (2011); Gautam (2011); Liang, Ma & Qi (2012)
2) Value Added Services M. K. Kim et al. (2004); H. S. Kim & Yoon (2004); Lim et al. (2006); Santouridis & Trivellas (2010); Gunjan et al. (2011); Jahanzeb, Fatima & Khan (2011)
3) Pricing Plan M. K. Kim et al. (2004); Lim et al. (2006); Ling & De Run(2009); Santouridis & Trivellas (2010); Gunjan et al. (2011)
4) Employees Competency Eshghi et al. (2008); Krishnan & Kothari (2008); Jahanzeb et al. (2011)
5) Billing System Lim et al. (2006); Krishnan & Kothari (2008); Pezeshki et al. (2009); Santouridis & Trivellas (2010)
6) Customer Service H. S. Kim & Yoon (2004); M. K. Kim et al. (2004); Lim et al. (2006); Kassim (2006); Pezeshki et al. (2009); Negi (2009); Negi & Ketema (2010); Y. E. Kim & Lee (2010); Santouridis & Trivellas (2010); Gautam (2011); Gunjan et al. (2011); Jahanzeb et al. (2011); Khaligh, Miremadi & Aminilari (2012)
7) Convenience M. K. Kim et al. (2004); Ling & De Run (2009); Negi (2009); Liang et al. (2012)
Source: See Reference Literature review showed the reflective models on mobile
telecommunication industry, researchers used different models with several
technical and functional dimensions to measure service quality. However,
most of them agreed that perceptions of mobile operators “service quality
are of a multidimensional nature. In this study, based on literature review a
formative multidimensional model has been developed (Mobile -Qual) that
77
determines customers” perceived service quality in mobile
telecommunication industry in Tamil Nadu.
3.4. Formative Research Foundation Studies
The conducted research is basically a survey on the mediating effects of
service loyalty on mobile service providers in Tamil Nadu. For this research,
almost all districts capital, public and private hospitals were selected. Since
the research is constructed on the basis of formative research model. The
following table (table 3.2) shows the unique formative research models.
Table 3.3 : Formative Research Models and Contributors
Sl.No Model Authors 1) BEM- ESW (NW) Model, PROFIT-COST Model,
TEM-AFC Model, ESW (NW) – PROFIT Model, (Performance of Asset Finance Companies in Non-Banking Financial Sector in Tamil Nadu Model)
Arulraj.A and Thiyagarajan.G 2008
2) SQM-HEI Model (Service Quality Mediated Higher Education India Model)
Arulraj, A. and Senthilkumar, N 2009
3) HFSQ Model (Housing Finance Service Quality Model)
Arulraj, A. and Sureshkumar, V 2010
4) TNTOURQUAL Model (Tamil Nadu Tourism Service Quality Model)
Arulraj, A. and Prabaharan, B 2010
5) SF-Cost Model (Share Holders Funds Model) Arulraj, A and Sarangarajan, V 2010
6) SEM-CPD Model (Structural Equation Modeling Consumer Purchasing Decision Model)
Arulraj, A. and Parthiban, B 2010
7) FERTQUAL Model (Fertilizer Retail Service Quality Model)
Arulraj, A. and Sukumaran, A 2010
8) BANKQUAL Model (Banking Service Quality Model)
Arulraj, A. and Ananth, A 2011
9) INSURELOYAL Model (Life Insurance Loyalty Model)
Arulraj, A and Ramesh, R 2012
10) IMQUAL (Investment Management Service Quality Model)
Arulraj, A and Lourthuraj, S.A 2012
11) THL Model (Tamil Nadu Healthcare Loyalty Model)
Arulraj, A and Rethina Sivakumar, G 2012
12) RETAIL QUAL Model (Retailing Service Loyalty Model)
Arulraj,A and Thanga Prashath, R 2012
78
13) MGNREGP QUAL (Mahatma Gandhi National Rural Employment Guarantee Programme Model)
Arulraj.A and Sethuraman.M 2013
14) SHGs QUAL (Self Help Groups Quality Model) Arulraj.A and Santhanalakshmi.M 2013
15) NW – INCOME Model (Strategic Financial Performance of Public Banks in India Model)
Arulraj.A and Ilavenil.R 2013
Source: See Reference The researcher reviewed above stated formative research models, before
developing the proposed hypothetical model in the present research. From
the above empirical quality researches the researcher formulated the Mobile
QUAL (Mobile Service Providers Quality) Model examines the relative
importance of Fringe Benefit Services as a mediating factor for Service
Loyalty to Tamil Nadu, India. The Mobile QUAL Model includes the
measurement of sub dimensions of quality of mobile service providers as
follows: I. Service Network Communication (SNC): The distributions of
telecom services to appropriate individuals in done actively on time (SNC1),
Do personalized dealing are made in a frequent manner (SNC2), The
distribution of coverage network speed is good (SNC3), Service provide
without waiting of call services during business hours (SNC4), and Clarity
in communication network (SNC5); II. Technology Adoption (TA): The
company regularly updates newer technologies (advanced) available in the
market (TA1), New technologies like broadband 2G & 3G etc., (TA2),
Mobile phone makes you feel secure and where always in touch with our
dear ones (TA3), Do low cost handsets will be able to provide a secure
communication channel (TA4), Branded mobile phones allow you to conduct
79
communication on a secure basis (TA5), If mobile phone is lost it is easily
traced by company using new technology (TA6), The cost of adopting new
technologies is higher for old customers (TA7), Education would enhance
the proficiency in mobile phone technology (TA8) and Is the company
committed to training and educating the customers on the operation of
relevant technologies (TA9); III. Customer Care Services (CCS): A
service provider does not tell customers exactly when services will be
performed (CCS1), I don’t receive prompt service from customer service
staff (CCS2), Customer service staff are not always willing to help
customers (CCS3), Customer service staff are too busy to respond to
customer requests promptly (CCS4), I can trust customer service staff
(CCS5), I feel safe in your transactions with customer service staff (CCS6),
Customer service staff are polite (CCS7), Customer service staff get
adequate support form a service provider to do their jobs well (CCS8),
Company is customer friendly always (CCS9), Whether your feedback are
accepted and upgraded by telecom company (CCS10) and Individual care
and special attention is given for old customer (CCS11); IV. Fringe Benefit
Services (FBS): Rate Cuter Schemes (FBS1), Festival offer Schemes
(FBS2), Internet pocket facility (FBS3), Free SMS facility (FBS4), Free
MMS facility (FBS5), E-Recharge Facilities (FBS6) and Sharing of Amount
(Talk time) (FBS7); V. Service Quality (SQ): Overall Service Network
Communication (SQ1), Overall Technology Adoption (SQ2), Overall
80
Customer care Services (SQ3), Overall Fringe Benefit Services (SQ4) and
Overall Brand Switching Process & MNP (OP5); VI. Brand Switching
Attitude & MNP (BSA): For Network failure (BSA1), For call service
failure (BSA2), For message failure (BSA3), For technology failure (BSA4),
For tariff system (BSA5), Rate cutters and recharge (BSA6), For poor
customer care (BSA7), Mobile number Portability facility (BSA8) and
Promotional Calls & SMS disturbing me to change (BSA9) and VII. Service
Loyalty (SL): I will continue my existing service network in future (SL1), I
will suggest to my other family member (SL2), I will recommend to my
friends & colleagues (SL3) and Some time Introduction MNP induce me to
change the provider (SL4).
3.5. Research Design
The research employed a cross sectional methodological approach.
Methodology described as cross sectional “is one used to collect data on all
relevant variables at one time” (O’Sullivan and Rassel, 1999).This approach
is particularly useful for studies designed to collect information on attitudes
and behaviours of large geographically diverse populations (O’Sullivan and
Rassel, 1999).The survey design is regarded as the most appropriate
research design to measure the perceptions of the respondents in this study.
A survey is the most appropriate research design as it can enable the
researcher to collect information from a large population. The information
obtained from the sample can then be generalized to an entire population
81
(Kerlinger and Lee, 2000).Survey research is usually a qualitative method
that requires standardized information in order to define or describe
variables or to study the relationships between variables.
Surveys generally fall into one of two categories, descriptive or relational.
Descriptive surveys are designed to provide a snapshot of the current state of
affairs while relational surveys are designed to empirically examine
relationships among two or more constructs either in an exploratory or in a
confirmatory manner. The current study is a relational survey that seeks to
explore the relationship between the Service Network Communication
(SNC), Technology Adoption (TA), Customer Care Services (CCS), Service
& MNP (BSA) and (7)Service Loyalty (SL), Service Network
Communication (SNC) consists of Five Questions, Technology Adoption
(TA) consists of Nine Questions, Customer Care Services (CCS) consists of
Eleven Questions, Fringe Benefit Services (FBS) consists of Seven
Questions, Service Quality (SQ) consists of Five Questions, Brand
Switching Attitude & MNP (BSA) consists of Nine Questions, and Service
Loyalty (SL) consists of Four Questions. Finally in the Eleven Questions
pertaining to respondents demographic profile information was given. All
the dimensions were presented as statements on the questionnaire, with the
same rating scale used throughout and measured on a seven point, Likert-
type scale that varied from 1 highly dissatisfied to 7 highly satisfied and
Strongly Disagree to Strongly Agree. For conducting an empirical study,
data were collected from respondents in Cauvery Delta Districts in Tamil
83
Nadu. Assurance was given to the respondents that the information collected
from them will be kept confidential and will be used only for academic
research purposes. Data had been collected using the “Personal-Contact”
approach as suggested by Suresh chandar et al. (2002) whereby “Contact
Persons” (Patients) have been approached personally and the survey was
explained in detail. The final questionnaire together with a cover letter
handed over personally to the “Contact Persons”, who in turn distributed it
randomly to customers among the Mobile Service Provider’s.
A total of 750 nos. of questionnaire were circulated to Customer of the
Cauvery Delta Districts in Tamil Nadu of these 750 were collected. Out of
the questionnaires that were collected 36 were not usable due to insufficient
and/or incomplete data. As a result, a total of 714 valid questionnaires were
used for the analysis, leading to a response rate of 95.2 percentages. Hence,
the sample size for the analysis is 714.The following table (table 3.3) gives a
view of the sample size across the Cauvery Delta Districts in Tamil Nadu.
Table 3.4 : Sample Size across the Delta Districts of Tamilnadu
Districts Region
Thanjavur
Thiruvarur
Nagappattinam Total
South 50 50 50 150 East 50 50 50 150 Centre 50 50 50 150 West 50 50 50 150 North 50 50 50 150 Total 250 250 250 750
Source: Primary Data
The sampling procedure used for the study was stratified random sampling.
The stratification has been done based on the Delta Districts Thanjavur,
84
Thiruvarur, and Nagappatinam for the nature of region south, east, centre,
west and north while selecting the customer of Mobile Service Providers
from each category, non-probabilistic convenience and judgmental sampling
technique was used. However, within such District, the respondents were
selected by stratified random sampling. The data collected were analyzed for
the entire sample.
3.5.3. Respondent’s Characteristics The demographical characteristics of the sample of respondents are
presented in order to get a clear picture of the sample. Demographic
variables that were measured from the respondents were as follows:
1. Name 2. Age 3. Sex 4. Religion 5. Community 6. Education Qualification 7. Occupation 8. Annual Income in Rs. 9. Service Provider 10. Type service 11. How often have you use Mobile 12. Preferring the Provider 13. No of SIM Cards have 14. Reason why?
The following table (table 3.5) gives the breakup of the sample size across
the different demographic variables.
85
Table 3.5:The Sample Size Across The Difference Demographic Variables
S. No. Demographic Dimensions No. of
Respondents Percentage of Respondents
1) Sex Male 472 62.50 Female 278 37.50
Total 750 100 2) Age 18.yrs. to 27 yrs. 156 20.80
28.yrs. to 37 yrs. 216 28.80 38 yrs. to 48 yrs. 181 24.14 48 yrs. to 57 yrs. 102 13.60 58.yrs. to 67 yrs. 76 10.13 68 yrs and above. 19 02.53
Total 750 100 3) Religion Hindu 678 90.40
Muslim 27 03.60 Christian 45 06.00
Total 750 100 4) Community BC 202 26.93
MBC 85 11.33 SC 463 61.74
Total 750 100 5) Educational
Qualifications School Dropout 76 10.13 SSLC 124 16.53 HSC 80 10.67 Diploma 112 14.94 UG 177 23.60 PG 181 24.13
Total 750 100 6) Occupation Unemployed 124 16.53
Farmer 80 10.67 Private Employee 177 23.60 Government Employee 112 14.94 Business 76 10.13 Professional 80 10.67
Source: Annual Report in MoCIT (Year: 2011 – 2012) Figure 4.12: Trend Analysis plot of Public Sector Units Telecom network in India From
(2007-2011).
20112010200920082007
1300
1200
1100
1000
900
800
700
600
Year
PSU
Tele
com
Net
wor
k (i
n la
kh)
MAPE 4.03MAD 37.41MSD 1615.61
Accuracy Measures
ActualFits
Variable
Trend Analysis Plot of Public Sector Units Telecom network in IndiaLinear Trend ModelYt = 532.1 + 139*t
Trend analysis figure 4.12 reveals the trends in the Public Sector Units in
Telecom Network in India. The trend plot that shows the original data, and
the fitted trend line, the output also displays the fitted trend equation Yt =
532.1+139*t and three measures help to determine the accuracy of the fitted
values: 4.03, 37.41 and 1615.61. The Public Sector Units Telecom network
data show a general upward trend, though with an evident cyclic factor. The
113
trend model appears to fit well to the overall trend. The above chart shows
the amount of Public Sector Units in Telecom network in India (in lakh)
from 2007 - 2011.
Figure 4.13: Trend Analysis plot of Private Sector Units in Telecom network in India
From (2007-2011).
20112010200920082007
8000
7000
6000
5000
4000
3000
2000
1000
0
Year
Priv
ate
Tele
com
Net
wor
k (i
n la
kh)
MAPE 15MAD 422MSD 198235
Accuracy Measures
ActualFits
Variable
Trend Analysis Plot of Private Telecom Networks Linear Trend ModelYt = -690 + 1543*t
Trend analysis figure 4.13 reveals the trends in the Private Sector Units in
Telecom network in India. The trend plot that shows the original data, and
the fitted trend line, the output also displays the fitted trend equation Yt = -
690+1543*t and three measures help to determine the accuracy of the fitted
values: 15, 422 and 198235. The Private Sector Units Telecom network data
show a general upward trend, though with an evident cyclic factor. The
trend model appears to fit well to the overall trend. The above chart shows
114
the amount of Private Sector Units in Telecom network in India (in lakh)
from 2007 - 2011.
Figure 4.14: Trend Analysis plot of Total Telecom Networks in India From (2007-2011).
20112010200920082007
9000
8000
7000
6000
5000
4000
3000
2000
1000
Year
Tota
l Net
wor
ks (
in la
kh)
MAPE 12MAD 459MSD 235578
Accuracy Measures
ActualFits
Variable
Trend Analysis Plot of Total Network in Telecom sector in IndiaLinear Trend ModelYt = -158 + 1682*t
Trend analysis figure 4.14 reveals the trends in the Total Telecom network
in India. The trend plot that shows the original data, and the fitted trend line,
the output also displays the fitted trend equation Yt = -158+1682*t and three
measures help to determine the accuracy of the fitted values: 12, 459 and
235578. The Private Sector Units Telecom network data show a general
upward trend, though with an evident cyclic factor. The trend model appears
to fit well to the overall trend. The above chart shows the amount of Private
Sector Units in Telecom network in India (in lakh) from 2007 - 2011.
115
4.2.6. Trend Analysis in Fault Rate in Telecom Sector in India
Table 4.6: Fault Rate in Telecom Sector in India (2007-2011) Year New Delhi Unit Mumbai Unit 2007 7.20 11.38 2008 6.71 9.10 2009 7.71 7.25 2010 11.01 6.17 2011 6.58 8.04
Source: Annual Report in MoCIT (Year: 2011 – 2012)
Figure 4.15: Trend Analysis plot of Fault Rate in New Delhi unit in Telecom Sector in India From (2007-2011).
20112010200920082007
11
10
9
8
7
6
Year
New
Del
hi U
nit
MAPE 13.7827MAD 1.1448MSD 2.4807
Accuracy Measures
ActualFits
Variable
Trend Analysis Plot of Fault Rate in New Delhi unit in Telecom Sector in IndiaLinear Trend ModelYt = 6.92 + 0.306*t
Trend analysis figure 4.15 reveals the trends in the Fault rate New Delhi
Units in Telecom network in India. The trend plot that shows the original
data, and the fitted trend line, the output also displays the fitted trend
equation Yt = -6.92+0.306*t and three measures help to determine the
accuracy of the fitted values: 13.7827, 1.1448 and 2.4807. The Fault rates
New Delhi Units Telecom network data show a general upward trend,
though with an evident cyclic factor. The trend model appears to fit well to
116
the overall trend. The above chart shows the amount of Fault rate New Delhi
Units in Telecom network in India from 2007 - 2011.
Figure 4.16: Trend Analysis plot of Fault Rate in Mumbai unit in Telecom Sector in
India From (2007-2011).
20112010200920082007
12
11
10
9
8
7
6
Year
Mum
bai U
nit
MAPE 13.5570MAD 1.0576MSD 1.3119
Accuracy Measures
ActualFits
Variable
Trend Analysis Plot of Mumbai Unit in Telecom Sector in IndiaLinear Trend Model
Yt = 11.27 - 0.961000*t
Trend analysis figure 4.16 reveals the trends in the Fault rate Mumbai Units
in Telecom network in India. The trend plot that shows the original data, and
the fitted trend line, the output also displays the fitted trend equation Yt =
11.27-0.961000*t and three measures help to determine the accuracy of the
fitted values: 13.5570, 1.0576 and 1.3119. The Fault rates Mumbai Units
Telecom network data show a general downward trend, though with an
evident cyclic factor. The trend model appears to fit well to the overall
trend. The above chart shows the amount of Fault rate Mumbai Units in
Telecom network in India from 2007 - 2011.
117
4.2.7. Trend analysis in Public Sector-Requirement in Telecom Sector in India
Table 4.7: Public Sector – Requirement in Telecom Sector in India (2007-2011) Year BSNL (in crore) MTNC (in crore) 2007 19203 1912.25 2008 20892 1513.98 2009 22497 1895.84 2010 24319 1429.73 2011 26143 8576.31
Source: Annual Report DoT Year (2011 – 2012)
Figure 4.17: Trend Analysis plot of BSNL- Fund Requirement in Telecom Sector in India From (2007-2011).
20112010200920082007
27000
26000
25000
24000
23000
22000
21000
20000
19000
Year
BSNL
(in
cro
re) MAPE 0.24
MAD 54.52MSD 4296.78
Accuracy Measures
ActualFits
Variable
Trend Analysis Plot of BSNL Requirement Fund in Telecom Sector in IndiaLinear Trend Model
Yt = 17418.7 + 1731*t
Trend analysis figure 4.17 reveals the trends in the BSNL-Fund
Requirement Telecom network in India. The trend plot that shows the
original data, and the fitted trend line, the output also displays the fitted
trend equation Yt = 17418.7+1731*t and three measures help to determine
the accuracy of the fitted values: 0.24, 54.52 and 4296.78. The BSNL-Fund
Requirement Telecom network data show a general upward trend, though
118
with an evident cyclic factor. The trend model appears to fit well to the
overall trend. The above chart shows the amount of BSNL-Fund
Requirement in Telecom network in India (in crore) from 2007 - 2011.
Figure 4.18: Trend Analysis plot of MTNC- Fund Requirement in Telecom Sector in India From (2007-2011).
20112010200920082007
9000
8000
7000
6000
5000
4000
3000
2000
1000
0
Year
MTN
C (i
n cr
ore)
MAPE 79MAD 1743MSD 4122013
Accuracy Measures
ActualFits
Variable
Trend Analysis Plot of MTNC Reuirement in Telecom Sector in indiaLinear Trend ModelYt = -908 + 1324*t
Trend analysis figure 4.18 reveals the trends in the MTNC-Fund
Requirement Telecom network in India. The trend plot that shows the
original data, and the fitted trend line, the output also displays the fitted
trend equation Yt = -908+1324*t and three measures help to determine the
accuracy of the fitted values: 79, 1743 and 4122013. The MTNC-Fund
Requirement Telecom network data show a general upward trend, though
with an evident cyclic factor. The trend model appears to fit well to the
119
overall trend. The above chart shows the amount of MTNC-Fund
Requirement in Telecom network in India (in crore) from 2007 - 2011.
4.2.8. Managerial Implication for Trend Analysis
The Indian mobile services industry has been the fastest growing mobile
services market in the world, registering a CAGR of more than 50% in terms
of subscribers and 15% in terms of gross revenues over the past decade. The
industry is presently the second largest globally by subscriber base with the
total subscriber base of 913.5 million as on July 2012. The strong growth in
the industry can be attributed primarily to the country’s large population,
healthy economic growth, affordable handsets, and most importantly low
tariffs.
Increasing price competition and aggressive customer acquisitions by the
telecom operators (telcos) led to frequent migrations between plans/telcos
by the price-sensitive subscribers, leading to proliferation of inactive
connections. In such a scenario, ‘active subscribers’ is a more accurate
representation of the subscriber base in the country, and stands at 76% of the
total subscribers as on July 2012, translating into ‘active tele density’ of
57%.
The tower industry is awaiting clarity on reduction in the limit on foreign
direct investment (FDI) in the sector and the inclusion of Tower Company’s
120
within the purview of licensing. Currently, some telcos are even exploring
the possibility of divesting their equity stake in tower companies in order to
meet funding requirements.
Cellular mobile telephones subscribers in India increased from 77 thousand
in 1995 to 3.6 million in 2000. By March 2002, it has grown to 6.4 million.
Cellular subscribers in proportion to total number of telephone subscribers
(basic plus cellular) have increased from 0.6 percent in 1995 to 14.6 percent
in 2002. This is still lower than the average of 24.6 percent achieved by the
low-income countries in 2001. The corresponding ratio for lower middle-
income countries is 41.8 percent, 52.8 percent for upper middle-income
countries and 50.2 percent for high-income countries. India is yet to
experience mobile explosion of the scale other countries have seen. One
would expect a rapid growth in mobile telephony in coming decades. India
has also achieved significant quality up gradation of its network in the 90s.
Digital lines in proportion to total number of main telephone lines have
increased from 87 per cent in 1995 to 99.8 percent in 1999.
One notable break with the past is that with opening up of the developing
economies and widespread sectoral reforms, catching up process has
become faster. Developing countries with liberal policies have much better
opportunity to leapfrog than before. Mobile experience of the low-income
countries bears testimony to this process. India is a participant in this global
121
process. There is tremendous appetite to absorb new technology. At the
higher end of the market, India will mimic the most sophisticated telecom
technology of the world and face all types of uncertainties that are
associated with any new technology anywhere in the world. It will take time
for the market for new technologies to consolidate. ‘Market maturing’ will
be a continuous process at some of the segments of telecom sector. This
holds good even today.
4.3. The Regression “Mobile QUAL” Overall Model 4.3.1. Regression Model of the “Mobile QUAL” Mediated Structural Model
In hierarchical regression, the predictor variables are entered in sets of
variables according to a pre-determined order that may infer some causal or
potentially mediating relationships between the predictors and the dependent
variable (Francis, 2003). Such situations are frequently of interest in the
social sciences. The logic involved in hypothesizing mediating relationships
is that “The Independent Variable Influences the Mediator Which, In Turn,
Influences the Outcome” (Holmbeck, 1997). However, an important pre-
condition for examining mediated relationships is that the independent
variable is significantly associated with the dependent variable prior to
testing any model for mediating variables (Holmbeck, 1997). Of interest is
the extent to which the introduction of the hypothesized mediating variable
reduces the magnitude of any direct influence of the independent variable on
122
the dependent variable. Hence the researcher empirically tested the
hierarchical regression for the model conceptualized in the figure 4.19
within the AMOS 20.0 graphics environment.
Figure 4.19: Shows the AMOS Output with Regression Weights of “Mobile QUAL”
Mediated Model
The Regression analyses conducted, the parameter estimates are then viewed
within AMOS graphics and it displays the standardized parameter estimates.
The regression analysis revealed that the Fringe Benefit Services on the
various dimensions of Mediated Model Mobile Service Provider, Fringe
123
Benefit Services (FBS) influenced 0.11 of the Service Loyalty (SL),
followed by Service Quality (SQ) which explains 0.40 of the Fringe Benefit
Services (FBS) the R2 value of 0.11 is displayed above the box Service
Loyalty (SL) in the AMOS graphics output. The visual representation of
results suggest that the relationships between the dimensions of Mobile
Service Provider, procedure and formalities (Service Quality (SQ) => Fringe
Benefit Services (FBS) = 0.40) resulted significant impact on the mediated
factor Fringe Benefit Services (FBS). Service Network Communication
(SNC), Technology Adoption (TA), Customer Care Services (CCS), Service
Quality (SQ), and Brand Switching Attitude & MNP (BSA) are resulted
very limited influence on the Fringe Benefit Services (FBS). It shows that
the Customer perception towards the Technology Adoption (TA) and
Customer Care Services (CCS) towards outcome of Mobile Service Provider
in insignificant whereas the impact of the same is very high on mediating
variable.
4.3.2. Bayesian Estimation and Testing for Regression Model of “Mobile QUAL” Mediated Structural Equation Model
The research model is a SEM, while many management scientist are most
familiar with the estimation of these models using software that analyses
covariance matrix of the observed data (e.g. LISREL, AMOS, EQS), the
researcher adopt a Bayesian approach for estimation and inference in AMOS
20.0 environment (Senthilkumar. N and Arulraj. A, 2011; Arbuckle and
124
Wothke, 2006). Since, it offers numerous methodological and substantive
advantages over alternative approaches.
Table 4.8: Bayesian Convergence Distribution for “Mobile QUAL” Regression Model
Regression weights Mean S.E. S.D. C.S. Skewness Kurtosis Min Max Name
4.3.3. Posterior Diagnostic Plots of ‘Mobile QUAL’ Mediated Regression Model
To check the convergence of the Bayesian MCMC method the posterior
diagnostic plots are analysed. The following figure (figure 4.20 and 4.21)
shows the posterior frequency polygon of the distribution of the parameters
across the 99000 samples. The Bayesian MCMC diagnostic plots reveals
that for all the figures the normality is achieved, so the structural equation
model fit is accurately estimated.
Figure 4.20: Posterior frequency polygon distribution of the Mediating Factor
Service Loyalty (SL) and Fringe Benefit Services (FBS) regression weight (W11)
126
Figure 4.21: Posterior frequency histogram distribution of the Mediating Factor Service Loyalty (SL) and Fringe Benefit Services (FBS) regression weight (W11)
The trace plot also called as time-series plot shows the sampled values of a
parameter over time. This plot helps to judge how quickly the MCMC
procedure converges in distribution. The following figures (figure4.22)
show the trace plot of the mediated Mobile QUAL Model for the mediated
factor Fringe Benefit Services (FBS) to Service Loyalty (SL) dimension
across 99000 samples. If we mentally break up this plot into a few
horizontal sections, the trace within any section would not look much
different from the trace in any other section. This indicates that the
convergence in distribution takes place rapidly. Hence the mediated Mobile
QUAL MCMC procedure very quickly forgets its starting values.
127
Figure 4.22: Posterior frequency trace plot of the Mediating Factor Service Loyalty (SL) and Fringe Benefit Services (FBS) regression weight (W11)
To determine how long it takes for the correlations among the samples to die
down, autocorrelation plot which is the estimated correlation between the
sampled value at any iteration and the sampled value k iterations later for k
= 1, 2, 3,…. is analysed for the Mobile QUAL regression model. The figure
4.23 shows the correlation plot of the Mobile QUAL model for the mediated
factor Fringe Benefit Services (FBS) to Service Loyalty (SL) dimension
across 99000 samples. The figure exhibits that at lag 100 and beyond, the
correlation is effectively 0. This indicates that by 90 iterations, the MCMC
procedure has essentially forgotten its starting position. Forgetting the
starting position is equivalent to convergence in distribution. Hence it is
ensured that convergence in distribution was attained and that the analysed
samples are indeed samples from the true posterior distribution.
128
Figure 4.23: Posterior frequency autocorrelation plot of the Mediating Factor Service Loyalty (SL) and Fringe Benefit Services (FBS) regression weight (W11)
Even though marginal posterior distributions are very important, they do not
reveal relationships that may exist among the two parameters. The summary
table given in table 4.8 and the frequency polygons given in the figure 4.24
and figure 4.25 describe only the marginal posterior distributions of the
parameters. Hence to visualize the relationships among pairs of Parameters
in two-dimensional. The surface plots following figures (figure 4.24 and
figure 4.25) provides bivariate marginal posterior plots of the Mobile QUAL
model for the mediated factor Fringe Benefit Services (FBS) with other
dimensions across 99000 samples. From the two figures it is revealed that
the two dimensional surface plots also signifies the interrelationship
between the mediating variable Fringe Benefit Services (FBS) with the other
dimensions Service Loyalty (SL) and Service Network Communication
(SNC).
129
Figure 4.24: Two-dimensional surface plot of the marginal posterior distribution of the mediating factor Fringe Benefit Services (FBS) with SQ and SNC
Figure 4.25: Two-dimensional histogram plot of the marginal posterior distribution of the mediating factor Fringe Benefit Services (FBS) with SQ and
SNC
The following figure 4.26 displays the two-dimensional plot of the bivariate
posterior density across 99000 samples. Ranging from dark to light, the
three shades of gray represent 50%, 90% and 95% credible regions,
130
respectively. From the figure, it is revealed that the sample respondent’s
responses are normally distributed.
Figure 4.26: Two-dimensional contour plot of the marginal posterior distribution
of the mediating factor Fringe Benefit Services (FBS) with SQ and SNC
The various diagnostic plots featured from figure 4.20 to figure 4.26 of the
Bayesian estimation of convergence of MCMC algorithm confirms the fact
that the convergence takes place and the normality is attained. Hence
absolute fit of the Mobile QUAL regression model. From the Mobile QUAL
regression model which is empirically tested with mediating factor with the
dimensions Service Loyalty (SL) and Service Network Communication
(SNC) it is evident that the Mobile service provider should concentrate on
the Fringe Benefit Services (FBS) as the mandatory aspect of Mobile
Service Provider in Cauvery Delta Districts in Tamil Nadu.
131
4.3.4. Structural Equation Modeling of “Overall Mediated Mobile QUAL” Mediated Model
Since the Service loyalty in Overall Mediated Inclusive Model for Mobile
Service Provider is theoretical construct, researcher has defined its
dimension based on the setting used to explore the construct. If Mediated
“Overall Mediated Mobile QUAL” Model is to be applicable in the Indian
context, the dimensions and the sub dimensions on Mobile Service Provider
have to be reliable and valid in measuring Service Loyalty in Mobile Service
Provider. The model examines the relative importance of dimensions of
Service Loyalty (SL) and Fringe Benefit Services (FBS) in Mobile Service
Provider in Cauvery Delta Districts in Tamil Nadu.
The “Overall Mediated Mobile QUAL” Model examines the relative
importance of Fringe Benefit Services (FBS) as a mediating factor for
Service Loyalty to Cauvery Delta Districts in Tamil Nadu. “The Overall
Mediated Mobile QUAL” Mediated Model includes the measurement of sub
dimensions of Service Loyalty of Mobile Service Provider as follows:
I. Service Network Communication (SNC): The distributions of telecom
services to appropriate individuals in done actively on time (SNC1), Do
personalized dealing are made in a frequent manner (SNC2), The
distribution of coverage network speed is good (SNC3), Service provide
without waiting of call services during business hours (SNC4), and Clarity
in communication network (SNC5); II. Technology Adoption (TA): The
132
company regularly updates newer technologies (advanced) available in the
market (TA1), New technologies like broadband 2G & 3G etc., (TA2),
Mobile phone makes you feel secure and where always in touch with our
dear ones (TA3), Do low cost handsets will be able to provide a secure
communication channel (TA4), Branded mobile phones allow you to conduct
communication on a secure basis (TA5), If mobile phone is lost it is easily
traced by company using new technology (TA6), The cost of adopting new
technologies is higher for old customers (TA7), Education would enhance
the proficiency in mobile phone technology (TA8) and Is the company
committed to training and educating the customers on the operation of
relevant technologies (TA9); III. Customer Care Services (CCS): A
service provider does not tell customers exactly when services will be
performed (CCS1), I don’t receive prompt service from customer service
staff (CCS2), Customer service staff are not always willing to help
customers (CCS3), Customer service staff are too busy to respond to
customer requests promptly (CCS4), I can trust customer service staff
(CCS5), I feel safe in your transactions with customer service staff (CCS6),
Customer service staff are polite (CCS7), Customer service staff get
adequate support form a service provider to do their jobs well (CCS8),
Company is customer friendly always (CCS9), Whether your feedback are
accepted and upgraded by telecom company (CCS10) and Individual care
and special attention is given for old customer (CCS11); IV. Fringe Benefit
133
Services (FBS): Rate Cuter Schemes (FBS1), Festival offer Schemes
(FBS2), Internet pocket facility (FBS3), Free SMS facility (FBS4), Free
MMS facility (FBS5), E-Recharge Facilities (FBS6) and Sharing of Amount
(Talk time) (FBS7); V. Service Quality (SQ): Overall Service Network
Communication (SQ1), Overall Technology Adoption (SQ2), Overall
Customer care Services (SQ3), Overall Fringe Benefit Services (SQ4) and
Overall Brand Switching Process & MNP (OP5); VI. Brand Switching
Attitude & MNP (BSA): For Network failure (BSA1), For call service
failure (BSA2), For message failure (BSA3), For technology failure (BSA4),
For tariff system (BSA5), Rate cutters and recharge (BSA6), For poor
customer care (BSA7), Mobile number Portability facility (BSA8) and
Promotional Calls & SMS disturbing me to change (BSA9) and VII. Service
Loyalty (SL): I will continue my existing service network in future (SL1), I
will suggest to my other family member (SL2), I will recommend to my
friends & colleagues (SL3) and Some time Introduction MNP induce me to
change the provider (SL4).
After identifying a potential model that best explains the data in terms of
theory and model fit, a Confirmatory Factor Analysis (CFA) using
Structural Equation Modeling (SEM) was used to test the invariance of the
factorial model. All tests of model invariance begin with a global test of the
equality of covariance structures across groups (Joreskog, 1971). The data
for all groups were analysed simultaneously to obtain efficient estimates
134
(Bentler, 1995). The constraints used include, from weaker to stronger: (1)
Model Structure, (2) Model Structure and Factor Loadings, and (3) Model
Structure, Factor Loadings, and Unique Variance.
4.3.4.1. Evaluation of Model Fit
According to the usual procedures, the goodness of fit is assessed by
checking the statistical and substantive validity of estimates, the
convergence of the estimation procedure, the empirical identification of the
model, the statistical significance of the parameters, and the goodness of fit
to the covariance matrix (Senthilkumar.N and Arulraj.A, 2011). The root
mean squared error of approximation (RMSEA) is selected as such a
measure. Values equal to 0.05 or lower are generally considered to be
acceptable (Browne and Cudeck, 1993). The sampling distribution for the
RMSEA can be derived, which makes it possible to compute confidence
intervals. These intervals allow researchers to test for close fit and not only
for exact fit, as the X2 does. If both extremes of the confidence interval are
below 0.05, then the hypothesis of close fit is rejected in favor of the
hypothesis of better than close fit. If both extremes of the confidence
interval are above 0.05, then the hypothesis of close fit is rejected in favor of
the hypothesis of bad fit (Senthilkumar. N and Arulraj. A, 2011). Several
well-known goodness-of-fit indices (GFI) were used to evaluate model fit:
the chi-square X2, the comparative fit index, the unadjusted GFI, the normal
fit index
standardiz
Figure
(NFI), th
zed root m
e 4.27: ShowMediat
he Tucker
mean square
ws AMOS ted Mobile
135
r-Lewis i
e error resi
path diagrQUAL’ St
5
ndex (TL
idual.
am output tructural E
LI), the R
for the ovequation M
RMSEA a
erall ‘Overodel
and the
All
136
Figure 4.27 shows Amos’s path diagram output for the Over All Mediated
Mobile QUAL Structural Equation model., You can see that the, Service
Network Communication (SNC) consists of sub dimensions, Technology
Adoption (TA) consists of Nine sub dimensions, Customer Care Services
(CCS) consists of Eleven sub dimensions, Fringe Benefit Services (FBS)
consists of Seven sub dimensions, Service Quality (SQ) consists of Five sub
dimensions, Brand Switching Attitude & MNP (BSA) consists of Nine sub
dimensions, and Service Loyalty (SL) consists of Four sub dimensions. The
RMSEA fit statistics for the model was 0.05, which was considered as a best
fit model (Brown and Cudeck, 1993; Diamantopoulos and Siguaw, 2000).
The path diagram shows the Fringe Benefit Services (FBS) is the mediating
factor for Service Loyalty. The regression co-efficient 0.31 signifies the
impact of mediating factor Fringe Benefit Services (FBS) on the other
Dimensions towards Service Loyalty of the Mobile Service Provider.
4.3.5. Evaluation of Over All Mediated Mobile QUAL Mediated Model
The following table 4.9 gives the summary of the various goodness-of-fit
statistics and other values corresponding to the Over All Mediated Mobile
QUAL Mediated Structural Equation Model. Also the last column in the
table provides the acceptable level for the various goodness-of-fit statistics
and other values.
137
Table.4.9: Summary of the Various Goodness of Fit Statistics and Other Values Corresponding To the Over All Mediated Mobile QUAL Mediated Structural
Equation Model
S.No. Measures of fit Over All Mediated
Mobile QUAL
Acceptable level for good fit
1. Chi-square (x2) at p 0.01 2677.017 Significant 2. Degree of freedom (d.f) 1159 Accepted 3. Comparative Fit Index (CFI) .801 >0.90 4. Bentler – Bonett Indes or Normed Fit
Index (NFI) .699 >0.90
5. Root Mean Squared error of Approximation (RMSEA)
.043 <0.05
Accepted 6. Non Centrality Parameter (NCP) 1518.017 Accepted 7. Non Centrality Parameter, Lower
Boundary (NCPLO 90) 1371.144 Accepted
8. Non Centrality Parameter, Upper Boundary (NCPHI 90)
1672.555 Accepted
9. Parsimony adjusted NFI (PNFI) .635 Accepted 10. Parsimony adjusted CFI (PCFI) .728 Accepted 11. Minimum value of Discrepancy
The table 4.10 shows the Bayesian convergence distribution of the “Over
All Mediated Mobile QUAL” Regression Model. In this research the
researcher has adopted for the procedure of assessing convergence of
MCMC algorithm of maximum likelihood. To estimate the MCMC
convergence the researcher has adopted two methods namely, convergence
in distribution, convergence of posterior summaries. The values of posterior
mean accurately estimate the Over All Mediated Mobile QUAL SEM
model. From the above table the highest value of Convergence Statistics
(C.S) is 1.001 which is less than the 1.002 conservative measures (Gelman
et al. 2004).
4.3.7. Posterior Diagnostic Plots of “Over All Mediated Mobile QUAL” Model
To check the convergence of the Bayesian MCMC method the posterior
diagnostic plots are analysed. The following figures (figure to 4.28 and 4.29)
142
show the posterior frequency polygon of the distribution of the parameters
across the 69000 samples. The Bayesian MCMC diagnostic plots reveals
that for all the figures the normality is achieved, so the structural equation
model fit is accurately estimated.
Figure 4.28: Posterior frequency polygon distribution of the mediating factor
Fringe Benefit Services (FBS) and Service Loyalty (SL) (W49)
Figure 4.29: Posterior frequency histogram distribution of the mediating factor Fringe Benefit Services (FBS) and Service Loyalty (SL) (W49)
The trace plot also called as time-series plot shows the sampled values of a
parameter over time. This plot helps to judge how quickly the MCMC
Fre
quen
cyF
requ
ency
143
procedure converges in distribution. The following figure (figure 4.30)
shows the trace plot of the Over All Mediated Mobile QUAL for the
mediated factor Fringe Benefit Services with Service Loyalty dimension
across 69000 samples. If we mentally break up this plot into a few
horizontal sections, the trace within any section would not look much
different from the trace in any other section. This indicates that the
convergence in distribution takes place rapidly. Hence the Over All
Mediated Mobile QUAL MCMC procedure very quickly forgets its starting
values.
Figure 4.30: Posterior trace plot of the Over All Mediated Mobile QUAL s for
the mediated factor Fringe Benefit Services (FBS) and Service Loyalty (SL) (W49)
To determine how long it takes for the correlations among the samples to die
down, autocorrelation plot which is the estimated correlation between the
sampled value at any iteration and the sampled value k iterations later for k
= 1, 2, 3,…. is analysed for the Over All Mediated Mobile QUAL
144
regression model. The figure (figure 4.31) shows the correlation plot of the
Over All Mediated Mobile QUAL model for the mediated factor Fringe
Benefit Services with Service Loyalty dimension across 69000 samples.
The figure exhibits that at lag 100 and beyond, the correlation is effectively
0. This indicates that by 90 iterations, the MCMC procedure has essentially
forgotten its starting position. Forgetting the starting position is equivalent
to convergence in distribution. Hence it is ensured that convergence in
distribution was attained, and that the analysis samples are indeed samples
from the true posterior distribution.
Figure 4.31: Posterior autocorrelation plot of the Over All Mediated Mobile
QUAL for the mediated factor Fringe Benefit Services (FBS) and Service Loyalty (SL) (W49)
Even though marginal posterior distributions are very important, they do not
reveal relationships that may exist among the two parameters. The summary
table given in table 4.10 and the frequency polygons given in the figure 4.32
and figure 4.33 describe only the marginal posterior distributions of the
parameters. Hence to visualize the relationships among pairs of Parameters
Cor
rela
tion
145
in two-dimensional. The surface plots following figures (figure 4.32 and
figure 4.33) provides bivariate marginal posterior plots of the Over All
Mediated Mobile QUAL model for the mediated factor Fringe Benefit
Services with other dimensions across 69000 samples. From the two figures
it reveals that the two-dimensional surface plots also signifies the
interrelationship between the variable of Fringe Benefit Services (FBS) with
the other dimensions Service Loyalty (SL) and Service Quality (SQ).
Figure 4.32: Two-dimensional surface plot of the marginal posterior distribution
of the Fringe Benefit Services (FBS) with the Service Loyalty (SL) and Service Quality (SQ) (W49).
146
Figure 4.33: Two-dimensional histogram plot of the marginal posterior distribution of the Fringe Benefit Services (FBS) with the Service Loyalty (SL)
and Service Quality (SQ) (W49).
The following figure 4.34 displays the two-dimensional plot of the bivariate
posterior density across 69000 samples. Ranging from dark to light the three
shades of gray represent 50%, 90%, and 95% credible regions, respectively.
From the figure, it reveals that the sample respondent’s responses are
normally distributed.
Figure 4.34: Two-dimensional contour plot of the marginal posterior distribution of the Fringe Benefit Services with the Service Loyalty (SL) and Service Quality
(SQ) (W49).
147
The various diagnostic plots featured from figure 4.28 to figure 4.34 of the
Bayesian estimation of convergence of MCMC algorithm confirms the fact
that the convergence takes place and the normality is attained. Hence
absolute fit of the Over All Mediated Mobile QUAL regression model. From
the Over All Mediated Mobile QUAL regression model which is empirically
tested with mediating factor Fringe Benefit Services (FBS) with the
dimensions of Service Network Communication (SNC), Technology
Adoption (TA), Customer Care Services (CCS), Service Quality (SQ),
Brand Switching Attitude & MNP (BSA) and Service Loyalty (SL) it is
evident that the Mobile Service Provider should concentrate on the Fringe
Benefit Service (FBS) as the most important aspect of Service Loyalty on
Mobile Service Provider in Cauvery Delta Districts in Tamil Nadu.
4.3.8. Hypotheses testing for the Mobile QUAL Model:
A mediator hypothesis is supported if the interaction path (SNC, TA, CCS,
SQ, BSA, SL and Fringe Benefit Services) are significant. There may also
be significant main effects for the predictor (Service Loyalty) and mediator
(Fringe Benefit Services). Therefore, this research seeks to explore whether
the relationship between Service Loyalty (SL) and SNC, TA, CCS, SQ,
BSA, SL are fully or partially mediated by Fringe Benefit Services.
Hypothesis 1: The service Loyalty dimension Service Network
Communication (SNC) is mediated by Fringe Benefit Services (FBS)
towards attainment of Service Loyalty to the Mobile Service Providers.
148
Hypothesis 2: The service Loyalty dimension Technology Adoption (TA) is
mediated by Fringe Benefit Services (FBS) towards attainment of Service
Loyalty to the Mobile Service Providers.
Hypothesis 3: The service Loyalty dimension Customer Care Services
(CCS) is mediated by Fringe Benefit Services (FBS) towards attainment of
Service Loyalty to the Mobile Service Providers.
Hypothesis 4: The service Loyalty dimension Service Quality (SQ) is
mediated by Fringe Benefit Services (FBS) towards attainment of Service
Loyalty to the Mobile Service Providers.
Hypothesis 5: The service Loyalty dimension Brand Switching Attitude &
MNP (BSA) is mediated by Fringe Benefit Services (FBS) towards
attainment of Service Loyalty to the Mobile Service Providers.
Hypothesis 6: The service Loyalty dimension Service Network
Communication (SNC) positively influences the Service Loyalty to the
Mobile Service Providers.
Hypothesis 7: The service Loyalty dimension Technology Adoption (TA)
positively influences the Service Loyalty to the Mobile Service Providers.
Hypothesis 8: The service Loyalty dimension Customer Care Services
(CCS) positively influences the Service Loyalty to the Mobile Service
Providers.
Hypothesis 9: The service Loyalty dimension Service Quality (SQ) positively
influences the Service Loyalty to the Mobile Service Providers.
149
Hypothesis 10: The service Loyalty dimension Brand Switching Attitude &
MNP (BSA) positively influences the Service Loyalty to the Mobile Service
Providers.
Hypothesis 11: The services Loyalty mediating dimension Fringe Benefit
Services (FBS), positively influence the Service Loyalty (SL) to the Mobile
Service Providers.
Hypothesis 12: Including the interaction between dimensions of the service
Loyalty and Fringe Benefit Services (FBS) will explain more of the variance
in Service Loyalty (SL) than the direct influence of dimensions of service
Loyalty or Fringe Benefit Services (FBS) on their own.
4.3.9. Hypotheses Verification for the Mobile QUAL Model
Hypothesis 1: Service Network Communication (SNC) r 2 of 0.00 mediated
through Fringe Benefit Services (FBS) with r 2 of 0.11 positively influence
Mobile Service Providers in Cauvery Delta Districts in Tamil Nadu.
Hypothesis is accepted.
Hypothesis 2: Technology Adoption (TA) r 2 of 0.30 mediated through
Fringe Benefit Services (FBS) with r 2 of 0.11 positively influence Mobile
Service Providers in Cauvery Delta Districts in Tamil Nadu. Hypothesis is
accepted.
Hypothesis 3: Customer Care Services (CCS) r 2 of 0.18 mediated through
Fringe Benefit Services (FBS) with r 2 of 0.11 positively influence Mobile
Service Providers in Cauvery Delta Districts in Tamil Nadu. Hypothesis is
accepted.
150
Hypothesis 4: Service Quality (SQ) r 2 of 0.40 mediated through Fringe
Benefit Services (FBS) with r 2 of 0.11 positively influence Mobile Service
Providers in Cauvery Delta Districts in Tamil Nadu. Hypothesis is accepted.
Hypothesis 5: Brand Switching Attitude & MNP (BSA) r 2 of 0.01 mediated
through Fringe Benefit Services (FBS) with r 2 of 0.11 positively influence
Mobile Service Providers in Cauvery Delta Districts in Tamil Nadu.
Hypothesis is accepted.
Hypothesis 6: Service Network Communication (SNC) has very high
insignificant influence over Mobile Service Providers in Cauvery Delta
Districts in Tamil Nadu Service Loyalty directly with r 2 of 0.15. Hypothesis
is accepted but trivial for the study.
Hypothesis 7: Technology Adoption (TA) has very low insignificant
influence over Mobile Service Providers in Cauvery Delta Districts in Tamil
Nadu Service Loyalty directly with r 2 of 0.05. Hypothesis is accepted but
trivial for the study.
Hypothesis 8: Customer Care Services (CCS) has very low insignificant
influence over Mobile Service Providers in Cauvery Delta Districts in Tamil
Nadu Service Loyalty directly with r 2 of 0.05. Hypothesis is accepted but
trivial for the study.
Hypothesis 9: Service Quality (SQ) has very high insignificant influence
over Mobile Service Providers in Cauvery Delta Districts in Tamil Nadu
Service Loyalty directly with r 2 of 0.14. Hypothesis is accepted but trivial
for the study.
Hypothesis 10: Brand Switching Attitude & MNP (BSA) has very low
insignificant influence over Mobile Service Providers in Cauvery Delta
151
Districts in Tamil Nadu Service Loyalty directly with r 2 of 0.05. Hypothesis
is accepted but trivial for the study.
Hypothesis 11: Mediator Fringe Benefit Services (FBS) has an r 2 of 0.11
with the outcome Mobile Service Providers in Cauvery Delta Districts in
Tamil Nadu and its mediating effect along with other variables with Mobile
Service Providers in Cauvery Delta Districts in Tamil Nadu is confirmed.
Hypothesis 12: There is no significance for the relationships between All
Hypotheses are accepted in Mobile QUAL models of Mobile Service
Providers in Cauvery Delta Districts in Tamil Nadu.
4.3.10. Managerial Implications for Mobile Service Provider
Mobile-QUAL is a valid instrument to measure service quality in cellular
mobile telephone operators in Tamil Nadu. Inclusion of additional
dimensions and items make it more comprehensive for application in
telecommunication services. The dimensions of Service Network
Communication (SNC), Technology Adoption (TA), Customer Care
Services (CCS), Service Quality (SQ) and Brand Switching Attitude &
MNP (BSA) and the mediating parameter Fringe Benefit Services (FBS)
and the outcome of Service Loyalty (SL) are important aspects that need
managerial attention to attract and retain customers. The regulators in
telecommunication industry should take appropriate measure to include
these dimensions in undertaking objective assessment of quality of
152
service of cellular mobile telephone operators in Tamil Nadu in
safeguarding customers’ interest.
The adapted Mobile-QUAL with additional dimensions was found to be a
valid instrument to measure service quality in mobile phone services. The
dimensions of tangible, assurance, responsiveness, empathy, convenience,
and network quality found to have positive and statistically significant
relationship with mobile phone users’ perceived service quality.
Convenience and network quality dimensions found to be relatively most
important dimensions affecting users’ perception. The dimension of
reliability did not reflect significant effect on customers’ perception of
quality.
The competitive environment in mobile phone industry in Tamil Nadu
has become intense. Mobile operators are vigorously investing in network
coverage, upgradation, and quality, competitive pricing, and diversified
offering to attract new customers and retain the existing customers. The
results of this study substantiate the response strategy of mobile phone
operators to enhance quality of network, the tangible, responsiveness, and
assurance, empathy, and convenience dimensions of services that are vital
to affect the customers’ perception of quality of service.
The proactive role of Indian Telecom Sector, consumers’ awareness to
higher quality of services, and the prospects of new entrants in the market
153
will enhance the existing level of competition. The emerging competitive
market environment will offer challenges to mobile phone operators to
proactively pursue customer focused strategy for building and sustaining
competitive advantage based on benchmark quality of service dimensions
that the results of this research indicate.
The results of the study reflect that the issue of provisioning of promised
service, timely, accurately, and dependably will need highest priority.
Earlier researches indicate that reliability positively and significantly
affects customers’ perception of service quality of mobile phone users.
Because the reliability has been established as the driver of mobile phone
service quality, Mobile operators will need to pursue two pronged
strategy with internal focus on improved processes, and external focus
on customers’ needs. An aggressive strategy is needed to enhance the
trustworthiness of mobile phone operators by keeping customers’ best
interest at heart, providing customized services and exemplary behaviour of
contact personnel to make the interaction a memorable experience. The
mobile operators should also focus on other dimensions of tangible;
responsiveness, assurance, and empathy because these aspects significantly
affect customers’ perception of service quality of mobile phone service
provider.
154
Employees play a leading role in telecommunication service. The role of
frontline staff becomes extremely important in making the interaction with
customer pleasing. The staffs need to know the importance of their role in
service delivery. Management should ensure that human resources
dimensions are addressed to optimize the service delivery by staff.
The study established that Mobile-QUAL with additional dimensions is a
reliable instrument for measurement of service quality dimensions in
telecommunication industry in Tamil Nadu. Changing customers have
made the service quality a fluid phenomenon. The competitive environment
demand constant assessment of service quality to meet rapid changes in
customers’ demand. It is essential that service quality of mobile phone
users be evaluated on regular basis to identify weaknesses, and emerging
trends in the service. The regular service quality assessment enables
organizations to align to the changing customers needs (Dutka & Frankel,
1993). Because of the growing level of competition that can be observed in
Iranian telecommunication industry, mobile phone operators should make
efforts to continuously improve the level of service quality offered to
their subscribers. However, a basic principle of quality management is that
to improve quality, it must first be measured. On the basis of the need to
develop specific measurement tools for different services), this study aimed
at developing and validating a model specifically for measuring mobile
telecommunication service quality. A multidimensional model has been
155
proposed (Mobile-QUAL) based on an extensive literature review and
then tested and validated by the survey data collected through Indian
mobile phone subscribers in Tamil Nadu. This model provides a very
useful tool, for both researchers and practitioners, for measuring and
managing service quality in mobile telecommunication sector.
Finding of this study showed that mobile phone subscribers for m their
service quality perceptions based on their evaluations of seven primary
resulted significant impact on the mediated factor Fringe Benefit
Services (FBS).
5.2.3. Findings from the Regression Model of the “Over All Mediated
Mobile QUAL” Model
The regression co-efficient 0.31 signifies the impact of mediating
factor Fringe Benefit Services (FBS) on the other Dimensions
towards Service Loyalty of the Mobile Service Provider.
Regression Model of the “Over All Mediated Mobile QUAL” Model
is revealed that all the criterions of goodness-of-fit statistics and other
169
measures of statistics are acceptable for the Over All Mediated
Mobile QUAL Structural Equation Model.
The Root Mean Squared error of Approximation (RMSEA) Value is
.043<0.05 Accepted level of good fit.
5.2.4. Findings from Conceptual Model
The conceptual research model empirically proved (figure 5.1). Thus, the
present study has focused on Mobile Service Provider Customer (Service)
Loyalty which is considered as an important indicator for both Government
(Public) and Private. The researcher identify that the Fringe Benefit
Services is the mediating factor for the Mobile Service Provider (Telecom)
sector in the study area. Hence Mobile Service Provider (Telecom) Sector
would be concentrated on Fringe Benefit Services to improve the Customer
loyalty for the growth of Mobile Service Provider (Telecom) Sector.
Figure 5.1 : Conceptual Model Research Model
Technology Adoption
Customer Care Services
Service Quality
Brand Switching Attitude & MNP
Demographic Variable Fringe Benefit
Services
Service Loyalty
Service Network Communication
170
5.3. Strategic Planning For Improving Mobile Service Provider Loyalty
In India, the Telecom Sector face a challenge of providing services to a
broad range of customers, which varies from suave community and high net
worth individuals to low-end publics who are catered to by stakeholders.
Over time, a series of initiatives have been taken to improve the quality of
customer service comprises the following in the figure:
Fig 5.2 Strategic Planning for The Mobile Service Provider Loyalty
Strategic Planning for the Promoting Mobile Service Provider
Service Loyalty
Service Quality
Service Quality
Service Loyalty
Technology Adoption
Service Net Work
Communication
Brand Switching Attitude & MNP
Customer Care
Service
s
Fringe Benefit Services
171
5.4. Limitations and Directions for Further Research Academician point of view
This study has some limitations on the generalize ability of the findings.
First, since the data were gathered in a specific geographic area of Tamil
Nadu, the results may be specific for this area. In order to generalize the
proposed model, further researches should replicate this model in other
populations and provinces. Second, the possibility to generalize the results
to other countries with different characteristics (such as different cultural
context, different level of economic development) needs to be verified, by
re-testing the proposed model. Another limitation of this study could be the
significant difference between the population of men and women in survey
sample. This happened because women were less likely to cooperate with
interviewers and complete the questionnaire.
Further researchers could examine the relationship between Mobile- QUAL,
customers‟ satisfaction and other relevant variables such as customer
loyalty. Also, future research could focus on the antecedents of mobile
telecommunication service quality and how customers form their
perceptions about each of the Mobile- QUAL in Indian context.
172
5.5. Conclusion
Quality is generally regarded as being a key factor in the creation of worth
and in influencing customer satisfaction. Hence, the telecommunication
industry in India has to be strategically positioned to provide quality
services to satisfy customers. To provide improved quality service,
telecommunication companies need to investigate degree of customers’
sensitivity and expectations toward service quality. Armed with such
information, telecommunication outfits are then able to strategically focus
service quality objectives and procedures to fit the Indian market.
References
References Accenture. (2008). High Performance in the Age of Customer Centricity, Customer
Satisfaction Research.
ACMA. (2008). Consumers express Consumers express overall satisfaction with telecommunication services but mobile and internet services of concern to rural sector.
ACMA. (2008). Consumers express Consumers express overall satisfaction with telecommunication services but mobile and internet services of concern to rural sector.
Aisha Khan and Ruche Chaturvedi (2005) Customer Relationship Management – An India Perspective, Excel Books, Indian Infrastructure, Oct. 2005, pg. 26.
Akroush, M. N., Al-Mohammad, S. M., Zuriekat, M. I., & Abu-Lail, B. N. (2011). An empirical model of customer loyalty in the Jordanian mobile telecommunications market. International Journal of Mobile Communications, 9(1), 76-101.
Akwule R U (1992), “Telecommunications in Kenya; Development and policy issue” in telecommunication policy, sept- oct.pp.603-11.
Andaleeb, S.S., & Basu, A.K. (1994). Technical complexity and consumer knowledge as moderators of service quality evaluation in the automobile service industry. Journal of Retailing, 70(4), 367-81.
Anderson, EW & Sullivan, M. (1993) “The Antecedents and Consequences of Consumer Satisfaction for Firms”, Mark Sci.12:pp.125–43 (spring).
Anita seth (2007), “quality of service parameters in cellular mobile communication”, international journal of mobile communications, vol-5, issue 1, jan-2007.
Annual Report in MoCIT (Year: 2011 – 2012), Department of Telecommunications Ministry of Communications & Information Technology, Government of India, New Delhi.
Arbuckle, J. L., &Wothke, W. (2006) Amos 7.0 user's Guide, Chicago: Small Waters Corporation.
Arulraj, A & Lourthuraj, S.A. (2012) “Investment Management Service Quality in Equities in Secondary Market”. Serial Publication, New Delhi.
Arulraj, A & Sarangarajan, V (2010), “Strategic Measurement Financial Performance”-. Serial Publication, New Delhi.
Arulraj, A & Sukumaran, A. (2010), “A Study on Mediating Service Quality in Fertilizer Marketing in Tamilnadu, India, (Unpublished Doctoral dissertation, Bharathidasan University, Trichy, India).
Arulraj, A. & Ananth, A. (2011), Strategic Approach on Service Quality Management in Rural Banking, Serial Publication, New Delhi.
Arulraj, A. & Parthiban, B. (2010) “A Study on Mediating Effects on Purchase Decision of Bikes in Kancheepuram Dt., Tamil Nadu”, (Unpublished Doctoral dissertation, Bharathidasan University, Trichy, India)
Arulraj, A. & Prabaharan, B. (2010) Methodology for Strategy Service Quality in Tourism, Serials Publication, New Delhi
Arulraj, A. & Ramesh, R (2012), Strategic Planning for Service Loyalty on Insurance, Serials Publication, New Delhi.
Arulraj, A. & Suresh Kumar, V. (2010), Social Empowerment through Housing Finance Service Quality, Serials Publication, New Delhi.
Arulraj,A & Ilavenil, R (2013) “A Study On Strategic Financial Performance Of Public Sector Banks In India”. (Unpublished Doctoral Dissertation, Bharathidasan University, Trichy, TN, India).
Arulraj,A & Rethina Sivakumar, R (2012) “A Study on Mediating Effects on Service Loyalty on Healthcare Services in Tamilnadu, India”. (Unpublished Doctoral Dissertation, Bharathidasan University, Trichy, TN, India)
Arulraj,A & Santhanalakshmi, M, (2013) “A Study Of Mediating Effects On Economic Service Quality For The Sustainability Of Self Help Groups In Central Districts Of Tamil Nadu”. (Unpublished Doctoral Dissertation, Bharathidasan University, Trichy, TN, India).
Arulraj,A & Sethuraman, M (2013) “A Study On Mediating Effects On Poverty Reduction In Mahatma Gandhi National Rural Employment Guarantee Programme At Cauvery Delta Districts In Tamilnadu”. (Unpublished Doctoral Dissertation, Bharathidasan University, Trichy, TN, India).
Arulraj,A & Thanga Prasath, R (2012) “A Study on Mediating Effects on Service Loyalty in Grocery Retailing in Thanjavur District, Tamilnadu”. (Unpublished Doctoral Dissertation, Bharathidasan University, Trichy, TN, India)
Arulraj,A. and Senthil Kumar, N. (2009) Methodology for Service Quality Measurement of higher education in India, Serials Publication, New Delhi.
Arulraj. A, Thiyagarajan .V, (2012) "Strategies Measurement of non-banking finance sector in India", Serials Publication, New Delhi.
As Navin (1995), “impact of strength of Ethnic identification on Hispanic shopping Behavior”, Journal of Retailing, Vol-70(4), 383-393.
ASEAN India synergy sectors Report 2005.
Associated chambers of commerce and industry of india 2005.
Aydin, S., & Özer, G. (2005). The analysis of antecedents of customer loyalty in the Turkish mobile telecommunication market. European Journal of Marketing, 39(7/8), 910-925.
Babakus, E., & Boller, G. W. (1992). An empirical assessment of the SERVQUAL scale. Journal of Business Research, 24, 235-268.
Babakus, E., & Mangold, W.G. (1992). Adapting the SERVQUAL scale to hospital services: an empirical investigation. Health Service Research, 26(6), 767-80.
Babakus, Emin, and Gregory W. Boiler. 1992. An empirical assessment of the SERVQUAL scale. Journal of Business Research, 24, 253-268.
Bagozzi, R.P. (1994): Structural equation models in marketing research: basic principles. In R.P. Bagozzi (Ed.): Principles of Marketing Research. Cambridge: Basil Blackwell, 317-385.
Barnhoorn, C. (2006). Customer satisfaction increases in the Telecommunications Industry.
Baron, R. M. & Kenny, D. A. (1986) “The Moderator-Mediator Variable Distinction in Social Psychological Research: Conceptual, Strategic, and Statistical.
Batista-Foguet, J.M. and Coenders, G. (2000): Modelos de Ecuaciones Estructurales [Structural Equation Models]. Madrid, Spain: La Muralla.
Baumann, C., Elliott, G. &Hamin, H. (2011) ‘Modelling Customer Loyalty in Financial Services: A Hybrid of Formative and Reflective Constructs’, International Journal of Bank Marketing, Vol. 29, Issue 3: pp. 247-267.
Bentler PM. (1995) EQS: Structural Equations Program Manual, Version 5.0, BMDP Statistical Software, Los Angeles.
Bepko and Charlene Pleger (2002), “Service Intangibility and Its Impact on Consumer Expectations of Service Quality”, Journal of Service Marketing, Vol. 14, No. 2, pp. 9-26.
Berkley, B.J. & Gupta, A. (1994) “Improving Service Quality with Information Technology”, International Journal of Information Management, Vol. 14: pp. 109-21.
Berry, Leonard L. and A. Parsuraman (1991), Marketing Services – Competing Through Quality, New York: Free Press.
Berry, L.L. (1995), “Relationship marketing of services: growing interests, emerging perspectives”, Journal of the Academy of Marketing Science, Vol.23, No.4, pp.236-45.
Berry, L.L., Parasuraman, A., Zeithaml, V.A., & Adsit, D. (1994). Improving service quality in America: lessons learned. Academy of Management Executive, 8(2), 32-52.
Bhatia, N. & Bhatia, A., (2000), Lending To Groups, Yojana, New Delhi.
Bickert, Jock (1992), “The Database Revolution,” Target Marketing, May, pp. 14-18.
Bing, M. N., Davison, H. K., LeBreton, D. L., & LeBreton, J. M. (2002) Issues and improvements in tests of mediation, Poster presented at the annual meeting of the Society for Industrial and Organizational Psychology, Toronto, Canada.
Bitner, M.J. &Hubbert, A.R. (1994), “Encounter satisfaction versus overall satisfaction versus quality”, in Rust, R.T. and Oliver, R.L. (Eds), Service Quality: New Directions in Theory and Practice, Sage Publications, Thousand Oaks, CA, pp. 72-94.
Bjorn welenius and Peter A Stern(2001) “Implementing Reforms in the Telecommunications sector”, The world bank, Washington DC.
Bloemer, J.M. & Kasper, H. (1995) “The Complex Relationship between Consumer Satisfaction and Brand Loyalty”, Journal of Economic Psychology, Vol. 16 No. 2: pp. 311-29.
Bojanic, D.C. (1991). Quality measurement in professional services firms, Journal of Professional Services Marketing, 7(2) 27-37.
Bollen, K.A. (1989), Structural Equations with Latent Variables. New York: Wiley.
Boohene, R., & Agyapong, G. (2011). Analysis of the antecedents of customer loyalty of telecommunication industry in Ghana: The case of Vodafone (Ghana). International Business Research, 4(1), 229-240.
Boomsma, A. (1983) On the robustness of LISREL (maximum likelihood estimation against small sample size and non-normality. Amsterdam: Socio-metric Research Foundation, (Doctoral dissertation, University of Groningen, The Netherlands).
Boshoff, C. &Gray, B. (2004)“The Relationships Between Service Quality, Customer Satisfaction and Buying Intentions in the Private Hospital Industry”, South African Journal Business Management, Vol. 35 No. 4: pp. 27-38.
Bowen, J. T. & Chen, S.-L. (2001) "The Relationship between Customer Loyalty and Customer Satisfaction", International Journal of Contemporary Hospitality Management, 13(4): pp.213-217.
Boyd, Walker & Larréché (1995). Advertising, personal selling and salesPromotion, Define PR on (p 352) as non-paid, non-personal stimulation of demand for a product, service or business unit by planting significant news about it or favourable presentation of it in the media (looks suspiciously similar to other definitions of publicity). Later on publicity and PR is used interchangeably (p374/375).
Braff Adam, Passmore William,J, and Simpson Michael (2003), “Going the distance with telecom customers”, The Mckinsey Quarterly,No.4,Pg.83.
Broderick, A.J. & Vachirapornpuk, S. (2002) “Service Quality in Internet Banking: the Importance of Customer Role”, Marketing Intelligence & Planning, Vol. 20 No. 6: pp. 327-35.
Brogowicz, A.A., Delene, L.M. & Lyth, D.M. (1990) “A Synthesised Service Quality Model with Managerial Implications”, International Journal of Service Industry Management, Vol. 1 No. 1: pp. 27-44.
Brown, M. W., & Cudeck, R. (1993). Alternative ways of assessing model fit. In K. A. Bollen & J. S. Long (Eds.), Testing structural equation models. Newbury Park, CA: Sage Publications.
Brown, S.W., & Swartz, T. (1989). A gap analysis of professional service quality. Journal of Marketing, 53(2), 92-8.
Brown, T., Churchill, G., & Peter, J. (1993). Improving the measurement of service quality. Journal of Retailing, 69(1), 127-39.
Browne, M.W. & Cudeck, R. (1993) Alternative ways of assessing model fit. In K.A. Bollen and J.S. Long (Eds.): Testing Structural Equation Models. Thousand Oaks: Sage: pp. 136-162.
Browne, M.W. and Cudeck, R. (1993): Alternative ways of assessing model fit. In K.A. Bollen and J.S. Long (Eds.): Testing Structural Equation Models. Thousand Oaks: Sage, 136-162.
Business & Economy, “Telecom Czar” 30 July 2005.
Business Today (1992), India Today Group.
Buttle, F. (1996) “SERVQUAL: Review, Critique, Research Agenda”. European Journal of Marketing, 30(1): pp. 8–35.
Buttle, F.&Burton, J. (2002) “Does Service Failure Influence Customer Loyalty?” J. Consumer Behavior. 1(3): pp.217-227.
BW Marketing white book, 2005, pg.54. Cannie and Caplin, 1991, “A Marketing approach to Customer retention”, Journal
of Consumer Marketing (Spring), pp.
Cap Gemini. (2005). Wireless phone users demand more than lower price plans according to German Mobile Cellular Telecommunications Markets. Telecommunication Policy, 25, 249.
Carman, J. M. (1990) “Consumer Perceptions of Service Quality: An Assessment of the SERVQUAL Dimension”, Journal of Retailing, 66(1):pp. 33-55.
Carman, J.M. (1990). Consumer perceptions of service quality: an assessment of the SERVQUAL dimensions. Journal of Retailing, 66(1) 33-55.
Carsten Fink, Aaditya Mattoo and Randeep Rathindran (2001), “Liberalizing Basic Telecommunications: The Asian Experience”, World Bank Policy Research Working Paper 2718.
Caruana, A. (2002) "Service Loyalty: The Effects of Service Quality and the Mediating Role of Customer Satisfaction." European Journal of Marketing, 36(7/8): pp. 811-830.
Caruana, Albert. 2002. Service Loyalty, the effects of service quality and the mediating role of customer satisfaction. European Journal of Marketing, 36 (7/8), 811-828.
Chao-Chan Wu, (2011) “The Impact of Hospital Brand Image On Service Quality, Patient Satisfaction and Loyalty”. African Journal of Business Management Vol. 5(12): pp. 4873-4882.
Chiou, J. S. (2004) "The Antecedents of Consumers’ Loyalty toward Internet Service Providers", Information & Management, 41(6): pp.685-695.
Consumer Report. (2005). There are differences among major carriers.
Cronin, J. and Stephen A. Taylor. 1992. Measuring service quality: A re-examination and extension. Journal of Marketing, 56 (July), 55-68.
Cronin, J. Joseph, Jr., Michael K. Brady and G. Thomas M. Hult. 2000. Assessing the effects of quality, value, and customer satisfaction on behavioural intentions in service environments. Journal of Retailing, 76 (2), 193-218.
Cronin, J.J. & Taylor, S.A. (1994) “SERVPERF versus SERVQUAL: Reconciling Performance-Based and Perceptions-Minus-Expectations Measurement of Service Quality”, Journal of Marketing, Vol. 58: pp. 125-31.
Cronin, J.J., & Taylor, S.A. (1994). SERVPERF versus SERVQUAL: reconciling performance-based and perceptions-minus-expectations measurement of service quality. Journal of Marketing, 58(1), 125-31.
Crosby, L. A., K. R. Evans, and D. Cowles. 1990. Relationship quality in services selling: An interpersonal influence perspective. Journal of Marketing, 54, 68-81.
Crosby, Lawrence, A. and Nancy Stephens (1987), “Effects of Relationship Marketing and Satisfaction, Retention, and Prices in the Life Insurance Industry,” Journal of Marketing Research, (November), pp. 404-411.
Crosby, Lawrence, A., Kenneth R Teas, and Deboprah Gowles, (1993),“Relationship Qualityin Services Selling – An interpersonal influence Perspective”, Journal of Marketing, 52 (April), pp. 21-34.
Customer Satisfaction Index. (2009). U.S. Wireless Contract Regional Customer Satisfaction.
Customer Satisfaction. (2007). Customer Satisfaction with Wireless Service Providers and Wireless Phone Manufacturers in Canada Declines Significantly.
Dabholkar, P. A., Thorpe, D. I., & Rentz, J. O. (1996), A measure of service quality for retail stores: Scale development and validation. Academy of Marketing Science Journal, 24(1), 3-16.
Dabholkar, P.A., Shepherd, C.D. and Thorpe, D.I. (2000) “A Comprehensive Frame-Work for Service Quality: An Investigation of Critical Conceptual and Measurement Issues through A Longitudinal Study”, Journal of Retailing, Vol. 76 No. 2: pp. 131-9.
David L. Kurtz, Kenneth L. Clow (2002). Services Marketing, John Wiley & Sons.
Delgado-Ballester, E. &Munuera-Alemán, J. (2000) "Brand Trust in the Context of Consumer Loyalty", European Journal of Marketing, 35(11/12): pp.1238-1258.
Dhar, Ravi and Klaus Wertenbroach 2006), “Consumer choice between hedonic and utilitarian goods”, Journal of consumer research ,37 (Feb.),pp.60-71.
Dhar, Ravi.Stephen M.Nowlis, and steven J Sherman (1999), “comparison effect on preference construction”, Journal of consumer research 26th dec.pp.293-306.
Diamantopoulos, A. &Siguaw, J.A. (2000) Introducing LISREL, London: Sage Publications.
Dick, Alan S. and Kunal Basu (1994), “Customer Loyality: Toward an Integrated Conceptual Framework”,Journal of the Academy of Marketing Science,22 (Spring), pp. 99-113.
Dirks and Danniel (1991), Advertising and promotion; an integrated marketing communications perspective, 3rd Canadian edition.
Donald A Snyder (2006), “Technology transfer; Lessons from experience – The telecommunication process” 16.dec.2006.
Donald H (1994) , “ Telecommunication libralisation and privatization ; the New Zealand experience in B.Wellenius and P.A.Stern (ed) Implementing reforms in the telecom sector, world bank, Washington, DC, PP.253-60.
Donath B (1999), “Consumer marketing trends”, marketing news 28, pp.14-27.
Donthu, N., & Yoo, B. (1998). Cultural influences on service quality expectations. Journal of Service Research, 1(2), 178-86.
Dossani, R. 2002. Telecommunications Reform in India. Westport, CT: Greenwood Press.
DOT- Annual Report, (2002) Government of India- Department of Telecommunication.
DSTI. (2007). Enhancing Competition in Telecommunication: Protecting and Empowering Consumers.
Dutka, S. and L. R. Frankel. 1991. In Paul Biemer et al, eds., Measurement Errors in Surveys. New York: Wiley, pp. 113-123.
Dutt and Sundaram, Indian Economy, Edition, 2004, Carlsson Jeanette and Arias Salvador, “Transforming Wire line Telecom”,E- business, Feb. 2004, pg. 13.
Dwayne D. Gremlera and Stephen W. Brown, (1996) “Service Loyalty: Its Nature, Importance, and Implications”, Advancing Service Quality: A Global perspective, ISQA, NY.
E Pedersen and Methlie (2002), A taxonomy of intermediately integration strategies in online markets, presented at the 15th Bled Electronic Commerce Conference, Bled, Slovenia, June-pp.17-19.
Economic Commission for Europe, “The Telecommunication Industry – Growth & Structural Change – United Nations, New York.
Economic survey, GOI, 2002 – 2003.
Economics Times 2005.
Edward, M., George, B. P., & Sarkar, S. K. (2010). The Impact of switching costs upon the service quality-perceived value-customer satisfaction- service loyalty chain: A study in the context of cellular services in India. Services Marketing Quarterly, 31(2), 151-173.
Eshghi, A., Roy, S. K., & Ganguli, S. (2008). Service quality and customer satisfaction: An empirical investigation in Indian mobile telecommunication services. Marketing Management Journal, 18(2), 119-144.
F. Robert Dwyer, Paul H. Schurr and Sej Oh (1987), “Developing Buyer Seller Relationships”, Journal of Marketing, Vol 51, (April, 1987), pp. 11-27.
FICCI (2003), Federation of Indian Chambers of Commerce & Industry Report.
Finn, David W. and Charles Lamb Jr., (1991), “An Evaluation of the SERVQUAL Scales in a Retailing Setting,” Advances in Consumer Research, Vol. 18, No. 1, pp. 483-490.
Francis, G. (2003) Multiple Regressions: Swinburne University Press. Frazier, Gary, Robert E. Spekman, and Charles O‟Neal (1988), “Just in Time
Exchange System and Industrial Marketing”, Journal of Marketing, 52 (October), pp. 52-67.
Frost, F.A. & Kumar, M. (2000) “INTSERVQUAL: An Internal Adaptation of the GAP Model in A Large Service Organization”, Journal of Services Marketing, Vol. 14 No. 5: pp. 358-77.
Ganesan, S. (1994), “Determinants of long-term orientation in buyer-seller relationships” Journal of Marketing, Vol. 58, pp. 1-19.
Ganguli, S. & Roy, S. (2011) “Generic Technology-Based Service Quality Dimensions In Banking: Impact on Customer Satisfaction and Loyalty”, International Journal of Bank Marketing, Vol. 29, Issue 2: pp. 168-189.
Ganguli,Shirshendu (2008),” changing face of relationship marketing valuation of CRM to EMM “, Effective executive,april-pp.54.
Gautam, V. (2011). An empirical study to understand the different antecedents of relationship quality in the Indian context with reference to the mobile telecommunication sector. RRM, 1, 29- 43.
Gelman, A, Carlin J.B, Stern H.S, and Rubin D.B (2004) “Bayesian Data Analysis”, 2nd ed, Boca Raton: Chapman and Hall/CRC.
Girish Taneja and Neeraj Kaushik(2007) “customer perception towards mobile service providers; An analytical overview”, The IUP Journal of services marketing,pp.14.
Gremler, D. (1995). The effect of satisfaction, switching costs, and interpersonal bonds on service loyalty. Unpublished doctoral dissertation, Arisona State University, Tucson, Arizona.
Grisaffe, Doug (2001), “Loyalty-Attitude, Behavior, and Good Science: A Third Take on the Neal-Brandt Debate,” Journal of Consumer Satisfaction, Dissatisfaction and Complaining Behavior, 14, 55-59.
Gronroos 1984. A service quality model and its implications. European Journal of Marketing, 18, 36-44.
Gronroos, Christian (1990), “Relationship Approach to Marketing in Service.
Gummerson, E. (1987), “The new marketing developing long-term interactive relationships”, Long-range Planning, Vol.20, No.4, pp.10-20.
Gunjan, M., Amitava, M., Abhishek, N., & Soumyadeep, S. (2011). Consumer behavior towards mobile phone service provider: An empirical research on mobile number portability in India. Advances In Management, 4(6), 44-49.
Hair, J. E., Anderson, R. E., Tatham, R. L., & Black, W. C. (1998). Multivariate Data Analysis. Delhi, India: Pearson Education, Inc.
Hal Mather, “How to Profitably Delight your Customers”, Butterworth Heinemann.
Haywood-Farmer, J. (1988), “A Conceptual Model Of Service Quality”, International Journal of Operations & Production Management, Vol. 8 No. 6: pp. 19-29.
Heman Requelme (2001), “ Do consumers know what they want? “, Journal of consumer marketing, Vol.18,Iss-5,pp 437- 448.
Hoffman, K.D., & Bateson, J.E.G. (2001). Essentials of Service Marketing. The Dryden Press, Hinsdale, IL.
Holbrook, M.B. (1994). The nature of customer value: an axiology of services in the consumption experience. In Rust, R.T., Oliver, R.L. (Eds), Service Quality: New Directions in Theory and Practice, Sage Publications, Inc., Thousand Oaks, CA, pp.21-71.
Holmbeck, G. N. (1997), Toward terminological, conceptual, and statistical clarity in the study of mediators and moderators: Examples from the child-clinical and
pediatric psychology literatures. Journal of Consulting and Clinical Psychology, 4, 599-610.
Iacobucci, D., Ostrom, A. & Grayson, K. (1995) "Distinguishing Service Quality and Customer Satisfaction: The Voice of the Consumer." Journal of Consumer Psychology 4(3): pp.277-303.
Indian infrastructure report (2005), The Infrastructure Sector in India, p.g.29. Indian Telecommunication Statistics 2002, Ministry of Communications, Government
of India.
J.D. Power & Associates Reports. (2009). Wireless traditional mobile phone satisfaction. [Online Available: http://businesscenter.jdpower.com/news/ pressrelease.aspx? ID=2009082. ( February 16, 2010).
J.D.Power and associate reports; Exceptional service satisfaction enhances dealer and manufacturer profibility through improved customer retention,”
Jacksopn, Barbara B. (1985). Winning and Keeping Industrial Customers: The Dynamics of Customer Relationships, Lexington, MA: D.C. Health and Company.
Jacoby, Jacob and Robert W. Chestnut (1978), Brand Loyalty: Measurement and Management, New York: Wiley.
Jahanzeb, S., Fatima, T., & Khan, M. B. (2011). An empirical analysis of customer loyalty in Pakistan's telecommunication industry. Journal of Database Marketing & Customer Strategy Management, 18(1), 5-15.
Jain and Chhokar (1993), “Reorganization of telecom sector, Past and Future”, Vikas Publication, New delhi.
James, L. R. & Brett, J. M. (1984) “Mediators, Moderators and Tests of Mediation”, Journal of Applied Psychology, 69:pp. 307-321.
Javalgi, R.G. and Moburg, C.R. (1997), “Service loyalty: implications for service pro-viders”, Journal of Services Marketing, Vol. 11 No. 3, pp. 165-79.
Joe alba, “knowledge calibration; what consumer know and what they think they know,” journal of consumer research , spring 2006.
Johnston, R. (1995) "The Determinants of Service Quality: Satisfiers and Dissatisfiers" International Journal of Service Industry Management, 6(5): pp. 53-72.
Joreskog, K.G. (1971) “Statistical Analysis of Sets of Cogeneric Tests,” Psychometrika,36, 109-136.
Kalavani (2006), “To study the gap between service promised and service offered by service provider”.
Kalpana and Chinnadurai (2006), “Promotional strategies of cellular services: A customer perspective”, Indian Journal of marketing, may- 2006.pp.29.
Kassim, N. M. (2006). Telecommunication industry in Malaysia: Demographics effect on customer expectations, performance, satisfaction and retention. Asia Pacific Business Review, 12(4), 437-463.
Keller, Kevin L. (1993) ``Conceptualizing, measuring and managing consumer-based brand equity'' Journal of Marketing.
Kerlinger, F.N., & Lee, H.B. (2000) Foundations of behavioral research, 4th Ed., New York: Harcourt Publishers.
Khaligh, A. A., Miremadi, A., & Aminilari, M. (2012). The impact of eCRM on loyalty and retention of customers in Iranian telecommunication sector. International Joumal of Business and Management, 7(2), 150-162.
Kim YK, Cho CH, Ahn SK, Goh IH, Kim HJ (2008) A study on medical services quality and its influence upon value of care and patient satisfaction – Focusing upon outpatients in a large-sized hospital. Total Qual. Manag. Bus. Excel. 19(11): pp.1155-1171.
Kim, H. S., & Yoon, C. H. (2004). Determinants of subscriber churn and customer loyalty in the Korean mobile telephony market. Telecommunications Policy, 28(9-10), 751-765.
Kim, M. K., Park, M. C., & Jeong, D. H. (2004). The effects of customer satisfaction and switching barrier on customer loyalty in Korean mobile telecommunication services. Telecommunications Policy, 28(2), 145-159.
Kim, Soyoung, Byoungho Jin. (2002). Validating the retail service quality scale for US and Korean customers of discount stores: an exploratory study. Journal of Services Marketing, 7(2) 223-237.
Kotler &Armstrong (1997). Advertising, personal selling and sales promotion (p 428) direct marketing is added as a growth trend (p 444).
Kotler, Philip 2001. Marketing Management. The Millennium Edition. Prentice Hall International, Inc.
Kracklauer, A., Mills, D. and Seifert, D. (2004) Collaborative Customer Relationship Management: taking CRM to the next level, New York: Springer.
Krishnan, R., & Kothari, M. (2008). Antecedents of customer relationships in the telecommunication sector: An empirical study. The Icfai University Press, 38-59.
Kushan Mitra (2005), Business Today, 5 June 2005.
Lai, F., Griffin, M., & Babin, B. J. (2009). How quality, value, image, and satisfaction create loyalty at a Chinese telecom. Journal of Business Research, 62(10), 980-986.
Lai, F., Hutchinson, J., Li, D., & Bai, C. (2007). An empirical assessment and application of SERVQUAL in mainland China’s mobile communication
industry. International Journal of Quality & Reliability Management, 24(3), 244-262.
Lapierre, J., P. Filiatrault, J. Perrien. (1996). Research on service quality evaluation: evolution and methodological issues. Journal of Retailing and Consumer Services, 3(2) 91 98.
Lee, J., Lee, J., & Feick, L. (2001). The impact of switching costs on the customer satisfaction–loyalty link: Mobile phone service in France. Journal of Services Marketing, 15, 35–48.
Leisen, B., & Vance, C. (2001). Cross-national assessment of service quality in the telecommunication industry: Evidence from the USA and Germany. Managing Service Quality, 11(5), 307-317.
Liang, D., Ma, Z., & Qi, L. (2012). Service quality and customer switching behavior in China's mobile phone service sector. Journal of Business Research.
Lim, H., Widdows, R., & Park, J. (2006). M-loyalty: Winning strategies for mobile carriers. Journal of Consumer Marketing, 23(4), 208-218.
Ling, C. E., & De Run, E. C. (2009). Satisfaction and loyalty: Customer perceptions of Malaysian Telecommunication service providers. The Icfai University Press, 6-18.
Liu, C. T., Guo, Y. M., & Lee, C. H. (2011). The effects of relationship quality and switching barriers on customer loyalty. International Journal of Information Management, 31(1), 71-79.
Lu, Y., Zhang, L., & Wang, B. (2009). A multidimensional and hierarchical model of mobile service quality. Electronic Commerce Research and Applications, 8(5), 228-240.
MacStravic, S. (1997). Questions of value in health care. Marketing Health Services, Chicago, 18(4), 50-3.
Maran K., Madhavi C. and Thilagavathi K. (2004), „Customer's Perception on Telephone: A Study with Special Reference to Chennai City‟, Journal of Marketing Management, ICFAI Press.
Marine Souheil and Blanchard Jean-Marie (2005), “Bridging the Digital Divide”,E-Business.
Mattsson, J. (1992), “A Service Quality Model Based On Ideal Value Standard”, International Journal of Service Industry Management, Vol. 3 No. 3: pp. 18-33.
McCaslin, Martin (2001), “Customer Loyalty is the Holy Grail for Insurance Businesses Today,” National Underwriter (Life & Health/Financial Services Edition), 50, 2001.
McDougall, G. H. G. & Levesque, T. (2000) "Customer Satisfaction with Services: Putting Perceived Value into the Equation." Journal of Services Marketing, 14(5): pp. 392-410.
McKenna, Regis (1991), Relationship Marketing : Successful Strategies for Age of the Customers, Addison Wesley Publishing Company.
McMullan, Rosalind and Audrey Gilmore (2003), “The Conceptual Development of Customer Loyalty Measurement: A Proposed Scale,” Journal of Targeting, Measurement & Analysis for Marketing, 11 (3), 230-243.
Mehta, S.C., Lalwani, A.K. and Han, S.L. (2000), “Service quality in retailing: relative efficiency of alternative measurement scales for different product-service environments”, International Journal of Retail & Distribution Management, Vol. 28 No. 2, pp. 62-72.
Melody .W.H. (1990), Communication policy in the global information economy. Whither the public interest? In M.Ferguson(ed) public communication; the new imperatives, pp.16-30.
Melody .W.H. (1994), “The information society; implications for economic institutions and market theory”. In E Comer (ed) , The global political economy of communication,pp.21-36.
Michael Meltzer (2005), “ are your customer profitable and segment your customer based on profitability.
Miettila, A. and Moller, K. (1990), “Interaction perspective into professional business services: a conceptual analysis”, paper presented at the Research Development on International Industrial Marketing and Purchasing, Milan.
Mobile Phone Survey. (2004). Au Ranks Highest in Customer Satisfaction with Mobile Telephone Service inJapan.
MoEA, 2007, Inward and Outward Direct Investment Statistics (December, 2007) (In Traditional Chinese), Investment Commission, Ministry of Economic Affairs, Taiwan. http://www.moeaic.gov.tw/system_external/home.html.
Morgan, R.M. and Hunt, S.D. (1994), “The commitment-trust theory of relationship marketing, Journal of Marketing, Vol.58, July, pp.20-30.
Motto (1990), “Privatization and Reorganization of Nippon telegraph and telephone” in in restructuring and managing the telecommunication sector, pp.67-69.
MTNL Report-1991.
Muhammad Asif Khan ( 2010) An Empirical Assessment of Service Quality of Cellular Mobile Telephone Operators in Pakistan, Asia social Science, Vol. 6, No. 10.
Mukherjee Arindham (2006), “Mobile service providers-perspective and Mpractice” , ICFAI University press.
Mutoh (1994), “The Database Revolution,” Target Marketing, May, pp. 14-18.
N.P. Singh and R.K. Gupta, “Use of Data Mining Tools”, Effective Executive, Nov. 2004, pg. 59-67.
Naidu, G.M., Atul Parvatiyar, Jagdish N. Sheth and Lori Westgate (1999). “Does Relationship Marketing Pay? An Empirical Investigation of Relationship Marketing Practices in Hospitals,” 46(3), pp. 207-218.
Narindar K Chhiber (2008) “Fast growth of mobile communication in india: lesson for emerging markets” excel books, new delhi.
National Telecom Policy (1999), Government of India.
Negi, R. (2009). Determining customer satisfaction through percieved service quality: A study of Ethiopian mobile users. International Journal of Mobile Marketing, 4(1), 31-38.
Negi, R., & Ketema, E. (2010). Relationship Marketing and customer loyalty: The Ethiopian mobile communication perspective. IJMM Summer, 5(3), 113-124.
Nerurkar, O. 2000. A preliminary investigation of SERVQUAL dimensions in India. Proceedings of the International Conference on Delivering Service Quality – Managerial Challenges for the 21st Century, New Delhi, 571-80.
O’Sullivan,E. & Rassel, G.R. ( 1999). Research methods for Public Administrators, New York, NY: Longman.
OECD (2007) “Mobile multiple play; new service pricing and policy implications,OECD digital economy papers no.126.
Oh, H. & Parks, S. C. (1997) "Customer Satisfaction and Service Quality: A Critical Review of the Literature and Research Implications for the Hospitality Industry." Hospitality Research Journal, 20(3): pp. 35-64.
Oh, H. (1999) “Service Quality, Customer Satisfaction and Customer Value: A Holistic Perspective”, International Journal of Hospitality Management, Vol. 18, pp. 67-82.
Oh, H. (1999), Store Image Issues in Retailing Literature: A Review and Discussion, Kyungsung University School of Business Administration, Pusan, available at: www.idrc.re.kr/data
Oliver R.L. (1980) “A Cognitive Model Of The Antecedents And Consequences Of Satisfaction Decisions”, Journal of Marketing Research 4: pp. 460–69.
Oliver, Richard L. (1999), “Whence Consumer Loyalty?” Journal of Marketing, 63, 33- 44.
Oliver, R. (1999) “Whence Consumer Loyalty”, Journal of Marketing, Vol. 63 No. 4: pp. 33-44.
Oliver, R.L. (1993) “A Conceptual Model of Service Quality and Service Satisfaction: Compatible Goals, Different Concepts”, in Swartz, T.A., Bowen, D.E. and
Brown, S.W. (Eds), Advances in Services Marketing and Management, Vol. 2, JAI Press, New York, NY: pp. 65-85.
Ozer, G., & Aydin, S. (2005). National customer satisfaction indices: an implementation in the Turkish mobile telephone market. Marketing Intelligence & Planning, 23(5), 486-504.
Parasuraman, A. Valari A. Zeithaml, and Leonard L. Berry. 1988. SERVQUAL: A multiple-item scale for measuring consumer perceptions of service quality. Journal of Retailing, (Spring), 12-40.
Parasuraman, A. 2000. “Technology Readiness Index (TRI): A Multiple Item Scale to Measure Readiness to Embrace New Technologies.” Journal of Services Research 2 (4): 307- 320.
Parasuraman, A. Valari A. Zeithaml, and Leonard L. Berry. 1985. A conceptual model of service quality and its implications for future research. Journal of Marketing, 49 (Fall), 41-50.
Parasuraman, A., Zeithaml, V. and Berry, L. (1991), “Refinement of expectations as a comparison standard in measuring service quality: implications for further research”, Journal of Retailing, Vol. 67 No. 4, pp. 420-50.
Parasuraman, A., Zeithaml, V.A. and Berry, L.L. (1988), “SERVQUAL: a multiple-item scale for measuring consumer perceptions of service quality”, Journal of Retailing, Vol. 64 No. 1, pp. 12-40.
Parasuraman, A., Zeithaml, V.A., Berry, L.L. (1985), "A conceptual model of service quality and its implications for future research", Journal of Marketing, Vol. 49 No.4, pp.41-50.
Peppers, Don and Martha Rogers (1993), The One to One Future Building Relationships One Customer at a Time, New York, NY: Doubleday.
Pezeshki, V., Mousavi, A., & Grant, S. (2009). Importance-performance analysis of service attributes and its impact on decision making in the mobile telecommunication industry. Measuring Business Excellence, 13(1), 82 - 92.
Philip, G. and Hazlett, S.A. (1997) “The Measurement of Service Quality: A New PC- P Attributes Model”, International Journal of Quality & Reliability Management, Vol. 14 No. 3: pp. 260-86.
Pizam, A. & Ellis, T. (1999) "Customer Satisfaction and Its Measurement in Hospitality Enterprises" International Journal of Contemporary Hospitality Management, 11(7): pp.326-339.
Prahalad, C.K., & Ramaswamy, V. (2000). Co-opting customer competencies. Harvard Business Review, 79-87.
Pratibha A Dabholkar (1995), “ A contingency Frame work for predicting causality between customer satisfaction and service quality,” Advances in consumer research , Vol.22, 1995 ; Pg.101- 108.
Rajan Bharti Mittal(2005),Joint Managing Director,Bharti televenture limited, Trends and Development, feb-15,2005.
Reichheld, F.F., & Sasser, W.E. (1990). Zero defections: quality comes to services. Harvard Business Review, 68, 301-7.
Rick Kazman (2008). “The Affective and Cognitive Impacts of Perceived Touch on Online Customers‟ Intention to Return in the Web-based eCRM environment,” Chapter 5.19 in S. A. Backer ed., Electronic Commerce: Concepts, Methodologies, Tools and Applications, Information Science Reference, 2008.
Robert C. Ford, Cherill P. Heaton, Stephen W. Brown (2001), “Delivering Excellent Service. Lessons From The Best Firms”, California Management Review, Vol. 44, No.1, Fall.
Rohit Prasad and V.Sridhar (2007), “Optimal number of mobile service provider in India: international journal of business data communications and networking, volume-4, issue-3, pg.no.69-88.
Rustr and Richard L. Oliver. 1994. Service quality: Insights and managerial implications from the frontier. In Service Quality: New Directions in Theory and Practice. Roland T. Rust and Richard L. Oliver (Eds.). New York: Sage Publications, Inc., 1-19.
Ruth N. Bolton (1991), „A Dynamic Model of the Duration of the Customer‟s Relationship with a Continuous Service Provider: The Role of Satisfaction‟, The Maryland Business School, University of Maryland.
Salegna, Gary J. and Stephen A. Goodwin (2005), “Consumer Loyalty to Service Providers: An Integrated Conceptual Model,” Journal of Consumer Satisfaction, Dissatisfaction and Complaining Behavior, 18, 51-67.
Sangani Priyanka (2005), “Cell commix” Mythology comes to the mobile”,Business Today, Feb., pg. 18.
Sangeetha, J. &Mahalingam, S. (2011) “Service Quality Models In Banking: A Review”,International Journal of Islamic and Middle Eastern Finance and Management, Vol. 4, Issue 1, pp. 83-103.
Santos, J. (2003) “E-Service Quality: A Model of Virtual Service Quality Dimensions”, Managing Service Quality, Vol. 13 No. 3, pp. 233-46.
Santouridis, I., & Trivellas, P. (2010). Investigating the impact of service quality and customer satisfaction on customer loyalty in mobile telephony in Greece. The TQM Journal, 22(3), 330 - 343.
Schumacker, R. E., & Lomax, R. G. (2004). A beginner's guide to structural equation modeling. Mahwah, New Jersey: Lawrence Erlbaum Associates, Inc.
Schumacker, Randall E. & Richard G. Lomax, (1996) A Beginner’s Guide to Structural Equation Modeling, Mahwah, NJ: Earlbaum Associates.
Selnes, F. (1993) “An Examination of the Effect of Product Performance on Brand Reputation, Satisfaction and Loyalty”, European Journal of Marketing, 27(9): pp. 19-35.
Senthikumar, N. & Arulraj, A. (2011), SQM-HEI determination of service quality measurement of higher education in India, Journal of Modelling in Management, 6(1), 60-78.
Seth et al (2008), “Managing customer perceived service quality for cellular mobile telephony; an empirical investigation” Vikalp.2008.
Seyed Yaghoub Hosseini, Manijeh Bahreini Zade, Alireza Ziaei Bideh (2013) Providing a Multidimensional Measurement Model for Assessing Mobile Telecommunication Service Quality (MS-Qual), Iranian Journal of Management Studies (IJMS) Vol.6, No.
Shanthi N.M. (2005), “Effectiveness of Predictive Churn Models for sustaining market share in telecom industry –An Appraisal”, ICFAI Journal of Services Marketing, September 2005.
Shapiro, B.P. and R.S. Posner (1979), “Making the Major Sale”, Harvard Business Review (March- April), pp. 68-79.
Sharma, Alka, Versha Mehta. (2004), Service Quality in Financial Services – A case study of Banking Services, Journal of Services Research, 4(2) 205-222.
Sheth, Jagdish N. and Rajendra S. Sisodia (1995), “Improving Marketing Productivity”, in Encyclopedia of Marketing in the year 2000. J. Heilbrunn,Ed., Chicago, IL: American Marketing Association/NTC Publishing.
Shikha Oja (2009), “Customer awareness of VAS of telecom sector of India”, The ICFAI University, Journal of Infrastructure,pp;1-14.
Shin, D. H., & Kim, W. Y. (2008). Forecasting customer switching intention in mobile service: An exploratory study of predictive factors in mobile number portability. Technological Forecasting and Social Change, 75(6), 854-874.
Shukla P (2004)“Effect of Product Usage, Satisfaction and Involvement on Brand Switching Behaviour”, Asia Pac. J. Mark., Log., 16(4): pp.82-104.
Shymal Ghosh (2003), “The Resurging Telecom Sector”, pib.nic.in, April.
Sigala, M. (2006). Mass customization implementation models and customer value in mobile phones services: Preliminary findings from Greece. Managing Service Quality, 16(4), 395-420.
Singh BK & Kuhad RC (1999) Biodegradation of lindane by the white-rot fungus Trametes hirsutus. Lett Appl Microbiol 28: 238–241.
Singh J &Sirdeshmukh D, (2000)“Agency and Trust Mechanisms in Consumer Satisfaction snd Loyalty Judgements”, J. Acad. Mark. Sci., 28(1): pp. 150-167.
Smith A.K. and Bolton R.N. (1998) "An Experimental Investigation of Customer Reactions to Service Failures: Paradox or Peril?" Journal of Service Research, Vol 1 No 1, pp. 65-81
Soteriou, A.C. & Stavrinides, Y. (2000) “An Internal Customer Service Quality Data Envelope Analysis Model for Bank Branches”, International Journal of Bank Marketing, Vol. 18 No. 5: pp. 246-52.
Souki, G.Q., & Filho, C.G. (2008). Perceived quality, satisfaction and customer loyalty: an empirical study in the mobile phones sector in Brazil. International Journal of Internet and Enterprise Management, 5(4), 298 – 312.
Spreng, R.A. & Mackoy, R.D. (1996) “An Empirical Examination of a Model of Perceived Service Quality and Satisfaction”, Journal of retailing, Vol. 722: pp. 201-14.
Spreng, R.A., A.K. Singh. (1993). An empirical assessment of the SERVQUAL scale and the relationship between service quality and satisfaction. in Cravens, D.W. and Dickson, P. (Eds), Enhancing Knowledge Development in Marketing, American Marketing Association, Chicago, IL, 1-6.
Stafford, M.R., Stafford, T.F., & Wells, B.P. (1998). Determinants of service quality and satisfaction in the auto casualty claims process. Journal of Services Marketing, 12(6), 426-40.
Stanton, Etzel & Walker (1994). Advertising, personal selling and sales promotion (p 456).
Stephen M. Watters, The New Telephony – Technology, Convergence, Industry Collision, Prentice Hall PTR, NJ07458.
Stone, M., Woodcock, N. and Machtynger, L. (2000) Customer Relationship Marketing: Get To Know Your Customers And Win Their Loyalty, 2nd ed., London: Kogan Page Publishers.
Storbacka, Kaj (2000), “Customer Profitability: Analysis and Design Issues”, in Handbook of Relationship Marketing,Jagdish N. Sheth and Atul Parvatiyar, Eds., Thousand Oaks, CA: Sage Publications, pp. 565-586.
Sukumar. (2007). A study of consumers preference and satisfaction towards various cell phone service providers.
Sureshchandar, G.S., Rajendran, C., & Anantharaman, R.N. (2002). Determinants of customer perceived service quality: a confirmatory factor analysis approach. Journal of Services Marketing, 16(1), 9-34.
Survey. (2008). Virgin Mobile tops regulator’s service benchmark: Survey.
Sutherland, E. (2007). The regulation of the quality of service in mobile networks. Info, 9(6), 17-34.
Swadeshkumar Samanta (2007), “Impact of price on mobile subscription and revenue”, Dept. of computing and electronic systems, University of essex, Colchester,UK.
Sweeney, J.C., Soutar, G.N. & Johnson, L.W. (1997) “Retail Service Quality and Perceived Value”, Journal of Consumer Services, Vol. 4 No. 1: pp. 39-48.
T.V.Ramchandran (2005), Director-Genaral, Cellular operators association of india, Trends and Development, may-15, 2005.
Tate, R. (1998). An introduction to modeling outcomes in the behavioral and social sciences. Boston, MA: Pearson Custom Publishing.
Tate, R. (1998). An introduction to modeling outcomes in the behavioral and social sciences. Boston, MA: Pearson Custom Publishing.
Taylor, S.A., & Baker, T.L. (1994). An assessment of the relationship between service quality and customer satisfaction in the formation of consumers’ purchase intentions. Journal of Retailing, 70(2), 163-78.
Teas, K.R. (1993): “Expectations, performance evaluation, and consumers’ perceptions of quality”, Journal of Marketing, Vol. 57: pp. 18-34.
Teas, R. K. (1994) "Expectations As A Comparison Standard in Measuring Service Quality: An Assessment of A Reassessment." Journal of Marketing.58 (1): pp. 132-140.
Tyran, C.K., & Ross, S.C. (2006). Service quality expectations and perceptions: use of the SERVQUAL instrument for requirements analysis. Issues in Information Systems, 7(1), 357-62.
Van der Wal, R.W.E., Pampallis, A., & Bond, C. (2002). Service quality in cellular telecommunications company: a South-African experience. Managing Service Quality, 12(5), 323-35.
Vargo, Stephen L. and Robert F. Lusch (2004a), “Evolving to a New marketing strategy,” Journal of management and research.
Vavra, Terry G. (1992), after marketing: How to Keep Customers for Life through Relationship Marketing, Homewood, IL: Business One-Irwin.
Vazquez, Rodolfo, Ignacio A. Bosque, Ana M. Diaz, Agustin V. Ruiz. (2001). Service quality in supermarket retailing: identifying critical service experiences. Journal of Retailing and Consumer Services, 8 1-14
Vikas sinh and chintaganta (1994), “Strengthening the Satisfaction-Profit Chain,” Journal of Service Research, 3 (2), 107-120.
Virat Bahri (2006), “The Database Revolution,” Target Marketing, May, pp. 14-18.
VSNL 16th annual report 2002, (Government of India).
Wang, Y., & Lo, H. -P. (2002). Service quality, customer satisfaction and behavior intentions: Evidence from China‟s telecommunication industry. Info, 4(6), 50-60.
Wang, Y., & Lo, H. -P. (2002). Service quality, customer satisfaction and behavior intentions: Evidence from China’s telecommunication industry. Info, 4(6), 50-60.
Wang, Y., & Lo, H.P. (2000). Service quality, customer satisfaction and behavior intentions. Info, 4(6), 50-60.
Ward, K.E., & Mullee, A.W. (1997). Quality of Service in Telecommunications. The Institution of Electrical Engineers Press, Stevenage.
Wilska(2001), “ New technology and young people‟s consumer identities; Acomparative study between Finland and Brazil” – Seniar researcher in economic sociology at the Turku School of economics, Finland.
Wong, K. K. K. (2010). Fighting churn with rate plan right-sizing: A customer retention strategy for the wireless telecommunications industry. The Service Industries Journal, 30(13), 2261-2271.
World telecommunication development report 2002.
Yip, George S. and Tammy L. Madsen (1996), “Global Account Management:The Frontier in Relationship Marketing,” International Marketing Review,13(3), pp. 24-42.
Zhao, L., Lu, Y., Zhang, L., & Chau, P. Y. K. (2012). Assessing the effects of service quality and justice on customer satisfaction and the continuance intention of mobile value-added services: An empirical test of a multidimensional model. Decision Support Systems, 52(3), 645-656.
Zhao, Y., Pugh, K., Sheldon, S., & Byers, J. (2002). Conditions for Classroom Technology Innovations. Teachers College Record, 104 (3).
Zhu, F.X., Wymer, W.J. & Chen, I. (2002) “IT-Based Services And Service Quality In Consumer Banking”, International Journal of Service Industry Management, Vol. 13 No. 1: pp. 69-90.
Appendices
Questionnaire
English
A Study on Service loyalty on Mobile communication Industry in India
Research scholar Research GuideK.Keerthi Dr.A.ARULRAJ, R.S.Govt .College, Thanjavur
Questionnaire
This questionnaire seeks your expectations and Perceptions on what makes an excellent Telecommunication network Satisfaction. Thank you for your assistance as this survey will allow us to understand your needs and improving the delivery to your satisfaction. This questionnaire is voluntary; all replies are confidential and anonymous. The research work carried for the purpose of academic development and not for any others. Please indicate by circling the appropriate level of Satisfaction for the factors mentioned below.
1. Highly dissatisfied 2.Dissatisfied 3.Some what ok 4.Undesired 5.Some what satisfied
Brand Switching Attitude & MNP 38. For Network failure. (1) (2) (3) (4) (5) (6) (7)39. For call service failure. (1) (2) (3) (4) (5) (6) (7)40. For message failure. (1) (2) (3) (4) (5) (6) (7)41. For technology failure. (1) (2) (3) (4) (5) (6) (7)42. For tariff system. (1) (2) (3) (4) (5) (6) (7)43. Rate cutters and recharge. (1) (2) (3) (4) (5) (6) (7)44. For poor customer care. (1) (2) (3) (4) (5) (6) (7)45. Mobile number Portability facility. (1) (2) (3) (4) (5) (6) (7)46. Promotional Calls & SMS disturbing me to
change.
Service Loyalty S Disagree S Agree 47. I will continue my existing service network in
future. (1) (2) (3) (4) (5) (6) (7)
48. I will suggest to my other family member. (1) (2) (3) (4) (5) (6) (7)49. I will recommend to my friends & colleagues. (1) (2) (3) (4) (5) (6) (7)50. Some time Introduction MNP induces me to
change the provider. (1) (2) (3) (4) (5) (6) (7)
Personal Information
1) Name : 2) Age : 3) Sex : (a) Male (b) Female 4) Religion : (a) Hindu (b) Muslim (c) Christian 5) Community : (a) BC (b) MBC (c) SC 6) Education