166
Doctoral thesis EXPLORING THE MECHANISM OF ACTION OF HUMAN ANTIMICROBIAL RIBONUCLEASES VIVIAN ANGÉLICA SALAZAR MONTOYA Barcelona, 2015

Doctoral thesis
EXPLORING THE MECHANISM OF
ACTION OF HUMAN ANTIMICROBIAL
RIBONUCLEASES
VIVIAN ANGÉLICA SALAZAR MONTOYA
Barcelona, 2015


EXPLORING THE MECHANISM OF
ACTION OF HUMAN ANTIMICROBIAL
RIBONUCLEASES
Tesis presentada por Vivian Angélica Salazar Montoya para optar al grado de
Doctor en Bioquímica y Biología Molecular.
Dirección de Tesis:
Dra. Ester Boix y Dr. Mohamed Moussaoui
Dra. Ester Boix Borras Dr. Mohamed Moussaoui Vivian A. Salazar M
Departamento de Bioquímica y Biología Molecular Facultad de Biociencias Cerdanyola del Vallès
Barcelona, España 2015


List of papers included in the thesis Protein post-translational modification in host defence: the antimicrobial mechanism of action of human eosinophil cationic protein native forms. Salazar VA, Rubin J, Moussaoui M, Pulido D, Nogués MV, Venge P and Boix E. (2014). FEBS Journal 281 (24): 5432–46 Human secretory RNases as multifaceted antimicrobial proteins. Exploring RNase 3 and RNase 7 mechanism of action against Candida albicans. Salazar VA, Arranz J, Navarro
S, Sánchez D, Nogués MV, Moussaoui M and Boix E. Submitted to Molecular Microbiology List of other papers related to the thesis Structural determinants of the eosinophil cationic protein antimicrobial activity. Boix E, Salazar VA, Torrent M, Pulido D, Nogués MV, Moussaoui M. (2012). Biological Chemistry 393 (8):801-815. “Searching for heparin Binding Partners” in Heparin: Properties, Uses and Side effects. Boix E, Torrent M, Nogués MV, Salazar V. Nova Science Publisher (2012): 133-157. Related structures submitted to the Protein Data Bank 4OXF Structure of ECP in complex with citrate ions at 1.50 Å 4OWZ Structure of ECP/H15A mutant


GENERAL INDEX
ABBREVIATIONS.......................................................................................................... i
RESUMEN ...................................................................................................................... ii
SUMMARY .................................................................................................................... iv
1. INTRODUCTION ...................................................................................................... 1
1.1 THE RNASE A SUPERFAMILY ...................................................................... 1
Catalytic properties of RNase A superfamily ........................................................... 3
Substrate binding sites of RNase A ........................................................................... 5
THE EIGHT HUMAN ‘‘ CANONICAL” RIBONUCLEASES ...................................................... 6
1.1.1 RNase 1, Human Pancreatic Ribonuclease ..................................................... 6
1.1.2 RNase 2, the Eosinophil Derived Neurotoxin (EDN) ................................... 6
1.1.3 RNase 3, the Eosinophil Cationic Protein (ECP) ...................................... 10
1.1.3.1 RNase 3/ECP antiparasitic activity......................................................... 11
1.1.3.2 RNase 3/ECP antibacterial activity ........................................................ 12
1.1.3.3 RNase 3/ECP activity in host tissues and in eukaryotic cells............... 15
1.1.3.4 RNase 3/ECP diversity: Polymorphism and post-translational
modifications ...................................................................................................... 15
1.1.4 RNase 4 ....................................................................................................... 17
1.1.5 RNase 5, Angiogenin .................................................................................. 18
1.1.6 RNase 6, RNase k6 ..................................................................................... 19
1.1.7 RNase 7, Skin derived RNase ..................................................................... 19
1.1.8 RNase 8, the placental RNase .................................................................... 20
RIBONUCLEASES INVOLVED IN HOST DEFENCE ........................................... 22
1.2 EOSINOPHILS AND THEIR GRANULE PROTEINS ................................. 24
1.2.1 Degranulation in human eosinophils ............................................................ 27
1.3 ANTIMICROBIAL PEPTIDES ..................................................................... 27
General mechanism of action ................................................................................. 29
1.3.1 Antimicrobial peptides and proteins with celullar uptake properties ........ 31
1.3.2 Cell penetrating Pancreatic-type ribonucleases ........................................... 31

1.4 CANDIDA ALBICANS GENERAL FEATURES ........................................... 32
2.AIMS OF THE THESIS ........................................................................................... 34
3. MATERIALS AND METHODS ............................................................................. 35
MATERIALS ................................................................................................................. 35
3.1 METHODS OF EXPRESSION AND PURIFICATION OF RECOMBINANT .. 37
PROTEINS ................................................................................................................. 37
3.1.1 Expression of recombinant proteins in E.coli ............................................... 37
3.1.1.1 Media preparation ................................................................................... 37
3.1.1.2 Expression .............................................................................................. 37
3.1.1.3 Protein purification ................................................................................. 38
3.1.2 Expression and purification of RNase 8 ........................................................ 40
3.1.2.1 RNase 8 gen cloning into the pET-45b(+) vector .................................. 40
3.1.2.2 Expression of the His-tagged RNase 8 ................................................... 42
3.1.2.3 Purification of the His-tagged RNase 8 .................................................. 42
3.1.2.4 His-tag removal and purification of RNase 8 ........................................ 44
3.1.3 SDS- polyacrylamide gel electrophoresis...................................................... 44
3.1.4 SDS-PAGE and activity staining gels (Zymogram) ....................................... 47
3.2 METHODS FOR EVALUATION OF ANTIMICROBIAL ACTIVITY ............. 49
3.2.1 Minimum Bactericidal Concentration (MBC) ............................................... 49
3.2.2 Minimal agglutination concentration (MAC) ................................................ 49
3.2.3 Bacteria Viability Assay (IC50) ...................................................................... 50
3.2.4 Bacteria cell leakage assay ........................................................................... 51
3.2.5 Bacteria Cytoplasmic Membrane-depolarization Assay ............................... 51
3.2.6 Lipopolysaccharide Binding Assay ............................................................... 52
3.3 METHODS FOR ACTIVITY EVALUATION IN MODEL MEMBRANES ...... 53
3.3.1 Liposome preparation ................................................................................... 53
3.3.2 Liposome aggregation ................................................................................... 54
3.3.3 Liposome Leakage Assay ............................................................................... 54
3.3.3.1 Tb3+ / Dipicolinic acid (DPA) assay ...................................................... 54
3.3.3.2 ANTS/DPX assay ................................................................................... 55
3.3.3.3 Dextran assay .......................................................................................... 56
3.4 MICROSCOPY METHODS ................................................................................ 57
3.4.1 Confocal microscopy ..................................................................................... 57
3.4.1.1 Protein labelling ...................................................................................... 57

3.4.2 Kinetic of yeast survival by Confocal Microscopy ........................................ 58
3.4.3 Scanning electron microscopy (SEM) ........................................................... 59
3.4.4 Transmission Electron Microscopy (TEM) ................................................... 60
3.5 FLOW CYTOMETRY ......................................................................................... 61
3.6. RNA EXTRACTION AND QUANTIFICATION.............................................. 61
3.7.1 Analysis of the contribution of posttranslational modifications of RNase
3/ECP native forms in antimicrobial activity ......................................................... 63
3.7.1.1 Minimum bactericidal concentration (MBC100) ..................................... 63
3.7.1.2 Minimum agglutination concentration (MAC)....................................... 63
3.7.1.3 Bacteria Viability Assay ......................................................................... 63
3.7.1.4 Bacteria cell leakage assay ..................................................................... 63
3.7.1.5 Bacteria Cytoplasmic Membrane-depolarization assay ......................... 64
3.7.1.6 LPS Binding Assay ................................................................................. 64
3.7.1.7 Liposome Leakage Assay ....................................................................... 65
3.7.1.8 Liposome aggregation ............................................................................ 65
3.7.2 Analysis of the antifungal activity of RNase 3/ECP and RNase 7. Candida
albicans as an eukaryotic pathogen model ............................................................. 65
3.7.2.1 Candida albicans and growth conditions ............................................... 65
3.7.2.2 Minimum Fungicidal Concentration (MFC) .......................................... 65
3.7.2.3 Viability assay (IC50) .............................................................................. 66
3.7.2.4 Agglutination activity toward C. albicans .............................................. 66
3.7.2.5 Cell membrane-depolarization assay ...................................................... 67
3.7.2.6 Cell cytoplasmic membrane permeation ................................................ 67
3.7.2.7 Kinetics of cell-survival.......................................................................... 67
3.7.2.8 Kinetics of cell-survival by Confocal Microscopy ................................. 68
3.7.2.9 Flow cytometry ....................................................................................... 69
3.7.3 Exploring RNase 8 structure-function. Design of a new expression protocol
and functional characterization ............................................................................. 69
3.7.3.1 Dynamic light scattering (DLS) ............................................................. 69
3.7.3.2 Quantitative determination of free sulfhydryl (-SH) groups .................. 69
3.7.3.3 Characterization of RNase 8 activity ...................................................... 71
3.7.3.3.1 SDS-PAGE and activity staining gel (Zymogram) ........................ 71
3.7.3.3.2 Analysis of the digestion products of poly(C) ................................ 71

3.7.3.3.3 Analysis of the digestion products of the pentacytidylic acid
(Cp)4C>p ........................................................................................................ 72
3.7.3.4 RNase 8 antibacterial activity characterization ...................................... 74
3.7.3.4.1 Minimum Bactericidal Concentration (MBC) .............................. 74
3.7.3.4.2 Bacteria viability assays ( IC50) ...................................................... 74
3.7.3.4.3 Agglutination activity ..................................................................... 74
3.7.3.4.4 Scanning electron microscopy (SEM) ........................................... 75
3.7.3.4.5 Transmission Electron Microscopy (TEM) ................................... 75
3.7.3.4.6 Bacterial cytoplasmic membrane-depolarization assay ................ 76
3.7.3.4.7 Permeabilization of microbial membranes .................................... 76
3.7.3.5 Liposome aggregation ............................................................................ 76
3.7.3.6 Liposome Leakage .................................................................................. 77
DPA/Tb3+ assay ............................................................................................. 77
ANTS/DPX assay .......................................................................................... 77
4. RESULTS .................................................................................................................. 78
4.1 ANALYSIS OF THE CONTRIBUTION OF POST-TRANSLATIONAL MODIFICATIONS OF
RNASE 3/ECP NATIVE FORMS IN ANTIMICROBIAL ACTIVITY . ...................................... 78
4.1.1 Antimicrobial activity of native RNase 3/ECP forms .................................... 78
4.1.2 Action at the bacterial envelope .................................................................... 79
4.1.2.1 Agglutination activity ............................................................................. 79
4.1.2.2 Lipopolysaccharide binding activity ...................................................... 80
4.1.3 Action at the bacterial cytoplasmic membrane ............................................. 80
4.1.4 Mechanism of action on model membranes .................................................. 82
4.1.4.1 Membrane leakage activity ..................................................................... 82
4.1.4.2 Liposome agglutination activity ............................................................. 84
4.2 ANALYSIS OF THE ANTIFUNGAL ACTIVITY OF RNASE 3/ECP AND RNASE 7.
CANDIDA ALBICANS AS AN EUKARYOTIC PATHOGEN MODEL. ........................................ 86
4.2.1 Design and characterization of active site mutants. ..................................... 86
4.2.2 Analysis of the membrane binding mutant. ................................................... 89
4.2.3 Antifungal activity and aggregation ability on Candida albicans ................. 90
4.3 EXPLORING RNASE 8 STRUCTURE-FUNCTION. DESIGN OF A NEW EXPRESSION
PROTOCOL AND FUNCTIONAL CHARACTERIZATION. ................................................... 105
4.3.1 RNase 8 expression and purification ........................................................... 105
4.3.1.1 Affinity chromatography ...................................................................... 105

4.3.1.2 Gel filtration chromatography .............................................................. 107
4.3.1.3 Reverse-phase chromatography ............................................................ 108
4.3.1.4 Removal of N-terminus His6 tag by Enterokinase................................ 109
4.3.1.5 Affinity chromatography ...................................................................... 109
4.3.1.6 Reverse-phase chromatography ............................................................ 110
4.3.2 RNase 8 characterization ............................................................................ 112
4.3.2.1 Dynamic light scattering analysis (DLS).............................................. 112
4.3.2.2 Protein modelling studies ..................................................................... 113
4.3.2.3 Determination of free sulfhydryl (-SH) groups by computational
prediction .......................................................................................................... 114
4.3.2.4 Quantitative determination of free sulfhydryl (-SH) groups in RNase 8
.......................................................................................................................... 116
4.3.2.5 RNase activity characterization ............................................................ 117
4.3.2.5.1 Staining activity gel ...................................................................... 117
4.3.2.5.2 Poly(C) cleavage pattern by RNase 8 ........................................... 118
4.3.2.5.3 Substrate cleavage pattern by RNase 8 ........................................ 120
4.3.3 RNase 8 antibacterial activity characterization .......................................... 123
4.3.3.1 Bactericidal and aggregation activities. ................................................ 123
4.3.3.2 Electron microscopy ............................................................................. 124
4.3.3.3.1 Depolarization assay .......................................................................... 126
4.3.3.3.2 Bacteria cell membrane permeabilization ......................................... 127
4.3.3.4 Activity on model membrane ............................................................... 128
4.3.3.4.1 Liposome agglutination activity ................................................... 128
4.3.3.4.2 ANTS/DPX and Terbium/DPA Liposome Leakage Assay .......... 129
5. DISCUSSION AND FUTURES PERSPECTIVES ............................................. 132
5.1 Analysis of the contribution of posttranslational modifications of RNase 3/ECP
native forms in antimicrobial activity. .................................................................. 132
5.2 Analysis of the antifungal activity of RNase 3/ECP and RNase 7. Candida
albicans as an eukaryotic pathogen model........................................................... 135
5.3 Exploring RNase 8 structure-function. Design of a new expression protocol
and functional characterization. .......................................................................... 138
6. CONCLUSIONS ..................................................................................................... 144
7. ACKNOWLEDGMENTS ...................................................................................... 148
8. REFERENCES ....................................................................................................... 150

Protein post-translational modification in host defence: the antimicrobial mechanism of
action of human eosinophil cationic protein native forms............................................167
Human secretory RNases as multifaceted antimicrobial proteins. Exploring RNase 3 and
RNase 7 mechanism of action against Candida albicans. ..........................................182
Structural determinants of the eosinophil cationic protein antimicrobial activity …..219
Searching for heparin Binding Partners.......................................................................241

INDEX FIGURES
Figure 1: RNase A ............................................................................................................ 1
Figure 2: Phylogenetic tree and primary sequence alignment of the human RNases. ..... 2
Figure 3: Transphosphorylation and hydrolysis reactions catalysed by RNase A. ......... 3
Figure 4: Schematic representation of RNase A substrate-binding sites.......................... 5
Figure 5: Structural determinants of RNase 3/ECP involved in biological activities. ... 11
Figure 6: RNase 3/ECP mechanism on lipid vesicles. ................................................... 15
Figure 7: RNase 3/ECP gene structure showing exons and introns organization. ........ 16
Figure 8: Disulphide bonds in human RNase 8 and its variants, predicted by DiANNA
(A) and DISULFIND (B). .............................................................................................. 22
Figure 9: Schematic representation of the potential mechanisms of action for the
RNases in host defence. .................................................................................................. 23
Figure 10: The eosinophil. .............................................................................................. 24
Figure 11: Schematic summary of Eosinophil and granule proteins. ............................. 25
Figure 12: Membrane pore-forming mechanisms by α-helical antimicrobial peptides. 30
Figure 13: RNase 8 gene cloning ................................................................................... 41
Figure 14: Reduction of Ellman’s reagent ...................................................................... 70
Figure 15: Profile comparison of DOPC/DOPG liposome leakage process as a function
of time for encapsulated MW markers. .......................................................................... 83
Figure 16: Liposome agglutination by recombinant and native RNase 3/ECP forms... 84
Figure 17: Liposome leakage and aggregation activities of recombinant RNase 3/ECP.
........................................................................................................................................ 85
Figure 18: RNase activity of RNase 3/ECP, RNase 7 and mutants .............................. 86
Figure 19: RNase 3/ECP and RNase 3-H15A activities in model membrane................ 88
Figure 20: RNase 7 and RNase 7-H15A activities in model membrane. ....................... 89
Figure 21: RNase3/ECP surface molecular representation. ........................................... 90
Figure 22: Kinetic Candida albicans profile after protein incubation. .......................... 93
Figure 23: Fluorescence microscopy of C. albicans treated with RNase 3/ECP and
RNase 3 H15A. ............................................................................................................... 96
Figure 24: Effects of RNase 7, RNase 7-H15A, RNase 3/ECP, RNase 3-H15A and
RNase 3-W15A (A-E) on C. albicans. .......................................................................... 98

Figure 25: Fluorescence signal distribution in Candida albicans yeast culture after
protein addition. .............................................................................................................. 99
Figure 26: Confocal microscopy analysis of Candida cell culture incubated with RNase
3/ECP, 7 and active site mutants labelled with alexa fluor 488. .................................... 99
Figure 27: Histogram of C. albicans distribution treated with RNase 3/ECP-Alexa
Fluor. ............................................................................................................................ 100
Figure 28: Protein uptake and cytotoxicity measured by flow cytometry. ................... 101
Figure 29: Protein localization and cytotoxicity measured by flow cytometry. ........... 102
Figure 30: Effect of RNase 3/ECP and mutants on C. albicans cellular RNA. .......... 103
Figure 31: Ni2+ affinity chelating chromatography on HisTrap HP column for the
purification of His-tagged RNase 8. ............................................................................. 106
Figure 32: 15% SDS-PAGE electrophoresis. ............................................................... 107
Figure 33: RNase 8 His-tag gel filtration chromatography column. ........................... 108
Figure 34: Reverse-phase chromatography: Elution profile of His-tag RNase 8. ........ 109
Figure 35: Ni2+ affinity chelate chromatography on HisTrap HP column for the
separation of RNase 8 and His-tagged RNase 8. .......................................................... 110
Figure 36: Reverse-phase chromatography. Elution profile of RNase 8. ..................... 111
Figure 37: Analysis by SDS-PAGE of the Histidine tag removal and RNase 8
purification. .................................................................................................................. 111
Figure 38: Analysis of the RNase 8 solution by dynamic light scattering (DLS). ....... 112
Figure 39: Aggregation regions in RNase A, RNase 3/ECP, RNase 7 and RNase 8. .. 114
Figure 40: Blast alignment of RNase 7 and RNase 8 sequences. ................................. 115
Figure 41: Computational prediction of disulphide bonds pairing in RNase 8. ........... 116
Figure 42: RNase activity staining on gels containing either poly(C) or poly(U) as
substrates. ..................................................................................................................... 118
Figure 43: Analysis by reverse-phase HPLC column (Nova-Pak C column). ........... 119
Figure 44: Distribution of products formed by the initial cleavage of (Cp)4C>p. ....... 121
Figure 45: Tetranucleotide/dinucleotide ratio for the cleavage of the pentacytidylic acid
substrate (Cp)4C>p by RNase A and RNase 8. ............................................................ 122
Figure 46: RNase 8 effect on E.coli cells analysed by TEM. ....................................... 125
Figure 47: RNase 8 effect on E.coli cells analysed by SEM. ....................................... 126
Figure 48: RNase 8 depolarization ability on E.coli. ................................................... 127
Figure 49: Membrane activity of RNase 8 by SYTOX Green® /DNA binding dye assay
for membrane permeabilization. ................................................................................... 128

Figure 50: Quantification of liposome aggregation by RNase 8. ................................. 129
Figure 51: RNase 8 leakage activity by monitoring the release of ANTS/DPX liposome
content. ......................................................................................................................... 130
Figure 52: Model showing the location of putative ECP N-glycosylation.................. 134
Figure 53: Timing of main events after RNase 3/ECP and RNase 7 addition. ............ 136
Figure 54: Computational prediction of disulphide bonds reshuffling in RNase 8. ..... 140


INDEX TABLES
Table 1: Summary of catalytic activity of Human RNases .............................................. 4
Table 2: Antimicrobial activity and other biological properties of RNase A family
members. .......................................................................................................................... 7
Table 3: Summary of RNase 3/ECP antibacterial activity and derived peptides. .......... 13
Table 4: Structural classification and sequences of host-defence peptides. ................... 28
Table 5: Comparison of recombinant and native RNase 3/ECP forms. ......................... 79
Table 6: Comparison of LPS binding by recombinant and native RNase 3/ECP ......... 80
forms. .............................................................................................................................. 80
Table 7: Comparison of membrane destabilization activities of recombinant and ........ 81
native RNase 3/ECP forms. ............................................................................................ 81
Table 8: Membrane leakage activity assayed using DOPC/DOPG liposome
encapsulated markers of distinct MW (Tb3+, ANTS and 3kDa Dextran). ..................... 83
Table 9: Antibacterial activities of RNase 3/ECP, RNase 7 and H15A mutants ........... 87
Table 10: Antifungal and cell agglutinating activities of RNase 7, RNase 7-H15A, .... 92
RNase 3/ECP, RNase 3-H15A and RNase 3-W35A on Candida albicans. .................. 92
Table 11: Membrane-depolarization and permeabilization activities on Candida......... 94
albicans. .......................................................................................................................... 94
Table 12: Comparison of timing for all proteins tested at 1 µM final concentration. .... 95
Table 13: Molar ratio TNB/RNase 8. ........................................................................... 117
Table 14: Antibacterial activities of RNase 8 against E.coli, S. aureus A. baumannii and
M. luteus. ...................................................................................................................... 124
Table 15: Aggregation activity of RNases on E.coli, S. aureus A. baumannii and M. 124
luteus ............................................................................................................................. 124
Table 16: Leakage activity of RNase 8 ........................................................................ 131


i
ABBREVIATIONS
ANG Human Angiogenin
AMPs Antimicrobial peptides
APS Ammonium persulfate
DOPC Dioleoyl phosphatidylcholine
DOPG Dioleoyl phosphatidylglycerol
DPA Dipicolinic acid
dsRNA Double-stranded ribonucleic acid
ECP Eosinophil Cationic Protein
EDN Eosinophil derived neurotoxin
EPO Eosinophil peroxidase
IL Interleukin
IAA Isoamyl alcohol
kDa Kilodalton
LPS Lipopolysaccharide
MBP Major Basic Protein
MW Molecular weight
PDB Protein Data Bank
PGN Peptidoglycans
RNase Ribonuclease
RNase A Bovine pancreatic ribonuclease
RNase 1 Human pancreatic ribonuclease
SDS Sodium dodecyl sulfate
SDS-PAGE Sodium dodecyl sulphate polyacrylamide gel electrophoresis
TEMED N,N,N',N'-tetramethylethane-1,2-diamine
TFA Trifluoroacetic acid


ii
RESUMEN
Las ribonucleases humanas son un grupo heterogéneo de proteínas pertenecientes a la
superfamilia de la Ribonucleasa A. Estas proteínas se caracterizan por su capacidad de
hidrolizar ácidos ribonucleicos y por la presencia de actividad antimicrobiana frente
diversos organismos patógenos como bacterias, hongos, parásitos y virus. Estudios
previos desarrollados en nuestro grupo de investigación han determinado y
caracterizado la actividad antimicrobiana que posee la Ribonucleasa 3, o Proteína
Catiónica de Eosinófilos (ECP), recombinante frente a bacterias Gram-positivo y Gram-
negativo.
El primer objetivo del presente estudio doctoral se centra en la caracterización de la
actividad antimicrobiana y en modelos de membrana de las formas nativas de la
ribonucleasa 3 purificadas a partir de eosinófilos. Las distintas formas nativas presentan
modificaciones postraduccionales dadas por diversos grados de glicosilación que se
correlacionan con la activación de los eosinófilos durante los procesos inflamatorios.
Las fracciones purificadas muestran diferentes grados de glicosilacion que se relacionan
con su maduracion en los gránulos secundarios. Los resultados indican que las
modificaciones post-transduccionales modulan su actividad biológica. El estudio
establece la capacidad antimicrobiana de las formas nativas y su actividad en modelos
de membrana.
Por otra parte, el incremento de enfermedades de etiología infecciosa, el desarrollo de
mecanismos de evasión de la respuesta inmune del huésped y el aumento de resistencia
a los antibióticos y antimicóticos convencionales, hace necesaria la búsqueda de
terapias alternativas. Tanto la proteína catiónica de eosinófilos o RNase 3 como la
ribonucleasa derivada de piel o RNasa 7, presentan actividad antimicrobiana frente
diversos patógenos. Como segundo objetivo de esta tesis, se evaluó por primera vez en
nuestro grupo de investigación la actividad antimicótica de las ribonucleasas 3 y 7
frente al hongo Candida albicans, el cual fue elegido como modelo patógeno eucariota.

iii
Se determinó y caracterizó la presencia de actividad anti-candida por parte de ambas
ribonucleasas humanas. Asi mismo, se analizaron los respectivos mutantes del centro
activo, carentes de actividad catalítica y un mutante de la ribonucleasa 3 que presenta un
substitución en el residuo W35 el cual esta implicado en la unión a membrana. La
actividad antifungica se evaluó a concentraciones proteicas subletales en las cuales se
logró evidenciar la internalización celular y degradación del RNA celular.
Por último, el tercer objetivo de esta tesis se centra en la purificación y caracterización
de la ribonucleasa 8, la más reciente ribonucleasa humana descrita, identificada
inicialmente en placenta. La RNasa 8 presenta un patrón inusual de enlaces disulfuro
respecto a sus proteínas homólogas. Este cambio estructural modifica la estabilidad de
la proteína y expone regiones que facilitan el proceso de agregación proteica. Por ello,
fue necesaria la previa optimización de un protocolo alternativo de purificación. Se
analizaron sus propiedades antimicrobianas, sugiriendo su posible participación en la
defensa inmune innata. El estudio comparativo de la RNasa 8 con su homólogo más
cercano la RNasa 7, indica que esta RNasa requiere una concentración proteica mayor
en comparación con la ribonucleasa 7 para desempeñar una actividad antimicrobiana.
Los resultados del presente estudio corroboran las propiedades antimicrobianas de
diversas ribonucleasas humanas miembros de la familia de la RNasa A, sugiriendo una
función ancestral en el sistema de defensa innato. El estudio contribuye a la
comprensión de su mecanismo de acción y plantea su potencial uso como herramientas
terapéuticas.

iv
SUMMARY
Human ribonucleases are a heterogeneous group of proteins belonging to the
superfamily of RNase A. These proteins are characterized by their ability to hydrolyse
ribonucleic acids and the presence of antimicrobial activity against various pathogens
including bacteria, fungi, parasites and viruses. Previous studies developed in our
research group have identified and characterized the antimicrobial activity of the
recombinant Ribonuclease 3, also called Eosinophil Cationic Protein, against Gram-
positive and Gram-negative bacteria.
The first objective of this doctoral study is focused on the antimicrobial and membrane
model characterization of native Ribonuclease 3 forms purified from eosinophils.
Native forms present post-translational modifications giving different glycosylation
grades that modulate their activity during inflammatory process. The purified protein
fractions show different degrees of glycosylation related to the secondary granules
maturation. This study expects to establish the antimicrobial capacity of native forms
purified from eosinophils and their activity in model membrane. Results indicate that
post-translational modifications modulate the protein biological activities.
On the other hand, the increase of infectious diseases, the development of evasion
mechanisms of the host immune response and the increased resistance to conventional
antibiotics, urge the search for therapeutic alternatives. Both RNase 3 (the eosinophil
cationic protein) and RNase 7 (the derived skin RNase), exhibit antimicrobial activity
against various pathogens. As a second objective, we evaluated for the first time the
antifungal activity against Candida albicans, an eukaryotic pathogen used as a model to
test the RNase antimicrobial mechanism of action. Both human ribonucleases displayed
antifungal activity. Additionally, active site mutants of both RNases were analysed.
Also, a mutant defective of the RNase 3/ECP main residue involved in membrane
binding was characterized (W35A). Results highlighted a dual mechanism of action,
where cell lysis takes place at high protein concentration, while depolarization, cell
internalization and cellular RNA degradation is achieved at sublethal doses.

v
Finally, the last objective is focused on the characterization of ribonuclease 8, also
called placental RNase, the most recent human ribonuclease described. RNase 8 has
gained and lost one cysteine residue in non-conserved positions in a mechanism called
"disulphide shuffling". The protein tendency to aggregate required the design of an
alternative purification protocol. We analysed its antimicrobial abilities, suggesting a
possible role in innate defence. The comparative study with its closest homologue,
RNase 7, showed that RNase 8 needed a higher protein concentration for effective
antibacterial activity.
The results of this study confirmed the high antimicrobial activity of several human
ribonucleases from the RNase A superfamily suggesting an ancestral role in the host
immune defence response. The study contributed to the understanding of their
mechanism of action and set the basis for applied drug design.
INTRODUCTION


1
1. INTRODUCTION
1.1 THE RNase A SUPERFAMILY
RNase A (bovine pancreatic RNase) superfamily is an extensive family of divergent
proteins that share specific elements of sequence homology, tertiary structure and the
catalytic activity on polymeric RNA. The RNase A family proteins are composed of a
signal peptide of about 25 amino acids and a mature peptide of about 130 amino acids.
Besides, all ribonucleases of this family share a typical structural fold and the key
catalytic residues (2 histidines and 1 lysine), showing a variable degree of enzymatic
activity (Dyer & Rosenberg 2006); (Raines et al. 1998). The human ribonucleases
exhibit 6 to 8 cysteines that form three to four disulphide bonds, and share key residues
and motives for the protein folding and three dimensional structure (Boix and Nogués
2007); (Rosenberg 2008b). A considerable sequence divergence among the family
members is observed, with identities varying from about 20 to nearly 100% (Boix and
Nogués 2007). Figure 1 shows the typical structure of RNase A.
Figure 1: RNase A Three-dimensional structure of Ribonuclease A, the prototype of the vertebrate RNase superfamily (PDB code: 7RSA). The predominant elements of secondary structure are a long four-stranded antiparallel β-sheet and three short α helices. The enzyme is cross-linked by four disulphide bonds. Modified from (Sorrentino. 2010).
The human RNases are encoded by unique genes that are located in the human
chromosome 14q11.2. All eight known functional genes encode relatively small
polypeptides (~15kDa). Among common elements, each gene encodes a ~ 20-28 amino
acid signal sequence, as would be expected for secretory proteins (Dyer & Rosenberg
2006). The human ribonucleases include 8 proteins: the human pancreatic RNase
(RNase 1), the Eosinophil Derived Neurotoxin (EDN/RNase 2), the Eosinophil Cationic

2
Protein (ECP/RNase 3), RNase 4, Angiogenin (RNase 5), RNase 6 or RNase K6, the
skin derived RNase (RNase 7) and the Human placental ribonuclease (RNase 8). By
evolutionary relationships the human ribonucleases can be clustered as shown in Figure
2A. The alignment of the eight human ribonucleases is shown in the Figure 2B. A brief
summary of RNase catalytic, antipathogenic and other described activities is shown in
Table 1 and 2.
A.
B. Figure 2: Phylogenetic tree and primary sequence alignment of the human RNases. A. Phylogenetic tree of the eight RNase A proteins. The neighbour joining method with protein p distance was used. Bootstrap percentages are shown on interior branches (modified from Zhang et al. 2002); RNase 7 and RNase 8 are closely related to one another, as are RNase 2 and RNase 3/ECP (78% and 67% amino acid sequence identity, respectively). B. Alignment of the eight human ribonucleases, conserved amino acids are boxed. The secondary elements of RNase 1 are displayed as a reference, taken from 1E21pdb. The ribonucleases sequence were searched in Uniprot, the codes used were P07998, P10153, P12724, P34096, P03950, Q93091, Q9H1E1 and Q8TDE3, respectively. The alignment was performed with Clustal W, Figure modified from (Boix and Nogués 2007).

3
Catalytic properties of RNase A superfamily
RNase A catalyses the cleavage of the P-O5 bond of an RNA strand and the hydrolysis
of the P-O2´ bond of a nucleoside 2´,3´-cyclic phosphodiester (Raines et al. 1998). The
breakdown of RNA takes place in two steps, the first being a transphosphorylation step
in which a 2′ ,3′ -cyclic nucleotide was formed at the 3′-terminus of one product and a
5′ -hydroxyl group appeared at the 5′ -terminus of the other product. In the second step,
the 2′,3′ -cyclic nucleotide was hydrolysed to a 3′-nucleotide. The first step was
reversible, whereas the second was practically irreversible (Cuchillo et al. 2011), Figure
3 shows the cleavage process.
Figure 3: Transphosphorylation and hydrolysis reactions catalysed by RNase A. Taken from (Cuchillo et al. 2011).
The prototype of this superfamily, bovine pancreatic ribonuclease, is perhaps the best
characterized of all known mammalian enzyme proteins. All superfamily members are
extracellular proteins and share the ability to degrade RNA. The eight human
ribonucleases with remarkable sequence similarities show significant catalytical
difference against diverse RNA substrates. All human RNases present catalytic activity
toward yeast tRNA except RNase 5 that shows an extremely low activity. The catalytic
activity against yeast tRNA is influenced by ionic strength and divalent cations
(Sorrentino 1998). RNase 1 activity is enhanced by an increase of the NaCl
concentration from 50 to 300 mM. RNase 1 substrate preference is more effective
towards poly (C) than poly (U). Human Pancreatic ribonuclease also displays a notable
catalytic activity against dsRNA (two orders of magnitude more than bovine RNase A)
(Sorrentino and Libonati 1997) due to the presence of additional noncatalytic basic
residues which cooperatively contribute to the binding and destabilization of the double-

4
helical RNA molecule (Sorrentino and Libonati 1997); (Sorrentino 2010). A summary
of catalytic activities of Human RNases is shown in Table 1.
Table 1: Summary of catalytic activity of Human RNases Enzyme
Substrate preference
Activity towards B1 site B2 site Cyclic
nucleotides
Yeast RNA* Double-strand RNA (dsRNA)
RNase 1 Poly (C) C > U (2:1)
A Hydrolyse 2´,3´ cyclic nucleotides
0.15 Present
RNase 2 Poly (U) U > C (2:1)
A > G (4:1) ND 0.65 Not Present
RNase 3 Poly (U) U > C (2:1)
A Low activity hydrolyse
2´,3´ cyclic nucleotides
0.048 Not Present
RNase 4 Poly (U) U>>>C (10:1)
A Hydrolyse 2´,3´ cyclic nucleotides
-RNase 1 Present
RNase 5 NR NR NR NR Extremely Low
Present
RNase 6 NR NR NR NR 0.034 Present RNase 7 NR NR NR NR 1.14 Present RNase 8 NR NR NR NR 0.012 Present
Values of Yeast RNA* activity were taken from (Zhang et al. 2002) Data on base preferences (B1 and B2 sites) was taken from (Boix et al. 2013) Data about activity toward cyclic nucleotides was taken from (Sorrentino and Libonati 1997); (Sorrentino 2010) NR: No reported data ND: Not detected
In contrast to RNase 1, RNase 2 and RNase 3/ECP prefer poly (U) over poly (C), and
are totally inactive on Poly (A) and dsRNA, and show a very low or undetectable
hydrolysis activity on 2´, 3´ cyclic mononucleotides (Sorrentino and Libonati 1994);
(Boix et al. 1999). The preference to poly (U) over poly (C) was also described for
RNase 4, displaying also a high hydrolytic activity towards 2´3´ cyclic mononucleotides
(Hofsteenge et al. 1998).
Regarding RNase 5, this RNase shows an extremely weak RNA cleaving activity in
comparison to RNase 1, although their overall 3D structures are quite similar. However,
the pyrimidine binding site of RNase 5 is blocked by the side chain of Gln 117; this
obstruction is also associated with a different orientation of the C-terminal segment of
the protein compared to that of RNase A (Russo et al. 1994). A few data have been
reported for RNase 6, its ribonucleolytic activity was tested against yeast RNA finding
about 40- fold lower than RNase 2 (Rosenberg and Dyer 1996).

5
Studies based on RNase 7 and/or RNase 8 kinetic parameters are not yet available. As
for, the degradation of yeast tRNA, RNase 7 shows a ribonuclease activity an order
lower than that of the human pancreatic RNase or RNase 1, but is about twice that of
RNase 8, the closest relative to RNase 7 (Zhang 2003); (Zhang et al. 2002).
Substrate binding sites of RNase A
Ribonuclease A binds nucleic acids through multiple electrostatic interactions between
the phosphates of the polynucleotide and the positive groups (side chains of lysines and
arginines) of the protein subsites (Figure 4) (Parés et al. 1991); (Boix et al. 1994);
(Moussaoui et al. 1996). The cleavage of the phosphodiester bond of the RNA by
RNase A takes place through an acid–base mechanism in the active site, formed by the
side chains of the amino acids His12, His119, and Lys41. In addition to the phosphate
active site p1, two other main noncatalytic phosphate-binding subsites were
characterized, the p0 site (Lys66), which binds the phosphate group of the nucleotide
adjacent upstream to that located in the active site (Fontecilla-Camps et al. 1994)
(Nogues et al. 1998)(Cuchillo et al. 2002), and the p2 site (Lys7 and Arg10), which
binds the phosphate group of the corresponding adjacent nucleotide located in the 3’
side (Parés et al. 1991)(Boix et al. 1994). Other phosphate-binding subsites, such as p-1
(Arg85) (Fontecilla-Camps et al. 1994)(Fisher et al. 1998) and others located on the
surface of the protein would also involved in the formation of the enzyme–substrate
complex.
Figure 4: Schematic representation of RNase A substrate-binding sites. p1 corresponds to the phosphate active site where the cleavage of the phosphodiester bond takes place. Taken from (Parés et al. 1991)

6
The eight human ‘‘canonical” ribonucleases
1.1.1 RNase 1, Human Pancreatic Ribonuclease
RNase 1 has been isolated mostly from pancreas, but enzymes which are products of the
same gene have also been purified from urine, seminal plasma, brain and kidney
(Sorrentino 1998). Differential post-translational processing occurs in this enzyme;
depending on the tissue origin (Beintema et al. 1988). Under physiological salt
conditions, RNase 1 presents a potent catalytic activity against double-strand RNA
(dsRNA) (Sorrentino et al. 2003). Thanks to its great catalytic ability, RNase 1 would
be able to act as an extracellular RNA scavenger and might also be involved in
nonspecific response to pathogenic RNA molecules. It was also reported to show
inhibitory activity against HIV and might protect the foetus during pregnancy (Lee-
Huang et al. 1999).
1.1.2 RNase 2, the Eosinophil Derived Neurotoxin (EDN)
RNase 2 is a RNase mainly secreted by eosinophil-activated secondary granules,
although it can also be expressed by neutrophils, liver, spleen, macrophages and
epithelial cells (Boix and Nogués 2007). In tha early 1930s, EDN was reported to
induce ataxia, paralysis and central nervous system cellular degeneration in
experimental rabbits (Gordon Phenomenon). In 1986 following its primary structure
sequencing, the protein was ascribed to the RNase A superfamily (Rosenberg 2008a).
EDN is unique among the major eosinophil granule proteins for its relatively low
cationicity, with a pI~9, much lower than that of the other granule protein counterparts:
the Eosinophil Cationic Protein, the Major Basic Protein and Eosinophil Peroxidase. It
is a small, single chain with a molecular mass of approximately 18.4 kDa; the signal
peptide is conformed by 27 amino acids, and the mature peptide 134 residues.

7
Table 2: Antimicrobial activity and other biological properties of RNase A family members. Modifided fron: Boix & Nogués.
RNase A ribonuclease* pI Tissues Expression Antimicrobial properties and other characteristics
RNase 1
8.98
Pancreas, human endothelial cells and other tissues and body fluids
RNA digestion in ruminant homologues Unknown non digestive physiological role for the human member Bacterial activity no reported (Sorrentino 2010)
RNase 2
10.4 Neutrophils, liver, spleen, macrophages and placental epithelial cells
Selective chemoattractant for dendritic cells Antiviral action on Respiratory syncytial virus and HIV (Rosenberg 2008a). Antimicrobial host defence (Rosenberg 2008a). Induction of proinflammatory mediators Neurotoxic activity
RNase 3
11.4 Eosinophils and minoritary in neutrophils
Bacterial activity against Gram-negative and Gram-positive strains (Torrent et al. 2010a) Lysis and aggregation of bacterial membrane and synthetic lipid bilayers (Torrent et al. 2008) Immunomodulator capacity (Venge et al. 1999); (Boix et al. 2008)

8
RNase 4
9.18 Ubiquitous, with predominance in liver and lung
None bacterial activity has been reported
RNase 5
10.5 Predominant in the liver. Also detected in endothelial cells, neurons, intestinal epithelium and keratinocytes
Inhibitory activity against Candida albicans (Hooper et al. 2003) Antibacterial activity (Abtin et al. 2009); (Hooper et al. 2003)
RNase 6
9.22 Lung, heart, placenta, kidney, pancreas, liver, brain, skeletal muscle. Also expressed in monocytes and neutrophils
Potential host defence and/or RNA catabolism (Dyer et al. 2004)

9
* Human RNase Secondary Structures, alpha helix are showed in cyan colour, beta sheet magenta and loops light pink.
RNase 7
10.3 Skin, liver, kidney, skeletal muscle and heart
Antimicrobial activity was reported against Gram-negative and Gram-positive strains (Torrent et al. 2010a) Activity against Candida albicans (Harder et al. 2002) Host Skin barrier against cutaneous infections (Harder & Schroder 2002) Bacteria membrane permeabilization (Torrent et al. 2010a)
RNase 8
8.4 Placenta, fetal tissues, spleen, lung and testis
Microbicidal activity against Gram-negative and Gram-positive stains Antiviral activity (Zhang et al. 2002); (Rudolph et al. 2002); (Chan
et al. 2002)

10
EDN does not display an antibacterial activity, but has in vitro a specific antiviral
activity which is dependent on its RNase activity (Sikriwal et al. 2009). EDN can
reduce in vitro the infectivity of the respiratory syncytial virus (RSV), and the Human
Immunodeficiency Virus (HIV) (Domachowske et al. 1998); (Rosenberg and
Domachowske 2001); (Rugeles et al. 2003), and is proposed to participate in the innate
and specific antiviral host defence (Boix et al. 1999).
EDN has also a chemotactic activity, inducing the dendritic cell maturation and
activation, and contributes to the modulation of both innate and adaptive immunity
(Yang et al. 2004).
1.1.3 RNase 3, the Eosinophil Cationic Protein (ECP)
The Eosinophil Cationic Protein is another member of the RNase A superfamily that is
secreted by secondary granules of eosinophils. Eosinophils are polymorphonuclear
white blood cells with distinct basic granules that stain with acidic dyes (e.g. eosin). In
the granules, the crystalloid core contains Eosinophil Major Basic Protein MBP (MBP-1
and MBP-2), while the matrix contains eosinophil cationic protein (ECP), eosinophil
derived neurotoxin (EDN), and Eosinophil peroxidase (Acharya & Ackerman 2014).
The eosinophil secretion is regulated by exocytosis and degranulation. Multiple forms
of degranulation are observed, as the releases of granules by cytolysis or a piecemeal
pattern, which reflect distinct host responses to inflammation or remodelling
requirements. A highly organized process allows a remarkable rapid release of secretion
proteins during immune response (Rosenberg et al. 2013).
RNase 3/ECP shows a high cationicity with a pI=11.4 (19 Arg), the mature peptide has
133 residues, while the signal peptide is conformed by 27 amino acids. The calculated
molecular weight of ECP is 15.6 kDa, but owing to differential glycosylation, its
molecular weight ranges between 16–21.4 kDa (Larsson et al. 2007). The antibacterial
ability and activity in membrane model of ECP native forms were analysed by our
research group (Salazar et al. 2014).

11
ECP displays a 67% amino acid sequence identity with EDN (89% nucleotide sequence
identity) and 31% with pancreatic ribonuclease. The structural (8 cysteines and
conserved secondary structure), and catalytic components (H15, H128 and Lys38)
required for ribonuclease activity have been retained in both proteins. The ribonuclease
activity of ECP towards most RNA substrates is approximately 50- to 100-fold lower
than that of EDN, which is on its turn significantly lower than that of RNase A (Boix et
al. 1999). ECP prefers pyrimidine residues with the highest activity displayed towards
poly (U). Evolutive studies indicated that EDN and ECP emerged via a gene duplication
and would have responded to unusual evolutionary constraints, which would have
promoted an increased cationicity and cytotoxicity for ECP (Rosenberg and Dyer
1995a). Figure 5 displays the structural determinants of ECP implicated in its
biological activities.
Figure 5: Structural determinants of RNase 3/ECP involved in biological activities. The 3D representation shows the particular regions implicated in catalytic activity and related to antimicrobial activities. Taken from (Boix et al. 2012).
1.1.3.1 RNase 3/ECP antiparasitic activity In host defence, ECP is a key mediator against parasite infections, as helminths and
protozoa (Boix et al. 2012) (Malik & Batra 2012). Antiparasitic ability has been
reported against Schistosoma mansonni, Brugia malayi, Leishmania, Plasmodium
(Waters et al. 1987) and Trypanosoma cruzi (Kierszenbaum et al. 1986). Indeed
eosinophilia and eosinophil tissue infiltration are directly associated with parasite
12
infections. The release of eosinophil granule proteins has been correlated with the
helminthic-induced tissue damage and deposition of eosinophil granule proteins in the
affected tissues of patients has been observed (Singh & Batra 2011).
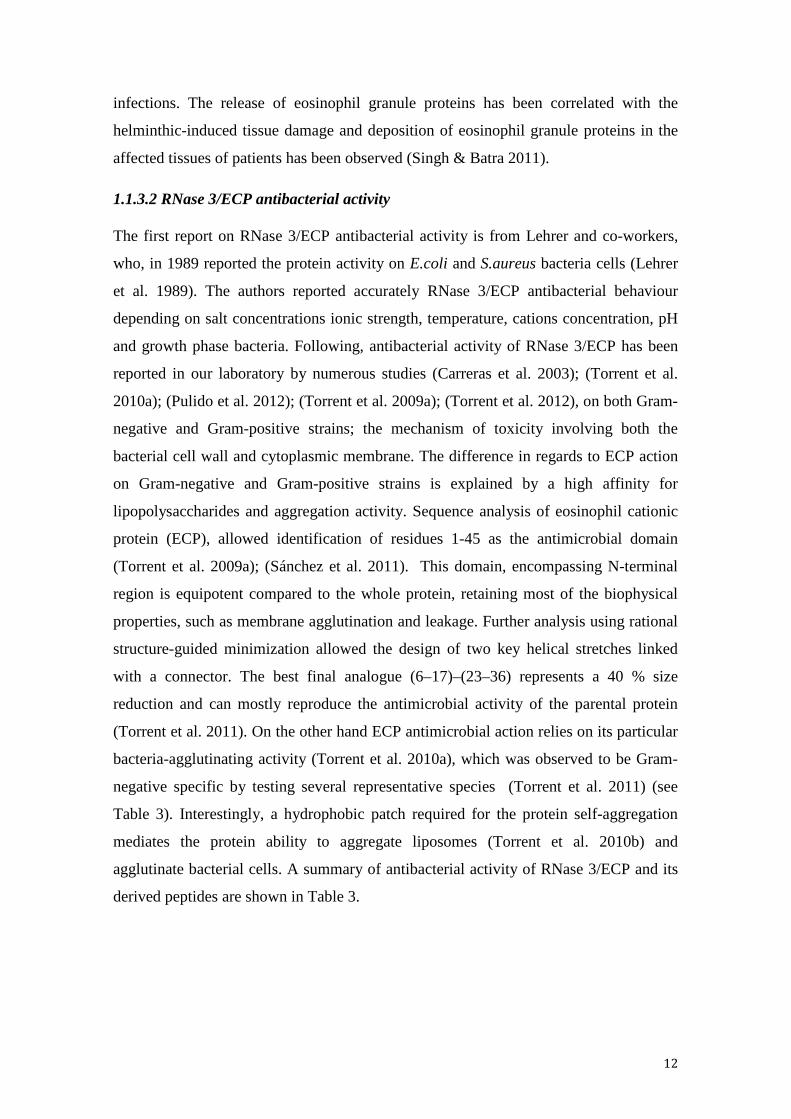
1.1.3.2 RNase 3/ECP antibacterial activity The first report on RNase 3/ECP antibacterial activity is from Lehrer and co-workers,
who, in 1989 reported the protein activity on E.coli and S.aureus bacteria cells (Lehrer
et al. 1989). The authors reported accurately RNase 3/ECP antibacterial behaviour
depending on salt concentrations ionic strength, temperature, cations concentration, pH
and growth phase bacteria. Following, antibacterial activity of RNase 3/ECP has been
reported in our laboratory by numerous studies (Carreras et al. 2003); (Torrent et al.
2010a); (Pulido et al. 2012); (Torrent et al. 2009a); (Torrent et al. 2012), on both Gram-
negative and Gram-positive strains; the mechanism of toxicity involving both the
bacterial cell wall and cytoplasmic membrane. The difference in regards to ECP action
on Gram-negative and Gram-positive strains is explained by a high affinity for
lipopolysaccharides and aggregation activity. Sequence analysis of eosinophil cationic
protein (ECP), allowed identification of residues 1-45 as the antimicrobial domain
(Torrent et al. 2009a); (Sánchez et al. 2011). This domain, encompassing N-terminal
region is equipotent compared to the whole protein, retaining most of the biophysical
properties, such as membrane agglutination and leakage. Further analysis using rational
structure-guided minimization allowed the design of two key helical stretches linked
with a connector. The best final analogue (6–17)–(23–36) represents a 40 % size
reduction and can mostly reproduce the antimicrobial activity of the parental protein
(Torrent et al. 2011). On the other hand ECP antimicrobial action relies on its particular
bacteria-agglutinating activity (Torrent et al. 2010a), which was observed to be Gram-
negative specific by testing several representative species (Torrent et al. 2011) (see
Table 3). Interestingly, a hydrophobic patch required for the protein self-aggregation
mediates the protein ability to aggregate liposomes (Torrent et al. 2010b) and
agglutinate bacterial cells. A summary of antibacterial activity of RNase 3/ECP and its
derived peptides are shown in Table 3.

13
Table 3: Summary of RNase 3/ECP antibacterial activity and derived peptides. Bactericidal and agglutination activities of RNae 3/ECP and peptide analogues calculated as MIC100 (µM) and minimal agglutinating concentration (MAC) values. Taken from (Torrent et al. 2011)
Action at the bacteria wall
The cell wall is responsible of structural integrity to the cell and is a specific binding
site for RNase 3/ECP which displays high binding affinity to peptidoglycans (PGN) and
lipopolysaccharides (LPS) (Torrent et al. 2008). Gram-negative bacteria posses an
outer membrane covered by a surface layer of lipopolysaccharides. LPS confer a
negative charge to the cell surface. Electrostatic interactions can result in the
accumulation of cationic proteins at the LPS layer forming a protein-LPS complex.
RNase 3/ECP is able to bind LPS and its Lipid A portion with a high affinity (Torrent et
al. 2008). LPS binding is facilitating by arginine and hydrophobic surface residues. The
action at the bacteria wall might represent a first encounter step key in its antimicrobial
mechanism of action, facilitating its effect toward the cytoplasmic membrane (Torrent
et al. 2008); (Torrent et al. 2010a). Also, affinity is displayed toward peptidoglycans
(PGN), a major constituent of Gram-positive bacteria cell walls.
RNase 3/ECP bacteria-agglutinating activity was also correlated with the protein ability
to interact with the Gram-negative outer membrane lipopolysaccharide (LPS) structure
by using a battery of E. coli cells with progressively truncated LPS (Pulido et al. 2012).
Results indicated that the protein requires for a full antimicrobial activity both the LPS
sugar core and the anionic phosphate groups, the agglutination activity being hampered
by LPS truncation, mostly when the full core is removed. LPS-binding determinants
were proposed by docking simulation, where residues Arg1, Trp10, Gln14, Lys38 and

14
Gln40 were spotted at hydrogen-bonding distance from the phosphorylated saccharide
moiety anchored to the Lipid A portion (Pulido et al. 2012).
Action at the membrane level
Membrane destabilizing is one of the key RNase 3/ECP properties providing the protein
wide spectra of antipathogen activities (Boix et al. 2008). It is well known that
antimicrobial molecules require a selective toxicity that can discriminate between host
and microbial cells. The antimicrobial molecules must hence target common and stable
structure among the pathogens, two of which are cytoplasmic and cell wall. It is, in fact
costly for the pathogens to modify the composition of its own envelope.
RNase 3/ECP cytotoxic and bactericidal activities correlate with its membrane
disruption capacity and are dependent upon surface exposition of both hydrophobic
(tryptophan) and basic (arginine) residues (Carreras et al. 2003). In particular, the role
of a single tryptophan residue (W35) in the membrane destabilisation activity of ECP is
assigned as crucial for insertion into lipid membrane, destabilization and aggregation of
lipid bilayers, leading to the disruption of the membrane. Thus, it appears that the
exposition of aromatic and cationic residues facilitate membrane disruption through a
carpet like mechanism (Torrent et al. 2007); (Gupta et al. 2012).
Additionally, RNase 3/ECP interaction with synthetic membranes leads to large
structures, which would correspond to aggregation and fusion of lipid vesicles; a
possible model is described in Figure 6 (Torrent et al. 2009b). Likewise, aggregation
ability in vitro has been reported on Gram-negative cell bacteria. The initial electrostatic
interactions between cationic ECP and the bacterial anionic surfaces being the driving
force behind the ECP-bacteria association (Boix et al. 2008).

15
Figure 6: RNase 3/ECP mechanism on lipid vesicles. Schematic drawing illustrating the proposed timing of events involved in the protein-lipid association process for RNase 3/ECP. The proposed model includes the following steps: The protein molecules association to vesicles lipid bilayers, the aggregation process and the inner content release. Taken from (Torrent et al. 2009b).
1.1.3.3 RNase 3/ECP activity in host tissues and in eukaryotic cells. Another interesting feature of RNase3/ECP is the capacity to bind specifically to the
eukaryote cell surface and its interaction to the cell surface heparan sulphate
proteoglycans that can serve as internalization mediators. ECP is also cytotoxic in vitro
to eukaryotic cells, although higher protein concentrations are required in comparison to
the range required for antimicrobial activity. RNase 3/ECP cytotoxic activity has been
reported for several cancer cell lines (Maeda et al. 2002); (Carreras et al. 2005);
(Navarro et al. 2008). Moreover, RNase 3/ECP is cytotoxic for tracheal epithelium and
RNase 3/ECP deposits, related to tissue damage, are observed after eosinophil
degranulation in inflammatory disorders (Kita 2013).
1.1.3.4 RNase 3/ECP diversity: Polymorphism and post-translational modifications
ECP gene lies in a chromosome location area (14q24) that has been linked to genes
related to asthma development (Venge et al. 1999). The gene encoding RNase 3/ECP
contains a noncoding exon 1, separated by a single intron from coding sequence exon 2,
a gene structure which is characteristic of the ribonuclease gene family (Hamann et al.
1991); (Boix et al. 2008).

16
Figure 7: RNase 3/ECP gene structure showing exons and introns organization. Polymorphisms locations are indicated. Numbers refer to positions relative to the translation initiation site. 5’and 3’ untranslated regions (5´UTR and 3`UTR) are marked (Boix et al. 2008).
Posttranslational modifications Protein heterogeneity is a result of factors as single nucleotide polymorphism (SNPs) or
posttranslational modifications as glycosylation. Glycosylation is one of the most
common post-translational modification. In RNase 3/ECP there are three known sites
for N-linked glycosylation; N57, N65 and N92, Figure 7 (Rosenberg et al. 1989).
Analysis on the purified native forms revealed the presence of N-linked
oligosaccharides containing sialic acid, galactose and N-acetyl glucosamine (Eriksson et
al. 2007a). Recently studies conclude that secretion of RNase 3/ECP from eosinophils
involves protein modification and that this modification mainly takes part at the
departure from the cell, while the protein that remains inside the activated cell is
unchanged. It was also shown that the secretion profile of RNase 3/ECP changes into
molecular masses identical to the masses of cytotoxically active RNase 3/ECP. Stored
noncytotoxic RNase 3/ECP is converted into cytotoxically active molecules upon
release from the cell (Woschnagg et al. 2009). Furthermore, interesting investigations
reported a possible gain in the cytotoxic activity when N-linked carbohydrate chain is
removed. The carbohydrate chains might block potential binding sites on RNase 3/ECP,
so removal of these chains would enhance the possibilities for interactions with target
cells (Rubin & Venge 2013).
Glycosylation heterogeneity is further increased by a SNP (Single Nucleotide
Polymorphism) (Boix et al. 2008). Several SNPs in the RNase 3/ECP gene have been
reported, and this genetic variation determines the cellular content and biological
activity of ECP (Eriksson et al. 2007a). The first reports on the sequence variation at
the RNase 3/ECP nucleotide sequence revealed seven polymorphism (Figure 7), but

17
only one in the coding sequence, the 434 (G>C) change, which implies the Arg97-Thr
substitution (Zhang et al. 2000). This change results in alterations of the net charge and
the mass of the protein (Eriksson et al. 2007a); (Rubin et al. 2009). Indeed, the cytotoxic
activity of RNase 3/ECP is partly related to this site and the biological properties are
altered by this polymorphism. Indeed results on the corresponding rECP variant that
carried the arginine-to-threonine change loose its cytotoxic activity. Deglycosylation of
the rECP 97thr mutant restored its cytotoxic activity, which suggests that the modified
glycosylation pattern was responsible for the loss of cytotoxicity (Larsson et al. 2007).
This polymorphism also is correlated with the natural course of Schistosoma mansoni
infection and with inflammatory bowel disease in an age and gender–dependent manner
(Eriksson et al. 2007b). The genotype 434CC, which encodes the more neutral and
somewhat less cytotoxic form of ECP, is found commonly among Ugandans, who live
in a region endemic for S. mansoni infection. By contrast, the 434CC genotype is quite
rare in Sudan, where S. mansoni is not endemic. Although this result suggests that there
is no selective advantage for those individuals whose eosinophils might provide
stronger antischistosomal host defence, the authors of this study determined that
individuals with the 434CC genotype developed substantially less liver fibrosis
secondary to S. mansoni infection. As such, the selective advantage may be for those
individuals whose eosinophils promote less collateral tissue damage when faced with a
similar pathogen burden (Rosenberg et al. 2013).
The variant Thr97 also shows associations with the symptoms of allergy and asthma.
An epidemiological study showed that ECP 434 (G>C) is common in the Swedish
population and also this polymorphism would be related to the allergic manifestations
(Jönsson et al. 2002).
1.1.4 RNase 4
Human RNase 4 was first isolated from conditioned medium of a colon carcinoma
tumour cell line and later from normal plasma. A mRNA coding for this protein was
detected in various somatic tissues including liver, pancreas, lung, heart kidney and
placenta (Rosenberg and Dyer 1995b). There are unusual features that characterize
RNase 4 and distinguish it from the other human ribonucleases: Its amino acid sequence
(119 amino acids) is the shortest and the most evolutionarily conserved among different

18
mammalian species (about 90% identity with bovine, porcine and rat RNases)
(Hofsteenge et al. 1998). RNase 4 has not been well characterized to date, although
there is some data associating RNase 4 with host defence. The major sites of expression
in cattle appear to be the liver, intestine, testes and mammary gland—all of which have
a significant host defence function. RNase 4 has been shown to suppress the growth of
C. albicans, although it is not as potent as RNase 5 (Harris et al. 2010). Overall, the
physiological functions of RNase 4 are largely unknown and good evidence for a role in
host defence is lacking at this time (Gupta et al. 2013).
1.1.5 RNase 5, Angiogenin
Angiogenin or RNase 5 is another ribonuclease suggested to be involved in the immune
defence system. Human angiogenin was first isolated from a human tumour cell line
and was named for its ability to promote blood vessel growth. Following, studies
determined that RNase 5 is constitutively expressed in a range of tissues and cell types
(Moenner et al. 1994). The molecular weight is 14,12 kDa, the sequence of cDNA and
gene was determined in ‘80s, and nucleotide sequence analysis revealed a sequence
coding for a signal peptide of 24 amino acids followed by 369 nucleotides coding for
the mature peptide of 123 amino acids (Strydom et al. 1985); (Sorrentino 1998). RNase
4 primary structure shows 33% sequence identity and 65% with pancreatic RNase 1
(Tello-Montoliu et al. 2006). RNase 5 is structurally characterized by lacking one of
four the disulphide bridges characteristic of the RNase A superfamily. RNase 5 displays
an unusual ribonucleolytic activity, which differs markedly both in magnitude and
specificity from RNase activity of the other human ribonucleases. Human angiogenin
presents a particularly weak RNase catalytic activity against the standard RNase
substrate (Leland et al. 2002).
RNase 5 has been related with an extensive range of physiological activities including
tumorogenesis, reproduction, regeneration of damage tissues, inflammatory bowel
disease and host defence (Gupta et al. 2013); (Hooper et al. 2003).
RNase 5 exhibits an immunomodulator function by interaction with a range of immune
cells; it can inhibit the degranulation of polymorphonuclear cells at nanomolar
concentrations (Tschesche et al. 1994). Under conditions of cellular stress (oxidative,

19
heat shock or ultraviolet irradiation) RNase 5 cleaves tRNA to produce and accumulate
tRNA-derived small RNAs (tiRNAs); this action generates arrest of protein synthesis in
order to conserve energy for repair of stress-induced damage. The inhibition of stress-
induced tiRNA production and translational arrest, caused by the RNase inhibitor, also
supports the involvement of angiogenin in defence against stress (Fu et al. 2009);
(Sorrentino 2010).
1.1.6 RNase 6, RNase k6
RNase 6 (also named RNase k6 for its orthologous relationship with bovine RNase k2)
is a protein that was not purified from any human tissue or fluid, but was identified as a
genomic segment localized on chromosome 14 (Rosenberg and Dyer 1996). The open
reading frame of RNase k6, amplified from human genomic DNA, encodes a 150 amino
acid polypeptide with eight cysteines and histidine and lysine residues corresponding to
those found in the active site of the prototype, ribonuclease A. A single mRNA
transcript was detected in many tissues including monocytes, neutrophils, lung, heart,
brain, placenta, liver, skeletal muscle, kidney and pancreas (Rosenberg and Dyer 1996).
Becknell and co-workers identified RNase 6 as a novel broad-spectrum antimicrobial
protein in the mammalian urinary tract with bactericidal activity, induced by
uropathogenic E. coli and expressed by recruited leukocytes during pyelonephritis
(Becknell et al. 2014).
1.1.7 RNase 7, Skin derived RNase
RNase 7 was first purified from healthy skin (Harder and Schroder 2002), and is
considered to be one of the main components of the innate immunity, first barrier
against infections at epithelial level. Afterward, the expression was reported in various
somatic tissues including liver, kidney, skeletal muscle and heart (Zhang 2003). The
protein is mainly secreted by keratinocytes, and the mRNA expression can be induced
by interleukin mediated via MAPKs, interferon and bacteria challenge (Mohammed et
al. 2011). RNase 7 includes a signal peptide of 28 amino acids and a mature peptide of
128 amino acids; the molecular weight is 14,546 Da. The mature peptide has eight
cysteines at positions conserved in most RNase A ribonucleases. The three catalytic
residues are also present (His15, Lys38 and His123) in mature peptide. RNase 7 is

20
atypically cationic with an isoelectric point (pI) of 10.5, presenting a high content of
lysines (18 of 128) amino acids (Zhang 2003).
Antimicrobial activity was reported against Gram-negative (Escherichia coli,
Pseudomonas aeruginosa) and Gram-positive strains (Propionibacterium acnes,
Staphylococcus aureus and Enterococcus faecium) (Harder and Schroder 2002);
(Torrent et al. 2010a); (Abtin et al. 2009), dermatophytes (Trichophytom rubrum, T
mentagrophytes, Microsporum canis and Epidermophytom floccosum), a common cause
of superficial skin infections and common tineas (Fritz et al. 2012), and yeast (Candida
albicans and Pichia pastoris) (Abtin et al. 2009); (Huang et al. 2007).
Studies of RNase 7 action on bacterial cell wall revealed a remarkable affinity for
peptidoglycan (PGN) and LPS at the Gram-positive and Gram-negative outer surface,
respectively. The antibacterial ability against bacteria is explained by a restricted
disturbance causing local blebs, whereas no cell agglutination activities are observed.
Studies in membrane models described the protein binding to the membrane by
electrostatic interactions following pore formation and membrane destabilization
(Torrent et al. 2010b). Lysine residues are described as critical for membrane
permeability and antimicrobial activity, specifically the cluster K1, K3,K111, K112 located
at the flexible coil near the N-terminus (Huang et al. 2007).
1.1.8 RNase 8, the placental RNase
Recently, a novel member of the secretory RNase A superfamily, called RNase 8, has
been discovered by searching the human genome databases (Zhang et al. 2002). RNase
8 and RNase 7 have an amino acid sequence identity of 78% and a genomic distance of
only 15,000 bp, suggesting that their genes may have evolved from a common ancestor
gene by a duplication event (Zhang et al. 2002). RNase 8 is closely related to RNase 7,
but evolutionary differ in some features. RNase 7 is a typical member of RNase A,
enzymatically active against standard RNA substrates, includes a Histidine-Lysine-
Histidine catalytic triad, and eight conserved cysteines that generate disulphide bonds
that define the tertiary structure (Harder and Schroder 2002); (Zhang et al. 2003).
Although no formal evolutionary analysis has been carried out on the RNase 7 lineage,
a comparison of available coding sequences from human and genome builds of

21
chimpanzee and macaque indicates that this lineage is highly conserved over time. In
contrast, earlier study reported by Zhang and colleagues described that RNase 8 has
been incorporating non-silent mutations at a very rapid rate, among the highest rates in
any coding sequences studied in primates (Zhang et al. 2003).
RNase 8 is a divergent paralog of RNase 7, which is lysine-enriched, has prominent
antimicrobial activity, and is expressed in both normal and diseased skin. In contrast,
the physiologic function of RNase 8 remains uncertain (Chan et al. 2012). RNase 7
exhibits potent antimicrobial activity against Gram-negative and Gram-positive bacteria
(Harder et al. 2002); (Zhang et al. 2003). The high similarity between both RNases
suggested that RNase 8 might also act as an antimicrobial protein.
The antipathogenic activity of RNase 8 has been reported testing on clinical isolates of
different bacteria and fungi (Rudolph et al. 2006), the results showed a broad spectrum
of antimicrobial activity against various species of Gram-positive and Gram-negative
bacteria (Rudolph et al. 2006). Additionally, RNase 8 displays a similar antiviral
activity on respiratory syncytial virus to RNase 7 without any effect on infected target
cells (Rudolph et al. 2006).
The majority of the canonical RNase A family members have 8 conserved cysteines. A
notable exception is RNase 5 (also known as angiogenin), which has only 6 cysteines,
forming 3 disulphide bonds (Strydom et al. 1985). In the case of RNase 8 comparative
evolutive studies suggested that the protein lost the sixth (C6) of the 8 conserved
cysteines but gained another (Zhang et al. 2002). The newly gained cysteine is located
between the fourth and fifth conserved cysteines. Computational predictions (Figure 8)
suggested changes of disulphide bonding by these cysteine substitutions. Human RNase
8 represents one of the first examples in which the presumable evolutionary change of a
disulphide bond involves 1 loss and 1 gain of cysteine, instead of 2 losses or 2 gains
(Zhang 2007).

22
Figure 8: Disulphide bonds in human RNase 8 and its variants, predicted by DiANNA (A) and DISULFIND (B). The thick grey line represents the primary sequence of the protein, with the N terminus located at the left-hand side. Cysteine residues are indicted by the letter C and disulphide bonds are shown by solid-line bridges below or above the primary sequence. Free cysteines are circled. On the left side of the Figure is the first evolutionary scenario, where the gain of CX preceded the loss of C6. On the right side of the Figure is the second evolutionary scenario where the loss of C6 preceded the gain of CX. Taken from (Zhang et al. 2007).
RIBONUCLEASES INVOLVED IN HOST DEFENCE
As described, the RNase A superfamily includes a broad network of distinct and
divergent gene lineages. Although all ribonucleases of RNase A superfamily share
invariant structural and catalytic elements, the primary sequences show significant
divergence. The RNase A ribonuclease lineages, include some ribonucleases involved
in host defence, as: (1) RNases 2 and RNases 3, also known as the eosinophil
ribonucleases (Boix and Nogués 2007); (Boix et al. 2012) (2) RNase 7, identified in
human skin (Harder and Schroder 2002); (Zhang 2003) (3) RNase 5, also known as
B
A

23
angiogenin, a ribonuclease that promote blood vessel growth with recently-discovered
antibacterial activity (Hooper et al. 2003) (4) RNase 6, identified as antibacterial
activity in urinary tract (Becknell et al. 2014) and (5) RNase 8, placental RNase with
controversial antibacterial activity (Rudolph et al. 2006); (Zhang et al. 2002).
Interestingly, some of the characterized antipathogen activities do not depend on
ribonuclease activity per se (Dyer & Rosenberg 2006). Various mechanisms are
implicated in host defence. Figure 9 represents the mechanism of action for RNases in
host defence.
Figure 9: Schematic representation of the potential mechanisms of action for the RNases in host defence. The processes are as follows: (1) Constitutive production and secretion of RNases; (2) Induced production and secretion of RNases in response to microbial invasion; (3) Direct antimicrobial activity and leakage of cellular contents; (4) RNase activity to clear microbial RNA; (5) DNA-binding activity of RNases facilitates recognition of microbial DNA to innate immune receptors; (6) Characteristic RNase activity of RNase 5 produces short fragments of viral RNA, which are then recognised by innate immune receptors; (7) EDN or RNase 3/ECP secreted by eosinophils degrades viral RNA; (8) Receptor-mediated uptake of EDN or RNase 3/ECP induces apoptosis; (9) EDN or ECP degrade microbial RNA released from infected and dying cells; (10) RNases produced by the liver are secreted into blood and lyse circulating microbes. Taken from (Gupta et al. 2013).

24
1.2 EOSINOPHILS AND THEIR GRANULE PROTEINS
Eosinophils were described in 1879 by Paul Ehrlich who noted their particular affinity
for acidophilic dyes. They are granulocytes developed in bone marrow from pluripotent
progenitors. In peripheral blood eosinophils are in mature state, their activation and
recruitment in tissues being stimulated by the cytokines, interleukin-5 (IL-5) and
eotaxin chemokines (Rosenberg et al. 2013). Eosinophils half-life in the peripheral
blood is around 18 hr. before their migration to the thymus or gastrointestinal tract,
where they reside under homeostatic conditions. In response to inflammatory stimuli,
eosinophils develop from committed bone marrow progenitors, after which they exit the
bone marrow, migrate into the blood and subsequently accumulate in peripheral tissues,
where their survival is prolonged (Hogan et al. 2008); (Rosenberg et al. 2013).
Relatively few mature eosinophils are found in the peripheral blood of healthy humans
(less than 400 per mm3), but these cells are easily distinguished from neutrophils, by
their bi-lobed nuclei and large specific granules (Figure 10).
Figure 10: The eosinophil. A. Transmission electron micrograph of mouse eosinophils. Cytoplasmic secretory granules are indicated by the arrows; the central core of theses granules contains the cationic major basic protein, and their periphery contains the remaining major cationic proteins, cytokines, chemokines, growth factors and enzyme. Original magnification, *6000. B. Human eosinophils from peripheral blood stained with Giemsa display characteristic bilobed nuclei and large red-stained cytoplasmic secretory granules. Original magnification, *100. Taken from (Rosenberg et al. 2013).
B.
A.
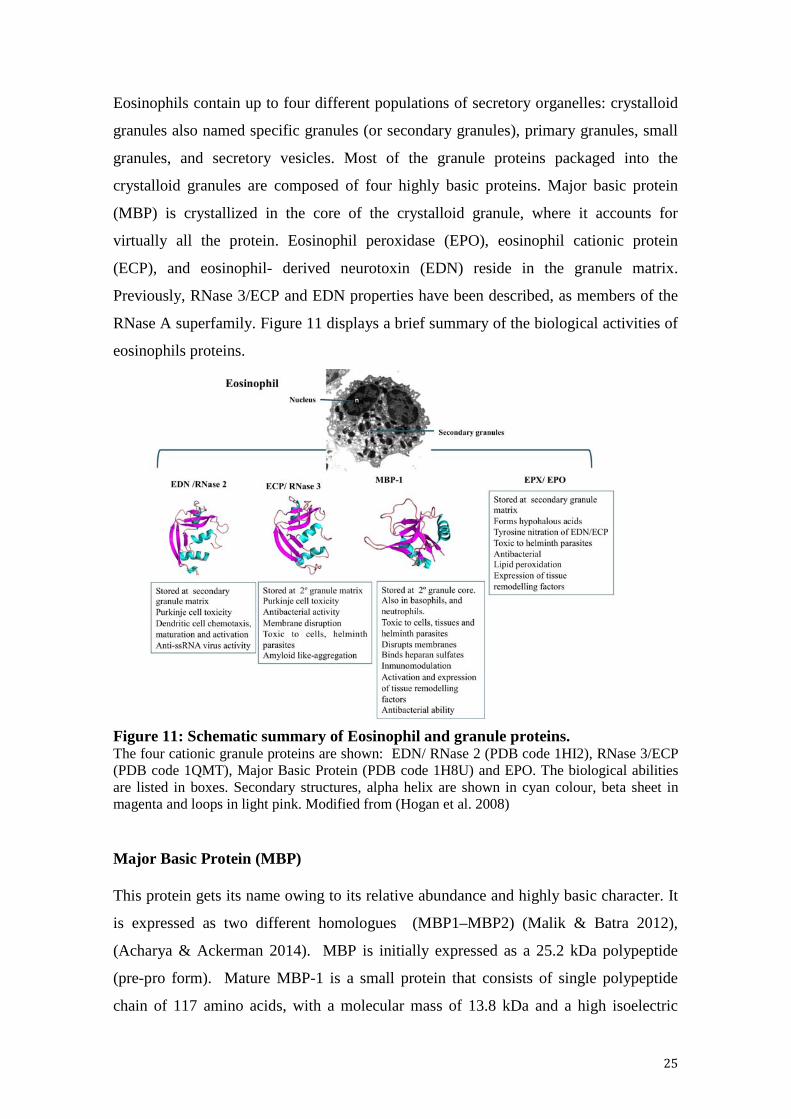
25
Eosinophils contain up to four different populations of secretory organelles: crystalloid
granules also named specific granules (or secondary granules), primary granules, small
granules, and secretory vesicles. Most of the granule proteins packaged into the
crystalloid granules are composed of four highly basic proteins. Major basic protein
(MBP) is crystallized in the core of the crystalloid granule, where it accounts for
virtually all the protein. Eosinophil peroxidase (EPO), eosinophil cationic protein
(ECP), and eosinophil- derived neurotoxin (EDN) reside in the granule matrix.
Previously, RNase 3/ECP and EDN properties have been described, as members of the
RNase A superfamily. Figure 11 displays a brief summary of the biological activities of
eosinophils proteins.
Figure 11: Schematic summary of Eosinophil and granule proteins. The four cationic granule proteins are shown: EDN/ RNase 2 (PDB code 1HI2), RNase 3/ECP (PDB code 1QMT), Major Basic Protein (PDB code 1H8U) and EPO. The biological abilities are listed in boxes. Secondary structures, alpha helix are shown in cyan colour, beta sheet in magenta and loops in light pink. Modified from (Hogan et al. 2008) Major Basic Protein (MBP) This protein gets its name owing to its relative abundance and highly basic character. It
is expressed as two different homologues (MBP1–MBP2) (Malik & Batra 2012),
(Acharya & Ackerman 2014). MBP is initially expressed as a 25.2 kDa polypeptide
(pre-pro form). Mature MBP-1 is a small protein that consists of single polypeptide
chain of 117 amino acids, with a molecular mass of 13.8 kDa and a high isoelectric

26
point (>11) (Hamann et al. 1991). Its basicity is due to the presence of 17 arginine
residues, and it also contains nine cysteine residues.
MBP-1 has been reported to be present in eosinophils and basophils, while the pro-form
is present in placental and breast tissue, isoform MBP-2 is exclusively expressed in
eosinophils. The protein cytotoxic effect over mammalian cells, helminths and bacteria
has been described; where cell damage is produced by disruption of the lipid bilayer
membrane or by regulation of the activity of enzymes within tissues (Gleich et al.
1993). MBP-1 stimulates mediator release from basophils and mast cells, activates
neutrophils and platelets, and augments superoxide generation by alveolar macrophages.
Under physiologic conditions, MBP-1 readily polymerizes in solution forming insoluble
aggregates due to the presence of five reactive thiol groups (Oxvig et al.1994). Recently
research showed that its paralog protein MBP-2, also displays similar conserved motifs
C-type lectins and disulphide bond locations (Wagner et al. 2007); (Plager et al. 2001).
MBP-2 homologue of MBP-1 expressed exclusively by eosinophils, is markedly less
basic than MBP1, with a calculated pI of 8.7. It has 66% amino acid sequence identity
with MBP-1; the biological activities are quite similar to MBP-1 involved also in cell
destruction, induction of superoxide anion, inducing histamine and leukotriene C4
release from basophils. The proximity of the two human MBP genes on chromosome
11 and their relationship to the two murine MBP genes suggest that they arose from a
gene duplication event before the evolutionary divergence of humans and mice (Plager
et al. 2001).
Eosinophil peroxidase
During activation eosinophils can generate potentially toxic reactive species (ROS).
Oxidant production begins with the generation of superoxide by the membrane bound
NADPH oxidase of eosinophils, which dismutates superoxide into hydrogen peroxide
(H2O2) (Acharya & Ackerman 2014). EPO, the most abundant cationic protein of the
matrix of the specific granules, uses this H2O2 as an oxidizing substrate to generate
potent oxidizing species. EPO catalyses the oxidation of halides particularly bromide,
pseudohalides and nitric oxide, resulting in the formation of highly reactive oxygen
species, reactive nitrogen metabolites and perioxynitrate-like oxidants; these

27
electrophiles oxidize proteins, hence promoting oxidative stress and subsequent cell
death by apoptosis and necrosis (MacPherson et al. 2001) . This protein is a heme-
containing haloperoxidase with a high pI composed of two subunits: a heavy chain of
50–57 kDa and a light chain of 11–15 kDa. EPO has 68% sequence identity to
neutrophil myeloperoxidase, suggesting that a peroxidase multigene family may have
developed through gene duplication (Hamann et al. 1991).
A special feature of EPO is related with post-translational nitration of EDN and RNase
3/ECP at Tyr 33, while itself is also nitrated at Tyr 349 in a mechanism unique to
eosinophils (Ulrich et al. 2008). The nitration takes place on the surface exposed
tyrosines and is mediated by EPO in the presence of H2O2 and NO.
1.2.1 Degranulation in human eosinophils
Secretion is an essential biological activity of all eukaryotic cells by which they release
specific products in the extracellular space during physiological and pathological
events. In human immune cells as eosinophils, basophils, neutrophils and mast cells,
additional secretory vesicle traffic is active. This secretory pathway is characterized by
vesicular transport of small packets of materials from the cytoplasmic secretory
granules to the cell surface. Piecemeal degranulation (PMD) can also drive the release
of secretory granule contents; this secretory process is now recognized as a central
secretion mode during the inflammatory response. In contrast to classical granule
exocytosis that involves granule fusion with the plasma membrane and release of the
total granule content, piecemeal degranulation enables release of specific granule-stored
proteins (Melo & Weller 2010). Eosinophils undergo PMD in response to varied
stimuli, including cross-linking of different subclasses of immunoglobulin receptors,
interferon-Υ (INF-Υ) and the chemokines. They develop cytoplasmic secretory vesicles,
know as eosinophil sombrero vesicles, which remain viable and fully responsive to
subsequent stimuli (Acharya & Ackerman 2014).
1.3 ANTIMICROBIAL PEPTIDES
Antimicrobial RNases from the RNase A family are small, secreted cationic proteins
complying the common properties of antimicrobial peptides. We described here the
main structure-function features of antimicrobial peptides. The clinical researches in

28
the last two decades are focused on the development of alternative therapies against
microbial pathologies, especially with the increment of microbial multi-resistant strains.
Antimicrobial peptides are key for the activation of multiples intracellular targets and
inhibit the microbial growth. Host defence peptides can be defined as short sequences
10-14 amino acids length, highly cationic, and with a substantial proportion of
hydrophobic residues. The peptide structure usually adopts an amphipathic disposition
with cationic and hydrophobic cluster spatially distributed (Hancock & Sahl 2006)
(Boix & Nogués 2007). According to folding structure, peptides can be group in: β-
sheet peptides stabilized by two to four disulphide bridges, α-helical peptides, extended
structures rich in glycine, proline, tryptophan, arginine and/or histidine and loop
peptides with one disulphide bridge. Table 4 displays the structural classification of
defence peptides. Design of peptides with improved biological activities is achieved by
high-throughput screening based on hydrophobicity and amphipaticity parameters,
transmembrane region predictions, and structure or function analogy (Hansen et al.
2008).
Table 4: Structural classification and sequences of host-defence peptides. Modified from (Hancock & Sahl 2006). Structural Classification
Name /3D structure Origin Sequence
β-sheet Human β- defensin PDB: 1IJV
Mammals Homo sapiens
DHYNCVSSGGQCLYSACPIF TKIQGTCYRGKAKCCK
α-helical Magainins PDB: 2LSA
Amphibians Xenopus leavis
GIGKFLHSAKKFGK AFVGEIMNS
Rich in some amino acids, as proline, glycine and arginine.
Indolicidin PDB: 1G8C
Mammals Bos Taurus
ILPWKWPWWPWRRX
Loop peptides with one disulphide bridge
Thanatin PDB: 8TFV
Arthropods Podisus maculiventris
GSKKPVPIIYCNRRTGKCQRM

29
General mechanism of action
Although, the precise mechanism of action of antimicrobial peptides is still not clearly
understood, there are general features described; from membrane permeabilization to
actions on diverse intracellular target molecules, including immune-modulatory
activities (Rahnamaeian 2011).
Pore-forming ability
The selective interaction with anionic membranes is a notable ability of cationic AMPs.
The hydrophilic positive charged domains facilitate the peptides to interact with the
negatively charged microbial surfaces and head groups of bilayer phospholipids leading
to cell membrane penetration (Rahnamaeian 2011). At present, three mechanisms
explain the pore formation:
“Carpet like”, where an initial interaction is electrostatically driven and destruction of
the cell membrane is given by a collaborative action of the peptides. Peptide self-
associate onto the acidic phospholipid- rich region of lipid bilayers and once there the
peptides would permeate the membrane when a local threshold concentration has been
reached (Rahnamaeian 2011); (Boix and Nogués 2007). A second mechanism, is the so-
called “Barrel- stave”, where α-helical peptides insert into the hydrophobic core of the
membrane and form transmembrane pores. In the third mechanism, “Toroidal”, the
peptides build toroidal pores in the lipid bilayers with toroidal conformation. Pore
construction is managed by the lipid polar head groups and the helix bundles orient
vertically to the membrane exterior. In other words, the attached peptides aggregate and
trigger the lipid monolayers to bend through the pore so that both the inserted peptides
and the lipid head groups line the water core. Figure 12 shows a summary of membrane
pore mechanism driven by antimicrobial peptides.

30
Figure 12: Membrane pore-forming mechanisms by α-helical antimicrobial peptides. Taken from (Rahnamaeian 2011).
Intracellular targets
Several AMPs can cross the microbe membranes and have intracellular targets. There
are multiple intracellular potential functional targets that mediate antimicrobial activity:
DNA and protein synthesis, chaperone-assisted protein folding, key cellular enzymatic
activities and cytoplasmic membrane or cell wall synthesis. As an example, insect
antimicrobial peptides pyrrhocoricin, drosocin and apiadaecin bind to the bacterial heat
shock protein DnaK and this interaction is associated with cell death (Kragol et al.
2002). Binding to DnaK prevents chaperone assisted protein folding and inhibits its
associated ATPase activity. For DNA interaction, Buforin II, a linear peptide derived
from proteolytic processing of histone H2A, has been reported in many researches
(Pavia et al. 2012); (Lan et al. 2010). Another peptide that likely functions through
DNA binding and/or inactivation of cellular process is the tryptophan-rich peptide
isolated from bovine granulocytes indolicidin (Nicolas 2009).
Immunomodulation by AMPs
AMPs can help to inhibit the infection based on their immunomodulatory properties
related to cross-talking with both innate and adaptative immunity. For example, several
AMPs can neutralize the adverse effects of LPS in vitro and in vivo. Among them, the
most studied are cathelicidin, defensin and polymyxin (Kruse & Kristensen 2008). In
particular, cathelicidins are able to directly interact, neutralize and disaggregate LPS.
Other immunomodulatory related activity is chemotaxis. As an example defensins are

31
described as potent chemoattracts for several cellular types as CD4+, CD45+, CD8+, T
cells and dendritic cells.
Peptide PR-39, a proline and arginine rich antimicrobial peptide isolated from pig
intestine, also regulate various processes such as cell development, cell proliferation,
cell cycle control, cell-survival, migration, and invasion by binding with the Cas family
adapter protein, p130 (Pushpanathan et al. 2013).
1.3.1 Antimicrobial peptides and proteins with celullar uptake properties
Many AMPs have been described as a separate class of natural cell-penetrating peptides
(CPPs) that can enter eukaryotic cells in a non-disruptive way without apparent
cytotoxicity. Moreover, many CCPs are structurally similar to antimicrobial peptides
involved in host defence. There are a number of AMPs that have also been convincingly
demonstrated to enter microbial cells at low to moderate concentrations. These AMPs
include Apidaecin, Bufforin II and Histatin-5 (Castle et al. 1999); (Park et al. 2000),
(Mochon and Liu 2008). During an immune response, antimicrobial peptides are
released or deposited at sites of infection by host defence such as macrophages and
neutrophils, and they kill pathogens through lethal cell permeabilization or inhibition of
intracellular targets.
Some CPPs, such as penetratin, pVEC, TP10, Esculentin, TAT have been shown to
enter to C. albicans cells (Holm et al. 2005); (Luca et al. 2013). To date, the human
salivary Histatin-5 peptide, which is active against the human pathogenic fungus
Candida albicans, has been studied in detail. Live-cell imaging has shown that Histatin-
5 enters fungal cells in a concentration dependent manner by either endocytic
internalization or direct translocation across the plasma membrane (Mochon and Liu
2008). However, only direct translocation into the cytosol involving permeabilization of
the plasma membrane was reported to result in the death of Candida cells (Mochon and
Liu, 2008); (Jang et al. 2010).
1.3.2 Cell penetrating Pancreatic-type ribonucleases
Cellular internalization also has been reported by pancreatic-type ribonucleases in
diverse cell line types. Onconase (ONC), Bovine Seminal (BS-RNase) and the human

32
eosinophil protein are involved in endocytic internalization and cell cytotoxicity.
ONC and BS-RNase are homologues of bovine pancreatic ribonuclease (RNase A) and
are potent cytotoxins that have been extensively characterized. BS-RNase, obtained
from bovine sperm, is a dimeric protein with two identical subunits; it shows
aspermatogenic, antitumor, embryotoxic and immunosuppressive activities. The
cytotoxic effect of BS-RNase is accompanied by the induction of apoptosis both in
human lymphocytes and in several tumour cell lines (Sinatra et al. 2000); it enters into
the cells by adsorptive endocytosis and evades the cytosolic ribonuclease inhibitor (Kim
et al. 1995); (Chao & Raines 2011). ONC is an RNase isolated from amphibian oocytes,
and is cytostatic and cytotoxic to numerous tumour cell lines. The tumour growth
controlling effect of ONC is achieved by degrading the RNA within cancer cells. This
results in the inhibition of protein synthesis and the arrest of the cell cycle (Wu et al.
1993). ONC treated cell lines also displayed apoptosis and, recently, an unusual entry
process that relies on clathrin-dependent endocytic uptake has been described. Recent
studies indicate that ONC substantially decreases the content of reactive oxygen species
(ROS) both in normal and in tumour cell lines (Ardelt et al. 2007).
Eosinophil cationic protein induces apoptosis in mammalian cells (Navarro et al. 2008)
in a cell-dependent manner (Benito et al. 2008). In the human bronchial epithelial cell
lines, Beas 2B, ECP is internalized following a clathrin- and caveolin –independent but
lipid raft-dependent macropynocytosis, being the cell-surface-bound heparin sulphate its
major receptor. In Beas-2B, ECP causes apoptosis mainly through the TNF-α-mediated
caspase-8 specific pathway in a mitochondria-independent manner (Chang et al. 2010).
In contrast, apoptosis does not require internalization in human acute promyelocytic
leukaemia HL-60, cervix adenocarcinoma HeLa cell lines, and primary cultures of
cerebellar granule cell and astrocytes. ECP binds and aggregates on the cell surface,
altering membrane permeability, which results in a modification of ionic intracellular
equilibrium (Navarro et al. 2008); (Navarro et al. 2010).
1.4 CANDIDA ALBICANS GENERAL FEATURES
Candida albicans is a common human fungal pathogen that colonizes the skin and
mucosal surfaces of most healthy individuals. C. albicans can cause two major types of

33
infections in humans: superficial infections, like oral or vaginal candidiasis, and life-
threatening systemic infections (Mayer et al. 2013). Several factors and activities have
been identified which contribute to the pathogenic potential of this fungus. As a first
consideration, Candida albicans displays a complex cell wall organization that plays a
role in maintaining structural integrity and in mediating adherence, whether to host or
microbes. The cell wall is composed of 90% carbohydrate (Chitin, β-1,3 glucan, β-1,6
glucan) and 10% protein (adhesins, invasins, hydrolases, etc.) (Molero et al. 1998). All
the components are implicated in Candida pathogenesis and contribute to the resistance
against the attack by host molecules or antifungal drugs.
On the other hand, C. albicans is a polymorphic fungus that has the ability to switch
between yeast and filamentous forms. This morphological transition is crucial as a
virulence factor promoting the disease progression (Han et al. 2011). In general C.
albicans can grow in several distinct morphological forms: yeast, hyphae, and
pseudohyphae, according to environmental conditions. The capacity to switch rapidly
in response to certain environmental signals is considered to be a critical virulence
factor for these fungi. In C. albicans, each morphology stage confers advantages in the
course of infection. The yeast form is important for dissemination through the
bloodstream and adherence to endothelial surfaces (Sudbery et al. 2004). The
filamentous forms are more adapted for invasion through the host epithelial tissue and
also have a higher resistance to phagocytosis due to their morphology (Rooney & Klein
2002). Indeed, the yeast-to-filamentous or vice versa transition can be induced by
distinct growing media conditions: carbon sources, temperature, pH, etc. Also, under
specific environmental conditions, the cooperative microbial behaviour cell-to-cell
offers a synchronised morphogenesis mediated by chemical signals. This phenomenon
called “quorum sensing” involves an autoinduction process by which individual cells
release small diffusible molecules into their environment and these molecules are
sensed by all cells in the population (Kruppa 2009); (Han et al. 2011).


AIMS OF THE THESIS


34
2. AIMS OF THE THESIS
The main objective of the present thesis is the characterization of representative human
ribonucleases involved in host defence. The main sections of this work are detailed
below:
• Analysis of the contribution of post-translational modifications of RNase 3/ECP
native forms in its antimicrobial activity.
• Analysis of the antifungal activity of RNase 3/ECP and RNase 7. Candida
albicans as an eukaryotic pathogen model to study the potential protein
internalization and contribution of its catalytic activity.
• Exploring RNase 8 structure-function. Design of a new expression protocol and
functional characterization.


MATERIALS AND METHODS


35
3. MATERIALS AND METHODS
Materials
• E. coli XL1-blue strain (Stratagen, La Jolla, CA).
• E. coli BL-21 (λDE3) strain (Stratagen, La Jolla, CA).
• Quickchange site-directed mutagenesis kit (Stratagen, La Jolla, CA).
• pET11c and pET-45b(+) (Novagen, Madison, WI).
• Oligonucleotides (Roche Diagnostics, Mannheim, Germany).
• BacTiter-Glo assay kit (Promega, Madison, WI).
• SYTOX® Green (Invitrogen, Groningen, the Netherlands).
• DiSC3(5) (3,3 dipropylthiacarbocyanine) (Invitrogen, Groningen, Netherlands)
• BC (BODIPY TR cadaverine, where BODIPY is boron dipyrromethane (4,4-
difluoro-4-bora-3a,4a-diaza-s-indacene) (Invitrogen Groningen, Netherlands).
• Dioleoyl phosphatidylcholine (DOPC) and dioleoyl phosphatidylglycerol (DOPG)
(Avanti Polar Lipids, Birmingham, AL)
• ANTS (8-aminonaphthalene-1,3,6-trisulfonic acid disodium salt) (Molecular
Probes, Eugene, OR).
• DPX (p-xylenebispyridinium bromide) (Molecular Probes, Eugene, OR).
• DPA (dipicolinic acid) (Molecular Probes, Eugene, OR).
• Terbium chloride (TbCl3), (Molecular Probes, Eugene, OR).
• Dextran labelled with rhodamine green (Sigma-Aldrich, St. Louis, MO)
• LPS (lipopolysaccharides) from E. coli serotype 0111:B4 (Sigma-Aldrich St. Louis,
MO)
• Mycological peptone, Dextrose, final pH 5.6, (Fluka-Sigma, St. Louis, MO)
• Live/Dead Kit (Bac Light) (Molecular Probes, Carlsbad CA, USA)
• Sabouraud dextrose broth (Sigma-Aldrich, St. Louis, MO)
• His-trap affinity column based on Ni-Sheparose matrix and the gel exclusion
column Hiload 26/20 superdex 200 (GE Healthcare, Milwaukee, WI, USA).
• HPLC reverse-phase column (Symmetry C18) (Waters, Milford, MA).

36
• Isopropyl-D-thiogalactopyranoside (IPTG) (Apollo Scientific, Manchester, UK)
• Ampicillin (Apollo Scientific, Manchester, UK)
• LB medium (Apollo Scientific, Manchester, UK)
• Dithiothreitol (DTT) (Apollo Scientific, Manchester, UK)
• Enterokinase (Apollo Scientific, Manchester, UK)
• Poly (C), poly(A) and poly (U) (Sigma-Aldrich, St. Louis, MO)
• Polyacrylamide gel electrophoresis (Bio-Rad, Richmond, CA)
• PD-10 desalting columns with Sephadex G-25 (Amersham Pharmacia Biotech,
Uppsula, Sweden)
• Staphylococcus aureus 502A (ATCC), Acinetobacter baumannii (ATCC 15308),
Micrococcus luteus (ATCC 7468) and C. albicans (ATCC 90028).

37
3.1 METHODS OF EXPRESSION AND PURIFICATION OF RECOMBINANT
PROTEINS
All the recombinant proteins analysed in this work were expressed in Escherichia coli
BL21 (λDE3) strain. In each case, the cells were transformed by the vector carrying the
corresponding synthetic gene. The genes of RNase 3/ECP and RNase 7 were cloned
into the pET11c vector and the gene of RNase 8 was cloned into pET45b(+) vector.
Proteins were purified from the inclusion bodies fraction (Boix et al. 1999); (Boix 2001)
or in the case of RNase 8, from the soluble fraction as an His-tagged protein.
3.1.1 Expression of recombinant proteins in E.coli
This protocol was used for the preparation of RNase 3/ECP, RNase 7 and their
corresponding mutant forms.
3.1.1.1 Media preparation * LB (Luria Bertani). Dissolve LB in deionised water (25 g per L) and sterilize the media by autoclave.
* TB (Terrific Broth).
Composition (for 1 L)
In 900 mL In 100 mL Tryptone 12g Yeast extract 24g Glycerol 4 mL
KH2PO4 2.31g K2HPO4 12.45g
Add deionised water up to 900 mL Add deionised water up to 100 mL Sterilize both solutions separately and mix them when the temperature is below 50ºC.
3.1.1.2 Expression • To 20 mL of LB medium, add ampicillin to a final concentration of 100 µg/mL
• Inoculate LB medium with E. coli cells (either from a glycerinate stock (15%
glycerol) or an agar plate colony).
• Keep shaking LB culture overnight at 250 rpm, 37 ºC.

38
• Inoculate 1 litre of TB with 10 mL of the overnight culture after adding ampicillin to
a final concentration of 400 µg/mL
• Incubate 2 to 3 hours in an orbital shaker at 250 rpm, 37ºC until the OD600= 0.5- 0.7
• Add IPTG to a final concentration of 1 mM and incubate during 4 hours.
• Harvest the cells by centrifugation 10 min at 15 000 x g and keep the sediment for
further processing.
3.1.1.3 Protein purification 3.1.1.3.a Protein solubilisation and refolding
• Resuspend the pellet in 50 to 100 mL (per each litre of culture) of the buffer 1
Buffer 1: 10 mM Tris HCl pH 8.0
2 mM EDTA.
• Keep the resuspended cells on ice, sonicate during 5-10 minutes intervals to avoid
overheating of the sample.
• Centrifuge at 20 000 xg for 30 min at 4ºC.
• Discard supernatant.
• Resuspend the pellet in 10 mL (10 mL per litre of culture) of the buffer 2
Buffer 2: 50 mM Tris HCl pH 8.0
300 mM NaCl
2 mM EDTA.
• Keep stirring at room temperature for 30 min.
• Centrifuge at 20 000 x g for 30 min at 4 ºC.
• Discard supernatant.
• Resuspend pellet in 12.5 mL (per each litre of culture) of the denaturing buffer
Buffer 3: 6 M Guanidine-HCl
100 mM Tris acetate pH 8.5
2 mM EDTA.
• Add reduced glutathione to a final concentration of 80 mM. While adding
glutathione reduced, add solid Tris-(hydroxymethyl)-aminomethane to sample in
order to keep pH at pH 8.0 until the reduced glutathione is completely dissolved.
• Keep stirring the solution at room temperature and under nitrogen atmosphere
during 2h.
• Centrifuge at 20 000 x g for 30 min at 4 ºC.

39
• Discard pellet and add the supernatant to the refolding buffer:
Refolding buffer: 100 mM Tris acetate pH 8,5
0.5 M L-arginine
0.4 mM oxidized glutathione.
The volume of the refolding buffer is to ensure a dilution of the sample of at least 50
fold.
The supernatant must be added drop by drop (approx. 5 mL each 10-15 min) while
stirring the refolding buffer.
• Keep stirring during 48 hours at 4 ºC.
• Centrifuge at 16000 x g for 30 minutes at 4 ºC to remove unfolded proteins and
other particles which may disturb next steps of processing like membrane plugging
during the process of buffer exchange and concentration.
3.1.1.3.b Concentration and buffer exchange The sample volume must be reduced and sample washed by the appropriate buffer
according to the conditions of chromatography. In our case a system consisting of a
membrane (Prep/Scale-TFF Cartridge) (Millipore) connected to a pump system
(Millipore) was used to ensure the concentration, dialysis and buffer exchange of the
sample.
• Concentrate sample up 250 mL.
• Wash the sample with approx. 10 volumes (2.5 litres) of the chromatography buffer.
• Recover the sample, centrifuge it 30 min at 15000 g, and filter it before loading to
the chromatography column.
3.1.1.3.c Cation exchange chromatography For the protein purification, the sample was loaded onto a cation exchange FPLC
column (Resource S) equilibrated with the initial buffer (A).
Buffers used in the chromatography were according to the protein properties.
In all cases, after loading the sample, the elution was carried out at a flow rate of 2
mL/min with an initial 10-min wash followed by a 45-min linear gradient from 100%
initial buffer to 100% elution buffer (B).

40
The peak fractions corresponding to the protein were mixed and desalted with deionised
water using the Amicon Ultra centrifugal unit filters. The sample was then frozen and
lyophilized. Protein was stored at -20 ºC.
• Purification scheme:
Prepare Buffer A: 150 mM Sodium acetate pH 5.0
Buffer B: 150 mM Sodium acetate pH 5.0 + 2M NaCl.
• Equilibrate the column Resource S with buffer A.
• Elute the sample in linear gradient from 0 to 2 M with buffer B.
Concentrate and desalt the protein fractions with deionized water 10x volume in
Amicon Ultra-15 centrifugal unit filter.
Freeze the protein to -80 ºC and lyophilize.
3.1.2 Expression and purification of RNase 8
Up to now, no adequate high yield method of purification of the recombinant human
RNase 8 has been reported. In the process of preparation of recombinant RNase 8, very
few or no protein was obtained with any method of purification carried out for the
preparation of most of other RNases including the human RNase 7, which share almost
80% of identity with RNase 8. In our first attempts of purification, high tendency of
protein aggregation was observed in the crude extract as well as during the process of
purification.
The expression of recombinant proteins as fusion proteins allows an effective capture of
the protein in the process of chromatography. For this purpose, the vector pET-45b(+)
which allows the expression of an N-terminus hexahistidine tagged protein was
selected.
3.1.2.1 RNase 8 gen cloning into the pET-45b(+) vector The cloning of the RNase 8 gene into the pET-45b(+) plasmid needed a previous
modification to introduce an NdeI restriction site in the cloning sequence of the plasmid
since the RNase 8 gen is delimited by NdeI and BamHI sites. This modification
involved the substitution of the PshAI restriction site by an NdeI restriction site. The
PshAI cloning site is involved in the fusion area between the histidines tag and the N-

41
terminus of the protein leading to the enterokinase cleavage sequence. For the
substitution of PshAI restriction site by NdeI restriction site the mutagenic
oligonucleotide: 5´-GATGACGACGACGAGATATGT-3´ and its complementary
sequence were used as primers. However, this substitution caused, after cloning, a
change in the enterokinase cleavage sequence. This change led to a substitution of the
amino acid Lys by Ile. Then, a new mutagenesis process was required to restore the
enterokinase cleavage sequence and the open reading frame. The mutagenic
oligonucleotide 5´-GATGACGACGACAAGATGAAGCCAAGGACATG-3´ and its
complementary sequence were used as primers in the mutagenesis process (Figure 13).
- The Quickchange site-directed mutagenesis kit was used in the process of
mutagenesis.
5’---GAT GAC GAC GAC ATA TGA AGC CCA AGG ACA TGA CAT CA--3’
3’-CTA CTG CTG CTG ACT TCG GGT TCC TGT AC- 5’TT CT
5’---GAT GAC GAC GAC AAG AGT CCG GAT CCC AAT TGG GAG---3’
PshA I BamH I
5’---GAT GAC GAC GAC ATA TGT CCG GAT CCC AAT TGG GAG---3’Nde I BamH I
RNase 8 gen Cloning into the vector
5’---GAT GAC GAC GAC AAG ATG AAG CCC AAG GAC ATG ACA TCA---3’Asp Asp Asp Asp Lys Met Lys LysPro Asp Met Thr Ser
3’-CTA CTG CTG CTG TAT ACA GGC CTA GGG TTA AC-5’
5’---GAT GAC GAC GAC AAG AGT CCG GAT CCC AAT TGG GAG---3’
5’---GAT GAC GAC GAC ATA TGA AGC CCA AGG ACA TGA CAT CA--3’Asp Asp Asp Asp Ile Stop
Enterokinase cleavage site
Site-directed mutagenesis
Site-directed mutagenesis
pET-45b(+) cloning region
5’---GAT GAC GAC GAC ATA TGA AGC CCA AGG ACA TGA CAT CA--3’
3’-CTA CTG CTG CTG ACT TCG GGT TCC TGT AC- 5’TT CT
5’---GAT GAC GAC GAC ATA TGA AGC CCA AGG ACA TGA CAT CA--3’
3’-CTA CTG CTG CTG ACT TCG GGT TCC TGT AC- 5’TT CT
5’---GAT GAC GAC GAC AAG AGT CCG GAT CCC AAT TGG GAG---3’
PshA I BamH I
5’---GAT GAC GAC GAC ATA TGT CCG GAT CCC AAT TGG GAG---3’Nde I BamH I
5’---GAT GAC GAC GAC ATA TGT CCG GAT CCC AAT TGG GAG---3’Nde I BamH I
RNase 8 gen Cloning into the vector
5’---GAT GAC GAC GAC AAG ATG AAG CCC AAG GAC ATG ACA TCA---3’Asp Asp Asp Asp Lys Met Lys LysPro Asp Met Thr Ser
5’---GAT GAC GAC GAC AAG ATG AAG CCC AAG GAC ATG ACA TCA---3’Asp Asp Asp Asp Lys Met Lys LysPro Asp Met Thr Ser
3’-CTA CTG CTG CTG TAT ACA GGC CTA GGG TTA AC-5’
5’---GAT GAC GAC GAC AAG AGT CCG GAT CCC AAT TGG GAG---3’
5’---GAT GAC GAC GAC ATA TGA AGC CCA AGG ACA TGA CAT CA--3’Asp Asp Asp Asp Ile Stop
5’---GAT GAC GAC GAC ATA TGA AGC CCA AGG ACA TGA CAT CA--3’Asp Asp Asp Asp Ile Stop
Enterokinase cleavage site
Site-directed mutagenesis
Site-directed mutagenesis
pET-45b(+) cloning region
Mutagenic oligonucleotide
Mutagenic oligonucleotide
5’---GAT GAC GAC GAC ATA TGA AGC CCA AGG ACA TGA CAT CA--3’
3’-CTA CTG CTG CTG ACT TCG GGT TCC TGT AC- 5’TT CT
5’---GAT GAC GAC GAC AAG AGT CCG GAT CCC AAT TGG GAG---3’
PshA I BamH I
5’---GAT GAC GAC GAC ATA TGT CCG GAT CCC AAT TGG GAG---3’Nde I BamH I
RNase 8 gen Cloning into the vector
5’---GAT GAC GAC GAC AAG ATG AAG CCC AAG GAC ATG ACA TCA---3’Asp Asp Asp Asp Lys Met Lys LysPro Asp Met Thr Ser
3’-CTA CTG CTG CTG TAT ACA GGC CTA GGG TTA AC-5’
5’---GAT GAC GAC GAC AAG AGT CCG GAT CCC AAT TGG GAG---3’
5’---GAT GAC GAC GAC ATA TGA AGC CCA AGG ACA TGA CAT CA--3’Asp Asp Asp Asp Ile Stop
Enterokinase cleavage site
Site-directed mutagenesis
Site-directed mutagenesis
pET-45b(+) cloning region
5’---GAT GAC GAC GAC ATA TGA AGC CCA AGG ACA TGA CAT CA--3’
3’-CTA CTG CTG CTG ACT TCG GGT TCC TGT AC- 5’TT CT
5’---GAT GAC GAC GAC ATA TGA AGC CCA AGG ACA TGA CAT CA--3’
3’-CTA CTG CTG CTG ACT TCG GGT TCC TGT AC- 5’TT CT
5’---GAT GAC GAC GAC AAG AGT CCG GAT CCC AAT TGG GAG---3’
PshA I BamH I
5’---GAT GAC GAC GAC ATA TGT CCG GAT CCC AAT TGG GAG---3’Nde I BamH I
5’---GAT GAC GAC GAC ATA TGT CCG GAT CCC AAT TGG GAG---3’Nde I BamH I
RNase 8 gen Cloning into the vector
5’---GAT GAC GAC GAC AAG ATG AAG CCC AAG GAC ATG ACA TCA---3’Asp Asp Asp Asp Lys Met Lys LysPro Asp Met Thr Ser
5’---GAT GAC GAC GAC AAG ATG AAG CCC AAG GAC ATG ACA TCA---3’Asp Asp Asp Asp Lys Met Lys LysPro Asp Met Thr Ser
3’-CTA CTG CTG CTG TAT ACA GGC CTA GGG TTA AC-5’
5’---GAT GAC GAC GAC AAG AGT CCG GAT CCC AAT TGG GAG---3’
5’---GAT GAC GAC GAC ATA TGA AGC CCA AGG ACA TGA CAT CA--3’Asp Asp Asp Asp Ile Stop
5’---GAT GAC GAC GAC ATA TGA AGC CCA AGG ACA TGA CAT CA--3’Asp Asp Asp Asp Ile Stop
Enterokinase cleavage site
Site-directed mutagenesis
Site-directed mutagenesis
pET-45b(+) cloning region
Mutagenic oligonucleotide
Mutagenic oligonucleotide
5’---GAT GAC GAC GAC ATA TGA AGC CCA AGG ACA TGA CAT CA--3’
3’-CTA CTG CTG CTG ACT TCG GGT TCC TGT AC- 5’TT CT
5’---GAT GAC GAC GAC AAG AGT CCG GAT CCC AAT TGG GAG---3’
PshA I BamH I
5’---GAT GAC GAC GAC ATA TGT CCG GAT CCC AAT TGG GAG---3’Nde I BamH I
RNase 8 gen Cloning into the vector
5’---GAT GAC GAC GAC AAG ATG AAG CCC AAG GAC ATG ACA TCA---3’Asp Asp Asp Asp Lys Met Lys LysPro Asp Met Thr Ser
3’-CTA CTG CTG CTG TAT ACA GGC CTA GGG TTA AC-5’
5’---GAT GAC GAC GAC AAG AGT CCG GAT CCC AAT TGG GAG---3’
5’---GAT GAC GAC GAC ATA TGA AGC CCA AGG ACA TGA CAT CA--3’Asp Asp Asp Asp Ile Stop
Enterokinase cleavage site
Site-directed mutagenesis
Site-directed mutagenesis
pET-45b(+) cloning region
5’---GAT GAC GAC GAC ATA TGA AGC CCA AGG ACA TGA CAT CA--3’
3’-CTA CTG CTG CTG ACT TCG GGT TCC TGT AC- 5’TT CT
5’---GAT GAC GAC GAC ATA TGA AGC CCA AGG ACA TGA CAT CA--3’
3’-CTA CTG CTG CTG ACT TCG GGT TCC TGT AC- 5’TT CT
5’---GAT GAC GAC GAC AAG AGT CCG GAT CCC AAT TGG GAG---3’
PshA I BamH I
5’---GAT GAC GAC GAC ATA TGT CCG GAT CCC AAT TGG GAG---3’Nde I BamH I
5’---GAT GAC GAC GAC ATA TGT CCG GAT CCC AAT TGG GAG---3’Nde I BamH I
RNase 8 gen Cloning into the vector
5’---GAT GAC GAC GAC AAG ATG AAG CCC AAG GAC ATG ACA TCA---3’Asp Asp Asp Asp Lys Met Lys LysPro Asp Met Thr Ser
5’---GAT GAC GAC GAC AAG ATG AAG CCC AAG GAC ATG ACA TCA---3’Asp Asp Asp Asp Lys Met Lys LysPro Asp Met Thr Ser
3’-CTA CTG CTG CTG TAT ACA GGC CTA GGG TTA AC-5’
5’---GAT GAC GAC GAC AAG AGT CCG GAT CCC AAT TGG GAG---3’
5’---GAT GAC GAC GAC ATA TGA AGC CCA AGG ACA TGA CAT CA--3’Asp Asp Asp Asp Ile Stop
5’---GAT GAC GAC GAC ATA TGA AGC CCA AGG ACA TGA CAT CA--3’Asp Asp Asp Asp Ile Stop
Enterokinase cleavage site
Site-directed mutagenesis
Site-directed mutagenesis
pET-45b(+) cloning region
Mutagenic oligonucleotide
Mutagenic oligonucleotide
Figure 13: RNase 8 gene cloning The first mutagenesis was carried out for insertion of NdeI restriction site and the second mutagenesis was to restore the open reading frame and the catalytic site of Enterokinase.
42
- After each mutagenesis reaction, E. coli XL1-blue competent cells were transformed
by 1 µL reaction mixture and plated on agar media containing ampicillin (75 µg/mL).
- Plasmid extraction was carried out for the subsequent DNA sequencing.
- The plasmid that directs the expression of the His-tag RNase 8 was used to transform
E. coli BL21 (λDE3) strain for the protein expression.
- The transformed E. coli BL21 (λDE3) strain was stored at -80ºC as a suspension
containing 15% glycerol (v/v).
3.1.2.2 Expression of the His-tagged RNase 8
• To l0 mL of LB add ampicillin to a final concentration of 50-75 µg/mL.
• Inoculate with transformed E. coli BL21 (λDE3).
• Keep shaking the bacterial culture overnight at 250 rpm and 37ºC.
• Inoculate 1 L of LB containing ampicillin (400 µg/mL) with 15 mL of the overnight
culture.
• Incubate at 250 rpm and 37ºC until an OD600 of approximately 0.6-0.7.
• Add IPTG to a final concentration of 1 mM.
• Keep shaking at room temperature for additional 4h.
• Harvest the cells by centrifugation 10 min at 15 000 x g.
• Resuspend the cell pellet in 40 mL of Tris/HCl 10 mM buffer, 2 mM EDTA and 1
mM PMSF.
• Sonicate during 5-10 minutes intervals. Keep the resuspended cells on ice to avoid
overheat of the sample.
• Centrifuge at 30000 x g for 45 min.
• Clarify the supernatant by filtration on 0.22 µm filter before loading on the Ni2+
affinity chelate chromatography.
3.1.2.3 Purification of the His-tagged RNase 8 3.1.2.3.a Affinity chromatography
• Load the supernatant on Ni2+ affinity chelate column previously equilibrated with
binding buffer 50 mM Tris/HCl pH 7.5, 500 mM NaCl, containing 60 mM
imidazole.

43
• Wash the column by 5 fold after loading the sample, with the binding buffer to
remove unbounded proteins.
• Elute the histidine tagged RNase 8 with the buffer 50 mM Tris/HCl pH 7.5, 500
mM NaCl, containing 300 mM imidazole.
• Add DTT and EDTA to the protein fraction to final concentrations of 5 mM to avoid
as much as possible the protein aggregation.
• Concentrate the sample up to 5 mL with Amicon Ultra-15 centrifugal unit filter
(10.000 K) and centrifuge before loading on the next chromatography column.
3.1.2.3.b Gel filtration chromatography In the gel filtration chromatography, Hiload 26/20 Superdex 200 FPLC column was
used. This column allows loading up to 5 mL sample volume.
• Equilibrate the column with the buffer 50 mM Tris/HCl pH 7.5 , 0.3 M NaCl, 5 mM
EDTA and 5 mM DTT at a flow rate of 0.5 mL/min.
• Apply 5 mL of the sample.
• Collect the peak fractions corresponding to the protein, and concentrate before
loading on the next chromatography column.
3.1.2.3.c Reverse-phase chromatography. Besides being a polishing step, this chromatography was used mainly for protein
desalting. In this step, reverse-phase HPLC column (Symmetry C18) was used and the
chromatography carried out at a flow rate of 1 mL/min using the following solutions:
Solvent A: H2O + 0.1% TFA.
Solvent B: Acetonitrile + 0.1% TFA.
• Equilibrate the column with a mixture of 90% solvent A and 10% solvent B.
• Inject the protein solution obtained in the previous chromatography.
• After loading the sample, the elution is carried out with an initial 10-min wash with
initial conditions followed by a 10-min linear gradient from the initial conditions to
75% solution A plus 25% solution B, then a second 30 min linear gradient from
75% solution A plus 25% solution B to 50% solution A plus 50% solution B.

44
• Mix the peak fractions corresponding to the His tagged RNase 8, freeze and
lyophilize. Store the protein at -20 ºC.
• After each step of purification process, check the purity of the protein by SDS-
PAGE.
3.1.2.4 His-tag removal and purification of RNase 8
3.1.2.4.a Enzymatic cleavage by enterokinase
• Dilute the His-tagged RNase 8 at a protein concentration of 1mg /mL in the
digestion buffer 10 mM Tris/HCl pH 7.5, containing 2 mM CaCl2.
• Add one unit of enterokinase for each mg of the protein.
• Incubate the reaction mixture 4 hours at 25ºC and immediately load on the Ni2+
affinity chromatography column.
3.1.2.4.b Purification of the RNase 8
To purify the RNase 8 from the mixture of the reaction catalysed by enterokinase, the
same process carried out for the purification of the His-tagged RNase 8 was used. The
only difference being the added amount of imidazole in the elution buffer.
• Equilibrate the column with 50 mM Tris/HCl pH 7.5, 500 mM NaCl buffer
containing 10 mM Imidazole. After loading the sample, carry out consecutive
column wash with buffer solutions containing 100 and 300 mM imidazole to elute
the detagged RNase 8 and the undigested His tagged RNase 8 respectively.
• Concentrate the fraction corresponding to RNase 8 as previously, centrifuge and
load on a reverse-phase HPLC column (Symmetry C18) to desalt the protein
solution.
• Freeze and lyophilize the peak fraction.
• After each step of purification process, check the purity of the protein by SDS-
PAGE 15 %.
3.1.3 SDS- polyacrylamide gel electrophoresis
During the process of preparation of proteins, the purity must be checked by SDS-
PAGE after each step.

45
* Reagents
- Solution A: 30% Acrylamide/bis-acrylamide
- Solution B: 1.5 M Tris/HCl, pH 8.8, 0.4% SDS
- Solution C: 0.5 M Tris/HCl, pH 6.8, 0.4% SDS
- TEMED
- Ammonium persulfate (APS10%)
- Running Buffer
10 X Running buffer Tris 0.25 M Glycine 1.92 M SDS 1%
Dilute the 10X buffer to 1X concentration prior use
- 5 X loading buffer
Tris/HCl, pH 6.8 0.2 M Dithiothreitol or β-mercapto-ethanol 10 mM Glycerol 20% (v/v) SDS 10% (w/v) Bromophenolblue Trace
- Staining solution:
Methanol 30% Acetic acid 8% Commassie Brilliant blue 0.15 %
- Destaining solution:
Ethanol 25% Acetic acid 8%
*Resolving gel preparation
Components 10 mL resolving gel (for 2 mingels) For 15 % gel
Solution A 5 mL Solution B 2.5 mL Destilled water 2.5 mL TEMED 0.010 mL Ammonium persulfate 0.040 mL

46
• Stacking gel preparation
Components 3 mL resolving gel (for 2 minigels)
For 5 % gel Solution A 0.500 mL Solution C 0.750 mL Destilled water 1.900 mL TEMED 0.005 mL Ammonium persulfate 0.040 mL
* Procedure 1. Assemble the glass plate sandwich. Prepare the resolving gel solution as described
above.
2. Add APS and TEMED at the end, mix carefully to avoid formation of bubbles.
Polymerization begins as soon as APS is added to the mixture, so all subsequent actions
must be performed promptly.
3. Pour the gel solution between the glass plates with a pipette, leave about 1/4 of the
space free for the stacking gel. Carefully cover the top of the resolving gel with 50%
isopropanol or water, and wait until the resolving gel polymerizes (~30 min). A clear
line will appear between the gel surface and the solution on top when polymerization is
complete.
4. Discard the water or isopropanol. Wash gently with deionized water.
5. Pour the stacking gel solution (prepared as described above, add APS and TEMED
last) carefully with a pipette to avoid formation of bubbles. Insert combs. Allow the gel
to polymerize (~ 45 min).
6. Remove combs carefully. Put the gel into the electrophoresis tank, fill the tank
(bottom and top reservoirs) with fresh 1x Tris-glycine-SDS Buffer, make sure that the
gel wells are covered with the buffer.

47
7. Load protein ladder/marker and probes.
8. Set an appropriate voltage and current depending on how many gels you run.
9. Stop the electrophoresis run when the dye front reaches the bottom of the gel.
Disassemble the gel sandwich and proceed with gel staining.
*Staining
1- Place the gel in a tank containing the staining solution and keep shaking at 80 rpm in
orbital shaker for at least 15 min.
2- Destain the gel with a solution containing: acetic acid 8% (v/v) and methanol 20%
(v/v).
3.1.4 SDS-PAGE and activity staining gels (Zymogram)
The RNase activity assays is performed by zymogram on 15% SDS-PAGE gels
containing 3 mg per gel of either poly(C), poly(U) or poly(A) (Sigma) as substrate
according to the method described by (Bravo et al. 1994).
For gel preparation of this electrophoresis, reagents and procedure are identical to those
of the previous SDS-PAGE except that the volume of deionized water added to the
mixture of resolving gel must contain the substrate.
- Weigh the quantity of substrate at a rate of 3 mg per gel, add the corresponding
volume of deionized water and keep at 50-60ºC during 10 min.
- Stir manually each 2-3 min.
- When the substrate is completely dissolved, mix immediately with the mixture
containing solution A and B previously prepared.
- Add TEMED and ammonium persulfate and pour the solution immediately between
the glass plates.
- Proceed as in the previous electrophoresis for the preparation of the stacking gel.
* Sample preparation
Sample preparation is similar to the previous electrophoresis except that the loading
buffer does not contain reducing agent (β-mercapto-ethanol or DTT).

48
* Electrophoresis running
The conditions for running the electrophoresis are identical to those of the previous
SDS-PAGE.
* Staining
Stop the electrophoresis run when the dye front reaches the bottom of the gel.
Disassemble the gel sandwich and proceed with gel staining.
- Place the gel in a tank and wash it 3-fold five minutes time with a buffer 10 mM
Tris/HCl pH 7.5 containing 20% isopropanol to remove SDS from the gel.
- Pour off the previous solution and wash the gel 3-fold five minutes time with a buffer
10 mM Tris/HCl pH 7.5 to remove isopropanol from the gel.
- Pour of the previous solution and incubate the gel at room temperature in 100 mM
Tris/HCl, during 1h.
- Pour off the previous solution and stain the gel during 2-5 min with a solution of 0.2%
toluidine blue (w/v water).
- Pour off the staining solution to its container for the next use.
- Wash the gel with water until the expected bands appear.

49
3.2 METHODS FOR EVALUATION OF ANTIMICROBIAL ACTIVITY
3.2.1 Minimum Bactericidal Concentration (MBC)
The minimum bactericidal concentration (MBC100) is calculated as the lowest
concentration of protein required to completely eliminate any bacteria growth (E. coli,
S. aureus, M. luteus and A. baumannii).
• Inoculate 10 mL of LB medium with the corresponding bacterial strain and incubate
overnight at 37ºC.
• Dilute the overnight culture to 5x10⁵ CFU/mL.
• Dissolve the corresponding protein to assay in 10 mM sodium phosphate buffer, pH
7.5.
• Add serial concentration proteins in each tube of bacterial suspension.
• Incubate during 4 hours at 37 ºC.
• Spread and plate onto petri dishes.
• Incubate at 37 ºC overnight.
• Determine a minimal inhibitory concentration as the lowest concentration that
inhibits growth.
• Make each experiment by triplicate.
3.2.2 Minimal agglutination concentration (MAC)
The agglutinating activity is calculated as the minimum agglutinating concentration of
the protein tested, corresponding to the first condition where bacterial aggregates are
visible.
• Inoculate 10 mL of LB medium with the corresponding bacterial strain and incubate
overnight at 37 ºC.
• Sub-culture into a fresh LB medium and grow the bacterial suspension to an OD600
~ 0.2.
• Centrifuge the bacterial culture during 3 min at 5 000 x g, discard the supernatant
and wash the bacterial pellet with 10 mM sodium phosphate buffer, pH 7.5.
• Resuspend the bacterial pellet and plate 100 µL on 96-well microliter dishes.
50
• Dilute the corresponding protein to test in 10 mM sodium phosphate buffer, pH 7.5.
• Add serial protein concentrations.
• Incubate 1 hour in orbital shaker at 80 rpm at 37 ºC.
• Check by visual inspection the minimal protein concentration where bacteria
aggregates are visible.
• Make each experiment by triplicate.
3.2.3 Bacteria Viability Assay (IC50)
Viable metabolically active cells are measured by ATP quantification using a coupled
luminescence detection assay. Thus, the luminescent signal is proportional to the ATP
amount required for the conversion of luciferin into oxyluciferin in the presence of
luciferase. IC50 values, is defined as the concentration for which cell viability is reduced
up to 50%.
• Inoculate 10 mL of LB medium with the corresponding bacterial strain and incubate
overnight at 37 ºC.
• Sub-culture into a fresh LB medium and grow the bacterial suspension to an OD600
~ 0.2.
• Centrifuge the bacterial culture during 3 min at 5 000 x g, discard the supernatant
and wash the bacterial pellet with 10 mM sodium phosphate buffer, pH 7.5.
• Resuspend the bacterial pellet and plate 100 µL on to 96-opaque-walled multiwell
plates.
• Dissolve the corresponding protein to assay in 10 mM sodium phosphate buffer, pH
7.5.
• Add serial protein concentrations to each well.
• Incubate 4 hours at 37ºC in a shaker.
• Add a volume of BacTiter-Glo™ Reagent equal to the volume of cell culture
medium present in each well.
• Mix contents briefly on an orbital shaker and incubate for five minutes.
• Record luminescence with a 1-s integration time.
• Calculate fifty percentage inhibitory concentrations (IC50) by fitting the data to a
dose-response curve.

51
• Make each experiment by triplicate.
3.2.4 Bacteria cell leakage assay
The membrane permeabilization is measured by increase of fluorescence due to the
binding of the dye Sytox ® green to the intracellular DNA.
• Inoculate 10 mL of LB medium with the corresponding bacterial strain and incubate
overnight at 37 ºC.
• Sub-culture into a fresh LB medium and grow the bacterial suspension to an OD600
~ 0.2.
• Centrifuge the bacterial culture during 3 min at 5 000 x g, discard the supernatant
and wash the bacterial pellet with PBS twice.
• Dilute cell culture to OD600 ~0.05.
• Plate 100 µL on 96-opaque-walled multiwell plates.
• Treat bacteria suspension with 5 µM of SYTOX® Green nucleic acid dye during 1
hour.
• Dilute the corresponding protein to assay in PBS.
• Add serial protein concentrations to each well.
• Measure the fluorescence during 45 min using a 485 nm excitation wavelength and
520 nm emission wavelength.
• Calculate cell disruption percentage.
% Disruption=100*(Fp−F0)/(F100-F0)
where Fp is the final fluorescence intensity after the addition of the protein, F0 and
F100 are the fluorescence intensities before the addition of the protein and after the
addition of 10% Triton X-100.
• Calculate IC50 values by fitting the data to a nonlinear regression curve.
3.2.5 Bacteria Cytoplasmic Membrane-depolarization Assay
Membrane-depolarization is monitored, using the DiSC3 (5) lipophilic dye, which
changes its fluorescence intensity in response to changes in transmembrane potential.

52
• Inoculate 10 mL of LB medium with the corresponding bacterial strain and incubate
overnight at 37 ºC.
• Sub-culture into a fresh LB medium and grow the bacterial suspension to an OD600
~ 0.2.
• Centrifuge the bacterial culture during 3 min at 5 000 x g, discard the supernatant.
• Wash with 5 mM Hepes-KOH, 20 mM glucose, pH 7.2.
• Incubate 10 minutes shaker at 37 ºC.
• Resuspended in 5 mM Hepes-KOH, 20 mM glucose, and 100 mM KCl, pH 7.2 and
dilute cell culture to OD600 ~0.05.
• Incubate 10 minutes shaker at 37 ºC.
• Add DiSC3(5) to a final concentration of 0.4 µM.
• Incubate 20 min in shaker at 37 ºC.
• Add the corresponding protein concentration.
• Monitor changes in the fluorescence signal continuously at 20 ºC using an excitation
wavelength of 620 nm and an emission wavelength of 670 nm.
• Estimate the time required to achieve half of total membrane-depolarization by
nonlinear regression analysis.
3.2.6 Lipopolysaccharide Binding Assay
LPS binding is assessed using the fluorescent probe BODIPY TR cadaverine (BC). BC
binds strongly to native LPS, specifically recognizing the lipid A portion. When a
protein that interacts with LPS is added, BC is displaced from the complex and its
fluorescence is increased, decreasing its occupancy factor.
• To 1 mL of a continuously stirred mixture of LPS (10 µg /mL) and BC (10 µM) in 5
mM Hepes buffer at pH 7.5 in a quartz cuvette:
Add 1 o 2 µL aliquots of protein solution at different concentration.
• Measure the fluorescence on a Cary Eclipse spectrofluorimeter. The BC excitation
wavelength is 580 nm and the emission wavelength is 620 nm.
• Compute the ED50 at the midpoint of the fluorescent signal versus the protein
concentration of the displacement curve by a curve-fitting of the data to the
equation:
53
OF= (F0-F)/(F0-Fmax)
where OF is the occupancy factor, F0 the fluorescence intensity of BC alone, Fmax is
the intensity in the presence of LPS at a saturation concentration, and F is the
intensities of the LPS/BC mixtures at each displacer concentrations.
3.3 METHODS FOR ACTIVITY EVALUATION IN MODEL MEMBRANES
3.3.1 Liposome preparation
• Prepare large unilamellar vesicles (LUVs) using dioleoyl phosphatidylcholine
(DOPC) and dioleoyl phosphatidylglycerol (DOPG).
• Make up the lipid mixture in a proportion (3:2 molar ratio).
• Add 5 mL of chloroform.
• Introduce the lipid solution into a 250 mL round bottom flask with a ground glass
neck.
• Attach the flask to a rotary evaporator, rotate about 60 rpm and immerse the flask in
a thermostated water bath set at 50 ºC.
• Continue until all the liquid has evaporated from solution, and a dry lipid film has
been deposited on the walls of the flask.
• Continue for 15 min after the dry residue first appears.
• Remove the flask from the evaporator.
• Add 5 mL of in 10 mM Tris-HCl pH 7.4, 0.1 M NaCl in order to obtain a 1 mM
stock.
• Leave the flask rotating for 30 min, or until all the lipid has been removed from the
walls of the flask.
• Extrude the lipid mix using 100 nm polycarbonate membranes.
• Make sequential extrusion steps.
• Keep at 4 ºC.
54
3.3.2 Liposome aggregation
Aggregation of liposomes by the ribonucleases is determined by dynamic light
scattering measuring the hydrodynamic radius of liposomes at a reading scattering
angle of 90 º.
• Dilute the LUV stock to a 200 µM final lipid concentration.
• Add the protein concentration to assay.
• Measure liposome aggregation by monitoring the sample size changes during 15
minutes using a Malvern Zetasizer Nano instrument.
3.3.3 Liposome Leakage Assay
The protein capacity to trigger the liposome leakage content by markers of distinct MW
was assessed using Tb3+/DPA, ANTS/DPX and Dextran is calculated by changes in
fluorescence intensity.
3.3.3.1 Tb3+ / Dipicolinic acid (DPA) assay • Prepare LUVs (large unilamellar vesicles) using dioleoyl phosphatidylcholine
(DOPC) and dioleoyl phosphatidylglycerol (DOPG).
• Make up the lipid mixture in a proportion (3:2 molar ratio).
• Add 5 mL of chloroform.
• Introduce the lipid solution into a 250 mL round bottom flask with a ground glass
neck.
• Attach the flask to a rotary evaporator, evacuate, rotate about 60 rpm and immerse
the flask in a thermostated water bath set at 50 ºC.
• Continue until all the liquid has evaporated from solution, and a dry lipid film has
been deposited on the walls of the flask.
• Continue for 30 min after the dry residue first appears.
• Remove the flask from the evaporator.
• Add buffer 50 mM TbCl3, 100 mM sodium citrate and 10 mM TES, pH 7.2 to
obtain a concentration of 10 mM lipid.
• Froze and thawed 10 times to ensure the distribution of the indicator molecules
between the interior and exterior of the vesicles.
• Keep in constantly rotation during 3 hours.

55
• Extrude the lipid mix using 100 nm polycarbonate membranes.
• Make sequential extrusion steps.
• Separate unencapsulated material from vesicles by gel filtration column PD-10
using 50 mM TbCl3, 100 mM sodium citrate, 300 mM NaCl and 10 mM TES, pH
7.2 as an elution buffer.
• Dilute to a 30 µM final lipid.
• Add 75 µM of DPA before leakage measurement.
• Add different protein concentrations.
• Measure leakage activity using a 270 nm excitation wavelength and 490 nm
emission wavelength.
• Calculate percentage of leakage (% L) produced by the proteins after 1 hour of
incubation with the liposomes, with the following equation:
%L=100− (Fp−F0)/( F100-F0)
where Fp is the final fluorescence intensity after the addition of the protein (1 h), F0
and F100 are the fluorescence intensities before the addition of the protein and after
the addition of 0.5% Triton X-100.
3.3.3.2 ANTS/DPX assay • Prepare LUVs (large unilamellar vesicles) using dioleoyl phosphatidylcholine
(DOPC) and dioleoyl phosphatidylglycerol (DOPG).
• Make up the lipid mixture in a proportion (3:2 molar ratio).
• Add 5 mL of chloroform.
• Introduce the lipid solution into a 250 mL round bottom flask with a ground glass
neck.
• Attach the flask to a rotary evaporator, evacuate, rotate about 60 rpm and immerse
the flask in a thermostated water bath set at 50 ºC.
• Continue until all the liquid has evaporated from solution, and a dry lipid film has
been deposited on the walls of the flask.
• Continue for 15 min after the dry residue first appears.
• Remove the flask from the evaporator.
• Add 5 mL of 2.5 mM ANTS, 45 mM DPX, 20 mM NaCl, and 10 mM Tris/HCl at
pH 7.5.

56
• Leave the flask rotating for 30 min, or until all the lipid film has been removed from
the walls of the flask.
• Extruder the lipid mix using 100 nm polycarbonate membranes.
• Make sequential extrusion steps.
• Separate unencapsulated material from vesicles by gel filtration column PD-10
using 20 mM Tris/HCl at pH 7.5, 0.1 M NaCl as an elution buffer.
• Dilute to a 30 µM final lipid concentration.
• Measure leakage activity using a 386 nm excitation wavelength and 535 nm
emission wavelength.
• Add different protein concentrations.
• Calculate percentage of leakage (% L) as previously described.
3.3.3.3 Dextran assay • Prepare LUVs (large unilamellar vesicles) using dioleoyl phosphatidylcholine
(DOPC) and dioleoyl phosphatidylglycerol (DOPG).
• Make up the lipid mixture in a proportion (3:2 molar ratio).
• Add 5 mL of chloroform.
• Introduce the lipid solution into a 250 mL round bottom flask with a ground glass
neck.
• Attach the flask to a rotary evaporator, evacuate, rotate about 60 rpm and immerse
the flask in a thermostated water bath set at 50 ºC.
• Continue until all the liquid has evaporated from solution, and a dry lipid film has
been deposited on the walls of the flask.
• Continue for 15 min after the dry residue first appears.
• Remove the flask from the evaporator.
• Add 5 mL of 10 mM potassium phosphate, pH 7.5 buffer and 10 mg/mL labelled
dextran.
• Leave the flask rotating for 30 min, or until all the lipid has been removed from the
walls of the flask.
• Froze and thaw 10 times to ensure the distribution of the indicator molecules
between the interior and exterior of the vesicles.
• Extrude the lipid mix using a 100 nm polycarbonate membranes.
• Make sequential extrusion steps.

57
• Separate unencapsulate material from vesicles by gel filtration column PD-10 using
elution buffer of 10 mM potassium phosphate, pH 7.5 buffer containing 10 mg/mL
of unlabelled dextran.
• Dilute to a 30 µM final lipid concentration.
• Measure leakage activity using a 545 nm excitation wavelength and 600 nm
emission wavelength.
• Add different protein concentrations.
• Calculate percentage of leakage (% L) as previously described.
3.4 MICROSCOPY METHODS
3.4.1 Confocal microscopy
Protein distribution on Candida cell population is monitored by addition of protein
labelled with Alexa Fluor® 488. The interaction protein-Candida cell is followed
during time lapse.
• Inoculate 10 mL of sabouraud medium with C. albicans and incubate overnight at
37 ºC.
• Sub-culture into a fresh sabouraud medium and grow the yeast suspension to an
OD600=0.3, approx. 2x10⁶ cell/mL.
• Centrifuge the Candida culture during 5 min at 5 000 x g, discard the supernatant
and wash the cell pellet with PBS.
• Resuspend in PBS.
• Add 2 µL of HOECHST during 10 min to label the viable yeast.
• Wash pellet cell twice with PBS.
• Place 300 µL of label yeast into Glass Bottom Microwell Dishes – 35 mm petri dish.
• Add the corresponding labelled protein.
• Use a Leica TCS SP2 AOBS equipped with a HCX PL APO 63x1.4 oil immersion
objective, Germany.
• Record images by time lapse at intervals of 30 seconds during 2 hours.
3.4.1.1 Protein labelling
• Prepare 5 ml of sodium bicarbonate solution 1 M.

58
• Vortex or pipet up and down until fully dissolved.
• Dilute the protein to label at concentration of 2 mg/mL, in a suitable buffer (PBS or
0.1 M sodium bicarbonate).
• To 0.5 mL of the 2 mg/mL protein solution, add 50 µL of 1 M bicarbonate.
• Allow a vial of reactive dye to warm to room temperature. Transfer the protein
solution to the vial of reactive dye (Alexa Fluor® 488 Protein Labelling Kit-
Invitrogen).
• Stir the reaction mixture for 1 hour at room temperature.
• Add PBS up to 2.5 mL to labelling reaction.
• Separate labelled and unlabelled protein by gel filtration column PD-10 using buffer
PBS.
• Equilibrate the column with 5 volume of PBS.
• Add into the column the 2.5 mL labelling reaction.
• Elute with 3 mL of PBS.
• Repeat the elution 5 times.
• Measure the absorbance of the conjugate solution at 280 nm and 494 nm (Abs 280
and A494) in a cuvette with a 1 cm pathlength.
• Calculate the protein concentration of protein in the sample:
Protein Concentration (M) = ((Abs280- (Abs 494*0.11))/ Protein molar extinction coefficient.
3.4.2 Kinetic of yeast survival by Confocal Microscopy
Survival of yeast is monitored by addition of syto 9/propidium. Syto 9 is a DNA green
fluorescent dye that diffuses thorough intact cell membranes and propidium iodide is a
DNA red fluorescent dye that can only access the nucleic acids of membrane damaged
cells, displacing the DNA bound syto 9.
• Inoculate 10 mL of sabouraud medium with C. albicans and incubate overnight at
37 ºC.
• Sub-culture into a fresh sabouraud medium and grow the yeast suspension to an
OD600 ~ 0.4.
• Centrifuge the Candida culture during 5 min at 5 000 x g, discard the supernatant
and wash the cell pellet with 0.85% NaCl solution.
• Resuspend in a 0.85% NaCl solution.

59
• Mix syto 9/propidium iodide 1:1.
• Add equal volume yeast suspension.
• Incubate 5 min at 37ºC.
• Place 250 µL in a plate-cover slide system.
• Add the protein at a 5 µM final concentration.
• Capture confocal images using a laser scanning confocal microscope (Leica TCS
SP2 AOBS equipped with a HCX PL APO 63, x1.4 oil immersion objective; Leica
Microsystems, Wetzlar, Germany).
• Excite Syto 9 using a 488 nm argon laser (515–540 nm emission collected) and
propidium iodide using an orange diode (588– 715 nm emission collected).
• To record the time-lapse experiment, use Life Data Mode software (Leica),
obtaining an image every 1 min in an experiment lasting 90 min.
3.4.3 Scanning electron microscopy (SEM)
The cell population behaviour, bacteria surface and cell morphology upon incubation
with the protein are visualized by Scanning electron microscopy.
• Inoculate 10 mL of LB medium with the corresponding bacteria strain and incubate
overnight at 37 ºC.
• Sub-culture into a fresh LB medium and grow the bacteria suspension to OD600 ~
0.2.
• Centrifuge the bacterial culture during 3 min at 5 000 x g, discard the supernatant
and wash the bacterial pellet with 10 mM sodium phosphate buffer, pH 7.5.
• Resuspend the bacterial pellet and divide into sterile tubes. Place an approx. volume
1 mL in each tube.
• Dissolve the corresponding protein to assay in 10 mM sodium phosphate buffer, pH
7.5.
• Add 5 µM of the corresponding protein.
• Incubate at 37 ºC during 4 hours.
• Fix cell suspensions with 2.5% gluteraldehyde in 100 mM Na-cacodylate buffer (pH
7.4) for 2h at room temperature.
• Transfer to a nucleopore filter, which is kept in a hydrated chamber for 30 min
allowing the cells to adhere, and then wash to remove the glutaraldehyde.

60
• Resuspend in the same 100 mM Na-cacodylate buffer at pH 7.4.
• Attach cells post-fixed by immersing the filters in 1% osmium tetroxide in
cacodylate buffer for 30 min, rinse in the same buffer, and dehydrate in ethanol in
ascending percentage concentrations [31, 70, 90 (2x) and 100 (2x)] for 15 min each.
• Mount the filters on aluminium stubs, coated with gold- palladium in a sputter
coater (K550; Emitech, East Grinsted, UK).
• View the filters at 15 kV accelerating voltage in a Hitachi S-570 scanning electron
microscope (Hitachi, Tokyo, Japan) .
• Collect a secondary electron image of cells for topography contrast at several
magnifications.
• Collect a total of ten micrographs at random for each condition.
3.4.4 Transmission Electron Microscopy (TEM)
The bacteria wall morphology is visualized at detail upon incubation with the proteins
by transmission electron microscopy.
• Inoculate 10 mL of LB medium with the corresponding bacteria strain and incubate
overnight at 37 ºC.
• Sub-culture into a fresh LB medium and grow the bacteria suspension to an OD600 ~
0.2.
• Centrifuge the bacteria culture during 3 min at 5 000 x g, discard the supernatant
and wash the bacteria pellet with 10 mM sodium phosphate buffer, pH 7.5.
• Resuspend the bacteria pellet and divide into sterile tubes (approx.1 mL in each
tube).
• Dissolve the corresponding protein to assay in 10 mM sodium phosphate buffer, pH
7.5.
• Add 5 µM of the corresponding protein.
• Incubate at 37 ºC during 4 hours.
• Centrifuge the bacterial culture during 10 min at 5 000 x g.
• Discard the supernatant.
• Prefix the bacteria pellets with 2.5% glutaraldehyde and 2% paraformaldehyde in
0.1 M cacodylate buffer at pH 7.4 for 2 h at 4 °C and post-fix in 1% osmium
tetroxide buffered in 0.1 M cacodylate at pH 7.4 for 2 h at 4 °C.

61
• Dehydrate the samples with acetone (50, 70, 90, 95, and 100%).
• Immerse the cells in EPON resin.
• Examine ultrathin sections in a JEOL JEM 2011 (Jeol Ltd., Tokyo, Japan).
3.5 FLOW CYTOMETRY
Cell distribution after incubation with labelled human ribonucleases is studied by flow
cytometry. Also, the cell is gated according to propidium iodide staining.
• Inoculate 10 mL of sabouraud medium with C. albicans and incubate overnight at
37 ºC.
• Sub-culture into a fresh sabouraud medium and grow the yeast suspension to an
OD600 ~ 0.4.
• Centrifuge the Candida culture during 5 min at 5 000 x g, discard the supernatant
and wash the cell pellet with PBS.
• Resuspend cell pellet in a PBS.
• To 500 µL aliquot of the Candida suspension, add the corresponding concentration
of labelled protein (Alexa-Fluor 488).
• Incubate during 1 hour.
• Wash the cells with PBS to eliminate not internalized protein.
• Add 2 µL of propidium iodide (1 µg/ µL).
• Incubate 5 min at room temperature.
• Examine 10,000 cells by FACS analysis using a FACSCalibur cytometer (BD
Biosciences)
• Use excitation and emission wavelengths of 488 nm and 515–545 nm.
3.6. RNA EXTRACTION AND QUANTIFICATION
Total cellular RNA from Candida albicans culture is extracted using the RiboPureTM-
Yeast Kit from Life technologies.
• Collect up to 3x10⁸ cells from a yeast culture by centrifugation for 2 min at 12,000
xg

62
• Add 480 µL of Lysis Buffer, 48 µL10% SDS and 480 µL Phenol:Chloroform:IAA,
resuspend by vortexing vigorously for 10-15 minutes.
• Transfer the mixture of cells and lysis reagents to one of the prepared tubes
containing 750 µL cold Zirconia Beads (Invitrogen), and securely fasten the lid.
• Centrifuge for 5 min at 16,100 x g at room temp to separate the aqueous phase,
containing the RNA, from the organic phase.
• Transfer the aqueous phase (top), containing the partially purified RNA, to a fresh
4–15 mL capacity tube with a tight fitting lid.
• Add 1.9 mL Binding Buffer to aqueous phase recovered in previous step and mix
thoroughly.
• Add 1.25 mL 100% ethanol (ACS grade or better) and mix thoroughly.
• Apply 700 µL of the sample mixture to a Filter Cartridge assembled in either a
collection tube (supplied) or a 5 mL syringe barrel on a vacuum manifold.
• Centrifuge for ~0.5–1 min or until the lysate/ethanol mixture is through the filter.
• Discard the flow-through and return the filter cartridge to the collection tube.
• Repeat as necessary to pass the entire sample through the filter cartridge.
• Wash the filter by adding 700 µL of kit wash solution 1 (Life-technologies) to the
filter cartridge, and centrifuging for ~1 min or until all of the liquid is through the
filter.
• Discard the flow-through and return the filter cartridge to the same collection tube
• Wash the filter by adding 500 µL of kit wash solution 2/3 (Life-technologies) to the
filter cartridge. Draw it through the filter as in the previous step.
• Repeat with a second 500 µL aliquot of wash solution 2/3.
• Centrifuge the filter cartridge for 1 min to remove excess wash.
• Transfer the filter cartridge to a fresh 2 mL collection tube.
• Elute RNA by applying 25–50 µL elution solution, preheated to 95–100°C, to the
centre of the filter.
• Centrifuge for 1 min.
• Repeat the elution step with a second 25–50 µL aliquot of preheated at 90ºC.
• Elute solution into the same collection tube.
• Analyse the RNA samples using an Experion automated microfluidic
electrophoresis system.

63
3.7 SECTION OF SPECIFIC APPLIED METHODS
Following, specific methodologies are detailed. Protocols that have been previously
described are only detailed here to provide the distinctiveparticularities applied in each
specific study. For practical purposes the following specific methodology sections have
been divided in three main blocks that correspond to each results main section:
3.7.1 Analysis of the contribution of posttranslational modifications of RNase 3/ECP
native forms in antimicrobial activity.
3.7.2 Analysis of the antifungal activity of RNase 3/ECP and RNase 7. Candida
albicans as an eukaryotic pathogen model.
3.7.3 Exploring RNase 8 structure-function. Design of a new expression protocol
and functional characterizatio

63
3.7.1 Analysis of the contribution of posttranslational modifications of RNase 3/ECP
native forms in antimicrobial activity
3.7.1.1 Minimum bactericidal concentration (MBC100)
Antimicrobial activity was expressed as the MBC100, which is defined as the lowest
concentration of protein that completely inhibits microbial growth.
• Proteins were serially diluted from 2 µM to 0.06 µM in 10 mM sodium phosphate,
pH 7.5.
• E.coli BL21 (λDE3) cells were incubated at 37 ºC overnight in LB broth and diluted
to give approximately 5x10⁵ CFU/mL in 10 mM sodium phosphate, pH 7.5.
• Proteins were added to bacteria suspension and incubated for 4 h, samples were
plated onto Petri dishes and incubated at 37 ºC overnight.
3.7.1.2 Minimum agglutination concentration (MAC)
Bacterial aggregation was determined as a function of protein concentration.
• E. coli cells were grown at 37 ºC to an OD600 ~ 0.2, centrifuged at 5000 xg for 2 min
and resuspended in Tris-HCl buffer, 0.1 M NaCl, pH 7.5.
• Aliquots of 100 µL of the bacteria, at an absorbance of 10 at 600 were treated with
increasing protein concentrations (from 0.06 to 2 µM) and incubated at 25 ºC for 1h.
• The aggregation was checked by visual inspection and the activity is expressed as
the minimum agglutinating concentration (MAC).
3.7.1.3 Bacteria Viability Assay
Bacterial viability was assayed using the BacTiter-Glo microbial cell viability
• Proteins or peptides were dissolved in PBS, serially diluted from 2 to 0.1 µM, and
tested against E. coli BL21 (λDE3) (OD600 ~ 0.2) for 4h of incubation time.
• An aliquot of 50 µL of culture was mixed with 50 µL of BacTiter-Glo reagent in a
microtiter plate according to the manufacturer’s instructions and incubated at 25 ºC
for 15 min. Luminescence was read on a Victor 3 plate reader (Perkin-Elmer,
Waltham, MA) with a 1-s integration time.
• Fifty percent inhibitory concentrations (IC50) were calculated by fitting the data to a
dose-response curve.
3.7.1.4 Bacteria cell leakage assay
Bacteria cell leakage was assessed using the SYTOX® Green nucleic acid dye.

64
• E. coli cells were grown at 37 ºC to an OD600 ~0.2, centrifuged at 5000 xg for 2 min
and resuspend in PBS and diluted to OD600 ~0.05.
• Aliquots of 100 µL of the bacteria suspension were treated with 5 µM of SYTOX®
Green nucleic acid dye during 1 hour.
• Protein concentrations ranging from 0.05 to 2 µM were added.
• Fluorescence was measured during 45 min using a 485 nm excitation wavelength
and 520 nm emission wavelength.
• The cell disruption percentage was calculated as described previously.
3.7.1.5 Bacteria Cytoplasmic Membrane-depolarization assay
Membrane-depolarization was followed using the sensitive membrane potential
DiSC3(5) fluorescent probe.
• Bacteria cultures were grown at 37 °C to an OD600 ~0.2, centrifuged at 5000 x g for
7 min, washed with 5 mM Hepes-KOH, 20 mM glucose, pH 7.2, and resuspended in
5 mM Hepes-KOH, 20 mM glucose, and 100 mM KCl, pH 7.2 to an OD600 ~0.05.
• DiSC3(5) was added to a final concentration of 0.4 µM.
• The protein was added to a final concentration of 50 nM.
• Changes in the fluorescence were continuously recorded after addition of protein
and the time required to achieve half of total membrane-depolarization was
estimated from nonlinear regression analysis.
3.7.1.6 LPS Binding Assay
LPS binding was assessed using the fluorescent probe Bodipy-TR cadaverine (BC) that
binds to the LPS Lipid A portion.
• The displacement assay was performed by the addition of 1 µL aliquots of protein
solution to 1 mL of a continuously stirred mixture of LPS (10 µg /mL) and BC (10
µM) in 5 mM Hepes buffer at pH 7.5.
• Fluorescence measurements were performed on a Cary Eclipse spectrofluorimeter.
• The BC excitation wavelength was 580 nm and the emission wavelength was 620
nm. Final values correspond to an average of four replicates and were the mean of a
0.3 s continuous measurement. The BC probe displacement by sequential protein
addition was registered and the occupancy displacement factor (ED50) was
calculated.

65
3.7.1.7 Liposome Leakage Assay
Liposome leakage assay was performed using a range of encapsulated markers of
distinct molecular weights (Tb3+, ANTS and Dextran).
• Liposomes with encapsulated markers were diluted to 30 µM before addition of
protein samples at distinct lipid/protein ratio. Encapsulated marker release was
followed for up to 1 h at 25 ºC after adding a protein concentration ranging from
0.05 to 1 µM.
• Leakage percentage was calculated as previously described.
3.7.1.8 Liposome aggregation
• For DLS assays a liposome stock of 1 mM was diluted to 200 µM in 10 mM
Tris/HCl, pH 7.4, and 0.1 M NaCl.
• Recombinant and native ECP (from 10 to 500 nM) was tested in the presence of
liposomes.
• For DLS experiments the scattering signal at 470 nm was collected at 90º from the
beam source using a Cary Eclipse Spectrofluorimeter.
3.7.2 Analysis of the antifungal activity of RNase 3/ECP and RNase 7. Candida
albicans as an eukaryotic pathogen model
3.7.2.1 Candida albicans and growth conditions
The C. albicans (ATCC 90028) cell was maintained at -70 ºC and culture overnight in
sabouraud dextrose broth, with agitation at 37 ºC), after each experiment. For the
assays, C. albicans was subculture for ~ 2-3 hours to yield a mid-logarithmic growth
culture.
3.7.2.2 Minimum Fungicidal Concentration (MFC)
Candida growth inhibition was determined by Minimum fungicidal concentration.
• C. albicans ATCC 90028 was cultured overnight in sabouraud dextrose broth at 37
ºC and subculture the next day in fresh sabouraud to obtained an optical density of
OD600=0.4.
• Cells were washed twice with in 10 mM sodium phosphate buffer, pH 7.5, and
diluted to 1x10⁵ cell/mL.

66
• Proteins were dissolved in 10 mM sodium phosphate buffer, pH 7.5, serially diluted
from 20 to 0.2 µM.
• C. albicans and protein solution were incubated at 37 ºC during 4h.
• The samples were plated onto sabouraud petri dishes and incubated at 37 ºC
overnight.
• Antifungal activity was expressed as the MFC, defined as the lowest protein
concentration that completely inhibits microbial growth. MFC of each protein was
determined from two independent experiments performed in triplicate for each
concentration.
3.7.2.3 Viability assay (IC50)
Antimicrobial activity was also assayed by following the reduction of C. albicans
viability, using the BacTiter-GloTM Microbial Cell Viability kit (Promega).
• Overnight culture of C. albicans was used to inoculate fresh sabouraud liquid
culture, and logarithmic phase culture was grown to an OD600 of 0.2.
• Proteins were added to 0.1 mL of culture at a final concentration from 0.025 to 20
µM.
• The C. albicans viability profile was followed after 4h of incubation at 37 ºC.
• 100 µL of culture were mixed with 100 µL of BacTiter-Glo reagent in a microtiter
plate following the manufacturer instructions and incubated at room temperature for
10 min.
• Luminescence was read on a Victor3 plate reader (PerkinElmer, Waltham, MA)
with a 1-s integration time. IC50 values were calculated by fitting the data to a dose-
response curve.
3.7.2.4 Agglutination activity toward C. albicans
Agglutination activity was evaluated by calculating the MAC.
• An aliquot of 0.5 mL yeast cells was grown at 37 ºC to OD600 = 0.4, centrifuged at
5000 x g for 2 min and resuspended in Tris-HCl buffer, 0.1 M NaCl (pH 7.5).
• An aliquot of 100 µL of the Candida suspension was incubated in microtitre plates
with an increasing protein concentration at 0.1 to 10 µM (vol. 100 µL) and left 4h
at 37 ºC.
• The aggregation behaviour was observed by visual inspection and checked with a
binocular microscope at x50 magnification.

67
• The agglutinating activity is expressed as the minimum agglutinating concentration
of the sample tested, corresponding to the first condition where Candida aggregates
are visible.
3.7.2.5 Cell membrane-depolarization assay
Membrane-depolarization was assayed by monitoring the DiSC3(5) fluorescence
intensity change in response to changes in transmembrane potential.
• Candida albicans cells were grown at 37 ºC to the mid-exponential phase and
resuspended in 5 mM Hepes-KOH, 20 mM glucose and 100 mM KCl at pH 7.2
until OD600 of 0.05 was reached.
• DiSC3(5) was added to a final concentration of 0.4 µM.
• Changes in the fluorescence were continuously monitored at 20 ºC at an excitation
wavelength of 620 nm and an emission wavelength of 670 nm.
• Protein in 5 mM Hepes-KOH buffer at pH 7.2 was added at a final tested protein
concentration of 1 µM.
• All conditions were assayed in duplicate.
• The time required to reach a stabilized maximum fluorescence reading was recorded
for each condition, and the time required to achieve half of total membrane-
depolarization was estimated from the nonlinear regression curve.
3.7.2.6 Cell cytoplasmic membrane permeation • Cell yeast cytoplasmic membrane permeation was monitored by using a SYTOX®
Green uptake assay.
• C. albicans cells were grown to mid-exponential growth phase (OD600= 0.6) and
then centrifuged, washed and resuspended in PBS.
• Cell suspensions in PBS (OD600=0.2) were incubated with 1 µM SYTOX® Green
for 15 min in the dark prior to the influx assay.
• At 2 to 4 min after initiating data collection; 1, 2, 5 and 10 µM concentrations of
proteins were added to the cell suspension.
• The increase in SYTOX Green® fluorescence was measured (excitation wavelength
at 485 nm and emission at 520 nm) for 40 min in a Cary Eclipse spectrofluorimeter.
3.7.2.7 Kinetics of cell-survival
C. albicans viability assay was performed using the Live⁄Dead microbial viability kit in
accordance with the manufacturer’s instructions.

68
• Candida strain was grown at 37ºC to OD600=0.4, centrifuged at 5000 x g for 5 min
and resuspended in a 0.85% NaCl solution.
• C. albicans was stained using a syto 9/propidium iodide 1:1 mixture
• The protein concentrations added were 0.5, 1, 2 and 5 µM.
• To calculate bacterial viability, the signal in the range 510–540 nm was integrated to
obtain the syto 9 signal (live cell) and from 620–650 nm to obtain the propidium
iodide signal (dead cell). Then, the percentage of live bacteria was represented as a
function of time.
3.7.2.8 Kinetics of cell-survival by Confocal Microscopy C. albicans were pre-stained using the syto 9 ⁄ propidium iodide 1 : 1 mix provided in
the Live ⁄Dead staining kit.
• Two hundred and fifty microliters of C. albicans (OD600 = 0.4) were mixed with 5
µM a final concentration of RNase 3/ECP or 7, and images were immediately
recorded.
• Confocal images of the yeast were captured using a laser scanning confocal
microscope (Leica TCS SP2 AOBS equipped with a HCX PL APO 63, x1.4 oil
immersion objective; Leica Microsystem, Wetzlar, Germany).
• Syto 9 was excited using a 488 nm argon laser (515–540 nm emission collected) and
propidium iodide was excited using an orange diode (588–715 nm emission
collected).
• To record the time-lapse experiment, Life Data Mode software (Leica) was used,
obtaining an image every 1 min in an experiment lasting 90 min.
Alternatively, labelled protein localization was evaluated:
• Candida albicans yeast at OD600=0.3, approx. 1*107 cell/mL were incubated with
proteins at 3 µM during 2 hours in PBS.
• After incubation, cells were washed with PBS and labelled with HOECHST 10 min
before observation of unfixed cells in Leica TCS SP2 AOBS equipped with a HCX
PL APO 63x1.4 oil immersion objective, Germany.
• Alexa Fluor 488- proteins were added directly to the cultures and time lapse was
recorded at intervals of 30 seconds in 2 hours.

69
3.7.2.9 Flow cytometry
• C. albicans were grown at 37 ºC to mid-exponential phase (OD600= 0.2), centrifuged
at 5000 x g for 2 min, resuspended in PBS.
• 500 µL aliquot of the Candida suspension was incubated with 5 µM of labelled
protein for 45 min. Also, 1 µM of labelled protein was added at 2, 5, 15 and 60
minutes.
• Cells suspension was washed 2 times to eliminate free labelled protein and
propidium iodide was added.
• After incubation, 10000 cells were subjected to FACS analysis using a
FACSCalibur cytometer (BD Biosciences) and excitation and emission wavelengths
of 488 nm and 515–545 nm respectively.
3.7.3 Exploring RNase 8 structure-function. Design of a new expression protocol
and functional characterization
3.7.3.1 Dynamic light scattering (DLS) To analyse the effect of protein concentration on the aggregation process, samples at
different concentration were analysed by Dynamic light scattering (DLS).
• Dissolve the protein at final concentrations of 70 µM (~1mg/mL) and 350 µM (~5
mg/mL) in phosphate buffer 10 mM pH 7.5
• Put the sample (60 µL) in the cuvette
• Place the cuvette in Malvern Zetasizer Nano-ZS instrument equipped with a
thermostated sample chamber.
• Measure the size distribution of the protein molecules at 4 mW He–Ne LASER (λ =
632.8 nm)
• Carry out three accumulations (12 times) during 15 min.
3.7.3.2 Quantitative determination of free sulfhydryl (-SH) groups The RNase 8 shows eight cysteines in its sequence. The quantitative determination of
free sulfhydryl groups in the protein allowed us to determine if any of the eight cysteine
residues present in the protein did not form a disulphide bridge. Ellman’s reagent 5,5’-
dithio-bis-(2-nitrobenzonic acid) also known as DTNB is useful because of its

70
specificity for –SH groups. A solution of this compound produces a measurable yellow-
coloured product when it reacts with sulfhydryls.
DTNB reacts with a free sulfhydryl group to yield a mixed and a 2-nitro-5-thiobenzoic
acid (TNB) (Figure 14). The target of DTNB in this reaction is the conjugate base (R
―S-) of a free sulfhydryl group.
Figure 14: Reduction of Ellman’s reagent
Sulfhydryl groups may be estimated in a sample either by comparison to a standard
curve composed of known concentrations of a sulfhydryl-containing compound such as
cysteine or by reference to the extinction coefficient of TNB.
* Material
- Reaction buffer: 0.1 M sodium phosphate, pH 8.0
- Cysteine hydrochloride monohydrate.
- Ellman’s reagent solution: Dissolve to a concentration of 4 mg/mL in reaction buffer.
* Procedure:
- Prepare a set of cysteine standards by dissolving cysteine hydrochloride monohydrate
in the reaction buffer at the following concentrations:

71
Standard Final Cysteine Concentration (mM) 1 1.5 2 1.25 3 1.0 4 0.75 5 0.5 6 0.25 7 0
- Prepare a set of 2-3 concentrations in the reaction buffer.
- Prepare a set of test tubes, each containing 20 µL of Ellman´s reagent and 1 mL
reaction buffer.
- Add 100 µL of each standard or protein sample to the tubes containing Ellman´s
reagent.
- Mix and incubate at room temperature for 15 minutes.
- Measure at 412 nm the absorbance of either the standards or the protein samples.
- Plot the values obtained for the standards to generate a standard curve.
- Use the standard curve plot to quantify the sulfhydryl groups of the protein samples.
Alternatively sulfhydryl groups may be quantified using as a reference the extinction
coefficient of TNB (14150 M-1.cm-1).
3.7.3.3 Characterization of RNase 8 activity
3.7.3.3.1 SDS-PAGE and activity staining gel (Zymogram) This activity assay was carried out in order to determine the preference of RNase 8 to
catalyse the digestion of poly(C) or poly(U) substrate. As described previously:
- Prepare two gels, one containing poly(C) and the other poly(U) as substrates.
- Prepare a set of 3-4 protein concentrations (poly(C) and poly(U) gel 40, 200, 400 ng).
- Prepare a fixed concentration of RNase A as standard (poly(C) gel 50, 250 and 500 pg
and poly(U) 0.5, 2.5 and 5 ng).
- Load the same quantities of sample in both gels and follow the electrophoresis process
and staining as described previously.
3.7.3.3.2 Analysis of the digestion products of poly(C) The activity determined by zymogram showed the preference of RNase 8 to catalyse
poly(C) cleavage as a substrate. For this reason, the high molecular mass poly(C) was

72
used as substrate to analyse the cleavage pattern by RNase 8. The analysis was carried
out according to Moussaoui et al, 1996.
At different digestion times the products of the reaction were separated by reverse-
phase HPLC (Nova Pak C18 column, Waters).
• Briefly, 25 µL of the reaction mixture were injected to the column equilibrated with
solvent A (10% (w/v) ammonium acetate and 1% (v/v) acetonitrile) and the elution
was carried out by an initial 10-min wash and 50-min gradient from 100% solvent A
to 10% solvent A plus 90% solvent B (10% (w/v) ammonium acetate and 11% (v/v)
acetonitrile).
• Product elution was detected from the absorbance at 260 nm, and peak identification
was performed according to (Moussaoui et al. 1996); (Nogues & Cuchillo 2001)
(Cuchillo et al. 2002)
• Dissolve the poly(C) in 10 mM HEPES-KOH pH 7.5 at a concentration of 2.5
mg/mL.
• Add 10 µL (8 µM) of enzyme solution to 25 µL of the poly(C) solution at 25°C.
• Incubate the reaction mixture during a 3 min.
• Inject 25-30 µL of the reaction mixture the reverse-phase HPLC column (Nova Pak
C18 column, Waters)
• Carry out the elution as described above.
• Repeat the process by injecting samples incubated at different times of digestion.
• For the product quantification, the percent area corresponding to each identified
peak is determined.
The mononucleotide fraction elute at the initial conditions and oligonucleotides of
increasing size elute with increasing retention times. The elution profile allows us to
distinguish between consecutive sizes up to 9 or 10 nucleotides.
3.7.3.3.3 Analysis of the digestion products of the pentacytidylic acid (Cp)4C>p
Preparation of the oligocytidylic acid (Cp)4C>p from poly(C) digestion The oligocytidylic acid (Cp)4C>p used as substrate was obtained by RNase A digestion
of a poly(C) solution. Five hundred microliters of a 10 mg/mL poly(C) solution in 10

73
mM Hepes- KOH at pH 7.5 were digested with RNase A, at 25°C for 5 min. The
reaction products were separated by reverse-phase column (Nova pak C18)
chromatography. The peak corresponding to the pentanucleotide (Cp)4C>p was
collected and lyophilized.
* Procedure
- Dissolve poly(C) substrate at a concentration of 10 mg/mL in the buffer 10 mM
HEPES-KOH at pH 7.5.
- To 500 µL of the poly(C) solution, add RNase A to a final concentration of 1
µM.
- Keep 5 min at room temperature.
- Inject the reaction mixture to the column and proceed to analyse of the digestion
products of poly(C).
- Collect the peak/s corresponding to the oligonucleotide/s needed, freeze and
lyophilize to evaporate acetonitrile and ammonium acetate.
- After lyophilisation, the sample may need to be washed with deionized water
and lyophilized again to remove completely the ammonium acetate.
Analysis of the oligocytidylic acid (Cp)4C>p cleavage pattern by RNase 8 * Procedure
- Resuspend the oligocytidylic acid (Cp)4C>p in 10 mM HEPES-KOH at pH 7.5
- To 25 µL of the substrate solution, add 10 µL of the enzyme solution.
- Keep at 25ºC during a determined time and inject the reaction mixture to
reverse-phase column (Nova Pak C18) equilibrated with solvent A (10% (w/v)
ammonium acetate and 0.3% (v/v) acetonitrile).
- In this case, the elution is carried out with an initial 10 min wash 100% solvent
A and a 20 min linear gradient from 100% solvent A to 100% solvent B (10%
(w/v) ammonium acetate and 5% (v/v) acetonitrile).
- For products quantification, the amount of each oligonucleotide product was
calculated by first integrating the areas (in OD units) and dividing these values
by the corresponding absorbance coefficients at 260 nm, ɛ260: 7845 M−1cm−1 for
C>p, 15,175 M−1cm−1 for CpC>p, 20,745 M−1cm−1 for (Cp)2C>p, 24,282
M−1cm−1 for (Cp)3C>p, and 28,683 M−1cm−1 for (Cp)4C>p (Cuchillo et al.,
2002).

74
3.7.3.4 RNase 8 antibacterial activity characterization
3.7.3.4.1 Minimum Bactericidal Concentration (MBC)
Antimicrobial activity was calculated by assessing the number of CFUs as a function of
protein concentration
• Proteins were dissolved in 10 mM sodium phosphate (Na2HPO4) buffer pH 7.5 and
serially diluted from 10 to 0.1 µM.
• Bacteria were incubated at 37 ºC overnight in LB broth and diluted to give
approximately 5 x 10⁵ CFU/mL.
• In each assay, protein solutions were added to each dilution of bacteria, incubated
for 4h.
• Samples were plated on Petri dishes and incubated at 37ºC overnight.
• The number of CFUs in each Petri dish was counted and the average values were
calculated.
• Values were averaged from two independent experiments performed in triplicate for
each protein concentration.
3.7.3.4.2 Bacteria viability assays ( IC50)
• Proteins were dissolved in 10 mM sodium phosphate buffer, pH 7.5, serially diluted
from 10 to 0.1 µM
• E. coli, S. aureus, A. baumannii and M. luteus strains (OD600 = 0.2) were added to
proteins dilution.
• The bacteria solution and protein were incubated for 4h.
• 100 µL of culture were mixed with 50 µL of BacTiter-Glo reagent in a microtiter
plate following the manufacturer instructions and incubated at room temperature for
10 min.
• Luminescence was read on a Victor 3 plate reader (PerkinElmer, Waltham, MA)
with a 1-s integration time.
• IC50 values were calculated by fitting the data to a dose-response curve.
3.7.3.4.3 Agglutination activity
Agglutination activity was evaluated by calculating the MAC.
• An aliquot of 5 mL of E. coli, S. aureus, A. baumannii and M. luteus strains cells
was grown at 37 ºC to the mid-exponential phase (D600 = 0.6).

75
• The bacteria cells were centrifuged at 5000 g for 2 min and resuspended in Tris-HCl
buffer, 0.1 M NaCl (pH 7.5) until OD600 = 0.2.
• An aliquot of 200 µL of the bacteria suspension was incubated in microtitre plates
with an increasing protein concentration at 0.1- 10 µM.
• Microtitre plate was incubated 2 hours at 37 ºC.
• The aggregation behaviour was observed by visual inspection and checked with a
binocular microscope at 50X magnification.
• The agglutinating activity is expressed as the minimum agglutinating concentration
of the sample tested, corresponding to the first condition where bacterial aggregates
are visible.
3.7.3.4.4 Scanning electron microscopy (SEM) • E. coli cell cultures of 1 mL were grown at 37 ºC to the mid-exponential phase
(OD600= 0.4).
• 5 µM of proteins in 10 mM sodium phosphate buffer, pH 7.5 were added.
• Aliquots were taken up to 4h of incubation and were prepared for analysis by SEM,
as described previously.
• The filters were mounted on aluminium stubs and coated with gold- palladium in a
sputter coater (K550; Emitech, East Grinsted, UK).
• The filters were viewed at 15 kV accelerating voltage in a Hitachi S-570 scanning
electron microscope (Hitachi, Tokyo, Japan).
• A total of ten micrographs were collected at random for each condition, and the
number of isolated cells and aggregates was registered.
3.7.3.4.5 Transmission Electron Microscopy (TEM)
• E. coli was grown to OD600=0.2 and incubated with 5 µM of proteins for 4h.
• Bacteria pellets were prefixed with 2.5% glutaraldehyde and 2% paraformaldehyde
in 0.1 M cacodylate buffer at pH 7.4 for 2 h at 4 °C and post-fixed in 1% osmium
tetroxide buffered in 0.1 M cacodylate at pH 7.4 for 2 h at 4 °C.
• The samples were dehydrated in acetone (50, 70, 90, 95, and 100%).
• The cells were immersed in EPON resin, and ultrathin sections were examined in a
JEOL JEM 2011 (Jeol Ltd., Tokyo, Japan).

76
3.7.3.4.6 Bacterial cytoplasmic membrane-depolarization assay
Membrane-depolarization was monitored, using the DiSC3(5) lipophilic dye, which
changes its fluorescence intensity in response to changes in transmembrane potential.
• E. coli cells were grown to mid-exponential phase and resuspended in 5 mM
Hepes/KOH, 20mM glucose, and 100 mM KCl at pH 7.2 to an attenuance
OD495=0.05.
• DiSC3 (5) at 0.4 µM was added.
• Changes in the fluorescence due to the alteration of the cytoplasmic membrane
potential were continuously monitored at 20 ºC by fluorescence emission at 670 nm
using an excitation wavelength of 620 nm.
• Protein samples were added at a final concentration of 50 nM.
• All conditions were assayed in duplicate. The time necessary to reach a stabilized
maximum fluorescence reading was recorded for each condition.
3.7.3.4.7 Permeabilization of microbial membranes
• E. coli was grown in LB at 37 °C to reach an OD600 =0.2.
• Cells were centrifuged, washed and resuspended in PBS for membrane permeability
experiments.
• Cell suspension in PBS (OD600=0.05) was incubated with 1µM SYTOX® Green for
30 minutes in the dark at 37 ºC.
• Proteins concentrations between 50 nM and 5 µM were added to the cell suspension
• Increase in fluorescence was measured (Excitation wavelength at 485 nm and
emission at 520 nm) immediately over a time scale of 0 to 40 minutes.
3.7.3.5 Liposome aggregation
• LUVs of DOPC/DOPG (3:2 molar ratio) lipids were obtained as described
previously.
• A liposome dilution of 200 µM in 10 mM Tris/HCl, pH 7.4, and 0.1 M NaCl was
tested with protein concentrations between 50 nM to 5 µM of proteins.
• The liposome aggregation was measured by monitoring the sample size changes
during 1 hour using a Malvern Zetasizer Nano instrument.

77
3.7.3.6 Liposome Leakage
DPA/Tb3+ assay
• The liposome to encapsulate Terbium cation (Tb3+) was prepared by adding
DOPC/DOPG in proportion 3:2 and drying under vacuum for 30 min.
• Large unilamellar vesicles (LUVs) were formed by extruding the lipid suspension
ten times through 100 nm nucleopore polycarbonate filters.
• The buffer consisted of 50 mM TbCl3, 100 mM sodium citrate and 10 mM TES pH
7.2
• After the extrusion process, liposomes were separated from external terbium via gel
filtration chromatography using a solution containing 300 mM NaCl to balance the
ionic strength of TbCl3. For leakage measurement 75 µM of DPA was added to
buffer.
• The leakage activity was assayed at different protein concentrations (from 0.05 to 5
µM) by following the release of the liposome content.
ANTS/DPX assay
The ANTS/DPX liposome leakage fluorescence assay was performed as described
previously.
• A single population of LUV of DOPC:DOPG 3:2 composition containing 12.5 mM
ANTS, 45 mM DPX, 20 mM NaCl, and 10 mM Tris/HCl at pH 7.5 was obtained.
• Unencapsulated material was separated from the vesicles by gel filtration on PD-10
using 20 mM Tris/HCl at pH 7.5, 0.1 M NaCl as an elution buffer.
• ANTS/ DPX liposome suspension was diluted to a 30 µM final lipid concentration
and was incubated at room temperature in the presence of the protein.
• The leakage activity was assayed at different protein concentrations (from 0.05 to 5
µM) by following the release of the liposome content.
• Fluorescence was measured using a 386 nm excitation wavelength and 535 nm
emission wavelength. The percentage of leakage (% L) produced by the proteins
after 1 hour of incubation with the liposomes was calculated.

RESULTS


78
4 RESULTS
4.1 Analysis of the contribution of post-translational modifications of RNase
3/ECP native forms in antimicrobial activity.
Native RNase 3/ECP was purified from pooled buffy coats from healthy blood donors.
The purification by gel filtration chromatography and ion-exchange chromatography
was carried out in the Department of Medical Sciences, Clinical Chemistry, Uppsala
University, according to the procedure described by Eriksson and colleagues (2007).
The protein samples eluted from the cation exchange chromatography were analysed by
SDS-PAGE as previously (Larsson et al. 2007). Molecular variants of ECP were
detected, ranging in mass from ~ 15.8 to 17.6 kDa. The RNase 3/ECP pools presented a
varied peaks number between 1 to 6. The native RNae 3/ECP pools were further
characterized by SELDI-TOF MS analysis using an anti-ECP monoclonal antibody and
classified as previously described (Rubin et al. 2009). The samples were grouped
according to molecular weight and named as nECP1 to nECP7 from high to low MW
(Salazar et al. 2014). Fractions nECP1 to nECP4 were pooled as heavy molecular
weight (HMW-ECP) and nECP5 to nECP7 as low molecular weight (LMW-ECP).
For comparison purposes, in some assays the highest and lowest MW fractions,
according to their highest intensity reference peak, were selected (named as LMW and
HMW forms). Native forms were compared with the non-glycosylated recombinant
protein, expressed in a prokaryote system and previously characterized (Boix et al.
1999), with a MW of 15.7 kDa, as checked by MALDI-TOF analysis.
4.1.1 Antimicrobial activity of native RNase 3/ECP forms
The antimicrobial activity of recombinant and native RNase 3/ECP forms purified from
eosinophils was assayed on E. coli cultures. Results indicated that an increase in the
overall MW correlated with a reduction of the protein antimicrobial activity (Table 5).
Bacteria viability was then tested using the Bactiter Glo assay based on the

79
quantification of ATP levels, as an estimate of viable cell number. Comparison of IC50
values confirmed the inverse correlation between glycosylation and cytotoxicity, where
the ECP fractions containing the highest MW corresponded to the highest IC50 values.
However, differences between samples viability values were not so pronounced,
indicating that diverse mechanisms are involved in the protein cytotoxicity.
Interestingly, the lowest glycosylated form displayed a comparable or even slightly
higher bactericidal activity than the non-glycosylated protein.
4.1.2 Action at the bacterial envelope
4.1.2.1 Agglutination activity
Following, we compared the cell agglutination activity of native and recombinant
proteins. Previous work on recombinant RNase 3/ECP highlighted the protein cell
agglutination activity on Gram-negative species such as Escherichia coli, Pseudomonas
sp and Acinetobacter baumannii (Pulido et al. 2012); (Torrent et al. 2012).
Agglutination activity was measured by assaying the minimal agglutination
concentration (MAC), defined as the minimal peptide concentration able to induce
agglutination in bacteria. The present studies show how glycosylated forms mostly
loose the bacteria agglutination ability displayed by the recombinant protein (Table 5).
Table 5: Comparison of recombinant and native RNase 3/ECP forms. Comparison of recombinant and native RNase 3/ECP forms. Antimicrobial and agglutination activities were tested on E. coli cell cultures. The MBC was estimated by calculating the protein concentration that reduced by 99.9% the starting CFU per milliliter; MBC T was the protein concentration that rendered the assay mixture essentially sterile and the minimal agglutination concentration (MAC) was calculated as described in Materials and methods. All values are averaged from three replicates of two independent experiments.
Protein MBC(µM) MBCT (µM) MAC (µM) nECP1 0.70 2-3 > 2 nECP2 0.80 2-2.5 > 2 nECP3 0.65 1.5 > 2 nECP4 0.60 1.5 > 2 nECP5 0.55 1.0 > 2 nECP6 0.50 1.0 2 nECP7 0.20 0.5 2 rECP 0.30 0.6 0.4

80
4.1.2.2 Lipopolysaccharide binding activity
Next, we assessed the protein binding affinity to the outer membrane LPS (Table 6),
which was previously found to correlate to the protein cell agglutination activity (Pulido
et al. 2012). Protein interaction with the LPS was estimated by the bodipy cadaverine
(BC) probe displacement after sequential protein addition from 10 nM to 1 µM.
Comparison of the calculated occupancy displacement factor (ED50) values for
recombinant and native fractions revealed a reduction of LPS affinity for the highest
MW fractions, although no major differences were registered, and a higher dispersion
was detected for the in between, more heterogeneous, fractions.
Table 6: Comparison of LPS binding by recombinant and native RNase 3/ECP forms. The occupancy displacement factor (ED50) was calculated as described in the methodology section. ED50 is given as the mean ±SD. T test is indicated for n=3 *P<0.05.
4.1.3 Action at the bacterial cytoplasmic membrane
In order to further interpret the distinct behaviour of the studied native forms on bacteria
cultures, we decided to analyse also their action at the bacteria cytoplasmic membrane
level. Our previous work on the recombinant protein illustrated how actions at both
bacterial envelope and membrane level were complementing each other (Boix et al.
2012); (Torrent et al. 2010a). To analyse the protein direct effect on the bacterial
cytoplasmic membrane we applied the SYTOX® Green assay, where the fluorescence
increase is registered to monitor the cell dye uptake. The assay is sensitive to any
Protein ED50 (µM)
nECP1 0.42± 0.13*
nECP2 0.46± 0.10*
nECP3 0.17± 0.09
nECP4 0.48± 0.05*
nECP5 0.29±0.05
nECP6 0.28± 0.04
nECP7 0.30± 0.09
rECP 0.23± 0.07

81
membrane local disturbance that would allow the access of the low molecular weight
dye (600 MW) to the intracellular compartment and the subsequent staining of cell
nucleic acids. Comparison of the bacteria cell leakage induced by recombinant and
native proteins indicated a moderate reduction as a function of the protein glycosylation
degree, where the highest MW forms mostly reduce their activity. In particular,
significant differences are observed when comparing the IC50 leakage activities of high
and low representative glycosylated forms. Interestingly, the lowest MW native form,
which does not induce cell agglutination, not only destabilizes the membrane in a
shorter lapse of time, but also at a lower protein concentration in comparison to the
recombinant protein (Table 7).
Table 7: Comparison of membrane destabilization activities of recombinant and native RNase 3/ECP forms. E. coli bacteria cell leakage was estimated by the Sitox Green uptake assay as detailed in the methodology section. Depolarization activity on E.coli cytoplasmic membrane was monitored by the DiSC3(5) dye assay as described. Half time to achieve maximum depolarization (t50) at 50 nM protein concentration is estimated. The membrane leakage activity on DOPC/DOPG liposomes was analysed using encapsulated Tb3+. Values are calculated as mean ± SD.
Protein
Bacteria cell Leakage
Depolarization activity Liposome leakage
(%) a IC50(µM) t50 (s) IC50(µM)
HMW-ECP 56.5 ± 0.2 > 1 330±50 1.24±0.09 LMW-ECP 68.1± 1.2 0.63 ± 0.14 54±0.05 0.17±0.02
rECP 70.8± 2.1 0.84 ± 0.10 85±0.01 0.15±0.03 aPercentage values calculated at 1 µM protein concentration in relation to the positive reference control (10% triton X-100). Percentage mean values are determined from two independent experiments performed in triplicate.
Following, the depolarization activity of the recombinant and native forms was
evaluated. Assays were performed at a protein concentration of 50 nM, well below the
bacteria leakage IC50 values. Comparable maximum depolarization activity is observed
for the assayed samples (Table 7). However, a significant reduction is registered in the
half time depolarization of the highest MW form, which might be attributed to its
diminished affinity towards the bacteria outer membrane LPS. The effective protein
concentration was well below the concentration required for lipid vesicles and cell
agglutination activities, suggesting that RNase 3/ECP can depolarize the cytoplasmic
membrane without undergoing any local self-aggregation process. On the other hand,
time course monitoring showed similar depolarization profiles for recombinant and

82
LMW ECP, indicating that the protein lowest post-translational modification did not
hinder the protein access and subsequent action at the cytoplasmic membrane.
4.1.4 Mechanism of action on model membranes
Finally, with the aim to better understand the protein behaviour at the bacteria cell
membrane we analysed both the protein membrane lysis and vesicle aggregation
activities using synthetic lipid bilayers.
4.1.4.1 Membrane leakage activity
Mixed neutral/anionic phospholipid liposomes were prepared entrapping fluorescent
markers of distinct MW. Previous work on the recombinant protein was performed for a
variety of phospholipids (Torrent et al. 2007); (Torrent et al. 2009), showing the protein
preference for anionic type lipids. The degree of membrane disturbance was evaluated
following the release of the vesicle inner content. Three assays were chosen that could
provide direct information on the magnitude of the local membrane disturbance (Rausch
et al. 2007). The Tb3+/DPA assay monitors the release of encapsulated Tb3+, which
upon interaction with the DPA present at the outer compartment emits fluorescence.
Tb3+ was chosen to detect small local membrane disturbance. Results were
complemented with the ANTS/DPX assay, where ANTS (450 MW) is encapsulated
together with its quencher, DPX, and the fluorescence of free unquenched ANTS
correlates with the liposome inner content release. Additionally, labelled dextran of
about 3 kDa was chosen to assess massive vesicle lysis. The release of entrapped
markers was monitored as a function of time and protein concentration. Comparison of
the release percentage of each dye was evaluated at final incubation time (Table 8).
IC50 for liposome leakage was assayed for low and high MW samples using Tb3+ dye
(Table 7).
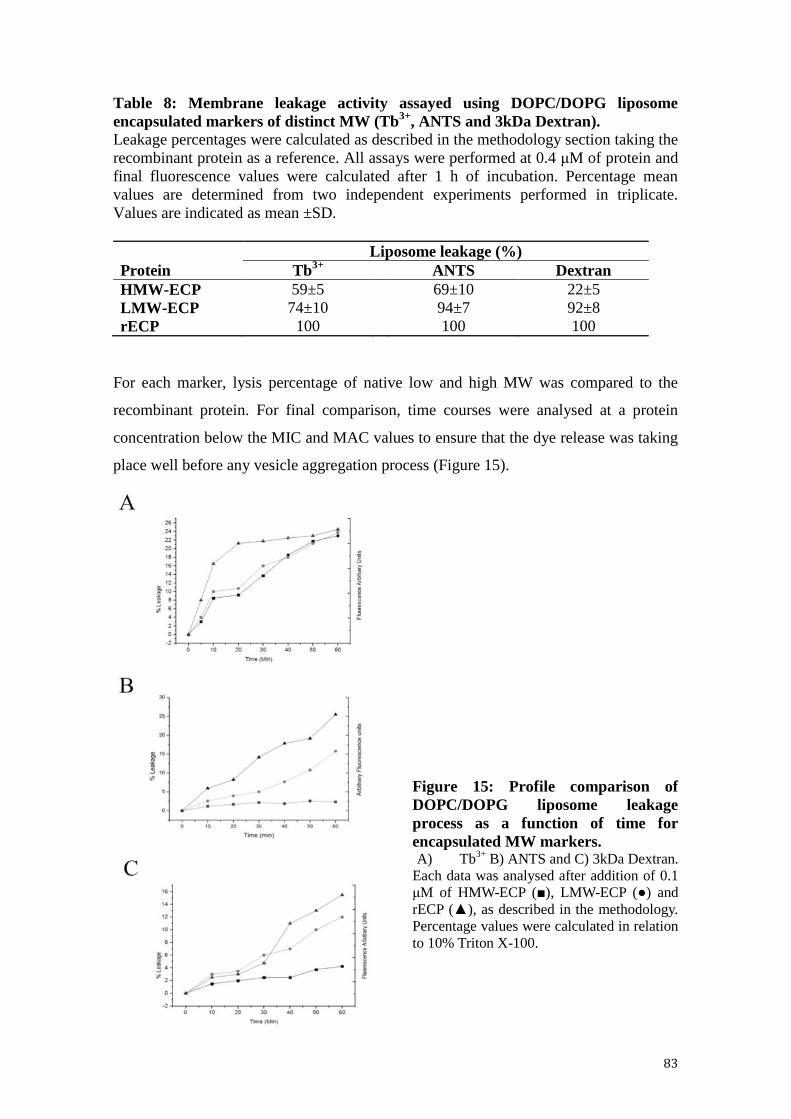
83
Table 8: Membrane leakage activity assayed using DOPC/DOPG liposome encapsulated markers of distinct MW (Tb3+, ANTS and 3kDa Dextran). Leakage percentages were calculated as described in the methodology section taking the recombinant protein as a reference. All assays were performed at 0.4 µM of protein and final fluorescence values were calculated after 1 h of incubation. Percentage mean values are determined from two independent experiments performed in triplicate. Values are indicated as mean ±SD.
Liposome leakage (%) Protein Tb3+ ANTS Dextran HMW-ECP 59±5 69±10 22±5 LMW-ECP 74±10 94±7 92±8 rECP 100 100 100
For each marker, lysis percentage of native low and high MW was compared to the
recombinant protein. For final comparison, time courses were analysed at a protein
concentration below the MIC and MAC values to ensure that the dye release was taking
place well before any vesicle aggregation process (Figure 15).
Figure 15: Profile comparison of DOPC/DOPG liposome leakage process as a function of time for encapsulated MW markers. A) Tb3+ B) ANTS and C) 3kDa Dextran.
Each data was analysed after addition of 0.1 µM of HMW-ECP (■), LMW-ECP (●) and rECP (▲), as described in the methodology. Percentage values were calculated in relation to 10% Triton X-100.

84
Significant but moderate differences between samples were observed for Tb+3 and
ANTS release, while dextran release percentage was mostly reduced for the heavy
glycosylated form. To note, the leakage profile of the entrapped dextran revealed
significant differences for the HMW form, which could hardly induce the dye release,
even after long exposure times. The data indicated that the massive membrane
disruption, required for dextran release, is mostly hindered by heavy glycosylation.
Moreover, about a 10-fold protein concentration is required for the HMW form to
induce liposome leakage, even for Tb3+ entrapped marker (Table 8). On the other hand,
a close follow up of the time course release of the Tb3+ dye marker (Figure 15)
suggested a local membrane transient disturbance mechanism rather than the formation
of a defined local pore.
4.1.4.2 Liposome agglutination activity
The protein action on lipid bilayers was also assessed by following the vesicle
aggregation activity. Aggregation was monitored by registering the mean size of
liposome population by Static and Dynamic Light Scattering. Liposome aggregation
previously reported for rECP (Torrent et al. 2007) was mostly lost for all the native
forms, and fully abolished for the heaviest glycosylated fractions (Figure 16).
Figure 16: Liposome agglutination by recombinant and native RNase 3/ECP forms. Vesicle aggregation was followed by Dynamic Light Scattering as described in the methodology. Protein at 0.4 µM final concentration was added to DOPC/DOPG liposomes.

85
Noteworthy, for all the studied native forms at the protein concentrations where
liposome leakage is taking place, no lipid aggregation is observed. On the contrary, the
side-by-side comparative profiles on liposome lysis and aggregation activities for rECP
indicated that aggregation preceded the vesicle content release, showing that the
recombinant protein triggered the leakage process by its lipid aggregation activity.
Figure 17 displays the liposome leakage profile of recombinant ECP.
Figure 17: Liposome leakage and aggregation activities of recombinant RNase 3/ECP. Liposome leakage was assayed following the release of vesicle entrapped ANTS/DPX and liposome aggregation was registered by static light scattering at 470 nm. Liposomes were prepared at 100 µm and proteins were added from 10 to 500 nm. Activities were assayed after 1 h of incubation. Black bar correspond to liposome leakage and grey bar to aggregation.

86
4.2 Analysis of the antifungal activity of RNase 3/ECP and RNase 7. Candida
albicans as an eukaryotic pathogen model.
In this study, we evaluated the antifungal activity towards C. albicans, of two
antimicrobial ribonucleases; the Eosinophil cationic protein, or RNase 3, and the skin-
derived ribonuclease, or RNase 7. Also, site-directed mutants were designed to abolish
both RNases catalytic activity (RNase 3-H15A and RNase 7-H15A) and cell-membrane
binding (RNase 3-W35A). Activities against E.coli and their ability on a membrane
model were determinated. Prior to the comparative analysis of the wild-type protein and
mutant variants antifungal activity, the enzymatic and antimicrobial properties of the
designed protein mutants were characterized.
4.2.1 Design and characterization of active site mutants.
Our investigation group have extensively documented the bactericidal activity of RNase
3/ECP and RNase 7 against a wide range of Gram-negative and Gram-positive bacteria
(Boix et al. 2012); (Pulido et al. 2012); (Torrent et al. 2010a), but up to date no analysis
of the contribution of active residues have been carried out. Catalytic centre modified-
forms were analysed for enzymatic properties, antibacterial ability and activity on
membrane model.
Comparative catalytic activity values by a spectrophotometric assay using oligocytidylic
acid as a substrate, or polyuridylic acid by zymogram analysis, estimated a residual
catalytic activity lower than 10 % (Figure 18).
A. B.
Figure 18: RNase activity of RNase 3/ECP, RNase 7 and mutants A. Zymogram activity of RNase 7-H15A on SDS-PAGE gel using poly (U) as substrate. Lane 1: RNase A 50 pg. Lane 2: RNase 7 50 ng. Lane 3: RNase 7-H15A 50 ng. B. Relative enzymatic activity determined by the spectrophotometric method using (Cp)4C>p substrate.

87
Moreover, the crystal structure of RNase 3-H15A (4OWZ) confirmed that no essential
structural changes have taken place.
Also, functional characterization of both RNases active site mutants confirmed that the
proteins conserved their membrane lytic and antibacterial activities (Table 9). Besides,
the potential contribution of the H15 positive net charge on the protein membrane
association was discarded, as the catalytic residue is not exposed to the protein surface,
as confirmed by calculating the solvent accessible surface area using the Areaimol
software utility from the CCP4 integrate Programme package (SASA for His 15 ~ 14Å;
4A2Y.pdb). Therefore the chosen active site mutants proved to serve as adequate
catalytic defective forms.
The antibacterial activity was examined against E.coli by MBC100, IC50 and MAC
techniques. The results obtained did not show significant differences in comparison to
wild type; the MBC100 values were maintained, with values of 0.6 and 0.7 µM for RNase
3/ECP and RNase 3-H15A, respectively. Also, RNase 7 displayed a value of 0.86 and
their mutant 0.97 µM. IC50 and MAC assays showed an equivalent antibacterial ability
in a similar range of protein concentration. The antibacterial activities of the active
centre mutants are shown in Table 9.
Table 9: Antibacterial activities of RNase 3/ECP, RNase 7 and H15A mutants Antimicrobial (IC50), Minimum Bactericidal Concentration (MBC100) and agglutinating (MAC) activities against E.coli. For the comparison of numerical variables between wild type and mutants the Student’s T test was used. Samples values did not show significant differences. ND, no determined using a maximum protein concentration of 5 µM. All values are averaged from three replicates of two independent experiments.
Protein
IC 50 (µM)
MBC 100 in µM (Minimum bactericidal
concentration)
MAC in µM (Minimal agglutination
concentration) RNase 3 0.36± 0.09 0.63 0.375 RNase 3-H15A 0.45± 0.09 0.72 0.472 RNase 7 0.41 ± 0.04 0.86 ND RNase 7-H15A 0.49 ± 0.06 0.97 ND

88
The leakage activity and liposome aggregation of the RNase 3/ECP and RNase 3-H15A
mutants were determinated and compared with the wild type protein. In both cases the
activity presented a similar pattern. Mutant-liposome aggregation was maintaining at a
nanomolar concentration, starting in a range of 200-300 nM. The increment of size of
liposome aggregates correlated with the protein concentration. As for leakage abilities
in liposomes DOPC:DOPG (3:2) a significant percentage of ANTS/ DPX released was
obtained at higher protein concentrations (500-600 nM). Figure 19 shows both activity
profiles for RNase 3/ECP and RNase 3-H15A.
Figure 19: RNase 3/ECP and RNase 3-H15A activities in model membrane. A. Profile comparison of leakage activity represented as a function of protein concentration. The data was registered after 1 hour of incubation of the LUV with RNase 3/ECP (squares) and RNase 3-H15A (circles) B. Profile comparison of aggregation activity represented as a function of protein concentration, the data was registered after addition of RNase 3/ECP (squares) and RNase 3-H15A (circles) to LUV. The aggregation was measured three times (twelve repetitions) by DLS.
The results presented here for H15A support the hypothesis that the antibacterial
activity may be independent of the catalytic activity, and that RNase 3/ECP and mutant
H15A share the same liposome, aggregation and leakage abilities and only differ in
their catalytic activity. We could confirm that the aggregation process is essential for
the antimicrobial activity of the RNase 3/ECP, as previously described by (Torrent et al.
2010a); (Torrent et al. 2012).
The same activities on membrane models were determinated for RNase 7-H15A and
compared with the wild type protein. In both cases the activity presented a similar
pattern, Figure 20.
A. B.

89
Figure 20: RNase 7 and RNase 7-H15A activities in model membrane. A. Profile comparison of leakage activity represented as a function of protein concentration. The data were registered after 1 hour of incubation of the LUV with RNase 7 (squares) and RNase 7-H15A (circles) B. Profile comparison of aggregation activity represented as a function of protein concentration, the data were registered after addition of RNase RNase 7 (squares) and RNase 7-H15A (circles) to LUV. The aggregation was measured three times (twelve repetitions) by DLS.
4.2.2 Analysis of the membrane binding mutant.
Previously, our investigation group has characterized the activity on bacterial cells and
synthetic membrane of the RNase 3/ECP mutant W35A by topography studies on the
membrane interaction (Torrent et al. 2007). These analyses showed that the mutation on
residue W35 decreased the protein penetration into the lipid bilayer and determined that
the presence of this residue is essential for insertion into the lipid bilayer. Figure 21
shows the surface-exposed position of W35.
A. B.
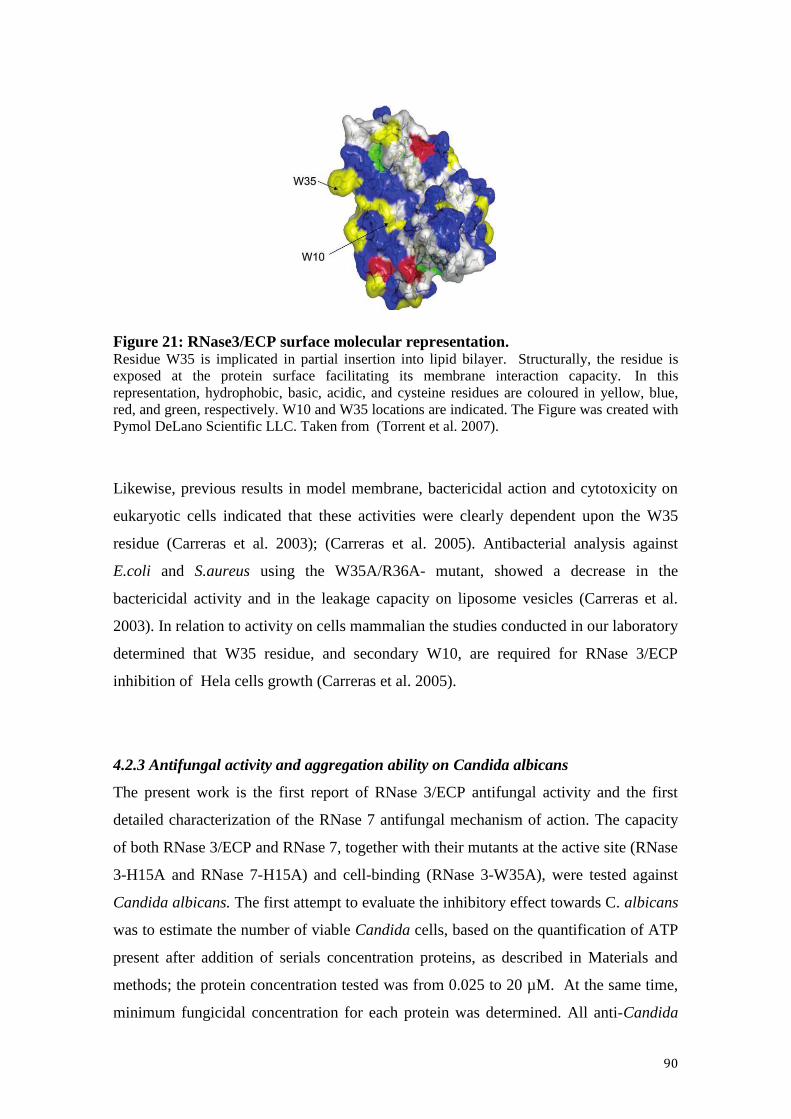
90
Figure 21: RNase3/ECP surface molecular representation. Residue W35 is implicated in partial insertion into lipid bilayer. Structurally, the residue is exposed at the protein surface facilitating its membrane interaction capacity. In this representation, hydrophobic, basic, acidic, and cysteine residues are coloured in yellow, blue, red, and green, respectively. W10 and W35 locations are indicated. The Figure was created with Pymol DeLano Scientific LLC. Taken from (Torrent et al. 2007).
Likewise, previous results in model membrane, bactericidal action and cytotoxicity on
eukaryotic cells indicated that these activities were clearly dependent upon the W35
residue (Carreras et al. 2003); (Carreras et al. 2005). Antibacterial analysis against
E.coli and S.aureus using the W35A/R36A- mutant, showed a decrease in the
bactericidal activity and in the leakage capacity on liposome vesicles (Carreras et al.
2003). In relation to activity on cells mammalian the studies conducted in our laboratory
determined that W35 residue, and secondary W10, are required for RNase 3/ECP
inhibition of Hela cells growth (Carreras et al. 2005).
4.2.3 Antifungal activity and aggregation ability on Candida albicans
The present work is the first report of RNase 3/ECP antifungal activity and the first
detailed characterization of the RNase 7 antifungal mechanism of action. The capacity
of both RNase 3/ECP and RNase 7, together with their mutants at the active site (RNase
3-H15A and RNase 7-H15A) and cell-binding (RNase 3-W35A), were tested against
Candida albicans. The first attempt to evaluate the inhibitory effect towards C. albicans
was to estimate the number of viable Candida cells, based on the quantification of ATP
present after addition of serials concentration proteins, as described in Materials and
methods; the protein concentration tested was from 0.025 to 20 µM. At the same time,
minimum fungicidal concentration for each protein was determined. All anti-Candida

91
evaluations have been performed three times and in duplicate. Analysis of IC50 and the
MFC100 values (Table 10) indicated that RNase 7 and RNase 7-H15A have comparable
antifungal activities, showing only small-significant differences in the IC50 values as
calculated by the Student’s T test. For a further analysis of RNase 7 and RNase 7-H15A
antifungal activities, both proteins aggregation activities were tested by serial addition
of protein concentrations up to 20 µM. None of the proteins displayed yeast aggregation
even at high protein concentration. These activities might be compared with the prior
results described by our investigation group on bacterial cells where RNase 7 did not
cause aggregation (Torrent et al. 2010a).
Regarding RNase 3/ECP, the wild-type protein and its mutant H15A also exhibited high
inhibitory ability at low micromolar range as shown by their MFC and IC50 values.
Besides, the comparison between RNase 3-H15A and RNase 3-W35A mutants with the
wild type demonstrated that both the H15 active site residue and the surface residue
W35 contribute to the antifungal activity. The RNase 3/ECP protein concentration
required to inhibit Candida growth was higher in comparison to RNase 7. Nevertheless,
the aggregation ability was displayed at a low protein concentration. Interestingly, the
aggregation ability towards C. albicans for both RNase 3/ECP and RNase 3-H15A
displayed a value around 2 µM, showing the protein potential high binding affinity for
Candida cell wall components. The achieved aggregation activity toward Candida
showed by RNase 3/ECP and H15A mutant is similar to that reported by other
antimicrobial peptides as LL37 (Tsai et al. 2011); (Tsai et al. 2014).
Concerning RNase 3-W35A, this protein presented a decrease in its antifungal activity,
the IC50 estimation was around 10 µM and MFC100 showed a value >20 µM necessary
to inhibit Candida growth. W35 was previously reported as an essential residue to
provide antibacterial activity (Carreras et al. 2003); this punctual changed by alanine
residue have the same effect in the antifungal ability.

92
Table 10: Antifungal and cell agglutinating activities of RNase 7, RNase 7-H15A, RNase 3/ECP, RNase 3-H15A and RNase 3-W35A on Candida albicans. IC50, MFC100, survival percentage and the minimal agglutinating activity (MAC) were calculated as described in Materials and methods. MFC100 values were calculated by CFU counting on plated Petri dishes. All values were averaged from three replicates of two independent experiments. The maximum concentration tested for MAC was 20 µM. The protein concentration used for the Live/Dead assay was 5 µM, the survival percentage was estimated at 240 min. For the comparison of numerical variables between wild type and mutant, the Student’s T test was used. Values of p <0.05* and p <0.09** were considered significant.
The interesting preliminary results encouraged us to further investigate the protein
mechanisms of action at the cellular level. The kinetic profile of survival on Candida
cells was analysed. The antifungal activity profiles were monitored by staining of yeast
cells with the Live/Dead Kit, using syto 9 and propidium iodide. Although the syto 9
dye can cross the cytoplasmic membrane and label all yeast cells, propidium iodide can
only access the content of membrane-damaged cells, competing and displacing the
bound syto 9. Therefore, the integration of syto 9 and propidium iodide fluorescence
provides an estimate of the viability percentage for monitoring the kinetics of the
antifungal process. The values were estimated after addition of 5 µM of each protein.
Although all proteins display an antifungal effect, again the RNase 7 was more effective
and was able to almost abolish the Candida population within the registered time,
achieving a 7.74% of final cell survival; the results being consistent with the
aforementioned MFC and IC50 values (Table 10).
RNase 3/ECP and its H15A mutant also growth displayed inhibition, where the wild-
type protein achieved a cell-survival percentage of 9%. On the other hand, the RNase
3-W35A presented the lowest Candida inhibition value with a 37% of survival.
Protein IC 50 (µM) MFC 100 in µM
(Minimum fungicidal concentration)
Survival (%)
MAC in µM (Minimal agglutination
concentration)
RNase 7 1.6 ± 0.97 3.75 7.74 ± 0.12 No aggregation
RNase 7-H15A 1.93 ± 0.76* 4.12 9.07 ± 0.09 No aggregation
RNase 3 2.5 ± 0.01 4.7 9.72 ± 0.05 2
RNase 3-H15A 3.45 ± 0.08** 9.0** 14.08 ± 0.12 2
RNase 3-W35A 9.03 ± 0.52** > 20** 37.84 ± 0.36 2.5 ± 0.05

93
To visualise the morphological changes in yeast cell population upon incubation with
both RNase 3/ECP and RNase 7, the process was also monitored using confocal
microscopy, where Live/Dead cells were also labelled with the syto 9 and propidium
iodide dyes, respectively, Figure 22. A careful inspection of yeast culture behaviour by
confocal microscopy revealed an increase in yeast dead cells following the aggregation
process, when RNase 3/ECP is added.
Figure 22: Kinetic Candida albicans profile after protein incubation. C. albicans cells were incubated with 5 µM of RNase 3/ECP in microscopy plates up to 1 h 40 min. Cell culture was stained with syto9 and propidium iodide, as provided by the Live/Dead kit. Images were taken at 0 min, 2 min, 30 min, 60 min and 100 min using a Leica SP2 confocal microscopy.
Based on the high antifungal activity displayed by host defence proteins, we next
decided to analyse the membrane-depolarization and permeabilization abilities. The
protein concentrations that were used for these experiments were reduced to sublethal
values, taking as a reference the values obtained by the IC50 determination.

94
Membrane depolarizing activity was studied using the DiSC3(5) fluorophor at 1 µM.
The results obtained showed that RNase 3/ECP and RNase 7 are able to depolarize
yeast cells at low protein concentration. Comparing RNase 7 with its H15A mutant, the
wild type was slightly more active. RNase 3/ECP and RNase 3-H15A retained a high
activity, while RNase 3-W35A showed the worst performance (Table 11).
Table 11: Membrane-depolarization and permeabilization activities on Candida albicans. Membrane-depolarization and permeabilization activities were determined using the DiSC3(5) probe and SYTOX Green®, respectively, as described in Materials and methods. The protein concentration used was 1 µM during 50 min. All values are averaged from three replicates of two independent experiments. Absolute fluorescence values are indicated for maximum membrane-depolarization and permeabilization. For membrane permeabilization and membrane-depolarization, the calculated percentages refer to the maximum values corresponding to the positive control (10 % Triton X-100). The p value was calculated using as a reference each wild-type activity (** correspond to p <0.001).
Protein Max. depolarizationa
Mean % Max. disruption
Mean %
RNase 7 165.77 ± 1.10 71.67 ± 0.1 134.56 ± 1.95 45.90 ± 0.5
RNase 7-H15A 153.96 ± 1.65** 66.54 ± 0.9 93.05 ± 1.24** 31.52 ± 0.3
RNase 3 80.07 ± 0.90 34.62 ± 0.08 104.93 ± 2.80 35.55 ± 0.4
RNase 3 -15A 67.27 ± 1.13** 29.08 ± 1.0 61.32 ± 0.63** 20.77 ± 0.2
RNase 3-W35A 28.42 ± 0.42** 12.28 ± 0.7 24.84 ± 0.25** 8.46 ± 0.6
Also, the timing for depolarization and cell death activities were analysed. Comparison
of t50 indicated that the depolarization activity is already significant well before cell
death (Table 12).

95
Table 12: Comparison of timing for all proteins tested at 1 µµµµM final concentration. T50 value was calculated as time to achieve 50% depolarization and cell-survival. Depolarization was assayed using DISC3(5) dye, and survival percentage was calculated by syto 9 and PI (Live/Dead kit).
Further insight into the cell membrane-permeabilizing effect of both proteins and their
mutants was performed using the SYTOX® Green assay. SYTOX® Green
uptake/fluorescence was monitored as a function of time after adding 1 µM final
concentrations of proteins. The total cell permeabilizing effect was calculated after 40
min of incubation, Table 11 shows that the RNase 7 presented the best permeabilizing
effect with a 45.9 % value, whereas RNase 3/ECP presented a high effect but slightly
lower effect with 35.5%. Mutant W35A presented the minor permeabilization effect.
Results suggest that W35A substitution limited the protein partial insertion into the
yeast cell membrane, as previously reported in a membrane model (Torrent et al. 2007).
Therefore, according to the depolarization and the cell leakage results, RNase 3/ECP
and RNase 7 have a membrane-perturbing activity against Candida yeast cells. Overall,
we can suggest that a direct protein interaction with membrane lipids followed by
membrane permeabilization is likely the first cause of antifungal activity of host
defence ribonucleases. Also, the effect is corroborated by the similar activity shown by
the active site mutant. This initial approach is similar to the effect described by other
antimicrobial peptides, as the 1-18 fragment of the frog skin esculentin towards
Candida (Luca et al. 2013), where Esc (1–18) displayed a fast fungicidal activity
(within 20 min), with a rapid membrane perturbation as the primary cause of antifungal
activity of this AMP.
To better understand the effect of host-ribonucleases toward Candida and analyse the
potential contribution of the RNase activity in the antifungal ability, we analysed the
wild types and mutants in Candida internalization. Observations of C. albicans cultures
treated with labelled ribonucleases by fluorescence microscopy showed an
Protein Depolarization t50 (s)
Cell death t50 (s)
% Survival after 120 minutes
RNase 7 261.23 873.6 38.2 RNase 7-H15A 288.53 1006.8 54.86 RNase 3 251.36 1707.3 56.87 RNase 3-H15A 356.75 2029.8 67.89

96
internalization activity towards pseudo-hyphal stage (Figure 23) and individual yeast
cells (Figure 24). Interestingly, numerous studies by antimicrobial peptides have also
reported better inhibitory effect in hyphal form and subsequent biofilm inhibition
formation (Luca et al. 2013); (Rahnamaeian 2011); (Kagan et al. 2013).
Figure 23: Fluorescence microscopy of C. albicans treated with RNase 3/ECP and RNase 3 H15A. C. albicans were incubated with 4 µM of Alexa fluor labelled A.RNase 3 and B. RNase 3-H15A and cultures were examined using fluorescence microscopy.
Once established that host ribonucleases were able to cross the yeast wall and
membrane at low concentrations, we incubated Candida cells with labelled RNases and
analysed the activity by a frame time of 120 minutes. As depolarization and disruption
abilities were observed at sub-lethal concentrations, we used the same concentration in
confocal observations. When Alexa-labelled proteins were incubated with C. albicans at
37 ºC in yeast form, an internal fluorescence was observed in both wild type proteins
and active site mutants. The membrane binding occured rapidly at the first minutes and
the intracellular fluorescence was progressively increased. Figure 24 shows the
internalization at the first 5 minutes and the gradual increment after 20 minutes of
incubation. Alexa Fluor 488-Protein signal is represented in green and Hoechst labelled
yeast cell signal in blue. In the case of RNase 3-H15A, the protein uptake process could
be observed better probably because the inhibition of the catalytic activity preserved the
A.
B.

97
internal machinery of yeast, maintaining the cell morphology for longer “time-live”.
The collection of data and images by time-lapse led us to determine that the cell
binding and uptake occurs rapidly at a time-dependent manner, as reported by (Fang et
al. 2013) for a cell-penetring peptide derived from RNase 3/ECP. On the other hand,
the results obtained with the RNase 3-W35A mutant, showed the protein accumulation
outside the yeast cell indicating that the RNase 3/ECP cell internalization and
antifungal activity are dependent upon this residue. Contribution of W35 residue in
antibacterial activity (Carreras et al. 2003); (Torrent et al. 2007), membrane model and
eukaryotic cells (Carreras et al. 2005) have previously been reported. Results confirmed
that both RNases are able to enter into the yeast cells. Distribution of fluorescence
signal is shown in Figure 25, confirming the Alexa labelled protein cell uptake. A total
of 20 C. albicans cells were analyzed by regions of interest (ROI), using LAS AF lite,
Leica software. The gradual increase of the green signal into the cell population was
followed during 60 min (Figure 24-26). The yeast size mean was adjusted around 4-4.5
µm, and a distance > 4.5 µm was adscribed to the cell environment. Protein cell uptake
was also visualized using a protein concentration bellow the IC50, and yeast population
visualization after several PBS washes to remove unbound protein (Figure 26).

98
Figure 24: Effects of RNase 7, RNase 7-H15A, RNase 3/ECP, RNase 3-H15A and RNase 3-W15A (A-E) on C. albicans in mid- exponential growth phase at 37ºC. The yeast morphology is shown in the left-hand side. Second panel shows Candida yeast labelled with hoechst. The third panel shows the merged hoechst + Alexa Fluor 488–protein after 5 min of protein addition and last panel shows the activity after 20 minutes. ImageJ software was used for analysis. The magnification scale is indicated at the bottom of each micrograph.

99
Figure 25: Fluorescence signal distribution in Candida albicans yeast culture after protein addition. A total of 20 Candida cells were analysed by ROIs using Leica TCS. Bar graphs of total percentage values of internal and external fluorescence (maximum peak) display the labelled protein distribution in Candida cells. Analysis was made at 20 min after protein addition at 1 µM final concentration. Yeast mean size was adjusted according to Hoescht labelled distribution and DISC imagen. The mean size was around 4.5 µm, a distance >4.5 µm was adscribed to the cell environment. Black bar corresponds to outer fluorescence and gray bar to inner fluorescence.
Figure 26: Confocal microscopy analysis of Candida cell culture (~3 x10⁶ cells/mL) incubated with 1 µM of RNase 3/ECP, 7 and active site mutants labelled with alexa fluor 488. Fluorescent and Differential Interference Contrast (DIC) merge images are shown. A) Protein localization in yeast cells after 20 min of incubation at 37ºC with labelled proteins. B) Merged images of C. albicans cells after three PBS washes to eliminate fluorescence background and free labelled proteins. The images were taken using a Leica TCS SP5 AOBS microscope.

100
To confirm the observations recorded by confocal microscopy, we studied the
internalization by flow cytometry. The figure 27 displays cell the protein uptake.
A. B.
Figure 27: Histogram of C. albicans distribution treated with RNase 3/ECP-Alexa Fluor. 10,000 cells were analyzed for RNase 3/ECP localization after incubation with 5 µM of protein during 1 hour. A. Control cells B. Candida albicans after labelled protein addition.
Afterwards, cytofluorometic experiments with all the proteins were carried out.
Propidium iodide was used to stain membrane-damaged cells. The plot shown in Figure
28 was divided in four sections to distinguish populations that are considered negative,
single positive, or double positive. The lower-left quadrant displays events that are
negative for both parameters (labelled-protein cell uptake (Alexa-fluor) and labelled
dead-cells with propidium iodide). The upper-left quadrant contains events that are
positive for the y-axis propidium iodide-dead cells, but negative for the x-axis (Alexa
fluor) parameter. The lower-right quadrant contains events that are positive for the x-
axis parameter (Alexa fluor) but negative for the y-axis (propidium iodide-dead cell)
parameter. The upper-right quadrant contains events that are positive for both
parameters (Alexa fluor; propidium iodide), or double positive.

101
Figure 28: Protein uptake and cytotoxicity measured by flow cytometry. 25000 cells, gated on Candida cells by Forward scatter (FSC)/Side scatter (SSC). C. albicans were incubated with 5 µM of RNase 3/ECP or H15A mutant, RNase 7 and H15A during 45 min; the samples were analysed using a FACSCalibur cytometer. Dot plot diagrams of Protein-Alexa Fluor 488/ PI show yeast population divided in four quadrants corresponding to: Candida cells without protein uptake: blue colour, cells with protein uptake: green colour, dead cells purple and dead cells by protein uptake: light blue colour.
After corroborating the Candida protein uptake at 1 µM concentration, the protein
uptake was followed during 1 h time; Figure 29 displays a gradual increase in the
protein fluorescence colocalization with cells. Besides, FACS analysis confirmed that
no significant cell death is observed at the assayed conditions.
A.

102
Figure 29: Protein localization and cytotoxicity measured by flow cytometry. C. albicans were incubated with 1 µM of RNase 7 (A) and H15A mutant (B) during 2 min, 5 min, 15 min and 60 min; the samples were analysed using a FACSCalibur cytometer. Dot plot diagrams of Protein-Alexa Fluor 488/ PI show yeast population divided in four quadrants corresponding to: Candida cells without protein uptake: blue colour, cells with protein uptake: green colour, dead cells: red and dead cells by protein uptake: orange colour. Finally, the RNases potential effect on the yeast intracellular RNA was assessed at
sublethal concentrations. Total cellular RNA was extracted from treated cultures and
analysed by capilar electrophoresis. Following, the corresponding time course decrease
in rRNA was evaluated by as a function of time, Figure 30. Results confirmed the
drastic reduction of the rRNA cleavage rate for the cells incubated with the active site
mutant. On the other hand, for the W35A mutant showing a defective internalization, no
significant cellular RNA degradation is observed. All time course samples were also
evaluated to confirm that no reduction of yeast cell population was significant by
registering the cell culture DO600. Also, CFU were assayed at incubation final time.
B.

103
Figure 30: Effect of RNase 3/ECP and mutants on C. albicans cellular RNA. 1 mL of yeast cell suspension (~ 1-2 x10⁷ cells/mL) was treated with 3 µM of each protein. A) Samples were analyzed by Experion automated electrophoresis and RNA was visualized with the Experion software. Left lane contains molecular mass markers, where reference base pairs are indicated. Control lane corresponds to cellular RNA from untreated cells. The RNA extraction was made at different time intervals up to 20 min.
Based on all results obtained in the present study, we confirmed that both RNase 3/ECP
and 7 displayed an efficient antifungal activity. RNase 7 activity was reported
previously by (Harder and Schroder 2002). This is the first report of RNase 3/ECP
activity together with a thorough characterization of both RNases mechanism of action.
The membrane-depolarization and destabilization abilities on Candida membrane were
analysed. The data also are consistent with the translocation of the proteins into
Candida cells at low sublethal protein concentration. In comparison to RNase 3/ECP,
RNase 7 presents a higher inhibitory activity suggesting a physiological role for RNase
7 antifungal properties. Its tissue expression at the skin level corresponds to the most
common tissue exposed to Candida infection. The cationic structure of both RNases
would facilitate the membrane protein association. Moreover, the high content of Arg of
RNase 3/ECP may promote the protein cell internalization, where the guanidine head
group of arginine can form hydrogen bonds with the negatively charged components on
the cell Candida surface membrane and might lead to internalization.

104
We can consider both RNases as multifunctional proteins with cytotoxic, membrane-
disrupting, and cell-penetrating activities on Candida albicans. Moreover, RNase
3/ECP additional cell aggregation ability also reported for bacterial cells (Torrent et al.
2010a); (Torrent et al. 2012); (Pulido et al. 2013) could be a useful tool key to inhibit
biofilm formation, with suitable pharmacological applications.
The present study of RNases antifungal activity shows that the protein-membrane
interaction is the first event that involve several sequential steps beginning with
membrane-disturbance and translocation into the cytoplasm in a non-lytic manner at
protein-sublethal-concentration where it acts on an intracellular target leading to cell
death, as reported for other antimicrobial peptide with antifungal activity (Meiller et al.
2009). Host defence RNases would interact with cellular nucleic acids and degrade
RNA, leading to cell death.
Finally, we established that RNase 7 and RNase 3/ECP are able to inhibit yeast cell
growth at micromolar concentration. A dual model of activity is dependent of protein
cationicity and the catalytic activity that contributes to final killing process. Also, our
analysis supported the essential role of W35 residue in membrane binding and
subsequently cell internalization.

105
4.3 Exploring RNase 8 structure-function. Design of a new expression protocol
and functional characterization.
4.3.1 RNase 8 expression and purification
Up to now, no clearly defined method of purification of the recombinant human RNase
8 has been reported. In the process of preparation of recombinant RNase 8 using pET11c
vector, and E. coli BL21 (λDE3) strain as an expression system, very few or almost no
protein was obtained. The methods of purification carried out for the preparation of
most of the other RNases homologues, including the human RNase 7, which shares
about 80% of identity with the RNase 8, also proved unsuccessful. In all our attempts of
purification, a high tendency of protein aggregation was observed in the crude extract as
well as during the process of purification.
Following, we select a method based on the use of an attached histidine tag. The protein
is recovered by a Ni2+ affinity chelating chromatography. The protocol allows an
effective capture of the soluble target protein. Moreover, the conditions of the
chromatography can facilitate the stability of the target protein. The vector pET45b(+)
which allows the expression of an N-terminus hexahistidine tagged protein was
selected. The expression has been carried out in E. coli BL21 (λDE3) after induction
with 1 mM IPTG at room temperature to enhance the expression of soluble protein
against the formation of inclusion bodies.
4.3.1.1 Affinity chromatography In this step of chromatography, the crude extract is rapidly loaded onto the Ni2+ affinity
chelating chromatography to capture the maximum quantity of soluble protein. This
method of chromatography allowed a high amount of bounded protein. However, even
in these conditions, protein aggregation was observed in the collected peak after elution
and during the subsequent steps of purification probably due to the high concentration
of protein. Therefore, the addition of a combination of 5 mM DTT and 5 mM EDTA
(Hiromi et al. 2005) to the eluted protein immediately after chromatography prevented
protein aggregation and enabled significant increase of the amount of soluble His-tag
RNase 8 (Figure 31).

106
100
80
60
40
0
20
0
20
40
60
80
100
%B
Waste
% B2000
1500
1000
500
mAU
0
0 50 100 150 200 250 300 350 ml
1 2 3 4 5 6 7 8 9 10 11 12 13 14 15 16 17 18 19 20 21 22 23 25 26 27 28 29 30 31 32 33 34 35
0 50 100 150 200 250 300 350 ml 0 50 100 150 200 250 300 350 ml
1 2 3 4 5 6 7 8 9 10 11 12 13 14 15 16 17 18 19 20 21 22 23 25 26 27 28 29 30 31 32 33 34 35 Waste
100
80
60
40
0
20
0
20
40
60
80
100
%B
Waste
% B100
80
60
40
0
20
0
20
40
60
80
100
%B
Waste
% B2000
1500
1000
500
mAU
0
2000
1500
1000
500
mAU
0
0 50 100 150 200 250 300 350 ml
1 2 3 4 5 6 7 8 9 10 11 12 13 14 15 16 17 18 19 20 21 22 23 25 26 27 28 29 30 31 32 33 34 35
0 50 100 150 200 250 300 350 ml 0 50 100 150 200 250 300 350 ml
1 2 3 4 5 6 7 8 9 10 11 12 13 14 15 16 17 18 19 20 21 22 23 25 26 27 28 29 30 31 32 33 34 35
0 50 100 150 200 250 300 350 ml 0 50 100 150 200 250 300 350 ml
1 2 3 4 5 6 7 8 9 10 11 12 13 14 15 16 17 18 19 20 21 22 23 25 26 27 28 29 30 31 32 33 34 35 Waste
Figure 31: Ni2+ affinity chelating chromatography on HisTrap HP column for the purification of His-tagged RNase 8. The column was equilibrated with 50 mM Tris/HCl pH 7.5, 500 mM NaCl, 60 mM Imidazole and the elution buffer was 50 mM Tris/HCl pH 7.5, 500 mM NaCl, 1M Imidazole.
The column was equilibrated with a buffer containing 60 mM imidazole since lower
concentrations allowed binding of unwanted proteins that elute together with the
histidine tagged RNase 8, even when an intermediate wash with higher concentration of
imidazole was applied.
SDS-PAGE electrophoresis (Figure 32, lane 3) indicated that this chromatography,
although it allows a high capture and consequently a high yield of target protein,
achieves a degree of purification is not satisfactory. An additional step of purification
was therefore necessary to obtain a pure protein.

107
Figure 32: 15% SDS-PAGE electrophoresis. Purification of His-tagged RNase 8, Lane 1, 5 µg of RNase A (marker); lane 2, Clarified extract after cell lysis; lanes 3, Flow through fraction and 4, Elution fraction.
4.3.1.2 Gel filtration chromatography In order to repurify the protein avoiding any drastic changes in the sample conditions,
the sample obtained in the previous chromatography was loaded onto a gel filtration
chromatography after sample concentration. Excessive high concentration was also
avoided to prevent protein aggregation. Therefore, the sample was concentrated up to 5
mL. Hiload 26/60 Superdex 200 FPLC column was suitable to achieve this
chromatography as it allowed loading sample volumes up to 5 mL. The column was
equilibrated with sodium acetate 50 mM containing 300 mM NaCl, 5 mM DTT and 5
mM EDTA. The sample loading and elution were carried out at a flow rate of 0.5
mL/min. A majoritary peak eluted at ~ 230 mL elution volume corresponded to the
histidine tagged RNase 8 (Figure 33).
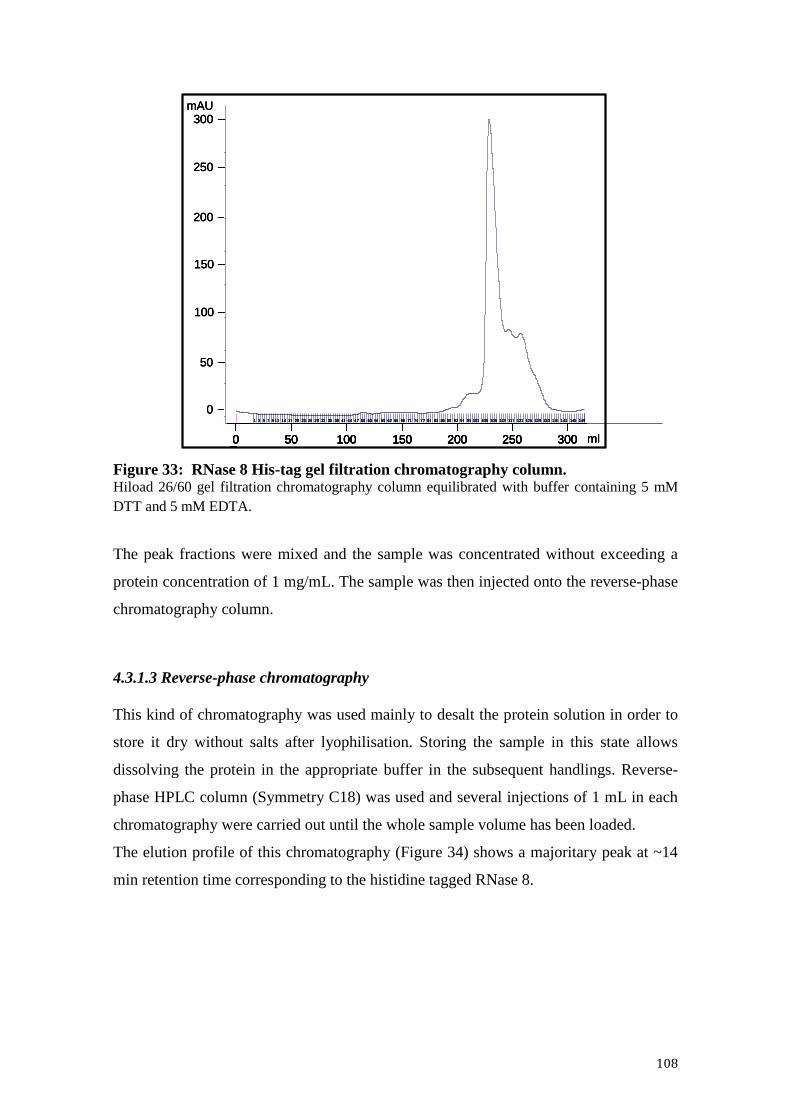
108
1 3 5 7 9 11 14 17 20 23 26 29 32 35 38 41 44 47 50 53 56 59 62 65 68 71 74 77 80 83 86 89 92 95 98 101 105 109 113 117 121 125 129 133 137 141 145 149
300
250
200
50
mAU
0
ml200 250150100 3000 50
150
100
1 3 5 7 9 11 14 17 20 23 26 29 32 35 38 41 44 47 50 53 56 59 62 65 68 71 74 77 80 83 86 89 92 95 98 101 105 109 113 117 121 125 129 133 137 141 145 149
300
250
200
50
mAU
0
ml200 250150100 3000 50
150
100
1 3 5 7 9 11 14 17 20 23 26 29 32 35 38 41 44 47 50 53 56 59 62 65 68 71 74 77 80 83 86 89 92 95 98 101 105 109 113 117 121 125 129 133 137 141 145 149
300
250
200
50
mAU
0
ml200 250150100 3000 50 ml200200 250250150150100100 30030000 5050
150
100
Figure 33: RNase 8 His-tag gel filtration chromatography column. Hiload 26/60 gel filtration chromatography column equilibrated with buffer containing 5 mM DTT and 5 mM EDTA.
The peak fractions were mixed and the sample was concentrated without exceeding a
protein concentration of 1 mg/mL. The sample was then injected onto the reverse-phase
chromatography column.
4.3.1.3 Reverse-phase chromatography This kind of chromatography was used mainly to desalt the protein solution in order to
store it dry without salts after lyophilisation. Storing the sample in this state allows
dissolving the protein in the appropriate buffer in the subsequent handlings. Reverse-
phase HPLC column (Symmetry C18) was used and several injections of 1 mL in each
chromatography were carried out until the whole sample volume has been loaded.
The elution profile of this chromatography (Figure 34) shows a majoritary peak at ~14
min retention time corresponding to the histidine tagged RNase 8.

109
Figure 34: Reverse-phase chromatography: Elution profile of His-tag RNase 8. Reverse-phase HPLC column (Symmetry C18) was used and a gradient with acetonitrile was applied as indicated.
4.3.1.4 Removal of N-terminus His6 tag by Enterokinase
The RNase 8 purification protocol is designed for situations in which complete removal
of the foreign his6 tagged peptide is required. The plasmid used to direct the expression
of His-tag RNase 8 included a sequence corresponding to Enterokinase site cleavage at
the C-terminus of the his6 tagged peptide linked to the target protein.
For the digestion, protein concentration was maintained at 1 mg/mL to avoid
aggregation of the protein and 0.02 U of Enterokinase was added for each mg of
histidine tagged RNase 8. The reaction mixture was incubated during 4 hours at 25 ºC.
The reaction mixture was then loaded to the Ni2+ affinity chelate chromatography to
purify the untagged RNase 8 from the rest of the reaction mixture (Figure 35).
4.3.1.5 Affinity chromatography
To purify the RNase 8 from the mixture of the reaction catalysed by the enterokinase,
the reaction mixture was loaded onto an His-Trap affinity column as in the previous
affinity chromatography. The column was equilibrated with 50 mM Tris/HCl pH 7.5,
500 mM NaCl buffer containing 10 mM Imidazole. For protein elution, consecutive

110
column washes were carried out with buffer solution containing 100 and 300 mM
imidazole to elute the detagged RNase 8 and undigested His tagged RNase 8
respectively (Figure 35).
0.0 10.0 20.0 30 .0 40 .0 5 0.0 60.0 m l
1 2 W aste 3 4 5 6 7 8 9 10 11 12 13 14 1 5 1 617 19 20 21 22 23 2 4 25 26 27 2 8 30 31 32 W aste
100
80
60
40
0
20
0
20
40
60
80
1 00
% B
W aste
% B
ml40 503020 600 10
800
600
400
200
mAU
00.0 10.0 20.0 30 .0 40 .0 5 0.0 60.0 m l
1 2 W aste 3 4 5 6 7 8 9 10 11 12 13 14 1 5 1 617 19 20 21 22 23 2 4 25 26 27 2 8 30 31 32 W aste
100
80
60
40
0
20
0
20
40
60
80
1 00
% B
W aste
% B100
80
60
40
0
20
0
20
40
60
80
1 00
% B
W aste
% B
ml4040 505030302020 606000 1010
800800
600600
400400
200200
mAU
000.0 10.0 20.0 30 .0 40 .0 5 0.0 60.0 m l
1 2 W aste 3 4 5 6 7 8 9 10 11 12 13 14 1 5 1 617 19 20 21 22 23 2 4 25 26 27 2 8 30 31 32 W aste
100
80
60
40
0
20
0
20
40
60
80
1 00
% B
W aste
% B
ml40 503020 600 10
800
600
400
200
mAU
00.0 10.0 20.0 30 .0 40 .0 5 0.0 60.0 m l
1 2 W aste 3 4 5 6 7 8 9 10 11 12 13 14 1 5 1 617 19 20 21 22 23 2 4 25 26 27 2 8 30 31 32 W aste
100
80
60
40
0
20
0
20
40
60
80
1 00
% B
W aste
% B100
80
60
40
0
20
0
20
40
60
80
1 00
% B
W aste
% B
ml4040 505030302020 606000 1010
800800
600600
400400
200200
mAU
00
Figure 35: Ni2+ affinity chelate chromatography on HisTrap HP column for the separation of RNase 8 and His-tagged RNase 8. The column was equilibrated with 50 mM Tris/HCl pH 7.5, 500 mM NaCl, 10 mM Imidazole and the elution buffer was 50 mM Tris/HCl pH 7.5, 500 mM NaCl, 1M Imidazole.
The elution profile of this chromatography (Figure 35) shows a majoritary peak at ~ 40
mL elution volume corresponding to the untagged RNase 8 and a peak at ~ 50 mL
elution volume which corresponds to the histidine tagged RNase 8. Some untagged
RNase 8 was also found in the fraction corresponding to the sample loading.
The fraction corresponding to RNase 8 was concentrated and injected as previously into
the reverse-phase HPLC column (Symmetry C18) to desalt the protein (Figure 36).
4.3.1.6 Reverse-phase chromatography
This chromatography was carried out by using the same conditions of chromatography
used for the purification of His-tag RNase 8 (Figure 35). The reverse-phase
chromatography was used mainly to store the protein dry without salts after
lyophilization.

111
Figure 36: Reverse-phase chromatography. Elution profile of RNase 8. Chromatography conditions were carried out as described above.
Figure 36 shows the elution profile of the protein in the reverse-phase chromatography
in which RNase 8 presents the same retention time as histidine tagged RNase 8. At this
stage, pure RNase 8 was obtained (Figure 37).
The protein solution eluted in the HPLC system was frozen in aliquots, lyophilized and
stored at -20ºC for the subsequent study.
The analysis by 15% SDS-PAGE of the different steps of the preparation of RNase 8
showed a correct processing to obtain a pure protein at the end of the process (Figure
37).
1 2 3 4 5 6 71 2 3 4 5 6 71 2 3 4 5 6 7
Figure 37: Analysis by SDS-PAGE of the Histidine tag removal and RNase 8 purification. Lane 1, RNase A; lane 2, His-tagged RNase 8 from reverse-phase chromatography; lanes 3 and 4, reaction mixture of the his-tagged RNase 8 and enterokinase after 2 and 4 h digestion respectively; lanes 5 and 6, samples from first and second peaks of Ni2+ chelate chromatography for the separation of untagged and tagged RNase 8; lane 7, sample corresponding to RNase 8 after the reverse-phase chromatography.

112
The analysis of the purified RNase 8 by N-terminus sequencing and MALDI-TOF
showed the correct removal of the His tagged peptide from the fusion protein.
During the process of removal of His tag and subsequent purification, a loss of 10 to
20% initial protein was observed. At the end of the process, four to five mg of protein
were obtained per litre of culture.
4.3.2 RNase 8 characterization
4.3.2.1 Dynamic light scattering analysis (DLS) Following, we used DLS to analyse if the purified protein was obtained in a monomeric
state or any protein oligomerization was taking place. In our experiments, we observed
aggregation of the protein in concentrations above 1 mg/mL in buffer conditions
required for our functional studies. The effect of protein concentration on the
aggregation of recombinant RNase 8 was analysed by Dynamic light scattering using
Zetasizer Nano (Malvern). Figure 38 shows the results of DLS experiments carried out
for protein concentrations of 1, 5 and 10 mg/mL. To check the value found for RNase 8
corresponding to the appropriate size, particle size of proteins with similar molecular
weight, RNase A and RNase 3/ECP in addition to BSA were checked in the same
conditions.
Figure 38: Analysis of the RNase 8 solution by dynamic light scattering (DLS). Left panel ) The protein solution analysed at concentrations of 1mg/mL (■) and 5 mg/mL (▲). No particles size was observed at 10 mg/mL of protein concentration in the analysed size range. (Right panel) RNase 8 particle size (▼) compared to RNase A (�), RNase 3/ECP (▲), and BSA (■) used as controls. All samples were dissolved in phosphate buffer 10 mM pH 7.5.

113
Figure 38B indicates that RNase 8 at a concentration of 1 mg/mL presents a size of a
monomer, whereas at a concentration of 5 mg/mL it presents a size corresponding to an
oligomeric state and at a concentration of 10 mg/ml, the observed size was out of the
scale selected in the experiment.
This result indicates that aggregation of RNase 8 occurs depending on the protein
concentration. Therefore, for subsequent protein handling the protein was kept at a
maximum concentration of 1 mg/mL. Additional studies are required to find the factors
and/or additives necessaries to prevent aggregation at higher concentrations of the
protein.
4.3.2.2 Protein modelling studies Modelling studying was undergone to identify the protein aggregation regions. RNase 8
three-dimensional structure was predicted taking RNase 7 structure as a model; the
RNase 7 coordinates (2HKY.pdb) of the 3D structure determinated by NMR were used
as a template.
RNase 8 sequence was obtained from the UniProt KB Database (Expasy Bioinformatics
Resource Portal) entry Q8TDE3. Aggregation prone regions were identified with
aggrescan software (http://bioinf.uab.es/aggrescan) and compared to those of RNase A
and RNase 3/ECP. The protein modelling was made by means of the Swiss Model
Server, (http://swissmodel.expasy.org/) and the final three-dimensional model of RNase
8 was visualized with Pymol DeLano Scientific LLC (Figure 39).
Aggrescan software (Conchillo-Solé et al. 2007) analysis proved the specific
aggregation regions in RNase 8, although the overall tendency was predicted lower than
RNase 3/ECP, but higher than RNase A. We suggest that protein solubility might be
also affected by disulphide-bond mispairing or the presence of remaining free cysteines
residues.
The protein molecular modelling (Figure 39) shows different areas of aggregation prone
regions when comparing the four RNases. RNase 3/ECP shows the highest percentage
and RNase A the lowest whereas RNase 7 and RNase 8 seem to present the same
percentage of aggregation zones.
This result does not explain the high tendency of RNase 8 to aggregate, as no
aggregation was observed with RNase 7 and RNase 3/ECP in similar conditions.

114
Figure 39: Aggregation regions in RNase A, RNase 3/ECP, RNase 7 and RNase 8. The aggregation zones are coloured in red, each aggregation zone is delimited by the marked residues. The Figure was drawn according to the results given by Aggrescan software. The Figure was created with Pymol DeLano Scientific LLC.
4.3.2.3 Determination of free sulfhydryl (-SH) groups by computational prediction Disulphide bonds play an important role in the folding and stability of proteins, being
evolutionarily conserved. RNase A, the vertebrate RNase family reference, has been
used as a model for folding studies (Scheraga et al. 1987). Most RNase A family
members contains 4 conserved disulphide bonds connecting 8 cysteines. However,
human RNase 8, a paralog of RNase A, shows atypical cysteine distribution when
compared with the other canonical RNases.

115
The majority of the canonical RNases of mammals have 8 conserved cysteines. An
exception is RNase 5 (also known as angiogenin), which has only 6 cysteines, forming
3 disulphide bonds (Strydom et al. 1985). In the case of RNase 8, it was suggested that
the protein lost the sixth (C6) of the 8 conserved cysteines but gained another, when
compared with other canonical RNases (Zhang et al. 2002). The newly gained cysteine
is located between the fourth and fifth conserved cysteines (Figure 40) and is referred to
as CX.
Computational predictions suggested changes of the disulphide bonding paring due to
these cysteine substitutions leading to a reshuffling of disulphide bonds observed in the
other canonical RNases (Zhang, 2007).
A model of a three-dimensional structure of RNase 8 was predicted according to the
three-dimensional of RNase 7, which shares almost a 80% identity (Figure 40). The
computational prediction (Figure 41) showed the possibility of the formation of three
disulphide bonds while Cys 23 and Cys 66, too far to form a disulphide bridge, would
stay free.
Figure 40: Blast alignment of RNase 7 and RNase 8 sequences. Primary structure showing the matching of cysteine residues. The Secondary structure and disulphide bonds (numeration under the sequence) correspond to RNase 7. Unmatched new cysteine is indicated with an arrow. Altered disulphide pair is underlined.

116
Figure 41: Computational prediction of disulphide bonds pairing in RNase 8. (A) The three-dimensional structures of RNase 7 an RNase 8 models are overlapped. Picture drawn by Pymol DeLano Scientific LLC program. (B) Zoom view of disulphide bond environments. (C) Detail of the Cysteine 66 environment predicted to remain as a free residue.
4.3.2.4 Quantitative determination of free sulfhydryl (-SH) groups in RNase 8 The quantitative determination of free sulfhydryl groups in the protein allows us to
determine if all eight cysteine residues present in the protein are able to form disulphide
bridges. Ellman’s reagent 5,5’-dithio-bis-(2-nitrobenzonic acid) (DTNB) is useful
because of its specificity for –SH groups. A solution of this compound would produce a
measurable yellow-coloured product if there are free sulfhydryl (-SH) group in the
protein. DTNB reacts with a free sulfhydryl group to yield a mixed and a 2-nitro-5-
thiobenzoicacid (TNB). Therefore, TNB concentration at the end of the reaction
corresponds to the quantity of free sulfhydryl groups in the protein.
The assay was carried out at three concentrations of RNase 8. The concentration of
TNB formed in the reaction was determined either by the extinction coefficient of the

117
compound or by taking a standard calibration curve as a reference. The ratio nmol
TNB/nmol RNase 8 can determine the number of free sulfhydryl groups in the protein.
The result showed yellow-coloured product formation indicating the presence of free
sulfhydryl groups in the protein. The quantitative determination of TNB for the three
selected concentrations of protein and the subsequent molar ratio TNB/RNase 8
calculation (Table 13) indicated the presence of two free sulfhydryl groups in RNase 8.
This result indicates that only six of the eight cysteine residues are able to form
disulphide bonds.
Table 13: Molar ratio TNB/RNase 8. The nmols of TNB were calculated either by its molar extinction coefficient (εTNB = 13600M-1cm-1) or by a standard calibration reference curve.
Relation nmolsTNB/RNase 8
Calibration curve εTNB=13600M-1cm-1
1.4 1.57
1.6 1.77
1.6 1.81
Once the protocol for RNase 8 expression and purification was optimized, we started
the characterization of the protein biological properties. In this context, the catalytical
and antimicrobial activities of RNase 8 were analysed.
4.3.2.5 RNase activity characterization
4.3.2.5.1 Staining activity gel
The zymogram technique although is not a quantitative method, is very powerful for
detecting RNase activities and useful for comparative activity assays. Enzymatic
activity using different homopolynucleotides as substrates was estimated for the initial
characterization of human RNase 8 (Figure 42). Both purine and pyrimidine
homopolynucleotides were analysed to determine if RNase 8 is a purine or pyrimidine
specific ribonuclease. For activity comparison purposes, three different concentrations

118
of RNase A were used as a reference in each gel. The concentration of RNase 8 was the
same in poly(C), poly(U) and poly(A) gel.
No activity was observed with the substrate poly(A) (data not shown). This result
indicates that RNase 8 is a pyrimidine specifique ribonuclease.
In poly(C) and poly(U) gels comparison (Figure 42), RNase 8 showed a much higher
activity with poly(C) than with poly(U). This result indicates that RNase 8 prefers a
cytidine rather than uridine containing substrate.
Figure 42: RNase activity staining on gels containing either poly(C) or poly(U) as substrates. (A) Poly (C) substrate Lanes 1, 3 and 5: 50, 250 and 500 pg respectively of native RNase A; lanes 2, 4 and 6: 40, 200 and 1000 ng of RNase 8. (B) Poly (U) Lanes 1, 3 and 5: 0.5, 2.5 and 5 ng respectively of native RNase A; lanes 2, 4 and 6: 40, 200 and 1000 ng of RNase 8.
4.3.2.5.2 Poly(C) cleavage pattern by RNase 8
The analysis of the poly(C) cleavage by RNase 8 was carried out by separation of the
products of the digestion by reverse-phase HPLC (Nova-Pak C18 column). Product
separation and oligonucleotide identification were described by (Moussaoui et al. 1996).
The initial poly(C) substrate elutes as a homogeneous peak. The oligocytidylic acids of
increasing size elute with increasing retention time and the resolution between products
allows us to quantify the different oligocytidylic acid peaks.
A BA BA B

119
Figure 43: Analysis by reverse-phase HPLC column (Nova-Pak C column). A. Analysis by reverse-phase HPLC column (Nova-Pak C column) of products obtained from poly(C) digestion by RNase 8 at time intervals from 0 to 45 min. B. Comparison with the oligonucleotide size distribution obtained for RNase A under the same conditions.
The analysis of the oligonucleotide size distribution by RNase A (Figure 43) shows that
under the conditions used only polynucleotide fragments are formed during the early
stages of incubation. However, shortly thereafter (5 min) a clear trend toward the
formation of oligonucleotides with a size of about 6-7 residues is observed. As
expected, at the end of the process there is a clear increase in the number of small size
oligonucleotides. These results suggest that the enzyme prefers binding and cleavage of
long substrates and that to be preferentially cleaved by RNase A the phosphodiester
bond has to be some six-seven nucleotides apart from at least one of the ends of the
molecule (Moussaoui et al. 1996).
The cleavage pattern observed in the case of RNase 8 (Figure 43A) seems to be similar
to the cleavage pattern observed for RNase A. Nevertheless, the analysis of the products
of digestion shows a formation of oligonucleotides 1-2 residues shorter (4-5 residues
oligonucleotide size) than in the case of RNase A and the formation of small size
oligonucleotides (dinucleotide and trinucleotide) occurs earlier in the case of RNase 8.
This result suggests that RNase 8 has a reduced number of substrate binding sites.

120
4.3.2.5.3 Substrate cleavage pattern by RNase 8 In the analysis of the product formation pattern with high molecular mass substrates,
such as poly(C), the interaction with the enzyme involves several binding subsites,
including the potential contribution of basic amino acids located at the surface of the
protein. However, when smaller substrates, such as a pentanucleotide, are used, the
binding of the substrate will be limited to the regions adjacent to the active site. The
characterization of the cleavage preference of RNase 8 using the (Cp)4C>p substrate
was carried out following the procedure described by (Cuchillo et al. 2002), which is
based on the size of the products and their ratio. Taking into account the products
generated from the specific scissile bond, exonucleolytic cleavage, from either end,
yields a mononucleotide plus a tetranucleotide whereas the endonucleolytic cleavage,
also from either end, yields a mixture of di- and trinucleotide (Figure 44A). For an
accurate characterization of the cleavage preference, the data analysed correspond to the
digestion products obtained from different times of the reaction (Figure 44B). Each
product was quantified from the peak area of each product in absorbance units divided
by the corresponding molar extinction coefficient at 260 nm (ɛ260): 7845 M−1cm−1 for
C>p, 15,175 M−1cm−1 for CpC>p, 20,745 M−1cm−1 for (Cp)2C>p, 24,282 M−1cm−1 for
(Cp)3C>p, and 28,683 M−1cm−1 for (Cp)4C>p (Cuchillo et al. 2002).

121
Figure 44: Distribution of products formed by the initial cleavage of (Cp)4C>p. A). Exonucleolytic cleavage, from either ends, yields a mononucleotide plus a tetranucleotide whereas the endonucleolytic cleavage, also from either ends, yields a mixture of di- and trinucleotides. The ratio between the tetranucleotide and the dinucleotide formation can be used as an indicator of the preference for the endo- or exonucleolytic cleavage. B) Separation by reverse-phase HPLC (Nova pak C18 column) of the products obtained from the digestion of (Cp)4C>p by RNase 8 in 10 mM HEPES-KOH at pH 7.5. Elution was carried out as described in the methods.
The ratio of formation of the tetranucleotide (Cp)3C>p versus dinucleotide CpC>p
products obtained from the digestion of the (Cp)4C>p substrate allows us to distinguish
between the preference for endo- or exonucleolytic activity. Because of the 1:1
stoichiometry, CpC>p can be replaced by (Cp)2C>p and (Cp)3C>p by C>p. However, in
the latter case the HPLC measurement of C>p concentration is subject to a significantly
higher error. Therefore the ratio (Cp)3C>p/ (Cp)C>p was chosen as the best indicative
parameter (Nogues & Cuchillo 2001).
t = 0 min
t = 35 min
t = 15 mint = 5 min
(Cp)
4C>p
(Cp)
3C>p
(Cp)
2C>p
(CpC
>p(C
>p t = 60 min
t = 0 mint = 0 min
t = 35 min
t = 15 mint = 5 min
(Cp)
4C>p
(Cp)
3C>p
(Cp)
2C>p
(CpC
>p(C
>p
(Cp)
4C>p
(Cp)
3C>p
(Cp)
2C>p
(CpC
>p(C
>p t = 60 min
B t = 0 min
t = 35 min
t = 15 mint = 5 min
(Cp)
4C>p
(Cp)
3C>p
(Cp)
2C>p
(CpC
>p(C
>p t = 60 min
t = 0 mint = 0 min
t = 35 min
t = 15 mint = 5 min
(Cp)
4C>p
(Cp)
3C>p
(Cp)
2C>p
(CpC
>p(C
>p
(Cp)
4C>p
(Cp)
3C>p
(Cp)
2C>p
(CpC
>p(C
>p t = 60 min
B

122
Figure 45 shows the ratio of (Cp)3C>p versus (Cp)C>p formation at different digestion
percentages of the initial substrate for RNase 8 compared to the ratio obtained for
RNase A. Extrapolation of this ratio to 0% digestion of the initial substrate indicates the
actual preference of the enzyme in the initial stages of the reaction. High values are
indicative of a preference for the exonucleolytic cleavage with respect to the
endonucleolytic cleavage and, conversely, low values are indicative of a preference for
an endonucleolytic cleavage. The value obtained for RNase 8 compared to RNase A
indicates that RNase 8 activity tends slightly to an exonucleolytic activity.
Figure 45: Tetranucleotide/dinucleotide ratio for the cleavage of the pentacytidylic acid substrate (Cp)4C>p by RNase A and RNase 8. Tetranucleotide formation indicates exonucleolytic cleavage whereas formation of dinucleotide indicates endonucleolytic cleavage.
BA

123
4.3.3 RNase 8 antibacterial activity characterization
After exploring the enzymatic properties of RNase 8, we studied its antibacterial
properties, which could contribute to evaluate its potential role in host defence. The
antibacterial abilities were compared with the activities of RNase 7, the closest RNase
A superfamily homologue. The protein mechanism of action on bacterial cells and
membrane model was carried out. RNase 3/ECP, which has been extensively described
in our laboratory (Torrent et al. 2009); (Torrent et al. 2010a) has been used as reference
control. All assays were carried out at protein concentration below 60 µM to prevent
any protein aggregation.
4.3.3.1 Bactericidal and aggregation activities. In order to establish the ribonuclease 8 effect on Gram-negative and Gram-positive
strains, the bacterial growth inhibition by different techniques was evaluated. As a first
approach, the Minimum Bactericidal Concentration (MBC100) against various species:
two Gram-negative (E. coli, A. baumannii,) and two Gram-positive (S. aureus and M.
luteus) was calculated. MBC100 was considered as the protein concentration where
bacteria growth is totally inhibited. The previous results in our laboratory displayed
that RNase 3/ECP and RNase 7 have a comparable activity against bacterial cells, and
both showed a better inhibitory action on Gram-negative strains as reported by (Pulido
et al. 2012); (Torrent et al. 2011). In contrast, RNase 8 displayed a slightly lower
antibacterial activity showing a MBC100 value higher than RNase 3/ECP and/or RNase
7 (Table 14). To further compare the antibacterial abilities, we determined the IC50,
defined as the concentration at which cell viability is reduced to 50 % using the
BacTiter Glo kit, where the bacterial viability was estimated by ATP quantification. The
data also revealed that RNase 8 needs a higher protein concentration, about two-fold, to
reduce cell viability against Gram-negative microorganisms in comparison to Gram-
positive species.

124
Table 14: Antibacterial activities of RNase 8 against E.coli, S. aureus A. baumannii and M. luteus. Minimum Bactericidal concentration (MBC100) and (IC50) activities of RNases against Gram-negative and Gram-positive species are calculated by CFU counting and Bactiter assays, respectively. All values are averaged from three replicates of two independent experiments.
Another key antimicrobial property thoroughly studied in our laboratory is the capacity
to induce bacterial cell agglutination (Torrent et al. 2012); (Torrent et al. 2010a);
(Torrent et al. 2008). To quantify the bacterial aggregation ability, the minimal
agglutination concentration (MAC) was calculated (Table 15). No agglutination activity
was detected for RNase 7 and RNase 8, even at a high protein concentration in
comparison to RNase 3/ECP (Table 15). Data results for RNase 3/ECP and RNase 7
are consistent with previously published data from our laboratory, where agglutinating
activity, not shared with RNase 7, is specific toward Gram-negative bacteria and is
dependent on the protein primary structure (Torrent et al. 2012); (Pulido et al. 2012).
Table 15: Aggregation activity of RNases on E.coli, S. aureus A. baumannii and M. luteus Minimum aggregation activity (MAC) was calculated as the minimal concentration where bacteria agglutination is observed. ND: Not detected at a maximum tested protein concentration of 10 µM. All values are averaged from three replicates of two independent experiments
4.3.3.2 Electron microscopy To better characterize the RNase 8 action at the Gram-negative cell envelope, electron
microscopy techniques were applied. Treated cells were visualized by Transmission
Protein
MBC 100 (µM) IC50 (µM)
E.coli S. aureus A. baumannii M. luteus E.coli S. aureus A. baumannii M. luteus
RNase 8 0.92±0.1 1.3± 0.2 1.2± 0.02 2.5± 0.01 0.7± 0.3 1.0± 0.05 0.79± 0.07 1.7± 0.03 RNase 7 0.62± 0.03 1.2± 0.02 0.8± 0.03 1.8± 0.2 0.4± 0.02 0.9± 0.3 0.6± 0.2 1.0± 0.01
0.7± 0.02 RNase 3 0.61± 0.02 1.0± 0.1 0.9± 0.01 1.4± 0.3 0.5±0.01 0.7± 0.2 0.5± 0.1
Protein MAC (µM)
E.coli S.aureus A. baumannii M. luteus RNase 8 ND ND ND ND RNase 7 ND ND ND ND RNase 3 0.3±0.1 1.2±0.30 0.6± 0.1 1.0± 0.03

125
Electron Microscopy (TEM) and Scanning Electron Microscopy (SEM). E.coli cells
were examined by TEM after 4 h of incubation with 5 µM concentration of
ribonucleases (Figure 46). Also, we applied SEM to visualize the cell surface and the
cell population behaviour (Figure 47). Following, we described the results by SEM and
TEM techniques.
Figure 46: RNase 8 effect on E.coli cells analysed by TEM. Transmission electron micrographs of E. coli, incubated in presence of 5 µM RNase 3/ECP, RNase 7 or RNase 8 for 4 h. Magnification scale is indicated at the bottom of each micrograph.
First, E. coli strains were visualized by transmission electron microscopy (TEM) after 4
hours of incubation with 5 µM of RNase 8, RNase 7 and RNase 3/ECP. Details at the
bacteria wall were evaluated, where consistent cell damage was observed, especially
after RNase 3/ECP treatment (Figure 46). The addition of RNase 7 and RNase 8
induced a local cell surface disturbance. The aggregation activity was detected after
addition of RNase 3/ECP by scanning electron micrographs (Figure 47), whereas this
process was not detectable after treatment with RNase 8 and RNase 7. Also, we
Control RNase 3
RNase 7 RNase 8

126
observed membrane damage after RNases addition in comparison to untreated cells.
RNase 8 membrane cell damage would be similar to damage observed after RNase 7
addition.
Figure 47: RNase 8 effect on E.coli cells analysed by SEM. Scanning electron micrographs of E. coli incubated in presence of 5 µM RNase 3/ECP, RNase 7 or RNase 8 for 4 h. Magnification scale is shown at the bottom of each micrograph. Based on all the obtained results regarding the antibacterial activity of RNase 8, we then
explored the protein action on bacterial envelope and model membranes. For these
methodologies protein concentrations below the minimum bactericidal concentration
were applied.
4.3.3.3 Activity on citoplasmatic membrane
4.3.3.3.1 Depolarization assay Membrane depolarizing activity was studied using the DiSC3(5) marker, which
modifies its fluorescence intensity in response to changes in the transmembrane
potential, as described in the methodology. The results obtained show (Figure 48) that

127
RNase 3/ECP and RNase 7 are able to depolarize E. coli cells more rapidly than RNase
8. When comparing membrane-depolarization activities, we observed that the three
tested RNases easily access the Gram-negative cytoplasmic membrane. However,
RNase 8 presents slower depolarization kinetics and lower final values at the end of the
incubation time.
Figure 48: RNase 8 depolarization ability on E.coli. E.coli cells were grown at 37ºC to mid-exponential phase (OD600=0.2), and resuspended in 5 mM Hepes/KOH buffer, 20 mM glucose and 100 mm KCl, pH 7.2 to OD600= 0.05. DiSC3(5) was added and, when the dye uptake was maximal, proteins in 5 mM Hepes/KOH buffer pH7.2, were added at a final concentration of 50 nM. The increase in fluorescence intensity registers the dye release upon reduction of transmembrene potential. RNase 8 is represented as black triangles, RNase 7 grey circles and RNase 3/ECP dark grey square.
4.3.3.3.2 Bacteria cell membrane permeabilization We also studied bactericidal activity by the SYTOX® Green DNA binding dye to verify
that the antimicrobial ability is correlated with permeabilization of the microbial
cytoplasmic membranes. In all cases, the ribonucleases used showed a rapid effect on
membrane permeabilization. The rate and extent of membrane permeabilization was
quantified. Similar values for RNase 3/ECP and RNase 7 were registered; observing the
membrane effect after 5 minutes of protein addition; whereas membrane
permeabilization by RNase 8 required a longer exposure. Interestingly, RNase 8 also
displayed a permeabilization action on E.coli membranes but significantly less effective
than RNase 7 (Figure 49).

128
Figure 49: Membrane activity of RNase 8 by SYTOX Green® /DNA binding dye assay for membrane permeabilization. In these experiments E. coli cells (OD600=0.05) were equilibrated in 96 well plates in a buffer containing the membrane-impermeable DNA binding dye SYTOX Green®. At time zero, 50 nM to 5 µM of proteins were added and the fluorescence caused by DNA binding of the SYTOX® Green dye was monitored. All proteins caused fast permeation across the bacterial membrane: Black triangles correspond to RNase 8, black circles to RNase 7 and black square to RNase 3/ECP. A. Membrane permeabilization as a function of protein concentration after 1 hour of incubation B. Membrane permeabilization as a function of time at low protein concentration (50 nM).
4.3.3.4 Activity on model membrane
4.3.3.4.1 Liposome agglutination activity Following, we analysed the protein interaction with bacteria and synthetic lipid bilayers.
The ability of Human RNase 8 to agglutinate DOPC/DOPG liposomes was studied by
Dynamic Light Scattering (DLS). Also, the protein leakage activity on liposomes was
measured by a fluorescence assay.
A
B

129
First, the process of RNase 8 interaction with model membranes has been analysed by
DLS. DLS measurements showed that the RNase 3/ECP interactions with liposomes
lead to large size vesicles aggregates, as previously reported (Torrent et al. 2007) . This
effect on the protein interaction with the vesicles was detectable immediately after
obtaining the lipid/protein mixture. Addition of 50 nM of RNase 3/ECP triggered the
vesicles aggregation. However, this rapid response is not observed for RNase 7 and
RNase 8, where the activity is only detectable above 0.1 and 0.5 µM respectively
(Figure 50A). A gradual increase in the calculated liposome population mean size value
is observed as a function of time (Figure 50B). A parallel increase in the polydispersity
index up to 1 is also observed, suggesting that the mean size increase is concomitant to
an increase in the population heterogeneity, which would be mainly due to vesicle
aggregation. The aggregation capacity is strongly dependent upon the assayed protein
range concentration, where RNase 8 needs a higher protein concentration in comparison
to RNase 7.
A. B.
Figure 50: Quantification of liposome aggregation by RNase 8. A. Liposome aggregation after addition of different protein concentrations. B. Evolution of the liposome population mean size upon incubation with RNase 8, RNase 7 and RNase 3/ECP evaluated by DLS. Time course recording using liposomes DOPC:DOPG (3:2) at RNase 8 (up triangles), RNase 7 (circles), RNase 3/ECP (squares) to 50 nM final concentration.
4.3.3.4.2 ANTS/DPX and Terbium/DPA Liposome Leakage Assay We have evaluated the protein capacity to trigger the liposome leakage content by the
ANTS/DPX and Terbium/DPA fluorescence assays. Leakage of liposome entrapped
ANTS/DPX (a marker of low molecular weight, 427 Da) allows the detection of local
membrane disruption. In this case, RNase 8 shows a lower leakage activity, in

130
comparison to RNase 3/ECP and RNase 7. Figure 51 shows the leakage percentage as a
function of protein concentration after 1 hour of incubation.
Figure 51: RNase 8 leakage activity by monitoring the release of ANTS/DPX liposome content. Percentage of leakage produced at increasing protein concentrations after 1 hour of incubation with ANTS/DPX liposomes is shown. RNase 3/ECP (dark grey bar), RNase 7 (light grey bar) and RNase 8 (grey bar).
Likewise, the RNases capacity to trigger the liposome content of Terbium/DPA was
measured by a fluorescence assay to evaluate the RNases ability to trigger local
membrane disturbance. The assay is based on the strong fluorescence emission of the
lanthanide metal terbium (III) (Tb3+) when it interacts with the aromatic chelator
dipicolinic acid DPA. In particular, vesicles have entrapped terbium (Tb3+), which can
form a luminescent complex with the aromatic chelator dipicolinic acid (DPA), present
in the external solution when the membranes are permeabilized. Leakage activity was
calculated by Tb3+/DPA complex formation after 10 min. Table 16 shows, the leakage
activity percentage on liposomes ANTS/DPX and Tb3+/DPA.

131
Table 16: Leakage activity of RNase 8 Leakage percentage of ANTS/DPX liposomes. The measurements were made after addition of 0.5 µM of proteins.
On the one hand, RNase 7 can promote the lipid bilayer destabilization and the release
of the liposome-entrapped from a threshold protein concentration of about 50 nM;
where the complex formation is quickly observed and reached the maximum absorbance
approximately after 10 minutes. On the other hand, no leakage activity under equivalent
assay conditions was detectable for RNase 8; where, the leakage capacity is only
significant from 0.1 µM.
In summary, our data indicates that RNase 8 has antimicrobial properties with an
inhibitory activity against Gram-negative and Gram-positive strains. The mechanism of
action might be similar to the one described for its homologue protein RNase 7 although
showing a significant reduced activity. On the other hand, RNase 8 does not display
any aggregation activity. RNase 8 might therefore work as a host defence protein.
Protein % ANTS/DPX % Tb 3+/DPA RNase 8 24 7 RNase 7 46 13 RNase 3 31 11


