DOCUMENT BESONE ED 145 414 CS 003 763 AUTHOR Fisher, Charles V.; And Others TITLE A Study of Instructional Time in Grade 2 Reading. Technical Report II-4. ETES (Beginning Teacher Evaluation Study). INSTITUTION California State Commission for Teacher Preparation and Licensing, Sacramento.; Far Vest Lab. for Educational Research and Development, San Francisco, Calif. SPONS AGENCY National Inst. of Education (DREW), Washington, D.C. POE DATE Nov 76 CONTRACT 400-750001 NOTE 201p.; See related document CS003758; A number of tables may not reproduce well due to small type EDRS PRICE 8F-$0.83 HC-$11.37 Plus Postage. DESCRIPTORS *Classroom Observation Techniques; Grade 2; *Measurement Techniques; Primary Education; *Reading Achievement; *Reading Instruction; *Reading Research; Test Construction; *Time Factors (Learning) IDENTIFIERS *Beginning Teacher Evaluation Study ABSTRACT This report describes a field study of the relationship between instructional time and student achievement in nine grade-two classrooms. Amounts of time allocated to reading and to instructional settings are described for a 40-day instructional period. Student *engaged time* was also measured for a 10-day period. Relationships between both allocated and engaged time in specific reading content categories and achievement in those content categories were examined. Large differences were found in the amounts of time students were engaged in instructional activities. Positive but relatively weak relationships were found between amount of instruction and student achievement. (Author/AA) *********************************************************************** Documents acquired by ERIC include many informal unpublished * saterials not available from other sources. ERIC makes every effort * * to obtain the best copy available. Nevertheless, items of marginal * * reproducibility are often encountered 4,nd this affects the quality * * of the icLofiche and hardcopy reproductions ERIC makes available * * via the ERIC Document Reproduction Service (EDRS). EDRS is not *-responsible for the quality of the original document. Reproductions * * supplied by EDRS arm the best that can be made from the original. * ***********************************************************************
Transcript
DOCUMENT BESONE
ED 145 414 CS 003 763
AUTHOR Fisher, Charles V.; And OthersTITLE A Study of Instructional Time in Grade 2 Reading.
INSTITUTION California State Commission for Teacher Preparationand Licensing, Sacramento.; Far Vest Lab. forEducational Research and Development, San Francisco,Calif.
SPONS AGENCY National Inst. of Education (DREW), Washington,D.C.
POE DATE Nov 76CONTRACT 400-750001NOTE 201p.; See related document CS003758; A number of
ABSTRACTThis report describes a field study of the
relationship between instructional time and student achievement innine grade-two classrooms. Amounts of time allocated to reading andto instructional settings are described for a 40-day instructionalperiod. Student *engaged time* was also measured for a 10-day period.Relationships between both allocated and engaged time in specificreading content categories and achievement in those contentcategories were examined. Large differences were found in the amountsof time students were engaged in instructional activities. Positivebut relatively weak relationships were found between amount ofinstruction and student achievement. (Author/AA)
***********************************************************************Documents acquired by ERIC include many informal unpublished
* saterials not available from other sources. ERIC makes every effort ** to obtain the best copy available. Nevertheless, items of marginal *
* reproducibility are often encountered 4,nd this affects the quality *
* of the icLofiche and hardcopy reproductions ERIC makes available *
* via the ERIC Document Reproduction Service (EDRS). EDRS is not*-responsible for the quality of the original document. Reproductions ** supplied by EDRS arm the best that can be made from the original. *
U S DEPARTMENT OF HEALTH,EDUCATION IL WELFARENATIONAL INSTITUTE OF
EDUCATION
THIS DOCUMENT HAS SEEN REPRO-OUCED EXACTLY AS RECEIVED FROMTHE PERSON OR ORGANIZATION ORIGIN-ATING IT POINTS OF VIEW OR OPINIONSSTATED 00 NOT NECESSARILY REPRE-SENT OFFICIAL NATIONAL INSTITUTE OFEDUCATION POSITION OR POLICY
SCOPE OF INTEREST NOTICE
The ERIC Facility has assignedthis document for processingto
In our lodgement, this documentis also of interest to the clearing-houses noted to the right Index-ing should reflect their specialpoints of view
Nikola N. FilbyRichard S. MarliaveLeonard S. CahenJeffrey E. Moore
BEST COPY ii.David C. Berliner
Submitted to
California Commission for Teacher Preparation and Licensing1020 110" Street
Sacramento, Ca. 95814
November 15, 1976
Far West Laboratory for Educational
Research and Development1855 Folsom Street
San Francisco, Ca. 94103
N) This work was completed pursuant to Contract #400-75-0001 between the
-.....Department of Health, Education and Welfare, National Institute of Edu-
N cation and the California Commission for Teacher Preparation and Licensing.
PDThe Far West Laboratory for Educational Research and Development,
1855 Folsom Street, San Francisco, California 94103, is a nonprofit4)
organization supported in part by the United States Office of Education'CD
and the National Institute of Education, Department of Health, EducationCr) and Welfare. The opinions expressed in this publication do not necessarily
0 reflect the position or policy of these agencies, and no official
endorsement by them should be inferrer,,.'. 9A.
PREFACE
The Far West laboratory conducts research for the California Com-
mission for Teacher Preparation and Licensing through funds provided by
the National Institute of Education. The Commission has responsibility
for certifying teachers and teacher training programs in the State of
California. The research that the Commission sponsors is designed to
help them understand what teacher behaviors or instructional activities
are beneficial for students. With a reliable knowledge base in this area
the Commission and the institutions that train teachers would be better
able to provide training experiences based on empirical findings relating
teacher behavior to student achievement.
In previous years under the Commission's sponsorship, the Beginning
Teacher Evaluation Study (BTES) has conducted empirical and methodological
research on teaching which led to a belief that an important element in
the study of teaching and learning is instructional time. Time allocated
by teachers for learning specific academic subject matter showed consider-
able variation across classes, and also varied among students within these
classes. Further, students appeared to be quite variable in how engaged
they were in their assigned academic activities. These major variations in
the amount of time students spent learning in different classes called for
further investigation. During the continuation of Phase III-A for the Com-
mission's research effort (1975-1976) the Laboratory staff was granted per-
mission to explore some of these temporal factors in instruction. Charles
Fisher headed the Laboratory team whose findings are presented in this report.
ii
Richard Marliave, Nikola Filby and Leonard Cahen of the BTES staff
contributed many creative conceptual and methodological ideas which
helped shape each phase of the study.
During the course of this study encouragement and insight were pro-
vided by Annegret Harnischfeger and David Wiley. We are grateful for
their longstanding interest in our work, and the constructive comments
that they offered.
During the analysis phase, the Laboratory was fortunate to receive
helpful comments from a number of distinguished consultants. We thank,
in particular, Leigh Burstein, Robert Linn, Richard Shavelson, and Ross
Traub for their help.
Jeffrey Moore, Pat Storm, and Mark Phillips of the BTES staff provided
reliable support for the substantial data processing effort. Marilyn Dishaw,
Faye Mueller, and Fannie Walton coordinated many of the field ac'ivities
and technical services so necessary for a field study that required the col-
lection and processing of large quantities of data from natural classroom
settings. Their efforts, and the efforts of the many field workers who assisted
with the data collection are greatly appreciated.
Deborah Walton patiently and efficiently typed the final copy and the many
complex tables. Edna Robnett and Jeremy George provided clerical support. We
thank them for their help.
Finally, our thanks and appreciation go to the teachers and students
in California schools who continue to support this project by donating their
time and comments. The hard work of many teachers, in addition to their regular
111
classroom responsibilities, makes this research possible. To each of these
dedicated volunteers we owe a special thanks.
David C. BerlinerPrincipal InvestigatorBeginning Teacher Evaluation StudyNovember, 1976
TABLE OF CONTENTS
PREFACE
I INTRODUCTION
II DESIGN AND INSTRUMENTATION
Design
Measures of Reading AchievementMeasure of Academic StatusProcess Variables
Characteristics of Teacher Allocated Time LogsAllocation of Instructional Time in ReadingInstructional Time and Student Achievement
Results from the 0A-08 periodResults from the A-B periodSummary
V DISCUSSION
Characteristics of Teacher Allocated Time LogsAllocation of Instructional Time in ReadingInstructional Time ard Student AchievementSummary and Conclusions
REFERENCES
APPENDIX A:
APPENDIX B:
APPENDIX C:
Directions and Examples of Items fromAchievement Tests
Reading Content Categories and Examplesof Teacher Logs
Teacher Rating Forms
6
Page
i
1
8
89
13
13
14
16
19
24
28
33
3638
44
44
49
54
56
68
8081
86118
119
119
123
125
130
132
134
151
162
LIST OF TABLES
2.1 Reliability coefficients for reading subscales at eachtesting occasion
2.2 Interobserver correlations for content category by settingcombinations
2.3 Estimates of average class engagement
3.1 Summary of data collected un nine Grade 2 classes
4.1 Class size, length of school day, adult instructional timeand time allocated to reading for nine Grade 7 classes
4.2 Means, standard deviations, and correlations for Class 1 on
allocated time from teacher logs, adjusted allocated timefrom teacher logs, allocated time from observer logs, andengaged time from direct observation
4.3 Means, standard deviations, and correlations for Class 2 onallocated time from teacher logs, adjusted allocated timefrom teacher logs, allocated time from observer logs, andengaged time from direct observation
4.4 Means, standard deviations, and correlations for Class 3 onallocated time from teacher logs, adjusted allocated timefrom teacher logs, allocated time from observer logs, andengaged time from direct observation
4.5 Means, standard deviations, and correlations for Class 4 onallocated time from teacher logs, adjusted allocated timefrom teacher logs, allocated time from observer logs, andengaged time from direct observation
4.6 Means, standard deviations, and correlations for Class 5 onallocated time from teacher logs, adjusted allocated timefrom teacher logs, allocated time from observer logs, andengaged time from direct observation
Page
11
35
39
44
54
59
60
61
62
63
4.7 Means, standard deviations, and correlations for Class 6 on 64
allocated time from teacher logs, adjusted allocated timefrom teacher logs, allocated time from observer logs, andengaged time from direct observation
4.8 Means and standard deviations for time allocated to general 70
content categories in reading for nine Grade 2 classes
vi
Page
4.9 Means and standard deviations for time allocated to specific 71
content categories in reading for nine Grade 2 classes
4.10 Means and standard deviations for time allocated to setting 76
combinations during reeding in ninkGrade 2 classes
4.11 Means, standard deviations and intercorrelations for estimates 78
of student engagement in six Grade 2 classes
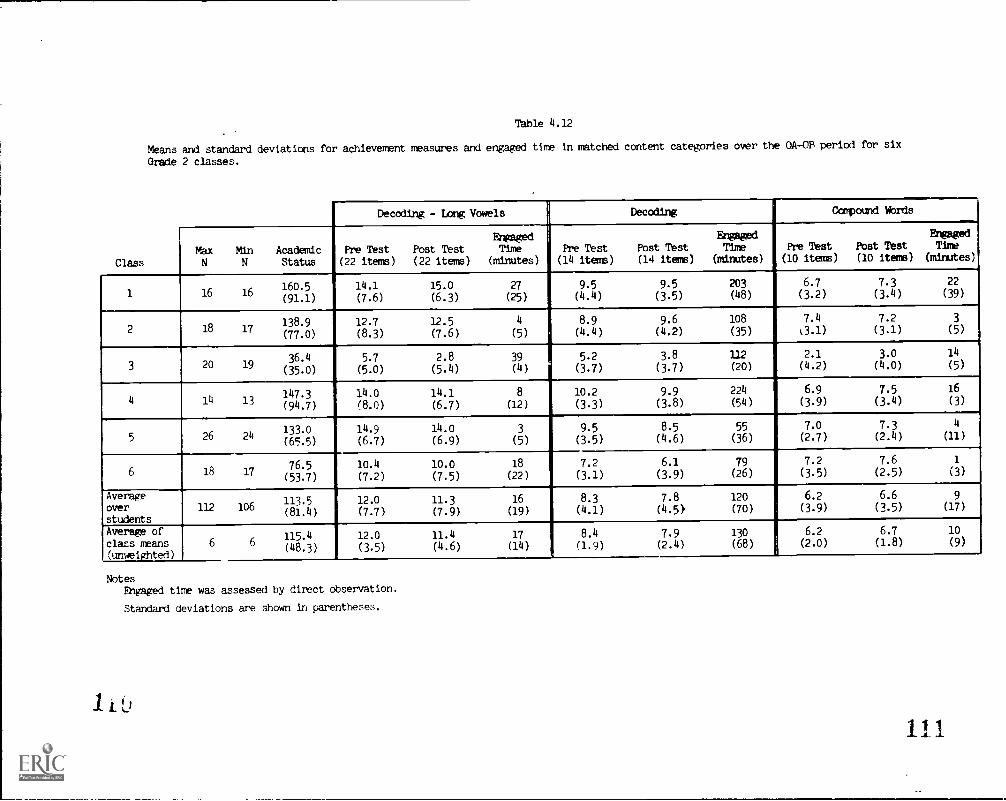
4.12 Means and standard deviations for achievement measures and 83
engaged time in matched content categories over the 0A-OBperiod for six Grade 2 classes
4.13 Means, standard deviations, and intercorrelations for achieve-mert in compound words and associated measures of engaged timeassessed over the 0A-OB interval
85
4.14 Means and standard deviations for achievement measures and 87
allocated time in matched content categories over the A-Bperiod for nine Grade 2 classes
4.15 Achievement in compound words (post) regressed on achievementin compound words (pre), academic status and measures ofallocated time over the A-B interval (subjects pooled, N = 79)
4.16 Achievement in compound words (post) regressed on achievementin compound words (pre), academic status and measures ofallocated time over the A-B interval (subjects pooled withinclass, N = 79)
4.17 Achievement in compound words (post) regressed on achievementin compound words (pre), academic status and measures ofestimated engaged time over the A-B interval (subjects pooled,N = 56)
4.18 Achievement in compound words (post) regressed on achievementin compound words (pre), academic status and measures ofestimated engaged time over the A-B interval (subjects pooledwithin class, N = 56)
4.19 Achievement in long vowels (post) regressed on achievement inlong vowels (pre), academic status and measures of allocatedtime over the A-B interval (subjects pooled, N = 91)
4.20 Achievement in long vowels (post) regressed on achievement inlong vowels (pre), academic status and measures of allocatedtime over the A-B interval (subjects pooled within class, N = 91)
4.21 Achievement in long vowels (post) regressed on achievement in 101
long vowels (pre), academic status and measures of estimatedengaged time over the A-B interval (subjects pooled, N = 66)
93
94
95
96
98
99
vii
Page
4.22 Achievement in long vowels (post) regressed on achievement in 102
long vowels (pre), academic status and measures of estimatedengaged time over the A-B interval (subjects pooled withinclass, r = 66)
4.23 Achievement in decoding (post) regressed on achievement in 105
decoding (pre), academic status and measures of allocated timeover the A-B interval (subjects pooled, N = 1031
4.24 Achievement in decoding (post) regressed on achievement in 106
decoding (pre), academic status and measures of allocated timeover the A-B interval (subjects pooled within class, N = 103)
4.25 Achievement in decoding (post) regressed on achievement in '07
decoding (pre), academic status and measures of estimatedengaged time over the A-B interval (subjects pooled, N = 72)
4.26 Achievement in decoding (post) regressed on achievement in 108
decoding (pre), academic status and measures of estimatedengaged time over the A-B interval (subjects pooled withinclass, N = 72)
4.27 Means, standard deviations and intercorrelations for achieve- 110
ment in reading and associated measures of instructional timeassessed over the A-B interval
4.28 Speed in decoding consonant sounds (post) regressed on speedin decoding consonant sounds (pre), academic status, andmeasures of-allocated time over the A-B interval (subjectspooled, N = 105)
4.29 Speed in decoding consonant sounds (post) regressed on speedin decoding consonant sounds (pre), academic status, andmeasures of allocated time over the A-B interval (subjectspooled within class, N = 105)
4.30 Speed in decoding consonant sounds (post) regressed on speed 115
in decoding consonant sounds (pre), academic status, andmeasures of estimated engaged time over the A-B interval
(subjects pooled, N = 77)
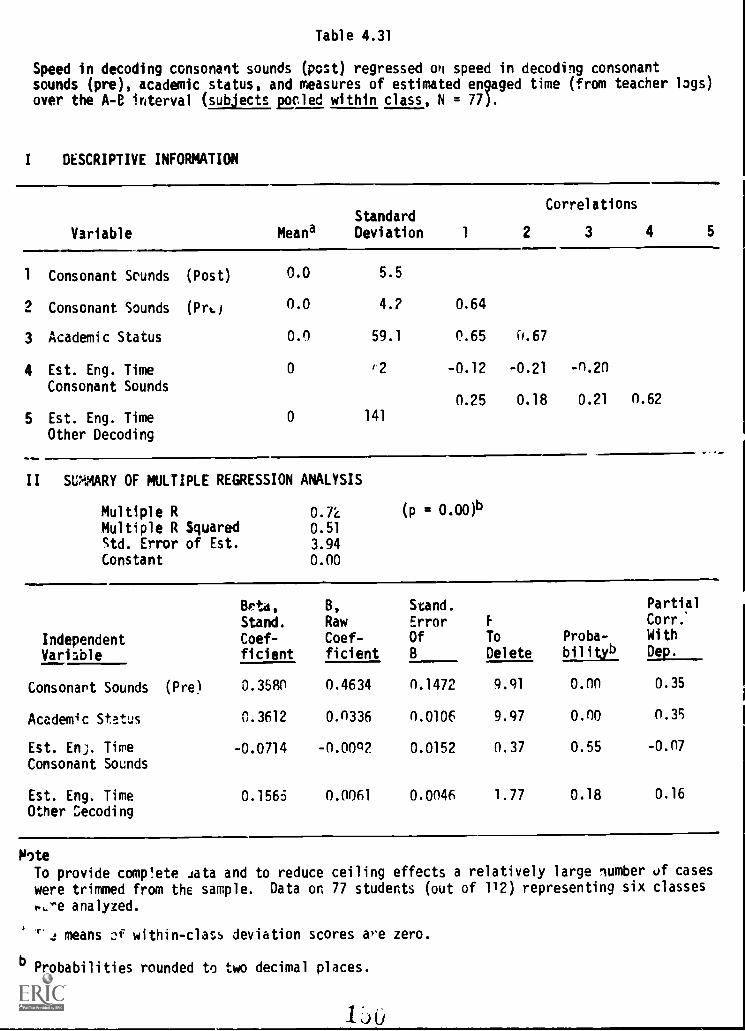
4.31 Speed in decoding consonant sounds (post) regressed on speed 116
in decoding consonant sounds (pre), academic status, andmeasures of estimated engaged time over the A-B interval(subjects pooled within class, N = 77)
4.32 Summary of Results of Regression Analysis for Time Variables 117
and Grade 2 Reading Achievement
112
113
LIST OF FIGURES
2.1 Teacher log format
2.2 Attendance/group composition record
2.3 Observation coding form
Page
20
21
30
I INTRODUCTION
The overriding goal of the Beginning Teacher Evaluation Study is
to identify teacher behaviors which are related to student learning.
It seems clear from previous research that substantial relationships
between teacher behavior and student learning are difficult to isolate,
and even more difficult to replicate. Although many experiments have
been conducted, the greater portion of this research has taken the form
of correlational field studies. These studies attempt to characterize
classroom phenomena in such a way that the amount of student learning
can be predicted from or related to instructional variables.
The major problem has been to define and measure characteristics
of instruction that are related to the amount learned. Large numbers
of variables have been considered; see the Handbook of Research on
Teaching (Gage, 1963), the Second Handbook of Research on Teaching
(Travers, 1973) and The Study of Teaching (Dunkin & Biddle, 1974).
The results of field studies for the vast majority of these variables
have been inconsistent.
Regardless of the variables chosen to characterize instruction,
it is clear that the instructional experiences of students differ in
both kind and amount. Differences in the amount of instructional time
students spend on a particular objective may be an important factor in
understanding student learning. Before inquiring further about the
relationship between teacher behavior and student le ning, it is
imperative to know whether students who receive more instructional time
in a given subject area exhibit more learning in that area than students
who receive less time. If time effects are large regardless of other
I 1
-2-
characteristics of Instruction then the pattern of teacher time allo-
cation must be carefully scrutinized.
In several studies, positive correlations have been found between
amount of instructional timc and student achievement, although the
strength of this relationship has been difficult to assess. In a review
of approximately 20 studies, David (1974) concluded that, in studies
where the variation in exposure to schooling was extensive, there were
consistent positive relationships between exposure to schooling and
achievement scores. In studies where the variation in exposure to
schooling was minimal, no consistent effects of exposure to schooling
were found.
Tn a school-level analysis, Wiley 0973) calculated average amount
of schooling by taking the product of length of school year, length of
school day, and average daily attendance rate. Using this index,
variation in amount of schooling was strongly and positively related to
knowledge acquisition in both reading and mathematics. Another school-
level analysis (Karweit, 1976) on the same data confirms this result.
However, analyses on several other data sets (Karweit, 1976) failed to
find positive effects for amount of instructional time.
Studies by Bond and Dykstra (1967), Harris and Serwer (1966), and
Harris, Morrison, Serwer and Gold (1968), report negative correlations
between teacher or student absences and achievement, which could imply
that more instructional time is associated with higher achievement.
Harris and Serwer (1966) found a positive relation between amount of
time in reading instruction and reading achievement. Other studies
other), and group size (small group/large group). These three dicho-
tomous setting variables combined to form eight setting types. Instruc-
tional time was allocated to subject areas and, within subject areas, to
the eight instructional setting types.
Of the time allocated to a particular subject area, students spent
some time engaged in on-task behavior and some time in off-task
behavior. From the point of view of the subject area under consider-
ation, this latter time can be thought of as unengaged time.
The general goal of this study was to describe reading instruction
in terms of both the allocated and engaged time which students spent in
each of the instructicnal settings for each content sub-area, and to
relate instructional time to student achievement. More specific goals
of the study are stated in the following research questions:
1. . How are allocated and engaged time distributed over various
content categories?
2. How is allocated time distributed over instructional settings?
3. Of the time allocated to a subject area, how much is engaged time?
4. What are the characteristics of teachers' reported records of
allocated time?
5. Do students who have more time allocated to a particular subject
area also shcw more learning in that subject area?
6. Do students who spend more engaged time in a particular subject
area learn more in that )(abject area?
The study reported here is part of a larger research effort. The
data available for analysis were part of a larger data set which was
1 6.
-7-
collected during the continuation of Phase III-A of the Beginning Teacher
Evaluation Study. The work undertaken in this part of Beginning Teacher
Evaluation Study is described in Program Plan for the Continuation of
Phase III-A (Far West Laboratory, 1975). As part of this program plan,
data on instructional time were collected in both reading and mathematics
subjects areas. The data from the two subject matter areas were analyzed
separately. A "parallel" analysis of the mathematics data is the subject
of Technical Report 11-3: A Study of Instructional Time in Grade 2
Mathematics. The current report deals exclusively with an analysis of
instructional time in reading.
In keeping with the goals of Phase III-A, an important function
of these exploratory studies was to provide experience in collecting
and analyzing data on instructional time. The information on time allo-
cation and the utility of various data collection devices is intended to
facilitate the design and conduct of Phase III-B of the Beginning
Teacher Evaluation Study.
II DESIGN AND INSTRUMENTATION
Design
The objectives of this study were to describe the naturally occur-
ring variations in allocated and engaged instructional time, and to
relate these variations to variations in student achievement. No
manipulation of classroom conditions or teacher behaviors was attempted.
The strategy was simply to assess student achievement in a number of
content areas on two occasions; once early in the fall and once late in
the fall. In the intertest interval, records of allocated time were
kept. The intertest period was chosen in such a way that a maximum
interval was available without inconvenience to schools during the first
two weeks of classes or the week preceding Christmas vacation. It was
also necessary to have approximately ten days at the beginning of the
school year for contacting teachers and instructing them in procedures
for keeping records of allocated time. These practical time constraints
determined that the first testing occasion (referred to as occasion A)
take place during the first week of October, 1975. Records of allocated
time were kept for eight weeks of instruction, after which the second
testing (occasion B) was conducted during the first week of December, 1975.
In addition to the records of allocated time, data were collected
on engaged time by direct observation. This procedure was carried out
in two-thirds of the classes in the sample. The data on engaged time
served two main purposes; first, it allowed estimation of the proportion
of allocated time during which students were actively engaged; and
second, it provided data for relating student engaged time to achievement.
-9-
For the second of these purposes, it seemed particularly important to
assess engaged time over several successive days, rather than a sample
of days. In this way, the engaged time in a particular subject area
could be assessed relatively accurately. Therefore classes were observed
for two weeks. In an attempt to create optimal conditions for the
assessment of the relation between engaged time and achievement, additional
achievement tests were administered at the beginning of the first obser-
vation day and at the end of the last observation day. These testing
occasions are referred to as OA and OB respectively. The procedure
provided 100 percent coverage by direct observation of in-school instruc-
tion for every student during the OA -OB period. Observation was carries
out by two observers; therefore only two classes could be observed during
any one two-week period. As a result, classes were observed in pairs
during successive two-week periods within the A-B period.
In summary, all classes.' were tested during the first week of October,
1975 (occasion A); allocated time records were kept for eight weeks; and
then all classes were tested again during the first week of December, 1975
(occasion B). Engaged time for two-thirds of the classes was assessed
by direct observation during a two-week period, with associated pretests
and posttests (occasions OA and OB). The timing of the observation
periods was staggered in such a way that pairs of classes were observed
during the same two-week period. All observation was conducted between
testing occasions A and B.
1The data set described here is a subset of the data collected duringthe continuation of Phase III-A of the Beginning Teacher EvaluationStudy (Far West Laboratory, 1975).
-10-
Measures of Reading Achievement
The measures of reading achievement used in this study are a sub-
set of the reading scales being developed by the staff of the Beginning
Teacher Evaluation Study. Interim versions of scalesl being refined
for rase III-B were used.
A relatively large battery of reading items were administered at
occasions A and B. The battery contained 340 items grouped into approx-
imately three dozen subscales each assessing achievement in a specific
reading content area commonly taught at Grade 2 in California schools.
Twelve subscales or combinations of subscales are analyzed in this report.
The scales are labeled decoding-consonant sounds (speeded test), decoding-
long vowels, decoding-consonant substitutions, decoding (total), context
clues-form of word, context clues (total), word structure-compound words,
word structure (total), word meaning-synonyms, comprehension-description,
comprehension-description, conprehension (total), and reading (total).
With the exception of the items in the compound words subscale, all items
were of the multiple choice type. All items were group-administered.
(Examples of items from the scales are included in Appendix A.) Identical
items were administered at occasions A and B and the resultant scores were
used in conjunction with time measures assessed over the intervening
eight-week interval.
Internal consistency reliability coefficients and other descriptive
statistics (sor scales used over the A-B period in the upper section of
Table 2.1. In several cases the scales used for analysis in later
'The development history and data from pilot testing of the items are in-
cluded in Technical Reeort III-1: Development and Refinement of Readin.2.
and Mathematics Tests for thelEtudy of Reading and Mathematics Instruction
in Grades 2 and 5 (Filby & Dishaw, 1975). For a description of further
refinement of the tests through an analysis of reactivity using thecurrent data set, see Filby and Dishaw, (1976).
Tat,le
.11ty ()ht.!. Ic r, "al. reading ..s4ocales at each testing c(rea.ion
in this respect; and, as a result, the rate of student learning may be
strongly affected. As a crude operationalization of pacing, a distinction
was made between seatwork and group work. Seatwork is the most frequently
occurring setting in which students have relatively high control over
pace; group work is the situation which is most externally paced.
The third facet of instructional setting was group size. This facet
has been the subject of much research and has great intuitive appeal.
It was included here, not because of its potential direct effect on
learning, but because different group sizes provide the opportunity for
very different kinds of student activities, teacher behaviors, and group
climates. The mere fact that a student is working in a small group does
not imply that a particular kind of instruction will occur; it does act
as a necessary (but not sufficient) condition for certain highly-valued
teacher behaviors. For instance; the smaller the group, the more
closely a teacher can approximate a tutoring situation with each student.
However, a lecture to a group of five children is probably very much
like a lecture to a group of thirty-five children. Group size, ljiice the
facets of setting, was coded as a dichotomy. Large groups were defined
to contain ten or more students; small groups, nine or fewer. (Pilot
experience showed that a lower value for the upper bound of "small
groups" would have provided very little discrimination among actual
classroom groups.)
Teacher logs. The teacher logs were developed by the staff of the
Beginning Teacher Evaluation Study. The logs served as the primary
-17-
source for collecting 41ta on allocated time, both for the study of in-
structional time and for the study of reactivity (see Filby & Dishaw,
1976). The develoPment of practical methods for collecting information
on allocated time was, in itself, an important objective of the work
carried out during the continuation year of Phase III-A of the Beginning
Teacher Evaluation Study.
The log procedures are the result of pilot work conducted in three
year-round schools during July Lid August, 1975. A wide variety of
procedures were considered, including many suggestions from participating
teachers. The goal of pilot testing was to have teachers try a prototype
log and, tapping their reactions and suggestions, to develop a workable
format for acquisition of a maximum of accurate information with minimum
inconvenience to the teacher. (Teachers recruited for the pilot tests
were told that procedures were being developed for recording the content
covered in reading and mathematics for each student in their classes.
They were also told that the information would be used to relate student
achievement to the content which had actually been covered during class-
room instruction.)
The first log that was tried had a checklist format. Content
categories were listed, and teachers were asked to indicate daily whC.her
students had worked on the categories. Teachers recorded the amount of
time, using the symbols N (not at all), S (from one to five minutes),
and A (any time period greater than five minutes). A relatively detailed
list of categories was included. If teachers felt that too many categories
had been listed, they were asked suggest categories which could be
collapsed. In classrooms where teaLhers grouped students for instruction,
logs were kept for student groups. Teachers with highly individualized
2
-18-
programs kept one log for each of four students. In the latter case,
students were selected from the high, middle, and low quarters of the
student - ability range. During the pilot period, teachers kept logs on
both mathematics and reading instruction.
Six teachers (three 5th grade and three 2nd grade) from a year-
round school in Hayward, California piloted this procedure for two weeks.
As they had individualized programs, the logs were kept for target
students. After two weeks, about half the teachers found that keeping
logs of this type took from five to ten minutes per day. With more
practice and greater familiarity with the content categories and the
format, it was estimated that all teachers could complete logs in about
ten minutes per day.
The procedure worked well in the Hayward program; however, it provided
data on only four students per class. The teachers had several constructive
comments. They found the content categories relatively familiar and easy
to use. Most felt that the "N" notation was a waste of time and dropped
it completely. A few noted some teacher benefits from keeping logs: it
reminded them specifically c: what they were or were not covering, and
the students for whom logs were kept were pleased and motivated by the
attention.
At this point, those teachers with highly individualized programs
were asked to divide their students into three ability groups and to
keep a weekly record of content covered for each group. They reported
difficulty in grouping students. in addition, content categories which
they noted as "covered" were not necessarily covered by all students in
a particular group.
At an additional pilot site in Fairfield, California, teachers also
26
19
kept logs as described above. Here, two fifth grade teachers were in-
volved in a team-teaching situation. Their classes were grouped by
mastery level, and they found it convcaient to keep the logs by student
group. After these teachers had kept logs for approximately ten days,
they were asked to augment the log to reflect instructional settings as
well as content covered. At this point, it became clear that information
on individual students was not necessary if the class were grouped. The
teachers in Fairfield suggested a log format which was a variation of a
lesson plan, rather than a checklist. This new format was tried and found
to be workable. However, it was clear that the organization for instruc-
tion varied considerably from class to class, requiring that the procedure
for log-keeping remain flexible.
As a result of experience in these classrooms, one procedure was
developed for classes which used various grouping strategies, and another
for classes that were highly individualized.
Teacher log procedure. The experience gained during the pilot was used
to refine the record keeping procedures. All participating teachers
maintained records of time allocated to reading instruction. These were
referred to as "teacher logs." The logs provided information on content
covered and settings for reading instruction, on a daily basis, for groups
of students in each class. The time allocated to each instructional
setting was recorded, with one or more cont,..t categories associated with
that setting. In highly individualized classes, teachers recorded the
content covered and settings used for each student during reading instruction.
The teacher log format is presented in Figure 2.1. Each one-page log
covered one week of instruction for a single group of students. The names
2
MONDAY
TEACHER GRADEREADINGMATH GROUP WEEK
TIME:
CONTENT
Adult SeaiworkiiiiAdu 1 t
and m D--t er
MATERIAL
CONTENT
TUESDAY Adult SeatworkNo Adult and
Other
MATERIAL
CONTENT
WEDNESDAY AduI t SeatworkNo Adult and Other
THURSDAY
MATERIAL
CONTENT
AdultITFAaul t
and SeatworkOther
MATERIAL
CONTENT
FRIDAY WA tNo Adult
and Seatwork
aher
JUMATERIAL
.
1.
I I I i I I
of the students in a given group were designated on the attendance/group
composition sheet (shown in Figure 2.2). Each teacher listed his class
roster on the left hand side of the attendance/group composition form.
For a given week, the teachers then designated the reading instruction
group for each student and the daily attendance. This procedure allowed
for different grouping patterns in reading and mathematics when logs
were being kept for two subject matter areas. It also allowed for
changes in the composition of student groups.
Reading content was recorded according to the list of categories
in Appendix B. Teachers referred to the list to find appropriate codes
for content categories that best described the instruction. Teachers
were also provided with glossaries which contained examples of each of
the content categories, and were individually trained in the log-keeping
procedure. Practice logs were kept by each teacher for up to two weeks
before data collection began. The training and glossary were intended
to ensure reliable categorization of content from teacher to teacher.
Content was recorded using the specific content categories.
In classroom situations, content tended to change more quickly than
setting. For this reason, several content categories were often desig-
nated for one instructional setting. The starting and ending time for
each setting was recorded, thereby providing a record of the instructional
time allocated to the content covered in each setting. If several
different categories were recorded for one setting, (and therefore one
time period), the the teacher specified the time devoted to each content
category whenever possible. Otherwise, the total period of time was
divided by the number of content categories, yielding an estimated time
allocated to each category.
33
-23-
The defining characteristics of instructional settings (adult in-
volvement, pace, and group size) have been described above. Direct
involvement of an adult covered a range of activities from lecturing to
monitoring independent seatwork. "Adult" referred to any teacher,
student teacher, or aide. The same adult was not classified as directly
involved in more than one setting at a time. Therefore, an adult would
not be classified as directly involved in monitoring seatwork if that
were a secondary function of the adult.
Regarding the pacing facet: "seatwork" referred to any setting where
students worked independently. Two or more students working together, or
an adult tutoring one student, was classified as a group-work setting.
The group size facet was not recorded by teachers. This categoriza-
tion was made by coders when the teacher logs were returned to the
Laboratory for processing. Group size was ascertained by checking the
number of students in a particular group on the attendance/group compo-
sition form.
In addition to the information noted above, teachers provided a
brief description of the materials used in each instructional setting:
the name of a textbook and the pages covered, worksheets used for seat-
work assignments, and the like.
In summary: for a given week, each teacher recorded how students
were grouped for reading instruction on the attendance/group composition
form. Daily absence records were kept on the same form; and if group
composition changed during the week, the changes were also reported.
On the teacher log form itself, teachers kept daily records for each
student group. For each day, time periods were blocked off by vertical
lines (drawn by the teacher). The beginning and ending times for a
34
-24-
setting were recorded along the top of the form. For each setting,
teachers recorded adult involvement, pacing, materials, and content
categories. In this way, varied instructional patterns could be recorded
on the same form. (Examples of completed teacher logs and attendance/
group composition sheets are included in Appendix B.)
Where teachers grouped students for instruction, this procedure
worked well. However, where instruction was highly individualized,
variations were adopted. This most often required the keeping of records
for individual students; or, where teachers operated a number of "activity
stations," records could be kept for each station.
Since the log procedures were quite new, relatively little was known
before the study about their measurement characteristics. Therefore, in
order to obtain independent assessments of allocated time, two additional
data sources were used. First, Far West Laboratory coders, who trans-
ferred the raw teacher logs into machine-punchable formats, spent one
aay in each classroom. During that day, the coders completed a log for
the reading instruction that occurred. This log was then available for
comparison with the teacher log for the same day. Since there was only
one day of coder log per teacher, these data were treated in a clinical
manner. Second, at the end of each day of direct observation, the Far
West Laboratory observers completed logs. From this data source, seven
to nine days of logs were made available for comparison with each teacher's
log. The results of these comparisons are presented in Chapter IV.
Direct observation. Data collection by direct observation served two
purposes. First, direct observation of instruction over a two
week intertest period provided the basis for relating achievement to
amount of engaged time. Observation of all school instruction during
35
-25-
this interval eliminated the problems arising from sampling of a few
instructional occasions from a relatively long intertest interval. The
observation system was intended to capture all instruction relevant to
reading in terms of engaged time in content and setting categories, which
could then be related to achievement measures. The second purpose of
the observation system was to provide independently collected data to
compare with the allocated time data from teacher logs. However, since
observers assessed engaged time and teachers reported allocated time
quantitative comparison of these two sources (for purposes of determining
the reliability of teacher logs) was difficult. So, in addition to their
daily observation task, observers completed an allocated time log of the
day's instruction. These were used for comparison to the teacher logs.
In the development of this observation system, the selection of the
level of specificity with which to describe classroom phenomena was a
difficult problem. The usefulness and practicality of a content- or
setting-category can vary tremendously depending upon the number of facets
involved in its definition. The more specific the categories, the more
difficult the coding of process data, especially when data are to be
collected on every student in a given classroom. A decision must be MO
to collect either more specific information for a smaller number of
students or less specific information on a larger number of students.
In this case, the decision was made to describe instructional settings
at a relatively global level, in terms of three dichotomous facets (adult
involvement, pacing, and group size). Within these. settings, content
was noted in relatively specific categories. (The setting facets and
content categories have been described above. Although data were collected
for both reading and mathematics instruction, only the data pertaining to
36
-26-
reading instruction are used for this report.)
During July and August, 1975, Far West Laboraotry staff observed
teachers of Grades 2 and 5 in year-round schools operating in Fairfield
and Hayward, California. On this occasion, attempts were made to code
content in reading and mathematics in a large number of specific categories.
It soon became clear that content changed very quickly when specific
categories were used. For example, teachers handed out seatwork dittos
which included work on a relatively large number of specific-reading
content categories. Clearly, it was impractical to record the amount of
time spent on each specific category by each student.
After trying several alternatives, this problem was resolved by
redefining the content categories. Since the observation covered a two
week period in the fall of the year, attention was restricted to a few
specific content categories which were commonly taught during that portion
of the school year. The other content areas were collapsed into one
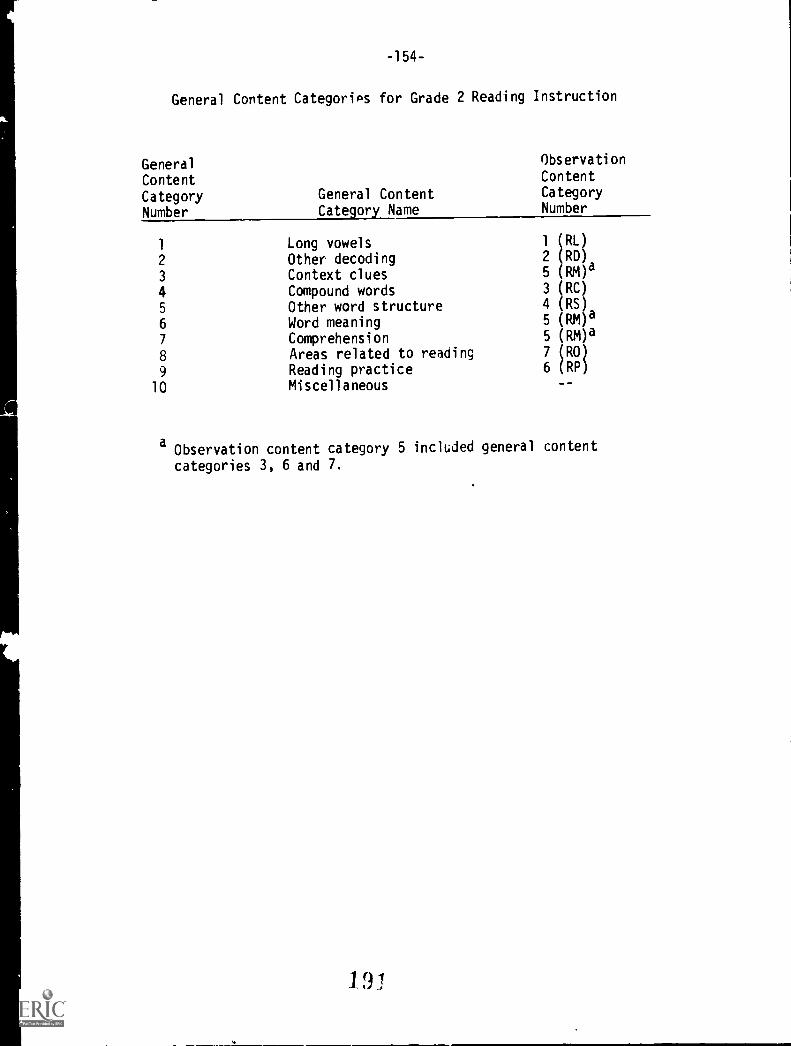
broad category. The observation categories chosen for reading were:
1. decoding-long vowels,2. other decoding,3. word structure-compound words,4. other word structure,5. context clues, word meaning and comprehension6. reading practice,7. areas related to reading.
The relationships among the specific, general, and observation content
categories are shown in Appendix B.
Focusing on a small number of content categories made observation
much more practical, but did not solve all problems. Experience during
piloting indicated that content still changed more quickly than setting
variables (for example, group size or adult involvement). Rather than
attempt a perfect fit between content categories and the setting variables,
3,7
-27-
more than one content designation was allowed for au particular combi-
nation of setting descriptors. These setting descriptors (adult involve-
ment, pacing, and group size) were identical to those used in the teacher
logs.
Some illustrations of how settings were coded may help to clarify
the meaning of the setting descriptors. Consider the adult involvement
setting facet. Suppose a teacher has his or her class divided into two
activity groups: a reading circle led by the teacher, and a group of
students doing seatwork. For all of the students in the reading circle,
the instructional setting is characterized by the direct involvement of
the teacher, while the setting for the remainder of the students entails
no direct teacher involvement, and would be so coded. The status of the
second group would not change even if the teacher occasionally answered
questions for students in the seatwork group. However, if the whole
class was doing seatwork, and the teacher's primary activity was moni-
toring students for the purpose of giving feedback and explanation,
then the setting would be coded as having a teacher directly involved.
In many classes, student-teachers and aides also engaged in direct in-
struction of students, and for coding purposes no distinction was made
between these adults and "teachers." The adult-involvement setting facet
was coded by using "A" to represent cases where the teacher was directly
involved and "N" for all other cases.
Instructional settings were also differentiated in terms of pacing.
A distinction was made between situations where each student controlled
the pace at which his work proceeded and situations where the student
did not. The vast majority of cases where the student has relatively
high control of his own pace occurred in independent seatwork. Pacing
-28-
was operationalized as seatwork (coded "S") and everything else (coded "0").
In addition, settings were differentiated in terms of group size.
Small groups (coded "L") were defined as having nine or fewer students.
Settings with ten or more students working on the same activity were
designated as large groups (coded "H").
The basic strategy of the system was to code all instruction in
reading (and mathematics) for each student in a classroom. This was done
by tracking the time students engaged in particular settings in terms
of teacher involvement, pacing, and group size, and subsequently coding
the content covered within each setting. (For each setting, one or more
content categories were recorded.)
Experience during piloting indicated that one observer could monitor
classes of up to thirty students for this information. However, it was
essential that the observer know the general routine of the classroom,
the materials, and also be able to distinguish one student from another
rapidly. These requirements were met by having an observer spend one
full day in a class before data collection began. This procedure allowed
teacher and students to become accustomed to the observer, and provided
the observer with practice in each classroom.
Direct observation procedure. Observers collected data over two conse-
cutive weeks in each classroom. One day was required for memorization
of the students' names, and familiarization with the general classroom
routine. The remainder of the time (approximately 9 days) was available
for official data collection.
Once the observer was familiar with the classroom organization and
students, the procedure was relatively straightforward. The observer
-29-
entered the classroom with the students each morning and used the obser-
vation coding form (Figure 2.3) to record data. (The coding form used
in the field was 8-1/2 inches by 14 inches. It has been reduced in size
for display in Figure 2.3.) Students' names were placed in the columns.
The four lefthand columns were used for recording starting and ending
times, teacher involvement and pacing codes.
The form was used in the following way. The observer noted the
starting time for any group setting wherein reading (or mathematics) was
the content. All times were recorded to the nearest minute. Teacher
involvement and pacing for each group were then coded in the appropriate
columns. Finally, the content was coded in the cell below the name of
each student in that setting.
If the content was the same for all students in a setting, then the
content was coded for the student appearing first in the list; and a
horizontal line was drawn across the appropriate cells for each of the
other students in that group. This indicated that the content code was
the same for all students in that group. In the simplest case, where a
setting came to an end at a particular time for the whole group, V-,
ending time was recorded. If some students in that setting covered
different categories of content, then those categories were coded under
the names of the appropriate students. If one or more of the students
in a setting left that setting, then the end time was entered in the cell
for that student directly under the content code. In this way, all
students who started out in the same setting could leave it at different
times and still be accounted for. If a student entered an existing
setting after it started, then the observer coded that student's start
time under his name and then coded the content. Thus, if a cell for a
-1 u
Figure 2.3
Observation Coding Form(Reduced from 8-1/2" X 14")
PO
14
F.,1:: ILs
TIME START
TIME ENO
T/N
S/0
STUDENT 1
STUDENT 2
STUDENT 3
ETC.
41
-31-
partici ,r student began with a time, it was implied that the group time
entered in the far left column did not apply to that student. If the
last entry in a cell for a particular student was a time, it implied that
he left the group before it ended and the end ti.le for the setting
(second column from left) did not apply for that student. Similarly,
if a student started off in setting A, changed to setting B, and then
returned to setting A again, the sequence could be coded. Tht cell under
the student's name might contain a content code, a time, another time,
a content code, and a third time. This configuration would represent a
case where the student started the rting with the whole group and was
wf-king cn the content listed first. his work continued until the first
time Yisted in his cell, at which point the student changed to another
setting. At the second time listed in the cell, the student returned to
the first setting and worked on the content listed next in the cell.
The final time recorded in the cell represents the point at which the
student left the setting again, and, in the example being considered,
the setting continued to exist after the student's second departure.
The time during which the student was not in the setting being discussed
could be accounted for by looking in another row on the form (that is,
in another setting). However, note that if the interim setting did
not involve reading (or mathematics), then no entry would have been
mac: t: for that interval.
To recapitulate: each row on the form represented a setting as
defined by teacher involvement and pacing. Several rows could be active
at any one time. Content and information which was associated with
individual students as opposed to groups) was recorded in the columns
of the form under the names of the particular students. In this way,
-32-
one observer kept track of all the students in the class. Note that
when a student was working on content which was not recordable within
one of the categories of reading (or mathematics) as defined for this
study, no codes were recorded.
Group size was not necessarily included in the set of codes. However,
the group size for any setting could be recovered from the codes already
described. For a particular student at a particular time, group size for
the setting could be determined by examining the row in which the student
was included and counting the number of students in the row at the same
point in time. (As previously stated: for purposes of analysis, group
size was considered a dichotomy; small groups defined as having nine or
fewer members, large groups as having more than nine. Since the exact
group sizes were available from the raw data, this cutting point could
be easily changed fcr additional analyses.)
The space , the eight of the sheet was used for comment or clari-
fications as they were required. Forms with the names of students were
printed for each class. The names of teacher and observer and the date
of observation were also recorded on each form.
In carrying out the observation routine, it was necessary for the
observer to move about the room to look at materials being worked on by
students. Experience showed that the content coding required a thorough
knowledge of the materials actually being used by students. This was
especially true in cases where the program was highly individualized.
The observation procedure was designed to collect information on
engaged time. If students were not engaged in the task at hand, then
time was subtracted from each setting for each student depending upon
how much time that student was unenaaged. When time was subtracted for
-33-
unengagement, it was done so in multiples of one minute; momentary in-
attention was ignored.
Engagement was judged by the observer with the aid of several guide-
lines. When students were working on tasks which required an overt
response, engagement was relatively easy to judge. When students were
working on tasks which did not involve overt responses, the situation
was somewhat more difficult. In the latter cases, observers used student
eye contact and body position as indicators of engagement. If a student
was in a discussion group, watching the various speakers in turn and
apparently following the discussion, then the time was considered engaged
time. If a student was discussing an unrelated topic with other students,
or was clearly not attending to the task, then the time was considered
unengaged time. The distinction was fairly crude; students were considered
unengaged only when the situation was unambiguous.
At the end of each observation day, the raw aata on the observation
coding form were transferred to standard coding booklets by the observer.
In this way, a set of engaged times was scilerated for each student,
describing his reading (and mathematics) instruction for the day. For
reading, with seven observation content categories and eight combinations
of the three dichotomous setting variables, there are 56 content-by-
setting combinations. The standard coding booklets contained a vector
of 56 engaged titre entries for each student, summarizing the engaged time
in reading for that particula, day. The observation data on this form
were punched on computer cards for further processing.
Observer reliability. The observation data were collected by two observers.
After approximately two weeks of training_ the observers simultaneously
collected data in two classrooms over a four day period for reliability
`14
-34-
purposes. Both observers went to Class A for two full days and then to
Class B for two full days. The data obtained in this period were trans-
ferred to the standard coding booklet; and times were collapsed over
days, classes and setting codes, so that total engaged times were avail-
able for each student for each content category from each of the two
observers. Interobserver correlations were computed, and showed good
agreement n most content categories.
After this post-training check, the observations were carried out
in the study class)oms. This required approximately six weeks. Follow-
ing the data collection, the observers returned to the same two classes
and simultaneously observed Class A for 2 days and Class B for one day.
These data were processed along with those collected at the post-
training period. The data were collapsed over the seven days (four pre
and three post) of observation, yielding total time in content-by-setting
combinations for each student from each observer.
The interobserver correlations for each content-by setting combination
are presented in Table 2.2. For the calculation of interobserver agree-
ment indices, the students from both classes were pooled, yielding a
sample of 45 students. Some setting-by-content combinations were rarely
(or never) observed during the seven day period. This resulted in some
correlations being calculated on distributions with very little variance.
In some cases only one student had A non-zero engaged time. This
accounts for many of the low correlations. Where the distributions were
all zeros for both observers, two dashes appear in the table. These
represent cases of perfect agreement; that is, neither observer recorded
a , time for any student in that content-by-setting combination. Where
4v
46
Table 2.2
Interob'erver correlations for content category by setting combinations. Data were collected
in two classrooms over a total of seven school days. Four of the days occurred after trainingbut before the study data were collected, while three of the days occurred after the study data
were collected.
OBSERVATION CONTENT CATEGORIES
Setting
Combinations
LongVowels(RL)
OtherDecoding
(RD)
CompoundWords
(RC)
Other WordStructure
(RS)
CombinedComprehension
(RM)
Reading
Practice(RP)
Areas RelatedTo Reading
(RO)
ASH .55 .45 .40 .30 .85 .89 .82
ASL - . NIa
.43 .00a -.05a
-.04 .41 -.06a
AOH 1.00 .93 -- -- .93 1.00 1.00
AOL 99 .62 -- .00a
.23 .69 10
NSH .00a
-- -- .00 .00 .92 --
NSL --b .16a
-- -- .08a
.22 -.06a
NOH-- -- -- -- -- -- --
NOL -- 1.00 -- -- -- -.12 --
All SettingsCombined
.95 .91 .63 .94 .85 .64 .97
Note Number of subjects = 45
A = adult, directly involved N = no adult directly involved
S = seatwork 0 - other (non-seatwo1:1
L = low group size H = high group size
aThese coefficients represent cases where only a few students had non-zero time; assessed by one or oothobservers. Seven of the coefficients had between five and eight students with non-zero times, while theothers had three students with non-zero times.
ba -- indicates perfect agreement between observers but all students had zero recorded time.
4
-36,
there was a reasonable amount of time recorded, the correlations were
relatively high, indicating that engaged time in content-by-setting com-
binations can be reliably recorded by different observers.
The setting information was used for descriptive purposes only.
Time in content areas was used Flth for descriptive purposes and in
analyses of time in content with achievement. The bottom row of Table 2.2
presents the interobserver agreement when the data were collapsed over
setting. Note again that the coefficients were relatively high.
Student engagement rates. Although the direct observation procedure
provided information on the amount of engaged time students spent in a
two week instruction period, ther was no direct information available
on student engagement rates. Two methods of estimating engagement rates
were triea.
As noted earlier, observers completed a log at the end of each day
of observation. This log contained the amount of allocated time in
reading (and mathematics) for students in the class for a particular day.
These daily logs were coded and punched. (Reading logs and mathematics
logs were punched separately.) For most classes, there were seven full
days of instruction for which both allocated time from observer logs and
engaged time from direct observation were available (one class had siA
days). For each student, the total time allocated to reading and the
total engaged time in reading were calculated (over the 6 or 7 day
period). An observed engagement rate was then computed for each student
by taking the ratio of total engaged tine in reading to total time allo-
cated to reading.
-37-
Since the observed engagement rate could be computed only after
extensive observation of each student, it was desirable to find an alter-
native procedure that would be less expensive. The results of this
work were to inform the Beginning Teacher Evaluation Study Phase III-B
design, so cost and practicality considerations were important.
An alternative procedure was based on adjusted teacher ratings of
student attentiveness. Teachers were asked to rate each student in terms
of the percent of the time which the student paid attention during class.
These ratings were made twice: once for instructional settings where
an adult was directly involved, and once for settings where no adult was
directly involved. The percent attentiveness ratings were made by
placing a check in one of nine categories, where each category represented
an increment of 10 percent on a 0 percent to 100 percent scale. (The
directions to teachers and the two rating forms are included in Appendix C.
By an oversight, the category representing 31 to 40 percent was omitted
from the form.)
The teacher ratings of attentiveness were assigned the mid-category
value; that is, a check in the 81-90 percent category was assigned a
value of 0.85. This provided a distribution of attentiveness scores
for each class. However, comparison from one class to another would be
hazardous, since errors due to teachers' tendencies to rate high or
low would appear as between-class differences. In an attempt to correct
for possible teacher bias, class estimates of mean engagement were made.
The estimates were based on data collected during instruction in
reading. An observer visited each class for one day. During the reading
instruction periods, the observer counted the number of students engaged
and the total number of students nominally working on reading. This
4
-38-
procedure was repeated every four minutes. In this manner, average
class engagement estimates were calculated. The results of this pro-
cedure are shown in Table 2.3.
These average class engagement estimates were used to adjust the
teacher ratings of student engagement. The adjustment was made in such
a way that each adjusted class mean was equal to the average class
engagement estimate. The adjustment is specified in the following equation:
y..IJ
= r: R..J IJ
IT
where Yij is the adjusted teacher rating of attentiveness for student i
in class j, Rij is the teacher rating of student attentiveness, Psi is
the class mean of the teacher ratings of student attentiveness for class
j,andr.is the mean class engagement estimate for class j. This
procedure prevents Yij from being negative, and preserves the relative
ranking of students within class.
Sample
The field work carried out by Far West Laboratory during the continu-
ation year of Phase III-A of the Beginning Teacher Evaluation Study (32e
Far West Laboratory, 1975) involved a sample of 33 teachers. This sample
was composed of 16 Grade 5 and 17 Grade 2 teachers. Each volunteered
to participate in the one-year study.
The teachers were recruited in the San Francisco Bay Area by Far
West Laboratory staff during the spring of 1975. After meetings with
Table 2.3
Estimates of average class gngagement during reading instructionfor eight Grade 2 classes.
Class
Average Numberof StudentsObserved
Number ofTime Samples
Time SampleInterval (Mins.)
Average kEngagement"
1 15 18 4 .44
2 11 44 4 .49
3 19 27 4 .25
4 7 41 . 4 .59
5 15 23 4 .41
6 16 31 4 .51
7 13 33 4 .55
8 7 38 5 .50
aAlthough there are nine classes in the sample, this procedure was carried
out in classes 1 through 8. No data are available for class number 9.
b These estimates were calculated from one day of observation per class. In
all cases data were collected during class time which was allocated toreading activities. Since teachers allocate varying amounts of time toreading, the time period covered by the observation differs considerably.The observers counted the number of students engaged at four minute inter-vals (with one exception). They recorded the number of students engaged,the time, and the number of students in the classroom who were part of theBTES study and who were nominally working on reading activities. The
average engagement was calculated by summing the number of students engagedover the total number of time samples and dividing by the sum of the numberof students in the classroom being followed by BTES and nominally workingon reading activities. No distinctions have been made between settingcombinations or subareas of content within reading.
-40-
administrative officials and building principals in ten districts, indi-
vidual teachers were contacted. The study was described, and teachers
were offered extension credits (through a cooperating college) or an
honorarium for their participation.
In September of 1975, it was decided to conduct the reading and
mathematics studies with separate samples of teachers. The teachers
at both grade levels chose to participate in either the reading or the
mathematics sample.
The study being reported concentrated on the Grade 2 reading sub-
sample, which consisted of nine teachers. Given practical and financial
constraints, it was not possible to carry out extensive direct obser-
vation in all classes. As a result, six of the Grade 2 reading classes
were selected for direct observation. Selection for the observation
subsample was made on the basis of variety of instructional organization
across classes and representation of inner city, suburban, and mixed
populations. All of the teachers selected agreed to be included in the
observation subsample. Since the direct observation required observers
to be present for the entire school day, it was feasible to collect
information on both reading and mathematics instruction. As a result,
this subsample was treated as a regular part of the Grade 2 reading
sample; but, in addition, several mathematics scales were administered
to the classes, and teachers kept logs of both reading and mathematics
instruction. This report deals only with the reading data collected
from the nine teachers.
Teachers in this study completed a remarkable amount of work in
connection with the study. (The work reported here is based on data
collected over approximately 10 weeks of instruction during the fall
-41-
of 1975; the teachers continued to contribute to other facets of the
Beginning Teacher Evaluation Study through the spring of 1976.) Each
teacher received either a $50 honorarium or four extension credits for
participating in the study. They were paid $10 per week for the
completion of teacher logs (kept over a period of approximately 12
weeks). Teachers who were observed for a two-week period were given
an additional honorarium of $100.
The nine classes represented a variety of background characteristics.
Five classes served a relatively lower class inner-city population, two
served a mixed population, and two served middle class suburban areas.
No two classes were in the same school, and the schools represented four
different school districts in the San Francisco Bay area. The reading
curricula it the classes varied widely. Seven of the nine classes relied
on basal readers as the core of the reading program (four classes used
the Harper and Row series; one class used the Lippincott series; one
class used both the Harper and Row and Lippincott series; and one class
used the Lippincott and Ginn series). Most of these classes had more
than one level of a particular series in use at any given time. The
levels varied from pre-primer to second grade as designated by the
publishers. One of the classes using the Harper and Row materials aug-
mented the program with substantial amounts of listening and silent
reading. Each day students in this class listened to tapes (with ear-
phones) while "reading along" in their books.
Two of the classes did not use basal readers. One of these used
a "controlled reading" program produced by Educational Development
Laboratories. This program prescribes sequential activities in word
recognition, word meaning and general comprehension. Workbook materials
5:i
-42-
and "readers" were used in conjunction with a number of specially designed
audio visual machines.
The other non-basal-reader program was highly individual zed.
Several "stations" presented reading related tasks to students. There
were phonics activities to be completed in workbooks as well as auditory
discrimination tasks carried out on special machines. A major portion
of the reading program was conducted via filmstrips and audio tapes.
Students were frequently tested before moving to new segments of the
material. In addition students spent time in silent reading from a
wide variety of books.
The teachers were all female, with several years experience in
teaching. One of the teachers had no prior second-grade teaching experi-
ence, although she had had experience at "ther elementary school grade
levels.
Several of the classes were split grades, containing some Grade 1
students and some Grade 2 students. Only Grade 2 students (but not
necessarily all Grade 2 students in a given class) were included in the
study. Of the Grade 2 students in a class, teachers were asked to
identify those who were reading at a level below the middle of Grade 1.
Since the low reading level would have made it difficult to test these
students reliably, they were not tested, nor were they followed via the
log procedure. At the initial testing, it became clear that several
other students were not able to complete the tests. These students
were also dropped from the study. This left 152 students in nine
classes as the student sample available for analysis.
54
III THE COLLECTION AND ANALYSIS OF DATA
Data Collection
The data collected in the nine Grade 2 classes are summarized
schematically in Table 3.1, This report deals only with the reading
data. The eight-week test data were comprised of the scores obtained
from testing occasions A (first week of October) dnd B (first week of
D °cember). The her log data describe the reading instruction for
the A-B intertest pnriod. The two-week test iata were comprised of
scores obi...ined on testing occasions OA and OB. For Classes 1 and 3,
this period fell in the latter half of October. For the remaining two
pairs of rldsses, (numbers 4 and 5 and numbers 2 and 6), the OA -OB
interval came during the first and last two weeks of November respectively.
The direct observation data and observer log data describe reading in-
struction during the OA -OB interval.
At occasions A and B, the reading battery was administered in four
45 minute group testig sessions. The four sessions required 2 testing
days. -3sts were administered by Far West Laboratory staff, but not by
the observers. No other tests were given on the same day. At the OA
and OB occastons, short mathematics and reading tests were administered
in one 45-minute session. This testing was administered by the observers.
All test administrators were briefed on the testing procedure, and
approximately half of tie testers administered at least one of the tests
in a classrocm practice session before testing began. hose test admin-
istrators who did not have a practice administration acted as observers
at least once while a test was being administered to a class. The
guidelines for test aoministration are included in Appendix A. Test
Table 3.1
Summary of data collected on nine Grade 2 classes.
Class
2 weekobservationdata
2 weektest
scores
8 weeklogdata
8 weektest
scores
8 weekattitudedata
2 weekobserverlogs
1 day
coderlogs
1 day coderestimate ofmean classengagement
teacherratings ofstudent
attentiveness
1 R,M R,M R,M R,M R,M R,M R R R
2 R,M R,M R,M R,M R,M R,M R R R
3 R,M R,M R,M R,M R,M R,M R R R
4 R,M R,M R,M R,M R,M R,M R R R
5 R,M R,M R,M R,M R,M R,M R R R
6 R,M R,M R,1 R,M R,M R,M R R R
: R R,M R R R
8 R R R,M R R R
R R R,M__a
--a
R
NotesR represents reading data; M represents mathematics data.
a The one lay coder log and tie couer estimate of mean class engagement were not oltained for class 9.
5
-45-
administrators completed testing report forms (see Appendix A) after
every administration, and were debriefed after testing occasions A and B.
The testing conditions were, on the whole, reasonably gooc. There
were, however, the usual number of unexpected interruptions. At the A
testing occasion, the tests proved difficult for many students and,
caused frustration for some. Items with unfamiliar terminology or
symbols which could hava caused reading difficulties were read to the
students by the test administrator. Care was taken to have the teachers
present in the classroom, to conduct the testing sessions at the same
time of day, and to adhere to time limits developed during pilot testing.
These precautions (and many others listed in the training materials)
were intended to reduce measurement error; however, the difficulty of
conducting field testing over several occasions (even in a small number
of classes) is not to be underestimated.
Student responses were made directly on the test booklets. The
completed booklets were returned to the Far West Laboratory for process-
ing. Some hand-scoring was required, after which the item responses
were punched on cards and verified. Scoring was done by a computer
routine, and the standard correction for guessing was applied. Item
analyses were conducted, and internal consistency reliability coefficients
calcul;ted.
Data collection for the teacher logs began early in September with
one-to-one meetings with each participant. Materials on log-keeping
were explained, and teachers began to keep practice logs up to two weeks
before the A testing occasion. Each teacher was visited several times
so that any questions about log keeping could be answered. The amount
of feedback which teachers required varied considerably. The more complex
-46-
the organization for instruction was, the more complicated 44,R log-
keeping became.
Once the class rosters were finalized and teachers had some practice,
the log-keeping seemed to go smoothly. Teachers were asked to complete
their logs each day, a;id to return them to the Far West Laboratory by
mail every Friday. This procedure worked quite well, although teachers
were sometim,.s late in returning logs, and it is not certain that all
teachers completed them every day.
When logs were returned to the Far West Laboratory, they were
visually checked and given to a coder who transferred the information
onto standard coding sheets. The log for any given day was coded
as a series of events, where each event was defined by a content code,
the setting codes, and the time allocated to that event. Events were
associated with particular students, so that a student's reading in-
struction for the day appeared as a series of events. All of the logs
were punched by student by day. Given that a student typically had four
or five events per day, and that the sample of 152 students was tracked
by logs for approximately 40 days, the management of the log data was
a challenging task.
Once all of the logs were coded and punched, two types of validity
checks were carried out. First, the number of days represented for each
student was checked to make sure that all the days in the A-B interval
were accounted for. This task was done by hand, using the raw logs and
absentee information to edit any discrepancies. In addition, for one
student in each class, the number of events on the computer printout was
handchecked against the raw logs. This was done to insure that students
-47-
had the correct number of events. Besides the handchecking procedures,
range tests were made by the computer.
When the log data had been checked and cleaned in this manner,
allocated times were accumulated over days. This generated a vector of
times (in minutes) for each student representing the distribution of
allocated reading time for that student in the categories formed by all
possible content-by-setting combinations. For reading, there were a
total of 544 categories (8 setting combinations by 68 specific content
categories). At this stage there were 152 students with complete log
data. Therefore, the fundamental log data matrix was 152 rows by 544
columns, where the entries were total allocated time for the A-B
testing interval. By aggregating over columns of this matrix, it was
possible to generate allocated time by settings, allocated time by
general content categories, etc. The time data used in the A-B analyses
of instructional time and student achievement were based on this matrix.
The accuracy of the teacher logs was investigated by comparing data
from teacher and observer logs. A second aggregation of the teacher log
data (over the days in the 0A-08 interval) was made for this purpose.
This aggregation was carried out for only six of the nine teachers
since only six had been observed.
The observer logs were processed in a manner similar to the teacher
logs. In this case, the reading instruction was coded by general
content categories only, thus making the fundamental matrix for observer
logs 112 rows (representing the students in the six observed classes)
by 80 columns (8 setting combinations by 10 general content categories).
The allocated times in this matrix represented instruction over a seven-
day period within the 0A-08 interval.
-48-
Data collection for the direct observation procedure began with
arrangements with the teacher for a two week period for observation.
At this time, the observer obtained an outline of classroom routine and
discussed the nature of the observation with the teacher. It was made
clear to the teacher that information on engaged time in instruction
for individual students would be collected, and that no data on teacher
behavior were being recorded. The OA and OB testing was discussed, and
teachers were told what scales would be administered. In addition,
teachers were asked to spend time on instruction in decoding long vowels.
This request was intended to ensure that-all students would have at
least some time in a common content category. It was desirable to have
significant amounts of engaged time in one or more time categories;
otherwise it would be difficult to demonstrate growth in achievement
over a two-week period.
On the first observation day, the observer memorized the names of
students who were to be observed, and became familiar with classroom
routine. During this day, the observation procedure was practiced in
this new setting, and teacher and students had time to become accustomed
to the observer. Every day during the observation period, the observer
entered the class with or before the students and remained for the entire
school day. This allowed the coding of all instruction relevant to
reading(and mathematics). On the second day of the observation period,
the OA testing was administered by the observer. Immediately after the
testing, observation data collection began and continued during in-school
hours until the OB testing date.
During the post-reliability check for the observation procedure,
several errors in transferring tim s from raw observation coding forms
C1
-49-
to standard coding booklets were discovered. The post-reliability data
were completely checked and anj errors corrected. This situation raised
questions about the transfer process for the study data. As a result,
a random sample of the study data was recoded. For each teacher, two
days were randomly selected from the set of observation days. The
corresponding raw observation data were recoded. This was done for both
the reading and mathematics data; 26 of the 104 booklets (representing
25 percent of the data) were recoded. In this sample, 76 errors were
found in a total of 1746 entries. This corresponded to a 4 percent
error rate. The errors varied in size. When all errors were combined,
the total number of minutes (regardless of sign) was 365.6. The average
error had a magnitude of 4.8 minutes. The errors discovered in this
sample were corrected before further processing of the observation data.
Given that some of the errors would "cancel out," that the errors were
distributed over a relAtively large number of students, and that the
average error was small; transfer and coding errors in the observation
data were of minor importance.
The observed engaged times were aggregated over days, generating
a 112-row by 56 column matrix (7 observation s.ontent categories by 8
setting combinations). These data were aggregated twice; once over all
days between the OA and OB testing, and once over the 0A-OB period
minus the days on which the testing actually took place. The latter
aggregation was used for comparison with the observer logs and the subset
of the teacher logs which had been aggregated over the identical days.
Analysis
The results presented in the next chapter are divided into three
6r)
-50-
sections: characteristics of teacher log data, description of time
allocated to reading content- and setting-categories, and analysis of
instructional time and reading achievement. This section summarizes
the procedures used in arriving at those results.
The data on teacher log characteristics are presented descriptively.
Each class was treated separately and within-class correlations are
presented between teacher log times and observer log times. No signi-
ficance testing has been carried out on these data.
The time-allocation data are presented in summary form. In the
main, class means and standard deviations are shown. No statistical
comparisons have been made on these data.
The section on time and learning was more problematic. The objective
of analyses in this section was to show whether or not students who spend
more time in a particular content area also show higher levels of
achievement in that content area. The analyses undertaken assumed that
posttest achievement level was a function of pretest achievement level,
general aptitude for school learning and the amount of instructional
time spent on the subje area. Multiple regression analysis was
selected as the procedure for analyzing the data. In this analytical
framework, the questions of major interest became "Is the raw regression
weight for time positive?" and "Is that weight bounded away from zero?"
(A positive regression weight indicates that more time is associated
with more learning. However, weights are of relatively little interest,
if a typical confidence band around the regression weight includes zero.)
One way to proceed would have been to conduct analyses within each
class, since the other instructional conditions for members of the same
0
-51-
class were reasonably homogeneous. In the current data set, this would
have required running analyses on very small samples ranging in size
from 13 to 26. Such analyses could hardly be expected to yield stable
results.
The procedure used instead required two separate steps. First,
all subjects were pooled regardless of class membership, and multiple
regression analyses were conducted. A substantial positive regression
weight for time was interpreted as meaning "more time/more learning,"
but the source of the effect was somewhat ambiguous. It could have
resulted from differences among classes (but no differences among
students within the same class), differences among students within the
same class (but no differences among classes), or both. At this point,
class means were plotted to help clarify the ambiguity. If no effect
for time was found, a within-class relationship remained possible.
Regardless of the results of this first step, a second step was
carried out. Scores on each variable were transformed to deviations
from their respective class means, and the regression analyses were
rerun on the deviation scores. This procedure is described by Cronbach
and Webb (1975).
A substantial positive regression weight for time on the second
step was interpreted as follows. students with more time have higher
levels of achievement regardless of class mean differences. No effects
on both steps vpuld indicate that, for this sample and for this model
sr_ification, instructional time was not linearly related to achievement.
Analyses carried out in the first step of this procedure are referred
to as "analyses with subjects pooled." Those carried out in the second
64
-52-
step are referred to as "analyses with subjects pooled within class."
Specifying which variables to include in the regression model was
somewhat difficult. In each case, academic status was used as a measure
of aptitude. The major time variable was defined as the time in the
content category which matched the content assessed by the achievement
test. In most cases, a second time variable was included representing
time in a logically related area of instruction. As a general rule,
analyses of achievement over the 0A-G3 period include engaged time
measures from direct observation. Analyses of achievement over the A-B
period have been carried out twice: once using allocated time estimates
from the teacher logs, and once using adjusted allocated time obtained
by multiplying the allocated time from the teacher logs by the observed
engagement rate. Throughout this report, this adjusted time is referred
to as "estimated engaged time (from teacher logs)."
Each regression run was made on cases with complete data. The
reading tests were relatively easy resulting in substantial ceiling
effects. To reduce these effects, the pretest score distribution was
examined and several cases trimmed, so that each student (after trimming)
had the opportunity to gain at least as many score units as were gained
by the sample as a whole. Trimming (to provide complete data and reduce
ceiling effects) was carried out as a routine procedure. The ceiling
effects in the data were serious. In the most severe case fifty percent
of the ample was trimmed before analysis.
60
IV RESULTS
Results are presented in three general areas: characteristics of
teachers' allocated time logs, allocations of instructional time to
reading, and relations between instructional time and student achieve-
ment. Time variables are reported in minutes unless otherwise noted.
Achievement scores are reported in raw score units where, in each
case, the scores have been corrected for guessing.
An overview of time allocated to reading is presented in Table 4.1.
Some comments on this table may clarify the conditions under which data
were gathered and facilitate the understanding of later tables. Note
that class size averaged 28 students, and that in most classes only a
portion of the total class was included in the Beginning Teacher Eval-
uation Study data collection. Data were available for a total of 152
students in the nine Grade 2 classes.
The number of days of instruction in the A-B testing interval
ranged from a high of 40 days to a low of 28 days (see Table 4.1).
This variation did not affect the time-and-learning analysis, since
all relevant in-school time between pre- and posttest was accounted
for. However, the discrepancy does cloud between class comparison of
allocated time. This problem could have been avoided by the reporting
of time per day or time per student-day; but this would give the
impression that time was allocated to every sub-content area on a
daily basis, which was not true. Therefore, in the time-allocation
section of this chapter, times are reported for a 40-day instructional
period; and for classes where the actual A-B interval was less than
Table 4.1
Class size, length of school day, adult instructional time, and time allocated to reading for nine Grade 2 classes.
a Values in parentheses are standard deviations computed within each class.
-55-
40 days, times have been adjusted prueortionately. A'l of the allocated
time information was taken from the teacher logs kept over the A-B
period.
The length of the school day for a student varied by as much as
25 minutes depending upon which class he attended. The times recc-ded
are in-class times, minus times for lunch and recesses. Since se,
classes operated on a staggered-day routine, wfie.e part of the class
came early and went home early while a second group came and went home
late, the length-of-school-day figures do not necessarily reflect the
amount of student contact-time for teachers. (Class 2 clearly illus-
trates the effect of the staggered day. Note that a student in Class 2
spent 240 minutes in daily instruction, but that the teacher instructed
students for 300 minutes per day.) 'tie total amount of adult instruc-
tional time reported in Table 4.1 was calculated by summing the in-class
time for all paid ...ilts in the classroom. The preceding column
indicates now much of this adult instructional time was contributed by
paid aides. The algebraic difference between the two adult time
columns equals the instructional time spent by the classroom teacher.
Although the adult time figures were difficult to interpret for any
particular student, at 'he class level it we; clear that quite different
amounts of adult instructional time were allocated to different classes.
Within this small sample, Class 3 reported 77 percent more allocated
adult time than did Class 2. The figures in the table do not account
for adult instructional time which may have been provided by volunteers,
nor has any non-instructional support time been considered.
fhe average number of minutes allocated to reading instruction
per student per day was calculated by summing all allocateo time in
6
-56-
reading over the A-B period and subsequently computing the average over
days and students within each class. From Sle 4.1, the average amount
of time allocated to reading varied by as much as a factor of 2.4 from
one class to another. Note also that there was some variation in time
allocated to reading within a particular clasp, and that this variability
changed from class to class. The variability within class represents
differential student absence rates as well as differential allocation
patterns across students within a class.
Since the within-class standard deviations were quite small, it
appears that the amount of time allocated to reading for a particular
child was determined by his class membership; and that (allowing for
absenteeism) students in the same class were allocated approximately
the same amount of time in reading. The final column in Table 4.1
reports the mean allocated time in reading per student per day as a
proportion of the total instruction per school day.
Characteristics of Teacher Allocated Time Logs.
The teacher logs provided measures of allocated time over the A-B
period. At a practical level, the procedure proved workable. Teat I
were able to use the content and setting categories, and to keep records
of time allocated to various kinds of instruction. The procedure was
also flexible enough to allow data collection in very different classroom
organizational structures.
Comparison of the teacher logs with observer logs provided informat.on
on the accuracy of the ecorded allocated times. The observer logs hc'l
been completed at the end of each school day d.iriL, e 01148 period.
This task was a seccndary priority for the observers, since all of
their in-school time was taken up with direct observation; and after
school hours, their primary task was the transference of direct obser-
vation data from the observation coding form to the standard coding
booklets.
The allocated time logs completed by the observers differed from
the teacher logs in at least two important ways. First, observer
allocated time logs recorded content at the level of general content
categories, while the teachers' logs used specific content categories.
This mismatch prevented the comparison of allocated time within all of
the specific content categories, but did allow comparison of allocated
time within the general content categories.
Second, the observer logs were coded for content using a strategy
referred to as "focus coding." This req.'red that an instructional
activity be placed in one particular content category, if possible --
tho most complex category which described the activity. (Comprehension
would be coded as "comprehension," and no as part comprehension and
part decoding, even though decoding is rIrt of the comprehension process.)
When contents were covered in sequence, each was coded with its appro-
priate allocated time, but where contents were coextensive in time, the
more complex content was coded. This focusing on one content category
was used in direct observation and hence carried over into the coding
of the observer allocated time logs.
The teacher logs, on the other hand, used a strategy referred to
as "multiple coding" for categorizing content. In this procedure,
teachers were encouraged to us# more than one content code, if it improved
the description of the activity. In processing the logs, if an instructional
7
-58-
activity received more than one content code for a time interval, the
time was distributed equally over the content cedes. The same activity
can be coded quite differently, depending upon whether focus coding or
multiple coding is used.
In spite of these differences, the observer logs were the best
source of information for checking the accuracy of teacher allocated
time logs. Tables 4.2 through 4.7 present comparative data on observer
and teacher logs. Each table presents information on one teacher. Only
six tables are reported since only six of the nine teachers were observed.
The tables are identical in format. These tables deal only with the
content information and, for the moment, ignore the setting information
in the log data. Since the last part of this chapter presents time and
learning results, the conteat characteristics of the logs were given
first priority.
The tables are based en teacher logs, observer logs, ana direct
observation information for days Alen all three sources were availahle
for a given cl ss. Table 4.7, describing the log characteristics for
Class 6, is based on data from six days of instruction. The tables for
the other five classes are each based on information from seven days of
instruction.
The rows of each table are labeled by general content category.
Note that rows 2,4, and 10 represent subtotals for decoding, word struc-
ture and comprehension respectively. The last row presents total time
in general content categories 1 through 9. The entries in column A are
allocated times from the teacher logs. Column C presents allocated time
from the observer logs. Information in all general content categories
was included for columns A and C, since the logs provided this information.
Table 4.2
Means, standard deviations, and correlations for Class 1 on allocated time from teacher logs, adjusted allo-cated time from teacher logs, allocated time from observer logs, and engaged time from direct observation.These data are summed over seven days of instruction for which all three sources of time information wereavailable. (N = 16)
Total reading 629 282 1062 410(GCC 1 through 9) (53) (104) (148) (85)
3 General content category numbers are shown in parentheses.
rAC
.63
-.77
.24
.30
-.48
-.96
rAD
rBD
.85 .87
.42 .32
.85 .67
.96 .69
.00 .19
-.80 -.72
.89
-..84
-.50
-.06 -.07 .39
.67 .70 .42
74
Table 4.3
Means, standard deviations, and correlations for Class 2 on allocated time from teacher logs, adjusted allo-cated time from teacher logs, allocated time from observer logs, and engaged time from direct observation.These data are summed over seven days of instruction for which all three sources of time information wereavailable. (N = 18)
Class 2
ContentCategory
A B C 0
Allocated Time Adjusted Allo- Allocated Time Engaged Time
from Teacher cated Time from from Observer from Direct
Logs Teacher Logs Logs ObservationrAC
Long vowels(GCC 1)
Total decoding(GCC 1,2)
8 4 13 4
(11) (6) (16) (5)
254 124 188 104
(52) (28) (48) (35)
.98
.97
Compound words(GCC 4)
Total word structure(GCC 4,5)
PrdCtiCe9t
Other mading(GCC 8)
1 0 2 3
(1) (1) (3) (5)
17 9 11
(19) (9) (11)
14
(15)
1.00
118 58 88 132
(33) (18) (37) (44)
85(21)
.98
.56
41
(11)
44(16)
25(12)
.69
rAD rBD
.82 .83
.74 .73
.91 .91
.91
.69
.92
.56
.51 .47
Context clues 7 0
(GCC 3) (9) (0).00
Word meaning(GCC 6)
0
(0)
0
(0)
Conprehension of text(GCC 7)
81
(26)
17
(9).30
Total comprehension(GCC 3,6,7)
88 42
(23) (10)
17 21
(9) (11).57 .29 .31
Total reading(GCC 1 through 9)
562 273 348 296
(110) (60) (86) (89).95 .84 .76
a General content c tegory numbers are shown in parentheses.
bA,4.- indicates pert t agreement between sources rc time information however there WAS no variance on either variable. 76
Table 4.4
Means, standard deviations, and correlations for Class 3 on allocated time from teacher logs, adjusted allo-cated time from teacher logs, allocated time from observer logs, and engaged time from direct observation.These data are summed over seven days of instruction for which all three sources of time information wereavailable. (N = 20)
. ContentCategory
Long vowels(GCC 1)
Total decoding(Gcc 1,2)
Compound words(GCC 4)
Total word structure(GCC 4,5)
Reading practice(GCC 9)
Other reading(GCC 8)
Context clues(GCC 3)
Word meaning(GCC 6)
Comprehension of text(GCC 7)
Total comprehension(GCC 3,6,7)
Total reading(GCC 1 through 9)
Class 3
A
Allocated Timefrom TeacherLugs
B
Adjusted Allo-cated Time fromTeacher Logs
C
Allocated Timefrom ObserverLogs
D
Engaged Timefrom DirectObservation
rAC rADrBD
77
(10)
19
(6)
100
(9)
38
(4)-.35 .30 .55
223
(21)
55
(15)
295
(52)
106
(18).53 .41 .29
38 9 24 11
(18) (4) (6) (4).55 .23 .47
39 9 24 12.57 .38 .59
(18) (4) (6) (4)
267
(3r)
66
(19)
175(30)
49
(12).29 .16 .57
46 12 5 2
(41) (12) (7) (0)-.75 .00 .00
0 0 __b
(0) (0)
0 0
(0) (0)
4IMM
120 38 .98(62) (54)
120
(62)
31
(20)
38(54)
16
(20).98 .96 .93
695(79)
172
(51)
537
(60)
184
(27).94 .65 .81
4 a General content category numbers are shown in parentheses.
bA -- indicates perfect agreement between sources of time information however there was no variance on either variable. 7b
Means, standard deviations, and correlations forcated time from teacher logs, allocated time fromThese data are summed over seven days of instructionavailable. (N = 14)
Table 4.5
Class 4 on allocatedobserver logs, and
for which all
Class 4
time from teacher logs, adjusted allo-engaged time from direct observation.
three sources of time information were
ContentCategory
A
Allocated Timefrom TeacherLogs
B
Adjusted Alto-cated Time fromTeacher Logs
C
Allocated Timefrom ObserverLogs
0
Engaged Timefrom DirectObservation
rACrAD r
BO
Long voqels(GCC 1)
20
(17)
13
(12)
27
(20)
6
(10).74 .71 .64
Total decoding(Gee 1,2)
90
(33)
54(25)
186(53)
195
(52).48 .45 .39
Compound words(GCC 4)
23
(7)
14
(5)
9
(1)
13
(3).04 .25 .44
Total word structure(GCC 4,5)
23
(7)
14
(5)
16
(3)
13
(3).04 .39 .53
Reading practice(GCC 9)
143
(35)
84(28)
184(50)
127
(69)-.18 .13 .35
Other reading(GCC 8)
8(11)
5
(7)
73
(41)
40(35)
.67 .49 .55
Context clues(GCC 3)
7
(11)
0
(0).00
Word meaning(Gee 6)
65(24)
0
(0),00
Comprehension of text;
57,__%
96/...... 01
Total comprehension(GCC 3,6,7)
129
(52)
78
(36)
96
(30)
37
(16)-.06 .24 .23
Total reading(GCC 1 through 9)
394(90)
235
(79)
554(104)
412(79)
.66 .55 .63
a General content category numbers are shown in parentheses.
did
Table 4.6
Means, standard deviations, and correlations for Class 5 on allocated time from teacher logs, adjusted allo-cated time from teacher logs, allocated time from observer logs, and engaged time from direct observation.These data are summed over seven days of instruction for which all three sources of time information wereavailable. (N = 26)
Class 5
. ContentCategory
A B C 0
Allocated Time Adjusted Allo- Allocated Time Engaged Time
from Teacher cated Time from from Observer from Direct rAC
a General content category numbers are shown in parentheses.
. 55 .19 ,22
. 29 .37 .01
82
Table 4.7
Means, standard deviations, ar'1 correlatioas for Class 6 on allocated time from teacher logs, J..isted allo-
cated time frum teacher logs, allocated time from observer logs, and engaged time from direct, observation.These data are summed over six days of instruction for which all three sources of time information wereavailable. ,N = 18)
a General rnntent category numbers are shown in parentheses.84
-65-
Columns A and C +provide the basic comparison for allocated time. Column
D presents engaged time from direct observation. Since the direct obser-
vation system used one content category to cover general content
categories 3, 6 and 7, some rows in column D are blank. Allocated times
from the teacher logs were multiplied by the adjusted teacher ratings
of student attentiveness. This product, referred to as "adjusted allo-
cated time (from teacher logs)" is presented in the tables as column B.
The purpose of calculating the adjusted allocated time was to
allow comparison with the engaged time from direct observation. There-
fore, column B presents data in only those rows (general content
categories) for which engaged time from direct observation was available.
Columns B and D then allow a comparison of measures of adjusted allocated
and engaged time from independent sources. In addition to comparison
of means and standard deviations, three sets of Pearson product-moment
correlation coefficients were calculated. The first, rAC, describes
the relation between the two sources of allocated time. The second,
rAD, describes the relation between allocated time from teacher logs
and engaged time from direct observation. Finally, rBD, represents the
:rree of relationship between adjusted allocated time and engaged time.
A simple summary of Tables 4.2 through 4.1 is difficult but several
comparisons do shed some light, for example, the comparison of allocated
time from teacher logs and from observer logs. The means in columns A
and C for rows 1 through 10 did not agree consistently; for some rows
they seemed to agree quite well for others they did not. No class had
agreement in all rows, but there were several content categories where
most classes agreed. In the main, these were categories where relatively
J
-66-
little time had been allocated. Of the 60 average differences in columns
A and C (6 classes by rows 1 through 10), 25 were less than 15 minutes
in magnitude and 32 were less than 30 minutes in magnitude. Note that
rows 1 and 2, rows 3 and 4 and rows 7, 8, 9 and 10 are not independent.
Therefore some of the "disagreements" between the means of columns A
and C were counted twice. In any case there were many large average
differences.
The differences between columns A and C for class 1 (Table 4.2)
appeared to be larger than those for the other classes rendering the
log data from class 1 less usful tnan that from other classes. Consider-
ing all of the classes, there were several examples of miscategorization
while in other cases pieces ,f the reading program have been included
by the observer but not by the teacher or vice versa. These comparisons
reflect a number of sources of error. One was the use of the different
coding strategies for the two data sources. (Teacher logs were coded
using the multiple coding stretegy, while the observer logs used focus
ceding.) Amount of error due to coding strategy differences as
compared to other sources of error is unknown. Class 5 (Table 4.6)
demonstrates this difficulty. Note that, in this table, the means in
col nns A and C match quite well, with the exception of general content
categories 3, 6 and 7. However, note too that the sum of general
content categories 3, 6 and 7 for column A (98 minutes) is in moderate
agreement with the correconding sum for column C (127 minutes). In
this case, the observer log (which used focus coding) allocated all of
the time in question to comprehension of text, while the teacher log
(using multiple coding) distributed the time (over context clues,
word meaning and comprehension of text.
86
-67
The variance within class in time allocated to reading (over 40
days of instruction) was moderate; that is, students in the same class
tended to get more or less similar amounts of time allocated to reading.
Differences among students within the same class on total time allocated
to reading were due in large part to absenteeism.
The content categories function as a partially ipsative set -- the
ame.-t of time in any one category was not independent of the time in
the other categories. Furthermore, an error in one category tended to
cause errors in one dr more additional categories.
For total times allocated to reading, relatively large differences
between sources of data were found. Note that when allocated time was
summed over ,:ontent categories, coding strategy differences no longer
had an effect. With the exception of class 1, the correlations between
columns A and C were moderate to high.
The correlation between the two sources of allocated time data
accdmulated over general content categories provided a reasonable summary
description for the classes. Wi4-',in five of the classes (1, 2, 3, 4,
and 6), the students were rank_..1 similarly on amount of allocated time
from the teacher logs and from the observer logs. The correlations for
these classes were 0.67, 0.95, 0.94, 0.66, and 0.94 respectively. For
Class 5 the correlation was 0.29.
Upon examination of the correlations between allocated time from
teacher logs and engaged time from direct observation, several interesting
findings emerged. First, for Class 5 (which had poor overall agreement
between the two sources cf allocated time), the value of rAD
was 0.37.
For the five classes where the two sources of total allocated time
-68-
agreed reasonably well within class, rAD was approximately equal to rAC
for three classes (1, 2 and 4), aria was substantially lower than rAC
for the others (Classes 3 and 6).
Turning now to the comparison of adjusted allocated time from teacher
logs and engaged time from direct observation: the differences in the
means in columns B and D were considerably smaller than those described
for columns A and C. In this case, 23 of 42 comparisons within general
content categories (represented b, rows il Tables 4.2 through 4.7)
showed means differing by less than 15 minutes. Agreement across
classes was good for long vowels, compound words and total word struc-
ture. An important question was whether the allocated time from teacher
logs or the adjusted allocated time from the teacher logs was more
highly correlated with the engaged tune from direct observation. A
comparison of rAD and rBD shows that in three classes (3, 4 and 6) the
adjusted allocated time from teacher logs was more highly correlated
with engaged time from direct observation. For each of these classes
the improvement wa substantial. However in two of the remaining
three classes (1 and 5) the decrease in the relationship brought about
by the adjustment procedure was also substantial. So, in this sample,
the characteristics of the aliocoted time from teacher logs were
improved in three of the classes but not improved in the other three
by the adjustment procedure. Since the teacher ratings were not
clearly successful in a majority of the classes, analyses of instruc-
tional time and achievement were conducted using them.
Allocation of Instructional Time in Reading
The data on allocated time from the teacher logs, accumulated over
-69-
the A-B interval (approximately 8 weeks), provide a summary record of
how time was spent during reading instruction in the nine Grade 2
classes. (The log data were far from being error free and, as a result
small differences in allocated times do not warrant interpretation.)
Table 4.8 illustrates how mean time allocated to reading (as
reported in the teacher logs) was distributed by content subarea for the
A-B testing interval. The general content categories make up the columns
of this table. During the A-B period, teachers allocated about one third
of their reading instruction to decoding and about one quarter to areas
related to reading (see Appendix A for content included in GCC 8).
Approximately one tenth of the time was allocated tc each of comprehension,
reading practice and the miscellaneous categories. The patterns of
allocation differed considerably trom class to class. Class 1 had a
high allocation of time to word structure and Class 9 had high alloca-
tions to both reading practice and the miscellaneous category. No
category was consistently omitted nor were the categories rank ordered
similarly within class. With very few exceptions the variation between
classes ,-as greater than that within classes.
The distribution of time allocated to reading over the specific
content categories is presented in Table 4.9. ":though the allocation
pattern amcng classes was quite complex, teachers generally tended to
allocate substantial amounts of time to the same specific content
categories. There were, of course many exceptions. For example, only
Class 1 allocated a large amount of time to specific category 3
(decoding-variant consonants); Class 9 allocated a large amount of time
to specific content category 59 (grammar
8
); and only Class 4 did not
Table 4.8
Means and standard ieviations for time allocated to general content categories in reading foi nine Grade 2 classes. The
entries are class averages reported in minutes per student accumulated over 40 days of instruction.
ClassDecoding(GCC 1,2)
ContentClues
(GCC 3)
WordStructure(GCC 4,5)
WordMeaning
(GCC 6)
Comprehension(GCC 7)
AreasRelatedto Reading
(GCC 8)
ReadingPractice(GCC 9)
Miscellaneous(GCC 10)
Tbtal TimeAllocatedto Reading(GCC 1 through 10)
11401
(173)
200
(41)
629(210)
187
(39)
207(49)
604
(37)
170
(32)
112(31)
3510(232)
21610(166)
26
(29)
109
(97)
3
(5)
411(112)
1055
(117)
614
(37)
522
(42)
4350(244)
31225
(81)
126
(12)
103(26)
76
(20)
474
(149)
1272(160)
106(44)
414(54)
3797(306)
4618
(211)
126(104)
71
(22)
277
(62)
597(176)
943
(181)
129(44)
68(24)
2833(241)
5773(022)
82
(50)
277(182)
74
(57)
366
(188)
593(159)
87
(53)
177(89)
2428(588)
F 1285
(159)
82
(37)
190(56)
254(126)
82
(79)
728(123)
291
(52)
820(57)
3733(261)
71358(94)
,,,it,
(53)
171
(85)
114
(41)
567(88)
1139
(105)
354
(82)
305
(59)
3886(368)
81543
(210)
110
(60)
111
(77)
130
(47)
361
(38)
935(132)
570(64)
374
(34)
4132(245)
q1(72
(339)
314
(66)
357
(217)
193
(63)
355(53)
538(36)
1309
(71)
1263
(93)
5999(336)
Average ofcless means
(unweighted)
1243
(368)
138(R4)
224
(178)
145
(90)
380
(163)
868
( ?64)
403
(391)
451(382)
3852
(1009)
NotesThese data are based on teacher log reports prorated for 0 days of instruction. The row totals correspond to 40 times
the average minutes per student per day' allocated to reading instruction reported in Table 4.1.
Ctandard deviations are shown in parentheses. 91
Table 4.9
Means and standard deviations for time allocated to specific content categories in reading for nineGrade 2 classes. The entries are class averages reported in minutes per student accumulated over40 days of instruction.
The columns of this table are specific content categories. The names of the categories corresponding to thecolumn numbers of the table are presented in Appendix B.
These data are based on teacher log reports prorated for 40 days of instruction. The row totals correspond to40 times the average minutes per student per day allocated to reading instruction reported in Table 4.1
Standard deviations are shown in parentheses.
9 5,.s 9 '3
-75-
allocate substantial time to specific content category 62 (silent reading).
When interpreting Table 4.9, note that the class averages may not
reflect the time allocation for a given student. The within-class
standard deviations are of some assistance in assessing the variability
among students. In some cases, the standard deviations were considerably
greater Clan the means; this situation arose when most students in the
class had almost zero time allocated to a given area while a fey students
had large allocations. Content categories with relatively small mean
times were characterized by these positively skewed distributions. On
the other hand, content categories where time was allocated to all
students tended to be characterized by negatively skewed distributions.
The tail of the distribution often resulted from student absenteeism.
Between class variability was, in general, greater than that within classes.
The distribution of time allocated to reading in various setting
combinations is presented in Table 4.10. The three dichotomous setting
variables (adult involvement, pacing, and group size) yield eight
three-way combinations, shown in columns 1 through 8. The marginal dis-
tributions for the three setting variables are presented in columns 9
through 14. With two exceptions, over 80 percent of time allocated to
reading had direct adult involvement. The exceptions, Classes 2 and 9,
had 69 and 44 percent respectively.
The allocations of time by pacing and group size were not consistent
across classes. On the average, students spent about 65 percent of the
time allocated to reading instruction in seatwork and about 55 percent
of the time in large groups. However classes varied remarkably on both
of these setting facets. For the pacing facet, Classes 4, 5 and 9 used
Table 4.10
Means and standard deviations for tine allocated to setting combinations during reading instruction in nine Grade 2 classes.
The entries are class averages reported in minutes per student accumulated over 40 days of instruction.
I
Class
ASL
A
S
H I
A
0L
A N
0 S
H L
N NS 0H L
AH
N S 0 L HTbtal TineAllocated tcReading
1903(726)
1 1538
i (860)
225
(385)
844
(446)
0
(0)
0 0 0 3510
(0) (o) (o) (232)
0
(0)
2441
(169)
1069
(83)
1128
(1111)
2382
(1303)
3510(232)
2386
(260
1796
1 (109)
611
(199)
218
(31)
188
(123)
534
(60)
i
619 1 0
(103) (0) i
3010
(163)
1343
(93)
2904
(369)
1447
(275)
1803
(164)
2547
(164)
4350
(244)
3893
(111)
i 4171
(58)
1108
(121)
907
(77)
297(44)
6
(10)
155
(28)
13
(11)
3326
(250)
471
(68)
1614
(183)
2183(187)
2453(197) I
1344
(118)
-i
34
(5)
3797(306)
2833(241)4
2402
(265)
! 0
1 (0)
3
(10)
34
(5)
394
(115)
0
(0)
0
(0)
0
(0)
2439(270)
394
(115)2796(236)
37(11)
2799(239)
51041(144)
I
i 706i (299)
7
(16)
210(62)
68
(60)
363
(259)
7
(17)
25
(29)
1965(423)
463
(305)
2178(560)
250(69)
1124
(184)
1304 1 2428
(436) (588)
6561(258)
1120
(359)
358
(120)
1061
(74)
419
(203)
171
(133)
0
(0)
42
(12)
3101(218)
632
(73)
2271
(169)
1461
(125)
1338
(576)
2394 3733
(548) (261)
7610
(90)
, 351
(76)
1624
(17o)
925(92)
57
(44)
177
(38)
45(27)
98
(26)
3510(355)
377
(60)
1195(147)
2692(241)
2336
(243)
1550(143)
3886(368)
8116
(154)
785 533
, (55) (19o)
1829
(111)
391
(128)
350 9
(44) I (23)
119
(30)
3263
(295)
869
(128)
1641
(102)
2491(186)
1049(246)
3083
(186)
4132
(245)
9304
(354)
1464 260
(254) (178)
602(328)
790(834)
2446 84
(701) (54)
49
(34)
2630
(135)
3369
(254)
5004
(395)
996
(157)
1438
(1415)
4562(1304)
5999(336)
Average ofclass means
(unweighted)
802
(673)
909 525
(609) , (534)
737
(551)
289 450 102 38
(246) (772) (201) (44)
2973(527)
879(1005)
2449(1111)
140(931)
1719(659)
2133(1283)
3852
(1009)
101
NotesThe column headings represent combinations of the three setting variables;
adult involvement (A = adult directly involved, N = adult not directly involved),
pacing (S = seatwork, 0 = non seatwork), and group size (L = small group size, H = large group size).
These data are based on teacher log reports prorated for 40 days of instruction. The row totals correspond to 40 times
the average minutes per student per day allocated to reading instruction reported in Table 4.1.
Standard deviations are shown in parentheses.
102
-77-
seatwork more than 80 percent of the time; while Classes 1, 2, and 6
and Classes 3, 7 and 8 used seatwork approximately 65 and 40 percent
of the time respectively. For the group size facet, Class 4 used small
groups exclusively; Classes 1, 2, 3, 5, 6 and 7 used small groups about
half of the time and Classes 8 and 9 used small groups for approximately
one quarter of the time allocated to reading.
When the combined settings were examined, no single allocation
pattern characterized all of the classes. Although the distribution
of allocated ime to setting combinations differed from class to class,
the NOL and NOH setting combinations were used least by almost all
classes. Class 4 allocated substantial amounts of time to only two
setting combinations (ASL and NSL); Class 1 used only the four setting
combinations including adult directly involved; the remaining classes
allocated substantial amounts of time to five or more setting combinations.
The single setting combination with the most allocated time was large
group seatwork with an adult directly involved. On the average ASH
accounted for 25 percent of the time allocated to reading; however,
this setting combination ranked highest in only three of the nine classes.
The setting combinations which, on the average, ranked second and third
in terms of amount of allocated time were ASL (21 percent) and AOH
(19 percent). Again the variation between classes on time allocated to
setting combinations was much greater than the variation within classes.
Allocated time data did not necessarily reflect the amount of time
students spent engaged in on-task behavior. Table 4.11 presents some
information on student engagement during reading instruction. Columns
A, B, and C, of this table show the means and standard deviations for
103
Table 4.11
Mems, standard deviations and intercorrelations for estimates of student engagement in six Grade 2 classes.
Class
Number ofStudents
ATeacherratingsof StudentAttentive-ness
B
AdjustedTeacher Ratingsof StudentAttentiveness
C
ObservedEngaementRate'
D
AcademicStatus
rBC
rBD
rCD
1 16.6
(.228 )d
.44
(.14)
.8(.05)
160
(91)5: .70 .47
2 18.86
(.08)
.49
(.04)
.85
(.14)
139
(77)35 .57 .41
3 20.58
(.16)
.25
(.07)
.34
(.03)
36
(35) 79 .42 .28
4 14.69
(.14)
.59
(.12)
.75
(.10)
147
(95)-.08 .42 .33
5 26.68
(.18)
.41
(.11)
.52
(.07)
333(66)
-:30 .80 -.29
6 18.62
(.22)
.51
(.18)
.44
(.09)
77(54)
.39 .58 .42
Allstudentspooled
11268
(..19) (.15) (.20)
114(81)
42 .58 35__J
a The teacher ratings of student attentiveness are described on page 37.
b The adjusted teacher ratings of student attentiveness were obtained by multiplying the teacher ratings
of student attentiveness by a different constant for each class. The mean of the adjusted ratings equals
the mean class engagement determined by one day of observation in each class (see page 37).
The observed engagement rate was calculated by taking the ratio for each student of engaged time in reading
(direct observation) and allocated time in reading (observer logs) (see page 38).
d Standard deviations are shown in parentheses.
10410t
-79-
different engagement indices. The average teacher ratings of student
attentiveness (column A) were, with one exception, higher than either
of the averages of the indices based on independent observation pro-
cedures (columns B and C). The standard deviation (within class) of
the teacher ratings (column A) was also greater, with only one exception,
than those for columns B and C. With the exception of Classes 2 and 4,
there was moderate agreement between columns B and C. The correlation
between the adjusted teacher ratings of student attentiveness and the
observed engagement rates varied considerably for the six classes.
Since the number of students within classes was small, only one of these
correlations (Class 3) appeared to be inordinately large. Thus with the
exception of Class 3, the adjusted teacher ratings did not correlate
consistently and positively with the observed engagement rates. When
all students were pooled, the correlation was positive and moderate
in size. Since this correlation coefficient is affected by the fairly
large between-class differences, its size is not surprising.
On the other hand, the correlations hetween the adjusted teacher
ratings of student attentiveness and academic status were all positive
and large. This could be interpreted in several ways. It may be that
aptitude and student attentiveness were strongly related; or more
likely, that the teachers' ratinys of student attentiveness were strongly
biased by teacher perceptions of student aptitude. In any case, the
within-class correlations in the table were not affected by the adjust-
ment procedure, since the adjustment coefficient was a conetant within
a given class. The observed engagement rates, on the other hand, were
derived without reference to students' academic status. If the observed
-80-
engagement fates are reasonably a' curate, this table points out that
teacher ratings of student attentiveness were strongly related to
academic status, and not to observed engagement rates. In addition,
observed engagement rates were only weakly correlated with academic
status.
Students were engaged in on-task behavior about one half of the
time allocated to reading. This figure varied considerably from class
to class.
Instructional Time and Student Achievemer.t
The conceptual and methodological issues concerning the relation-
ship between instructional time and student : chievement are very complex.
A relatively large number of models and analytic procedures could be
used to investigate the relationship. Several exploratory analyses have
been carried out on this data set. Within-class regression analyses
were performed, but the small number of students per class made the
results unstable, and therefore difficult to interpret. raw regression
weights varied remarkably from class to class and also within class when
one or more students were removed. In addition, several interaction
terms and alternative definitions of time variables were included in
the model, with varying degrees of success. Not all of these analyses
are included in this report. Those which are included represent only
one relatively narrow approach to the problem.
In every case, achievement scores have been corrected for guessing;
however, no other transformations affecting the score intervals have
been made. In some cases, severe ceiling effects have been reduced by
trimming subjects rather than by transforming the data in some non-linear
in
-81-
fashion. (Other instances of trimming subjects are discussed as they
occur.) The time variables are reported in minutes. For allocated time
from teacher logs and engaged time from direct observation, the raw data
were recorded in minutes. In the case of engaged time estimated from
teacher logs, the allocated times from teacher logs were multiplied by
an observed engagement rate.
In general, results of multiple regression an .e presented for
achievement (post) regressed on achievement (pre), academic status, and
two time variables. One of the time variables represents time in the con-
tent category which matches the content covered by the achievement test;
the second time variable represents time in a content area which is
logically related to the content area covered by the achievement test.
Results of an analysis pooling subjects are followed by results of an
analysis where subjects were pooled within class. For analyses of data
collected over the A-B period, regression runs were made using allocated
times, and rerun using engaged times estimated from allocated times. In
all analyses, estimated engaged times were ca';ulated by taking the product
of allocated times from teacher logs and observed engagement rates.
Results for data collected during the OA -OB period are presented
first, followed by results for data collected during the A-B period.
Results from the 0A-08 keriod. Classes 1 through 6 comprised the obser-
vation subsample. All results in this section are based on data from
these six classes. The 0A-08 period was approximately two weeks in
length fcr each class. Pre and post achievement tests were administered
and engaged time was assessed by direct observation for all of the
intervening in-school instruction. Means and standard deviations for
10
-82-
the achievement measures and engaged time in matched content categories
are presented in Table 4.12. During the 0A-08 period, teachers were
asked to allocate time to instruction in compo. i words. Some teachers
responded by allocating small amounts of time to compound words, while
others allocated practically none. As a result, there were small
amounts of engaged time and also little variance in the amount of
engaged time in compound words. Note from Table 4.12 that, given the
short two-week time period, there was a small gain in achievement in
compound words. Five of the classes had gains of less than one point
and the sixth class showed a small loss over the two-wEek period.
The other two content areas covered in Table 4.12 showed slight
losses. For both decoding-long vowels and decoding (total) only two
of the six classes showed non-negative gains. Decoding-long vowels
is a relatively narrow content area in which moderate to small amounts
of engaged time were recorded. Decoding, on the owner hand, is a
broad content area (including decoding-long vowels and eleven other
specific content categories) in which relatively large amounts of engaged
time were observed.
Compare the variation within class at OB with that at OA for each
of the measures. In 9 of the 18 situations in Table 4.12 the variation
was less at OB than at OA. The major cause of this phenomenon was a
severe ceiling effect in all three measures. The combined impact of the
ceiling effect on all 0A-08 measures and the small amount of engaged
time in two of the matched content categories made time-achievement
analyses for the 0A-08 period extremely hazardous. No further analyses
of decoding-long vowels or decoding (total) were attempted.
Class
Table 4.12
Means and standard deviations for achievement measures and engaged time in matched content categories over the OA -0B period for six
1 This is the only speeded test included in the report; all others had liberal
2 This total score does not contain the speeded subtest.
Ome limits.123
Examination of the frequency distributions revealed serious ceiling
effects for most of the measures.
The quantities of allocated time varied widely from one content
category to another. However the content categories represented in
Table 4.14 also varied in size and in several cases overlap in coverage.
For example, decoding (total) included decoding-long vowels and decoding'
consonant substitution as well as other areas of decoding. For a par-
ticular content category there was considerable variation both within
and between classes. In most cases the variation between classes was
greater than that within classes.
Regression analyses were carried out on several of the content areas
represented in Table 4.14. In general, areas where ceiling effects were
least serious were chosen for analysis. In each case, a frequency dis-
tribution of the pretest was examined and cases were trimmed, and
students with missing data were deleted before analysis. After reducing
the number of subjects (in some cases the reduction was substantial),
an analysis where subjects were pooled and an analysis where subjects
were pooled within class were carried out on the remaining students from
the nine classes in the sample. In these analyses achievement (post)
was regressed on achievement (pre), academic status, allocated time in
the matched content area and allocated time in a logically related
content area.
Two parallel analyses were conducted using estimated engaged time
rather than allocated time. Engaged time was estimated by multiplying
allocated time by the engagement rate which was obtained during the
direct observation. Since only six of the nine classes were observed,
engagement rates were available for some students but not for others.
Iwo
-92-
Therefore the sample size for the analyses using estimated engaged time
was invariably smaller (representing the omission of three classes)
than for the analyses using allocated time.
Tables 4.15 and 4.16 present results for regression analyses of
achievement in compound words on allocated time variables. As outlined
above, two time variables were entered in the regression equation: the
time allocated to compound words (matched category) and the time allo-
cated to other word structure (a logically related content area). After
trimming for missing data and for ceiling effects, 79 of the 152 students
remained in the file.
The four independent variables accounted for 30 percent of the
variance when subjects were pooled and 20 percent when subjects were
pooled within class. In both cases, academic status accounted for, by
far the greatest portion, of the explained variance. The pretest and
both time variables were relatively weak contributors to the posttest
variation. However, note that when subjects were pooled within class
(Table 4.16), allocated time in compound words had a large raw coefficient,
had a substantial partial correlation with the posttest, and was a much
stronger contributor than the posttest.
Tables 4.17 and 4.18 present results for similar analyses except
that estimated engaged time was used rather than allocated time. These
analyses were similar to those reported for allocated time. The four
independent variables accounted for 28 percent (subjects pooled) and 25
percent (subjects pooled within class) of the variance in the posttest.
Academic status was the strongest contributor in both analyses while the
pretest was relatively weak in both. When subjects were pooled, estimated
I 9..,,,:
Table 4.15
Achievement in compound words (post) regressed on achievement in compound words (pre),
academic status and measures of allocated time (from teacher logs) over the A-B interval(subjects pooled, N = 79).
I DESCRIPTIVE INFORMATION
Variable
StandardCorrelations
Mean Deviation 1 2 3 4 5
1
1 Compound Words (Post) 5.0 4.5
2 Compound Words (Pre) 1.7 2.7 0.30
3 Academic Status 62.4 46.5 0.53 0.46
4 Allocated Time 48 57 0.23 0,08 0.23
Compound Words0.3? 0.19 0.35 0.71
5 Allocated Time 155 158
Other Word Structure
II SUMMARY OF MULTIPLE REGRESSION ANALYSIS
Multiple R 0.55
Multiple R Squared 0.30
Std. Error of Est. 3.86
Constant 1.45
(p = 0.00)a
Beta, B, Stand. Partial
Stand. Raw Error F Corr.
Independent Coef- Coef- Of To Proba- With
Variable ficient ficient B Delete bilitya Dep.
Compound Words (Pre) 0.0663 0.1112 0.1835 0.37 0.55 0.07
Academic Status 0.4485 0.0435 0.0111 15.38 0.00 0.41
Allocated Time 0.0389 0.0031 0.0110 n.08 0.77 0.03
Compound Words
Allocated Time 0.1187 0.0034 0.0041 0.69 0.59 0.10
Other 6Jrd Structure
NoteTo provide complete data and to reduce ceiling effects a relatively large number of cases
were trimmed from the sample. Data on 79 students (out of 152) representing nine classes
were analyzed.
a Probabilities rounded to two decimal places.
2U
Table 4.16
Achievement in compound words (post) regressed on achievement in compound words (pre),academic status and measures of allocated time (from teacher logs) over the A-Binterval (subjects pooled within class, N = 79)
I DESCRIPTIVE INFORMATION
Standard
Variable Meana Deviation 1
Correlations
2 3 4 5
1 Compound Words (Post) 0.0 4.1
2 Compound Words (Pre) 0.0 2.5 0.24
3 Academic Status 0.0 39.7 0.47 0.40
4 Allocated Time 0 38 0.36 0.35 0.37
Compound Words0.33 0.26 0.48 0.72
5 Allocated Time 0 101
Other Word Structure
II SUMMARY OF MULTIPLE REGRESSION ANALYSIS
Multiple R 0.51
Multiple R Squared 0.26
Std. Error of Est. 3.64
Constant 0.00
(p = 0.00)b
Beta, B, Stand. Partial
Stand. Raw Error F Corr.
Independent Coef- Coef- Of To Proba- With
Variable ficient ficient B Delete bilityb Dep.
compound Words (Pre) 0.0068 0.0113 0.1868 0.00 0.95 0.01
Academic Status 0.3943 0.0409 0.0124 10.79 0.00 0.36
Allocated Time 0.2262 0.0246 0.0150 2.35 0.13 0.18
Compound Words
Allocated Time -0.0217 -0.0009 0.0062 0.02 0.88 -0.02
Other Word Structure
NoteTo provide complete data and to reduce ceiling effects a relatively large number of cases
were trimmed from the sample. Data on 79 students (out of 152) representing nine classes
were analyzed.
a The means of within-class deviation scores are zero.
b Probabilities rounded to two decimal places.
Table 4.17
Achievement in compound words (post) regressed on achievement in compound words (pre),
academic status and measures of estimated engaged time (from teacher logs) over the A-B
interval (subjects pooled, N = 56).
I DESCRIPTIVE INFORMATION
Variable
CorrelationsStandard
Mean Deviation 1 2 3 4 5
1 Compound Words (Post) 5.7 3.9
2 Compound Words (Pre) 1.7 2.8 0.28
3 Academic Status 67.9 46.5 0.50 0.47
4 Est. Eng. Time 23 22 0.14 0.10 0.17
Compound Words0.38 0.26 0.43 0.53
5 Est. Eng. Time 76 79
Other Word Structure
II SUMMARY OF MULTIPLE REGRESSION ANALYSIS
Multiple R 0.53
Multiple R Squared 0.28
Std. Error of Est. 3.46
Lonstant 2.76
(p = 0.00)a
Beta, B, Stand. Partial
Stand. Raw Error F Corr.
Independent Coef- Coef- Of To Proba- With
Variable ficient ficient B Delete bilitya Dep.
Compound Words (Pre) 0.0460 0.0634 0.1856 0.12 0.73 0.05
Academic Status 0.3849 0.0325 0.0122 7.09 0.01 0.35
Est. Eng. Time -0.0514 -0.0091 0.0249 0.13 0.72 -0.05
Compound Words
Est. Eng. Time 0.2256 0.0113 0.0077 2.16 0.14 0.20
Other Word Structure
NoteTo provide complete data and to reduce ceiling effects a relatively large number of cases
were trimmed from the sample. Data on 56 students (out of 112) representing six classes
were analyzed.
a Probabilities rounded to two decimal places.
.2,
Table 4.18
Achievement in compound words (post, regressed on achievement in compound words (pre),academic status and measures of estimated engaged time (from teacher logs) over theA-B interval (subjects pooled within class, N = 56).
I DESCRIPTIVE INFORMATION
Standard
Variable Meana Deviation 1
Correlations
2 3 4 5
1 Compound Words (Post) 0.0 3.6
2 Compound Words (Pre) 0.0 2.6 0.17
3 Academic Status 0.0 40.7 0.46 0.38
4 Est. Eng. Tine 0 15 0.29 0.35 0.24
Compound Words0.34 0.22 0.45. 0.52
5 Est. Eng. Time 0 57
Other Word Structure
II SUMMARY OF MULTIPLE REGRESSION ANALYSIS
Multiple R 0.50
Multiple R Squared 0.25
Std. Error of Est. 3.26
Constant 0.00
(p = 0.00)b
Beta, B, Stand. Partial
Stand. Raw Error F Corr.
Independent Coef- Coef- Of To Proba- With
Variable ficient ficient B Delete bilityb Dep.
Canpound Words (Pre) -0.0652 -0.0917 0.1926 0.23 0.64 -0.07
Academic Status 0.4088 0.0365 0.0129 8.06 0.01 0.37
Est. Eng. Time 0.1718 0.0418 0.0359 1.35 0.25 0.16
Compound Words
Est. Eng. Time 0.0790 0.0050 0.0098 0.26 0.62 0.07
Other Word Structure
NoteTo provide complete data and to reduce ceiling effects a relatively large number of cases
were trimmed from the sample. Data on 56 students (out of 112) representing six classes
were analyzed.
a The means of within -class deviation scores are zero.
b Probabilities rounded to two decimal places.
-97-
engaged time in compound words had a large coefficient, a relatively
large partial correlation with the posttest, and was a stronger contri-
bution than the pretest. This result indicates that when class mean
differences were removed, students who spent more time engaged in com-
pound words achieved more in compound words than students who spent less
time engaged in compound words.
The results of the analyses on achievement in compound words were
dominated by the academic status variables. For the time variables, the
results were stronger in analyses where subjects were pooled within class
than for analyses where subjects were pooled. In the latter type of
analysis estimated engaged time uniquely accounted for four percent of
the variance in the posttest.
Similar analyses were carried out on time and achievement in decoding-
long vowels. Before analysis, subjects were trimmed from the file to
eliminate cases with missing data and to reduce ceiling effects. All
students with scores outside the range -5 to 17.on the pretest were
dropped from the file. After trimming, 91 of the 152 students remained
in the file.
Tables 4.19 and 4.20 present analyses where achievement in decoding-
long vowels (post) was regressed on achievement in decoding-long vowels
(pre), academic status, allocated time in decoding-long vowels and allo-
cated time in other decoding. The pattern of correlations among the
variables was similar when the matrix for subjects pooled (Table 4.19)
is compared to the matrix for subjects pooled within class (Table 4.20).
The pretest, posttest and academic status variables were highly inter-
correlated in both tables. Allocated time in long vowels was weakly but
LJO
Table 4.19
Achievement in long vowels (post) regressed on achievement in long vowels (pre),academic status and measures of allocated time (from teacher logs) over the A-B interval(subjects pooled, N = 91).
I DESCRIPTIVE INFORMATION
Standard
Variable Mean Deviation 1
Correlations
2 3 4 5
1 Long Vowels (Post) 10.7 6.7
2 Long Vowels (Pre) 7.1 5.4 0.76
3 Academic Status 65.4 46.1 0.73 n.76
4 Allocated Time 304 175 0.14 -0.01 -0.06
Long Vowels41.21 -0.32 -0.24 0.25
5 Allocated Time 783 258
Other Decoding
II SUMMARY OF MULTIPLE REGRESSION ANALYSIS
Multiple R 0.82
Multiple R Squared 0.68Std. Error of Est. 3.90
Constant 3.10
(p = 0.00)a
IndependentVariable
Beta,
Stand.
Coef-ficient
B,
RawCoef-
ficient
Stand.ErrorOfB
F
To
Delete
Proba-bilitya
Partial
Corr.With
Dep.
Long Vowels (Pre) 0.4367 0.5422 0.1205 20.24 0.00 0.44
Academic Status n.3876 0.0565 0.0138 16.86 0.00 0.4n
Allocated Time 0.1929 0.0074 0.0024 9.19 0.00 0.31
Long Vowels
Allocated Time -0.1102 -0.0029 0.0017 2.71 0.10 -0.17
Other Decoding
NoteTo provide complete data and to reduce ceiling effects a relatively large number of cases
were trimmed from the sample. Data on 91 students (out of 152) representing nine classes
were analyzed.
a Probabilities rounded to two decimal places.
1.31
Table 4.20
Achievement in long vowels (post) regressed on achievement in long vowels (pre),academic status and measures of allocated time (from teacher logs) over the A-B interval(subjects pooled within class, N = 91).
I DESCRIPTIVE INFORMATION
Standard
Variable Meana Deviation 1
Correlations
2 3 4
1 Long Vowels (Post) 0.0 5.4
2 Long Vowels (Pre) n.o 4.8 0.74
3 Academic Status 0.0 38.2 0.66 0.76
4 Allocated Time 0 117 0.02 -0.12 -0.08
Long Vowels-0.21 -0.?4 -0.22 0.22
5 Allocated Time 0 134
Other Decoding
II SUMMARY OF MULTIPLE REGRESSION ANALYSIS
Multiple R 0.76
Multiple R Squared 0.58
Std. Error of Est. 3.53
Constant 0.00
(p = 0.00)b
5
Beta, B, Stand. Partial
Stand. Raw Error F Corr.
Independent Coef- Coef- Of To Proba- With
Variable ficient ficient B Delete bilityb 12ept__
Long Vowels (Pre) 0.5602 0.6198 0.1187 27.24 0.00 0.4q
Academic Status 0.2384 0.0334 0.0150 4.99 0.03 0.23
Allocated Time 0.1145 0.0052 0.0033 2.57 0.11 0.17
Long Vowels
Allocated Time -0.0483 -0.0019 0.0028 0.44 0.52 -0.07
Other Decoding
NoteTo provide complete data and to reduce ceiling effects a relatively large number of.cases
were trimmed from the sample. Data on 91 students (out of 152) representing nine classes
were analyzed.
a The means of within-class deviation scores are zero.
b Probabilities rounded to two decimal places.
132
-100-
positively correlated with the posttest, and slightly negatively corre-
lated with the pretest and academic status. Allocated time in other
decoding was negatively correlated with all three test scores.
In the regression analyses, the four independent variables accounted
for 68 percent (subjects pooled) and 58 percent (subjects pooled within
class) of the posttest variance. Although the analyses were dominated
by the pretest, allocated time in decoding-long vowels had a positive
regression weight. The effect was stronger for the analyses where
subjects were pooled, but in both analyses the partial correlation
between allocated time in decoding-long vowels and achievement (post)
was quite high (0.31 and 0.17). For the analyses presented in Tables
4.19 and 4.20, allocated time in decoding-long vowels accounted uniquely
for 3 and 1 percent of the posttest variance respectively. Time allo-
cated to the other decoding areas yielded a negative weight in both
analyses. In the analysis where subjects were pooled the effect was
quite strong though much weaker than the effect of time allocated to
decoding-long vowels. Since the zero order correlation between the two
time variables was positive, the negative weight for time allocated to
other decoding was somewhat difficult to explain.
Parallel analyses were computed using estimated engaged time rather
than allocated time. The sample on which these analyses were carried
out contained 66 students from the 6 classes for which estimates of
engaged time were available. The results for subjects pooled and subjects
pooled within class are presented in Tables 4.21 and 4.22 respectively.
The pattern of intercorrelations among the test scores similar to those
presented in Tables 4.19 and 4.20. However the correlations among the
133
Table 4.21
Achievement in long vowels (post) regressed on achievement in long vowels (pre),
academic status and measures of estimated engaged time (from teacher logs) over theA-B interval (subjects pooled, N = 66).
I DESCRIPTIVE INFORMATION
StandardCorrelations
Variable Mean Deviation 1 2 3 4 5
1 Long Vowels (Post) 11.6 6.7
2 Long Vowels (Pre) 8.1 5.5 0.76
3 Academic Status 71.4 48.0 0.70 0.74
4 Est. Eng. Time 150 90 0.24 0.03 0.16
Long Vowels-0.01 -0.09 0.21 0.47
5 Est. Eng. Time 389 259
Other Decoding
II SUMMARY OF MULTIPLE REGRESSION ANALYSIS
Multiple R 0.82 (p = 0.00)a
Multiple R Squared 0.67
Std. Error of Est. 4.02
Constant 2.08
Beta, B, Stand. Partial
Stand. Raw Error F Corr.
Independent Coef- Coef- Of To Proba- With
Variable ficient ficient B Delete bilitya 1:p.___
Long Vowels (Pre) 0.5071 0.6237 0.1458 18.30 0.00 0.48
Academic Status 0.3165 0.0444 0.0169 6.89 0.01 11.32
Est. Eng. Time 0.2374 0.0178 0.0(163 7.94 0.01 0.34
Long Vowels
Est. Eng. Time -0.1407 -0.0037 0.0(124 2.41 0.12 -0.20
Other Decoding
NoteTo provide complete data and to reduce ceiling effects a relatively large number of cases
were trimmed from the sample. Data on 66 students (out of 112) representing six classes
were analyzed.
a Probabilities rounded to two decimal places.
134
Table 4.22
Achievement in long vowels (post) regressed on achievement in long vowels (pre),
academic status and measures of estimated engaged time (from teacher logs) over the A-B
interval (sub ects pooled within class, N = 66).
I DESCRIPTIVE INFORMATION
Standard
Variable Meana Deviation 1
Correlations
2 3 4 5
1 Long Vowels (Post) 0.0 5.3
2 Long Vowels (Pre) 0.0 5.1 0.76
3 Academic Status 0.0 40.6 0.64 0.75
4 Est. Eng. Time 0 74 0.08 -0.01 0.04
Long Vowels0.14 0.08 0.16 0.67
5 Est. Eng. Time 0 94
Other Decoding
II SUMMARY OF MULTIPLE REGRESSION ANALYSIS
Multiple R 0.77
Multiple R Squared 0.59
Std. Error of Est. 3.53
Constant 0.00
(p = 0.00)b
Beta, B, Stand. Partial
Stand. Raw Error F Corr.
Independent Coef- Coef- Of To Proba- With
Variable ficient ficient B Delete bilityb Der.
Long Vowels (Pre) 0.6327 0.6656 0.1314 25.67 0.00 0.54
Academic Status 0.1617 0.0213 0.0166 1.65 0.20 0.16
Est. Eng. Time 0.0712 ( 0051 0.0079 0.42 0.53 0.08
Long Vowels
Est. Eng. Time 0.0177 0.0010 0.0064 0.03 0.87 0.02
Other Decoding
NoteTo provide complete data and to reduce ceiling effects a relatively large number of cases
were trimmed from the sample. Data on 66 students (out of 112) representing six classes
were analyzed.
a The means of within-class deviation scores are zero.
bProbabilities rounded to two decimal places.
1.35
-103-
test scores and time variables changed quite markedly. The correlation
between estimated engaged time in long vowels and estimated engaged time
in other decoding increased to 0.47 in Table 4.21 and 0.67 in Table 4.22.
Where there were negative correlations between allocated times and test
scores +here were essentially zero or positive correlations between
estimated engaged times and test scores.
In the regression analysis where subjects were pooled there was
a positive relation 'lip between estimated engaged time in decoding -loig
vowels and the posaest. In the same analysis estimated engaged time
in the other areas of decoding entered negatively. Both times have
sizeable partial correlations with the posttest. When subjects were
pooled within class (Table 4.22) neither time variable had much impact
on the posttest.
In the analyses of achievement in decoding-long vowels the pretest
dominated the relationships. However time in the matched category was
positively related to the posttest, especially in analyses where subjects
were pooled. A negative relationship occurred between achievement in
decoding-long vowels and time in the other decoding areas when subjects
were pooled but the relationship disappeared when subjects were pooled
within class.
In addition to analyses of relatively narrow content categories
(compotnd words and decoding-long vowels) regressions were run on total
decoding which represents a much broader content category and includes
much greater amounts of allocated time. In these analyses, time allocated
to decoding and all other time allocated to reading were used as inde-
pendent variables. After trimming the samo;e to eliminate missing data
136
-104-
and to alleviate ceiling effects 103 cases remained for analyses.
The results for the allocated time measures are presented in Tables
4.23 and 4.24. Note that the correlations among the test scores were
extremely high and that time allocated to the matched category correlates
negatively with the posttest. Nevertheless the weight for time allocated
to decoding was positive in the analysis where subjects were pooled.
This weight goes slightly negative in the analysis where subjects were
pooled within :lass. In niether case was the effect very strong.
However, when subjects were pooled within class ( Table 4.24) the time
allocated to other reading had a lar...;,2 tsitive weight and a substantial
pat ,a1 correlation with posttest.
When parallel analyses were run using estimated engaged time (Tables
4.25 and 4.26), the negative zero order correlations disappeared. These
analyses were similar to the analyses usirj allocated time. The result
for estimated engaged time (wnen subjects were pooled within class)
was repeated.
The test score variables in the analyses o. decoding were very
highly correlated. This condition dominated the analyses. The effect
of the matched time category was weak and inconsistent, sometimes yield-
ing positive weights sometimes negative weights. The time in other
reading howev:r did have a cohsistent positive relationship to posttest
when subjects were pooled within class.
The broadest content category available for analysis was total read-
ing. All of the reading subscores (exclusive of speeded subtests) were
added to form a total reading score containing 301 items (see Table 4.14).
After trimming to reduce the ceiling effect and eliminate missing data,
13.
Table 4.23
Achievement in decoding (post) regressed on achievement in decoding (pre), academicstatus and measures of allocated time (from teacher logs) over the A-B interval(suItlecapooled, N = 103).
I DESCRIPTIVE INFORMATION
Standard
Variable Mean Deviation 1
Correlations
2 3 4 5
1 Decoding (Post) 45.4 21.6
2 Decoding (131) 34.8 19.7 0.90
3 Academic Status 89.6 65.3 0.88 0.93
4 Allocated Time 1074 350 -0.16 -0.24 -0.19
Decoding0.02 -0.05 0.01 0.23
5 Allocated Time 1802 316
Other Reading
II SUMMARY OF MULTIPLE REGRESSION ANALYSIS
Multiple R 0.91
Multiple R SquP-ed 0.83
Std. Error of tJt. 9.14
Constant 5.19
(p * 0.00)a
Beta, B, Stand. Partial
Stand. Raw Error F Corr.
Ineependent Coef- Coef- Of To Proba- With
Variable ficient ficient B Delete bilitya, 12eL_____
Academic Status 0.2985 0.0940 0.0442 4.53 0.03 0.25
Est. Eng. Time 0.0853 0.0053 0.0045 1.42 0.24 0.14
Decoding
Est. Eng. Time 0.0104 0.0005 6.0034 0.02 0.88 0.02
Other Reading
NoteTo provide complete data and to reduce ceiling effects a relatively large number of cases
were trimed from the sample. Data on 72 students (out of 112) representing six classes
were analyzed.
a Probabilities rounded to two decimal places.
1.10
Table 4.26
Achievement in decoding (post) regressed on achievement in decoding (pre), academicstatus and measures of estimated engaged time (from teacher logs) over the A-B interval(subjects pooled within class, N = 72).
5 Est. Engaged Time 64 1509 723 (328) 0.34 0.27 0.26 0.53
Reading
a Standard deviations, calculated when students were pooled within class, are shown in parentheses.
b Correlations, computed when students were pooled within class, are shown below the major diagonal.
relationships were somewhat stronger between posttest and estimates of
engaged time than between posttest and allocated time. In no case did
a time variable account uniquely for more than one percent of the variance
in total reading. Given that the pre and posttest were so highly corre-
lated, this situation was not unexpected.
The analyses presented to this point all involved achievement
scores resulting from testing sessions which provided plenty of time for
most students to complete the items. The final analyses to be presented
deal with a speeded test of decoding-consonant sounds. This twenty-four
item test proved to be very easy for some classes and very difficult for
others (see Table 4.14). In fact, students in some classes got almost
all the items correct at the pretest. As a result the test operated
as a speeded test in some classes but had some the characteristics of a
power test ;n other classes. The class means and standard deviations
attest to this fact. Subjects were trimmed from the data to reduce the
ceiling effect and to eliminate wissing data leaving 105 students for
analyses using allocated time variables. Tables 4.28 and 4.29 present
the results for speed in decoding consonant sounds (post) regressed
on speed in decoding consonant sounds (pre), academic status, time
allocated to decoding consonant sounds and time allocated to other
decoding. Academic status was as highly correlated with the posttest
as with the pretest in both tables. The matched time variable corre-
lated negatively with test scores in both tables whereas time
allocated to other decoding correlated about zero with the test scores.
In the analyses where subjects were pooled, time allocated
to decoding consonant sounds showed a strong negative relationship
with the posttest. When subjects were pooled within class, the
110
Table 4.28
Speed in decoding consonant sounds (post) regressed on speed in decoding consonantsounds (pre), academic status, and measures of allocated time (from teacher logs) over
Academic Status 0.4312 0.0428 0.0091 21.97 0.00 0.42
Allocated Time -0.2194 -0.0091 0.0026 12.08 0.00 -0.33
Consonant Sounds
Allocated Time -0.0324 -0.0007 0.0013 0.28 0.60 -0.05
Other Decoding
NoteTo provide complete data and to reduce ceiling effects a relatively large number of cases
were trimmed from the sample. Data on 105 students (out of 152) representing nine classes
were analyzed.
a Probabilities rounded to two decimal places.
Table 4.29
Speed in decoding consonant sounds (post) regressed on speed in decoding consonantsounds (pre), academic status, and measures of allocated time (from teacher logs) overthe A-B interval (subjects pooled within class, N = 105).
I DESCRIPTIVE INFORMATION
Standard
Variable Meana Deviation 1
Correlations
2 3 4 5
1 Consonant Sounds (Post) 0.0 5.8
2 Consonant Sounds (Pre) 0.0 4.4 0.71
3 Academic Status 0.0 57.3 0.70 0.70
4 Allocated Time 0 103 -0.41 -0.44 -0.38
Consonant Sounds-0.05 0.02 -0.07 0.39
5 Allocated Time 0 156
Other Decoding
II SUMMARY OF MULTIPLE REGRESSION ANALYSIS
Multiple RMultiple R SquaredStd. Error of Est.Constant
Academic Status 0.37(7 0.0381 0.0092 17.01 0.00 0.38
Allocated Time -0.0890 -0.0051 0.0045 1.23 0.27 -0.11
Consonant Sounds
Allocated Time 0.0046 0.0002 0.0027 0.00 0.95 0.
Other Decoding
NoteTo provide complete data and to reduce ceiling effects a relatively large number of cases
were trimmed from the sample. Data on 105 students (out of 152) representing nine classes
were analyzed.
a The means of within-class deviation scores are zero.
b Probabilities rounded to two decimal places.
-114-
relationship was considerably weaker but still negative. Allocated
time in other decoding had weights approximately equal to zero in both
analyses. On examination of the class means, it became clear that most
of the negative effect was produced by Classes 8 and 9 which had near
zero or negative test score gains and by far the largest amounts of
allocated time (see Table 4.14).
When parallel analyses were run using estimated engaged time, Classes
7, 8 and 9 were dropped since no observation data were available for them.
Results of these analyses are contained in Tables 4.30 and 4.31. The
correlations between estimated engaged time in decoding consonant sounds
and the test scores were essentially zero when subjects were pooled but
remained negative when subjects were pooled within class. Estimated
engaged time in her decoding was positively correlated with the test
scores in both cases. The regression analyses showed a rather different
pattern of results from those using allocated time variables. Three of
the weights for time were positive and one was negative; but no time
variable accounted for a significant amount of posttest variance nor
correlated highly with the posttest when the other independent variables
were partialled out.
Considering all of the analyses of the speeded test scores, academic
status dominated the relationship when subjects were pooled, and academic
status and pretest were more or less equally related to the posttest
when subjects were pooled within class. For allocated time a negative
relationship with posttest occurred when subjects were pooled. This
effect was due to between class variance since the effect was much
weaker when subjects were pooled within class. When analyses were run
Table 4.30
Speed in decoding consonant sounds (post) regressed on speed in decoding consonantsounds (pre), academic status, and measures of estimated engaged time (from teacher logs)
Academic Status 0.5003 0.0449 0.0098 20.84 0.00 0.47
Est. Eng. Time 0.0414 0.0050 0.0106 0.22 0.65 0.06
Consonant Sounds
Est. Eng. Time 0.0372 0.0007 0.0019 0.16 0.69 .05
Other Decoding
NoteTo provide complete data and to reduce ceiling effects a relatively large number of cases
were trimmed from the sample. Data on 77 students (out of 112) representing six classes
were analyzed.
a Probabilities rounded to two decimal places.
1 eL
Table 4.31
Speed in decoding consonant sounds (post) regressed on speed in decoding consonantsounds (pre), academic status, and measures of estimated engaged time (from teacher logs)over the A-C interval (subjects pooled within class, N = 77).
I DESCRIPTIVE INFORMATION
StandardCorrelations
Variable Meana Deviation 1 2 3 4 5
1 Consonant Sounds (Post) 0.0 5.5
2 Consonant Sounds (Pro 0.0 4.2 0.64
3 Academic Status o.n 59.1 0.65 0.67
4 Est. Eng. Time 0 '2 -0.12 -0.21 -n.20
Consonant Sounds0.25 0.18 0.21 0.62
5 Est. Eng. Time 0 141
Other Decoding
II SUMMARY OF MULTIPLE REGRESSION ANALYSIS
Multiple R 0.72Multiple R Squared 0.51
Std. Error of Est. 3.94Constant 0.00
(p = 0.00
IndependentVariable
Consonant Sounds (Pre)
Academic Status
Est. Enj. Time
Consonant Sounds
Est. Eng. TimeOther decoding
Bete, B, Stand. Partial
Stand. Raw Error F Corr:
Coef- Coef- Of To Proba- With
ficient ficient B Delete bilityb Dep.
0.3580 0.4634 0.1472 9.91 0.00 0.35
0.3612 0.0336 0.0106 9.97 0.00 0.35
-0.0714 -0.0002 0.0152 0.37 0.55 -0.07
0.1566 0.0061 0.0046 1.77 0.18 0.16
Note
To provide comp!ete data and to reduce ceiling effects a relatively large number of cases
were trimmed from the sample. Data on 77 students (out of 112) representing six classes
w.,-e analyzed.
J means within-class deviation scores are zero.
bProbabilities rounded to two decimal places.
iu
151
Table 4.32
Summary of hesults of Regression Analysis for Tine Variables and Grade 2 Reading Achievement
I RESCLTS FOB 0A-0B FER1OL (2 weeks) Subjects Pooled Oubjeets eooleu Within Class
DependentVariable
-atoned
Time
Variable
ReittedTireVariable
haw Beg.Coefficient
StandardError of E
Unique LarianceArTodntea for orTire 1.arlablea
0.1/0.7
haw RegCoefficient
.0177/-.053.'
OtandaniError' of b
oniqde varianceAceount,..1 "u
arid. lca
Compoundwords (08)
Engaged Time
OaVound
r1 aged l'imeOtner Word .0054/-.0327 .0171/.0445 .0204/.050y 1.2/1.0
-atce: t.:17 variatleb was column gives the percent of variance in the dependent variable ai4uely recounted Vol after pretezt, urnsc-lierd2 'ave teen entered. For related tine variables this column gives the percent of valiance in the dependent, vdriatle,,:.(1:,ted for after pretest, acaderlic status and tne ma.ched time variable have been entered.
17w.. ,egres7i,sc,: 'trriel o,t on readln, scores Oil not Include the academi: status %,al.atle or a related tire v -able.
-118-
using estimated engaged time, the time variables were weakly related to
posttest. The one exception wag a relatively weak negative relation
between matched time and posttest when subjects were pooled within class.
Summary. A summary of the regression analyses is presented in Table 4.32.
An examination of the raw regression coefficients for time variables
whert the dependent variable was a power test, revealed that 15 of the
18 coefficients were positive. The coefficients associated with estimated
engaged time were generally larger than the corresponding coefficients
associated with allocated time. With the exception of the decoding
results, the coefficients obtained in analyses where subjects were pooled
within class were greater than those obtained in corresponding analyses
where subjects were pooled. The percentages of variance accounted for
uniquely by time variables were quite small. Given the general pre-
post correlations and academic status-post correlations, this situation
was not unexpected.
The results from the speeded test were somewhat puzzling. In analyses
where subjects were pooled, the weights associated with allocated time
were negative; however the analagous weights for estimated engaged time
were positive. When subjects were pooled within class, the matched
times were negatively weighted but related times were non-negatively
weighted.
151:,
V DISCUSSION
Characteristics of Teacher Allocated Time Logs
The data on allocated time were collected via teacher logs. For
all analyses over the A-B period, this data source was of central
importance. The distributions of allocated time by content category
and by setting combination were taken directly from the teacher logs.
Allocated time from the teacher logs was the major independent
variable in the analyses of the time-achievement relationship. In
addition, all calculations of estimated engaged time depended upon the
teacher logs. Since the log procedure was central to the current
study and since portions of the Phase III-B study will include collection
of data on allocated time, a number of features of the teacher logs
warrant discussion.
Several practical features of the logs worked quite well. The
format was brief and readily understood by the teachers. The logs were
filled out in a relatively short period of time even though data were
collected for many students in each classroom and the number of specific
reading content categories was large. The system was flexible, in that,
allocated time was coded in classrooms with very different structures
and degrees of individualization of instruction. Teachers who grouped
students for instruction found the forms easy to use and teachers who
operated highly individualized classes found that the procedure could
be readily adapted.
The accuracy of the data provided by the teacher logs was investi-c
gated by comparison with the daily logs maintained by the observers.
154
-120-
Interpretation of comparisons within content categories between these
two sources of log data was hampered by two factors. The two sources
of log data were categorized at different levels of content (teacher
logs used specific content categories while observerlogs used general
content categories). In addition, the two log procedures used different
content coding strategies (teacher logs used multiple coding, and
observer logs employed focus coding). However, for total time allo-
cated to reading, differences due to level of content and coding
strategy were irrelevant.
Comparisons of total allo4ed time in reading from teacher logs
with that from observer logs were available for six of the nine classes
(since only six of the classes were observed). The correlations between
the two sources of allocated time were high (0.94 or greater) within
three of the classes, moderate (about 0.67) in two classes and low
(0.29) in one class. Hence, in five of the six classes, the two log
procedures ranked students similarly on total time allocated to reading.
However, the mean amount of allocated time differed considerably between
teacher and observer logs in five of the six classes.
Within content categories the correlations between the two sources
of allocated time remained moderately high for most classes. Class 1
was an exception, in that, more than half of the correlations between
the two sources of allocated time for content areas were negative even
though the correlation between sources when content areas were collapsed
was moderately high. Again the mean differences for time allocated to
content categories differed considerably between teacher and observer
logs. In most classes there was moderate to good agreement between the
155
-121-
two sources of log data on content categories where instruction did not
occur.
A possible source of error in the teacher logs was the inconsistency
with which some logs were returned to the Far West Laboratory. Logs
were to be returned weekly, although the records themselves were
entered daily. Some teachers required reminders to return the logs;
and, in these cases, it seems safe to assume that the logs might have
been completed considerably after the time when the instruction occurred.
The intervening time could have varied from one day to one or more
weeks. The use of prestamped and preaddressed envelopes did not
eradicate this problem.
If teachers completed logs well after the instruction occurred, they
probably relied heavily on lesson plans for the details of instruction.
This hypothesized use of lesson plans (which may or may not have reflected
the actual instruction accurately) could well have affected more logs
than those which were returned late. In addition, the project staff
referred to the logs as "lesson plan logs," which may have influenced
teachers. In future work, the logs may be improved by devising pro-
cederes to ensure that they are recorded regularly, and are clearly
differentiated from the lesson plans which many school districts require
as part of their regular operating procedure.
The coding differences (focus vs. multiple) which were discussed
earlier can be eliminated quite easily. In future, independently
collected samples of allocated time data using the same coding strategy
as the teacher logs must be obtained. It is important to note, however,
that the choice of coding strategy may have strong consequences for
detection of a relationship between tira and learning.
)f.
-122-
The training of teachers in the use of the logs was conducted on
a one to one basis. In future, it would be more efficient to provide
one or more group sessions to give a common introduction to the
procedures. These sessions could be followed up with one to one meetings
in the schools to discuss clarification and possible adaptations arising
from practice logs.
No data were available to check the logs within all specific con-
tent categories. In addition, no assessment of the characteristics of
the setting codes recorded in teacher logs has been made. These points
notwithstanding, the teacher logs compared reasorably well with observer
logs and with refinements can be used to collect useful information on
allocation of instructional time.
Results of the comparisons between allocated time from teacher logs
and engaged time from direct observation varied from class to class.
Three of the classes (1, 2, and 3) had relatively high correlations
between allocated time from teacher logs and engaged time from direct
observations while classes 4, 5, and 6 showed moderate co-relations. In
two of the six classes, the correlation between allocated time from
teacher logs and engaged time from erect observation was higher than
the correlation between allocated time from teachers logs and allocated
time from observer logs.
The allocated time from teacher logs was adjusted by weighting each
student's time by a rating of attentiveness. Ratings were made by the
teacher for each student individually. When the adjusted allocated times
(collapsed over content categories) were correlated with engaged time
from direct observation, four of the classes yielded relatively high
15 ':'
-123-
coefficients, one was moderately high, and one was approximately zero.
In three of the six classes the correlation between engaged and allocated
time was higher after the adjustment. In the other three classes the
correlations were lower. 1,-. the majority of cases the adjustment brought
the mean allocated time closer to the mean observed engaged time.
Allocation of Instructional Time in Reading
The mean total time allocated to reading for the 40 day instructional
period varied from approximately 2,450 to 6,000 minutes across the nine
classes. That is, in the most extreme case one class was averaging
almost 2.5 times mire time allocated to reading compared to another
class. Given that the logs were not error free, this still represented
a remarkable difference. The variation between classes in time allocated
to reading was greater than the variation within class.
The pattern of allocation to general and specific content categories
was partly a function of the time during the year when the data were
collected. The period including October and November represented the
major portion of instruct' before the Christmas break, however, the
selection of a different two month period would have generated a diff-
erent pattern of time allocation to content areas.
On the average, one-third of the reading time was allocated to
decoding. About 23 percent of reading time was allocated to "areas
related to reading." Within this general content cateyory dictionary
skills, grammar, and creative writing received the most time. The
genera content categories labeled comprehension, reading practice and
miscellaneous each accounted for approximately 10 percent of the time
-124-
allocated to reading. At the level of general content categories there
was some similarity in the pattern of allocation From class to class.
However, the general content categories were not ranked in the same way
for any pair of classes. At the level of specific content categories,
patterns were difficult to discern. Only one category (foreign
language) received no time allocation from any class. Within the
general and specific content categories the variation between classes
was greater than the variation within classes. The variability within
class was due in part to student absenteeism and partly to differential
allocations within class. Most classes had several reading groups and
these groups were often allocated time in different content areas.
There were large differences, in the distributions of allocated
time across classes. These differences, in and of themselves, may or
may nct be important. It remains to be seen whether the differences in
time allocation were appropriate. For example, if a class had mastered
a particular content area, then large allocations of time to that area
would not have been warranted. On the other hand, if a class or some
of its members performed at a low level in a particular content area,
some time probably should have been allocated to that area.
The allocation of time to setting combinations within reading re-
vealed three patterns. Class I allocated time only to settings wherein
a teacher was directly involved. In this case time was allocated to
each of the four possible settings with teacher involvement. Class 4
all cated about 85 percent of the time in reading to the "large group
seatwork with adult present" setting and about 15 percent to the "large
group seatwork without an adult present" setting. This class operated
essentially in two settings. The other seven classes allocated
15 !)
-125-
substantial amounts of time to most of the settings.
Across classes, much more time was allocated to settings where adults
were directly involved than to settings where no adult was directly in-
volved, and much more time was allocated to seatwork settings as opposed
to non-seatwork settings. Time was allocated about equally to large and
small groups. In almost all cases there was more variation between
classes than within classes.
Students were engaged in on-task activities for approximately half
of the time allocated to reading; however, there were large differences
both between and within classes. This figure was obtained by direct
observation in six of the nine classes. Student attentiveness was also
assessed by teacher ratings. These ratings correlated relatively highly
with academic status but weakly and inconsistently with the observed
engagement rates which, in turn, correlated weakly with academic status.
In this sample, the teacher ratings were apparently biased by teacher
perception of student ability, but observed student engagement was not
independent of teacher ratings and academic status.
Instructional Time and Student Achievement
Mul,iple regression analyses relating student achievement and in-
structional time were reported. The results were quite complex, however
several points bear comment.
In the main, instructional time variables were positively related
to student achievement. ,hat is, where students spent more time, achieve-
ment was higher. There were several exceptions to this statement,
especially for the analyses carried out on the speeded test. The latter
analyses will be discussed later in this section.
-126-
Each analysis was carried out with subjects pooled and then repeated
with subjects pooled within class. In general, instructional time
variables showed stronger effects when subjects were pooled within class
than when subjects were pooled. This implied that if a student spent
more time (relative to the mean time spent for his class) then his
achievement tended to be higher than the mean achievement for his class.
An analogous statement can be made about time and achievement relative
to the means for the whole sample (regardless of class membership) but
the effect tended to be smaller than that found when subjects were pooled
within class. For this sample of classes, the variation in average class
time in instruction was not strongly related to average class differences
in achievement. This could have resulted in a number of ways; for
example, differential effectiveness of teachers and/or curricula, or the
allocation of time (in some classes) to content areas after the students
had mastered the areas. It was not within the scope of the present
data set to pursue these or other possibilities. The point here is
that, within a given class more time was associated with more learning.
Differences between classes in amount of instructional time were also
weakly related to achievement.
Analyses were carried out on allocated time and subsequently the
analyses were repeated (on a subsample) using estimated engaged time.
The relationship between time and achievement was stronger when estimated
engaged times were used than when allocated time was used. Even though
the estimation of engaged time was somewhat crude, engaged time appeared
to be more highly related to student achievement than allocated time.
The content areas chosen for analysis were purposely varied in
"breadth." Compound words was the narrowest category chosen, in that,
1C1
-127-
the knowledge to be acquired in the area was relatively small in amount
and relatively simple in structure. The long vowels category was some-
what broader in that the concepts involved were more complicated and were
also more closely tied to other content categories (for example, short
vowels and other decoding categories). The total decoding and total
reading categories were broader still. The results for the broadest
category (reading) and the narrowest category (compound words) followed
the trends (more or less) described above. The results from the two
decoding categories were somewhat weaker. A logical analysis of the test
items used to assess decoding, pointed out that instruction in decoding
may be helpful but not necessary for answering the items correctly. There-
fore students who were not in 2 phonics-type program could certainly get
the items correct even though they had small amounts of time allocated to
decoding tasks. In reading, this situation makes it particularly difficult
to isolate pieces of instructional time which relate uniquely to perform-
ance on paper and pencil tests. There was clearly considerable transfer
of knowledge from one content area to another. In addition, the broader
the content area the greater the potential overlap. The data bore this
out, especially in the decoding area. Note that time in other reading
was a strong contributor to achievement (when students were pooled within
class). The results for decoding-long vowels employed time in other
decoding as the secondary time variable. Having recognized this transfer
phenomenon, time in other reading may have been a more useful choice
for the secondary time variable in the analysis.
The analysis of one speeded test (decoding-consonant sounds) was
reported. The results were conflicting. Half of the regression
-128-
coefficients for time variables were positive; half were negative. An
examination of the item difficulties by class revealed that in some
classes the test performed as a speeded test. The items were very easy
and hence the number right was mostly a function of speed of response.
However, in several classes the item difficulties were relatively low,
so that the test did not perform as a speeded test. This fact seriously
clouds the interpretation of the analysis. No substantial conclusions
were drawn from analyses of the speeded test.
The findings reported on the relationship between instructional time
and achievement were derived from exploratory analyses. Alternative
analysis plans might or might not replicate the results The underlying
model relating time and other factors to learning remains unclear. In
the analysis reported here, no consideration was given to possible
nonlinear relationships. Given more time and resources, a number of
interesting hypotheses could be explored. A conceptually simple and
intuitively appealing approach assumes that learning is the product of
some learning rate and time. With a zero learning rate or no time, no
learning takes place. Where learning rate is constant, learning is a
function of time; where time is constant, learning is a function of
learning rate. Equal amounts of learning may occur as the result of a
small amount of time and a high learning rate, or vice versa. The major
difficulty with this notion is the complexity of the "learning rate"
concept. Presumably learning rate is a function of the person and of
the learning task. This example of a product model (or others) was
not explored for this report.
The way in which content areas are subdivided and categorized affects
-129-
the relationship between time and achievement. In this s'..dy, reading
instruction was partitioned into mutually exclusive categories. Achieve-
ment tests corresponding to the categories were developed, and relationships
were sought between achievement and tim within the same category. This
appears to be the place to start; however, the results and the previox,
discussion point out the difficulty of developing consistent and meani4,J1
content categories. The greater the transfer effects in a subject area,
the more complex the relation between time-in-content and achievement.
It would appear that some subject areas are more amenable to useful
content categorization than others (when usefulness is defined in terms
of the relationship to paper and pencil test scores). A slight variation
on the transfer issue concerns the relative impact of out-of-school
experience on achievement. Of the academic areas taught in elementary
school, reading is prnably influenced more by out-of-school experience
than other subject areas. This speculation does not invalidate the time
to achievement relationship, but it may make the relationship more complex
and difficult to investigate empirically. It is tempting to redefine
the content categories and to hiera :hially structure the mnner in which
they should be related to a given achievement measure. Several simple
redefinitions have been reported, any other plausible alternatives
could also be tried.
The results of this study must, in general, be carefully qualified
for a number of reasons. The achievement measures were relatively short,
and therefore prone to sizeable measurement errors. There were -evere
ceiling effects on many of the scales. Hence, the samples on which
analyses were conducted usually included from 50 to 80 percent of the
1 6'
-130-
students with complete data. Only a few classes were involved; nine
for analyses of allocated time and six for ana es of estimated engaged
time. In addition the correlations between test scores were high. The
time variables accounted uniquely for small portions of posttest variation.
This fact was, at least partly, a fun, tion of th.. iulti- colinearity. In
addition, thP teacher log-keeping procedures and the direct observation
procedures contained relatively large errors.
Summary and Conclusions
The assessment of allocated time by teacher logs was reasonably,
successful. The allocated time c' to collected from teachers compared
moderately well with data collected by Far West laboratory observers.
In future work, it is recommended that fewer content categories be used;
that teachers be brought to a central location for training on log
procedures, that steps be taken to ensure that teachers complete the
logs daily, and that a E Jnple of allocated time data be collected inde-
pendently with identical coding procedures for subsequent comparison
purposes.
The observation procedure indicated that engaged time can be rel....)ly
assessed for grade two students. It is recommended that complete school
:ays be sampled during observation. However, since the testing over a
two-week period did not yield reliable gains on most scales, it is
recommended that observation days be spaccl over a longer period of time.
For analysis of reading scores, one day of observation per week over a
minimum of eight weeks is recommended.
There were substantial differences in time Jloc ed to reading both
-13'-
between and within classes. A considerable amount of the within class
variation was due to student absenteeism. Classes varied remarkably on
the distribution of time spent on content categories as well as time
spent in particular setting combinations. No single setting combination
characterized all of the classes. Students were engaged in reading
activities about 50 percent of the time that was allocated to reading.
However, there were large variations both between and within classes.
Teacher ratings of student attentiveness were weakly related to observed
engagement rates. Teacher ratings alone should not be relied on as the
major assessment of students engagement.
Instructional time and student achievement were positively related.
The strength ana consistency of the relationship varied considerably.
Ceiling effects on the tests prompted relatively severe trimming of
subjects from the sample. It is recommenuad for future work, that
students be selected so that the range on entering achievement is re-
stricted. This will tend to avoid ceiling effects and to reduce pre-post
correlations.
166
REFERENCES
Bennett, N. Teaching styles and pupil progress. London: Open Books, 1976.
Block, J., & Burns, R. Time in school learning: An instructionals cholo ist'a ers ective. Paper presented at the annual meeting of theDemean ducat ona Research Association, Washington, D.C., 1975.
Bloom, B. S. Learning for mastery. UCLA Evaluation Comment, 1968, 1, 1-12.
Bond, G. L., & Dykstra, R. The cooperative research program in first-grade reading instruction. Reading Research Quarterly, 1967, 2, 5-142.
Carroll, J. B. A model of school learning. Teachers College record,1963, 64, 723-733
Carroll, J. B., & Spearitt, D. A study cf a model of school learning.Monograph No. 4, Center for Research and Devi-Moment in EducationalDifferences, Harvard University, 1967. (ERIC Document ReproductionService No. ED 045 477)
Cronbach, L. J. Coefficient alpha and the internal structure of tests.Psychometrika, 1951, 16, 297-334.
Cronbach, L. J., & Webb, N. Between-class and within-class effects ina reported aptitud X treatment interaction: Reanalysis of a study byG. L. Anderson. _ournal of Educational Psychology, 1975, 67, 717-724.
David, J. L. Summer study: A two part investigation of the impact of
exposure to schooling on achievementgrowth. Unpublished doctoraldissertation, Wrvard University, 1974.
Dunkin, M. J., & Biddle, B. J. The study of teaching. New York: Holt,
Rinehart, and Winston, 1974.
Far West Laboratory for Educational Research and Development. ,Proiram
plan for continuation of Phase III-A: Beginning Teacher Evaluation
Study. San Francisco, 1975.
Filby, N. N., & Dishaw, M. Development and refinem2nt of reading andmathematics tests for the study of reading and mathematics instructionin Grades 2 and 5 (Technical Report III-1). Beginning Teacher
Evaluation Study, Far West Laboratory, San Francisco, 1975.
Filby, N. N., & L:snaw, M. Refinement of reading and mathematics tests through
an analysis of reactivity (Technical Report 111-6). Beginning Teacher
Evaluation Study, Far West Laboratory for Educational Research and Development,
San Francisco, 1976.
Fisher, C. W. A study of instructional time in _grade 2 mathematics (Technical
Report 11-3). Beginning Teacher Evaluation Study, Far West laboratory for
Educational Research and Development, San Francisco, 1976.
1C
-133-
Gage, N. L. (Ed.), Handbook of research on teaching. Chicago: RandMcNally and Company, 1963.
Harnischfeger, A., and Wiley, D. Teaching-learning processes in elementaryschool: A synoptic view (TechnicalReport 75-31-1), San Francisco:Far West Laboratory, 1975.
Harris, A. J., Morrison, C., Serwer, b., and Gold, L. A continuation ofthe CRAFT project: Comparing reading approaches with disadvantagedurban Negro children in rimar rades. New York: City Universityof ew Yor 9 8. R C Document eproduction Service No. ED 010 297)
Harris, A. J., & Serwer, B. Comparison of reading approaches in firstglfide teaching with disadvantaged children. (The CRAFT projectNed York: City University of New York, N6.
Hess, R. & Takanishi, R. The relationship of teacher behavior and schoolcharacteristics to student enagagemegt (TIchnical Report 42). Centerfor Research and Development in Teaching, Stanford University, 1974.
Karweit, N. Quantity of schooling: A major educational factor?Educational Researcher, 1976, 5 (2). 15-17.
Shanker, A. Research on teaching methods: British study gives firsthard data. New York Times, May 16, 1976.
Stallings, J. A. Relationships between classroom instructional practicesanu child development. Paper presented at the annual meeting of tieAmerican Educational Research AssoLi2tion, Washington, D.C., 1975.
Stallings, J. A., & Kaskowitz, D. Follow-through classroom observationevaluation, 1972-1973. Menlo Park, California: Stanford ResearchInstitute, 1974.
Thorndike, R. L. (Ed.) Educational measurement (2nd Ed.). Washington, D.C.,American Council on Education, 1971.
Travers, Robert M. W. (Ea.), Second handbook of research on teaching.Chicago: Rand McNally and Company, 1973.
Wiley, D. E. Another hour, another day: Quantity of schooling, a potentpath for policy. Studies of Educative Processes, No. 3. Chicago,July, 1973.
APPENDIX A
Directions and Examples of Itemsfrom khievement lests
-135-
General Instructions to Testers
Winter Testing, 1975
Teachers
The teacher will be in the room during the testing, mainly to help
maintain order. If all is going well, the teacher r work on other
things. The BTES staff member is in all cases responsible for adminis-
tering the test.
At the beginning of the test session, give the teacher a copy of
the tests, Say something like "YOU MIGHT WANT TO LOOK THROUGH A COPY
f_IF THE TEST." Let the teacher keen the test during the test session,
but be sure to get the test back at the end of the session. Do not let
the teacheo keep a copy of the test.
Circulating to Check (Not to Help!)
During the testing, it will be necessary to circulate around the
room, making sure that students have understood the directions correctly.
A student who is confused may raise his hand for help. If this happens
(or if you see a child who is not following directions), repeat the
instruction to the child. You may point out to him where he is supposed
to read and m, k. But do nct help him -nswer the questions. And do
not read any words for the child during the reading tests.
The teacher may want to help circulate and answer questions. This
is permissable as long as the teacher understands that he may only repeat
the instruction: am: may nut read words for the child nor try to explain
the task more clearly.
-136-
Frustrated Children
Some children at lower levels will find the exercises frustrating.
Try to encourage such children to figure out what they can. Say some-
thing like:
I KNOW SOME OF THE QUESTIONS ARE DIFFICULT. MAYBE
YOU HAVEN'T LEARNED SOME OF THESE THINGS YET. YOU
ARE HELPING US FIND OUT WHICH THINGS ARE HARD TO DO.
TRY TO FIGURE OUT WHATEVER YOU CAN ON YOUR OWN.
Time Limits
The time limits given for each subtest represent the maximum work in
allowed for students after the directions have been given. These
times are guidelines, and some leaway is allowed, but it is important
not to start running long on each subtest, or total time will be unduly
extended. We expect that, in most classes, the majority of students will
finish within fiese limits, while a few students will consistently be
slow. When you have to stop students before they finish, tell them:
IT IS TIME TO STOP. (OR TIME TO GO ON.) ITS OK
IF YOU DIDN'T FINISH. WE JUST WANT TO SEE HOW PEOPLE
DO ON THESE EXERCISES.
Try to keep the classroom atmosphere work-oriented but not high-
pressured.
17j
-137-
Guessing
Do not encourage students to guess randomly. Tell them:
WORK OUT THE ANSWER AS BEST YOU CAN. THERE
MAY BE SOME THINGS YOU DON'T KNOW. IF YOU
CAN'T DO IT AT ALL, JUST LEAVE IT BLANK.
Preparation
Past experience has shown the importance of being well prepared
for the onslaught of an active group of children. A good strong cup
of coffee is often much more valuable than ten more minutes' sleep.
Materials Needed
The tester should go out into the field with:
test booklets
scratch paper (2 pieces per student, math only)
extra pencils
class list and record form
watch with second hand
rubber band
The tester should return to Faye Mueller (phone 565-3011):
test booklets
class list enclosed in rubber band
filled in record form
1 7
-138-
EXAMPLE OF SPECIFIC INSTRUCTIONS FOR TESTBooklet 2A2 (Decoding)
Make sure that desks are clear and that the students are seated some
distance apart.
GOOD MORNING. TODAY WE ARE GOING TO DO SOME READING PROBLEMS
SIMILAR TO THOSE WE DID ON . WHEN YOU RECEIVE
YOUR BOOKLET, FILL IN YOUR NAME WITH YOUR LAST NAME FIRST.
PLEASE DO NOT OPEN THE BOOKLET.
4
Pass out booklets and pencils as needed. When children have finished
writing their names, state.
Pages 1 - 3 Speed Test (1 minute)
OPEN YOUR BOOKLETS TO PAGE 1. WE'RE GOING TO DO SOMETHING
A LITTLE DIFFERENT TODAY, SO LISTEN CAREFULLY. THE DIRECTIONS
SAY: LOOK AT THE PICTURE. READ THE WORDS CAREFULLY. CIRCLE
THE WORD THAT NAMES THE PICTURE.
DO YOU REMEMBER THESE PICTURES FROM LAST TIME? THE FIRST
PICTURE IS DOG AND THE WORD DOG IS CIRCLED. LET'S DO THE NEXT
ONE. WHAT IS THE PICTURE? RIGHT, TREE. READ THE WORDS
AND CIRCLE THE WORD TREE LET'S DO THE LAST ONE. WHAT IS
THE PICTURE? RIGHT, SING CIRCLE THE WORD SING
NOW, PUT DOWN YOUR PENCILS SO YOU CAN LISTEN TO THE WAY WE'RE
GOING TO DO THIS TODAY. PUT DOWN YOUR PENCILS. LOOK AT ME SO
I'LL KNOW YOU ARE READY TO LISTEN. YOU'RE GOING TO DO 2 PAGES
OF PICTURES JUST LIKE THIS. BUT YOU WILL HAVE JUST ONE
MINUTE TO DO BOTH PAGES. YOU WILL NEED TO WORK QUICKLY BUT
CAREFULLY. WHEN I SAY GO, TURN THE PAGE AND START. REMEMBER
TO DO BOTH PAGES. WHEN I SAY STOP, PUT YOUR PENCILS DOWN. IS
173
-139-
EVERYONE READY? GO
Time for exactly one minute.
STOP. PUT YOUR PENCILS DOWN. WE HAVE FINISHED
THIS PART OF THE BOOKLET. PLEASE DO NOT TURN
BACK TO THIS PART.
174
-140-
Page 4 - 5 (4 minutes)
THE DIRECTIONS SAY: READ THE SENTENCE OR STORY. LOOK AT THE
UNDERLINED WORD. FIND THE WORD OR PHRASE THAT MEANS THE SAME
THING AS THE UNDERLINED WORD. CIRCLE THE LETTER OF YOUR ANSWER.
LOOK AT EXAMPLE A. LISA TRIED TO OPEN THE WINDOW. IT WAS
STUCK. WHAT DOES IT MEAN? A. LISA WAS STUCK? B. THE WINDOW
WAS STUCK? C. OPEN WAS STUCK? WHAT DOES IT MEAN? IT
MEANS THE WINDOW. SO LETTER B IS CIRCLED.
LET'S DO THE NEXT ONE TOGETHER. LOOK AT EXAMPLE B. IT SAYS:
TIM'S MOTHER CALLED HIM FOR DINNER. HE WAS VERY HUNGRY. WHAT
DOES HE MEAN? A. MOTHER, B. TIM, C. DINNER. WHAT DOES HE
MEAN' RIGHT, HE MEANS TIM. TIM WAS HUNGRY. WHAT LETTER
IS IN FRONT OF THE ANSWER TIM?...RIGHT, B. CIRCLE THE LETTER B.
DOES EVERYONE UNDERSTAND?
YOU DO THE REST OF PAGES 4 AND 5 ON YOUR OWN, THEN STOP AND
WAIT. LOOK UP AT ME WHEN YOU FINISH. YOU MAY BEGIN.
Circulate to be sure students do both pages.
-141--
Page 6 (3 minutes)
ON THIS PAGE WE'RE GOING TO WORK ON CONTRACTIONS. THERE
ARE 2 KINDS OF QUESTIONS. LOOK AT THE FIRST ONE, EXAMPLE A.
THE DIRECTIONS SAY: FIND THE TWO WORDS THAT MAKE UP THE
CONTRACTION. CIRCLE THE LETTER OF YOUR ANSWER. THE UNDER-
LINED CONTRACTION IS HE'S. THE CONTRACTION HE'S IS MADE FROM
THE WORDS HE IS, SO LETTER B IS CIRCLED. LOOK AT EXAMPLE B.
THE DIRECTIONS SAY: FIND THE RIGHT CONTRACTION FOR THE TWO
WORDS. THE TWO WORDS UNDERLINED ARE HE IS. WHAT IS THE
CONTRACTION OF HE IS? RIGHT. HE'S. HE IS BECOMES HE'S,
SO LETTER C IS CIRCLED. YOU DO THE REST OF THIS PAGE, THEN
STOP AND WAIT. LOOK UP AT ME WHEN YOU FINISH. YOU MAY BEGIN.
17t
-142-
Pages 7 - 8 (6 minutes)
THE DIRECTIONS SAY READ THE SENTENCE OR STORY. LOOK AT THE
UNDERLINED WORD. THE SENTENCE OR STORY HELPS TO TELL YOU THE
MEANING OF THE UNDERLINED WORD. CHOOSE THE BEST DEFINITION.
CIRCLE THE LETTER OF YOUR ANSWER.
LOOK AT THE EXAMPLE. IT SAYS: I SAW THE KITTEN IN THE BOX.
WHAT DOES SAW MEAN? A. CUT, R. LOOKED AT, C. A TOOL FOR
CUTTING. WHAT DOES SAW MEAN?....RIGHT, LOOKED AT. I LOOKED
AT THE KITTENS IN THE BOX. Whr LETTER IS IN FRONT OF THE
CHOICE LOOKED AT RIGHT, B. SO CIRCLE THE LETTER B.
DO THIS PAGE AND THE NEXT PAGE. WORK UNTIL YOU COME 10 THE
WORD STOP. YOU MAY BEGIN.
Circulate to make sure students do both pages, and after 5 minutes say:
IYOU HAVE ONE MORE MINUTE TO WORK.
After 6 minutes say:
STOP. EVERYONE TURN TO THE PAGE THAT SAYS STOP.
Page 9 Stop Break (2 minutes)
Lead the children in exercises for a couple of minutes. Then ask them to
return to their seats. When the children are quiet, go on to t6e next page.
17,
-143-
Page 10 (3 minutes - paced)
ON THIS PAGE YOU'LL HAVE TO LISTEN CAREFULLY TO KNOW WHAT TO
DO. I AM GOING TO READ SOME WORDS. YOU CIRCLE THE WORD THAT
IS THE SAME AS THE WORD I SAY. LOOK AT EXAMPLE A. THE FIRST
WORD IS THF. ON YOUR PAGE THE WORD THE IS CIRCLED. LET'S DO
THE NEXT ONE. LOOK AT EXAMPLE B. PUT A alcu AROUND THE WORD
THAT IS THE SAME AS THE WORD I SAY. LISTEN CAREFULLY. WHEN
WHEN. WHICH WORD DID YOU MARK? YES, THE FOURTH
WORD, W H E r, WHEN
Circulate Lriefl to see that all st'dents are in the right place and marking
correctly. Read the remaining words slowly and carefully. Read the line
lumber and word. Repeat each word. Pause about 10 seconds between lines.
LET'S GO C:1 TO LINE 1.
IHAT I SAY.
LISTEN CAREFULLY. CIRCLE THE WORD
1. MIGHT MIGHT 8 SOME SOME
2. OF OF 9. NIGHT,.. .NIGHT
3. THERE THERE 10. WHOSE WHOSE
4. WAS WAS 11. KNOW KNOW
5. FROM FROM 12. WHERE. ...WHERE
6. ONE ONE 13. WHAT WHAT
7. WHAT WHAT 14. HAVE HAVE
-144-
Page 11 (2 minutes)
THE DIRECTIONS SAY: THE LETTER C CAN MAKE TWO DIFFERENT
SOUNDS. LOOK IN THE BOX:
IN THE WORD CAT THE SOUND IS /K/ LIKE IN KITE. THE
LETTER K IS USED TO STAND Fon THE SOUND /K/. IN THE
WORD CITY THE SOUND IS /S/, LIKE IN SING. THE LETTER S
IS USED TO SAND FOR THE SOUND /S/. CAT, KITE, /K/.
rITY, SING, /S/.
READ EACH WORD BELOW, AND FIND OUT WHICH SOUND THE UNDER-
LINED C MAKES. CIRCLE THE LETTER WHICH SHOWS THE MATCHING
SOUND.
LOOK AT THE EXAMPLES.
A. COAT. WHAT SOUND DOES THE UNDERLINED LETTER MAKE? /K/
OR /S/? LISTEN, COAT....RIGHT. COAT. /K/. SO THE LETTER K
IF CIRCLED.
LET'S DO THE NEXT ONE. THE WORD IS CIRCUS. WHAT SOUND
DOES THE UNDERLINED LETTER MAKE? /K/ OR /S/? LISTEN,
CIRCUS....RIGHT, CIRCUS. /S/. SO CIRCLE THE LETTER S.
LOOK AT THE LAST EXAMPLE, RACE. WHAT SOUND DOES THE UNDER-
LINED LETTER MAKE? YuU CIRCLE THE LETTER OF THE MATCHING
SOUND. RALE WHAT SOUND DID YOU HEAR? RIGHT ,'S /.
WHAT LETTER DID YOU CIRCLE? R164T, S. DO YOU UNDER-
STAND WHAT TO DO?
NOL DO THE REST OF THE PAGE ON YOUR OWN, TUrN STOP. YOU MAY BEGIN.
17b
-145-
Page 12 (2 minutes)
THE DIRECTIONS SAY: THESE WORDS ARE COMPOUND WORDS. TWO
LITTLE WORDS ARE PUT TOGETHER TO MAKE A NEW WORD. DRAW A
LINE THROUGH THE NEW WORD TO SHOW THE TWO PARTS.
LOOK AT THE EXAMPLE. THE WORD GOLDFISH IS MADE UP OF THE
WORDS GOLD AND FISH. THE LINE SHOWS THE TWO PARTS. LET'S
DO THE NEXT WORD TOGETHER. OUTSLDE. WHAT ARE THE TWO WORDS
IN OUTSIDE? RAJHT, OUT AND SIDE. DRAW A LINE BETWEEN
THE TWO PARTS.
NOW DO THE REST OF THE WORDS ON YOU OWN. DRAW ONE LINE IN
EACH WORD. GO TO THE END OF THE PAGE, THEN STOP. BEGIN.
As the children finish, say:
LOOK UP AT ME WHEN YOU FINISH, SO I'LL KNOW YOU ARE READY....
TURN THE PAGE.
-146-
Page 13 (2 minutes)
THE DIRECTIONS SAY: READ THE WORD. LOOK FOR THE ROOT WORD
Ii THE LONGER WORD. DRAW A LINE THROUGH THE WORD TO SHOW THE
TWO PARTS.
LOOK AT THE EXAMPLE. JUMPING IS MADE FROM THE WARD JUMP
PLUS THE ENDING i - N - G. THE LINE SHOWS THE TWO PARTS.
RERUN IS MADE FROM THE WORD RUN PLUS THE PREFIX R - E.
WHAT ABOUT THE NEXT WORD, SLOWLY? WHAT ARE THE TWO PARTS?...
RIGHT, SLOW PLUS THE ENnING L - Y. YOU DRAW THE LINE BETWEEN
THE TWO PARTS.
NOW DO THE REST OF THE WORDS ON YOUR OWN. DRAW ONE LINE IN
EACH WORD. GO TO THE ENO OF THE PAGE, THEN STOP. BEGIN.
.,11 .1101.1.1,
-147-
Pages 14 - 15 (9 minutes)
HFRE IS A STORY TO READ. PEAD THE STORY, THEN ANSWER THE
QUESTIONS. CIRCLE THE LETTER OF THE ANSWER YOU CHOOSE. T"E
END OF THE STORY TS ON THE NEXT PAGE. DO BOTH PAGES. YOU
0;VE 9 MINUTES TO WORK. BEGIN.
Circulate to make sure both pages get done. After 8 minutes, say:
[ YOU HAVE 1 MORE MINUTE TO WORK.
After 9 minutes, say:
STOP. CLOSE YOUR BOOKS.
-148-
TESTING RENRT FORMSpring, 1976
Tests Given:
Grade Level:
Teacher: School:
Date: Time:
Tester:
Number of Students Tested: Number of Students Absent:
Conditions of Testing (Problems /Irregularities):
Example Items from Achievement Scales
Scale Name
Numberof
Items
Description Example Items
Decoding -Consonant Sounds(speeded)
24
Consonant Sounds. dog fop log
The student must identUy theword containing the correctconsonants to name a picture.
Includes single consonants,blends, and digraphs ininitial and final position.
'Q.,
.
three see 4000)
, /.
1\:Ank sing sick
DecodingLong Vowels
22
Vowels - Long Vowel, Final E.ApAN
I ..1.1
11,,,.... ,,,,,h,/
/rop rope rap
The student must recognize therole of final e in vowel pro-nunciation by selecting thecorrect word to name a picture.
Vowels - Digraphs.
GAPblick bloke block
sail sell sealThe student must recognize thelong vowel sound of commondigraphs.
Deeding - Con onantSubstitution
10
Consonant Substitution.hop
op
tw skThe student must select thecorrect consonant blend ordigraph to substitute in initialposition and make a new real word.
Context Clues -Form of Word
10
Context Clues - Form of Word. Something that warms you up is aThe student must use undcrstand-Inq of sentence meaning andknowledge of word structure toselect the correct word to filla blank.
heating
neats
heater
184 185
Example Items from Achievement Scales (can't)
Scale Name
Numberof
ItemsDescription Example Items
Word Structure -
Compound Words10
Compound Words. gold/fishThe student must dividesimple compound wordsinto two parts.
Word Meaning -Synonyms
18
y_lorp_Sris.a little dog
The student must identifythe word with the samemeaning as an underlinedword.
A. fast 0 smallB. funny D. long
Comprehension -Description
13
Comprehension - Description
Mary felt scared walkingdark woods....
How did Mary feel?
A. happy
B. mad
0 afraid
through the
The woods were .The student must understanddescriptions of charactersand emotions or descriptionsof settings (including timeand place).
A. sunny
0 dark
C. rainy
186 187
APPENDIX B
Reading Content Categories and Examples
of Teacher Logs
-152-
Specific Content Categories for Grade 2 Reading Instruction
SpecificContentCategoryNumber
Specific ContentCategory Name
General
ContentCategoryNumber
ObservationContentCategoryNumber
Decoding
1 Single consonants 2 2
2 Consonant blends and digraphs 2 2
3 Variant ccr,onants (c,g) 2 2
4 Vowels - short 2 2
5 Vowels - final e pattern - long vowels 1 1
6 Vowels - digraphs 1 1
7 Vowels - dipthongs 2 2
8' Vowels - vowels + r (car) 2 2
9 Complex, multi-syllabic 2 2
10 Silent letters 2 2
11 Sound substitution tasks 2 2
58 Spelling 2 2
14 Other decoding 2 2
Context Clues
15 Choosing word(s?which fit gram. context 3 5
16 Choosing word(sjwhich make best sense 3 5
(semantic appropriateness)1.7 Choosing correct form of word 3 5
18 Choosing word with correct initial cons. 3 5
19 Choosing correct pronoun 3 5
20 Other context clues 3 5
Word Structure
21 Compound words 4 3
22 Identification of root words 5 4
23 Prefixes - meaning and use 5 4
24 Suffixes - meaning and use 5 4
25 Contractions 5 4
26 Syllables 5 4
27 Other word structure 5 4
Word Meaning
28 Sronyms 6 5
29 Antonyms 6 5
30 Vocabulary building 6 5
31 Pronoun reference 6 5
32 Multi-meaning words in context 6 5
33 Unfamiliar words in context 6 5
34 Figurative language 6 5
35 Other word meaning 6 5
-153-
Comprehension
36 Understanding event detail 7 5
37 Understanding description 7 5
38 Understanding relationships 7 5
39 Understanding main idea 7 5
40 Literal recall 7 5
41 Translation of ideas 7 5
42 Synthesis of ideas, inference 7 5
43 Going beyond the text, prediction 7 5
44 Recognizing facts and opinions 7 5
45 General comprehension 7 5
46 Understanding directions 7 5
47 Picture interpretation to aid comprehension 7 5
General Content Categories for Grade 2 Reading Instruction
General
ContentCategoryNumber
General ContentCategory Name
ObservationContentCategoryNumber
1
2
3
4
5
6
7
89
10
long vowelsOther decodingContext cluesCompound wordsOther word structureWord meaningComprehensionAreas related to readingReading practiceMiscellaneous
1 (111.)
2 (RD)5 (RM)a3 (RC)
4 (RS)5 (R14a5 (RM)a7 (RO)6 (RP)
a Observation content category 5 included general content
categories 3, 6 and 7.
1.9 1
-155-
READING GLOSSARY
I. DECODING (Knowledge and use of letter-sound correspondence)
SCC 1 Single consonants -Sounds of single consonants in any position 'n a word.Examples: b, c, d, . . .
SCC 2 Consonant blends and digraphsBlends include st, bl, tr, . . .
Digraphs include ch, sh, th, wh.
SCC 3 Variant consonantsA comparison of several sounds possible for a single consonant.Examples: "c" in cat vs city, "g" in goat vs giant
SCC 4 Vowel - shortRegular short sound of a, e, i, o, and u
SCC 5 Vowel - final e patternLong vowel sound when word ends with e, as in rope
SCC 6 Vowel digraphsInclude ee, ea, ai, oa, and ay
SCC 7 Vowel dipthongsInclude oi, oo, ou, oy, au, and aw
SCC 8 Vowel plus rVowel sound modified by following consonant rExamples: ar, er, ir, or, ur, air, ear
SCC 9 Complex, multi-syllabicDecoding of multi-syllabic words, includes internal patterns,syllable influence on vowel decoding
SCC 10 Silent consonantsLetters which are not sounded in a wordExamples: comb, knit
SCC 11 Sound substitution tasksSubstituting one sound for another to create a new word.Example: fan, _an, p, pan
SCC 12 Sight wordsRecognition of common words, especially function words (the, of, to,would, could. were) and words with irregular spelling (are, come, put)
SCC 13 Automaticity of word recognitionPractice to improve speed of word recognition, so that the processbeLomes automatic.
i. CONTEXT CLUES
Context clues involve usino the context of a phrase, sentence, or story
to help identify a word or to predict a missing part. Different types
_1. 90
-156-
of context clues emphasize different aspects of the linguistic context
or of the word to be identified.
SCC 1 Choosing word(s) which fit the grammatical context.Father is sleeping the bed.
night
in
warm
SCC 16 Choosing the word(s) which make best sense in the blank.The lives in the royal palace with her father.
princessprincesister
SCC 17 Choosing the correct form of a word.Both of the are asleep.
babybabying
babies
SCC 18 Choosing the word with the correct initial consonant.Don't the milk.
sill
spill
still
SCC 19 Choosiip correct pronoun.John dropped his book and then picked up.
them
it
him
III. WORD STRUCTURE
SCC 21 CompoundsWords formed by combining two smaller words "mailbox"
SCC 22 Identification of root wordsRecognizing the root word in a derived form "playing" root . play
SCC 23 PrefixesInclude re-, un-, dis-, pre-, . .
SCC 24 SuffixesInclude grammatical endings like -s, -ed, and -ing and other suffixes
like -ly, -ful, -ness, -less . ...
SCC 25 Contractionsdo not - don't
SCC 26 Syllables - separation of a word into sound units preamble - pre am ble
193
-157-
IV. WORD MEANING
SCC 28 Identifying words with similar meanings - quick = fast
SCC 29 AntonymsIdentifying words with opposite meanings - large vs. small
SCC 30 Vocabulary buildingLearning word meanings
SCC 31 Pronoun referenceIdentifying the referent of a pronoun."John washed his car." his=John's
SCC 32 Multi-meaning words in contextIdentifying the specific meaning of a word in a particular
context.I cut my hand on a piece of paper.
a. part of a clock
b. part of a person
c. give something
SCC 33 Unfamiliar words in contextDeducing the meaning of an unfamiliar word through its use in context.
The car was so badly entrenched in the mud that we had to call a
tow truck.
a. stuckb. built
c. dirty
SCC 34 Figurative languageRecognizing the meaning of a word or phrase used in a nonliteral
sense, including simile, metaphor, and idiomatic expressions.
The soldier fought like a tiger to protect his home.a. in a striped uniformb. with sharp claws
c. bravely and fiercely
')h, how Peter wished he could whistle! Peter saw his friend Sam
playing with a dog. Whenever Sam whistled, the dog ran straight to him.
Peter wished he could do that trick with his own dog, Willie. Peter tried
and tried to whistle, but he just couldn't.Peter went into his house and put on his father's old hat, to make
nimself feel more grown-up. He looked into the mirror to practice
whistling. Still no whistle!The next day Peter went outside to play. He sat on the front steps
and tried to whistle. Then Peter saw his dog coming. Quick as a wink,
Peter hid behind the stairs. He wanted to surprise Willie with a whistle.
Peter puffed up his cheeks. He blew and blew and blew. Suddenly, out
came a real whistle. Willie stopped and looked around to see who was
making the noise."It's me," Peter shouted. He jumped out from behind the stairs.
Willie raced straight up to him.
The following illustrations refer to the story above.
194
-158-
V. COMPREHENSION
SCC 36 Understanding event detail. What did Peter put on?
SCC 37 Understanding description - Where did Peter hide?How did Peter feel at the end of the story?
SCC 38 Understanding relationships - What happened first?Why did Willie stop and look around?
SCC 39 Understanding the main idea - What is the story mostly about?What lesson can we learn from the story?
SCC 40 Literal recall - recall of information exactly as stated in the story.
What did Peter wish he could do?a. have a dogb. whistlec. go to school
SCC 41 Translation of ideasRecognizing ideas stated in different words; ability to paraphrase;
recall of information when ideas are restated.
What happened when Sam-whistled?a. Peter went over to see Sam
b. A dog went over to see Sam
c. Peter whistled too
SCC 42 Synthesis of ideas, inferenceAbility to integrate information from different points in a text;
understanding ideas directly implied by a text.
What trick did Peter want to do with his dog?
a. teach Willie to whistle
b. put an old hat on Willie
c. whistle to cal' Willie
SCC 43 Going beyond the text, predict-;onRelating the text to one's own knowledge and experience; supplying
from experience information not directly given in a text. Includes
predicting what might come next in a story.
H04 did Peter feel when Willie came running?
a. happy
b. scaredc. mad
SCC 44 Recognizing facts and opinionsEvaluating statements and the basis for their acceptance.
Included evaluating the qualifications of a speaker.
Which of the following is a fact rather than an opinion?
a. The Etruscans built cities long ago.
b. The jewelry made by the Etruscans was the most
beautiful ever made.
c. Historians do not know as much as archeologists do.
-159-
SCC 45 General ComprehensionSilent reading or general reading practice, where comprehensioninvolves a mixture of the facets above: (Please use one or more of
the specific categories, if possible.)
196
-160-
Example: Attendance/Group Composition Record
MATH (circle one) Teacher No. 3 Grade 2
Student's Name Grou Week of October 27-31,1
1975
1. ID # 239
.
3o1
3. ID MEM.... ID
bsent111111MBarlIMMIIIIMIIIIMINIIMaNNIIIIII
,
ID.
6. ID
ID 3.
8. ID 252
9. ID # 253
11. ID # NMI
El'bsent
14. ID #259
iitnilifaMita=18.
o 260
o
ID I20. 265 3
..
32.
Example:Teacher Log removed due to very poor copy
197
APPENDIX C
Teacher Rating Forms
19S
-163-
Rating of Student Attentiveness
The lesson plan logs tell us how much time vi..s allocated by the teacher todifferent settings and objectives in reading or mathematics. But there is often
a difference between the amount of time taken up by a lesson and the amount of
time which is active learning time lor a student. We would like to get a more
accurate estimate of the amount of actual learning time for an individual stu-
dent. This will be used as a "correction factor" in the interpretation of the
log information.
A student who is paying attention works actively on assignmentsparticipates or listens attentively
during class discussion
A student who is not paying attention talks to his neighbordaydreamsdraws pictures on his paperfalls asleepwalks around the roomwaits for help
Children differ in the amount of time they pay attention in class. Based on
your observations of the children so far thi.; year, please rate each child in
your class as to the percentage of time that child generally pays attention.Think only of the subject matter for which you are keeping logs. If you are
keeping math logs, think about how much of the time a student pays attention
during math lessons. If you are keeping reading logs, think of the time you
record as reading or reading related.
We suspect that children may differ in attentiveness depending on whether or not
an adult is present. For this reason, we would like you to rate each child twice.First rate the children for settings in which an adult is present (either seatworkwith an adult supervising or group work with an adult). Then rate the children
a second time for settings with no adult present.
One way to go about this task is to go through the following steps:1. Think of a typical 40 or 50 minute lesson period. Think first of
settings where an adult is present to supervise and encourage atten-tion. During what percentage of the time would a student by likelyto pay attention to the lesson? On the form labeled "Adult Present,"assign each student a rating.
2. Shift your thinking to a 40 or 50 minute period where the studentsare left to work on their own without an adult. What percentage ofthe time would a student be likely to pay attention under these con-
ditions? Record your ratings on the form labeled "No Adult."Use as many or as few of the categories as you wish to indicate the differencesin attentiveness among your students. The descriptions below may help as
guidelines.
91-100% The child almost always attends to the learning task.
71-80% The child sometimes loses time through temporary in-attention or general classroom disruption but he tendsto work more often than not.
51-60% The child is as likely to be distracted as he is to work.Only about half the period is spent attending to thetask.
21-30% The child is frequently distracted and inattentive.Large periods of time may be lost through inattention.The child may be noticeably disruptive in class or maysimply daydream a lot.
0-10% The child almost never attends to the learning task.