Document # Date LAT-TD-08316-01 06/23/2006 Author(s) Supersedes J. F. Ormes None System or Sponsoring Office LAT TECHNICAL NOTE System Engineering Document Title GLAST LAT Background Review CHANGE HISTORY LOG [Change history log may be deleted if not used] Revision Effective Date Description of Changes DCN # 01 Initial Release LAT-TD-08316-01
Transcript
Document # Date
LAT-TD-08316-01 06/23/2006Author(s) Supersedes
J. F. Ormes None
System or Sponsoring OfficeLAT TECHNICAL NOTESystem Engineering
Document Title
GLAST LAT Background Review
CHANGE HISTORY LOG [Change history log may be deleted if not used]Revision Effective Date Description of Changes DCN #
01 Initial Release LAT-TD-08316-01
LAT BACKGROUND REVIEW - FINAL REPORT, JUNE 2006 �
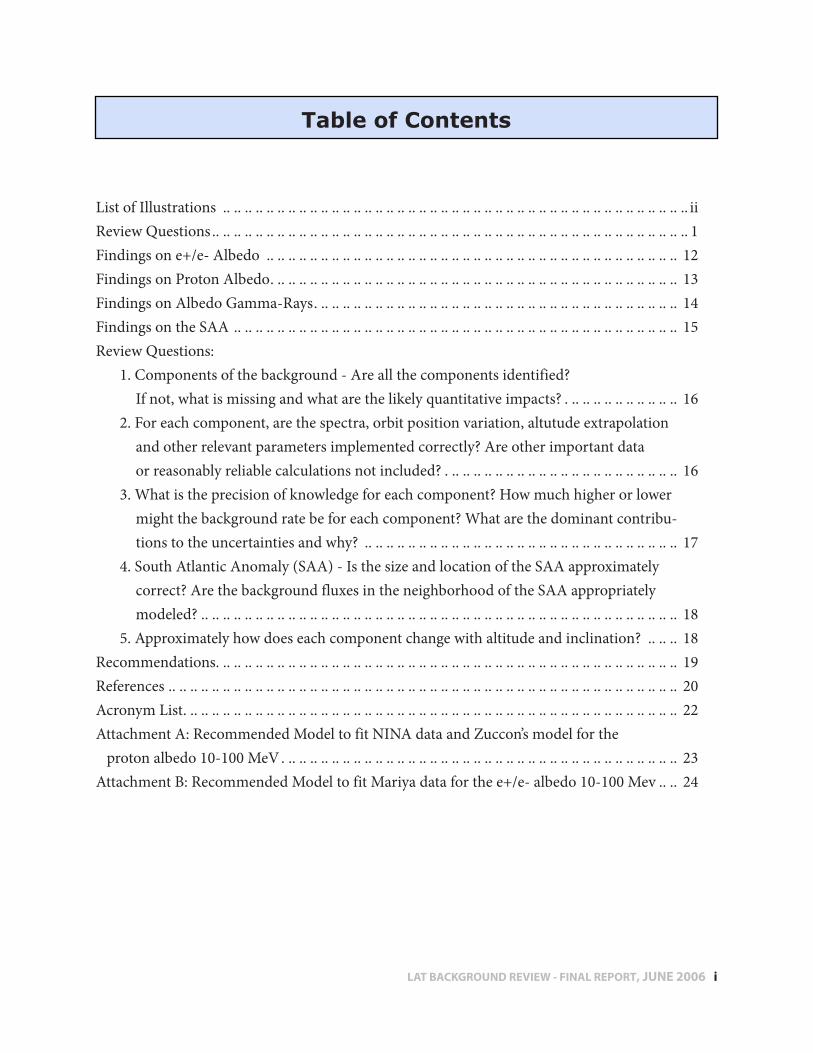
List of Illustrations iiReview Questions 1Findings on e+/e- Albedo 12Findings on Proton Albedo 13Findings on Albedo Gamma-Rays 14Findings on the SAA 15Review Questions:
1 Components of the background - Are all the components identified?If not, what is missing and what are the likely quantitative impacts? 16
2 For each component, are the spectra, orbit position variation, altutude extrapolation and other relevant parameters implemented correctly? Are other important dataor reasonably reliable calculations not included? 16
3 What is the precision of knowledge for each component? How much higher or lowermight the background rate be for each component? What are the dominant contribu-tions to the uncertainties and why? 17
4 South Atlantic Anomaly (SAA) - Is the size and location of the SAA approximatelycorrect? Are the background fluxes in the neighborhood of the SAA appropriatelymodeled? 18
5 Approximately how does each component change with altitude and inclination? 18Recommendations 19References 20Acronym List 22Attachment A: Recommended Model to fit NINA data and Zuccon’s model for the proton albedo 10-100 MeV 23Attachment B: Recommended Model to fit Mariya data for the e+/e- albedo 10-100 Mev 24
Table of Contents
LAT BACKGROUND REVIEW - FINAL REPORT, JUNE 2006 ��
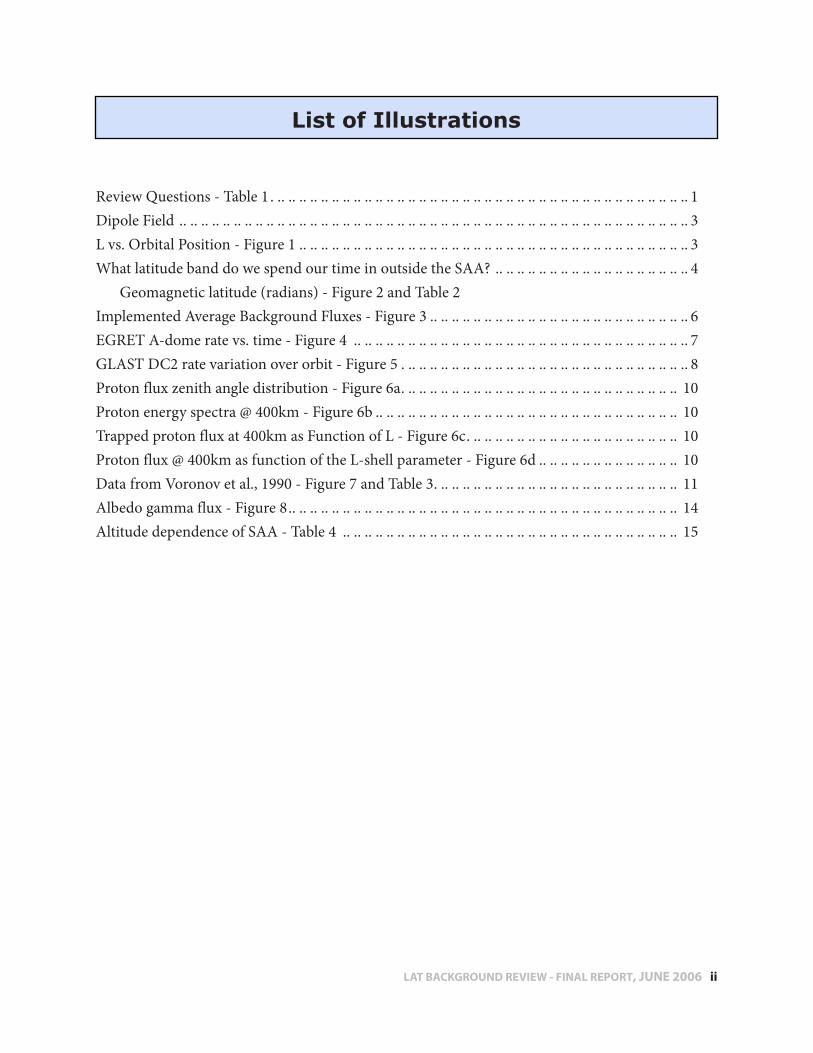
Review Questions - Table 1 1Dipole Field 3L vs Orbital Position - Figure 1 3What latitude band do we spend our time in outside the SAA? 4
Geomagnetic latitude (radians) - Figure 2 and Table 2Implemented Average Background Fluxes - Figure 3 6EGRET A-dome rate vs time - Figure 4 7GLAST DC2 rate variation over orbit - Figure 5 8Proton flux zenith angle distribution - Figure 6a 10Proton energy spectra @ 400km - Figure 6b 10Trapped proton flux at 400km as Function of L - Figure 6c 10Proton flux @ 400km as function of the L-shell parameter - Figure 6d 10Data from Voronov et al , 1990 - Figure 7 and Table 3 11Albedo gamma flux - Figure 8 14Altitude dependence of SAA - Table 4 15
List of Illustrations
LAT BACKGROUND REVIEW - FINAL REPORT, JUNE 2006 �
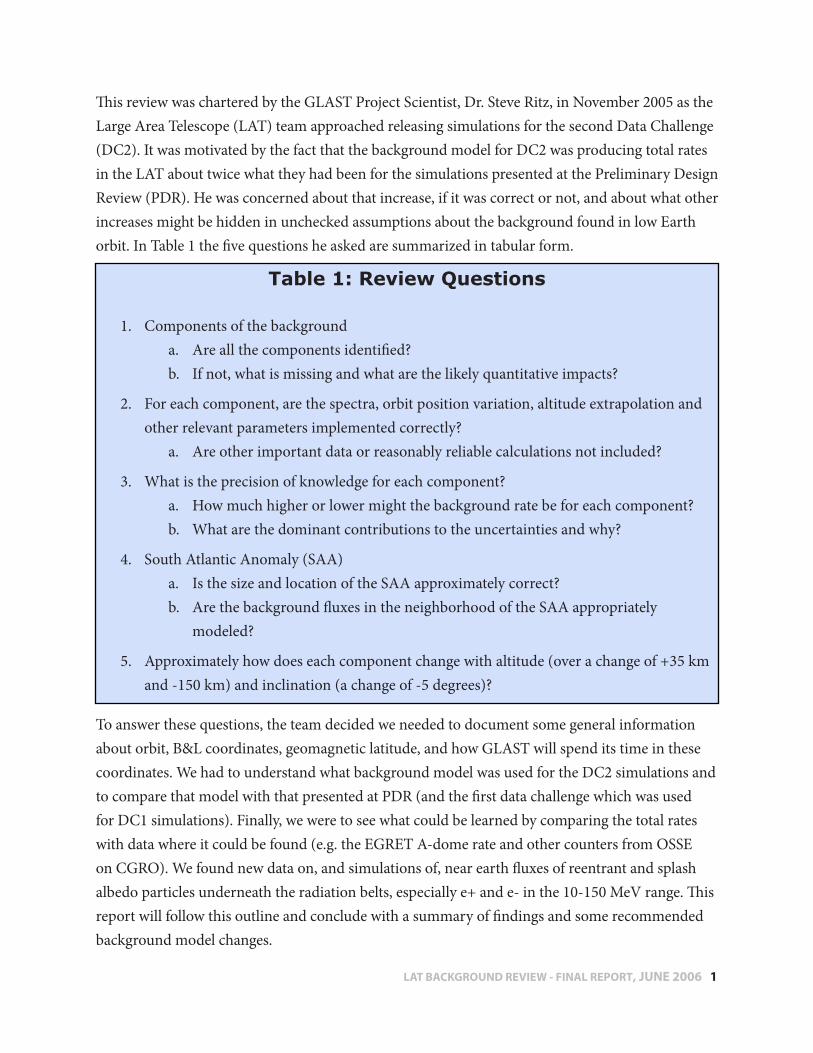
This review was chartered by the GLAST Project Scientist, Dr Steve Ritz, in November 2005 as the Large Area Telescope (LAT) team approached releasing simulations for the second Data Challenge (DC2) It was motivated by the fact that the background model for DC2 was producing total rates in the LAT about twice what they had been for the simulations presented at the Preliminary Design Review (PDR) He was concerned about that increase, if it was correct or not, and about what other increases might be hidden in unchecked assumptions about the background found in low Earth orbit In Table 1 the five questions he asked are summarized in tabular form
To answer these questions, the team decided we needed to document some general information about orbit, B&L coordinates, geomagnetic latitude, and how GLAST will spend its time in these coordinates We had to understand what background model was used for the DC2 simulations and to compare that model with that presented at PDR (and the first data challenge which was used for DC1 simulations) Finally, we were to see what could be learned by comparing the total rates with data where it could be found (e g the EGRET A-dome rate and other counters from OSSE on CGRO) We found new data on, and simulations of, near earth fluxes of reentrant and splash albedo particles underneath the radiation belts, especially e+ and e- in the 10-150 MeV range This report will follow this outline and conclude with a summary of findings and some recommended background model changes
Table 1: Review Questions
1 Components of the backgrounda Are all the components identified? b If not, what is missing and what are the likely quantitative impacts?
2 For each component, are the spectra, orbit position variation, altitude extrapolation and other relevant parameters implemented correctly?
a Are other important data or reasonably reliable calculations not included?
3 What is the precision of knowledge for each component? a How much higher or lower might the background rate be for each component?b What are the dominant contributions to the uncertainties and why?
4 South Atlantic Anomaly (SAA)a Is the size and location of the SAA approximately correct? b Are the background fluxes in the neighborhood of the SAA appropriately
modeled?
5 Approximately how does each component change with altitude (over a change of +35 km and -150 km) and inclination (a change of -5 degrees)?
LAT BACKGROUND REVIEW - FINAL REPORT, JUNE 2006 2
The work summarized in this report was done via VRVS meetings Dec 7, 14, and 21, 2005 and Jan 11, 2006 The final report was presented on Feb 22 There were lots of internal emails and postings that can be found on http://confluence slac stanford edu/display/SCIGRPS/Background+Flux+Review and on http://confluence slac stanford edu/display/SCIGRPS/Background+Fluxes and links therein The background material was prepared by Steve Ritz with additions by Julie McEnery on the Earth albedo gammas For the DC2 Background Model, see the presentation Toby Burnett gave at GSFC entitled Background for DC2 in June 2005 and Mizuno-san’s Proton/e-/e+ background flux models in CRflux that can be found at http://www slac stanford edu/~mizuno/outgoing/CRflux_protonElectronPositron_2005-11-27 ppt
The PDR background model relied heavily on the CHIME1 programs, a model of galactic and solar cosmic ray particle intensities, the radiation belts and other radiation characteristic of the near Earth environment The development of CHIME predated the measurements by the AMS and BESS magnetic rigidity spectrometers on which the DC2 background model was based
The baseline GLAST mission parameters assume an orbit altitude of 565 km (0 0887 RE)2 and
an inclination of 28 5 degrees We were asked to consider orbits from 600 km to 415 km and reduced inclination down to 23 5 degrees 3 We take the Earth’s effective radius for absorbing cosmic rays to be 6400 km
Let f be the fraction of the solid angle of sky blocked by Earth plus atmosphere Then
where a = height of atmosphere for absorbing cosmic rays, h = is the orbital altitude and 6371+(415, 565, 600) km
The cosmic ray intensities vary throughout the solar cycle The intensities can be characterized in an approximate form by a single parameter Φ(t) For our purposes the flux at Earth can be estimated using the force field approximation for the solar modulation of the interstellar spectrum
The AMS data were taken4 when this parameter was Φ = ΦReZ/A, where ΦR=650MV
1 The CRRES/SPACERAD Heavy Ion Model of the Environment (CHIME) specified the location and intensity of galactic cosmic rays, solar energetic particles, and anomalous cosmic rays 2 RE = 6371 km; in some applications one needs to add the height of the atmosphere which is taken to be 30 km for purposes of estimating the height to which cosmic rays can move freely � Subsequent to the commissioning of this report, the mission orbit has been rebaselined to an inclination of 25.4°.4 See references 2 and 3 and Mizuno-san’ Powerpoint for the background model
dE dE mctΕmcΕ
(t)) (E dN (E) dNEarth
−Φ+
−Φ+∞= 22
22
))((
LAT BACKGROUND REVIEW - FINAL REPORT, JUNE 2006 �
Geomagnetic coordinates were introduced early in the space age to simplify the problem of characterizing the radiation environment by using 2 instead of 3 dimensions Locating GLAST in geomagnetic coordinates is essential to using particle fluxes that have been measured by spacecraft in different orbits The methodology has been known since the early days of the space program A convenient description has been provided by the radiation background group at Goddard Space Flight Center (GSFC)5 The box below contains the key components and definitions for the case of a simple dipole field
In reality, the Earth’s dipole is offset from the center of the Earth and is tilted and L values must be calculated based on the detailed field model L values as a function of latitude and longitude are shown in Figure 1 6 Note that reducing the orbital inclination from 28º to 23º would remove access to most of the L shells above 1 8
Much of the existing data is from satellites in different orbits To inter-compare, data is organized in L shell bins However, some of the recently obtained data is binned as a function of geomagnetic latitude To make meaningful comparisons we found it useful to know where
5 http://radhome gsfc nasa gov/radhome/papers/SC_nsrec97 pdf, pages I-15 to I-216 LAT-TD-07754-01: Particle Background Rates from CGRO/OSSE, Draft Dec 21, 2005 prepared by E Grove
For a dipole field, R = Ro cos2 (q dipole) defines lines of constant B, also known as “L shells,” or surfaces of constant L Ro is the radial distance to the field line where it crosses the geomagnetic equator, and R is the radial distance to the point where the field is B at latitude q L is defined as
L = Ro/RE where RE = 6371 km.
For the non-ideal case of the Earth’s field, L is obtained from the multipole model of the field R the geomagnetic latitude QM is defined by R = Lcos2 (QM)
(Adapted from J. L. Barth, reference 4.)
LAT BACKGROUND REVIEW - FINAL REPORT, JUNE 2006 �
GLAST would spend its time, i e what fraction of the orbit was spent at what L coordinate? Figure 2 and the corresponding Table 2 were created from data on orbit simulations provided by Julie McEnery
Our first task was to understand the total simulated rate and whether or not the fluxes being used were correct Why did the rates approximately double going from the simulations done for the LAT Preliminary Design Review (PDR) held in January 2002 to those used in the fall of 2005 for DC2? We found that there were lots of changes going from PDR to DC2 and that there was no simple answer Modeling of the components (e-, e+, p) of the albedo had changed and the latitude dependence, not included at PDR, had been implemented The PDR cosmic ray flux model was based on the CHIME model which includes the east-west effect, whereas the DC2 model was based on AMS(ref 6) measurements We found that the DC2 model of the proton spectrum was accurate,
LAT BACKGROUND REVIEW - FINAL REPORT, JUNE 2006 �
whereas the CHIME model had been based on earlier and out of date measurements We also found that, while the east-west effect will be important in determining the local arrival distribution of particles and their impact locations on the LAT, the east-west effect was unimportant in determining the overall orbit average flux We concluded that the PDR model had underestimated the orbit averaged fluxes of the GCR protons and nuclei by about a factor of 2
AMS was at a much lower altitude (380km) than GLAST will be However, this is NOT the reason for any flux discrepancy from PDR to DC2 For GCR, the Earth shadowing is actually less at higher altitude, and the flux is slightly higher due to the decreased shadowing For the e+/e- and proton albedos, modeling of the intensities shows that the flux varies little with orbital altitude This is consistent with common sense as long as the orbital altitude is small compared to the Earth’s radius and the Earth is essentially “flat”
In summary, we found that the new model by Mizuno-san being used for DC2 was an accurate representation of the fluxes measured by AMS down to energies around 150-200 MeV where the measurements left off We noted that the extrapolations down to 10 MeV were ad hoc: dN/dE α E-1 and will see below they require revision We did not assess the PDR fluxes in detail, but we find nothing to explain the factor of 2 increase in flux from PDR to DC2 except to say that the DC2 models of the individual components of the flux were based on improved measurements by AMS that were not available when the CHIME and CREME models were made
In presenting his original questions to the review team, Steve Ritz had made some observations and asked some questions about these changes; we have added some comments and answers from the Review panel
1 “There were no protons above 100 GeV in the implementation.” It was agreed this should be corrected It has been corrected as of this writing
2 “The albedo e+/e- flux is a factor >3 larger than for PDR. Why? The answer seems to be the orbit variation that was not taken into account for PDR. Is that correct?” Mizuno-san replied: “That’s right The PDR model was (I believe) based on measurement in a high latitude region, whereas DC2 takes the orbit variation into account The albedo e+/e- flux in the equatorial region is about 3 times higher than that in the high latitude region ” (This response is based on the range 150 to 1000 MeV Subsequently we have learned this isn’t true for the lower energy range, 10-150 MeV; see below )
LAT BACKGROUND REVIEW - FINAL REPORT, JUNE 2006 6
3 “Similarly, the GCR proton rate is higher. Is the reason the same?” The galactic cosmic ray proton rate is increased It is a factor of 2 higher than that generated by the code CrProtonPrimary based on the CHIME model CREME7 was the predecessor to CHIME The DC2 fluxes are shown in Figure 3 The integral of the CHIME orbit average flux is ∼ a factor of two below the DC2 implementation based on AMS measurements
4 “Are the CR electrons OK?” The GCR electron spectrum is even steeper than the GCR proton spectrum The simulated spectrum is correct, and flux relative to protons is right However, it should be noted that high energy electrons represent a serious background for high energy gamma rays due to the similarity of their cascades
5 “Is there agreement on the albedo gamma flux now?” Between PDR and DC2 Dirk Petry reanalyzed the EGRET photon data coming from the Earth This work is ongoing For example, this flux should be correlated with the solar modulated flux of GCR, but this effect has not yet been found in the data One would also expect some dependence on latitude,
7 https://CREME96 nrl navy mil/
LAT BACKGROUND REVIEW - FINAL REPORT, JUNE 2006 �
but this has not yet been quantified Between PDR and DC2 the shape of the spectrum changed from that based on the original EGRET analysis The PDR implementation only used the photons from the Earth’s limb DC2 includes the flux from the whole Earth, resulting in an increase in the total flux Julie McEnery recommends we use the fluxes based on the new Petry analysis The integrated flux in the DC2 implementation is 8531 Hz/m^2 (6347435 events generated into a 6m2 sphere over 124 seconds), compared with ~4200 Hz/m^2 for PDR Thus, we determine that this increase in the albedo gamma ray rate is real and based on better understanding of the fluxes and improved modeling
As a final check, we compared our DC2 model total count rates in GLAST with those measured in the EGRET anticoincidence dome (A-dome) Figure 4 shows the count rate in kHz in the A-dome8 for a typical one-day period Note the dropouts due to the SSA
Figure 5 shows the simulation for the LAT, also for a 24-hour period Note that the EGRET A-dome area and the LAT simulated target are both 6m2 There are some differences in sensitivity between the LAT and the A-dome The LAT ACD threshold is set at ~200keV, whereas the A-dome threshold was set to be sensitive to perhaps 10’s of keV However, the light from the large A-dome was subject to attenuation traversing the scintillator to the PMTs making the real threshold position dependent, whereas in LAT the threshold is uniform over the sensitive area of the ACD
8 Plot courtesy of D Bertsch, S Ritz: LAT-PR-00403-03
LAT BACKGROUND REVIEW - FINAL REPORT, JUNE 2006 �
tiles Another difference is in the effect of secondary particles resulting from the different masses of the GLAST and CGRO spacecrafts It is hard to know how to model and correct for these differences and how they might affect the resultant rate comparison, but they are not thought to affect the basic agreement in rates as presented
The rates (outside the SAA) are roughly the same, but the orbit average EGRET rates show more orbital modulation This suggests that the LAT background model does not contain as much variation with latitude as is present in the real world
A Monte Carlo model of EGRET is under construction at Santa Cruz by Bill Atwood Once a new background model is made based on recommendations below, it can be used in this EGRET model to check our conclusions regarding the overall rates Since our average rate is close to that observed by the A-dome, this will provide an important check on the changes we will recommend below
The answers to the questions above left us with several potential issues and further questions The extrapolation of fluxes of e+ and e- albedo from the range 100-1000 MeV down to 10 MeV was done in an ad hoc manner The e+ were of particular concern in this regard Over the energy range 150-1000 MeV, AMS found the e+ intensity was rising faster than the e- as energy decreased The literature
LAT BACKGROUND REVIEW - FINAL REPORT, JUNE 2006 �
on albedo particles describes complex directional properties (anisotropies) that were not included in our modeling Included in this category is the east-west effect on the GCR that means the flux coming from the western horizon is made larger by the bending of positively charged particles in the Earth’s magnetic field (and a corresponding reduction of fluxes from the eastern horizon) We suspected there might be complex dependencies of fluences relative to the particles’ orientation with respect to the local magnetic field known as pitch angle anisotropies There could be variations in time associated with the solar cycle or with disturbances to the Earth’s magnetic field
GCR integral fluxes above will vary by ~20%-30% from solar maximum to solar minimum What about albedo gammas, protons and e+/e- that are produced by GCR hitting the atmosphere? The fluxes of these particles should track the solar cycle How does the flux of albedo particles vary with altitude? How well isolated is the SAA; does the background rise in the neighborhood of the SAA?
To answer these questions we sought out additional data and modeling The AMS group had discovered9 an excess of albedo positrons especially at low geomagnetic latitudes There are two different kinds of albedo discussed in the literature, but they are really two different manifestations of particles produced by cosmic rays interacting with atmospheric nuclei “Splash albedo” is particles observed coming upward from the atmosphere and “reentrant albedo” is particles observed moving down toward the atmosphere (after coming up out of the atmosphere, often in the opposite hemisphere, and following a field line back in) AMS found quasi trapped particles that are quickly reabsorbed by the atmosphere and other particles that bounce between the two hemispheres a few times 10
AMS also measured upward and downward moving albedo protons11 as a function of geo-magnetic latitude from 100MeV to the geomagnetic cutoff Except for the higher latitudes, the spectra are flattening at 200-300 MeV and below The data >100 MeV are relatively accurate, and are well modeled in the DC2 simulations To see how these intensities would extrapolate to energies around 10 MeV we found measurements12 by the NINA and NINA-II instruments flown on Russian satellites They studied proton albedo from 10-35 MeV and showed that indeed the spectra flatten and even fall off below 100 MeV They further show a strong latitude dependence increasing to higher latitudes Data were collected in zenith and sun orientations making it difficult to see anisotropies that had been observed previously A very weak altitude variation was seen in the data going from 400-800km
9 See reference 3 10 Of course, radiation belt particles are trapped for a long time, bouncing back and forth and drifting around the Earth in complex but stable long-lived orbits 11 See reference 1 12 See reference 5
LAT BACKGROUND REVIEW - FINAL REPORT, JUNE 2006 �0
A modeling effort13 was undertaken by the AMS team to understand their results These models are most complete for albedo protons These simulations14 shown in Figure 6 indicate the strong angular dependence (6a) and the latitude variation of the flux integrated above and below 200 MeV (6b) They also indicate how the AMS, which looked only towards the zenith and nadir, did not observe the latitude dependence predicted by the model
13 See reference numbers 28-30 See also 15 and 18 14 See reference 28
LAT BACKGROUND REVIEW - FINAL REPORT, JUNE 2006 ��
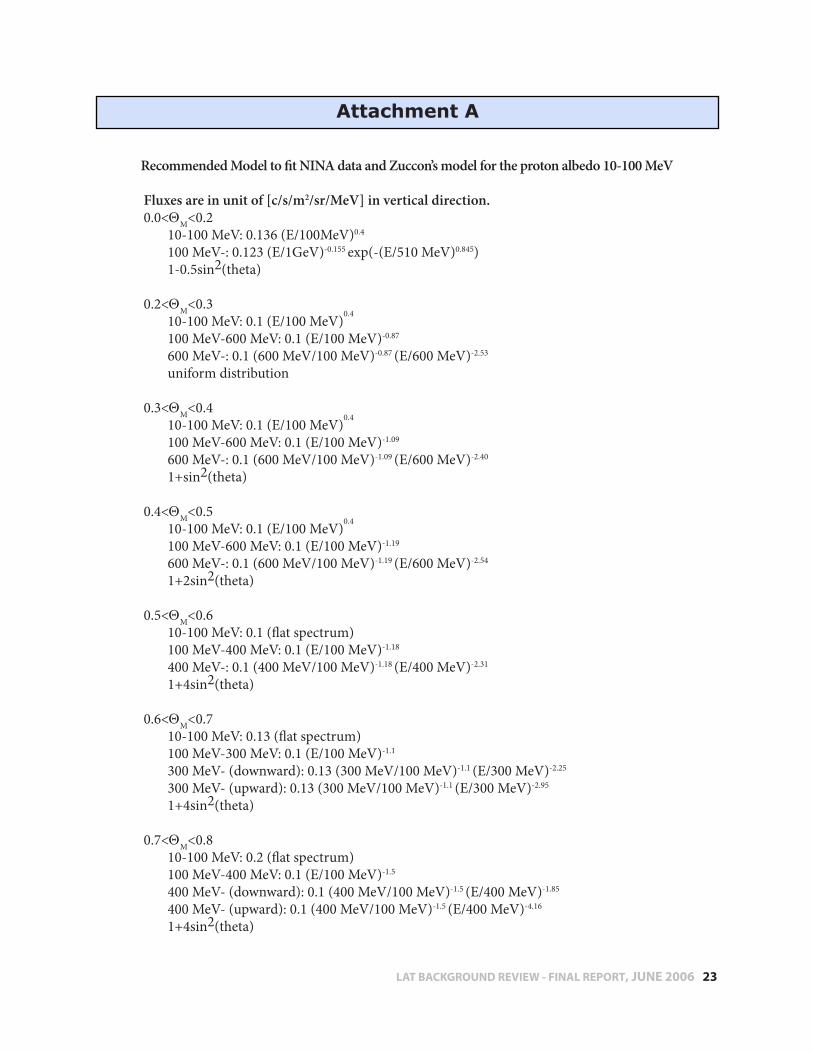
Based on these models we recommend a revision of the latitude dependence of the albedo proton spectra We also recommend new extrapolations below 100 MeV and including the modeled angular distribution It turns out that compensating effects leave the orbit average fluxes as implemented for DC2 correct, but the latitude dependence is incorrect Fixing this will help in reproducing the EGRET A-dome orbital flux variations The DC2 model assumes these fluxes were valid isotropically, but they were not In addition, the representation of the latitude dependence was not correct In the recommendations listed below we will suggest how to fix the background model to remedy these errors, but we give it lower priority (relative to fixing the e+/e- albedo as discussed below) because it will have modest impact on the overall rate predictions The recommended model changes for the albedo protons are given in Attachment A
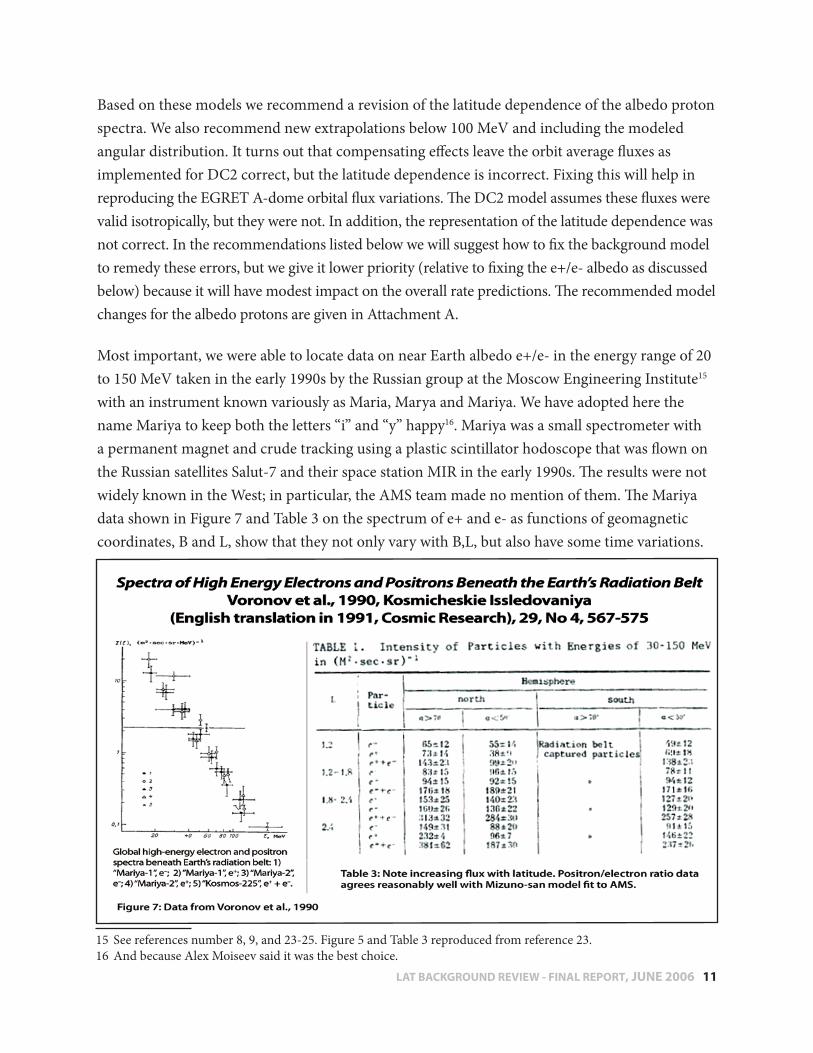
Most important, we were able to locate data on near Earth albedo e+/e- in the energy range of 20 to 150 MeV taken in the early 1990s by the Russian group at the Moscow Engineering Institute15 with an instrument known variously as Maria, Marya and Mariya We have adopted here the name Mariya to keep both the letters “i” and “y” happy16 Mariya was a small spectrometer with a permanent magnet and crude tracking using a plastic scintillator hodoscope that was flown on the Russian satellites Salut-7 and their space station MIR in the early 1990s The results were not widely known in the West; in particular, the AMS team made no mention of them The Mariya data shown in Figure 7 and Table 3 on the spectrum of e+ and e- as functions of geomagnetic coordinates, B and L, show that they not only vary with B,L, but also have some time variations
15 See references number 8, 9, and 23-25 Figure 5 and Table 3 reproduced from reference 23 16 And because Alex Moiseev said it was the best choice
LAT BACKGROUND REVIEW - FINAL REPORT, JUNE 2006 �2
In addition, as examination of the full paper shows, they suggest there are pitch angle and perhaps some weak altitude variations in flux The excess of positrons over electrons seen by AMS at low latitudes goes away or is at least reduced (depending on latitude) at lower energies
Typical errors on the Mariya data points are of the order 20% In other words, the experimental situation is a complex one, and the phase space of variations is not easily represented However, it is very clear that the spectra climb towards lower energy faster than E-1 as assumed for DC2; representations with spectra proportional to E-2 are more representative We have built a model fit (see Attachment B) to these data that has been coded as part of the background model 17 It was not implemented as of background runs made with version 7 of the simulation code This new model of the albedo e+/e- leaves unchanged the model where AMS data exists
We have been in touch with Paulo Zuccon18 who did the modeling for AMS mentioned above He has expressed a willingness to extend his model to lower energy so that it may be compared to the Mariya data When that simulation is completed, the model of albedo fluxes can be made more sophisticated to include anisotropic effects if warranted One simulation19 of the Mariya data was done recently and explains the general features
We were able to confirm the general B,L patterns in these data by looking at intensity maps20 of still lower energy electrons and protons as a function of altitude but below the radiation belts
The presentation of our findings is divided by particle type We begin with the e+/e- albedo. The overall background count rates are dominated by e+ plus e- fluxes in the 30-150 MeV band This band is also important because the e+ can annihilate in flight in the protective blanket that surrounds the LAT, and in the top 1/5-1/3 of the ACD When they annihilate, the photons produced cannot be individually distinguished from celestial photons
Information on positron and electron albedo fluxes comes from a review of the available literature:
• The Mariya data show stronger latitude dependence than do the AMS measurements • The AMS measurements may be off because they don’t sample the full angular
distribution
17 A graphical representation of the formulas in Attachment B can be found at http://confluence slac stanford edu/display/SCIGRPS/Background+Flux+Review18 See references 28-30 19 Reference 19 20 See reference 16
Findings on e+/e- Albedo
LAT BACKGROUND REVIEW - FINAL REPORT, JUNE 2006 ��
• Modeling of the 150 to 1000 MeV fluxes indicates the altitude dependence is negligible over 350-650 km range
• The orbit averaged fluxes in DC2 model with 1/E extrapolation below 100 MeV are low by a factor of more than 1 8, primarily due to underestimates in the high latitude model!
• At highest latitudes where we spend 10% of our time, DC2 flux is underestimated by a factor of 8 5 at energies below 100 MeV (Stick to lower inclination!)
1 The DC2 (Mizuno-san model) model fits well the AMS data (>150 MeV) at higher energies, and is within 20% for equatorial region (QM<0 3), but underestimates the fluxes <100 MeV at higher latitudes by factors up to 8
2 We have proposed21 a new model for the range 10-150 MeV where the flux E-γ and γ depend on latitude (1 77 < γ < 2 5) This new model fits onto AMS data (>150 MeV) at higher energies, and comes within 30% of all the Mariya measurements in the range 30-150 MeV
We continue by summarizing the situation with our summary of the proton albedo fluxes • Proton albedo is less important and less uncertain than the e+/e- component • The low latitude fluxes were overestimated by a factor of 1 5-2 and the high latitude fluxes
were underestimated by a similar amount • AMS does not see spectral hardening at the lowest end of their energy range, but the
spectra must harden between 20 and 200 MeV because of the constraints implied by NINA and NINA2 measurements22 The spectrum of albedo protons does not steepen towards lower energy
• AMS could not see the anisotropy increasing towards the horizon that was reported in the literature because they pointed only towards the zenith and nadir We have replaced the average angular dependence from the literature [1 + 0 6 sin(q), where q is the angle from the zenith] with a more complex angular dependence that depends on latitude and is based on the results of simulations 23
The orbit averaged albedo proton flux is about right, but the modulation with geomagnetic latitude is wrong
21 Mizuno-san has written the code to implement these changes See Attachment B 22 See reference 5 23 See Attachment A and references 28-30
Findings on Proton Albedo
LAT BACKGROUND REVIEW - FINAL REPORT, JUNE 2006 ��
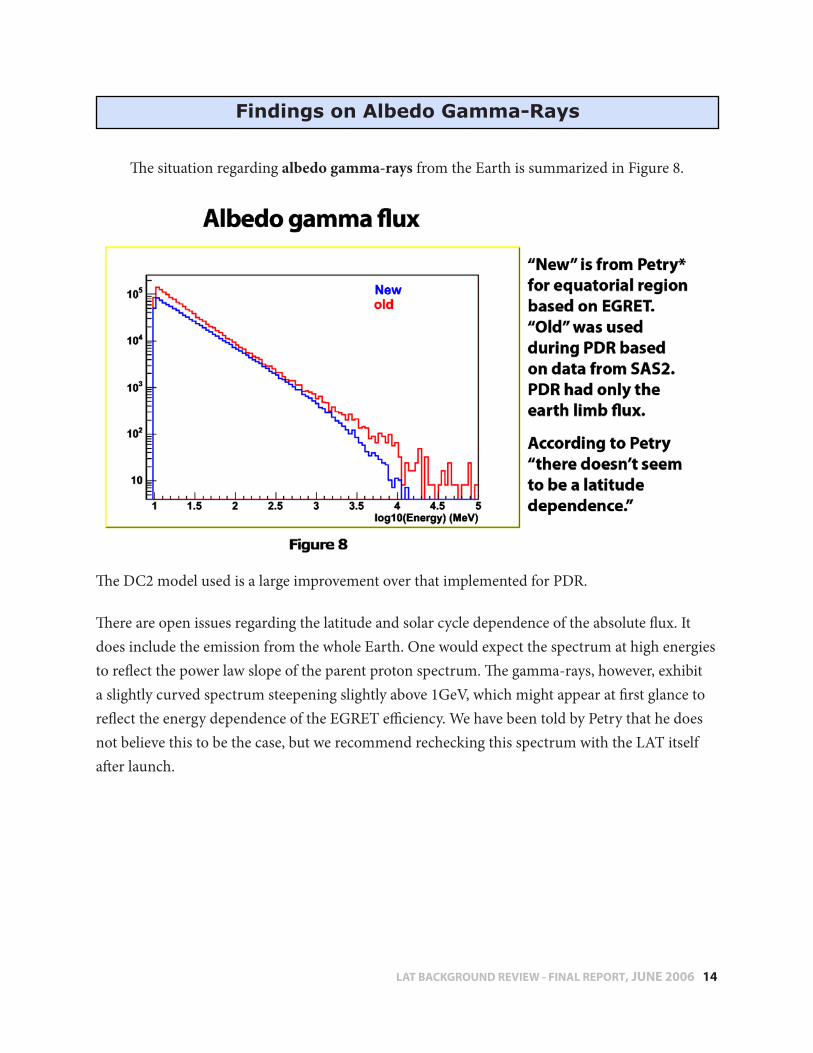
The situation regarding albedo gamma-rays from the Earth is summarized in Figure 8
The DC2 model used is a large improvement over that implemented for PDR
There are open issues regarding the latitude and solar cycle dependence of the absolute flux It does include the emission from the whole Earth One would expect the spectrum at high energies to reflect the power law slope of the parent proton spectrum The gamma-rays, however, exhibit a slightly curved spectrum steepening slightly above 1GeV, which might appear at first glance to reflect the energy dependence of the EGRET efficiency We have been told by Petry that he does not believe this to be the case, but we recommend rechecking this spectrum with the LAT itself after launch
Findings on Albedo Gamma-Rays
LAT BACKGROUND REVIEW - FINAL REPORT, JUNE 2006 ��
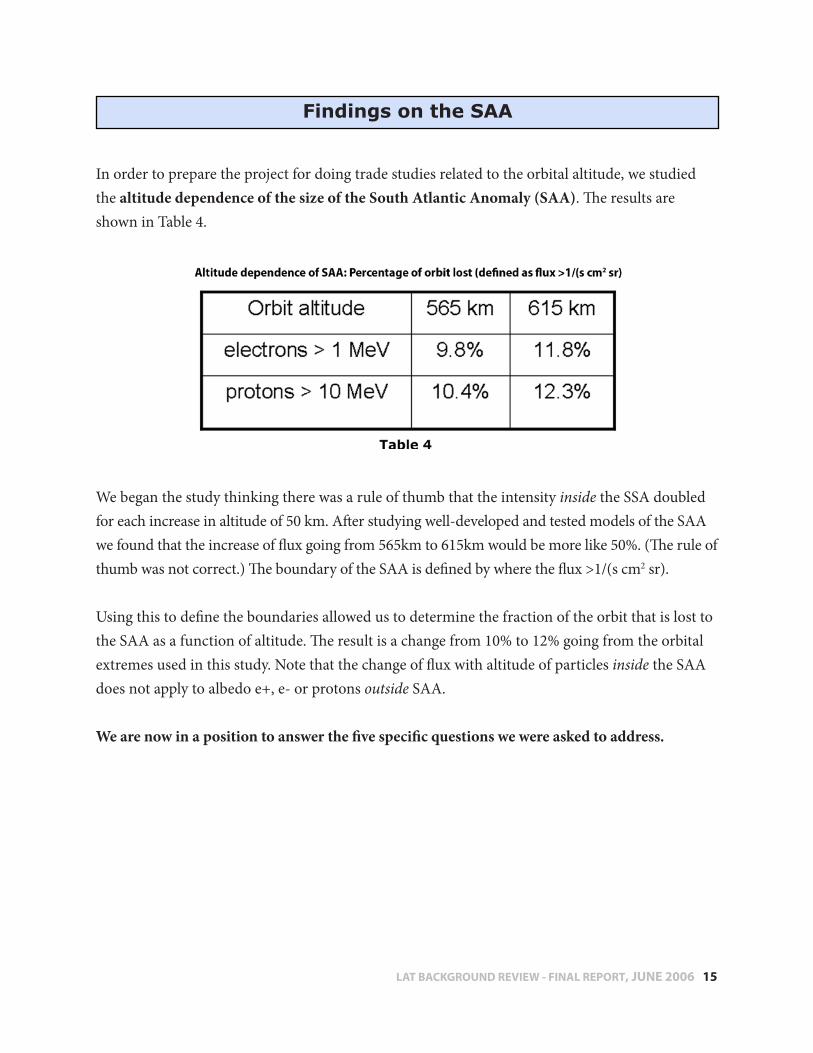
In order to prepare the project for doing trade studies related to the orbital altitude, we studied the altitude dependence of the size of the South Atlantic Anomaly (SAA) The results are shown in Table 4
We began the study thinking there was a rule of thumb that the intensity inside the SSA doubled for each increase in altitude of 50 km After studying well-developed and tested models of the SAA we found that the increase of flux going from 565km to 615km would be more like 50% (The rule of thumb was not correct ) The boundary of the SAA is defined by where the flux >1/(s cm2 sr)
Using this to define the boundaries allowed us to determine the fraction of the orbit that is lost to the SAA as a function of altitude The result is a change from 10% to 12% going from the orbital extremes used in this study Note that the change of flux with altitude of particles inside the SAA does not apply to albedo e+, e- or protons outside SAA
We are now in a position to answer the five specific questions we were asked to address.
Findings on the SAA
LAT BACKGROUND REVIEW - FINAL REPORT, JUNE 2006 �6
1. Components of the background Are all the components identified? If not, what is missing and what are the likely quantitative impacts?
Answers:• Data from the MARIYA (Russia) and NINA (Russia-Italy) experiments and simulations
by the AMS team are new inputs for 10-150 MeV range that improve our understanding of the albedo/quasi-trapped components The quantitative impacts are discussed below in the answer to question 3
• Neutrons and soft gammas from the atmosphere are not included It is believed that these components are not significant, but further checks are recommended The neutron albedo from the Earth24 varies with latitude, following the galactic cosmic ray flux For latitudes < 30 degrees, it is reasonable to assume the total flux is 0 2 n/(cm^2 s) going upwards from the atmosphere aka “the neutron leakage flux ” Roughly 1/2 the neutrons are below 1 MeV, 1/2 above Above 10 MeV it would be reasonable to use 0 01 n/(cm^2 s) going upwards The altitude dependence is (R/RE)-3 2 (R measured from the center of the Earth) The flux numbers given above apply to 300-400km altitudes, so at 600 km, there may be about 10%-12% fewer The LAT can assume ~100 neutrons/(m2 s) (E>10 MeV) and ~1000 neutrons/(m2 s) (all energies)
2. For each component, are the spectra, orbit position variation, altitude extrapolation and other relevant parameters implemented correctly?
Are other important data or reasonably reliable calculations not included?
Answers:• Above 200 MeV, all components, including Earth albedo gammas and all components of
the galactic cosmic rays, are well represented by the DC2 model implementation • Including the east-west effect would not change the orbit average galactic cosmic ray flux25 • For albedo protons, the lower latitude flux is overestimated and the higher latitude flux
is underestimated in the DC2 model The orbit average flux is about right An improved model is given in Attachment A
• Below 100 MeV the 1/E model used for DC2 under-represents the orbit averaged e+/e- albedo flux, especially at higher latitudes The flux used was about 20% high for QM<0 3 but underestimates the flux at higher latitudes by an amount that increases with increasing latitude to a factor of 8 for QM>0 6 A corrected model is given in Attachment B
24 See references 17 and 27 25 As can be shown using Liouville’s Theorum and was validated independently
Review Questions
LAT BACKGROUND REVIEW - FINAL REPORT, JUNE 2006 ��
3. What is the precision of knowledge for each component? How much higher or lower might the background rate be for each component? What are the dominant contributions to the uncertainties and why?
Answers:• Albedo e+ plus e-
- Extrapolation from 150 MeV down to 10 MeV dominates the flux of this dominant component
- The DC2 integral above 10 MeV is ~2 times below the Mariya measurements - We propose a revised model (see Attachment B) that comes a lot closer to the average
of the MARIYA measurements, but to quote from Fiandini,26 “…e- and e+ fluxes differ significantly in regions of different L, B coordinates and different pitch angles ” “Significantly” seems to be factors of 1 5-2
- The measurements vary with pitch angle and time - This extrapolation is still uncertain We estimate the orbit average flux could be
+/-50% from the revised model Restricting ourselves to energies >30MeV, the uncertainty is less, probably +/-30%
- Angular distributions are probably important but are not being modeled - The DC2 background model was based on AMS data AMS did not observe oriented
in B, L coordinates, MARIYA did - MARIYA observed changes with time, AMS could not These changes are not modeled - AMS and MARIYA data do not fit together smoothly; our revised model does - 10-100 MeV fluxes increase with latitude; AMS zenith and nadir fluxes do not - Residual uncertainties are likely to be latitude dependent: The DC2 model is high at
low latitude and is low at high latitude • Albedo gammas: Albedo gammas are probably modeled correctly in DC2 We do not have
a curve of the latitude dependence from EGRET, but do have an assurance from Petry that his analysis represents an orbital average The shape of the lowest energy part of the spectrum is the same as that found with SAS-2 data
• Albedo protons: The DC2 orbit averaged flux seems about right Models of where in the orbit these particles are found and their angular distribution indicates there should be 1 5-2x fewer at low latitude and 1 5-2x more at high latitude A proposed revised model is given in Attachment A Once implemented, the residual uncertainly in the orbit averaged flux should be ~30%
• Galactic cosmic ray e+, e-, protons, helium, and heavier nuclei: The DC2 fluxes are correct for solar minimum The measurements and the model are probably both good to ~10% East-west asymmetries are not accounted for but do not affect the orbit averaged fluxes
26 See reference 11
➢
➢➢
➢➢
➢➢
➢➢➢➢
LAT BACKGROUND REVIEW - FINAL REPORT, JUNE 2006 ��
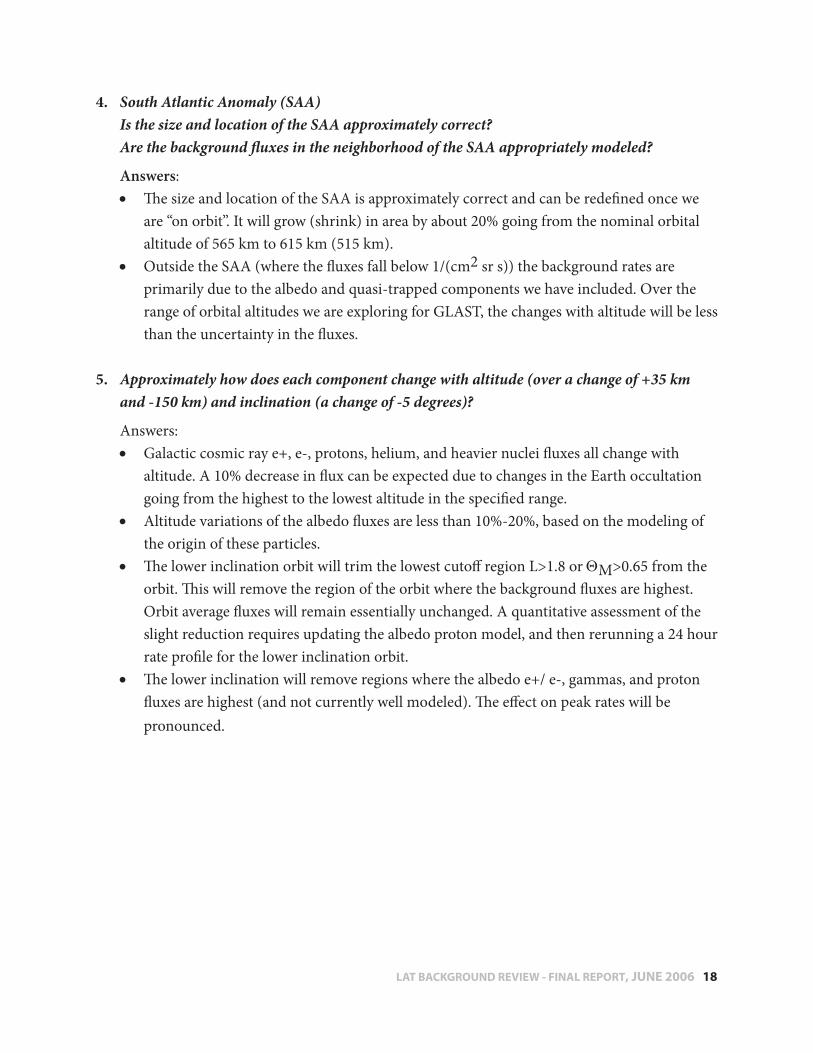
4. South Atlantic Anomaly (SAA) Is the size and location of the SAA approximately correct? Are the background fluxes in the neighborhood of the SAA appropriately modeled?
Answers:• The size and location of the SAA is approximately correct and can be redefined once we
are “on orbit” It will grow (shrink) in area by about 20% going from the nominal orbital altitude of 565 km to 615 km (515 km)
• Outside the SAA (where the fluxes fall below 1/(cm2 sr s)) the background rates are primarily due to the albedo and quasi-trapped components we have included Over the range of orbital altitudes we are exploring for GLAST, the changes with altitude will be less than the uncertainty in the fluxes
5. Approximately how does each component change with altitude (over a change of +35 km and -150 km) and inclination (a change of -5 degrees)?
Answers:• Galactic cosmic ray e+, e-, protons, helium, and heavier nuclei fluxes all change with
altitude A 10% decrease in flux can be expected due to changes in the Earth occultation going from the highest to the lowest altitude in the specified range
• Altitude variations of the albedo fluxes are less than 10%-20%, based on the modeling of the origin of these particles
• The lower inclination orbit will trim the lowest cutoff region L>1 8 or QM>0 65 from the orbit This will remove the region of the orbit where the background fluxes are highest Orbit average fluxes will remain essentially unchanged A quantitative assessment of the slight reduction requires updating the albedo proton model, and then rerunning a 24 hour rate profile for the lower inclination orbit
• The lower inclination will remove regions where the albedo e+/ e-, gammas, and proton fluxes are highest (and not currently well modeled) The effect on peak rates will be pronounced
LAT BACKGROUND REVIEW - FINAL REPORT, JUNE 2006 ��
• Mizuno-san has well represented the AMS albedo and GCR fluxes and recently (after DC2) added coding to represent the lower energy e+/e- data Runs should be made with this new extension to the background model and the resultant simulated spectra should be checked against the data
• The model for the albedo protons should be revised to reflect changes in the latitude dependence Runs should also be made with this new extension to the background model and the resultant simulated spectra should be checked against the data
• The impact of including the neutrons into the model should be checked
• We believe the EGRET A-dome rates should be approximately the same as the rates thrown at the LAT simulation cross sectional area (6 m2 in both cases) Following the above checks, the orbit average fluxes and the modulations seen over a day of orbital variations should be compared with those of the EGRET A-dome (Figure 4 above )
• The details of the model should be checked against any improved modeling of the albedo fluxes such as those being conducted currently by Paulo Zuccon in Italy Obviously we should also keep an eye out for any new data
• The impact of e+ annihilations and proton interactions in the micrometeorite shield and thermal blanket should be studied first by modeling the orbital variations in low energy gamma ray fluxes and then, once in orbit, compared with the observations This should be done in not only B and L coordinates along the orbit, but also in coordinates perpendicular and parallel to the local magnetic field The idea is to find a modulation of the background gamma rays that can be used to estimate their fraction of the observed gamma rays
• It would be prudent to check the shape of the Earth albedo gamma-ray spectrum after the launch, especially at high energies where the EGRET and SAS-2 data may be affected by energy dependent efficiencies Also, it would be good to see if the latitude dependence of the flux is correlated with the GCR flux variations
Recommendations
LAT BACKGROUND REVIEW - FINAL REPORT, JUNE 2006 20
RefeRences
1 Aguilar et al , 2002, The Alpha Magnetic Spectrometer (AMS) on the International Space Station: Part I – results from the test fight on the space shuttle, Physics Reports 366, 331-405
2 Alcaraz et al , 2000, Protons in Near Earth Orbit, Physics Letters B, 472, 215-2263 Alcaraz et al , 2000, Leptons in Near Earth Orbit, Physics Letters B, 484, 10-224 Barth, Janet, A “Short Course” modeling the near Earth radiation environment can be found at:
http://radhome gsfc nasa gov/radhome/papers/SC_nsrec97 pdf a Most of what we need is found on pages 36-40 of the 85 total Section 5 1 3 is for trapped
protons and section 5 1 4 is for electrons Figures 5 1 3 1 on page 36 shows the dependence on McIlwan’s L parameter which, at the magnetic equator, is equivalent to altitude in units of the Earth’s radius Figures 5 1 3 2 and 5 1 4 2 (incorrectly labeled protons instead of electrons) refer to the Daly et al , 1997
5 Bidoli et al 2002, Energy spectrum of secondary protons above the atmosphere measured by the instruments NINA and NINA-2 Annales Geophysicae, 20, issue 10, 1693-1697
6 Daly, E J , A Hilgers, G Drolshagen, and H D R Evans, 17 April, 1997, Space Environment Analysis: Experience and Trends, [ESA/ESTEC WWW document]
a http://www estec esa nl/CONFANNOUN/96a09/Abstracts/abstract45/paper/ 7 Derome, L , M Bue´nerd, and Youg Liu, 2001, Secondary electrons and positrons in near earth
orbit, astro-ph/01034748 Dmitriev, A et al , 1998, Energetic particle fluxes data base of ``CORONAS-I’’ satellite
observations, Advances in Space Research, Vol 21, No 12, 1669-1674 9 Dmitriev, A V , et al , 1998, Distribution of Energetic Particles and Secondary Radiation
According to Orbital Station ‘MIR’ Data Obtained in 1991, 1998, Advances in Space Research, Vol 21, No 12, 1797-1800
10 Fiandrini, E and G Esposito, 2002, Leptons with E>200 MeV trapped in the South Atlantic Anomaly, J Mod Phys A, Feb 15, 2002, lep-insaa1-jmpa
11 Fiandrini, E , et al , 2002, Leptons with E>200 MeV trapped in the Earth’s radiation belts, JGR, 107, 148-227, 10 1029/2001JA900151
12 Grove, E , Particle Background Estimates for GLAST LAT, LAT-TD-07718-01 13 Grove, E , Particle Background Rates from OSSE, LAT-TD-07754-01 14 Gusev, A A , 2002, Trapped positron flux formation in the innermost magnetosphere of the
Earth, Earth Planets Space, 54, 707–714 15 Huang, M -H A , 2001, Origin of Large Albedo Positron Flux, Proc ICRC, 1733 16 Kohno, T , et al 1990, Intensity Maps of MeV Electrons and protons Below the Radiation Belt,
Planet. Space Sci., 38, 4, 483
References
LAT BACKGROUND REVIEW - FINAL REPORT, JUNE 2006 2�
18 Kuznetsov, S N et al , 2001, Energetic Charged Particle Fluxes under Radiation Belts, Proc 27th International Cosmic Ray Conference Hamburg, Germany 07-15 Aug, 2001, p 1651
19 Mikhailov, 2002, Low Energy Electron and Positron Spectra in the Earth Orbit Measured by Maria-2 Instrument, J of Mod Phys A, 17, Ns12-13, 1695-1704
a http://ams pg infn it/analysis/workshop/trento/mikhailov pdf20 Petry, D , 2004, The Earth’s Albedo as Observed by EGRET, arXiv: astro-ph/0410487 21 Selesnick, R S , and M D Looper, 2004, Low-altitude distribution of radiation belt electrons, J
Geophys Res , 109, A11209, doi:10 1029/2004JA010611, 11 pages 22 Tylka, A , 2000, A review of Cosmic-ray Albedo Studies: 1949-1970, LAT-TD-07720-01 23 Voronov, S A , A M Galper, S V Koldashov, L V Maslennikov, V V Mikhailov, and A V
Popov, 1991, Energy spectra of high-energy electrons and positrons below Earth’s radiation belt, Cosmic Res , Engl Transl , 29(4), 567-575
24 Voronov, S A , S V Koldashov, and V V Mikhailov, 1995, Spectra of albedo electrons and positrons with energy greater than 20 MeV, Cosmic Res , Engl Transl , 33(3), 329-331
25 Voronov, S A , S V Koldashov, and V V Mikhailov, 1995, Nature of High-Energy Electrons in Earth’s Radiation Belt, Cosmic Res , Engl Transl , 33(5), 546-549
26 Watts, J W , et al , 1987, Approximate Angular Distribution and Spectra for Geomagnetically Trapped protons in Low-Earth orbit, AIP Conf Proc 186, High Energy Radiation Background in Space, 75, (1987)
27 Weidenspointner, G , 1998, The local neutron flux at low earth orbiting altitudes, Adv Space Res Vol 21, No 12, 1781-1784
28 Ziccon, P , Presentation of results: The radiation environment below the radiation belts, INFN Perugia
a See particularly pages 43-47 b http://ams pg infn it/~zuccon/Bari pdf 29 Zuccon P : A Monte Carlo simulation of the cosmic rays interaction with near Earth
environment, PhD dissertation a http://ams pg infn it/Tesi/tesi_zuccon pdf30 Zuccon, P , et al , 2003, A calculation of the radiation environment for satellite experiments
operating below the Van Allen belts, ICRC 2003, 4292 a http://www-rccn icrr u-tokyo ac jp/icrc2003/PROCEEDINGS/PDF/1040 pdf
LAT BACKGROUND REVIEW - FINAL REPORT, JUNE 2006 22
A-dome: The EGRET Anti-coincidence domeACD: Anti-Coincidence DetectorAMS: Alpha Magnetic SpectrometerBESS: Balloon-borne Experiment with a Superconducting SolenoidCGRO: Compton Gamma-Ray ObservatoryCHIME: Cosmic ray effects on Micro-electronicsCOMPTEL: Compton Telescope (The COMPTEL instrument, on the Compton Gamma Ray Observatory, is a Compton imaging telescope operating in the energy range 0 75 - 30 MeV )CREME: Predecessor to CHIME Cosmic Ray Effects on Micro ElectronicsCRRES: Combined Release and Radiation Effects SatelliteDC2: Data Challenge 2EGRET: Energetic Gamma-Ray Experiment TelescopeGCR: Galactic Cosmic RayGLAST: Gamma-ray Large Area Space TelescopeGSFE: Goddard Space Flight CenterLAT: Large Area TelescopeMARIYA: Russian experiment to electrons and positrons in near Earth spaceNINA: Russian-Italian experiment to study 1-10 MeV nuclei in near Earth spaceOSSE: Oriented Scintillation Spectrometer ExperimentPDR: Preliminary Design ReviewPMT: Photomultiplier TubeRVS: Virtual Rooms Video-conferencing SystemSAA: South Atlantic AnomalySAS-2: Small Astronomy Satellite, #2SPACERAD: Space Radiation Effects Program for CRRES mission
Acronym List
LAT BACKGROUND REVIEW - FINAL REPORT, JUNE 2006 2�