DOCUMENT DE TRAVAIL N° 415 DIRECTION GÉNÉRALE DES ÉTUDES ET DES RELATIONS INTERNATIONALES THE IMPACT OF A ‘SODA TAX’ ON PRICES. EVIDENCE FROM FRENCH MICRO DATA Nicoletta Berardi, Patrick Sevestre, Marine Tepaut and Alexandre Vigneron December 2012 (revised version may 2016)
Transcript
DOCUMENT
DE TRAVAIL
N° 415
DIRECTION GÉNÉRALE DES ÉTUDES ET DES RELATIONS INTERNATIONALES
THE IMPACT OF A ‘SODA TAX’ ON PRICES.
EVIDENCE FROM FRENCH MICRO DATA
Nicoletta Berardi, Patrick Sevestre, Marine Tepaut and Alexandre Vigneron
December 2012 (revised version may 2016)
DIRECTION GÉNÉRALE DES ÉTUDES ET DES RELATIONS INTERNATIONALES
THE IMPACT OF A ‘SODA TAX’ ON PRICES.
EVIDENCE FROM FRENCH MICRO DATA
Nicoletta Berardi, Patrick Sevestre, Marine Tepaut and Alexandre Vigneron
December 2012 (revised version may 2016)
Les Documents de travail reflètent les idées personnelles de leurs auteurs et n'expriment pas nécessairement la position de la Banque de France. Ce document est disponible sur le site internet de la Banque de France « www.banque-france.fr ». Working Papers reflect the opinions of the authors and do not necessarily express the views of the Banque de France. This document is available on the Banque de France Website “www.banque-france.fr”.
∗Berardi: Banque de France, SAMIC-DEMS-DGEI, 31 rue Croix des Petits Champs,75001Paris, France (e-mail address: [email protected]); Sevestre: AMSE-GREQAM, Aix-Marseille Université, Chateau Lafarge, route des Milles, 13290 Les Milles, France (e-mail address:[email protected]); Tépaut: Université de Paris I - Panthéon Sorbonne, 106-112 Boulevardde l’Hôpital, 75013, Paris, France (e-mail address: [email protected]); Vigneron: Université Paris-Est Créteil, Faculté de Sciences Economiques et de Gestion, 61 avenue du Général de Gaulle, 94010Créteil Cedex France (e-mail address: [email protected]). The authors wish to addressspecial thanks to Prixing, the start-up that provided the data used in this paper and in particular EricLarchevêque, the owner and CEO of the company. Thanks also to Christine Boizot-Szantal, CélineBonnet, Clément Carbonnier, Claire Chambolle, Pauline Givord, Stéphane Gregoir, Vincent Réquillart,and Julio Rotemberg, as well as participants to seminars at Banque de France, GREMAQ (University ofToulouse), INRA-ALISS (Ivry), and to conferences (JMA, Nice, June 2012; AFSE and LAGV, Marseilles,June 2012; 18th International Conference on Panel Data, Paris, July 2012). Errors and shortcomings areour own. The views expressed in this paper are those of the authors and do not necessarily representthose of their institutions.
1
Résumé: A partir d’une base de données constituée de plus de 500,000 observationssur le prix de boissons non alcoolisées, nous évaluons l’impact de la ‘taxe soda’, instituée
depuis le 1er Janvier 2012 en France. L’approche retenue, en "différence de différences",
nous permet de montrer que la taxe a progressivement été répercutée dans le prix des
boissons contenant du sucre ajouté ou des édulcorants. Six premiers mois après son intro-
duction, la taxe était totalement répercutée dans le prix des sodas et presque totalement
pour les boissons aux fruits, tandis que de façon partielle pour les eaux aromatisées. Nous
montrons également que l’impact de la taxe sur les prix a été différent selon les marques
de boissons et les groupes de distribution.
Mots-clés: Taxe d’accise, boisson, sucre ajouté, incidence, ajustement de prix
Codes JEL: E31, D40
Abstract: Based on an original data set of more than 500,000 non-alcoholic beverageprice records, we evaluate the impact on consumer prices of the ‘soda tax’, an excise on
drinks with added sugar or sweetener, introduced in January 2012 in France. We adopt
a difference in differences approach and find that the tax was gradually passed through.
6 month after its introduction the tax was fully shifted to soda prices and almost fully
shifted to prices of fruit drinks, while the pass-through for flavored waters was incomplete.
We also find that the pass-through was heterogeneous across brands and retailing groups.
Keywords: soda tax; pass-through; tax incidence; excise tax.
JEL classification: E31, D40
2
1 Introduction
Since January 2012 a ‘soda tax’has been introduced in France, based on the claim that
drinks containing added sugar or sweetener are unhealthy and that their consumption
should be discouraged. A similar tax already existed in some countries, like Denmark,
Finland and Hungary and in many US states (OECD, 2012; Bridging the Gap Program,
2011). The excise concerns all non-alcoholic beverages with added sugar or sweetener,
like sodas, but also flavored waters and fruit drinks. It amounts to 7.16 cents per liter,1
but a full pass-through of the soda tax would amount to a price increase of 7.55 cents
per liter, given that VAT applies to the excise.
The aim of this paper is to evaluate the impact of the French soda tax on the price
of the three main product categories of concerned drinks: (i) flavored waters, (ii) fruit
drinks and ready-to-drink teas, and (iii) sodas (including colas, energy, tonic and other
soft drinks). Because the tax was not necessarily immediately and fully shifted to prices,
our analysis allows for gradual price reactions over time. We also consider the possibility
of heterogeneity in the tax pass-through across retailing groups and beverage brands.
This paper contributes to the still sparse literature on the impact of sugar sweetened
beverage (SSB) excise taxes on prices. Despite the increasing interest in the impact
of SSB taxes on soft drinks consumption and, consequently, on health or obesity (e.g.,
Brownell et al. 2009; Dharmasena and Capps, 2012; Finkelstein et al., 2013; Jacobson
and Brownell, 2000; Lin et al., 2010; Smith et al., 2010; Fletcher et al., 2010), there is
still little evidence regarding the impact of an SSB tax on soda prices. Actually, most
often the impact of a soda tax on obesity and health has been simply estimated under
the assumption of full pass-through of the tax to prices.
The theoretical literature regarding the impact of excise taxes on prices in markets
with perfect competition is unambiguous: in standard cases (i.e., upward sloping supply
curve and downward sloping demand), the tax is under-shifted to prices (i.e., prices
increase by less than the tax). In particular, the smaller the elasticity of demand and
the larger the elasticity of supply, the larger the pass-through of the tax to prices. Only
if demand is totally inelastic or if the supply curve is infinitely elastic (i.e., marginal
costs are constant), the tax is fully passed-through to prices (Fullerton and Metcalf,
2002). However, when goods are sold on markets where imperfect competition prevails,
depending on the characteristics of demand and on those of production costs, excise taxes
may be either under-shifted, fully shifted or even over-shifted to prices.
Since non-alcoholic beverages can be considered highly differentiated products, no-
1Law number 2011-1977, passed on December 28th, 2011 (the government initial project was to setthe tax at 3.58 cents per liter and only for beverages with added sugar).
3
tably differing from each other in terms of taste and quality and since we focus on the
impact of the soda tax on prices over the months just following its introduction, we may
here restrict our attention to results regarding the short-run impact of excise taxes on
prices on markets with differentiated products.2 Anderson et al. (2001) show that in the
case of differentiated products, if firms compete in prices and if the elasticity of demand is
constant, an excise tax is over-shifted to prices. Taking into account product differentia-
tion in a context of spatial competition (i.e., the intensity of competition is stronger with
firms selling ‘close’products than with those selling ‘far distant’products), Fullerton and
Metcalf (2002) show that an excise tax is fully passed-through to producer prices and
over-shifted to consumer prices (as long as an ad valorem tax also applies).
Are theoretical predictions corroborated by existing empirical studies regarding the
impact of SSB taxes on prices? The few empirical assessments of the pass-through of
a soda tax to prices available until now suggest that the soda taxes would rather be
over-shifted to prices. Bergman and Hansen (2013) evaluate the impact of various excise
tax variations on alcoholic and non-alcoholic beverage prices in Denmark. Based on the
analysis of micro price data used by Statistics Denmark to compute the Danish Consumer
Price Index, they conclude that the two increases in the soft drink tax that occurred in
1998 and 2001 were strongly over-shifted to consumer prices. Using a quite different
approach, Bonnet and Réquillart (2013) come to the same conclusion. They specify a
structural model where competition is horizontal (among producers on the one hand and
among retailers on the other hand), as well as vertical (between producers and retailers)
and show using simulations that an excise SSB tax is likely to be over-shifted to prices.
Beyond these two studies, a few empirical studies consider the more general question
of the impact of specific consumption taxes on prices. Besley and Rosen (1999) have
considered the impact of sales taxes on a large number of products in US. They also
outline an over-shifting of these taxes to soda prices. Doyle and Samphantharak (2008)
find under-shifting of gasoline sales tax changes, while Marion and Muehlegger (2011)
full pass-through in the US. Carbonnier (2007) shows that French VAT changes in the
new car and housing repair services sectors were under-shifted. The conclusions that can
be drawn from other studies devoted to the impact of excise taxes on prices of alcoholic
beverages or cigarettes are also diverse. Although Kenkel (2005) and Young and Bieliska-
Kwapisz (2002) also conclude to over-shifting of taxes to alcoholic beverage prices, as do
Hanson and Sullivan (2009) regarding cigarette prices, De Cicca et al. (2013) find full
shifting while Chiou and Muehlegger (2010) and Harding et al. (2012) find under-shifting.
2It is also important to distinguish between short-run and long-run effects as, in the long run, firmsentries and exits affect the tax impact on prices (see Stern, 1987; Delipalla and Keen, 1992; Anderson etal., 2001).
4
In order to evaluate the extent of the pass-through of the French soda tax to prices,
we apply a difference in differences approach to an original data set made of about 52,000
price trajectories. Each trajectory refers to a non-alcoholic beverage (defined by its brand,
quantity, packaging, etc. and individually identified by its bar code) sold in a specific shop
(defined by its name, retailing group, and address). Overall, the prices of 845 different
beverage products sold in one or more of the 760 supermarkets present in the data set
are followed from August 2011 to June 2012.3
We find that, after 6 months, the tax was fully shifted to soda prices, while there
was a significant under-shifting of the tax to prices of flavored waters and a slight one
to prices of fruit drinks. Notice that the preponderance of sodas sales among the non-
alcoholic beverages liable to the tax suggests a quasi-full shifting of the excise to beverage
prices at the macroeconomic level, supporting the full shifting assumption often made in
studies about the impact of SSB taxes on the consumption of soft drinks. Moreover, our
results point to a significant heterogeneity of the soda tax pass-through not only across
product categories, but also across retailing groups as well as across beverage brands.
In particular, the average quasi-full shifting of the tax results from the combination of
an over-shifting for private labels and small producers’brands (at least for fruit drinks)
and of an under-shifting of the tax in the case of large producers’brands. At the same
time, we find that the two main retailing groups in France often passed through the soda
tax less than the other ones. These results are shown to be consistent with a simple
producer-retailer bargaining framework.
The remaining of the paper is structured as follows. Detailed presentations of the
data and empirical strategy are provided in Sections 2 and 3, respectively. Section 4 is
devoted to the presentation of the results regarding the average magnitude and timing
of the pass-through, while Section 5 contains a discussion of the heterogeneity of the
pass-through across brands and retailers. Section 6 concludes.
2 Data
Our analyses of the impact of the soda tax are based on data collected by Prixing, a start-
up that developed a price comparator available on mobiles and on the internet. Prixing
developed automatic procedures allowing the collection of price lists from ‘drives’. A
drive is a place where you collect goods you have previously ordered on the internet.
Most drives are associated with a supermarket, but there are also a few ‘stand alone’
drives (‘warehouse-drives’/ ‘drives-entrepôt’in French). This form of retailing gained in
3These data were collected and made available to us by Prixing, a start-up company providing con-sumers with a free mobile price comparator (see http://www.prixing.fr/).
5
importance since 2010 in France: there were around 500 drives in France at the end of
2010, their number doubled by the end of 2011, to reach almost 2,000 by the end of 2012
and about 2,700 by the end of 2013 (Dauvers, 2013a, 2013b). This new retailing channel
differs from the usual internet retailers in two respects: customers have to go to the drive
to collect the purchased goods and, more importantly for our analysis, prices are exactly
those that customers would pay, would they go and buy the same product in the physical
store associated with the drive.4
Although the range of products available in a drive is a bit smaller than that available
in the associated physical store, it is still considerable. On average, about 10,000 products
are available to customers in drives, ranging from 3,000 products in the smallest ones
up to 25,000 in the largest ones (Dauvers, 2012). This has to be compared with the
number of products offered in supermarkets, which ranges between 5,000 and 10,000
for small supermarkets and reaches between 30,000 and 100,000 in hypermarkets (i.e.,
outlets with a selling space of at least 2,500m2).5 The list of products available in drives
thus represents a quite significant fraction of those available in supermarkets and its
structure broadly corresponds to that of products available in supermarkets, i.e., with a
strong predominance of food products (almost two thirds of collected prices), non-durable
household goods such as washing-up liquid or dishwasher detergent (around 12%) and
personal care products (around 10%). Prices of clothes and household appliances are also
recorded though for a much more limited number of items.
The initial data bases we were given access to contain prices regarding more than
135,000 products sold in about 1,800 drive outlets, i.e., almost the total population of
drives that existed in mid-2012 in France. The average number of products for each
drive in this data set is about 9,000. Altogether, this represents about 80 millions price
spells6 covering the period between March 2010 and September 2012.7 Unfortunately,
4One of the major retailing chains in France recently tried a different pricing strategy whereby a fewproducts are sold at a cheaper price in some drives than in the associated supermarkets. However, thispractice was not yet implemented at the time of the collection of the data we use here. More in general,it may happen that some discounts are available in the physical store and not in drives and vice-versa.
5E.g. see Auchan website : http://www.groupe-auchan.com/nos-activites/hypermarches/ or Neuville(2009). Notice that in France supermarkets and hypermarkets represent more than 70% of grocery sales(Anderton et al., 2011).
6A ‘price spell’is the triplet made of the following three elements:1) the price of a precisely defined product i, identified by its bar-code (e.g., a 1 liter glass bottle of
brand b pure orange juice) in a given store j (e.g., the supermarket/drive from the retailing group g,located at a given address),2) the date when this price was first set (start date of the price spell),3) the date when this price was changed, possibly temporarily only (end date of the price spell).If the price of a product in a shop decreases from 1 euro to 80 euro cents and then increases to 90 euro
cents, this will define 3 price spells, possibly (right or left) censored.7At the end of April 2012 we were provided with a first data base covering the period March 2010
to mid-April 2012. We then obtained in October 2012 a second data base that covers the period April
6
due to technical problems, the first waves of collected prices were often subject to severe
measurement errors regarding in particular the beginning and end dates of the recorded
price spells and/or the classification of products. Our analysis is then based on price data
limited to the period from August 2011 until June 2012. Overall, this data set comprises
about 52 millions spells starting in August 2011 or later, the original price records having
most often been collected on a daily basis.8
Because our focus in this paper is on the soda tax, we restricted the sample to non-
alcoholic beverages, and more specifically to three categories of products: (i) waters, (ii)
fruit drinks and ready-to-drink teas, and (iii) sodas (including colas, energy, tonic and
other soft drinks). A ‘product’is a specific beverage defined by its brand, its physical
characteristics (nature of the content, volume content, presence of added sugar or sweet-
ener, etc) and its packaging (e.g., 1 liter of pure apple juice, in a glass bottle, produced by
Pampryl). It is uniquely identified by its EAN barcode9. The original data set contains
prices of about 3,000 distinct non-alcoholic beverage products and each drive on average
sells 345 of these products (unfortunately not continuously).
Besides the necessary shortening of the period of analysis induced by the unreliability
of the recorded start and end dates of price spells before August 2011, we had to do
some further trimming of the data set. First of all, the information about the sugar or
sweetener content of beverages was not easily accessible for all beverages. After discarding
products for which we could not find this information, the ‘beverage sample’contained
more than 2 millions price spells associated with about 1700 distinct beverages. Second,
we also discarded spells with inconsistent start and end dates (i.e., a start date posterior
to the end date). Third, some more trimming had to be done due to missing data or
outliers regarding the price or the quantity contents for some products. In order to limit
the presence of outliers, we computed, for all products within classes defined by product
category × brand × month × soda tax liability, the distributions of the price per literand discarded the observations below the 1st and above the 99th percentiles. Moreover,
we excluded prices associated with monthly increases or decreases exceeding +/- 30%, in
to September 2012. The availability of exact identifiers of both products and drive outlets allowed us tomerge these two data bases.
8At the beginning of price collection in March 2010, Prixing collected prices in less drives and notnecessarily daily. A preliminary analysis of the data bases suggested that data are reliable since August2011. Starting the sample in May 2011, i.e., only three months before the current beginning date ofthe sample (August 2011), would dramatically decrease the number of price trajectories available in abalanced panel to 2,268 (instead of 51,622 in the current sample). Adding three months before and afterthe current sample, that is having a balanced panel from May 2011 to September 2012 would only leave1,776 price trajectories. A balanced sample from November 2010 to September 2012 would contain noobservation.
9The EAN barcodes (originally European Article Number, now renamed International Article Numbereven though the abbreviation EAN has been retained) are international product identification numbers.
7
log-differences.10 Fourth, to avoid composition effects and to allow for a proper difference
in difference analysis, we kept in the sample only the combinations of products and shops
for which the price was recorded every month over the period August 2011 to June 2012.
Since the total number of observations was still considerable (more than 15 millions
price records, once price spells are converted into daily price records), we decided to keep
only one price observation per month, chosen as the most frequently observed price over
a month for each specific product sold in a specific shop. The resulting monthly modal
price is similar in spirit to the reference price as defined in Eichenbaum et al. (2011),11
that is a ‘normal’price around which there may be temporary fluctuations (e.g., due to
temporary promotions). Since we are not interested in the day to day impact of the tax
on prices, ignoring temporary price discounts should not be an issue.12
Finally, in order to improve the representativeness of our sample, we have weighted
the data. Indeed, besides the issue of the sample representativeness of brands, not all
retailing groups developed drives at the same pace. In particular, one of the major
retailing groups in France lagged behind regarding the opening of this type of outlet,
while a smaller player offered this option in most of its supermarkets, even in small ones.
Therefore, our sample of drives (although almost exhaustive) did not necessarily provide
a representative picture of supermarket sales at the aggregate level. The weight given to
each observation in our sample was defined in two steps. First, the weight ωbg of brand
b sold in retailing group g has been computed as the product of the brand market share
MBb (see Tables A2 to A4 in the Appendix) by the retailing group market share MGg
(see Table A1 in the Appendix):
ωbg =MBb × MGg.
The same rule has been used for computing the market share of each retailing group’s
private label: the total market share of private labels has been split across retailing
groups, assuming that their respective market share is that of the retailing group itself.
Second, the weight ωbg has been divided by the number of observations available for
brand b in retailing group g, assuming that brand market shares are broadly similar across
10Using an higher threshold (+/- 80%) does not induce any significant change in the estimation results(available upon request).11In Eichenbaum et al. (2011), reference prices are defined as the modal price over a quarter, while
we opt for the modal price over a month.12Temporary discounts are not very frequent in our sample nor in the French retailing sector in general
and are not seasonal (e.g. see Baudry et al., 2007, and Berardi et al., 2013), so that their impact, if any,should be negligible. Moreover, for these temporary sales to have a significant impact on the pass-throughestimates would require a strong and permanent change in their frequency and magnitude, specificallyfor taxed products after the tax implementation, a phenomenon about which we have no indication.
8
shops of the same retailing group:
ω∗bg = ωbg / Nbg.
Therefore, the weighted sample should be representative, at the national level, of both
the retailing groups’market shares and of those of brands.13
Table 1 reports some descriptive statistics about our final sample, decomposed into:
waters that contain added sugar/sweetener (typically flavored waters), and those that
don’t; fruit drinks that contain added sugar/sweetener and fruit juices that don’t; and
sodas, which all contain either added sugar or sweetener.
Table 1: Descriptive statistics (August 2011 - June 2012 sample)Product Tax N. obs. N. of N. of Mean price (euro/liter)
category: per month products shops Aug.2011 Dec.2011 Jun.2012
Water No 9806 166 747 0.55 0.55 0.54
Yes 1292 25 504 0.78 0.78 0.83
Fruit drink No 13705 271 722 1.70 1.72 1.74
Yes 9515 157 635 1.19 1.19 1.25
Soda Yes 17304 226 716 1.23 1.23 1.30
Total - 51622 845 760 - - -
Despite the trimming that had to be done, our sample compares favorably in terms
of number of observations, product coverage, and shop coverage to most of those used in
the literature for assessing the impact of taxes on prices. Indeed, our econometric sample
contains 567,842 observations made of 51,622 price trajectories regarding the prices of
845 products sold in at least one among the 760 drive outlets in which prices have been
collected.14 The external validity of results based on our data is supported by the fact
that drives have exactly the same prices as the physical store and a very similar range of
13The results obtained using the unweighted data (available upon request) are not qualitatively differentfrom those presented below.14In order to check the robustness of our results to the sample composition, we built a second econo-
metric sample covering the period November 2011 to June 2012 (see Section 4.3). This restricted periodallows to significantly increase the number of products for which we are able to continuously track prices(see Appendix B).
9
products, as well as by our weighting, which ensures representativeness at the national
level of both brands and retailing groups’market shares.
Table 1 also shows that average prices are, not surprisingly, different across product
categories. This is a direct consequence of their specific characteristics: pure fruit juices
are higher quality products than fruit flavor beverages. Similarly, flavored waters are
more sophisticated products than simple waters.
3 Empirical strategy for the assessment of the tax
pass-through
3.1 Definition of control groups
In order to estimate the pass-though of the soda tax, one would ideally compare the
evolution of prices of the concerned products with their counterfactual price evolution had
the excise not been introduced. Since it is impossible to observe the true counterfactual,
the empirical strategy to identify the pass-though of the soda tax relies on the comparison
of the treated individuals with those of a control group, which is assumed to reflect the
behavior of the treated group if the treatment had been absent. Therefore, a prerequisite
for a satisfactory control group is to exhibit a price evolution as similar as possible to that
of the treated group before the treatment, that is before the introduction of the excise in
January 2012.
Figures 1, 2, and 3 below represent (respectively for flavored waters, fruit drinks and
teas, and sodas) the evolution of the average prices of the products that became liable
to the tax in January 2012 (represented in the left graph in each Figure), together with
those of prices for some alternative control groups (other graphs to the right in each
Figure), month by month between August 2011 and June 2012. The monthly average
price level is normalized to the average price in December 2011 (the month before the
excise introduction) for taxed and untaxed beverages within each product category, so
that each bar represents the difference between the average price during a given month and
that of prices prevailing in December 2011. The observed price changes are represented
in the graphs as percentages of the expected price change (including VAT) in case of
full pass-through of the excise. For instance, 80% of full-pass-through corresponds to a
nominal price increase of 6 cents.15
1580% of the excise tax including VAT (7.16 cents plus a 5.5% VAT), that is, 80% of 7.55 cents.
10
Figure 1: Evolution of average prices of taxed flavored water and corresponding control
groups, normalized to the price in December 2011 and expressed as percentages of the
full pass-through
Note : The left panel shows the difference between the monthly average price of the
taxed product category and its price in December 2011, as percentage of the full pass-
through (7.55 cents, VAT included). The second panel shows the evolution of prices for
the preferred control group. The last panels show the evolution of prices for alternative
control groups.
The graphs on the left of Figures 2 and 3 show that, for fruit drinks and teas as well
as for sodas, the average price trajectory of the products liable to the tax was remarkably
flat before the introduction of the tax. Flavored waters (Figure 1) do not exhibit the
same pattern: their prices increased at a quite regular (yet quantitatively limited) pace
during the pre-tax period. These graphs also show that prices of taxed beverages strongly
increased from January 2012 onward, pointing to a quite significant and immediate impact
of the tax.
Next to the right, the evolution of the average prices of products constituting our
preferred control group is presented. The benchmark control group for flavored waters
is the whole set of beverages not affected by the excise, that is, water and fruit juices
11
without sugar or sweetener added. Indeed, the overall evolution of prices of these untaxed
beverages before the tax introduction is quite close to that of the taxed flavored waters.
For taxed fruit drinks and sodas, the evolution of prices before the introduction of the
tax was quite flat, a characteristic shared by ‘normal’waters, which therefore constitute
their benchmark control group.
Figure 2: Evolution of average prices of taxed fruit drinks and teas and corresponding
control groups, normalized to the price in December 2011 and expressed as percentages
of the full pass-through
Note: The left panel shows the difference between the monthly average price of the
taxed product category and its price in December 2011, as percentage of the full pass-
through (7.55 cents, VAT included). The second panel shows the evolution of prices for
the preferred control group. The last panels show the evolution of prices for alternative
control groups.
Finally, the right panels of the Figures present alternative control groups, used for
checking the robustness of our conclusions. The first set of alternative control groups have
been obtained using a matching procedure: each taxed beverage sold in a given shop was
matched with all untaxed beverages sold in the same shop, with weights proportional
to the closeness of their pre-tax price evolution (see Section 3.2 for a more detailed
presentation of this matching procedure). The last graphs shown in Figures 1 and 2
provide the price evolution for the last alternative control groups we consider. They
12
correspond to untaxed products of the same category (waters in Figure 1 and fruit drinks
and juices in Figure 2). Such a control group does not exist for sodas as there exists no
soda without added sugar or sweetener. This definition of the control groups relies on the
supposed similarity of the physical characteristics of taxed and untaxed beverages within
each category. However, these control groups do not strictly comply with the common
trend assumption.
Figure 3: Evolution of average prices of sodas and corresponding control groups,
normalized to the price in December 2011 and expressed as percentages of the full pass-
through
Note: The left panel shows the difference between the monthly average price of the
taxed product category and its price in December 2011, as percentage of the full pass-
through (7.55 cents, VAT included). The second panel shows the evolution of prices for
the preferred control group. The last panels show the evolution of prices for alternative
control groups.
Before moving to the details of the econometric models and estimated results, notice
that Figures 1, 2, and 3 clearly show at a descriptive level that all the alternative control
groups lead to the same qualitative conclusion: the tax was under-shifted to prices of
flavored water and fruit drinks and fully shifted to soda prices.
13
3.2 Econometric estimation of the pass-through
Figures 1, 2, and 3 graphically suggest that the implementation of the soda tax induced
a significant increase in the prices of the beverages concerned by the excise. However,
a proper quantitative assessment of the impact of the tax on prices calls for the use of
treatment analysis tools. Our preferred estimates of pass-through for (taxed) flavored
waters, fruit drinks, and sodas are obtained using a standard difference in differences
approach, in which the control groups have been chosen so as to share similar pre-tax
average evolutions of prices, by respectively estimating the following three econometric
models:
Pijt =∑τ
βwτ Dijtτ + λwt + αwi + δwj + εijt
with i ∈ {taxed flavored waters, all untaxed beverages} ,Pijt =
∑τ
βfτ Dijtτ + λft + αfi + δfj + εijt
with i ∈ {taxed fruit drinks, untaxed waters} ,Pijt =
∑τ
βsτ Dijtτ + λst + αsi + δsj + εijt
with i ∈ {taxed sodas, untaxed waters}
where Pijt is the monthly modal price per liter (in euro cents) of product i sold in shop
j at time t; the dummy variable Dijtτ equals 1 when product i contains added sugar
or sweetener and the period τ ∈ {Jan., Feb.,Mar., Apr.,May, Jun.}(i.e., the productis liable to the tax), while it equals 0 otherwise. The parameters βcτ for c ∈ {w, f, s}(for waters, fruits drinks, and sodas, respectively) measure the price increase (in euro
cents per liter) induced by the tax. They have to be compared to 7.55, that is the price
increase that would be associated with a full pass-through of the tax. The parameters
λct , αci and δcj are fixed effects controlling respectively for the aggregate time effects,
for product unobserved and observed time-invariant characteristics (including whether
they contain added sugar or sweetener or not, whether the brand is a private label or a
national brand, etc.) and for unobserved and observed time-invariant shop characteristics
(retailing group, location, local competition, etc.).
In order to test the robustness of the results, three additional sets of pass-through
estimates have been obtained, respectively based on: 1) a matching procedure; 2) the
same difference in differences approach as above, but with different control groups; and
3) a simple difference approach.
Matching aims at achieving the maximal similarity between the treated and un-
treated observations. The matching procedure we have implemented is inspired by
14
the synthetic control approach proposed by Abadie et al. (2010). However, given
the large number of potential controls, their optimizing procedure is unfeasible in our
case. We thus adapt their approach and adopt a matching procedure in two steps.
First, we consider as ‘neighbors’ of a taxed beverage i sold in a shop j all the un-
taxed beverages sold in the same shop. Second, these untaxed beverages are given
weights inversely proportional to the distance between their pre-tax price variations
and those of the considered taxed beverage. More precisely, the distance is defined as∑DecemberSeptember
∣∣(P Taxedijt − P Taxed
ijt−1 )− (PUntaxedijt − PUntaxed
ijt−1 )∣∣, that is, the sum over the period
from September to December of the absolute values of the difference between the pre-tax
monthly price variations (P Taxedijt − P Taxed
ijt−1 ) of the considered taxed beverage and that
of an untaxed beverage sold in the same shop (PUntaxedijt − PUntaxed
ijt−1 ). In case the price
of the taxed product remained unchanged over the whole pre-tax period, only untaxed
products with unchanged prices over the same period are considered as possible neigh-
bors, and all the matching observations are then given the same weights.16 Finally, the
synthetic control associated with a taxed product was computed as the weighted average
of its neighbors. This procedure thus amounts to build synthetic controls that are close
to the treated unit, since the products used as controls share similar pre-tax price trends
and are sold in the same shop.
The second set of alternative pass-through estimates corresponds to a simple and
intuitive, though not necessarily statistically optimal, control group. Indeed, we simply
take as the control group for taxed products of a category (waters, fruits drinks and teas)
the group of all untaxed product in the same category: untaxed waters are used as the
control group for taxed flavored waters, while untaxed fruit drinks and juices for taxed
fruit drinks. This definition of the control groups essentially relies on the proximity of
the main physical characteristics of the taxed and untaxed products. However, it does
not guarantee that the parallel pre-trend assumption is satisfied.
The third set of alternative pass-through estimates is based on a simple difference
analysis. Indeed, Figures 2 and 3 show that, at least on average, the prices of both
taxed fruit drinks and sodas remained quite stable between August and December 2011.
Therefore, it does not seem unreasonable, at least for these two product categories, to
consider that simply comparing their prices before and after the tax (i.e., before and after
January 2012) may provide a relatively satisfactory estimate of the pass-through.
16Notice that this procedure did not allow to find any match for a few taxed products sold in agiven shop. We thus discarded these observations from our estimation sample for all the analyses. Acomparison with the estimates obtained with our initial sample (see Berardi et al., 2012) shows that thisdid not have any significant implication for our pass-through estimates.
15
4 Average magnitude and timing of the pass-through
of the soda tax to prices
Have producers and retailers passed the soda tax through to consumer prices? When
and to which extent (a full pass-through of the soda tax would amount to 7.55 cents per
liter)? This section answers these questions. We first present the difference-in-difference
estimated pass-through of the soda tax over time resulting from our preferred control
groups. The pass-through estimated with alternative control groups and other robustness
checks follow.
4.1 Benchmark results
The left panel of Table 2 reports the estimated average impact of the tax on prices of
products that are liable to the tax for each of the three product categories we consider
(flavored water, fruit drinks and teas, and sodas).17 Since there may be lags in the
transmission of the tax to prices, we report the estimated pass-though month by month
over the first semester of 2012. The right panel shows the results of tests of the extent of
the pass-through as of June 2012.
In contrast with the few results available in the literature about the impact of SSB
taxes on prices, we do not get any indication of a significant over-shifting of the tax, on
average. Indeed, we get only full pass-through of the tax in the case of sodas and an
almost full pass-through for fruit drinks. More precisely, the average increase in prices for
sodas reached the expected 7.55 euro cents in April 2012 and, even though soda prices
still increased a bit after April 2012, in June 2012 the test cannot reject the assumption
of a full shifting (while that of a significant over-shifting can be rejected at the usual
5% level). Regarding fruit drinks, the estimated pass-through (7.1 cents) is below the
full pass-through threshold, thus leading to a slight under-shifting of the tax (with a
pass-through coeffi cient of 94%). However, both the assumption of full shifting and that
of under-shifting cannot be rejected (the p-value obtained when testing full shifting is
larger than that obtained when testing for under-shifting). Finally, the pass-through of
flavored waters is clearly incomplete. In June 2012 it amounted to only about 4.7 cents
(62% of the full pass-through).
17Because the main objects of interest of this paper are the coeffi cients βcτ , which estimate the priceeffect of the tax, the Tables do not report the other parameter estimates. The full estimation results areavailable on request.
16
Table 2 : Average pass-through (in cents per liter) by month
(August 2011 - June 2012 sample)Product Pass-through estimates (Jan. to Jun.) Pass-through degree tests (Jun.)
category: Jan. Feb. Mar. Apr. May Jun. Under-sh. Full shift. Over-sh.
the differences in the prices of the concerned products, at least across stores belonging
to the same retailing group. However, empirical evidence suggests the opposite, even
for large, well-known, dominant producers (Dauvers, 2014). Our data also show price
differences that often exceed 30% for the same product across drives belonging to the
same retailing group.
The absence of over-shifting that is pointed out by our results is not surprising, based
on the fact that the elasticity of demand for non-alcoholic beverages consumption to prices
has been estimated to be significantly larger than 1, in absolute value (e.g., Bonnet and
Réquillart, 2013 and Bonnet and Dubois, 2010 on French data, as well as Pofahl et al.,
2005 or Alviola et al., 2010 on US data). Moreover, these studies also show that the
price elasticity of demand for water is larger (in absolute value) than that for the two
other groups of products (which instead have similar price elasticities). Indeed, Bonnet
and Réquillart (2013) estimate that demand elasticities for sodas and fruit drinks range
from -2.13 to -3.95 (depending on the brand), while Bonnet and Dubois (2010), using
similar data (the TNS/Kantar Worldpanels for 2005 and 2006 in France) and approach
(a random coeffi cients logit model), estimate that the elasticity of water demand is -5.8.
This provides a rationale to the differences in the estimated pass-through between water,
on the one hand, and fruit drinks and sodas on the other hand. Moreover, the lower
pass-through obtained for water may also stem from the fact that flavored waters are
more easily substituted by other products than fruit drinks and sodas. Indeed, normal
waters are similar and cheaper than (taxed) flavored waters. This contrasts with the case
of fruit drinks: pure fruit juices are significantly more expensive than fruit drinks, thus
making the substitution more unlikely. In the case of sodas, finding a close (and untaxed)
substitute is even more diffi cult, as all sodas are liable to the tax and as the degree of
product differentiation is quite high across sodas.
Beyond the issue of the magnitude of the pass-through, it is also interesting to notice
that the pass-through of the tax to beverage prices was spread over several months.
Despite the fact that a significant number of retailers left their prices unchanged in
January, i.e., even after the tax became effective (see Berardi et al., 2012),19 between
one half (for fruit drinks) and two-thirds (for sodas) of the tax was, on average, already
passed-through to the prices in January. This is not imputable to a simple January
seasonal effect, since the evolutions of the offi cial price indices for waters on the one
hand, and fruit drinks and sodas on the other hand, do not exhibit any seasonal pattern
(see Figure C1 in the Appendix). Finally, the stabilization of the pass-through estimates
for waters and soda (and to a lower extent for fruit drinks) from May 2012 onward can be
19This phenomenon was also emphasized by Bergman and Hansen (2013) regarding the impact of theDanish SSB taxes.
18
considered an indication that all the desired price adjustments associated with the SSB
tax were completed by the end of the first semester 2012.
4.2 Alternative control groups and simple differences
In order to assess the robustness of the estimates provided in the previous section, we
estimated the tax pass-through using the alternative control groups described in Section
3. The estimated average pass-through coeffi cients (as of June 2012) resulting from these
alternative control groups are reported in Table 3.
First, considering the synthetic control groups obtained by our matching procedure,
the comparison between the second and the third columns of Table 3 indicates that
this computationally very intensive procedure leads to estimated pass-through that are
extremely similar to our benchmark.
The fourth column of Table 3 shows the estimated pass-through when considering
the second set of alternative control groups, i.e., untaxed waters and untaxed fruit juices
as alternative control groups for flavored waters and fruit drinks respectively. Although
these results still point to an under-shifting of the tax for flavored waters and fruit drinks,
from a quantitative point of view the pass-through appears larger for flavored waters and
smaller for fruit drinks with respect to our benchmark estimation. This is due to the fact
that, even though the treated and control groups share a similar nature, the latter do not
comply with the common trend assumption. On the one hand, the larger pass-through
for flavored waters comes from the stability of normal water prices before January 2012,
which doesn’t perfectly match the slightly increasing prices of the former. On the other
hand, the lower pass-through for fruit juices results from the fact the average price of
pure fruit juices exhibit an increasing pre-tax trend.20
Finally, the last column of Table 3 shows the estimated pass-through coeffi cients
relying on simple differences, i.e., the impact of the pass-through is estimated only based
on the differences in the prices of the products that are liable to the tax before and after
the tax was implemented. The results again point to an under-shifting of the tax and
to the same ranking of the pass-through across product categories as our benchmark
results: the pass-through was larger for sodas than for fruit drinks, while in turn fruit
drinks exhibited a larger pass-through than flavored waters.
20Moreover, although pure fruit juices seem at first an intuitive control group for fruit drinks in termsof the product nature, they have a composition (100% fruit juice) that strongly differs from that of fruitdrinks and ready-to-drink teas (for which the main ingredient is water).
19
Table 3 : Average pass-through (in cents per liter) in June 2012 for alternative control
groups and first difference (August 2011 - June 2012 sample)Treated group Preferred Alternative Alternative First diff.
Product control gr. (Matching) (Untaxed prod. of
category: same prod. categ.)
Water 4.7 4.7 5.9 4.9
(0.3) (0.2) (0.5) (0.2)
Fruit drink 7.1 6.8 3.9 6.3
(0.7) (0.4) (0.4) (0.3)
Soda 7.7 7.5 - 7.0
(0.3) (0.4) (0.2)Note: all regressions contain month, shop and product fixed effects.
Standard errors, clustered by shop, are given in parentheses.
4.3 Further robustness checks
Beyond defining control groups in alternative ways, we also tested for the reliability
of the benchmark estimates running two other types of robustness checks. First, we
estimated an alternative model allowing the price of products liable to the tax to increase
from October 2011, i.e., when the excise was discussed in the Parliament.21 Indeed, it
is possible that producers and/or retailers anticipated their reaction to the excise and
started raising their prices before January 2012. In order to check whether this might
have been the case, we estimated a model allowing retailers to have increased prices of the
products containing sugar or a sweetener starting from October 2011 (i.e., even before
these products were actually taxed). The results are reported in Table 4 and point to the
absence of an anticipation behavior.
Second, we further checked the robustness of our results by estimating our bench-
mark model on a different sample, which starts in November 2011 rather than in August
2011. The rationale for this choice is that the evolution of prices between August and
December 2011 was rather flat. Therefore, using as pre-tax prices even only a couple of
months before the tax (November and December 2011) should not make a big difference
with respect to using pre-tax prices observed over the five months between August and
December 2011. However, the great advantage of starting our sample in November 2011
is a huge increase in the product coverage. Indeed, the number of products continuously
21It was definitively voted in December 2011, just a few days before its implementation.
20
observed between November 2011 and June 2012 is much larger than that of products
observed between August 2011 and June 2012. This alternative ‘November to June’sam-
ple contains prices of 1,019 products sold in 958 shops, amounting in total to 1,056,416
observations (versus 845 products sold in 760 shops, amounting to 567,842 observations
in our ‘August to June’sample). As the estimates in Table 5 show, the pass-through
coeffi cients obtained with this larger sample are qualitatively similar to those obtained
with the sample covering the longer period. The main difference is that the conclusion
that the French soda tax was not fully passed-through to prices extends here to sodas.
Table 4 : Average pass-through (in cents per liter) by month, allowing for anticipated
price increases (August 2011 - June 2012 sample)Product category: Oct. Nov. Dec. Jan. Feb. Mar. Apr. May Jun.
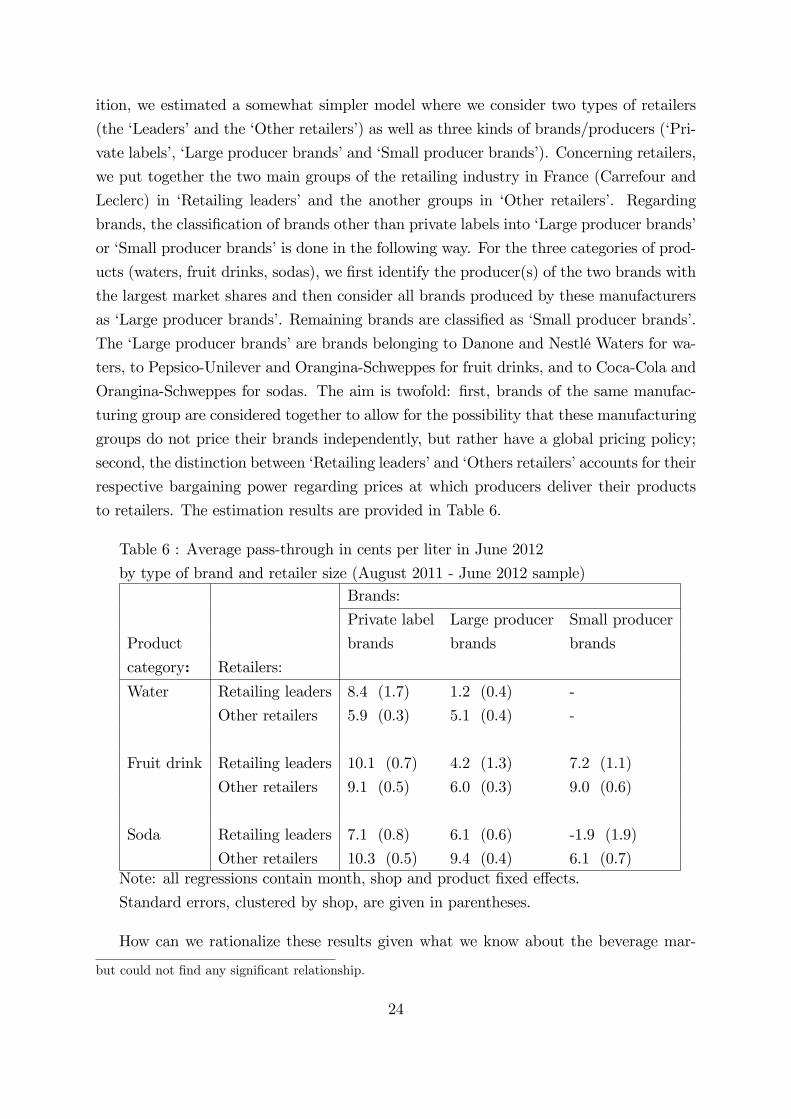
we put together the two main groups of the retailing industry in France (Carrefour and
Leclerc) in ‘Retailing leaders’ and the another groups in ‘Other retailers’. Regarding
brands, the classification of brands other than private labels into ‘Large producer brands’
or ‘Small producer brands’is done in the following way. For the three categories of prod-
ucts (waters, fruit drinks, sodas), we first identify the producer(s) of the two brands with
the largest market shares and then consider all brands produced by these manufacturers
as ‘Large producer brands’. Remaining brands are classified as ‘Small producer brands’.
The ‘Large producer brands’are brands belonging to Danone and Nestlé Waters for wa-
ters, to Pepsico-Unilever and Orangina-Schweppes for fruit drinks, and to Coca-Cola and
Orangina-Schweppes for sodas. The aim is twofold: first, brands of the same manufac-
turing group are considered together to allow for the possibility that these manufacturing
groups do not price their brands independently, but rather have a global pricing policy;
second, the distinction between ‘Retailing leaders’and ‘Others retailers’accounts for their
respective bargaining power regarding prices at which producers deliver their products
to retailers. The estimation results are provided in Table 6.
Table 6 : Average pass-through in cents per liter in June 2012
by type of brand and retailer size (August 2011 - June 2012 sample)Brands:
Private label Large producer Small producer
Product brands brands brands
category: Retailers:
Water Retailing leaders 8.4 (1.7) 1.2 (0.4) -
Other retailers 5.9 (0.3) 5.1 (0.4) -
Fruit drink Retailing leaders 10.1 (0.7) 4.2 (1.3) 7.2 (1.1)
Other retailers 9.1 (0.5) 6.0 (0.3) 9.0 (0.6)
Soda Retailing leaders 7.1 (0.8) 6.1 (0.6) -1.9 (1.9)
Other retailers 10.3 (0.5) 9.4 (0.4) 6.1 (0.7)Note: all regressions contain month, shop and product fixed effects.
Standard errors, clustered by shop, are given in parentheses.
How can we rationalize these results given what we know about the beverage mar-
but could not find any significant relationship.
24
ket and the producers-retailers relationships in France? First, French retailers strongly
compete in price. Second, by law in France, processed food producers and retailers must
negotiate once a year on sales conditions.24 The negotiation basically sets a price list
for different levels of quantities sold by the producer to the retailer, as well as possible
rebates and discounts. The price agreement can be renegotiated in case a major and
unforeseen event affects producers’production costs (including changes in taxes, such as
a SSB tax).
Given the strong competition prevailing between retailers, one may consider that,
when bargaining with producers, retailers already have a quite precise expectation, E(Pc),
about the price at which they expect to sell the product, given what they know about
their competitors’prices as well as about the elasticity of consumers’demand. In the case
of a product for which there is no stricto sensu direct competition with other retailers
(e.g., for private label products), one may consider that the expected price is essentially
determined by what retailers know about the elasticity of demand.
Let us assume that the bargaining between producers and retailers can be modelled
as a Nash-bargaining game:
Max
Pp[(Pp − Cmp)
′ ϕ(X)− π0p]θ [(E(Pc)− Pp)′ ϕ(X)− π0c ]1−θ
where:
- Pp is the vector of the producer price list, i.e., the list of prices associated with the
different possible levels of quantities purchased by the retailer; 25
- Cmp is the vector of the producer marginal cost, which may vary depending on the
level of quantity possibly purchased by the retailer, X, determining that of the production
level;
- ϕ(X) is the vector of the different levels of quantities possibly purchased by the
retailer,X, weighted by their probability of realization, assumed to be common knowledge
for both the producer and the retailer. When the negotiation takes place, these quantities
are just hypothetical purchased quantities. Indeed, the result of the negotiation is only
an agreement about a price list. Retailers have no obligation regarding the volume they
buy from the producer and they can decide to stop selling a product whenever they wish
24The negotiation about sales conditions in year t usually start at the end of year t − 1, but have tobe completed by the beginning of March of year t. New conditions cannot apply retrospectively to theperiod before the agreement has been reached.25For the sake of simplicity, we assume that the producer price makes most of the retailers’marginal
cost. Including another component in the retailers’marginal cost would not change the main messagesof the model, nor the interpretation of our results.
25
so;26
- π0p is the producer profit in case there is no agreement (we shall assume that in this
case the product is not sold by the retailer, so that π0p = 0);
- E(Pc) is the expected retail price, anticipated by the retailer based on its knowledge
of consumers’demand characteristics and competition;
- π0c is the retailer profit in case there is no agreement (we shall assume that in this
case the product is not sold, so that π0c = 0);
- θ is the bargaining power of the producer and (1 − θ) that of the retailer. The
bargaining power depends on the relative weight of the producer and the retailer on the
market as well as on the elasticity of substitution between the product under negotiation
and its substitutes (if any).
Participation constraints simply write as: Pp ≥ Cmp for the producer and Pp ≤ Pc
for the retailer. It is easy to show that, given these two participation constraints, the
solution of this simple bargaining game is Pp = E(Pc)θ × Cm(1−θ)
p or in logarithms:
ln(Pp) = θ ln(E(Pc)) + (1− θ) ln(Cmp).
If θ = 1, the producer has the whole bargaining power and Pp = Pc. In other words,
the margin goes entirely to the producer, while the retailer’s margin is zero. If on the
contrary θ = 0, then Pp = Cmp, so that the the producer makes no margin. In a second
step, the retailer sets the consumer price of the product by (possibly) adding a margin
to the producer price :
ln(Pc) = ln(PP ) + (1− θ) ln(M).
This model then simply states that ln(Pc) = ln(Cmp) + ln(M) and that the total
marginM is shared between producers and retailers according to their bargaining power.
The total margin depends on the market conditions both at the retail level (elasticity
of consumers’ demand, competition with other retailers, etc.) and at the production
level (production costs, market power of the producer, etc.). In particular, the larger the
elasticity of demand and the stronger the competition, the lower the margin.
In this framework, assuming a constant production marginal cost, the French excise
tax corresponds to a 7.55 euro cents increase in the producers marginal cost. Producers
with no bargaining power (θ = 0) have a zero margin. Their participation constraint
thus implies that they must fully shift the tax to the production price. Then, retailers
may, depending on the market conditions at the retailing level, either fully shift the tax
or absorb part of it in their margin. Depending on the market conditions, the tax may
26E.g. see http://www.lsa-conso.fr/les-produits-danone-sont-de-retour-chez-leclerc,128432 andhttp://www.lsa-conso.fr/des-produits-laitiers-nestle-lactalis-absents-des-rayons-d-auchan,128583.
26
thus be over-shifted (low elasticity of demand, low competition), or under-shifted (high
elasticity of demand, strong competition). When producers have a strong bargaining
power (θ = 1), the extent to which they can pass the tax through to prices indirectly
depends on the market conditions for their product at the retailing level. The tougher
the competition, the lower the margin and, consequently, the extent of the pass-through
of the tax to prices.
Are predictions drawn from this simple model consistent with our empirical findings?
Concerning the heterogeneity of pass-through across brands, we find that, whatever the
product category (waters, fruit drinks, sodas) and whatever the size of the retailing group,
the pass-through of the tax was higher for private labels than for other brand products
(see Table 6). This finding is consistent with our theoretical framework, since private
labels are characterized by weaker bargaining power of producers27 and smaller demand
elasticity than other products28. Moreover, as mentioned in Section 5.1, differences in the
pass-through across product categories are consistent with the fact that the magnitude
of the demand elasticity is lower for water than for the other two product categories.
Contrary to the case of private labels, the pass-through coeffi cients estimated for ‘Large
producer brands’reveal an under-shifting of the tax to prices in almost all cases. This
is consistent with the theoretical predictions of our model when large producers enjoy
some bargaining power in the negotiations with retailers. Indeed, if producers benefit
from price-cost margins, they have the possibility of not fully shifting the tax to their
prices.29 Moreover, if retailers harshly compete in price and the demand is rather elastic to
the price, the tax is under-shifted to consumer prices, too. Concerning ‘Small producer
brands’, we find that the estimated pass-through coeffi cients are larger than those of
‘Large producer brands’in the case of fruit drinks. This is consistent with our simple
bargaining framework, since it seems reasonable that the former have lower margins and
can thus hardly afford not to shift the tax to their price. In the case of sodas the pass-
through is not larger for small than for large producers, probably due to the characteristics
of energy drinks.30
27Indeed, Bonnet and Réquillart (2011) and Bonnet and Dubois (2010) have shown that, for soft drinksand waters in France, the price-cost margin is lower for private labels than for other brands, whichsuggests low bargaining power of the producers of private label products. Bonnet and Réquillart (2013)and Bergès-Sennou et al. (2004) argue that the producers of private label products sell at productionmarginal cost.28Bonnet and Réquillart (2013) show that the demand elasticity for private label beverages, though
significant, is smaller than that for other brands (between -2.13 and -3.65 for private labels, comparedto -3.25 to -3.95 for other brands). The lower elasticity of the demand for private label products mayalso explain why we find that retailers over-shifted the tax to the prices of these products in most cases.29The beverage sector in France indeed enjoys large markups with respect to the food indus-
try (see https://www.banque-france.fr/economie-et-statistiques/entreprises/structure-et-performances-des-entreprises/fascicules-dindicateurs-sectoriels.html).30As far as sodas of small producers are concerned, the estimates are strongly affected by the specific
27
Concerning the heterogeneity of pass-through across retailing groups, in most cases the
tax pass-through is lower for the two largest retailing groups (the ‘Retailing leaders’) than
for the other retailing groups. This is probably explained by the fierce price competition
between these two large retailing groups, each of which regularly claim to be the cheapest
one.31 Another complementary explanation, consistent with our model, is that the largest
retailers were able to impose an under-shifting of the tax on producer prices, while smaller
retailers were not in such a favorable bargaining position. Finally, notice once again that
across product categories the pass-through of the tax was lower for waters, consistently
with the higher price elasticity of demand for this beverage.
Overall, our estimation results are consistent with the prediction of a quite simple
model in which the consumer price depends on the production costs as well as on the
characteristics of demand (elasticity) and on those of the market (competition). The
margin, defined as the difference between the retail price and the production cost, is then
shared between producers and retailers on the basis of their respective bargaining power.
6 Conclusion
Our results show a significant under-shifting of the tax to prices of flavored waters, as
well as a slight one to prices of fruit drinks. However, the full pass-through obtained for
sodas together with the large share of these products (75%) in the total supermarket sales
of non-alcoholic beverages liable to the tax (about 2.5 billion euros in 2011) suggests a
quasi-full shifting of the excise to beverage prices at the macroeconomic level. Therefore,
in contrast with the few available results on the effect of SBB taxes on prices (Bonnet and
Réquillart, 2013 and Bergman and Hansen, 2013), our empirical analyses overall provide
support for the full shifting assumption that is often made in studies about the impact of
SSB taxes on the consumption of soft drinks, either explicitly (Dharmasena and Capps,
2012 and Brownell et al., 2009), or more or less implicitly by assuming a price increase
stemming from an unspecified magnitude tax change (Smith et al., 2010; Finkelstein et
evolution of prices of a well-known brand of energy drinks exhibiting large price decreases in 2012. Whenthis particular brand is excluded from the sample, the ‘Small producer brands’pass-through raises from-1.9 to 5.0 for ‘Leading retailers’and from 6.1 to 6.8 for ‘Other retailers’. Moreover, the average price ofsodas of ‘Small producer brands’is quite significantly higher than that of private labels and other brands.In particular, these products include most of the energizing drinks in our sample, which seem to enjoyhigh price-cost margins. This is likely to be due to the strong product differentiation existing in thissegment of the beverage market. Indeed, not only the average prices of these particular soft-drinks aremuch higher than that of other beverages, but their standard deviation is too, suggesting the existenceof a number of small monopolies. These elements may have allowed those producers to under-shift thetax to prices.31E.g. http://www.quiestlemoinscher.com/ , a price comparator run by Leclerc, and
http://www.garantieprixleplusbas.carrefour.fr/, the equivalent for Carrefour.
28
al., 2013; Block et al., 2010; Lin et al., 2010).
Another important finding is the pervasive heterogeneity of the pass-through, not
only across product categories, but also across beverage brands and across retailers. In
particular, the pass-through for private label products is significantly larger than that
observed for other brands. Since private label products are characterized by both lower
average prices and higher pass-through, a larger impact of the soda tax on low income
households seems likely. The full shifting of the tax observed on average thus results
from the combination of an over-shifting for private labels and small producers’brands
(at least for fruit drinks) and of an under-shifting of the tax in the case of large producers’
brands. At the same time, we find that the two main retailing groups in France often
passed through the soda tax less than the other ones. These results are shown to be
consistent with a simple producer-retailer bargaining framework.
Overall, the absence of over-shifting of the excise, together with its limited magnitude
(7.55 euro cents, corresponding to a price increase of 7% on average), allow to agree with
Boizot-Szantal and Etilé (2012) and Bonnet and Réquillart (2013) regarding the expected
low impact the soda tax in terms of sugar consumption and of its consequences on health.
29
Appendix A: More about the data base
Table A1: Composition of the sample by retail chain and group.Retail chain N. of shops retailing group Group
market share
auchan 41 AUCHAN 10.9 %
simply market 38 AUCHAN 10.9 %
carrefour 2 CARREFOUR 18.7 %
carrefour market 1 CARREFOUR 18.7 %
casino 20 CASINO 5.0 %
geant casino 57 CASINO 5.0 %
leclerc 107 LECLERC 18.6 %
intermarche 179 LES MOUSQUETAIRES 12.6 %
ecomarche 3 LES MOUSQUETAIRES 12.6 %
hyper u 40 SYSTEME U 9.2 %
marche u 4 SYSTEME U 9.2 %
super u 263 SYSTEME U 9.2 %
u express 5 SYSTEME U 9.2 %
Total 760 75.0%Sources: Prixing and, for retailing groups market shares, Kantar Worldpanel cited by Agro-
media (2012) .
30
Table A2 : Composition of the sample by brand for watersBrand Market share N. of shops Products with Products with
added sugar no added sugar
or sweetener nor sweetener
all private labels 20.1 % 508 x x
cristaline 17.3 % 72 0 x
evian 6.3 % 581 0 x
volvic 5.9 % 583 x x
contrex 5.0 % 485 x x
salvetat 5.0 % 447 0 x
vittel 4.1 % 382 0 x
badoit 3.9 % 399 0 x
hepar 2.7 % 122 0 x
san pellegrino 2.5 % 264 x x
quezac 2.1 % 207 0 x
st-yorre 1.9 % 181 0 x
st amand 1.8 % 94 0 x
courmayeur 1.2 % 152 0 x
vichy celestins 1.0 % 100 0 x
rozana 0.8 % 128 0 x
taillefine 0.4 % 61 x 0
perrier 0.1 % 364 0 x
other brands 17.9 % 417 0 xSources: Prixing and, for brand market shares, Rayon-boissons.com (http://www.rayon-
boissons.com/), a professional website focusing on beverages.
Market share figures provided in the table combine market shares provided by Rayon-
boissons.com for plain waters, sparkling waters and flavored waters separately.
Private labels include: auchan, carrefour, casino, leclerc, intermarche and produit u.
Other brands include: abatilles, aix les bains, arcens, carola, lisbeth, mont dore, mont
roucous, mont d’arrée, nestle, ogeu, pierval, plancoet, st antonin, spa, st alban, telle quelle,
thonon, vals, vernière and wattwiller.
31
Table A3 : Composition of the sample by brand for fruit drinksBrand Market share Market share N. of shops Products with Products with
in 2011 used in added sugar no added sugar
the analysis or sweetener nor sweetener
all private labels 56.5 % 48.0 % 562 x x
oasis - 11.0 % 565 x 0
tropicana 11.5 % 9.8 % 644 0 x
joker 11.2 % 9.5 % 408 x x
lipton - 4.0 % 365 x 0
pampryl 3.4 % 2.9 % 100 x x
fruite 2.3 % 2.0 % 76 0 x
ocean spray 2.3 % 2.0 % 358 x 0
pressade 2.3 % 2.0 % 112 x x
pago 1.1 % 1.0 % 89 x x
rea 0.9 % 0.8 % 92 x 0
granini 0.4 % 0.3 % 38 x 0
other brands 7.3 % 6.7 % 600 x xSources: Prixing and, for brand market shares, Rayon-boissons.com.
Market share figures published by Rayon-boissons.com slightly differ from those used in our
analysis because, given their characteristics, two brands (Oasis and Lipton) were moved from
the category ‘soda’to the category ‘fruit drinks and ready to drink tea’.
Private labels include: auchan, carrefour, casino, leclerc, intermarche and produit u.
Other brands include: alter éco, andros, bjorg, brut de pomme, éthiquable, fanta, gayelord
effects on beverage consumption, calorie intake, and obesity. USDA Economic Research
Report 100.
Stern, N., 1987. The effects of taxation, price control and government contracts in
oligopoly and monopolistic competition. Journal of Public Economics 32 (2), 133-158.
Young, D., Bieliska-Kwapisz, A., 2002. Alcohol taxes and beverage prices. National
Tax Journal 55 (1), 57-73.
40
Documents de Travail
396. M. Bussiere and A. Ristiniemi, “Credit Ratings and Debt Crises,” September 2012
397. A. Monfort and F. Pegoraro, “Asset Pricing with Second-Order Esscher Transforms,” September 2012
398. S. Gabrieli, “Too-connected versus too-big-to-fail: banks’ network centrality and overnight interest rate,” September 2012
399. Y. Kalantzis, R. Kambayashi and S. Lechevalier, “Wage and Productivity differentials in Japan. The Role of Labor Market Mechanisms,” September 2012
400. F. Bec and M. Bessec, “Inventory Investment Dynamics and Recoveries: A Comparison of Manufacturing and Retail Trade Sectors,” October 2012
401. P. Antipa, K. Barhoumi, V. Brunhes-Lesage and O. Darné, “Nowcasting German GDP: A comparison of bridge and factor models,” October 2012
402. G. Gaballo, “Good Luck or Good Policy? An Expectational Theory of Macro-Volatility Switches,” October 2012
403. J. Barthélemy and M. Marx, “Generalizing the Taylor Principle: New Comment,” October 2012 404. H. Fraisse and P. Frouté, “Households Debt Restructuring: Evidence from the French Experience,” October
2012
405. E. Kremp and P. Sevestre, “Did the crisis induce credit rationing for French SMEs?,” November 2012
406. P. Bacchetta, K. Benhima and Y. Kalantzis, “Capital Controls with International Reserve Accumulation: Can this Be Optimal?,” November 2012
407. P. Andrade, E. Ghysels and J. Idier, “Tails of Inflation Forecasts and Tales of Monetary Policy,” November 2012
408. N. Berman, A. Berthou and J. Héricourt, “Export dynamics and sales at home,” November 2012
409. M. Bessec, “Short-term forecasts of French GDP: a dynamic factor model with targeted predictors,” November 2012
410. J. Carluccio and T. Fally, “Foreign Entry and Spillovers with Technological Incompatibilities in the Supply Chain,” November 2012
411. T. Duprey, “Bank Ownership and Credit Cycle: the lower sensitivity of public bank lending to the business cycle,” December 2012
412. O. Loisel, A. Pommeret and F. Portier, “Monetary Policy and Herd Behavior: Leaning Against Bubbles,” December 2012
413. F. Collard, H. Dellas, B. Diba and O. Loisel, “Optimal Monetary and Prudential Policies,” December 2012
414. C. Gourieroux, J.-C. Heam and A. Monfort, “Bilateral Exposures and Systemic Solvency Risk,” December 2012
415. N. Berardi, P. Sevestre, M. Tepaut and Alexandre Vigneron, “The impact of a `soda tax' on prices. Evidence from French micro data,” December 2012 (revised version may 2016)
Pour accéder à la liste complète des Documents de Travail publiés par la Banque de France veuillez consulter le site : www.banque-france.fr For a complete list of Working Papers published by the Banque de France, please visit the website: www.banque-france.fr Pour tous commentaires ou demandes sur les Documents de Travail, contacter la bibliothèque de la Direction Générale des Études et des Relations Internationales à l'adresse suivante : For any comment or enquiries on the Working Papers, contact the library of the Directorate General Economics and International Relations at the following address : BANQUE DE FRANCE 49- 1404 Labolog 75049 Paris Cedex 01 tél : 0033 (0)1 42 97 77 24 ou 01 42 92 63 40 ou 48 90 ou 69 81 email : [email protected]