DOCUMENT LESUME ED 393 883 TM 024 785 AUTHOR Rasor, Richard A.; Barr, James TITLE Refinement in Assessment Validation: Technicalities of Dealing with Low Correlations and Instructor Grading Variation. PUB DATE [95] NOTE 23p.; Poitions of paper presented at the Annual Research Conference of the RP Group Granlibakken, 1993. PUB TYPE Reports Research/Technical (143) Speeches/Conference Papers (150) EDRS PRICE DESCRIPTORS ABSTRACT MF01/PC01 Plus Postage. *College Students; *Correlation; Educational Assessment; *Grade Point Average; *Grading; Higher Education; *Scores; Student Evaluation; Test Results; *Validity Issues and problems in assessment research are explored, with suggestions to help establish an acceptable correlation between student assessment scores and final grades. Topics include assessing instructor grading variation, instructor grade point average (GPA), success rates, and lack of linearity in grade scales. Solutions to these problems are offered in the form of a new four-point research grading scale and a new "contextual" student GPA based on cumulative grade average with the final grade in the target course removed from the calculation. The contextual GPA was usee to equate student "skill" levels in course selections when identifying the degree of instructor grading variation. The techniques were applied to a sample of 6,077 students covering performance data in 26 courses. The magnitude of the resulting correlations suggests giving much greater emphasis to student cumulative college GPA as a multiple measure when establishing entrance "skill" levels deemed necessary for success in general courses having no specific course prerequisite. Practical suggestions are included for identifying the true correlation between assessment test scores and grades given the problem of instructor grading variation. (Contains three tables and six figures.) (Author/SLD) *********************************************************************** * Reproductions supplied by EDRS are the best that can be made from the original document. ***********************************************************************
Transcript
DOCUMENT LESUME
ED 393 883 TM 024 785
AUTHOR Rasor, Richard A.; Barr, JamesTITLE Refinement in Assessment Validation: Technicalities
of Dealing with Low Correlations and InstructorGrading Variation.
PUB DATE [95]
NOTE 23p.; Poitions of paper presented at the AnnualResearch Conference of the RP Group Granlibakken,1993.
PUB TYPE Reports Research/Technical (143)Speeches/Conference Papers (150)
EDRS PRICEDESCRIPTORS
ABSTRACT
MF01/PC01 Plus Postage.*College Students; *Correlation; EducationalAssessment; *Grade Point Average; *Grading; HigherEducation; *Scores; Student Evaluation; Test Results;*Validity
Issues and problems in assessment research areexplored, with suggestions to help establish an acceptablecorrelation between student assessment scores and final grades.Topics include assessing instructor grading variation, instructorgrade point average (GPA), success rates, and lack of linearity ingrade scales. Solutions to these problems are offered in the form ofa new four-point research grading scale and a new "contextual"student GPA based on cumulative grade average with the final grade inthe target course removed from the calculation. The contextual GPAwas usee to equate student "skill" levels in course selections whenidentifying the degree of instructor grading variation. Thetechniques were applied to a sample of 6,077 students coveringperformance data in 26 courses. The magnitude of the resultingcorrelations suggests giving much greater emphasis to studentcumulative college GPA as a multiple measure when establishingentrance "skill" levels deemed necessary for success in generalcourses having no specific course prerequisite. Practical suggestionsare included for identifying the true correlation between assessmenttest scores and grades given the problem of instructor gradingvariation. (Contains three tables and six figures.) (Author/SLD)
************************************************************************ Reproductions supplied by EDRS are the best that can be made
from the original document.***********************************************************************
U.S. DEPAITTNENT OF EDUCATIONOthc of Educational Research and Improvement
ED ONAL RESOURCES INFORMATIONCENTER (ERIC)
This document has been risproduCtsd asreceived from the parson or orgenizationoriginating d
0 Minor changes have been made to improveceProductron Quairty
Pants of v.ew or opirhons stated m this docu-ment do not necessarily represent officialOERI position or policy
'PERMISSION TO REPRODUCE THISMATERIAL HAS BEEN GRANTED BY
tleAmo
TO THE EDUCATIONAL RESOURCESINFORMATION CENTER (ERIC).-
REFINEMENT IN ASSESSMENT VALIDATION:
TECHNICALITIES OF DEALING WITH LOW CORRELATIONSAND
INSTRUCTOR GRADING VARIATION
by
Richard A. Rasor
James Barr
American River College
BEST COPY AVAILABLE
Abstract
Portions of this paper were originally presented at The RP Group's 1993 AnnualResearch Conference at Granlibakken. The report covers many issues and problems inassessment research along with suggestions that may prove helpful in establishing anacceptable correlation between student assessment scores and final grades.
Topics include assessing instructor grading variation, instructor GPAs, success
rates, and lack of linearity in grade scales. Solutions to these problems are offered in
the form of a new 4-pt. research grading scale, and a new "contextual" student GPAbased upon cumulative grade average with the final grade in the target course removedfrom the calculation. The contextual GPA was used to equate student "skill" levels in
course sections when identifying the degree of instructor grading variation.
The authors applied their techniques to a large sample of students coveringperformance data in several general education courses. The magnitude of the resultingcorrelations suggests giving much greater emphasis to student cumulative college GPA
as a multiple measure when establishing entrance "skill" levels deemed necessary for
success in general courses having no specific course prerequisite.
The report ends with practical suggestions on how to identify the true correlationbetween assessment test scores and grades given the problem of instructor grading
variation.
II3
Acknowledgments
We wish to thank Sharon McCuen, Dean of Research and Development at AmericanRiver College, for her continued efforts in promoting institutional research.
Dr. Queen Randall, former president of American River College and nowChancellor, Los Rios Community College District, is also thanked for her invaluablesupport regarding campus based research.
Finally, we would be unable to conduct our present line '3 f research without thecontinued efforts of the fine research staff at the Los Rios Community College DistrictOffice, namely, Jose Pagtalunan, Brad Brazil, and Janice Jones (presently Interim Deanof Math and Engineering, American River College).
iii 4
Many community college researchers, assessment personnel, and various staffconcerned with matriculation throughout California, are still having a difficult timewith validating assessment/course placement procedures at their colleges. It wouldseem to many of these people that establishing a correlation coefficient of at least .35(which is state mandated) between student assessment scores and course grades is likeasking for the moon! However, the problem is not that .35 is too high a standard. Fewof us would expect a respected test publisher to ever release an instrument withvalidity coefficients any lower. Indeed, we would probably demand much more.Problems arise when we apply validity standards in a micro sense, that is, to one typeof course, often with many levels, with different instructors, and usually with smallsample sizes.
The difficulties in not finding a correlation of .35 or higher between assessment testscores and course performance stem from several reasons:
Possible Causes of Low Correlations
1. A test publisher may validate a test in a general way using somewhat differentprocedures and applying different norms than what we do in our attempts at localmicro validation.
2. Usually test publishers do not have to validate scores against several levels ofone type of course, nor do they have to deal with intact systems where there is aptto be considerable resistance toward temporarily suspending rules of placement forthe sake of validating an existing (and perhaps long-standing) placement test.
3. Single test validation may not be uniform for all colleges within a multi-collegedistrict because each institution has its unique characteristics including differentstudent populations.
4. Within certain courses, there appears to be considerable grading variationbetween instructors who teach the same course. This means that the traditionalcriterion of final grade can be highly unreliable. If one instructor's "A" representsthe same degree of excellence as another instructor's "C", then there can only be alow correlation between assessment test scores and grades.
5. Final grades as a criterion measure are often based upon course completers. Yetsuch students may represent a restricted range of talent when compared to theoriginal class. This is because the students who dropped out could have had lowerassessment test scores. Any restriction of range (predictor or criterion measure) areapt to lower a correlation.
6. There appears to be no clear difference between the letter grade of "F" and thedesignation "W" (indicating withdrawal from the course). In a recent survey atARC, 67% of the teaching faculty routinely drop a student who is no longer
attending class while nearly 32% give the "F" grade (1% give an Incomplete). Thismeans that how one codes such grades for computational purposes has a substantialimpact upon the value of any correlation between assessment test scores and grades.
7. From ARC's experience, "A", "B", or "C" final grades are linearly related toassessment test scores (linearity is a prerequisite for using the Pearson correlationcoefficient). However, grades of "D", "F", or "W" are sometimes associated withhigh assessment test scores. In one of our earlier research projects, students whowithdrew from English 1A, as a group, had the highest assessment test scoreaverage. Such lack of linearity between measures lowers any correlation.
8. Dated assessment test scores (over six months old) with subsequent enrollmentin other courses are apt to lower a correlation between scores and target coursegrades. Yet the reality is that enrollments in courses affected by matriculationregulations include many experienced students who enroll in the target course longafter an assessment test was taken.
9. Course placement recommendations given to students in private by counselingstaff (or through the student "grapevine") may sometimes include a subtlesuggestion that a particular student who scores low on an assessment test take aparticular instructor that has a reputation for "easy" grading. The converse may alsobe true. Such practices have resulted in low assessment scores being paired withhigh grades, an outcome sure to lower any overall positive correlation.
10. In spite of the previously mentioned reasons (and probably many others), thereremains the distinct pos;ibility that little or no correlation exists between assessmentscores and grades in a target course. Without a task analysis done on the course,content analysis done on the assessment test, and determining how grades areassigned, one cannot be sure even why there should be any relationship.
We address some of these technical problems which you may find useful in yourassessment research.
Instructor Grading Variation, the Conventional Course GPA, and the Success Rate
In examining the GPAs for entire sections of courses (number of "A"s, "B"s, "C"s andother grades given, it became obvious to us that instructors were not applying gradingstandards in the same way. The worst example we found at ARC was a course GPA of1.28 for 10 sections with one instructor (and a success rate of 32%), while for a secondinstructor of the same course, the GPA was 3.01 and based upon 15 sections (with asuccess rate of 81%). Remember that the dropout rate is not included in course GPA(nor a student's conventional GPA) but is included in the computation of success rate.Clearly, in this instance, which instructor a student enrolled with probably had muchmore to do with course success than did any assessment test score.
2
In terms of establishing validity coefficients, we do not like the conventional GPA.The reason is simple enough, GPA does not include "W" notations. An instructor couldgive one "A" and have the rest of the class drop which would result in a course GPA of4.0!
At first consideration, course success rates would seem to be a better index ofoverall class performance because it is easily understood and includes the number ofstudents receiving "W" notations. But, it too, has its limitations. With identical successrates of 50%, one instructor could have assigned half the class "C"s (with the other halfreceiving "W"s) while another instructor could give all "A"s to half the class (with theremaining half receiving "F"s). What is needed is a modified success index that issensitive to degrees of success as is the conventional GPA. A practical solution will bediscussed shortly.
Assigning Values for the Coding of Letter Grades
Our Assessment Director (Tom Powell) had already run many correlations betweenassessment scores and grades in selected courses. His printouts usually included twocorrelation values, one with "W"s coded the same as "F"s (both zero), and one with all"W"s removed from the calculations (which lowered sample size).
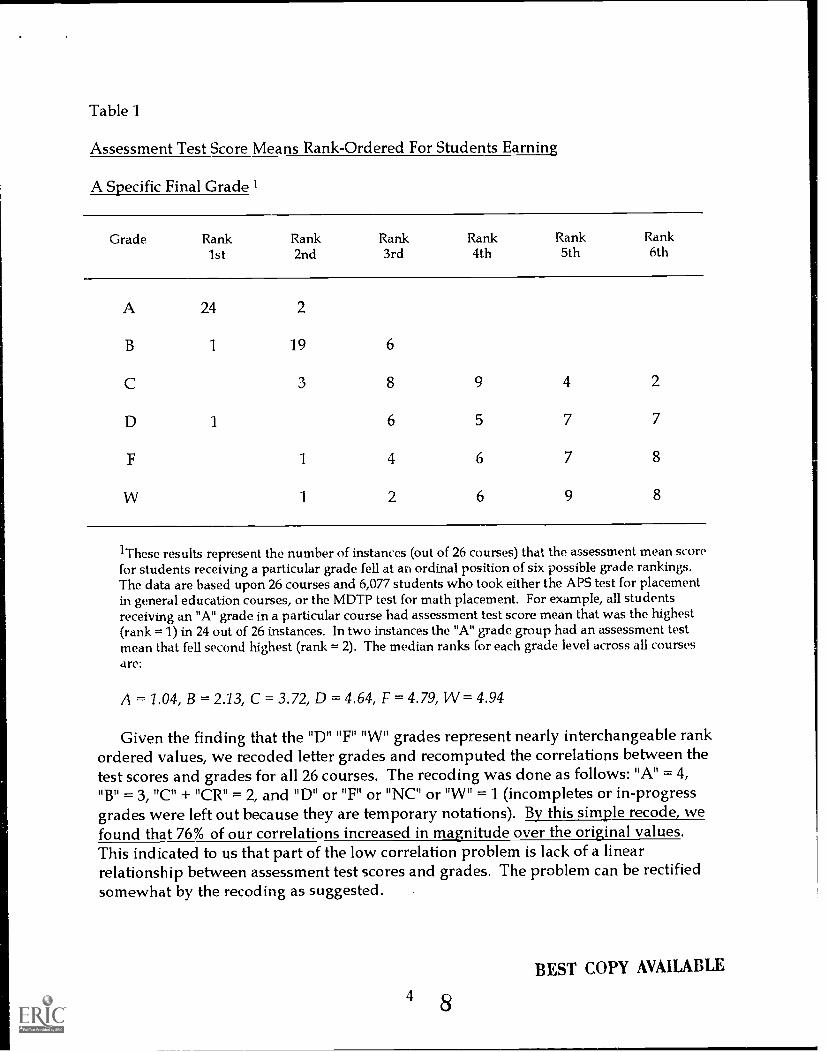
We examined the mean assessment score for students who had received a specificgrade in a target course (i.e., assessment mean cross- tabulated with letter grade level).We did this for each grade level in several courses. Our results are presented in Table 1(p. 4), and are based upon 26 courses and 6,077 students. In 24 of 26 courses, the "A"students had the highest assessment score mean (an assigned rank order of 1). In 2 ofthe 26 courses, the students who earned an "A" grade had an assessment score meanthat fell in 2nd place (below some other group of students who earned a differentgrade). Clearly then, students who earned an "A" in nearly all of these courses also hadthe highest assessment scores when compared with students who earned differentletter grades. So far, this speaks well for linear trend. However, subsequent grades donot follow that linear pattern so nicely. In other words, students who earn "B"s haveassessment score means which are not always in second place standing(rank order = 2). And so it goes.
When the median rank orders are computed and plotted along a straight line, aninteresting finding emerges . Students who earn an "A" grade, as a group, usually havethe highest assessment score mean irrespective of course. The "B" group usually comesin 2nd place with respect to their assessment mean. With "C"s, the rank orders aremuch more varied (i.e., three times in 2nd place, eight times in 3rd piace, -- even twotimes in 6th place below "A", "B", "D", "F", or "W"). Clearly, linearity breaks downstarting with the letter grade "C", then dramatically so after the "C". Grade groupings of"D", "F", and "W" are so mixed that their median ranks based upon assessment testmeans are nearly identical.
3
Table 1
Assessment Test Score Means Rank-Ordered For Students Earning
A Specific Final Grade
Grade Rank1st
Rank2nd
Rank3rd
Rank4th
Rank5th
Rank6th
A 24 2
B 1 19 6
C 3 8 9 4 2
D 1 6 5 7 7
F 1 4 6 7 8
W 1 2 6 9 8
1These results represent the number of instances (out of 26 courses) that the assessment mean scorefor students receiving a particular grade fell at an ordinal position of six possible grade rankings.The data are based upon 26 courses and 6,077 students who took either the APS test for placementin general education courses, or the MDTP test for math placement. For example, all studentsreceiving an "A" grade in a particular course had assessment test score mean that was the highest(rank = 1) in 24 out of 26 instances. In two instances the "A" grade group had an assessment testmean that fell second highest (rank = 2). The median ranks for each grade level across all coursesare:
A = 1.04, B = 2.13, C = 3.72, D = 4.64, F = 4.79, W = 4.94
Given the finding that the "D" "F" "W" grades represent nearly interchangeable rankordered values, we recoded letter grades and recomputed the correlations between thetest scores and grades for all 26 courses. The recoding was done as follows: "A" = 4,"B" = 3, "C" + "CR" = 2, and "D" or "F" or "NC" or "W" = 1 (incompletes or in-progressgrades were left out because they are temporary notations). By this simple recode, wefound that 76% of our correlations increased in magnitude over the original values.This indicated to us that part of the low correlation problem is lack of a linearrelationship between assessment test scores and grades. The problem can be rectifiedsomewhat by the recoding as suggested.
4 8
BEST COPY AVAILABLE
Development of the 4-Point Research GPA
On page 3 we indicated that a modified success rate that would be sensitive to"degrees" of success was needed. Our recoding of grades as "A" = 4, "B" = 3,"C or CR" = 2, and all other unsuccessful grade notations = 1, had worked out well forour correlational assessment research. We also thought that the same recode should beuseful with research on instructor grading variation. In other words, instead ofcomparing conventional instructor GPAs or simple success rates, why not calculate thisnew GPA? (We dubbed this a "research GPA" to distinguish it from the regular GPA).The benefits include relative ease of computer recoding, the resulting mean (GPA)closely approximates the mean for the regular GPA, the scale overcomes trying todistinguish between "F"s and "W"s, and because of including "W"s, helps to maintain adesirable sample size. With the 4-point research GPA, a value of 2.0 would mean thatall students averaged out at a "C" level. A value of 1.0 would be interpreted as allstudents averaging out as unsuccessful ("D" or "F" or "NC" or "W").
As a pilot test, we constructed 50 hypothetical instructor grade distributions andcalculated the correlations between research GPA and simple s,iccess rate ( r = .93),between research GPA and regular GPA (r = .93), and between regular GPA andsuccess rate (r = .87). These preliminary results were encouraging.
The merit of the research GPA is that it maintains the virtues of the success ratewithout sacrificing the power of detecting subtle grade differences within the definitionof success ( "A", "B", "C", "CR"). The drawback is that reporting another type of GPAmay prove confusing. One possible solution to any confusion would be to multiply theresearch GPA by 100 and round the value. You could call this a course performancescore.
9
5
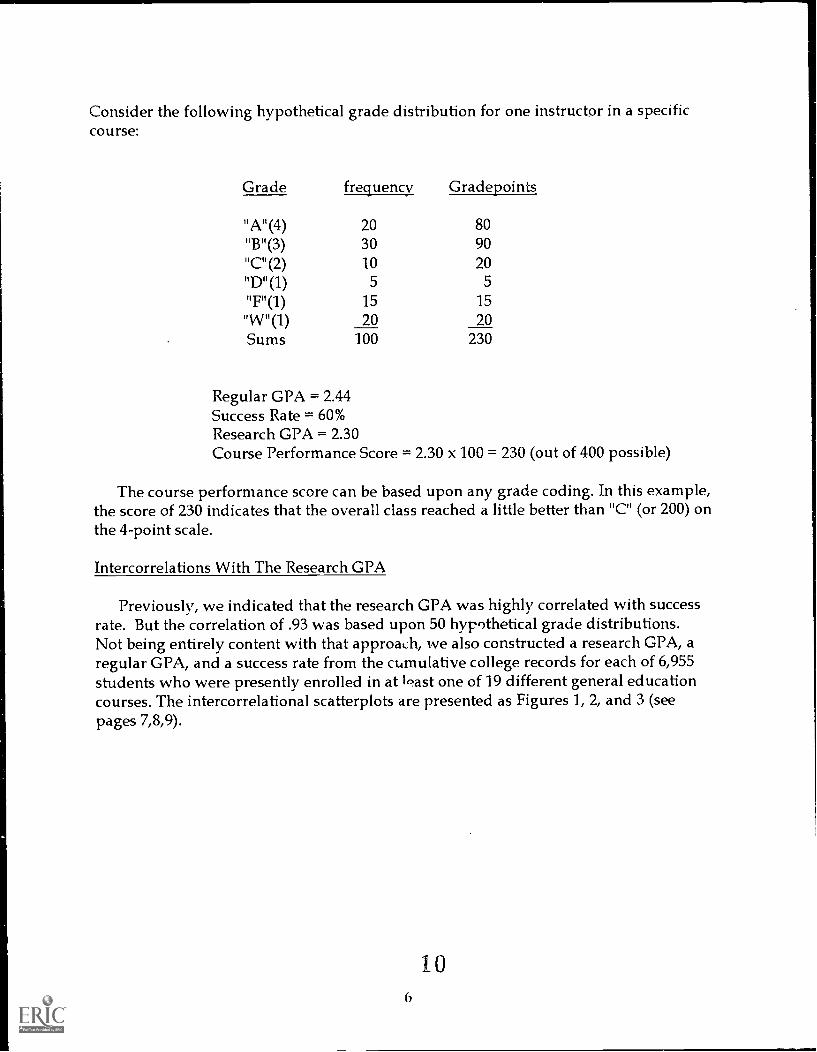
Consider the following hypothetical grade distribution for one instructor in a specificcourse:
The course performance score can be based upon any grade coding. In this example,the score of 230 indicates that the overall class reached a little better than "C" (or 200) onthe 4-point scale.
Intercorrelations With The Research GPA
Previously, we indicated that the research GPA was highly correlated with successrate. But the correlation of .93 was based upon 50 hypothetical grade distributions.Not being entirely content with that approach, we also constructed a research GPA, aregular GPA, and a success rate from the cumulative college records for each of 6,955students who were presently enrolled in at least one of 19 different general educationcourses. The intercorrelational scatterplots are presented as Figures I, 2, and 3 (seepages 7,8,9).
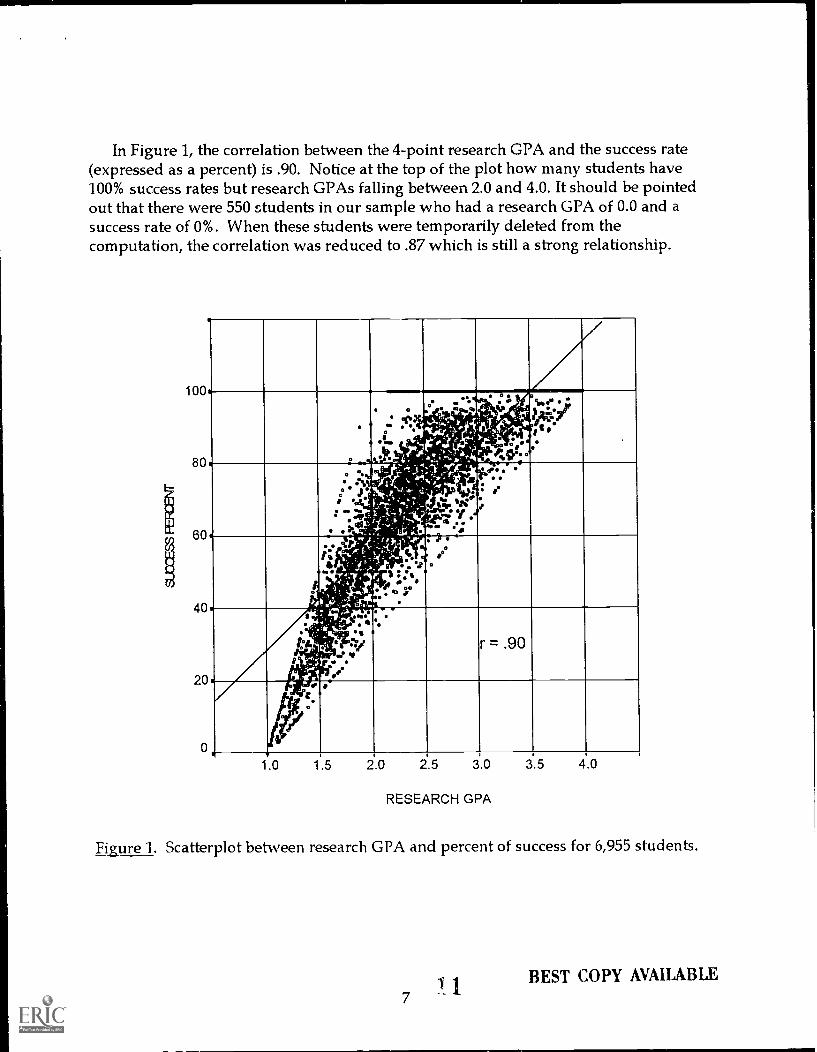
In Figure 1, the correlation between the 4-point research GPA and the success rate(expressed as a percent) is .90. Notice at the top of the plot how many students have100% success rates but research GPAs falling between 2.0 and 4.0. It should be pointedout that there were 550 students in our sample who had a research GPA of 0.0 and asuccess rate of 0%. When these students were temporarily deleted from thecomputation, the correlation was reduced to .87 which is still a strong relationship.
100
80
60
40
20
0
' St.
__.
- ..1. .464.,41
.1°. 'F''t
...* aa % el
- .
''-. a .
. 0460
4 4-)x.:,
AV'.. .U.11
friefiri t
a
-.40° J.....00
... ,l,-
,e'C,-,p'.J 4, 1:-
i.r. .. 7L k.I'
/' vibrr 'No
01.ste.r.- op l'ce.z .., .;,,....
e
t41
r: -1.1: i: '#:::IP wt..
./4); '4",;`sy. ,.... !,. le
s:: VI.°
°
II
/
,,a,
.5-s....., -
. %.1rde
me
4?
-
r = 90
r
,f
1.0 1.5 2.0 2.5 3.0
RESEARCH GPA
3.5 4.0
Figure 1. Scatterplot between research GPA and percent of success for 6,955 students.
1 17
BEST COPY AVAILABLE
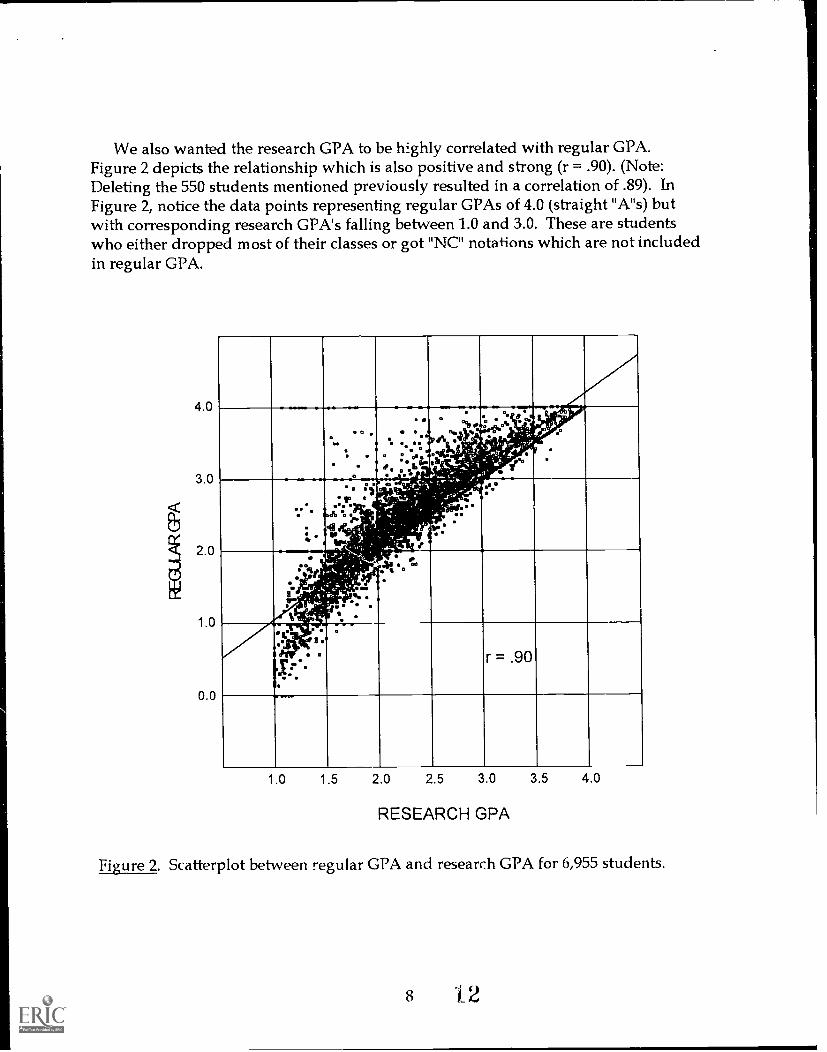
We also wanted the research GPA to be highly correlated with regular GPA.Figure 2 depicts the relationship which is also positive and strong (r = .90). (Note:Deleting the 550 students mentioned previously resulted in a correlation of .89). InFigure 2, notice the data points representing regular GPAs of 4.0 (straight "A"s) butwith corresponding research GPA's falling between 1.0 and 3.0. These are studentswho either dropped most of their classes or got "NC" notations which are not includedin regular GPA.
4.0
3.0
2.0
1.0
0.0
-.
No
a
o
_
a . "onoao:d.
°
*gt,...?,;i:..
sil ''''.: .-. ...t. - .:.`
Lt.',
: % : .... _,::Ar.
,..,., ,.."
'- ',.i...
15J6
e,
o
... ..
.i.,e --..-...;..)-
..
r S .
:ip . .....
11% ,......,:,;.......a .1/47
... ' ; '''..'
1,
-.:-...-......
c. ior.,,......, ..
!" -......
.. ..
.i .
ga?...1.
r = .90
-__
1 0 1.5 2.0 2.5 3.0
RESEARCH GPA
3.5 4.0
Figure 2. Scatterplot between regular GPA and research GPA for 6,955 students.
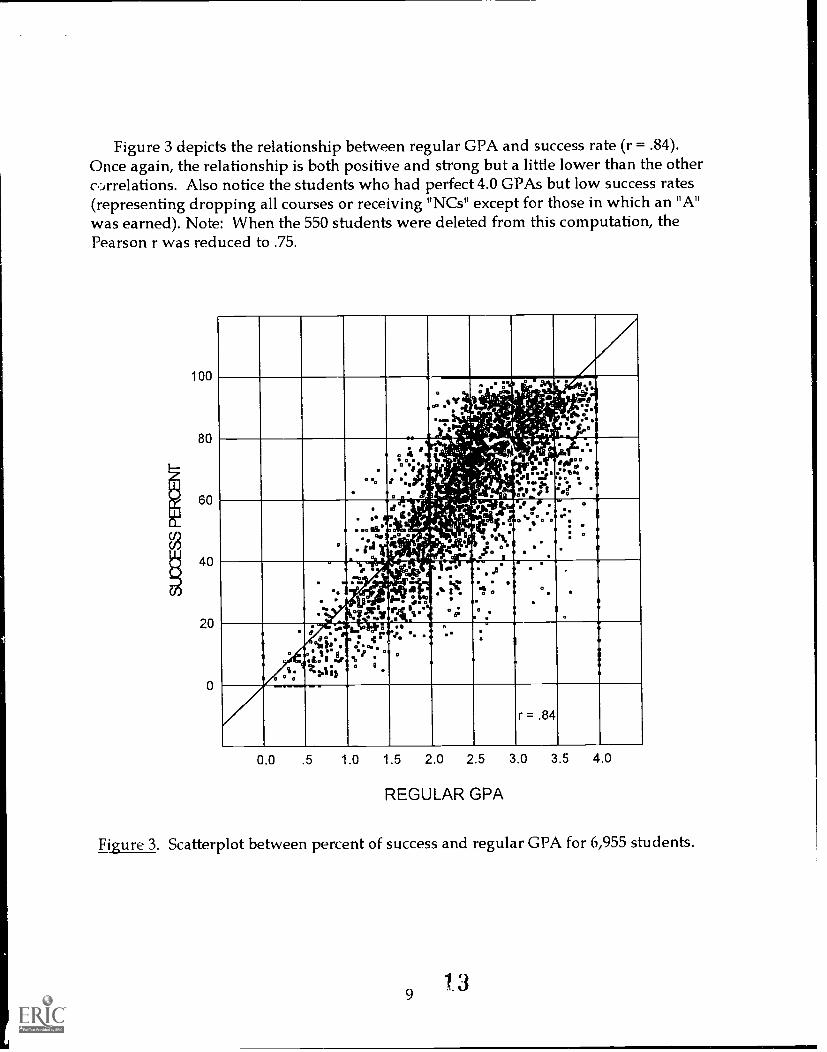
Figure 3 depicts the relationship between regular GPA and success rate (r = .84).Once again, the relationship is both positive and strong but a little lower than the otherc.:irrelations. Also notice the students who had perfect 4.0 GPAs but low success rates(representing dropping all courses or receiving "NCs" except for those in which an "A"was earned). Note: When the 550 students were deleted from this computation, thePearson r was reduced to .75.
100
80
60
40
20
k.. s .;'J ....i.
..- J1- .,.,. f' " WI ."
; .
.°%
-
..".jet .,g,'
.
..:,.7
',ii,-.;.fr, .;...-* .t..
:-.4,"..-.); ,,,;':,kit.:.' ..'' ,0:c....
ii.:- . .. ."?;.
.:4', .1ficit,1!,
.,.
.- ii.
, .
ta'to'........,,...
r.s:Ps
.. .too':. 1
*.tr
.
...
00161*is. glij
.'24..,,,,,...y,,4-%
OS4
.....1,11;,.
..li
A-.
9.
A,.S.
7 ,.'''... 0 0 0 .."
: *
.I
. .-..,f.0b , ,
a0 1.. slr:
4.:141'..v .41,:i..;
0.11:-. Jr:-,6% 114.
0;
" .1
1.
.° ..
.
0
.,
0 *
.S
0
,-.,,,..0
,as
_terf,a*" tI 8L 01% Oh,
.cr*
I
I %; °
° 1
lo7 ..
,
. ,
'
1
,
r = .84
0.0 .5 1.0 1.5 2.0 2.5 3.0 3.5 4.0
REGULAR GPA
Figure 3. Scatterplot between percent of success and regular GPA for 6,955 students.
Shape of the Distribution for the Research GPA
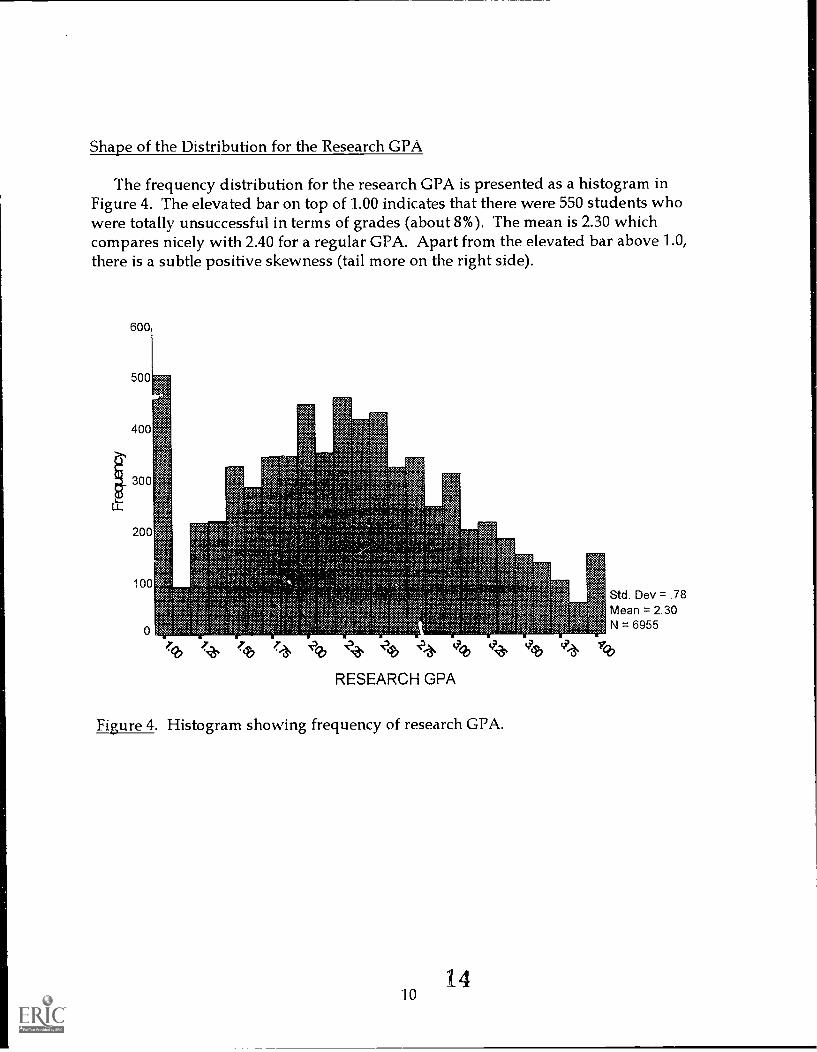
The frequency distribution for the research GPA is presented as a histogram inFigure 4. The elevated bar on top of 1.00 indicates that there were 550 students whowere totally unsuccessful in terms of grades (about 8%). The mean is 2.30 whichcompares nicely with 2.40 for a regular GPA. Apart from the elevated bar above 1.0,there is a subtle positive skewness (tail more on the right side).
Std. Dev = .78Mean = 2.30N = 6955
1. `34 'Peb `9,t7 4 veb
RESEARCH GPA
Figure 4. Histogram showing frequency of research GPA.
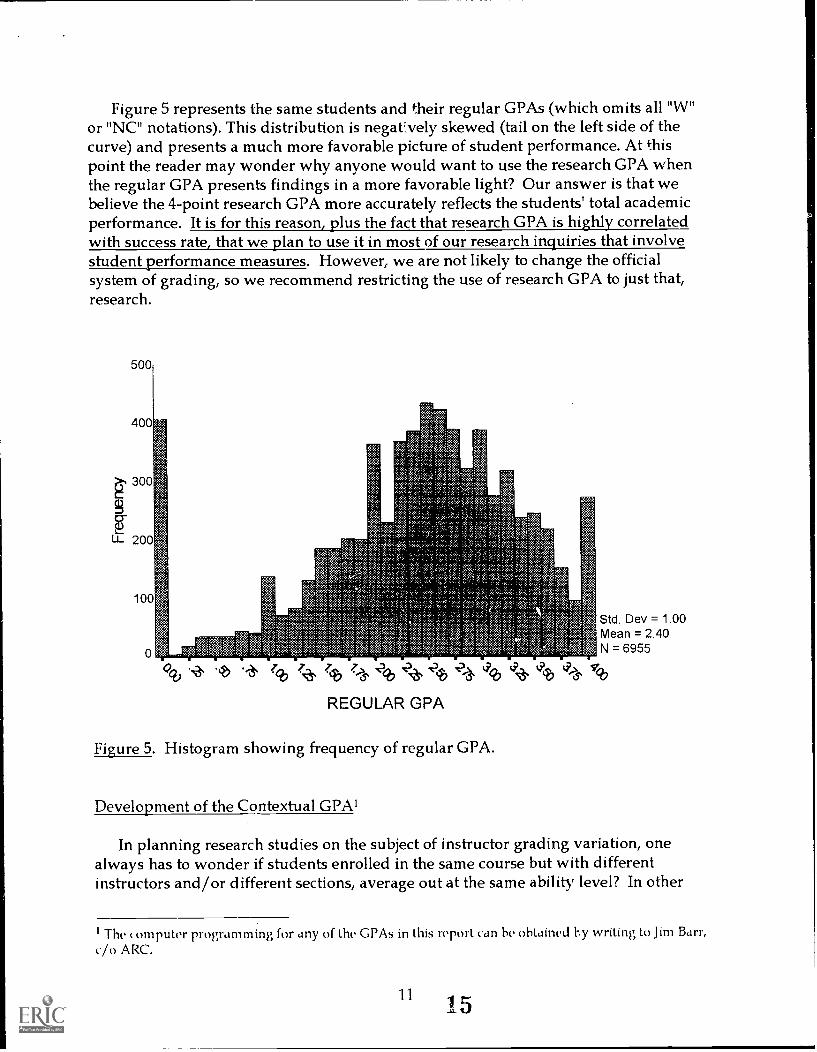
Figure 5 represents the same students and their regular GPAs (which omits all "W"or "NC" notations). This distribution is negatvely skewed (tail on the left side of thecurve) and presents a much more favorable picture of student performance. At thispoint the reader may wonder why anyone would want to use the research GPA whenthe regular GPA presents findings in a more favorable light? Our answer is that webelieve the 4-point research GPA more accurately reflects the students' total academicperformance. It is for this reason, plus the fact that research GPA is highly correlatedwith success rate, that we plan to use it in most of our research inquiries that involvestudent performance measures. However, we are not likely to change the officialsystem of grading, so we recommend restricting the use of research GPA to just that,research.
Std. Dev = 1.00Mean = 2.40N = 6955
';-12 7-('5% ylb 14 4'46 tj;1". 4:t)
REGULAR GPA
Figure 5. Histogram showing frequency of regular GPA.
Development of the Contextual GPA'
In planning research studies on the subject of instructor grading variation, onealways has to wonder if students enrolled in the same course but with differentinstructors and/or different sections, average out at the same ability level? In other
I The wmpuler programming for any of the GPAs in this report can he obtained by writing to Jim Barr,c/o ARC.
15
words, could a substantial amount of differences in instructor grading (or retention) bedue to initial differences in student ability/motivational levels? We used to think thatour registration process was akin to random assignment of students to course sectionsthereby balancing out student skill levels across instructors. But then our subsequentresearch with English 1A instructors revealed a relationship between skill level andinstructor selected. We found that lower assessment scoring students enrolled inEnglish 1A with instructors who gave the largest number of high grades! (This reallyshould not have been a surprise but it was). Furthermore, we also discovered thatstudents who had the highest assessment score mean were enrolled with an instructorwho typically gives low grades!
This inverse relationship indicated to us that in order to do good research oninstructor grading variation we must control for the variable of student ability.Unfortunately, the relationship between scores on our assessment instrument (APS)and grades in English is quite low, and some students do not have a test score on file orthe score is considerably dated. Furthermore, new freshmen have no college GPA norare many high school transcripts available when they could be useful. What weneeded was a performance measure on every student that was timely and that wouldbe independent of the grade earned in the target course.
Our solution was to develop a 4-point research GPA, as before, on each studentthrough enrollment in the target course, but with this important modification: Thegrade in the target course would be removed from calculation of the research GPA. Wedubbed this value as the "contextual GPA", sort of a wrap-around-the-target-courseresearch GPA.
To illustrate, assume that a student took nothing but 3-unit courses and thefollowing grade notations (minus the target course grade ) appeared on her cumulativerecord:
AAAABBBCCCFWW plus earned a "C" in the target course.
Grade frequency Gradepoints
"A"(4)'Iwo)"C"(2)"DT)
impi(1)
SUMS
4 163 93 6
0 0
1
2 213 34
34/13 = a contextual research GPA of 2.62 and with a "2" in the target course (a "C").
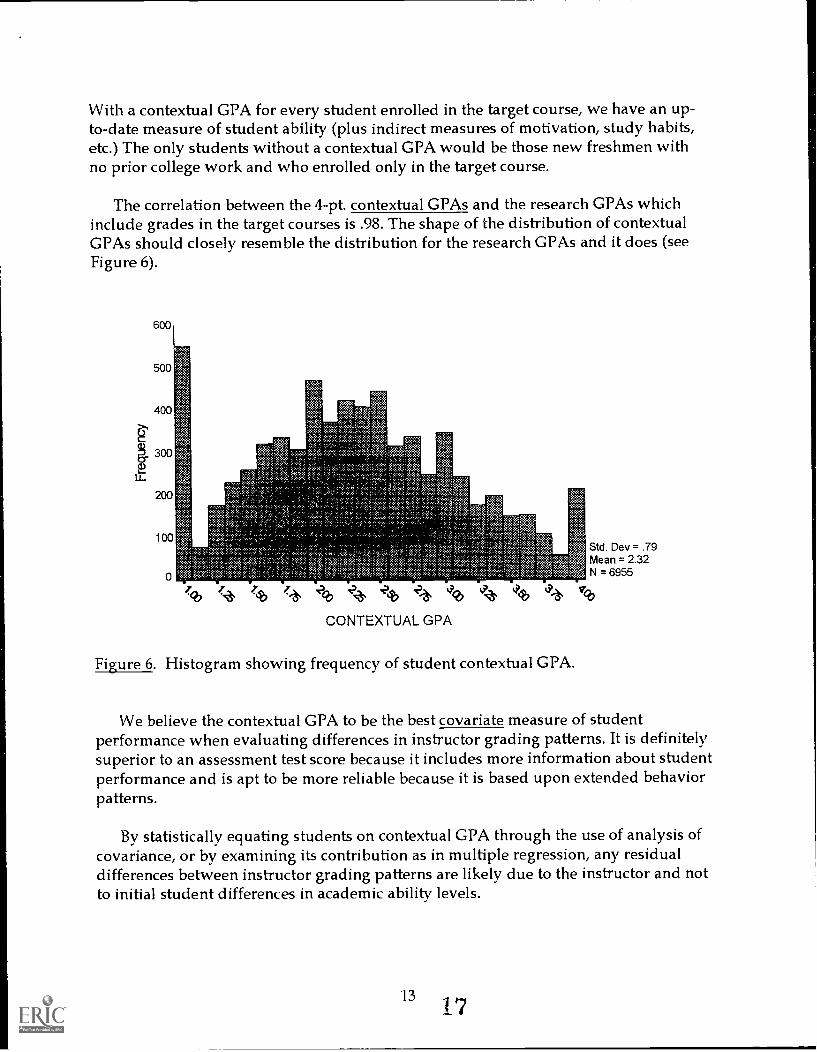
With a contextual GPA for every student enrolled in the target course, we have an up-to-date measure of student ability (plus indirect measures of motivation, study habits,etc.) The only students without a contextual GPA would be those new freshmen withno prior college work and who enrolled only in the target course.
The correlation between the 4-pt. contextual GPAs and the research GPAs whichinclude grades in the target courses is .98. The shape of the distribution of contextualGPAs should closely resemble the distribution for the research GPAs and it does (seeFigure 6).
600
500
400
200
100
4) 4 427 % 'le?)
CONTEXTUAL GPA
Figure 6. Histogram showing frequency of student contextual GPA.
Std. Dev = .79Mean = 2.32N = 6955
We believe the contextual GPA to be the best covariate measure of studentperformance when evaluating differences in instructor grading patterns. It is definitelysuperior to an assessment test score because it includes more information about studentperformance and is apt to be more reliable because it is based upon extended behaviorpatterns.
By statistically equating students on contextual GPA through the use of analysis ofcovariance, or by examining its contribution as in multiple regression, any residualdifferences between instructor grading patterns are likely due to the instructor and notto initial student differences in academic ability levels.
We also believe the contextual GPA will be useful as a multiple measure inco/prerequisite research. By the time some students enroll in a target course, theirassessment scores are dated, they may not have taken recommended preparatory skillcourses, or they may be new students having no regular college GPA. By using thecontextual GPA (or a conventional GPA computed in a contextual manner), theresearcher should have a performance measure on nearly every student. Pending theoutcome, a prerequisite for a course could be modified to read some score on theassessment instrument, completion of a preparatory skill course, or a particular collegeGPA on a specified number of units. Naturally, any published prerequisite GPAwould refer to the regular GPA without contextual consideration. The contextual GPAis only used in the initial research.
Applying The Research GPA To Instructor Grading Variability Across The Curriculum
From the fall 1992 semester, we selected 19 general education courses with multiplesections that were offered during the day and routinely taught by at least two or morefull-time, tenured instructors at ARC. The courses covered a span of four regularsemesters. Different sections of the same course that were taught by the same instructorwere combined to increase sample size for each faculty member. There were a total of6,955 students and 71 instructors (69 unduplicated count).
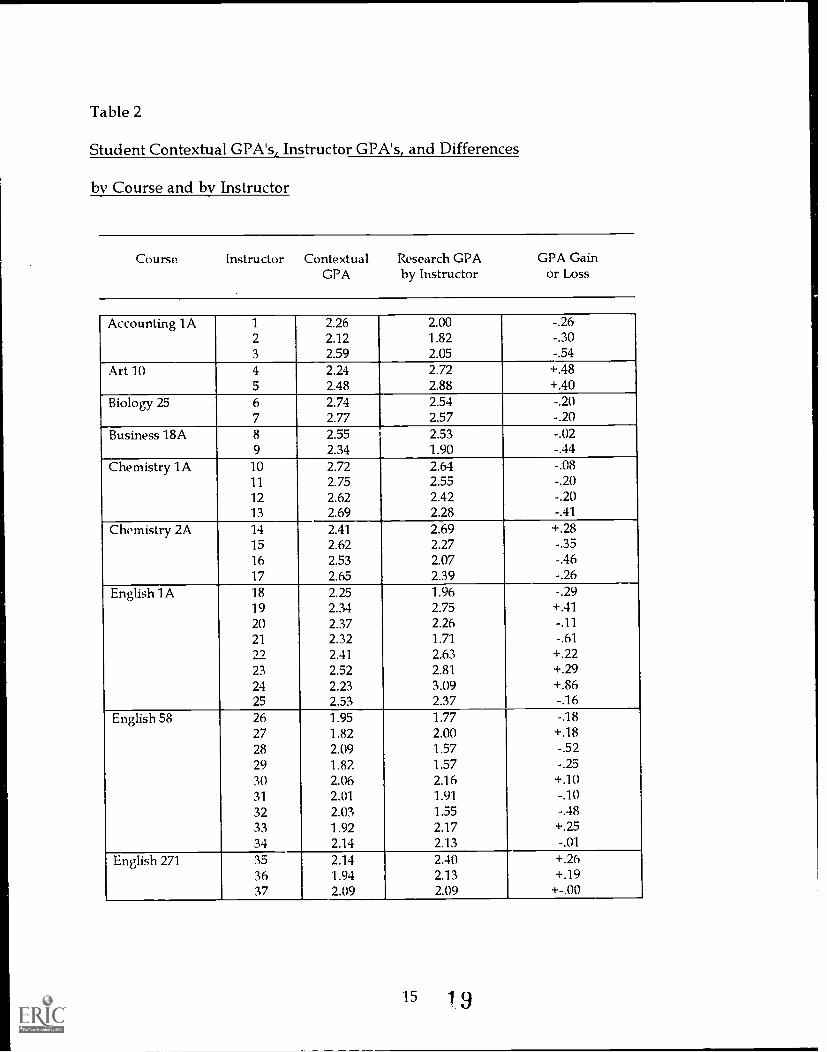
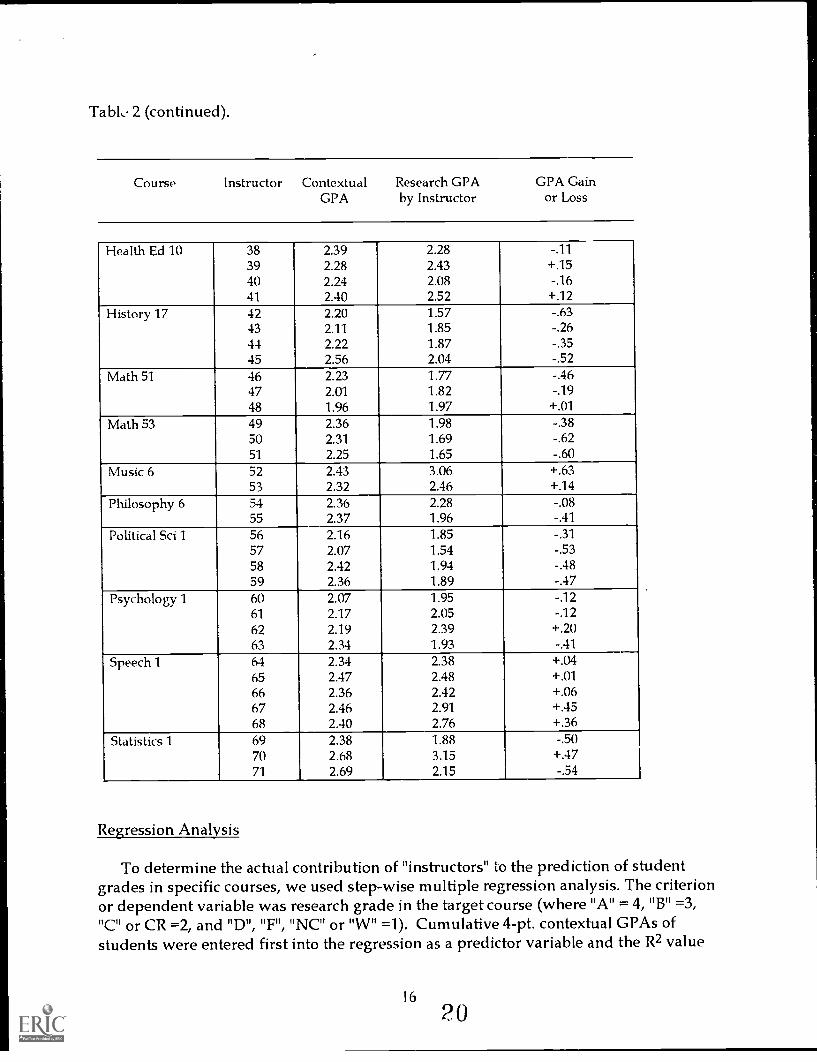
We applied the 4-point contextual GPA for each student within a given course witha specific instructor as well as the 4-point research GPA for the instructor (i.e., theresearch GPA for the entire course per instructor). These results are presented inTable 2 (p. 15, 16). In examining the first course in Table 2 (Accounting 1 X), you willnotP that instructor #1 had students who had a cumulative contextual GPA of 2.26. Theresearch GPA, based only upon ;:he grades in the target course, came in a t 2.00. Thedifference between those two values (the gain or loss) is an average grade loss of -.26with that instructor (course average minus contextual GPA). So, on average, the coursewas more difficult (i.e., more unsuccessful grade notations) than what these studentshad typically experienced. Notice that for Accounting 1A, all three instructors gavegrades that resulted in grade loss for students. Now examine English 1A with its eightinstructors. The gain/loss column (the differences) clearly show grading inconsistency.The biggest gain is with instructor #24 and the largest loss is with instructor #21.Finally, please examine the results for Statistics 1 with its three instructors. Theabsolute range between contextual GPA and instructor GPA is from -.54 to +.47, adifference of over one full research grade! Such large ins':ructor grading variationwithin the same course is something that should not exist. Further, this magnitude ofgrading inconsistency renders validation of course placement by any type of studentassessment as totally absurd. We have found that presenting data to faculty as we haveorganized it in Table 2, makes the issue abundantly clear.
14 1 8
Table 2
Student Contextual CPA's, Instructor GPA's, and Differences
by Course and by Instructor
Course Instructor Contextual Research GPAGPA by Instructor
To determine the actual contribution of "instructors" to the prediction of studentgrades in specific courses, we used step-wise multiple regression analysis. The criterionor dependent variable was research grade in the target course (where "A" = 4, "B" =3,"C" or CR =2, and "D", "F", "NC" or "W" =1). Cumulative 4-pt. contextual GPAs ofstudents were entered first into the regression as a predictor variable and the R2 value
16
20
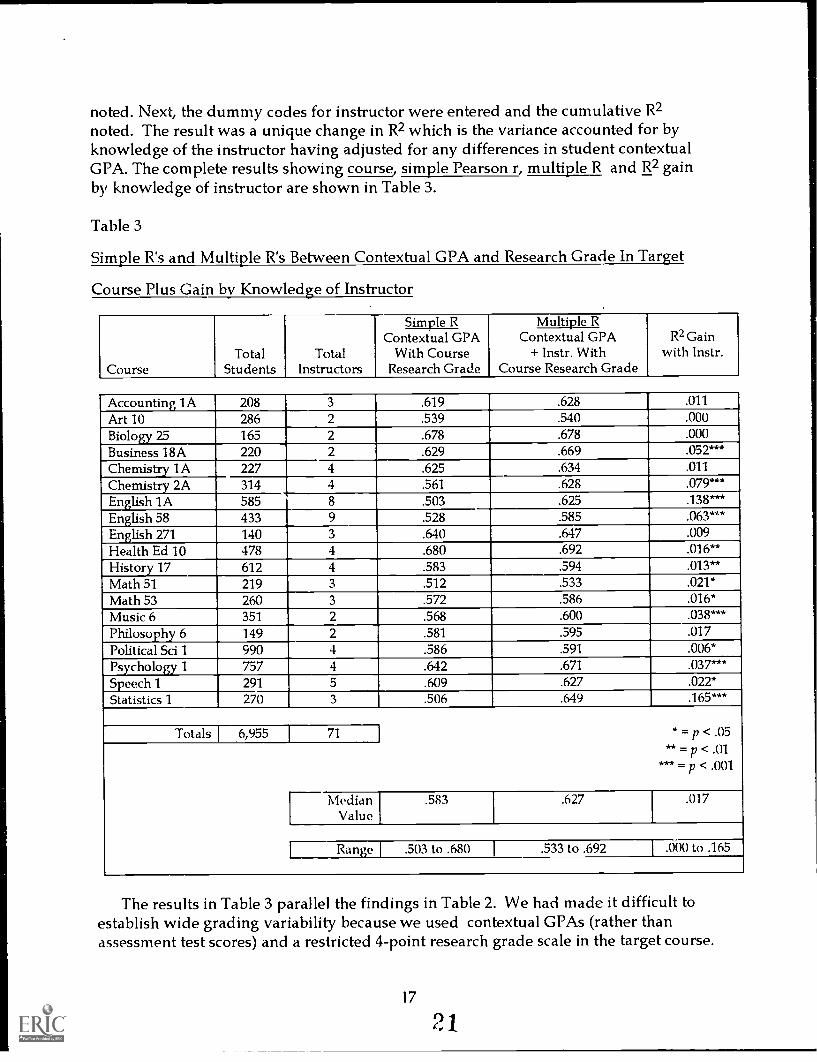
noted. Next, the dummy codes for instructor were entered and the cumulative R2noted. The result was a unique change in R2 which is the variance accounted for byknowledge of the instructor having adjusted for any differences in student contextualGPA. The complete results showing course, simple Pearson r, multiple R and R2 gainby knowledge of instructor are shown in Table 3.
Table 3
Simple R's and Multiple R's Between Contextual GPA and Research Grade In Target
Course Plus Gain by Knowledge of Instructor
Simple R Multiple RContextual GPA Contextual GPA R2 Gain
Total Total With Course + Instr. With with Instr.Course Students Instructors Research Grade Course Research Grade
Accounting 1A 208 3 .619 .628 .011
Art 10 286 2 .539 .540 .000
Biology 25 165 2 .678 .678 .000
Business 18A 220 2 .629 .669 .032
Chemistry 1A 227 4 .625 .634 .011
Chemistry 2A 314 4 .561 .628 .079
English lA 585 8 .503 .625 .138-English 58 433 9 .528 .585
English 271 140 3 .640 .647 .009Health Ed 10 478 4 .680 .692 .016**
The results in Table 3 parallel the findings in Table 2. We had made it difficult toestablish wide grading variability because we used contextual GPAs (rather thanassessment test scores) and a restricted 4-point research grade scale in the target course.
In spite of this, we did find some troublesome courses, but not wide gradinginconsistency everywhere. Of course, this was a bit of good news!
In Table 3 in the R2 Gain column, you will notice that the biggest trouble spots occurwith Pie following courses: Business 18A, Chemistry 2A, English 1A, English 58, I'.1usic6, Psychology 1, and the very worst problem, Statistics 1. All of these courses hadinstructors which accounted for 3% or more of the grading variance not attributable todifferences in student grade histories. With Statistics 1, knowledge of instructoraccounted for 16.5% of the variance in grading. Overall, the median R2 gain byknowledge of instructor was 1.7%.
In Table 3, note that the simple correlations between contextual GPAs and coursegrades have a median value of .583 which, from our practice, is globally higher thancorrelation coefficients between assessment test scores and grades. Frankly stated,college GPAs are generally better predictors of target course grades than are assessmenttest scores. In our judgment, cumulative college GPA should be given more officialstatus as a multiple measure when judging student qualifications for course placement.
But Before You Trash The Test
It has been established that wide differences in instructor grading practices cancreate havoc with validating any assessment/placement procedure. The sensible thingto do is to start a movement toward rectifying grading inconsistency. The politicalhammer is "no consistency-- no placement."
Should you wish to examine what a validity coefficient between assessment testscores and grades might be under the most favorable of circumstances (i.e., little or noinstructor grading differences), we offer the following recommendations.
1. Compute a part (or partial) correlation between assessment test scores andgrades having removed the effects of instructor GPA from grades (part) or fromgrades and assessment scores (partial). The part procedure is outlined as OptionD, page 21.10 in the yellow covered Matriculation Evaluation: Phase III LocalResearch Options, June 1992. Note that a part or partial correlation value maysometimes be lower than the original correlation between assessment scores andgrades. This is a function of the interrelationships existing between thevariables. For example, if the correlation between GPAs for instructors andstudent assessment scores is high positive, the part or partial correlation betweenassessment scores and grades will be lower than the original correlation.
2. A more straightforward approach is to convert grades for all students enrolledwith the same instructor into standardized Z scores (the student's coded gradevalue minus the mean GPA for a specific instructor all divided by the standarddeviation of grades for that instructor). Converting student grades intorespective Z scores within each instructor makes the mean of all Z scores (for
18
each instructor) equal to 0.0. The student Z scores are now relative performances.A Z of 1.00 is interpreted in the same way across all instructors, namely that sucha student scored one standard deviation above the mean grade (GPA) for thecourse with that instructor. It may be that a grade of "B" with one instructorcould convert to a Z of 1.00, but the same grade if earned from another instructorcould convert to a Z of 2.0.
Once the Z conversions are completed for each instructor within the samecourse, a Pearson r correlation can be computed between student assessmenttest scores and respective Z scores that are based upon grades. The result willgive the correlation between assessment scores and relative course performanceswith the effects of instructor grading inconsistency removed.
Please remember that such procedures as outlined above will not validate thetraditional use of an assessment instrument. Rather, it will help to gain someinformation on what validity could be under ideal circumstances. This may help toremove doubts about an assessment test and place it upon inconsistency of grading ifthat is where it truly belongs.


![[XLS]xenopusresource.org · Web view736. 866. 766. 310. 344. 763. 785. 883. 857. 803. 918. 788. 360. 361. 37. 445. 534. 844. 354. 790. 751. 752. 588. 762. 879. 343. 761. 737. 768.](https://static.documents.pub/doc/80x56/5b08801c7f8b9a992a8c5b14/xls-view736-866-766-310-344-763-785-883-857-803-918-788-360-361.jpg)


![Get 642-785 exam questions & 642-785 practice tests [Infographic]](https://static.documents.pub/doc/80x56/5a65c26d7f8b9ab3488b4f9b/get-642-785-exam-questions-642-785-practice-tests-infographic.jpg)


