Document of The World Bank Report No: ICR0000550 IMPLEMENTATION COMPLETION AND RESULTS REPORT (IDA-H0500) ON A CREDIT IN THE AMOUNT OF SDR 36.7 MILLION (US$55 MILLION EQUIVALENT) TO THE REPUBLIC OF KENYA FOR A FREE PRIMARY EDUCATION SUPPORT PROJECT December 20, 2007 Human Development 1 Eastern Africa 2 Africa Region Public Disclosure Authorized Public Disclosure Authorized Public Disclosure Authorized Public Disclosure Authorized Public Disclosure Authorized Public Disclosure Authorized Public Disclosure Authorized Public Disclosure Authorized
Transcript
Document of The World Bank
Report No: ICR0000550
IMPLEMENTATION COMPLETION AND RESULTS REPORT (IDA-H0500)
ON A
CREDIT
IN THE AMOUNT OF SDR 36.7 MILLION (US$55 MILLION EQUIVALENT)
TO THE
REPUBLIC OF KENYA
FOR A
FREE PRIMARY EDUCATION SUPPORT PROJECT
December 20, 2007
Human Development 1 Eastern Africa 2 Africa Region
Pub
lic D
iscl
osur
e A
utho
rized
Pub
lic D
iscl
osur
e A
utho
rized
Pub
lic D
iscl
osur
e A
utho
rized
Pub
lic D
iscl
osur
e A
utho
rized
Pub
lic D
iscl
osur
e A
utho
rized
Pub
lic D
iscl
osur
e A
utho
rized
Pub
lic D
iscl
osur
e A
utho
rized
Pub
lic D
iscl
osur
e A
utho
rized
CURRENCY EQUIVALENTS (Exchange Rate Effective December 2007)
Currency Unit = Kenya Shilling
Ksh 60 = US$1
FISCAL YEAR July 1 - June 30
ABBREVIATIONS AND ACRONYMS
ALRMP ASALs
: Arid Lands Resource Management Project Arid and Semi-Arid Lands
CAS : Country Assistance Strategy DEO : District Education Officer DIR : Detailed Implementation Review ECD : Early Childhood Development EMIS : Education Management Information Systems FM : Financial Management FMR : Financial Monitoring Report FPE : Free Primary Education FPESP : Free Primary Education Support Project GER : Gross Enrolment Rates HT : Head Teachers ICR : Implementation Completion Report IM : Intructional Materials IMP : Instructional Materials Programme INSET : In-service Teacher Training INT : Department of Institutional Integrity KCPE : Kenya Certificate Primary Education KESSP : Kenya Education Sector Support Project KRT : Key Resource Teachers MEO : Ministry Education Officer MOE : Ministry of Education MoEST : Ministry of Education, Science and Technology MOU : Memorandum of Understanding NFE : Non-Formal Education PAD : Project Appraisal Document PDE : Provincial Director of Education PDO : Project Development Objective PETS : Public Expenditure Tracking Survey PIU : Project Implementation Unit QAG
: Quality Assurance Group
SbTD : School-based Teacher Development SIMBA : School Instructional Materials Bank Account SIMSC : School Instructional Materials Steering Committee SPRED : Strengthening Primary Education STEPS : Strengthening Primary and Secondary Education TA : Technical Assistance WBI : World Bank Institute
Vice President: Obiageli Katryn Ezekwesili Country Director: Colin Bruce
Sector Manager: Christopher Walker Project Team Leader: Michael Mills
ICR Team Leader: Shobhana Sosale ICR Primary Author: Robert Hawkins
KENYA Free Primary Education Support Project
CONTENTS
Data Sheet A. Basic Information B. Key Dates C. Ratings Summary D. Sector and Theme Codes E. Bank Staff F. Results Framework Analysis G. Ratings of Project Performance in ISRs H. Restructuring I. Disbursement Graph
1. Project Context, Development Objectives and Design............................................... 12. Key Factors Affecting Implementation and Outcomes .............................................. 43. Assessment of Outcomes .......................................................................................... 104. Assessment of Risk to Development Outcome......................................................... 175. Assessment of Bank and Borrower Performance ..................................................... 186. Lessons Learned ....................................................................................................... 207. Comments on Issues Raised by Borrower/Implementing Agencies/Partners .......... 20Annex 1. Project Costs and Financing.......................................................................... 24Annex 2. Outputs by Component ................................................................................. 25Annex 3. Economic and Financial Analysis................................................................. 32Annex 4. Bank Lending and Implementation Support/Supervision Processes ............ 38Annex 5. Beneficiary Survey Results ........................................................................... 40Annex 6. Stakeholder Workshop Report and Results................................................... 41Annex 7. Summary of Borrower's ICR and/or Comments on Draft ICR..................... 42Annex 8. Comments of Cofinanciers and Other Partners/Stakeholders....................... 49Annex 9. List of Supporting Documents ...................................................................... 54
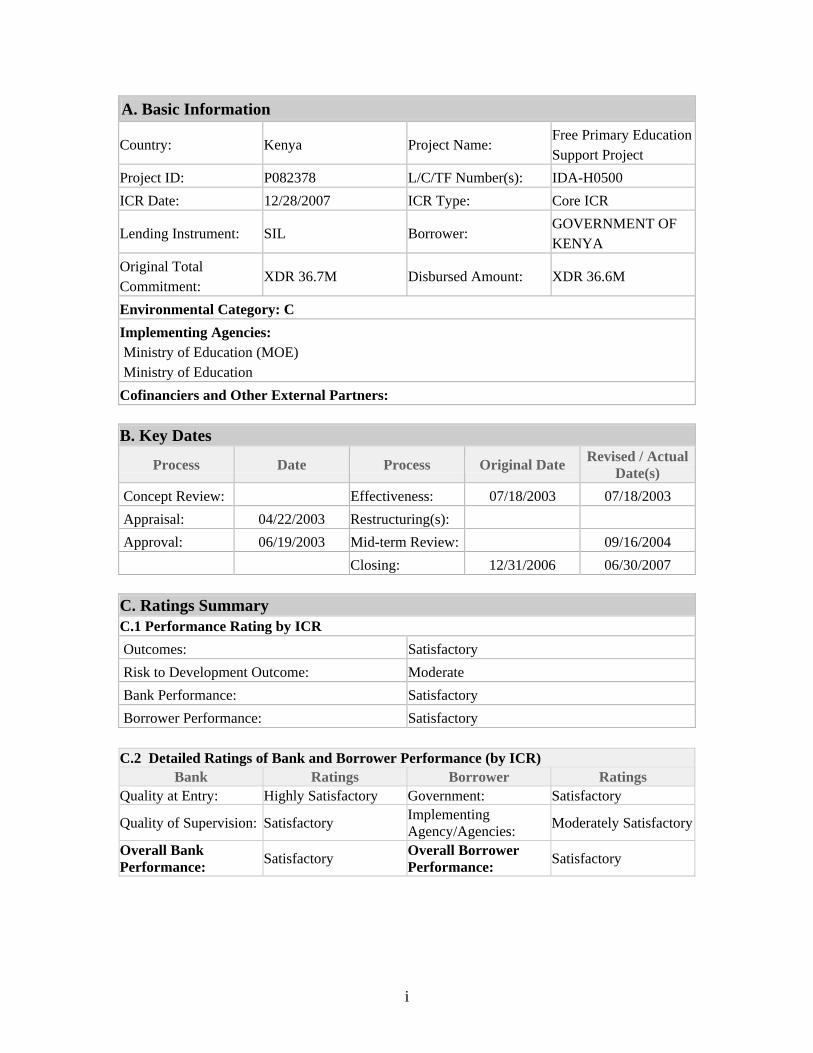
Lending Instrument: SIL Borrower: GOVERNMENT OF KENYA
Original Total Commitment:
XDR 36.7M Disbursed Amount: XDR 36.6M
Environmental Category: C Implementing Agencies: Ministry of Education (MOE) Ministry of Education Cofinanciers and Other External Partners: B. Key Dates
Process Date Process Original Date Revised / Actual Date(s)
Concept Review: Effectiveness: 07/18/2003 07/18/2003 Appraisal: 04/22/2003 Restructuring(s): Approval: 06/19/2003 Mid-term Review: 09/16/2004 Closing: 12/31/2006 06/30/2007 C. Ratings Summary C.1 Performance Rating by ICR Outcomes: Satisfactory Risk to Development Outcome: Moderate Bank Performance: Satisfactory Borrower Performance: Satisfactory
C.2 Detailed Ratings of Bank and Borrower Performance (by ICR) Bank Ratings Borrower Ratings
Quality at Entry: Highly Satisfactory Government: Satisfactory
Quality of Supervision: Satisfactory Implementing Agency/Agencies: Moderately Satisfactory
Overall Bank Performance: Satisfactory Overall Borrower
Performance: Satisfactory
ii
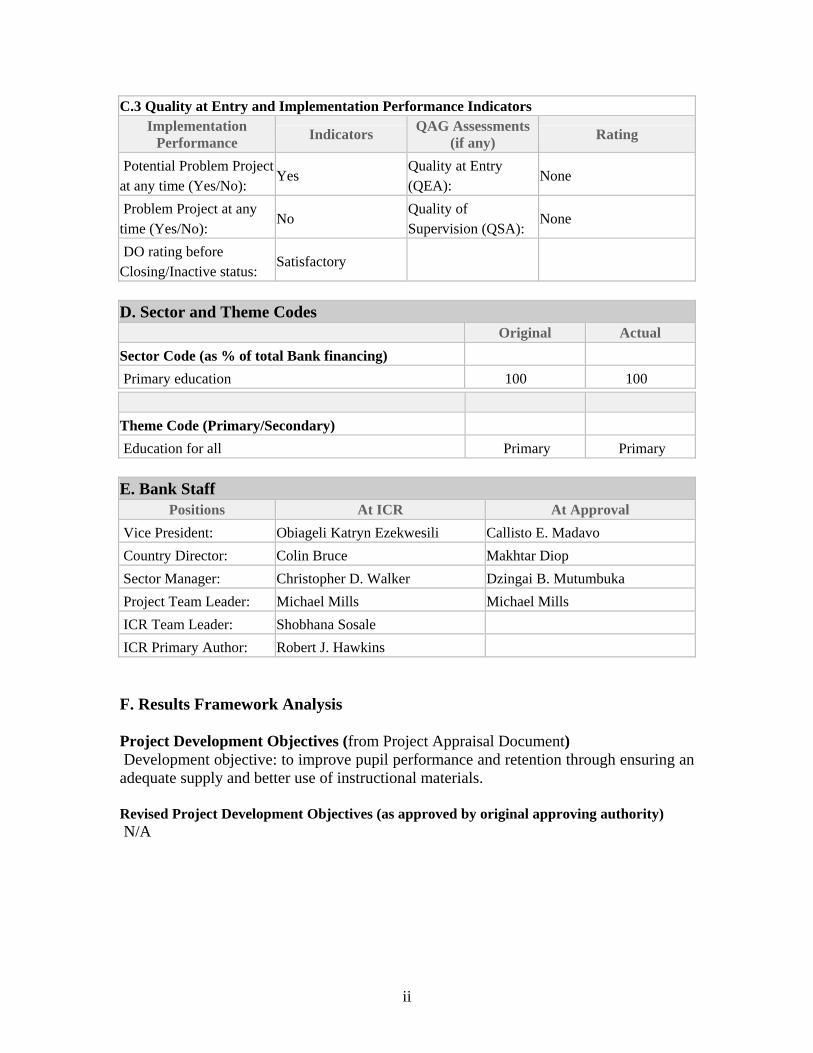
C.3 Quality at Entry and Implementation Performance Indicators Implementation
Original Actual Sector Code (as % of total Bank financing) Primary education 100 100
Theme Code (Primary/Secondary) Education for all Primary Primary E. Bank Staff
Positions At ICR At Approval Vice President: Obiageli Katryn Ezekwesili Callisto E. Madavo Country Director: Colin Bruce Makhtar Diop Sector Manager: Christopher D. Walker Dzingai B. Mutumbuka Project Team Leader: Michael Mills Michael Mills ICR Team Leader: Shobhana Sosale ICR Primary Author: Robert J. Hawkins F. Results Framework Analysis Project Development Objectives (from Project Appraisal Document) Development objective: to improve pupil performance and retention through ensuring an adequate supply and better use of instructional materials. Revised Project Development Objectives (as approved by original approving authority) N/A
iii
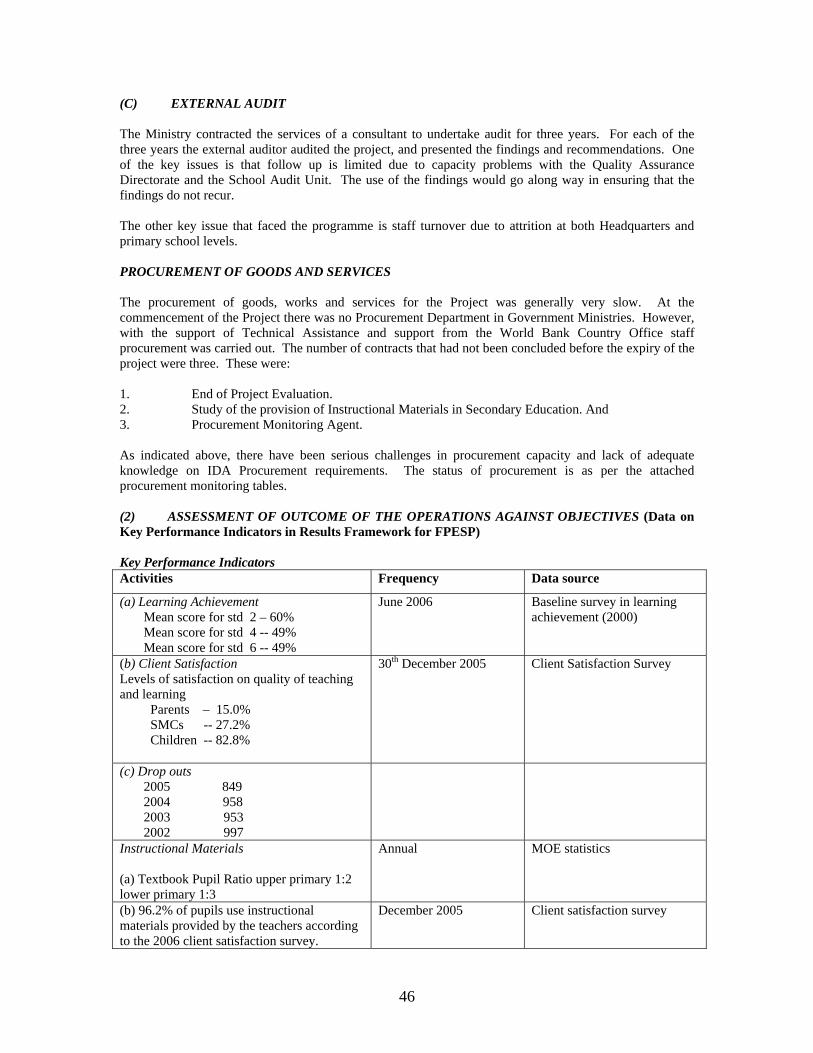
(a) PDO Indicator(s)
Indicator Baseline Value
Original Target Values (from
approval documents)
Formally Revised Target Values
Actual Value Achieved at
Completion or Target Years
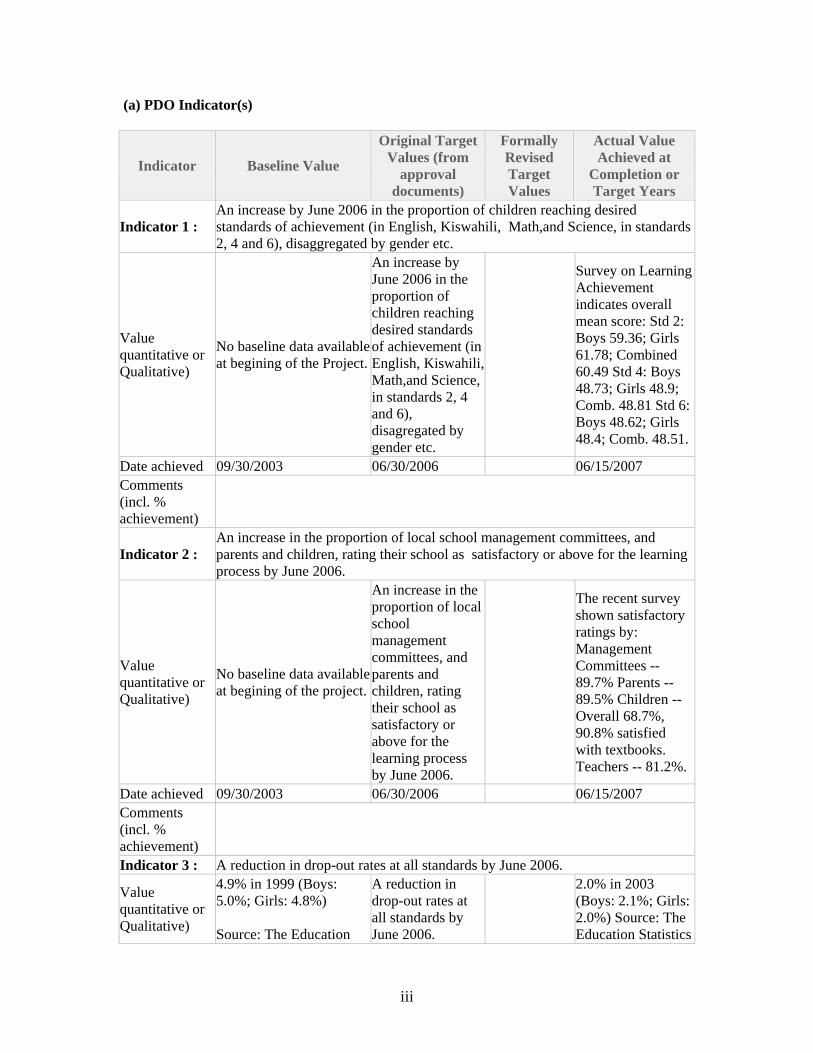
Indicator 1 : An increase by June 2006 in the proportion of children reaching desired standards of achievement (in English, Kiswahili, Math,and Science, in standards 2, 4 and 6), disaggregated by gender etc.
Value quantitative or Qualitative)
No baseline data available at begining of the Project.
An increase by June 2006 in the proportion of children reaching desired standards of achievement (in English, Kiswahili, Math,and Science, in standards 2, 4 and 6), disagregated by gender etc.
Survey on Learning Achievement indicates overall mean score: Std 2: Boys 59.36; Girls 61.78; Combined 60.49 Std 4: Boys 48.73; Girls 48.9; Comb. 48.81 Std 6: Boys 48.62; Girls 48.4; Comb. 48.51.
Date achieved 09/30/2003 06/30/2006 06/15/2007 Comments (incl. % achievement)
Indicator 2 : An increase in the proportion of local school management committees, and parents and children, rating their school as satisfactory or above for the learning process by June 2006.
Value quantitative or Qualitative)
No baseline data available at begining of the project.
An increase in the proportion of local school management committees, and parents and children, rating their school as satisfactory or above for the learning process by June 2006.
The recent survey shown satisfactory ratings by: Management Committees -- 89.7% Parents -- 89.5% Children -- Overall 68.7%, 90.8% satisfied with textbooks. Teachers -- 81.2%.
Date achieved 09/30/2003 06/30/2006 06/15/2007 Comments (incl. % achievement)
Indicator 3 : A reduction in drop-out rates at all standards by June 2006.
Value quantitative or Qualitative)
4.9% in 1999 (Boys: 5.0%; Girls: 4.8%) Source: The Education
A reduction in drop-out rates at all standards by June 2006.
2.0% in 2003 (Boys: 2.1%; Girls: 2.0%) Source: The Education Statistics
iv
Statistics Section, MoEST Section, MoE Date achieved 09/30/2003 06/30/2006 06/15/2007 Comments (incl. % achievement)
(b) Intermediate Outcome Indicator(s)
Indicator Baseline Value
Original Target Values (from
approval documents)
Formally Revised
Target Values
Actual Value Achieved at
Completion or Target Years
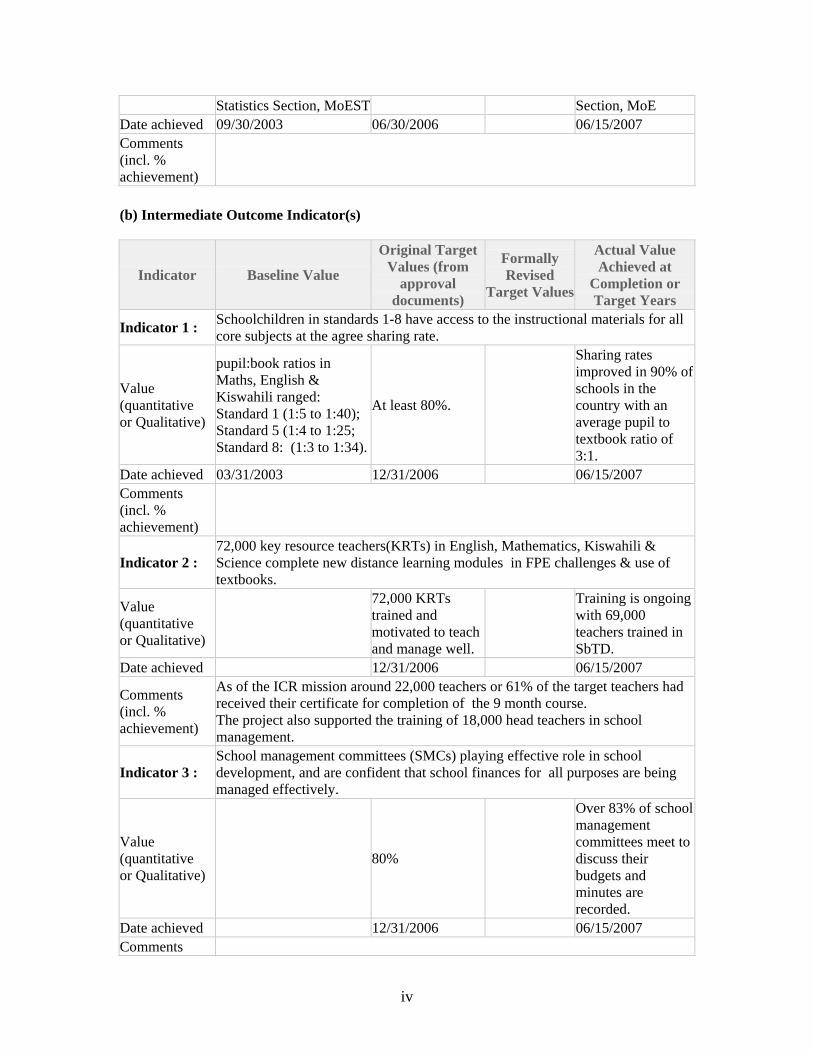
Indicator 1 : Schoolchildren in standards 1-8 have access to the instructional materials for all core subjects at the agree sharing rate.
Value (quantitative or Qualitative)
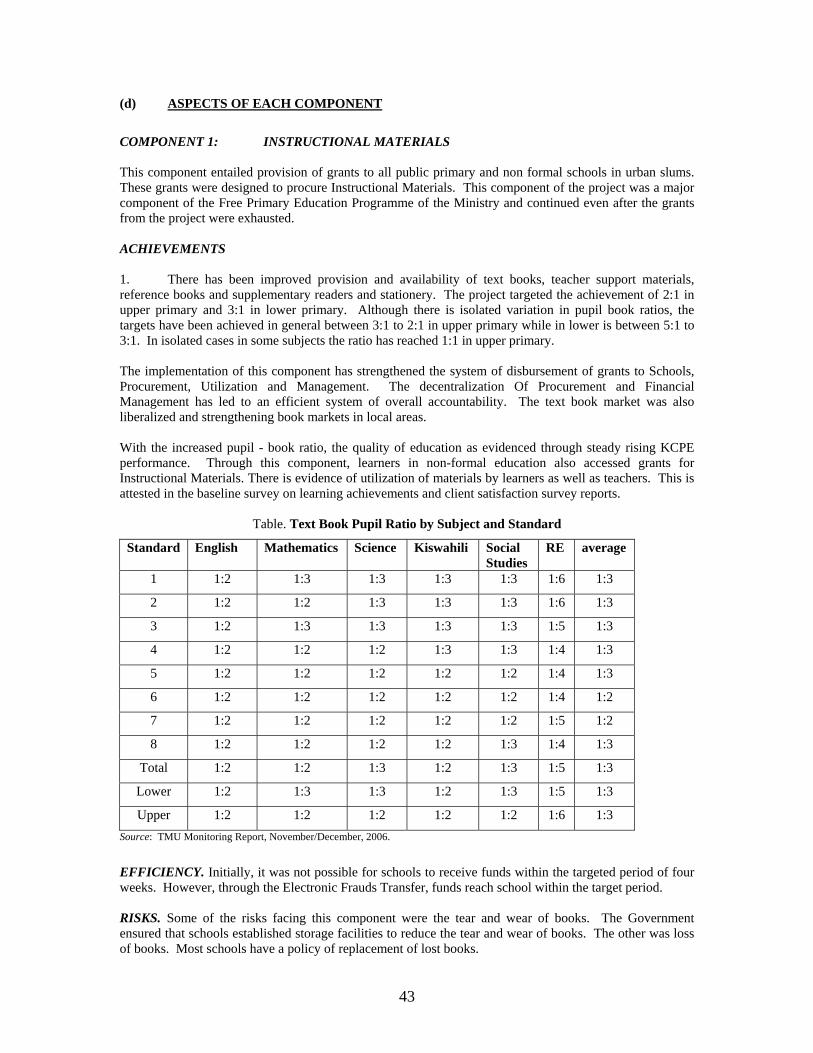
pupil:book ratios in Maths, English & Kiswahili ranged: Standard 1 (1:5 to 1:40); Standard 5 (1:4 to 1:25; Standard 8: (1:3 to 1:34).
At least 80%.
Sharing rates improved in 90% of schools in the country with an average pupil to textbook ratio of 3:1.
Date achieved 03/31/2003 12/31/2006 06/15/2007 Comments (incl. % achievement)
Indicator 2 : 72,000 key resource teachers(KRTs) in English, Mathematics, Kiswahili & Science complete new distance learning modules in FPE challenges & use of textbooks.
Value (quantitative or Qualitative)
72,000 KRTs trained and motivated to teach and manage well.
Training is ongoing with 69,000 teachers trained in SbTD.
Date achieved 12/31/2006 06/15/2007
Comments (incl. % achievement)
As of the ICR mission around 22,000 teachers or 61% of the target teachers had received their certificate for completion of the 9 month course. The project also supported the training of 18,000 head teachers in school management.
Indicator 3 : School management committees (SMCs) playing effective role in school development, and are confident that school finances for all purposes are being managed effectively.
Value (quantitative or Qualitative)
80%
Over 83% of school management committees meet to discuss their budgets and minutes are recorded.
Date achieved 12/31/2006 06/15/2007 Comments
v
(incl. % achievement)
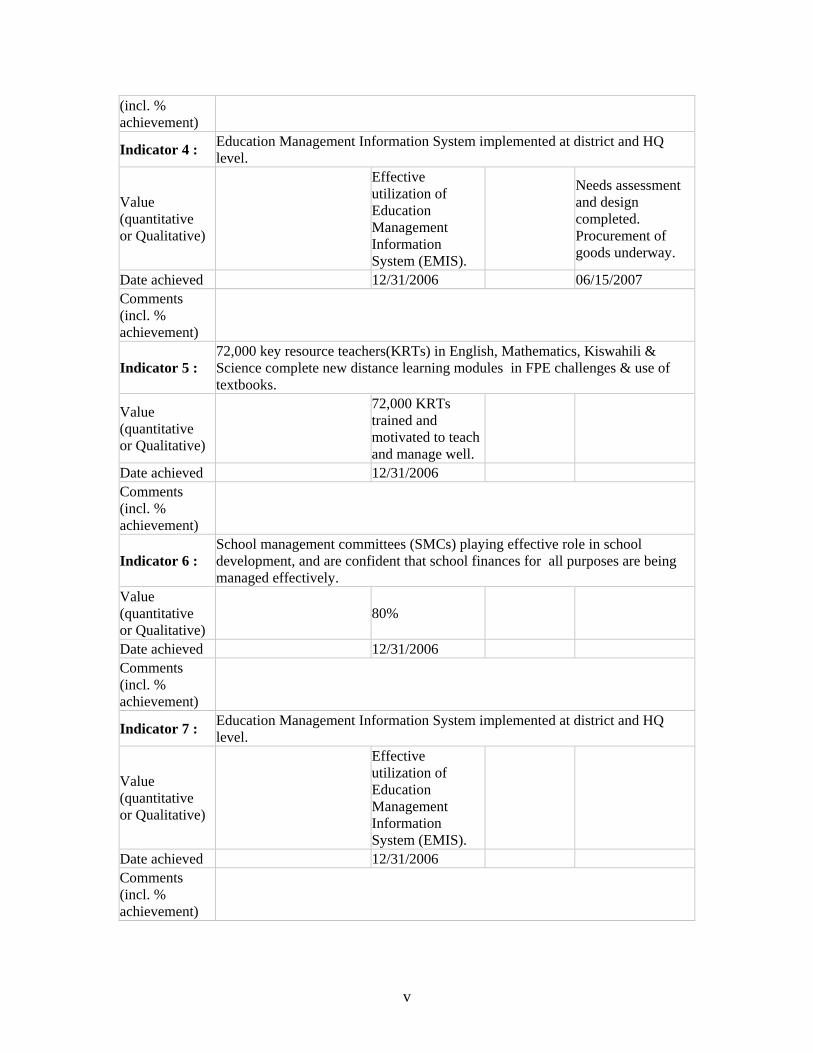
Indicator 4 : Education Management Information System implemented at district and HQ level.
Value (quantitative or Qualitative)
Effective utilization of Education Management Information System (EMIS).
Needs assessment and design completed. Procurement of goods underway.
Date achieved 12/31/2006 06/15/2007 Comments (incl. % achievement)
Indicator 5 : 72,000 key resource teachers(KRTs) in English, Mathematics, Kiswahili & Science complete new distance learning modules in FPE challenges & use of textbooks.
Value (quantitative or Qualitative)
72,000 KRTs trained and motivated to teach and manage well.
Date achieved 12/31/2006 Comments (incl. % achievement)
Indicator 6 : School management committees (SMCs) playing effective role in school development, and are confident that school finances for all purposes are being managed effectively.
Value (quantitative or Qualitative)
80%
Date achieved 12/31/2006 Comments (incl. % achievement)
Indicator 7 : Education Management Information System implemented at district and HQ level.
Value (quantitative or Qualitative)
Effective utilization of Education Management Information System (EMIS).
Date achieved 12/31/2006 Comments (incl. % achievement)
1. Project Context, Development Objectives and Design
1.1 Context at Appraisal The Country Assistance Strategy at the time of project inception stressed the need for Kenyan designed and owned approaches to reform and the importance of broad based participation. The election of the new Kenyan government in December 2002 and its focus on governance, corruption, and poverty provided an important impetus for the Bank to re-engage in a number of sectors including education. The election created a unique and urgent window for the Bank to respond to Kenya’s request to support its social and economic challenges. The new government immediately introduced its Free Primary Education (FPE) policy in January, 2003 which abolished primary school fees and levies charged to parents. In education, throughout the 1990’s primary and secondary schools gross enrollment rates (GER) both dropped significantly largely due to the increasing costs of education to parents and due to slow economic growth. By 2000 the primary school GER had dropped to an estimated 88 percent. As a result of the FPE policy the primary education system experienced an increase of 1.2 million students from 2002 increasing the total primary school enrollment to 7.2 million pupils (with a GER at 104 percent). There were about 17,750 primary schools in the country with an average school size of about 370 students in 2002. With FPE, the average school size increased to 400 students. There were many issues that Government needed to address to achieve the stated goals of FPE – namely reducing the unit costs of education; increasing expenditure on non-salary costs such as textbooks and other learning materials; implementing the revised curriculum to allow more time on task; preparing and adopting an action plan for the training, redeployment, hiring, and upgrading of teachers; and revising the Education Act and regulations to decentralize decision making to the district and school level administrators. One of the major reforms focused on instructional materials and textbooks. Before the reform, schools had to rely on parental and community contributions to purchase textbooks resulting in inadequate numbers of books due to high costs, high pupil to book ratios, and children being excluded from schools due to inability to purchase the books. The reform, initially supported by the Dutch and DFID, incorporated the following policy changes: textbook preparation and publication were liberalized; the principle of shared use of the textbooks was accepted; approved lists of textbooks were made available; and there was full financial decentralization of textbook procurement to school communities. Moreover, Government and DFID funds were transferred directly to schools via the commercial banking system where schools committees comprising teachers and parents select books from a pre-approved list and purchase the textbooks locally using a transparent tendering process. The focus of the Bank project therefore was planned to be relatively narrow in scope with support to scaling up the financing of instructional materials as well as some capacity building and monitoring and evaluation activities. The decision to focus on instructional materials was made for a number of reasons: the provision of textbooks would have a direct impact on learning in the schools; the project would defray the costs of education to parents; the support could be designed and implemented relatively quickly as it would build on the existing successful program; and finally it would provide additional momentum to the introduction of the new curriculum. Capacity building would then complement the provision of textbooks with in-service teacher training; minimize fiduciary risks through financial management training; and support the sustainability of the venture through design of a follow-up project.
2
1.2 Original Project Development Objectives (PDO) and Key Indicators (as approved)
The original development objective was: to improve pupil performance and retention through ensuring an adequate supply and better use of instructional materials. Detailed objectives and outcome/output indicators are provided in the table below:
Table 1. Project Objectives and Outcome/Output Indicators Objective Outcome/Output Indicator
DO 1: Improve Pupil performance and retention through ensuring an adequate supply and better use of instructional materials.
1.1 Increase by June 2006 in proportion of children reaching desired standards of achievement (in English, Kiswahili, Math and Science in standards 2,4, and 6), disaggregated by province, gender, urban/rural and intra-rural.
1.2 Increase in proportion of local school management committees and parents and children rating their school as satisfactory or above for the learning process by June 2006.
1.3 Reduction in drop out rates at all standards by June 2006.
1.4 Completion of a plan for a follow-up project using studies and training provided.
DO 2: Improved provision and utilization of instructional materials by school children and teachers.
2.1 Improved availability of instructional materials against minimum standards of provision.
2.2 At least 80% of schoolchildren in standards 1-8 have access to the instructional materials for all core subjects at the agreed sharing rate.
DO 3: Capacity Building: effective teaching and learning in schools.
3.1 At least 80% of teachers use the new instructional materials according to the standards set out in the School Inspectors Handbook.
3.2 72,000 key resource teachers in English, Math, Kiswahili and Science complete new distance learning modules in FPE challenges and use of textbooks.
3.3 17,500 nominated guidance and counseling teachers trained to provide services to pupils with special needs.
3.4 17,500 head teachers trained in quality assurance and supervision.
3.5 Cluster meetings of key resource teachers and key resource head teachers taking place at least three times per year.
3.6 80% of school management committees playing effective role in whole school development.
3.7 Action plans have been agreed for a revised system of school inspection, teacher development and support.
DO 4: Capacity Building: improved accounting system implemented in primary schools.
4.1 80% of school management committees are confident that school finances for all purposes are being managed effectively.
3
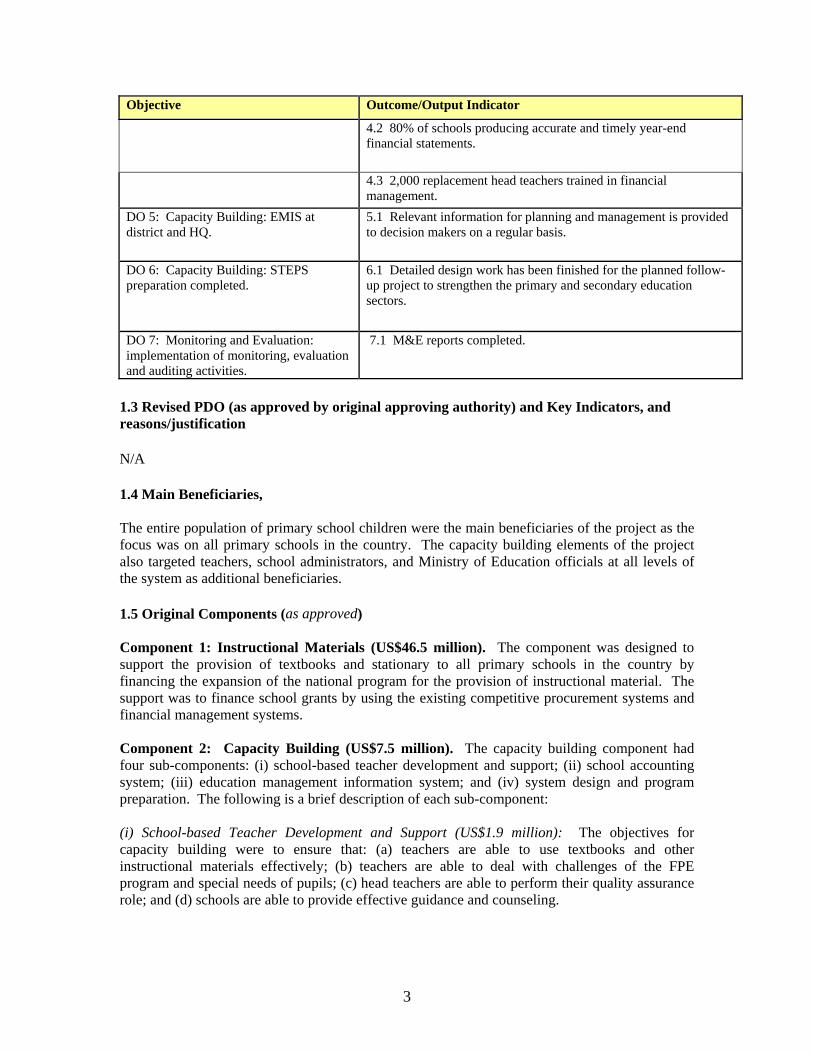
Objective Outcome/Output Indicator
4.2 80% of schools producing accurate and timely year-end financial statements.
4.3 2,000 replacement head teachers trained in financial management.
DO 5: Capacity Building: EMIS at district and HQ.
5.1 Relevant information for planning and management is provided to decision makers on a regular basis.
DO 6: Capacity Building: STEPS preparation completed.
6.1 Detailed design work has been finished for the planned follow-up project to strengthen the primary and secondary education sectors.
DO 7: Monitoring and Evaluation: implementation of monitoring, evaluation and auditing activities.
7.1 M&E reports completed.
1.3 Revised PDO (as approved by original approving authority) and Key Indicators, and reasons/justification N/A
1.4 Main Beneficiaries, The entire population of primary school children were the main beneficiaries of the project as the focus was on all primary schools in the country. The capacity building elements of the project also targeted teachers, school administrators, and Ministry of Education officials at all levels of the system as additional beneficiaries.
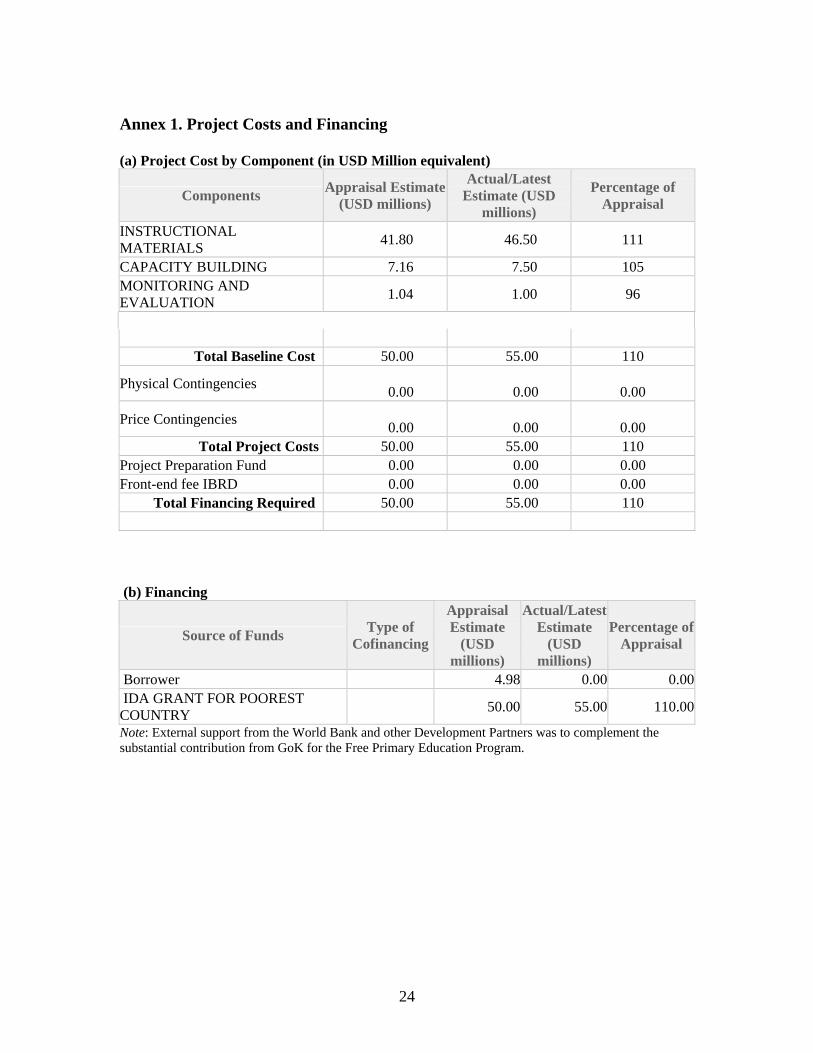
1.5 Original Components (as approved) Component 1: Instructional Materials (US$46.5 million). The component was designed to support the provision of textbooks and stationary to all primary schools in the country by financing the expansion of the national program for the provision of instructional material. The support was to finance school grants by using the existing competitive procurement systems and financial management systems. Component 2: Capacity Building (US$7.5 million). The capacity building component had four sub-components: (i) school-based teacher development and support; (ii) school accounting system; (iii) education management information system; and (iv) system design and program preparation. The following is a brief description of each sub-component: (i) School-based Teacher Development and Support (US$1.9 million): The objectives for capacity building were to ensure that: (a) teachers are able to use textbooks and other instructional materials effectively; (b) teachers are able to deal with challenges of the FPE program and special needs of pupils; (c) head teachers are able to perform their quality assurance role; and (d) schools are able to provide effective guidance and counseling.
4
(ii) School Accounting System (US$1 million): The objective was to provide financial management training to head teachers and school management committees so that all funds disbursed were properly accounted for and used for their intended purposes. (iii) Education Management Information System (US$2.5 million): The objective of this sub-component was to complete the design of an EMIS and initiate implementation of a new system to address the paucity of data on the characteristics and operational efficiency of the education system. (iv) System Design and Program Preparation (US$2.1 million): The sub-component was to support the deeper understanding of selected technical issues; develop strategies for increasing access and improving quality; strengthen management capacity; and to help develop future sub-sector programs. Component 3: Monitoring and Evaluation (US$1.0 million). The component was to focus on monitoring key performance indicators at the outcome and output levels; undertake an evaluation at the end of the project and conduct annual audits throughout the life of the project.
1.6 Revised Components Component 2: Capacity Building – Special Program for Disadvantaged Groups. An additional program for both arid lands and non-formal education was introduced within the capacity building component. The grants to Arid and Semi-Arid Lands (ASALs) were provided to support the construction of schools in 15 districts through a formal collaboration with the Arid Lands Resource Management Project (ALRMP) and an MOU between the President’s Office and the Ministry of Education. The grants for non-formal education were designed to assist slum schools in Nairobi to participate in the decentralized textbook procurement scheme.
1.7 Other significant changes N/A
2. Key Factors Affecting Implementation and Outcomes
2.1 Project Preparation, Design and Quality at Entry When the new government in 2002 requested Bank support in the Education sector, the Bank responded extremely rapidly in preparing the project. The project was appraised in February 2003, went to the Board in June 2003 and became effective in July. This 6 month response time was greatly appreciated by the client and reflected the speed with which the Bank can produce a quality product with the appropriate internal management support and sense of urgency. The Bank was able to respond quickly for a number of reasons. First, the project was very focused. Instead of addressing all issues at once, the team remained extremely disciplined and identified only three components, one of which accounted for 80% of the project funds – the instructional materials component. Next, the project leveraged existing government systems. Procurement of textbooks, for instance, was built upon a very successful DFID supported SPRED 3 project which distributed grants directly to schools for textbook and instructional material purchases. Finally, the project did not attempt to set up a separate project implementation unit but rather built upon the knowledge and expertise already existing in the Ministry of Education (MoE).
5
As noted earlier, the design of the project responded directly to two key CAS issues – the need for Kenyan designed and owned approaches to reform and the imperative to have broad based participation to ensure positive impact. By building upon existing MoE policies and practices, the project immediately gained strong ownership within the Ministry. Moreover, the project deepened the Government’s key policy of decentralized education management. By scaling up an existing practice of decentralized procurement of textbooks, the project deepened the CAS objective of broad based participation by expanding the number of schools impacted through the project from an initial small sample to every primary school in the country. Broad based participation was also strengthened by expanding the number of school selection committees composed of parents. The preparation phase adequately addressed the risks associated with the project. The perceived risks for the project at the preparation stage to a large extent dictated its design. The greatest risk at project design was the large increase of school managed resources and the possibilities for mismanagement in a country where governance had been a concern to donors. To mitigate this risk, the project supported a number of systems to ensure proper use of funds such as electronic transfer of funds to school bank accounts, pre-selected books and prices in an “orange book”, and the establishment of school committees with principles of transparency in posting bank account information for instance. Moreover, the capacity building component to train all school heads in financial management was designed to further mitigate the risk. Finally, the strong auditing component of the project also addressed the risk of mismanagement of funds. Despite the risk, the Bank and the Government of Kenya took a bold and calculated decision to scale up a system of decentralized procurement which had been extremely successful on a very limited pilot basis. The Bank further took a calculated risk in disbursing an initial tranche of US$27 million into the special account – far above the normal Bank levels for an initial disbursement – in order for the government of Kenya to reach all 18,000 schools. Donor coordination represents another important positive aspect of the project design. By building on existing practices that had previously been supported by other donors – DFID and the Dutch government – the project immediately formed a foundation for strong ongoing donor coordination as well as positive momentum by building off of existing activities. Moreover, the collaboration among donors allowed the Bank to design and begin project implementation so quickly. It is rare that a Bank project finances the extension of a project initiated by another donor. This example is discussed in greater detail in the “lessons learned” section of the ICR. Finally, the decision to provide an IDA grant instead of an IDA credit developed a strong sense of trust and good will for the project among the client. These observations are supported by the QAG rating of satisfactory for quality at entry for the project. The QAG report summarizes that, “The project was well designed in terms of its limited focus and its support for decentralization, which is founded in broad Government support. The project also used an existing implementation mechanism, developed by the Government with other donors, to ensure that funding would flow quickly to schools.”
2.2 Implementation The implementation of the instructional materials component through disbursement of school grants was extremely effective and efficient. According to the Public Expenditure Tracking Report (PETS) of October 2005, 97.8% of schools had received all disbursed funds (first tranche of US$27 million) in their accounts and the average mean expenditure on Account 1 (the instructional materials or SIMBA account) was 95%. All 18,000 schools received on average of
6
Kshs.300 (just under US$5) per student for the purchase of textbooks and instructional supplies. The successful implementation of this component was greatly supported by use of existing government-owned systems and the overall high commitment of the MoE to the project. Moreover, the broad-based participatory process embodied in the involvement of school management committees supported the speed and accountability in the procurement of textbooks for all of the 18,000 schools in the system. The Capacity Building component had a more mixed implementation record. The component first supported the implementation of the project by training some 36,000 key resource teachers through multi-media distance learning methodologies. Also, to support school level financial management approximately 17,550 head teachers were trained in effective financial management. The head teacher training experienced significant problems with high turnover among teach teachers and therefore presented a challenge of providing continuous training to new heads. While the initial training aspects of the capacity building component were generally successfully implemented, other aspects of the component encountered significant delays – specifically the EMIS component. According to Ministry staff, the delays were mainly attributed to difficulty in following the Bank’s procurement guidelines for hiring consulting firms. This difficulty can be partly attributed to the Ministries own capacity constraints in procurement and management more generally. For instance, the program coordinator in the Ministry had to take on all the responsibilities of procurement along with coordination and management responsibilities due to the lack of other qualified personnel. This dual responsibility points to larger management and capacity issues at the Ministry. The QAG also points out that “In retrospect, capacity at the central ministry level was insufficient for rapid implementation of the small but important EMIS and M&E components”. The QAG however also states that “The difficulties encountered…raise the question of the need for more innovative approaches [to capacity building] which do not focus on expensive international TA. One solution proposed and put into effect by the Team was the provision of local TA on the basis of a ‘retainer’, so that MoE staff can seek guidance on a week-to-week basis.” In fact, while capacity limitations at the MoE were exposed through project implementation, the decision not to establish a separate PIU and the learning-by-doing nature of a new type of decentralized program developed capacities that otherwise would not have been developed. The capacity limitations were clear and there are a number of lessons learned. These are explained in greater detail in other sections of the ICR with regard to further supporting public sector capacity. An additional activity under the capacity building component – special programs for disadvantaged groups – expanded the textbook provision in 166 non-formal schools and also pilot tested funding for construction of school facilities through cooperation with Arid Lands Resource Management Project. While building experience in how to engage with non-formal schools and rural arid areas of the country, the component drew funds away from more traditional forms of capacity building. Finally, it should be noted here that the task team did a commendable job in trying to find resources and expertise outside of the project funding to build necessary capacities at the Ministry to improve program implementation. The monitoring and evaluation component is reviewed in more detail in the next section. Overall, QAG gave the supervision of the project a satisfactory rating.
7
2.3 Monitoring and Evaluation (M&E) Design, Implementation and Utilization The Monitoring and Evaluation (M&E) design was adequate. Due to the rapid development of the project, an adequate baseline was never achieved prior to project implementation. Furthermore, the M&E component suffered from similar delays as the EMIS sub-component due to capacity constraints. While the project experienced delays in implementing the key M&E studies and therefore follow-up studies were not possible, the two envisaged main studies were undertaken – the client satisfaction survey and learning achievement survey. These studies provided important data on the impact of the intervention and important lessons for the design of the follow up project. The following is a list of planned studies and status of their implementation.
Table 2. Planned Studies and Status as of end-Project in June 2007
Planned Study Status Client Satisfaction Survey Complete Baseline survey for learning achievement Complete Study on teacher training and development Not undertaken due to capacity
constraints Strengthening testing and assessment Not undertaken through Project
funding. MoE funding to Kenya National Examinations Council (KNEC) to complete the study
Study on advisory services Not undertaken due to capacity constraints
Study on provision of instructional materials in secondary schools
Complete
Revision of procurement manuals Complete a. M&E design. The indicators developed to monitor progress toward the project development objectives were adequate. The methods for collecting the data were built into the project as a separate component therefore resources were identified upfront for the monitoring, evaluation, and auditing exercises. b. M&E implementation. The implementation of this component experienced the same procurement delays as the capacity building component. Two of the key studies were delayed by more than two years. The project however did complete the following evaluations:
• Client Satisfaction Survey • Baseline survey for learning achievement.
The annual external audit executed by Ernst and Young was executed every year. The end-of-project evaluation is in process. Many of the consultancies for the studies to support the evaluation of the project, however, either did not take place due to capacity constraints and the inability of MoE to take into consideration the recommendations of studies that had already been completed, or due to significant delays in the procurement of consultants. These studies included:
• Study on teacher training and development • Strengthening testing and assessment • Study on advisory services • Study on provision of instructional materials in secondary schools • Revision of procurement manuals.
8
c. M&E utilization According to the Ministry of Education, the client satisfaction study was used as a strong indicator of the success of the project and its overall support by the broader public. It also provided important directions on how to improve the project in the next phases. The learning achievement study however was less well used. Overall, the Ministry needs to further develop an evidence based and data driven decision-making culture. Better data collection methodologies, data analysis and utilization need to be developed in conjunction with the further capacity building efforts at the Ministry. Broader and more effective use of ICT may be one area for future development. For instance, a pilot that MoE was considering using is cell phones to collect data in a more frequent and decentralized manner. This approach could be encouraged.
2.4 Safeguard and Fiduciary Compliance
The Bank’s Integrity Department (INT) undertook a Detailed Implementation Review (DIR) of four projects (including the FPESP) in the Kenya portfolio at the request of the Government of Kenya, due to the high level of corruption uncovered by INT in an earlier investigation concerning a specific Bank-financed project that was ultimately suspended, and fraud and corruption documented in a subsequent independent forensic audit by Deloitte & Touche LLP. The purpose of a DIR, as defined by INT, is to set out in detail the level of fraud and corruption in procurement operations, contract management, and project implementation, and to provide recommendations designed to reduce risks to ongoing and future projects. In the case of the education sector, the country and sector teams did not have any indication of fraud or corruption in the FPESP. The real purpose for supporting the DIR, however, was to corroborate that the sector was indeed corruption free, before continuing to prepare the follow on operation, the Kenya Education Sector Support Project (KESSP), and to incorporate DIR recommendations that could usefully strengthen the fiduciary arrangements and controls of the subsequent operation. The findings of the FPESP DIR carried out in 2006 were that the fiduciary safeguards in the education sector were reasonable. The report concluded that specifically FPESP (i) appeared to be “appropriately safeguarded”; (ii) “exhibited adequate safeguards against fraud and corruption”; and (iii) “appeared to better achieve its development objective”.
However, financial management issues emerged near the end of the project. The audit report for the last quarter of 2006 was qualified and the first quarter 2007 financial management report was late. The audit report identified three areas of concern, all of which the MOE has subsequently taken action to address. The areas include: (i) expenditure on undelivered goods of Ksh 574,720; (ii) expenditure of Ksh 2,614,260 to unqualified suppliers –i.e. “briefcase” booksellers; and (iii) outstanding overdue advances of Ksh 259,310 relating to imprest which was closed out at end of June 30, 2006. The FMR report was delayed due to weak financial management capacity in the MoE.
Procurement and disbursement through the project had overall been adequate particularly due to the innovative nature of the focus on decentralized procurement. The provision of teaching and learning materials had always been through centralized procurement and distribution. Under, Free Primary Education, the government decentralized procurement through per capita grants with procurement based at the school level. To facilitate this process, MoE developed a number of policy and instructional documents to support primary schools. The decentralized structure for school level procurement worked very well in getting the necessary funds to schools and in setting up systems and procedures for the oversight of the funds. Continued oversight, refinement of the systems and capacity building will however be needed to ensure that the funds continue to be used for the intended purposes at the school level. Ernst &Young issued an audit report for the
9
year end June 30, 2006 in which they highlight a number of areas which need further improvement. The main aspects cited for improvement in the report include the following:
• Some schools did not convene SIMSC meetings to discuss the funds allocated to them and the identification of the supplier. In 2006, 54% of the schools visited had fully complied with the constitution of their SIMSC, down from 90% in 2005, and compared to 28% in 2004.
• Most schools did not complete supplier pre-qualification forms. • Some schools did not seek new quotations from instructional materials suppliers but
stayed with the supplier from the prior year. • Some schools did not receive the offer letters from the suppliers indicating the discounts
offered. • Some schools did not have written agreements with the suppliers. • Of 280 schools visited only 20% of the total schools visited had fully complied with all
procurement procedures; 31% had partly complied and 48% had not complied at all. • 32% of the schools visited had fully complied with the required procedures for payment
to suppliers compared to 41% in 2005. • In 2006, 54% of the schools visited were charged extra fees by commercial banks
contrary to the MOU with the MoE.
On the positive side:
• The audit revealed an 85% adherence to the specified use of funds, up from 58% in 2004. • Most of the schools had received funds for the instructional materials, however some
experienced delays due to incorrect bank accounts. • In 2006, 69% of the schools visited had received funds in line with their enrolment;
while 20% received an under allocation and 11% received more than their enrollment. • 96% of the schools visited had complied with the requirements for bank signatories. • In 2004, 72% of the schools experienced delays in procurement. This figure increased to
74% in 2005, but declined significantly to 29% in 2006 due to increased oversight.
On Financial controls, the Ernst & Young audit identified the following issues:
• The MoE does not have an effective financial management system to assist in collating and summarizing key financial data and reports obtained from the primary schools.
• The MoE does not have an effective system of monitoring the utilization of project funds by the schools.
• Weaknesses have been noted at most schools with regard to updating cash books and bank reconciliations.
• Most schools did not submit financial returns to DEOs.
Procurement at the Ministry level (mostly for services) has encountered many more delays than the decentralized procurement. The project revealed that there is little or no capacity at the Ministry for procurement and by default the project coordinator has taken on the procurement responsibilities. This reflects a certain deficiency in the institutionalization of the project in the broader MoE.
2.5 Post-completion Operation/Next Phase
10
As with the monitoring and evaluation component, the post-completion operation was built into the project design from inception. The capacity building component of the project included detailed design work for the planned follow-up project to strengthen the primary and secondary education sectors. As a result of this focus on the next phases, the project supported the development of the Kenya Education Sector Support Project (KESSP) which became effective in March 2007. KESSP will carry on many of the positive reforms and outcomes that the FPE project generated thus ensuring sustainability of the progress made under the project. A first focus of the next phase will be on governance and accountability. The principles of social accountability, maximum transparency and dissemination of information, independent monitoring and the wide involvement of stakeholders in program design and supervision is being carried on through to the KESSP project. Specifically, governance actions as identified in the DIR which include an additional review of disbursements to schools to review issues identified in section 2.4 above; the need to retain an independent internationally recognized agent to monitor the procurement process; establishment of an integrated financial management and procurement database; simplification of MOE accounting tools and procedures at the school level; and tailoring appropriate types and frequency of training sessions on Bank procurement to MOE. Furthermore, many of the lessons from the FPE program will be disseminated to the other levels of the education system. For instance, at the secondary level, measures will include improved guidelines for the management of resources; capacity building in financial management and procurement; public expenditure tracking; posting of national examination results on a public website; revising the code of ethics for teachers and provision of enforcement mechanisms; and extending social accountability and the use of a risk based internal audit. Moreover, all the components of the project have been carried over to the KESSP project. First, the provision of instructional materials to primary schools is continuing under KESSP with US$475 million provisionally allocated by government for this activity. KESSP builds on the FPESP experience to extend the decentralized procurement to grants for infrastructure, and the provision of grants to ECD committees. Next, the capacity building component continues. The in-service teacher training program is estimated to receive US$37 million allocated by government to maintain and update the existing set of courses and develop new programs. Additional capacity building will be provided for deepening the school management and accountability skills as well as capacity building for teachers. The education management information system will continue to be supported with a focus on further harmonization of data. Finally, the monitoring, evaluation and auditing support is being carried through to the new project to support development of a KESSP baseline, process monitoring systems, and an impact evaluation program.
3. Assessment of Outcomes
3.1 Relevance of Objectives, Design and Implementation The project was and is highly relevant to the past and current development priorities of the Kenyan government. The focus on the decentralization of management to the school level is directly in line with the Government’s own decentralization efforts. Also, the project gave a tremendous boost to Government’s efforts to implement Free Primary Education (FPE). The
11
financing from the Bank allowed the Government to distribute textbooks to all students across the country thereby relieving parents of the burden (pre-FPESP out-of-pocket expenses for learning materials was approximately Kshs.1,695 or US$26 per pupil) and allowing for more children to enroll in primary education who otherwise could not afford schooling costs (after the introduction of FPESP, the estimated out-of-pocket expenses for learning materials was Kshs.185 or US$3, with the remaining Kshs.650 being subsidized by Government). Annex 3 provides the detailed unit cost calculations. The project also responded directly to the CAS goal of improving opportunities and access to basic social services for the poor. By relieving parents of the burden to pay for instructional materials, the project provided the catalyst for an increase of over 1.5 million new students to enroll in Kenyan primary schools. Moreover, the evaluation data shows that the impact with regard to reduced repetition rates was greater on poorer schools in the country.
3.2 Achievement of Project Development Objectives ICR Rating: Satisfactory The main project development objective was to improve pupil performance and retention through ensuring an adequate supply and better use of instructional materials. Based on the findings of the ICR mission and the results of MoE impact evaluation studies, the development objective has been satisfactorily achieved. The rating is supported by the outcome/impact indicators for the development objective. While the positive outcomes are most likely a result of a confluence of factors including a strong foundation established as a result of a successful pilot, MoE leadership, strong community engagement, good donor collaboration, etc., it is very likely that a large portion of the impact could be attributed to the project – both directly and indirectly (as the project supported key inputs for improved learning achievement such as textbook provision, related teacher training, social accountability and management to name a few). In sum, as a result of the provision of learning materials to at least 80% of the standard 1-8 schoolchildren, the project realized the following major outcomes: Outcome Indicator 1: an increase by June 2006 in the proportion of children reaching desired standards of achievement (in English, Kiswahili, Mathematics and Science, in standards 2, 4 and 6), disaggregated by province, gender, urban/rural and intra-rural.
Evidence to date: According to the report “An Impact Evaluation of the Instructional Materials and In-service Teacher Training Programmes”, results show that 98% of head teachers and 99% of teachers felt that the instructional materials had contributed to improved teaching and learning in their schools. Moreover, the survey on “Learning Achievement” shows the following mean scores for the following standards:
• Standard 2: 60.49 (Boys – 59.36; Girls – 61.78) • Standard 4: 48.81 (Boys – 48.73; Girls – 48.9) • Standard 6: 48.51 (Boys – 48.62; Girls – 48.4)
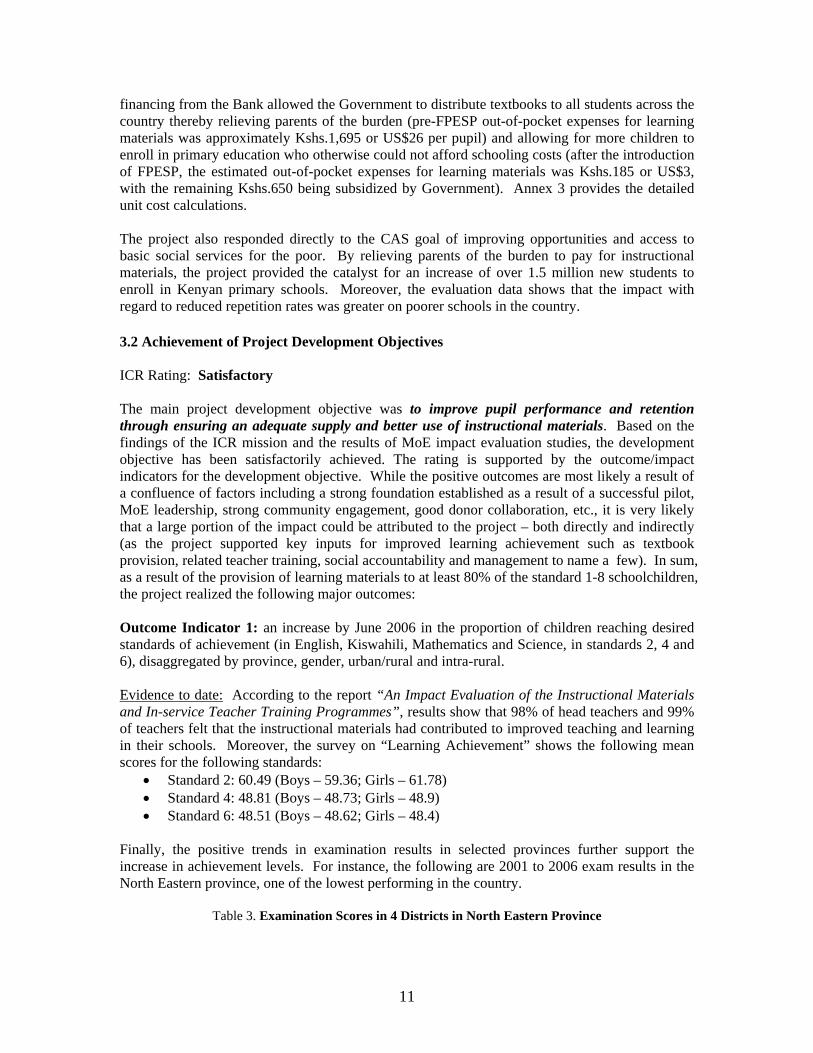
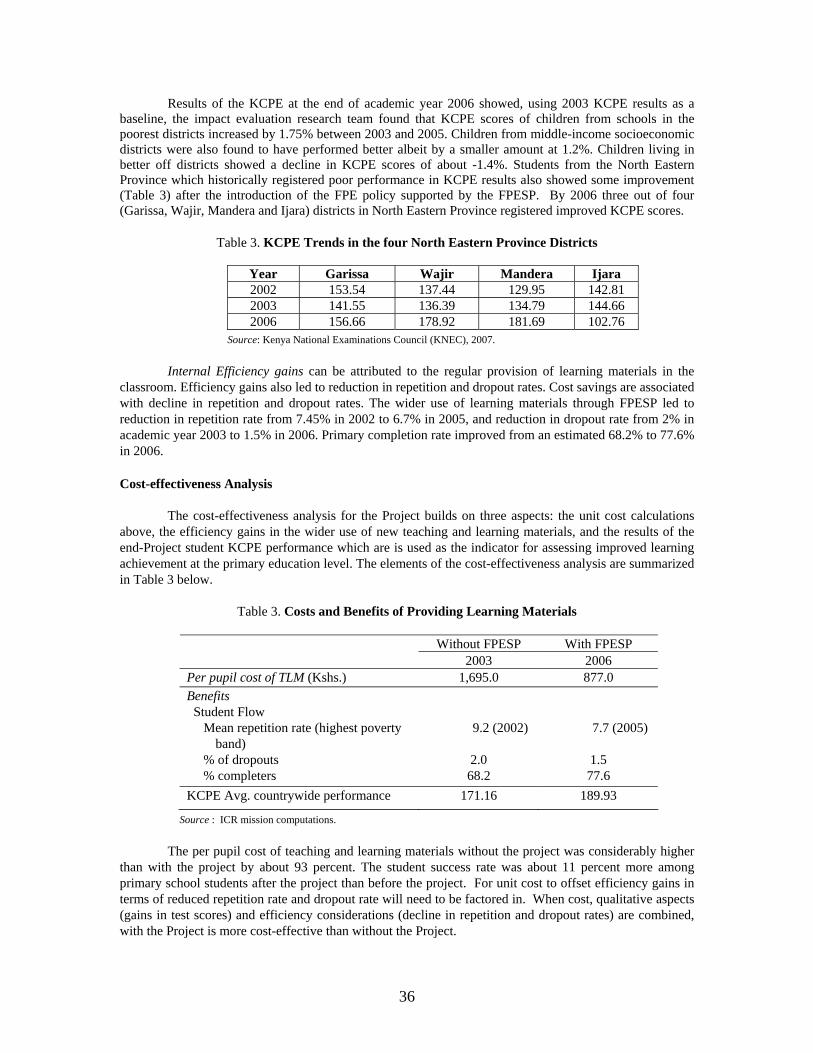
Finally, the positive trends in examination results in selected provinces further support the increase in achievement levels. For instance, the following are 2001 to 2006 exam results in the North Eastern province, one of the lowest performing in the country.
Table 3. Examination Scores in 4 Districts in North Eastern Province
As illustrated, since project effectiveness in 2003, three of the four districts realized substantial increases of between 10 to 35 percent in their examination results. Outcome Indicator 2: As a result of the provision of the instructional materials, every school has put in place a school instructional materials management committee with signatory authority over local bank accounts and the expected outcome of the project would be an increase in the proportion of local school management committees and parents and children rating their school as satisfactory or above for the learning process by June 2006.
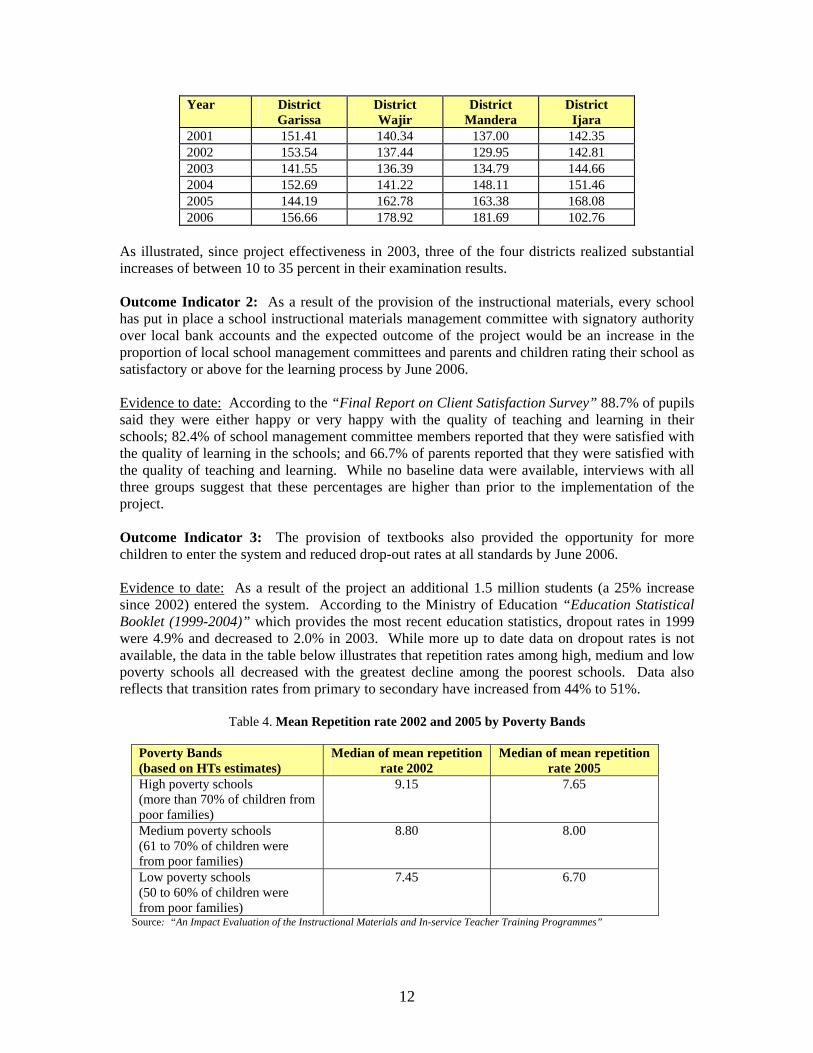
Evidence to date: According to the “Final Report on Client Satisfaction Survey” 88.7% of pupils said they were either happy or very happy with the quality of teaching and learning in their schools; 82.4% of school management committee members reported that they were satisfied with the quality of learning in the schools; and 66.7% of parents reported that they were satisfied with the quality of teaching and learning. While no baseline data were available, interviews with all three groups suggest that these percentages are higher than prior to the implementation of the project. Outcome Indicator 3: The provision of textbooks also provided the opportunity for more children to enter the system and reduced drop-out rates at all standards by June 2006. Evidence to date: As a result of the project an additional 1.5 million students (a 25% increase since 2002) entered the system. According to the Ministry of Education “Education Statistical Booklet (1999-2004)” which provides the most recent education statistics, dropout rates in 1999 were 4.9% and decreased to 2.0% in 2003. While more up to date data on dropout rates is not available, the data in the table below illustrates that repetition rates among high, medium and low poverty schools all decreased with the greatest decline among the poorest schools. Data also reflects that transition rates from primary to secondary have increased from 44% to 51%.
Table 4. Mean Repetition rate 2002 and 2005 by Poverty Bands
Poverty Bands (based on HTs estimates)
Median of mean repetition rate 2002
Median of mean repetition rate 2005
High poverty schools (more than 70% of children from poor families)
9.15 7.65
Medium poverty schools (61 to 70% of children were from poor families)
8.80 8.00
Low poverty schools (50 to 60% of children were from poor families)
7.45 6.70
Source: “An Impact Evaluation of the Instructional Materials and In-service Teacher Training Programmes”
13
Outcome Indicator 4: The provision of the textbook and capacity building components were to result in the completion of a plan for a follow-up project to strengthen the education sector, using studies and training provided, approved by the Permanent Secretary MOEST, and addressing the concerns of key stakeholders. Evidence to date: The Kenya Education Support Project (KESSP) has been designed based on lessons learned from the Free Primary Education Support Project. Additional evidence for the project’s impact is detailed in the outputs and outcomes of each of the specific components of the project found in Annex 2.
3.3 Efficiency For analytical purposes, Project efficiency is defined as improvements in service delivery. This was accomplished through quicker transfer of resources from MoE to decision-making nodes, in this case, primary schools. The analysis includes a cost-effectiveness assessment which brings together the costs and benefits of the Project, analyzes the “before” and “after” Project, and provides information on whether the Project intervention was cost-effective or otherwise.
First, disbursement efficiency improved as a result of the project. FPESP embodies the decentralization principles of financial control and accountability to public primary schools. At the outset, the Project Appraisal Document (PAD) specified that unit disbursements per school-child varied from one disbursement to another. During the course of project implementation, a PETS was undertaken. The objective was to check in detail progress on disbursements. Results showed that overall the funds had flowed efficiently and that the funds were utilized for intended purposes. Moreover, the exercise showed that initially it was not possible for schools to receive funds within the targeted period of four weeks. However, through the Electronic Funds Transfer, funds reached primary schools within the target period. The DIR review findings further support efficient disbursement of funds through the project. The report reveals that “(the) Free Primary Education Support Project (FPESP) achieved a satisfactory level of accountability from local communities to the national ministry which contributed to the proper use of funds under FPESP. The key elements were the transparent provision of comprehensive information, the use of efficient systems for flow of funds and strong local accountability mechanisms... Timely and agreed amounts of disbursements to schools based on required MOE documents that were confirmed during final project supervision in October 2006. Targets of 97% of schools receiving funds in the bank accounts without problems.” As 80% of the project focused on provision of learning materials the analysis is limited to this project component. On the cost side, assuming that the GoK continues to supply textbooks and learning materials (TLM) to all primary school children through the FPE subsidy, books with the project were less expensive than textbooks without FPESP. This is due to the strategy adopted under FPESP to reduce the range of books developed and the related prices. The per pupil cost of teaching and learning materials without the project was considerably higher than with the project by about 93 percent. This is partly due to the introduction of the FPE subsidy and partly due to the lowering of the per pupil cost of primary education. The introduction of FPE and the tuition subsidy enabled children to have the minimum required since parental contribution was dramatically reduced by almost 88%.
14
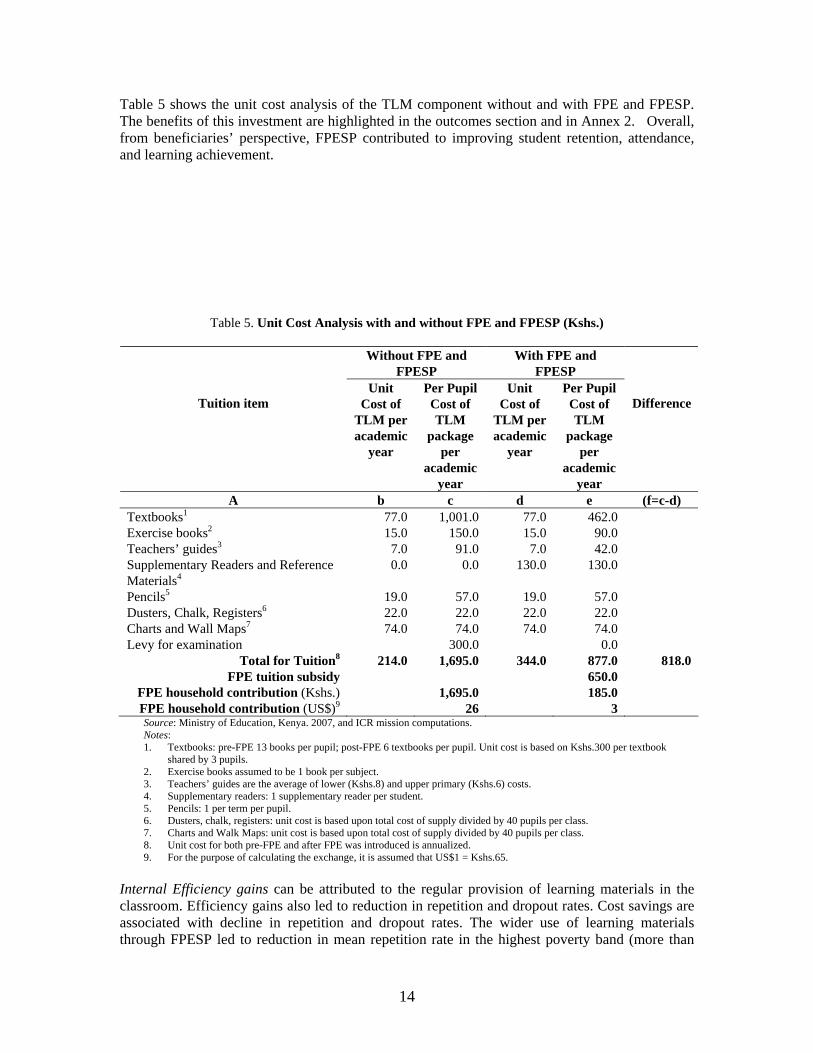
Table 5 shows the unit cost analysis of the TLM component without and with FPE and FPESP. The benefits of this investment are highlighted in the outcomes section and in Annex 2. Overall, from beneficiaries’ perspective, FPESP contributed to improving student retention, attendance, and learning achievement.
Table 5. Unit Cost Analysis with and without FPE and FPESP (Kshs.)
Without FPE and FPESP
With FPE and FPESP
Tuition item
Unit Cost of
TLM per academic
year
Per Pupil Cost of TLM
package per
academic year
Unit Cost of
TLM per academic
year
Per Pupil Cost of TLM
package per
academic year
Difference
A b c d e (f=c-d) Textbooks1 77.0 1,001.0 77.0 462.0 Exercise books2 15.0 150.0 15.0 90.0 Teachers’ guides3 7.0 91.0 7.0 42.0 Supplementary Readers and Reference Materials4
0.0 0.0 130.0 130.0
Pencils5 19.0 57.0 19.0 57.0 Dusters, Chalk, Registers6 22.0 22.0 22.0 22.0 Charts and Wall Maps7 74.0 74.0 74.0 74.0 Levy for examination 300.0 0.0
Total for Tuition8 214.0 1,695.0 344.0 877.0 818.0 FPE tuition subsidy 650.0
FPE household contribution (Kshs.) 1,695.0 185.0 FPE household contribution (US$)9 26 3 Source: Ministry of Education, Kenya. 2007, and ICR mission computations. Notes: 1. Textbooks: pre-FPE 13 books per pupil; post-FPE 6 textbooks per pupil. Unit cost is based on Kshs.300 per textbook
shared by 3 pupils. 2. Exercise books assumed to be 1 book per subject. 3. Teachers’ guides are the average of lower (Kshs.8) and upper primary (Kshs.6) costs. 4. Supplementary readers: 1 supplementary reader per student. 5. Pencils: 1 per term per pupil. 6. Dusters, chalk, registers: unit cost is based upon total cost of supply divided by 40 pupils per class. 7. Charts and Walk Maps: unit cost is based upon total cost of supply divided by 40 pupils per class. 8. Unit cost for both pre-FPE and after FPE was introduced is annualized. 9. For the purpose of calculating the exchange, it is assumed that US$1 = Kshs.65.
Internal Efficiency gains can be attributed to the regular provision of learning materials in the classroom. Efficiency gains also led to reduction in repetition and dropout rates. Cost savings are associated with decline in repetition and dropout rates. The wider use of learning materials through FPESP led to reduction in mean repetition rate in the highest poverty band (more than
15
70% of children from poor families) from 9.2% in academic year 2002 to 7.7% in 2005, and reduction in dropout rate from 2% in 2003 to 1.5% in 2006. Primary completion rate improved from an estimated 68.2% to 77.6% in 2006. As illustrated below, the student success rate was about 11 percent more among primary school students after the project than before the project. For unit cost to offset efficiency gains in terms of reduced repetition rate and dropout rate were taken into consideration. This is shown in Table 6. When cost, qualitative aspects (gains in test scores) and efficiency considerations (decline in repetition and dropout rates) are combined, with the Project is more cost-effective than without the Project.
Table 6. Costs and Benefits of Providing Learning Materials
Without FPESP With FPESP 2003 2006
Per pupil cost of TLM (Kshs.) 1,695.0 877.0 Benefits Student Flow
3.4 Justification of Overall Outcome Rating Rating: Satisfactory Based on the high relevance of the project, the substantial achievement of the PDOs and the efficiency gains that the project catalyzed, the rating is clearly merited.
3.5 Overarching Themes, Other Outcomes and Impacts (a) Poverty Impacts, Gender Aspects, and Social Development The poverty impact of the project has been very strong with the most evident aspect of its impact being the enrollment of an additional 1.5 million children who otherwise were not able to afford basic educational materials to attend school. While some literature 1 argues that textbook provision in Kenya benefits only the strongest students while weaker students and students without English language skills are not impacted, the data analyzed for this ICR argues for a strong poverty impact of the project. For the first time since the introduction of user fees in the late 1980s children from poor families, in 2003 they began to have equal access to learning materials in the classroom as well as at home. As a consequence, student retention and attendance
1 Glewwe, P; Kremer, M; Moulin, S. “Many Children Left Behind? Textbooks and Test Scores in Kenya”
16
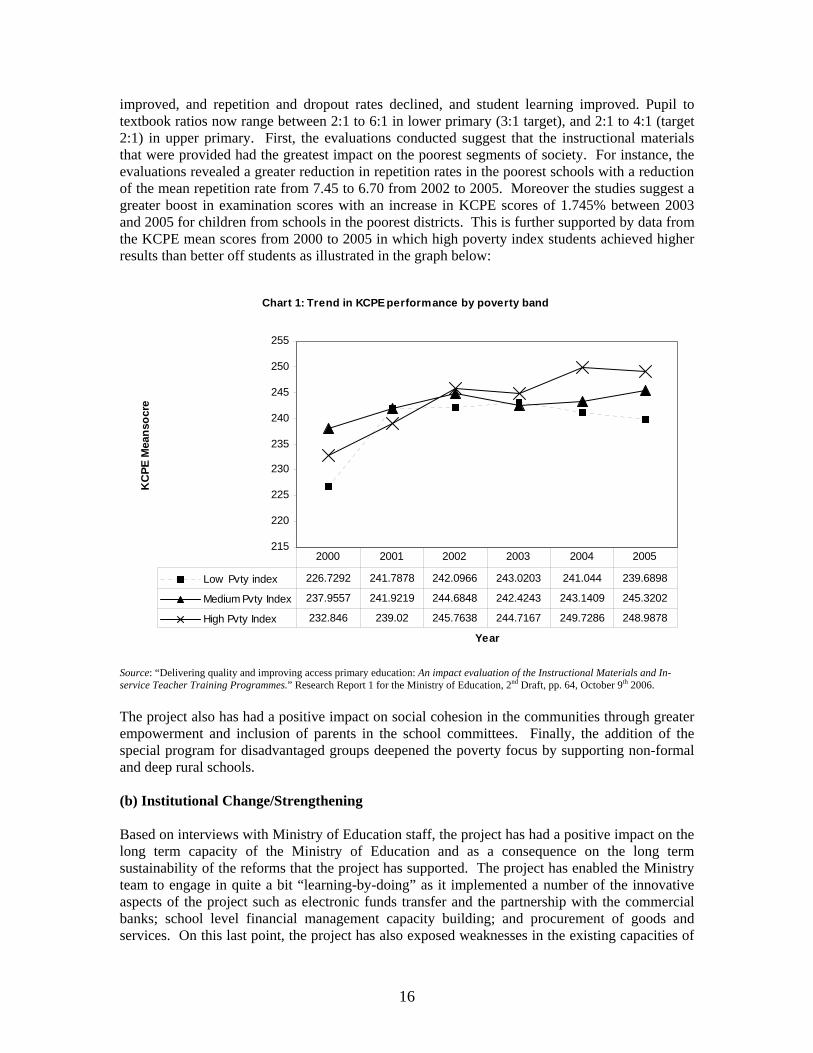
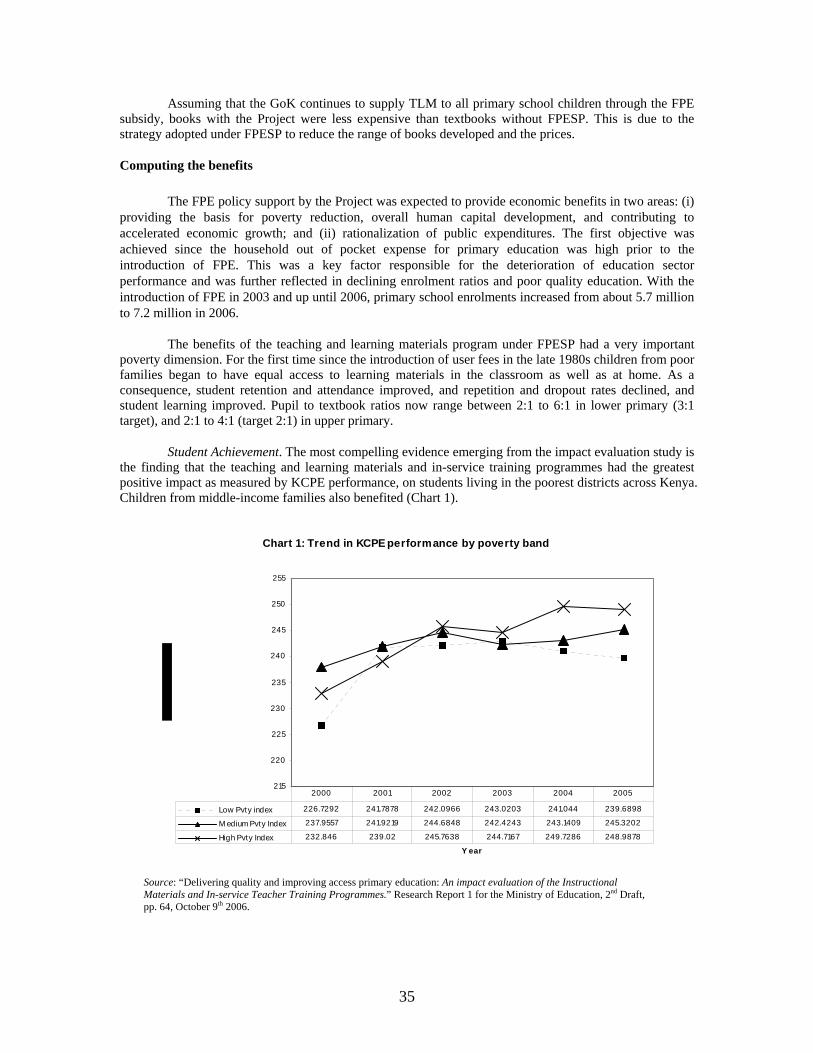
improved, and repetition and dropout rates declined, and student learning improved. Pupil to textbook ratios now range between 2:1 to 6:1 in lower primary (3:1 target), and 2:1 to 4:1 (target 2:1) in upper primary. First, the evaluations conducted suggest that the instructional materials that were provided had the greatest impact on the poorest segments of society. For instance, the evaluations revealed a greater reduction in repetition rates in the poorest schools with a reduction of the mean repetition rate from 7.45 to 6.70 from 2002 to 2005. Moreover the studies suggest a greater boost in examination scores with an increase in KCPE scores of 1.745% between 2003 and 2005 for children from schools in the poorest districts. This is further supported by data from the KCPE mean scores from 2000 to 2005 in which high poverty index students achieved higher results than better off students as illustrated in the graph below:
Chart 1: Trend in KCPE performance by poverty band
215
220
225
230
235
240
245
250
255
Year
KC
PE M
eans
ocre
Low Pvty index 226.7292 241.7878 242.0966 243.0203 241.044 239.6898
Medium Pvty Index 237.9557 241.9219 244.6848 242.4243 243.1409 245.3202
High Pvty Index 232.846 239.02 245.7638 244.7167 249.7286 248.9878
2000 2001 2002 2003 2004 2005
Source: “Delivering quality and improving access primary education: An impact evaluation of the Instructional Materials and In-service Teacher Training Programmes.” Research Report 1 for the Ministry of Education, 2nd Draft, pp. 64, October 9th 2006. The project also has had a positive impact on social cohesion in the communities through greater empowerment and inclusion of parents in the school committees. Finally, the addition of the special program for disadvantaged groups deepened the poverty focus by supporting non-formal and deep rural schools. (b) Institutional Change/Strengthening Based on interviews with Ministry of Education staff, the project has had a positive impact on the long term capacity of the Ministry of Education and as a consequence on the long term sustainability of the reforms that the project has supported. The project has enabled the Ministry team to engage in quite a bit “learning-by-doing” as it implemented a number of the innovative aspects of the project such as electronic funds transfer and the partnership with the commercial banks; school level financial management capacity building; and procurement of goods and services. On this last point, the project has also exposed weaknesses in the existing capacities of
17
the Ministry such as the procurement and financial management capacities which are being addressed in follow up projects. One of the most important outcomes of the ownership and implementation of the project has been a changed attitude reported among Ministry staff who have indicated that they are more accountable and proactive in their work. (c) Other Unintended Outcomes and Impacts (positive or negative) There were a number of unintended outcomes of the project that various educators and Ministry officials reported during the ICR mission. The main issues are as follows:
• Misinterpretation of the branding of “Free” primary education. The concept of free primary education was interpreted in many communities as government paying for all aspects of primary school education. In many cases, this has resulted in a complete abdication of financial responsibilities to the school, leaving schools with an extra burden of clarifying what is free and what still needs to be supported by parents. Also, while allowing over 1.5 million students to come back to school, the program did not reach all eligible students in the system.
• Challenges of older students coming back to school. Some of the schools visited highlighted the additional challenge of managing a school with older students mixed among younger students. For instance, one school visited – St. Catherine’s -- has a 21 year old in class 5.
• Positive private-public partnership with commercial banks. Many of the banks visited during the ICR mission viewed the partnership with the schools as extremely positive and reported a positive externality of the program as an increase in clients among school parents in their communities. They also identified a willingness to support on-going financial literacy and capacity building at the local schools.
3.6 Summary of Findings of Beneficiary Survey and/or Stakeholder Workshops N/A
4. Assessment of Risk to Development Outcome Rating: Moderate At the fiscal and economic level, a number of issues suggest that gains achieved through this project will be sustained. First, the Kenyan government provides a considerable amount of its budget to education with expenditure at around 7 percent of GDP and education spending as a percentage of total government spending at around 25%. Moreover, the Kenyan economy is growing at more than 6% which suggests that the fiscal environment to sustain this support will continue. Moreover, ownership is strong. The government commitment to the policy reforms deepened through the project is evident through the follow up KESSP project which will further support the reforms begun under FPE. Also, local and community ownership has been greatly strengthened through the decentralized procurement processes propagated by the project. The success of the decentralization process is a strong indicator that the system of local procurement and ownership will be maintained in the future.
18
While risks have been greatly mitigated through the design of the FPESP and the development of the new KESSP project, there are still a number of outstanding areas of risks that need further attention in the future to maintain the positive gains achieved through the project. The first risk to maintenance of the development objective is partly a consequence of the success of the project. By supporting the entrance of 1.5 million new children in the system, the quality of education through higher teacher to pupil ratios and lack of classroom space can have an adverse affect on the positive gains in learning achievement through the provision of instructional materials. Thus far one of the lessons learned is that quality has in fact increased. Nevertheless, the risk must be monitored and managed. Also, while initial implementation of the decentralized financial management and procurement has been positive, these gains could slip if not continuously monitored and supported. Recent audits have in fact revealed that some positive financial management practices have already begun to be implemented less strenuously by communities than during inception. Further, capacities in the Ministry of Education could present a challenge to maintaining the positive gains from the project. First, a change in the political leadership in the Ministry of Education could adversely affect the positive esprit de corps that was generated under this project. It can not be foreseen what culture new leadership would bring, but the positive role of leadership in this project was essential for success. Also, a more ambitious agenda under the new project may dilute the successful focus that was achieved under the FPE and stretch limited MOE capacity – particularly with regard to procurement and financial management. Finally, the challenges of HIV/AIDS on teacher population should not be discounted as a potential risk to the positive gains achieved through the project.
5. Assessment of Bank and Borrower Performance
5.1 Bank Performance (a) Bank Performance in Ensuring Quality at Entry Rating: Highly Satisfactory Bank performance at entry can be considered best practice for a number of reasons. First, the Bank team responded extremely rapidly to the new government’s request for support by producing a quality project for the Board to evaluate within 3 months of appraisal. Moreover, the team designed the project to maximize existing experience in the country and build upon successes. For instance, the project deepened the pilot decentralized procurement systems and supported the scaling up of this decentralization. Also, the project design enhanced collaboration with existing donors in the country – particularly DFID – to facilitate continuation of ongoing support to the MOE. Next, the project did not attempt to set up a separate project implementation unit, but rather built upon the existing capacities in the MOE to coordinate the project thus deepening ownership and building on existing knowledge and capacities. Finally, the design of the project contributed to its success. The project stayed focused on a few key objectives and through this limited scope supported key reforms. Also, the design included important capacity building components, monitoring and evaluation and support for a follow up project to sustain the achievements.
19
(b) Quality of Supervision Rating: Satisfactory The Bank task team provided excellent support to the Ministry of Education team during the supervision of the project. The task team leader did an exceptionally good job of fostering teamwork and collaborating across Bank units. For instance, the MOE praised the support of both the financial management and procurement staff assigned to the project. Also, the team brought in key capacity building support from WBI. Further, the task team stayed in constant dialogue with the Ministry to ensure reporting and further support for those areas of weakness in the Ministry such as procurement. Overall, the strong support assisted the Ministry to identify those areas of short term risk and respond to them as well as prepare medium term responses for more entrenched challenges through the design of the follow up KESSP project. While the task team performance could be considered exemplary – even highly satisfactory -- the overall rating of the Bank team’s performance was negatively influenced due to the challenges that the INT team introduced to the Bank-MoE relationship. This resulted in the supervision rating going down to ‘satisfactory.’ As highlighted in lessons learned and borrower feedback, the manner in which INT conducted its review and the negative environment that was created as a result seriously jeopardized the positive relationship and trust that had otherwise been established with the client. (c) Justification of Rating for Overall Bank Performance Rating: Satisfactory Based on the quality of the project at entry, the positive engagement that the task team established with the client during supervision and the achievement of the overall development objectives, the Bank performance warrants a satisfactory rating. The rating takes into account that although Bank performance at entry was highly satisfactory, the subsequent issues surrounding the INT process as explained above brought down Bank performance at supervision to satisfactory.
5.2 Borrower Performance (a) Government Performance Rating: Satisfactory Overall the government’s performance on this project has been excellent. The key ingredient to success seems to be the leadership demonstrated by MOE top management. The leadership manifested itself in the boldness of approach, the focus on the objective and most importantly in a new attitude that was fostered among the Ministry staff. Staff reported having both more responsibility and accountability for decisions. Overall a greater esprit de corps was created in the Ministry and broad ownership of the FPE objectives was shared among the staff. The Ministry should also be recognized for fostering new partnerships in implementing the FPE program. First, the partnership with the commercial banking sector was key in facilitating a rapid and transparent disbursement of funds to the school level. Also, the openness to collaborate across Ministries, while challenging, should be noted. Finally, the focus on decentralization and strengthening community level partnerships proved to be a key element in the success of the project. (b) Implementing Agency or Agencies Performance
20
Rating: Moderately Satisfactory The Ministry team responsible for implementing the project executed well. The project presented unique challenges in that the decentralized procurement would be scaled to all 18,000 schools at the primary level. The innovations integral to this scale and the large number of schools engaged in this new activity required the implementation team to remain vigilant and flexible – quickly identifying challenges and responding. Issues such as Bank accounts being closed, Bank’s not adhering to their MOU with the Ministry, monitoring of the use of funds at school level, etc required the team to quickly identify and resolve problems. The capacity of the team, while strengthened through execution of the program, however, presented a constant challenge to implementation. The main area of weakness was the financial management and procurement capacities within the team. The project coordinator for instance became the de facto procurement specialist due to lack of other qualified personnel which resulted in long delays in procurement of capacity building and M&E components of the project. Moreover, one of the final audit reports was qualified further revealing capacity shortcomings. (c) Justification of Rating for Overall Borrower Performance Rating: Satisfactory Based on both the positive leadership in the Ministry and the effective execution of the project by the implementation team, the borrower performance is rated as satisfactory. The rating is given despite the poor procurement and financial management performance and is justified based on the positive development outcomes and execution of the primary component of the project – instructional materials.
6. Lessons Learned The following are the main lessons learned for this project: 1. Leadership is essential to success. While the Bank task team did an excellent job in project design and supervision, the success of the project could not have been realized without the strong and dedicated leadership of the MoE. The main lesson here is that leadership capacity cannot be underestimated in development and implementation of successful projects. Integrity, dynamism, bold decision making, vision, and taking unpopular political decisions characterize some of the most important elements of leadership in this project. As a result of this leadership, the new policies of decentralization were enforced (ensuring that booksellers followed the rules), new partnership were struck (with the commercial banks), a strong foundation of trust was built with the Bank and a new esprit de corps developed amongst technical staff in the Ministry. While these positive aspects can be cited, leadership capacity could have been improved in areas such as organizational management (establishing proper functions such as procurement to support the project in the Ministry), evidence-based and data driven decision making, and increased capacity building among technical level staff including establishment of clearer policies to provide incentives for skill acquisition. Overall, however leadership provided the key element to the successful implementation of this project. For future, this aspect should be taken into greater consideration in project preparation and risk assessment. 2. Smaller successful pilots can be successfully brought to scale. An important lesson from this project was the Bank’s willingness to identify and review a smaller pilot initiative developed and supported by the Dutch and DFID and to invest essentially in the preparatory work of others. The
21
approach proved to be successful for a number of reasons. First, it allowed the Bank to disburse much more quickly than otherwise possible and largely helped to avoid the long preparation time that often results in Bank operations. Next, it allowed the Bank to leverage a network of existing consultants who knew the project and were able to provide on-going support and evaluation during supervision. Further, it showed good faith in the systems of the MoE and built essential trust by investing in these systems that had strong buy in from the Ministry. For instance, in order to meet this demand, the Bank team worked concertedly to get an exception from Bank procurement to support the use of pre-qualified books in the Ministry’s “orange book”. The overall lesson is that Bank preparation should spend less time in analyzing and “creating” a project and more time in analyzing existing elements of a system or pilots that are working well and can be brought to scale. 3. Decentralized procurement is both efficient and empowering. Another main lesson from the project is that with the right political will and systems in place, resources can be effectively transferred to the school level for decentralized procurement. Moreover, transparency and accountability can be effectively addressed through decentralized procurement. While the greatest risk coming into the project was accountability for funds disbursed to the schools, the systems put in place by the MoE have provided the transparency and accountability necessary to safeguard the funds and support local ownership. Moreover, the decentralized procurement alleviated many of the bottlenecks that capacity constrained Ministries of Education often encounter and which result in slow and ineffective project implementation. 4. Free Primary Education does not necessarily result in drop in quality. One of the key lessons gained from this project is that despite the infusion of an additional 1.5 million learners in the system, the quality of education need not be compromised, and that in fact, the data support an increase in quality particularly for the poorest schools. This experience will be important to communicate and will impact other Bank clients looking at perceived trade offs of free primary education. Other less important lessons learned: 5. Public-Private partnerships support improvements in service delivery efficiency. The project helped the MoE to develop a very successful partnership with the commercial banks to electronically transfer funds to school accounts in local banks near the respective school’s jurisdiction. The electronic transfer provided greater accounting and speed of disbursement than prior methods. Moreover, the banks have established professional relationships with the schools and additional support such as training in financial management have been discussed. The banks took this project on not just as a commercial venture but as part of their corporate social responsibility – this partnership should lay the foundation for further public-private partnerships. 6. Baseline data are critical for overall monitoring and evaluation emphasis. Overall the project lacked appropriate baseline data on primary schools before initiating project implementation. An area highlighted by the Ministry was the assumption that all schools had the same textbook to pupil ratios and the application of a similar formula for all schools resulted in an uneven distribution of resources. The Ministry has highlighted the need to retarget distribution of resources with a clearer baseline of the school’s starting point. Moreover, the EMIS is an unfinished aspect of the project which points to an under prioritization on the part of the MoE on the need to timely and accurate data for education system planning and execution. This issue is receiving attention through the follow-on project, KESSP, and more support is being provided in this area.
22
7. Realistic assessment of institutional capacity during project preparation is essential in order to design appropriate remedial measures. While the project is to be commended for implementing the project through the MoE structures and for not setting up a separate implementation unit, the execution of the project revealed important capacity gaps. The design of the project did not adequately address the issue of Ministry capacity in the capacity building component and therefore much of the support was provided on an ad hoc basis. Improved financial management and procurement capacities need to be built at the Ministry of Education to more effectively monitor and manage future projects. The project stretched existing and limited capacities and resulted in some delays in aspects of project implementation. Moreover, a more strategic and systematic approach to identifying capacity gaps could have been developed prior to implementation. The capacity constraints point to broader issues of MoE organization, incentives, and division of labor. In future, a capacity assessment of the Ministry and clear areas of support during the project need to be identified upfront. 8. INT process for execution of DIR requires critical examination. The only negative feedback that the ICR team received from the client about the Bank was on the nature of the interaction with the INT team. In fact, the DIR review tarnished the positive traction that the task team had established with the client on the first re-engagement in the education sector after some years of hiatus. The methodology of the review and the non-transparent manner in which it was conducted contributed to the client’s negative assessment of the Bank. Moreover, the intervention delayed the follow up sectorwide project, further undermining the Bank task team’s credibility and goodwill. Greater consultation by the INT team with the project task team throughout the DIR process would have improved the process. 9. Vigilant follow-up needs to take place at school level. The MoE should provide ongoing capacity building to teachers and school heads in the principles of accountability and transparency. Further, community engagement must continue to be stressed in order to shore up the positive gains of the project. The Ernst and Young report points to potential backsliding on the decentralized procurement practices which need to be identified and addressed on a continual basis. 10. Effective and concerted integration of lessons learned from prior Bank projects helps to design more relevant interventions. The project effectively integrated a number of lessons learned that have been highlighted in prior Bank projects such as:
• Focus -- the project was focused and did not take a Christmas tree approach and try to address all education challenges at once, but rather focused on instructional materials;
• Do not set up a PIU and diminish capacity at the Ministry -- the project did not set up a separate project implementation unit but rather built on the experience in the Ministry and provided capacity building through learning by doing;
• Support areas that can have a catalytic effect on policy reforms – while the project supported a relatively narrow focus on instructional materials, it fostered a much larger policy reform focused on decentralization.
• Support donor coordination -- finally the project effectively collaborated with other donors to jointly address MoE reforms.
7. Comments on Issues Raised by Borrower/Implementing Agencies/Partners (a) Borrower/implementing agencies
23
The borrower had high praise for the Bank task team that managed the project highlighting both the professionalism and quality of inputs as well as strong and consistent support during implementation. The borrower however had: (i) very strong negative feedback about the INT team which had conducted the DIR. Specifically, the borrower stated that the INT team had exhibited a lack of understanding about the status of Kenyan development projects and had treated the client with a lack of respect; and (ii) that the Ministry felt that Bank procurement policies were burdensome and resulted in many of the delays that the project encountered. (b) Cofinanciers N/A (c) Other partners and stakeholders (e.g. NGOs/private sector/civil society) The commercial Banks that were interviewed were very pleased with participation in the project and viewed it as a positive partnership. The project represented the largest single transfer of resources in a short period and they indicated that it helped them to refine their own internal systems for such a project. The booksellers also conveyed a positive experience through their participation in the project as it expanded their market and helped them to better understand and service the schools in their community. DFID highlighted the close collaboration with the Bank team as an important aspect of the success of the project and the continuity from the DFID SPRED project. In fact the sharing of consultants who had worked on prior aspects of the DFID pilot project contributed to the successful design of this project. Finally, the partners contributed to the on-going assessment of the impact of the textbook provision and provided important feedback to the task team through these studies. In the context of studying the impact of its Strengthening Primary Education (SPRED) Project, the UK Department for International Development (DFID) commissioned external evaluation undertaken by PriceWaterHouseCoopers also included the FPESP. The conclusions drawn were that “(FPESP) The textbook project has certainly reduced the cost of education to parents, improved the relationship between teachers, parents and pupils and infused a culturally sensitive and responsive school management environment with respect to textbook procurement, storage, conservation and use. However, it appears equally certain that unless funding levels are enhanced and sustained, impact on family expenditure will remain minimal and the gains already made could be transient.”
24
Annex 1. Project Costs and Financing
(a) Project Cost by Component (in USD Million equivalent)
Components Appraisal Estimate (USD millions)
Actual/Latest Estimate (USD
millions)
Percentage of Appraisal
INSTRUCTIONAL MATERIALS 41.80 46.50 111
CAPACITY BUILDING 7.16 7.50 105 MONITORING AND EVALUATION 1.04 1.00 96
Total Baseline Cost 50.00 55.00 110
Physical Contingencies 0.00
0.00
0.00
Price Contingencies 0.00
0.00
0.00
Total Project Costs 50.00 55.00 110 Project Preparation Fund 0.00 0.00 0.00 Front-end fee IBRD 0.00 0.00 0.00
Total Financing Required 50.00 55.00 110
(b) Financing
Source of Funds Type of Cofinancing
Appraisal Estimate
(USD millions)
Actual/Latest Estimate
(USD millions)
Percentage of Appraisal
Borrower 4.98 0.00 0.00 IDA GRANT FOR POOREST COUNTRY 50.00 55.00 110.00
Note: External support from the World Bank and other Development Partners was to complement the substantial contribution from GoK for the Free Primary Education Program.
25
Annex 2. Outputs by Component Component Output Output Indicator Evidence as of ICR Component 1: Instructional Materials
Improved provision and utilization of instructional materials by school children and teachers
At least 80 percent of schoolchildren in standards 1-8 have access to the instructional materials for all core subjects at the agreed sharing rate.
Sharing rates improved in 90% of schools in the country with an average pupil to textbook ratio of 3:1.
Component 2: Capacity Building
Sub-component 1: Effective teaching and learning in schools
Output 1: 72,000 key resource teachers (KRTs) in English, Mathematics, Kiswahili and Science complete new distance learning modules in FPE challenges and use of textbooks. Output 2: 17,500 head teachers trained in quality assurance and supervision.
Training is ongoing with 69,000 teachers trained in SbTD. As of the ICR mission around 22,000 teachers or 61% of the target teachers had received their certificate for completion of the 9 month course. The project also supported the training of 18,000 head teachers in school management. At the time of the ICR mission, the training was still ongoing for the head teachers.
Component 2: Capacity Building
Sub-component 2: Improved accounting system implemented in primary schools
80 percent of school management committees are confident that school finances are being managed effectively. 80 percent of schools producing accurate and timely year-end financial statements. 2,000 replacement head teachers trained in financial management.
Over 83% of school management committees meet to discuss their budgets and minutes are recorded. According to survey 74% of cash books were in good shape. 97% of headteachers and 98% of teachers felt school management had improved.
Component 2: Capacity Building
Sub-component 3: Education management information system implemented at district and HQ levels.
Relevant information for planning and management is provided to decision makers on a regular basis.
Needs assessment and design completed. Procurement of goods underway.
Component 2: Capacity Building
Sub-component 4: Preparation for STEPS completed
Detailed design work has been finished for the planned follow-up
KESSP project designed.
26
project to strengthen the primary and secondary education sectors.
Component 3: Monitoring and Evaluation
Monitoring, evaluation and external audits
Baseline survey on student learning End of project evaluation Bi annual external audits
Baseline Survey on Learning Achievement complete. Client satisfaction survey complete. External audit complete. End of project evaluation underway.
To support the above overall development objective, the project financed three main components: instructional materials, capacity building and monitoring and evaluation. The following are the outputs and outcomes by component. Component 1: Instructional materials: At the beginning of the project in July 2003, public primary schools had approximately 9 million textbooks. The textbook to pupil ratios were variable but very low. As reflected in the report “An Impact Evaluation of the Instructional Materials and In-Service Teacher Training Programmes”: "The baseline survey carried out to facilitate the GOK/NG textbook project in selected target districts revealed the pathetic status of the book stock situations in those districts. For instance, the pupil-textbook ratio for lower primary ranged from 5:1 to 10:1 while in upper primary the ratio varied from 5:1 to 2:1” Moreover, the cost of textbooks was born by the parents themselves. This financial burden caused many pupils to stay away from school because their parents could not afford the costs. The free provision of textbooks alleviated this burden allowing children to enter the system. By 2006, the reported textbook ratio was down to around 3:1 for both upper and lower primary as illustrated in the following table from the study,
Lower Primary (books per student)
Upper Primary (books per student)
National target 3 2 Reported: Headteachers 3.05 2.37 Reported: KRTs 3.09 2.38 Actual: Audit by field researchers2 3.24 3.13
Source: “An impact evaluation of the Instructional Materials and In-Service Teacher Training Programme” The provision of the instructional material has had a profound impact on the Kenyan education system. The following are the main areas of impact:
1. Access to and quality of instructional materials; 2. Use of instructional materials in schools and impact in teaching and learning; 3. Participation and ownership at the community level; 4. Enhanced partnerships with the private sector;
2 The textbook ratios listed area based on an audit of 522 classes in lower primary and 809 classes in upper primary.
27
5. Improved school management and transparency. 1. Access to and quality of instructional materials: The instructional material component of the project has had a profound impact on the access to and quality of instructional materials in Kenyan primary schools. The following are a few of the key achievements:
• Increase in textbook to pupil ratio: The ratio in 2001 ranged from 5:1 to 10:1 in lower primary and 5:1 to 2:1 in upper primary. After introduction of the instructional materials program, both upper and lower primary ratios were approximately 3:1 on average.
• Increase in access of textbooks at home: 93% of pupils indicated that they were allowed to take textbooks home, and the majority of the pupils reported that they enjoyed this opportunity.
• Increase in quality of textbooks: The project deepened the textbook liberalization program providing increased competition among publishers and book sellers. As a result, according to Ministry officials, KIE officials and schools, the quality of instructional materials has greatly improved.
2. Use of instructional materials in schools and impact on teaching and learning: Beyond access and quality, the project has produced a significant increase in use of instructional materials in primary schools and a subsequent positive impact on teaching and learning. The following are the key achievements to support this finding:
• Overall improved teaching and learning: results show that 98% of head teachers and 99% of teachers felt that the instructional materials had contributed to improved teaching and learning.
• Greater use of textbooks: 84% of teachers observed made use of textbooks in their lessons. • Increased reading in the classroom: In 1999 only 3% of classroom time involved reading
compared with 46% in 2006. • Enhanced classroom use and group work: In live observations undertaken in 159 classes, 84%
of teachers made use of textbooks in their lessons, while group-based reading activities were observed in 46% of lessons.
• Pupils are able to read more on their own: Due to ability to take books home, more students are now able to engage in independent study including reading on their own.
• Less use of rote blackboard instruction. More teachers are engaged in reading in class and facilitation of group work providing a student-centred classroom pedagogy and less rote learning. Also, group-based reading activities were observed in 46% of the lessons
• Increased amount of homework: Before the instructional materials program only 54% of teachers gave homework to their students which involved using their textbooks at home. Since the national launch of the program there has been a dramatic shift in this practice – 98% of teachers reported that they now give homework assignments to students in upper primary which involves using of textbooks at home. Regarding lower primary 69% of teachers give homework assignments to students which involves using the textbooks at home.
• Positive learning impact of homework: The results show that the use of textbooks in doing homework at home had a positive and significant impact on KCPE performance. This indicates that textbooks have greater impact on learning and KCPE performance when pupils are allowed to take them home for homework assignments.
• Increased girls participation: 83% of HTs and 80% of teachers felt that the provision of instructional materials had contributed to increased girls enrolment.
3. Participation and ownership at the community level: Another important achievement of this component has been the impetus on the government’s policy of greater community participation in education. The following are the key outcomes to support this objective:
• More accountability and transparency: 93% of HTs and 85% of teachers felt that parents are demanding more accountability and transparency today as to how funds are used at the school compared with before FPE.
28
• More teacher ownership in educational content: Teachers are deciding what books to buy and SIMSC members are making the final decisions.
• Greater parental involvement in schools: 95% of HTs and 93% of teachers surveyed stated that meetings had been held with parents to inform them about the instructional materials program. The average number of meetings held with parents in 2005 was 2.4.
4. Enhanced partnerships with the private sector: The project has also effectively leveraged the private sector in support of education. The following are the results to support this objective:
• Greater competition among publishers and increased quality of books: The project accelerated the liberalization of the publishing industry resulting in more private sector publishers entering the market and a concurrent increase in the quality of materials.
• Greater efficiency of disbursement through partnership with the banking sector: There is clear evidence that this partnership is working well with 100% of schools surveyed having an operational bank account. Moreover, there is evidence of banks fulfilling their obligations under this programme, with the finding that 47% of surveyed schools received a bank statement each month, while 27% received it quarterly. A further 15% received a statement annually, and 7% twice yearly.
• Greater choice and better quality among book sellers: Head teachers have been very pleased with the open choice of bookseller and highlight competition among suppliers -- 39% of HTs had used two suppliers, 33% one and 23% three. There is however a tendency to stay with one supplier once chosen which questions the openness of the process once a supplier is entrenched. Across the sampled schools the average delivery time was 15 days, however, some schools had to wait between 60 and 90 days. Further, evidence of competency among local IM suppliers can be seen in the finding that 91% of HTs surveyed stated that their last two orders had been supplied correctly. There is also evidence that local suppliers are responsive to schools – 82% of HTs stated that local supplies had all the IMs they needed.
5. Improved School management and transparency: An additional outcome of the project has been an increase in the management of the schools. The following are the results to support this outcome:
• Improved management of the school: 97% of HTs and 98% of teachers felt that the IMP had improved management at the school.
• Greater participation in management decisions: School management committees have been established in all schools with 12 individuals representing teachers and parents appointed. Meetings were held on demand, and attendance was 88%.
• Greater accountability: Head teachers were tasked with ultimate accountability for finances. According to the survey, 74 % of the cash books were in good shape.
• Greater transparency: The Head teachers have taken on the responsibility of publicly displaying their financial information as well as their results. In fact, 77% of HTs surveyed displayed the status of School IM funds in a public place.
Greater parent involvement: 100% of HTs and 91% of teachers surveyed agreed that the instructional materials had contributed to greater awareness among parents about how the school is using government funds sent to the school bank account. Component 2: Capacity Building The capacity building component of the project addressed the following areas:
i) Effective teaching and learning in schools ii) Improved accounting system implemented in primary schools iii) Education management information system implemented at district and HQ levels iv) Preparation for STEPS completed
This component also addressed the provision of infrastructure under the partnership with the Arid Lands project in the Presidency and Non-formal education in slum areas.
29
The following are the outputs and outcomes that have emerged from each of these sub-components: Sub-component 1: Effective Teaching and Learning in schools. The project built upon a successful DFID supported project called SPRED which provided self-paced video and audio distance in-service training to subject matter teachers. The main focus of the training was to develop reflective teachers; shift the pedagogy from teacher-centered to student-centered; and develop master teachers in the schools to train others. The FPESP project expanded the use of this methodology to extend teacher professional development in the areas of guidance and counselling and Kiswahili. The project aimed to train one teacher in each school in both areas or 36,000 teachers. As of the ICR mission around 22,000 teachers or 61% of the target teachers had received their certificate for completion of the 9 month course. The project also supported the training of 18,000 head teachers in school management. At the time of the ICR mission, the training was still ongoing for the head teachers. The following are areas where this component has achieved a positive development impact: 1. Use of the instructional materials: Evidence indicates that the training has positively influenced the use of textbooks in the classroom and new pedagogical practices. In the 2005 INSET study, 62% of Standard 6 teachers made use of textbooks in their teaching and 34% used paired or group work in their lessons. However, the most significant differences in classroom practices were demonstrated by the KRTs who had received training under the INSET programme: 64% used paired or group work in their lessons and 89% made use of textbooks in their teaching. Also overall, maintenance of the books has been good with schools reporting a 3 to 4 year life-span. 2. New classroom configurations to support new pedagogies: In the 1999, most classrooms (97%) were organized using a traditional classroom layout with desks in rows. Use of this rigid learning environment is starting to change; in 48% of the observed lessons the teacher changed the classroom layout in order for different kinds of learning tasks and different kinds of learning discussions to take place. 3. Positive impact on KCPE performance: Empirical results show that the number of KRTs in a school as a proportion of total teachers has a positive and significant effect on student performance (as measured by KCPE) and enrolment. Sub-component 2: Improved accounting system implemented in primary schools. For this component, around 17,200 head teachers have received training in financial management. Evidence of the success of the training regarding the management of SIMBA accounts can be seen in the high level of knowledge (73%) of the minimum balance required to keep an account open (KShs. 1000). One of the challenges however for this component has been finding appropriate venues in the country for large scale training. Sub-component 3: Education management information system implemented at district and HQ levels. This component has not yet been fully implemented. Three phases were outlined for this sub-component: development of a needs assessment, design of the system and procurement of goods for the system. The assessment and design have been done, a consultant report has been finished and a workshop implemented. The MOE is now in the process of procuring the goods for the system. Sub-component 4: Preparation for STEPS completed. The STEPS project was replaced with the Kenya Education Sector Support Program (KESSP) which has been fully developed with a PAD approved. Sub-component 5: Special Program for Disadvantaged Groups. Two areas were covered under this sub-component – grants to arid and semi-arid lands for school construction and grants to non-formal schools. This sub-component was added after an amendment to the grant agreement and development of an MOU with the Office of the President. Through collaboration with the Arid Lands Resource Management Project, 15 districts benefited from construction of new classrooms. The one classroom that the ICR mission visited was extremely well constructed but after a year began to show cracks due to a poor foundation. The school learned from the experience and implemented supporting beams for the next classroom that was constructed with parent donations.
30
The Ministry of Education estimates that there are approximately 300,000 children attending non-formal education schools of which 80% are in Nairobi slums. Funds of Ksh29.6 million were distributed to 110 non-formal schools in urban slums for the purchase of instructional materials. Cooperation across ministries was highlighted as a challenge in this component, but the fact that MOE identified another group with more experience in local school construction improved the implementation of the sub-component. A number of other capacity building events have taken place as a result of the project. Below is a list of other events in which Kenyan education authorities have participated:
• Education tour to Malaysia by Senior Ministry officials • WBI Education Reform course in Washington in 2004 in which 5 officers attended • WBI Education Reform course in Washington in 2006 in which 5 officers attended • NFE Adult Education Conference in Botswana • PETS course in Cambodia • Multigrade teaching course in Kampala • WBI Education Reform Core Course in Mombasa • Financial Management Course in Malawi • Procurement Course in Mombassa • Governance, Accountability and Resource Leakage in Education course in Naivasha – May 2006 • WBI Decentralization course for 76 DEOs, MEOs, and 8 PDEs in June 2006 • WBI contextualized reform course for MOE IP managers – November 2005
Component 3: Monitoring and Evaluation. This component has three sub-components:
Two studies under this component – the Baseline Survey on Learning Achievement and Client Satisfaction Survey have been completed and have addressed the issues of baseline data and impact of the project to date. In addition an expenditure tracking survey was completed as well as an annual external audit of the project conducted by Ernst and Young. Areas of improvement: The following suggested areas of improvement have been identified for each of the components: Component 1: Instructional Materials
• Better upstream feedback mechanisms should be put in place to understand the demands at the school level. For instance, a number of schools highlighted that they would like to purchase books not listed in the orange book and have not way to provide this feedback.
• Storage facilities could be improved – only 50% of schools have good storage facilities. • While survey data reveals that schools are assigning homework, the impact of this homework is in
doubt with a 3:1 pupil to textbook ratio as not all students have access every night to all 6 required textbooks.
• Overcrowding of classrooms and high student to teacher ratios were cited in many schools. • Procurement process at school level. Most give 5% discount and discount on stationary seems to
be the deciding cost factor. Most schools stay with supplier if they are happy. Component 2: Capacity Building
• More in-service training. Teachers at many of the schools visited cited the lack of training opportunities as an issue.
31
• Clearer link to career progression. A better incentive structure could be implemented in the training activities to link professional development with annual reviews and promotions.
• In Kajiado, the Arid Lands person indicated that 300K shillings was not enough for a classroom and that cost was more like 450K. Furniture was 75K where 30K was given. Explanation given that community was expected to contribute their share to make up the difference (around 30%). At Oloirimirimi Primary school they spent 700K for parent built school. Contractor took 4-5 months and local person took 3 months – issue of identifying licensed contractor.
• Better and more frequent supervision needed from the Ministry of Works for the school construction.
• Commercial Banks indicated that they could support FM training at local level. Component 3: Monitoring and Evaluation
• The original baseline data was lacking for the project which resulted in an assumption that all schools should be treated equally. For the future disbursement of resources for instructional materials, the schools existing stock of books should be a criteria.
• A national database of textbooks should be established to better handle the needs and existing stocks at the school level.
• As 76% of schools have access to a cell phone, greater use of the SMS-text based communication could be used as well as pilots on use of cell phones as data collection devices.
32
Annex 3. Economic and Financial Analysis (including assumptions in the analysis) For analytical purposes, Project efficiency is defined as improvements in service delivery through quicker transfer of resources from MoE to decision-making nodes, in this case, primary schools. The analysis also includes a cost-effectiveness assessment which brings together the costs and benefits of the Project, and provides the arguments for how the FPESP was a cost effective approach. Background. In July, 2003 the Ministry of Education (MoE) launched a bold new national program, called the Primary Schools Instructional Materials Programme (IMP) to deliver quality instructional materials to primary schools throughout Kenya. To complement the IMP the MoE also expanded the national In-service Teacher Training (INSET) program (started in 2002) in order to strengthen the capacity of teachers to effectively use the new school textbooks in the classroom. At the time there was a crisis in the primary education sector as a result of the Free Primary Education (FPE) policy which triggered an immediate withdrawal of funding for textbooks provided by parents. MoE sought World Bank assistance to provide assistance for burgeoning enrolments.
The Free Primary Education Support Project (FPESP) embodies the decentralization principles of financial control and accountability to public primary schools. Non-formal schools did not benefit from the project until they had put in place accounting systems. At the outset the Project Appraisal Document (PAD) specified that unit disbursements per school-child varied from one disbursement to another. Variations in the disbursements of funds over time were expected under the project due to variations in curriculum needs and the durability of different elements in the package of instructional materials. During the course of project implementation, a Public Expenditure Tracking Survey (PETS) was undertaken from September 2004 to August 2005). The objective was to check in detail progress on disbursements. Results showed that overall the funds had flowed efficiently and that the funds were utilized for intended purposes. Weaknesses identified were that (i) initially it was not possible for schools to receive funds within the targeted period of four weeks. However, through the Electronic Funds Transfer, funds reached primary schools within the target period; (ii) some disbursement schedules prepared by the MoE Textbook Management Unit included a few schools without bank account numbers, causing accounting and bank reconciliation difficulties. These issues were addressed by the Ministry of Education (MOE), which conducted a further monitoring exercise in October 2005 (324 schools were inspected in detail); and (iii) some loss of textbooks due to improper security/storage of books and theft was reported. The magnitude of the loss, however, was not significant to reduce the benefits of textbook support to primary school students.
The findings of a report entitled “Delivering Quality and Improving Access to Primary Education:
An impact evaluation of Instructional Materials and In-service Teacher Training Programmes” also revealed the positive aspects of FPESP.
DIR review findings were that “(the) Free Primary Education Support Project (FPESP) achieved a satisfactory level of accountability from local communities to the national ministry which contributed to the proper use of funds under FPESP. The key elements were the transparent provision of comprehensive information, the use of efficient systems for flow of funds and strong local accountability mechanisms... Timely and agreed amounts of disbursements to schools based on required MOE documents that were confirmed during final project supervision in October 2006. Targets of 97% of schools receiving funds in the bank accounts without problems.”
Overall, from a beneficiaries perspective, FPESP contributed to improving student retention, attendance, and learning achievement. Computing Unit Costs
The cost of constructing classrooms has been excluded from the analysis. The reason being that
the PESP support was predominantly for teaching and learning materials and for institutional capacity development (school-based development and support, school accounting system, education management
33
information system (EMIS), and system design and program preparation). In order to keep the cost calculation simple, omitting the investment cost helps to isolate the recurrent costs (for school-based teacher development and support, and for teaching and learning materials). Arguably there are development and construction costs involved in the context of the introduction of FPE. The magnitude of the total investment cost through FPESP included the following areas:
Teacher in-service training. As of project closing in June 2007, 69,000 out of 72,000 teachers had
received training, with training for the remaining being underway, and 18,000 Head Teachers had received training in system management. The total cost of training the teachers is estimated at Kshs.123.5 million (US$1.9 million). The calculation yields the unit cost of in-service training in the use of new TLM for a teacher to be Kshs.1,372 (approximately US$21). The cost of training teachers is not annualized and the opportunity cost of investing in teacher training has not been factored into the calculation.
School accounting system was introduced in about 18,000 primary schools at an investment cost of
Kshs.65 million (US$1.0 million). The unit cost is Kshs.3,611 (US$56). The cost of amortization over a period of time and the opportunity cost of investing in the system have not been factored into the calculation.
Education Management Information System (EMIS) in 71 districts was introduced at an
investment of Kshs.162.5 million (US$2.5 million). The unit cost is Kshs.228,873 (US$3,521). The cost of amortization over a period of time and the opportunity cost of investing in the system have not been factored into the calculation.
System design and program preparation investment cost of Kshs.136.5 million (US$2.1 million)
was incurred. Since the entire primary education system benefited from the investment, it is difficult to identify the number of beneficiaries. Furthermore, calculating the unit cost after factoring amortization over a period of time and the opportunity cost of investing in the system is also difficult to specify.
Since school accounting systems, the EMIS and the system design and program preparation
support have systemic spillover benefits beyond the life of FPESP, these investments will not be factored into the aggregation of unit costs for FPESP. The focus is on the unit cost of teaching and learning materials which constituted the bulk of the investment cost for FPESP.
Teaching and Learning Materials (TLM). The unit procurement cost of teaching and learning
materials (TLM) remained essentially the same, pre-FPE and after FPESP became operational. The unit procurement cost of TLM was Kshs.207 pre-FPE. The per pupil cost of TLM package before FPE constituted was Kshs.1,604. Since households bought and owned the books, textbooks replacement cost was not an issue for GoK.
The announcement of FPE brought about an increase in unit procurement cost from Kshs.207 to
Kshs.337 due to the introduction of supplementary readers under the new curriculum, but an overall lowering of per pupil cost of TLM from Kshs.1,604 to Kshs.835. This was due in large part to: (i) a per pupil subsidy was introduced by Government of Kenya (GoK) in the amount of Kshs.1,020 (approximately US$16 per pupil) which included 64% or Kshs.650 (approximately US$10) for TLM alone; and (ii) a number of reforms directly linked to TLM which reduced the TLM unit procurement cost and per pupil cost:
• A shift in the ownership of TLM from parents to schools: Schools began to procure textbooks, own them and loaned them to students. Replacement became a factor in the budget since schools had to pay for them.
• Rationalization of the cost of TLM: Efficiency measures comprised: (i) Reduction in the number of textbooks from 13 to 6 following the review and introduction of
the new curriculum; (ii) Introduction of a new evaluation and approval system through the FPESP. One element
which affected the price of TLM was the introduction of intense price pressure with 30% of bidding marks was awarded for price alone. So publishers could not easily get on the approved list (Orange Book); and
34
(iii) Introduction of the principle of fixed prices irrespective of distance which was also introduced with FPESP. Prior to this bookseller could increase prices taking into consideration the distance from point of production to delivery points. The code of conduct included in the Orange book specified that publishers and booksellers had to supply books at the orange book price or less through discounts, but not more.
The factors above have been taken into consideration in computing the unit cost of TLM and the per pupil cost of TLM (Table 1). In addition, the recurrent cost implications for reaching the MoE target of 3 pupils to a textbook (3:1) for lower primary and two pupils to a textbook (2:1) for upper primary schools, and the life span of TLM have also been factored into the unit cost calculations (Table 1).
Table 1. Unit Cost Analysis with and without FPE and FPESP (Kshs.)
Without FPE and FPESP
With FPE and FPESP
Tuition item
Unit Cost of
TLM per academic
year
Per Pupil Cost of TLM
package per
academic year
Unit Cost of
TLM per academic
year
Per Pupil Cost of TLM
package per
academic year
Difference
A b c d e (f=c-d) Textbooks1 77.0 1,001.0 77.0 462.0 Exercise books2 15.0 150.0 15.0 90.0 Teachers’ guides3 7.0 91.0 7.0 42.0 Supplementary Readers and Reference Materials4
0.0 0.0 130.0 130.0
Pencils5 19.0 57.0 19.0 57.0 Dusters, Chalk, Registers6 22.0 22.0 22.0 22.0 Charts and Wall Maps7 74.0 74.0 74.0 74.0 Levy for examination 300.0 0.0
Total for Tuition8 214.0 1,695.0 344.0 877.0 818.0 FPE tuition subsidy 650.0
FPE household contribution (Kshs.) 1,695.0 185.0 FPE household contribution (US$)9 26 3 Source: Ministry of Education, Kenya. 2007, and ICR mission computations. Notes: 10. Textbooks: pre-FPE 13 books per pupil; post-FPE 6 textbooks per pupil. Unit cost is based on
Kshs.300 per textbook shared by 3 pupils. 11. Exercise books assumed to be 1 book per subject. 12. Teachers’ guides are the average of lower (Kshs.8) and upper primary (Kshs.6) costs. 13. Supplementary readers: 1 supplementary reader per student. 14. Pencils: 1 per term per pupil. 15. Dusters, chalk, registers: unit cost is based upon total cost of supply divided by 40 pupils per class. 16. Charts and Walk Maps: unit cost is based upon total cost of supply divided by 40 pupils per class. 17. Unit cost for both pre-FPE and after FPE was introduced is annualized. 18. For the purpose of calculating the exchange, it is assumed that US$1 = Kshs.65.
Column c in Table 1 shows the notional calculation of what it would have cost parents to purchase the minimum TLM required in order to send their children to primary school. The introduction of FPE and the tuition subsidy enabled children to have the minimum required since parental contribution was dramatically reduced by almost 88%.
35
Assuming that the GoK continues to supply TLM to all primary school children through the FPE subsidy, books with the Project were less expensive than textbooks without FPESP. This is due to the strategy adopted under FPESP to reduce the range of books developed and the prices.
Computing the benefits The FPE policy support by the Project was expected to provide economic benefits in two areas: (i) providing the basis for poverty reduction, overall human capital development, and contributing to accelerated economic growth; and (ii) rationalization of public expenditures. The first objective was achieved since the household out of pocket expense for primary education was high prior to the introduction of FPE. This was a key factor responsible for the deterioration of education sector performance and was further reflected in declining enrolment ratios and poor quality education. With the introduction of FPE in 2003 and up until 2006, primary school enrolments increased from about 5.7 million to 7.2 million in 2006.
The benefits of the teaching and learning materials program under FPESP had a very important poverty dimension. For the first time since the introduction of user fees in the late 1980s children from poor families began to have equal access to learning materials in the classroom as well as at home. As a consequence, student retention and attendance improved, and repetition and dropout rates declined, and student learning improved. Pupil to textbook ratios now range between 2:1 to 6:1 in lower primary (3:1 target), and 2:1 to 4:1 (target 2:1) in upper primary.
Student Achievement. The most compelling evidence emerging from the impact evaluation study is the finding that the teaching and learning materials and in-service training programmes had the greatest positive impact as measured by KCPE performance, on students living in the poorest districts across Kenya. Children from middle-income families also benefited (Chart 1).
Chart 1: Trend in KCPE performance by poverty band
215
220
225
230
235
240
245
250
255
Y ear
Low Pvty index 226.7292 241.7878 242.0966 243.0203 241.044 239.6898
M edium Pvty Index 237.9557 241.9219 244.6848 242.4243 243.1409 245.3202
High Pvty Index 232.846 239.02 245.7638 244.7167 249.7286 248.9878
2000 2001 2002 2003 2004 2005
Source: “Delivering quality and improving access primary education: An impact evaluation of the Instructional Materials and In-service Teacher Training Programmes.” Research Report 1 for the Ministry of Education, 2nd Draft, pp. 64, October 9th 2006.
36
Results of the KCPE at the end of academic year 2006 showed, using 2003 KCPE results as a baseline, the impact evaluation research team found that KCPE scores of children from schools in the poorest districts increased by 1.75% between 2003 and 2005. Children from middle-income socioeconomic districts were also found to have performed better albeit by a smaller amount at 1.2%. Children living in better off districts showed a decline in KCPE scores of about -1.4%. Students from the North Eastern Province which historically registered poor performance in KCPE results also showed some improvement (Table 3) after the introduction of the FPE policy supported by the FPESP. By 2006 three out of four (Garissa, Wajir, Mandera and Ijara) districts in North Eastern Province registered improved KCPE scores.
Table 3. KCPE Trends in the four North Eastern Province Districts
Source: Kenya National Examinations Council (KNEC), 2007.
Internal Efficiency gains can be attributed to the regular provision of learning materials in the classroom. Efficiency gains also led to reduction in repetition and dropout rates. Cost savings are associated with decline in repetition and dropout rates. The wider use of learning materials through FPESP led to reduction in repetition rate from 7.45% in 2002 to 6.7% in 2005, and reduction in dropout rate from 2% in academic year 2003 to 1.5% in 2006. Primary completion rate improved from an estimated 68.2% to 77.6% in 2006. Cost-effectiveness Analysis
The cost-effectiveness analysis for the Project builds on three aspects: the unit cost calculations above, the efficiency gains in the wider use of new teaching and learning materials, and the results of the end-Project student KCPE performance which are is used as the indicator for assessing improved learning achievement at the primary education level. The elements of the cost-effectiveness analysis are summarized in Table 3 below.
Table 3. Costs and Benefits of Providing Learning Materials
Without FPESP With FPESP 2003 2006
Per pupil cost of TLM (Kshs.) 1,695.0 877.0 Benefits Student Flow
The per pupil cost of teaching and learning materials without the project was considerably higher than with the project by about 93 percent. The student success rate was about 11 percent more among primary school students after the project than before the project. For unit cost to offset efficiency gains in terms of reduced repetition rate and dropout rate will need to be factored in. When cost, qualitative aspects (gains in test scores) and efficiency considerations (decline in repetition and dropout rates) are combined, with the Project is more cost-effective than without the Project.
37
Cost-effectiveness can best be analyzed by computing the total unit cost of a student completing the primary education cycle. However, the FPESP investments benefited both students and the system as a whole. It is difficult to amortize the systemic costs and to factor the opportunity cost to arrive at the unit cost with FPESP. Conclusion
There is Government and donor commitment to financing teaching and learning materials in all classrooms at primary education level in Kenya. This is currently ongoing through the Kenya Education Sector Support Project (KESSP). Kenya is in the process of putting in place reforms at all levels of education. The financial sustainability of teaching and learning materials investment program needs to be further evaluated in the context of the KESSP.
38
Annex 4. Bank Lending and Implementation Support/Supervision Processes
(a) Task Team members
Names Title Unit Responsibility/ Specialty
Lending Michael Mills Lead Economist ECSHD Team Leader Donald Hamilton Sr. Education Planner AFTH1 Team member Laura Kiang Operations Officer SASHD Team member Dandan Chen Economist AFTH1 Team member James Kamunge Education Consultant AFTH1 Team member Dahir Elmi Warsame Procurement Specialist AFTPC Team member John Nyanga Sr. Financial Management Specia AFTFM Team member Pascale H. Dubois Sr. Counsel LEGAF Team member Mohammad Nawaz Counsel LEGAF Team member Hyacinth Brown Sr. Finance Officer LOAG2 Team member Modupe A. Adebowale Sr. Finance Officer LOAG2 Team member Margaret Olale Disbursements Assistant AFC05 Team member Marlaine Lockheed WBIEG Peer Reviewer Alfonso de Guzman EASHD Peer Reviewer Surendra K. Agarwal Lead Specialist Team member Tony Read Textbook Consultant Team member Kevin Brown Management Consultant Team member Debbie Peterson Program Assistant AFTH1 Team member Caroline Kidiavayi Program Assistant AFC05 Team member
Supervision/ICR Michael Mills Lead Economist AFTH1 Team Leader James M. Kamunge Consultant AFCE2 Team member Laura M. Kiang Operations Officer SASHD Team member Josephine Lutta Kiyenje Consultant AFCE2 Team member Monica Wachera Ndungu Temporary AFCE3 Team member Monica Gathoni Okwirry Program Assistant AFCE2 Team member Andrew Sunil Rajkumar Economist AFTH3 Team member Dahir Elmi Warsame Sr Procurement Spec. AFTPC Team member Moses Sabuni Wasike Sr Financial Management Specia AFTFM Team member Shobhana Sosale Education Economist AFTH1 ICR Team Leader Robert J. Hawkins Sr. Operations Officer WBIHD ICR Primary Author
39
(b) Staff Time and Cost
Staff Time and Cost (Bank Budget Only)
Stage of Project Cycle No. of staff weeks USD Thousands (including
Annex 6. Stakeholder Workshop Report and Results N/A
42
Annex 7. Summary of Borrower's ICR and/or Comments on Draft ICR INTRODUCTION. In January 2003, the Government of Kenya (GoK) introduced Free Primary Education (FPE) Programme. This was implemented through per capita grants through electronic transfer of funds. Each school was required to open two accounts, School Instructional Materials Bank Account (SIMBA) and General Purpose Account (GPA). The School Instructional Materials and the School Management Committees were required to manage financial and procurement process. The introduction of the FPE initiative provided an opportunity to the World Bank to resume program support to Kenya. The World Bank, therefore, came in to support the programme through a grant under the Free Primary Education Support Project (FPESP). (a) PROJECT OBJECTIVE. The project objective was to improve pupil performance and retention through ensuring supply and better use of Instructional Materials. The project provided an initial support to the Government to deal with the financial and capacity challenges created by the initiative. (b) PERFORMANCE INDICATORS. The project’s performance indicators and targets were: An increase by June 2006 in the proportion of children reaching desired standards of achievements (in
English, Kiswahili, Mathematics and Science in standards 2, 4 and 6), disaggregated by province, gender, urban/rural and intra rural.
An increase in the proportion of local management committees and parents and children, rating their school as satisfactory or above for the learning process by June 2006.
A reduction in drop out rates at all standards by June 2006. The completion of a plan for follow up project to strengthen the education sector, using studies and
training provided, approved by the Permanent Secretary Ministry of Education and addressing the concerns of key stakeholders.
(c) PROJECT COMPONENTS. Below are the project components and sub-components for FPESP.
NO COMPONENTS ACTIVITIES ESTIMATED EXPENDITURES
1 Instructional Materials Per Capita grants earmarked for the Procurement of Instructional Materials
46.5m
2 Capacity building (a) SbTD – Training of key resource teachers (KRTs) to enhance curriculum delivery. It targeted 36,000 of whom 18,000 KRTs in Kiswahili, 18,000 KRTs in Guidance and Counselling and TAC tutors.
(b) School Accounting System. Financial Management Training for school audit, field officers and primary school heads.
(c) Education Management Information System (EMIS). Technical assistance for EMIS. Needs design and installation of the network. Training user’s and procurement of equipment (both software and hardware)
(d) System design and programme preparation. Management capacity, developing future sub-programmes including studies and support to disadvantaged children.
7.5m
3 Monitoring and Evaluation Surveys and reports 1.0 m
43
(d) ASPECTS OF EACH COMPONENT
COMPONENT 1: INSTRUCTIONAL MATERIALS This component entailed provision of grants to all public primary and non formal schools in urban slums. These grants were designed to procure Instructional Materials. This component of the project was a major component of the Free Primary Education Programme of the Ministry and continued even after the grants from the project were exhausted. ACHIEVEMENTS 1. There has been improved provision and availability of text books, teacher support materials, reference books and supplementary readers and stationery. The project targeted the achievement of 2:1 in upper primary and 3:1 in lower primary. Although there is isolated variation in pupil book ratios, the targets have been achieved in general between 3:1 to 2:1 in upper primary while in lower is between 5:1 to 3:1. In isolated cases in some subjects the ratio has reached 1:1 in upper primary. The implementation of this component has strengthened the system of disbursement of grants to Schools, Procurement, Utilization and Management. The decentralization Of Procurement and Financial Management has led to an efficient system of overall accountability. The text book market was also liberalized and strengthening book markets in local areas.
With the increased pupil - book ratio, the quality of education as evidenced through steady rising KCPE performance. Through this component, learners in non-formal education also accessed grants for Instructional Materials. There is evidence of utilization of materials by learners as well as teachers. This is attested in the baseline survey on learning achievements and client satisfaction survey reports.
Table. Text Book Pupil Ratio by Subject and Standard
Standard English Mathematics Science Kiswahili Social Studies
EFFICIENCY. Initially, it was not possible for schools to receive funds within the targeted period of four weeks. However, through the Electronic Frauds Transfer, funds reach school within the target period. RISKS. Some of the risks facing this component were the tear and wear of books. The Government ensured that schools established storage facilities to reduce the tear and wear of books. The other was loss of books. Most schools have a policy of replacement of lost books.
44
CHALLENGES. During the implementation, a few schools did not receive funds in time either due to wrong bank accounts or closed accounts. The provision of Instructional Materials was faced with the challenges of storage, wear and tear. The Government has continued to provide grants which are used to replace torn books and improve the ratio. On storage, the Government provided grants to enhance security and storage of materials. COMPONENT 2: CAPACITY BUILDING (a) SCHOOL BASED TEACHER DEVELOPMENT (SbTD) The main objective of SbTD was to improve the quality of teaching and learning in primary schools. Implementation of the School Based Teacher Development was through scaling up of the existing programme through the development of Kiswahili and Guidance and Counselling modules. The earlier programme focused on in-servicing teachers in English, Science and Mathematics. The target of the SbTD extension was 18,000 KRTs in Kiswahili and 18,000 in Guidance and Counselling. CHALLENGES. Recruitment of the KRTs was not 100% as expected because some teachers did not see immediate gains for the course. Moreover, Kiswahili module was not popular in some areas of the country. (b) SCHOOL EMPOWERMENT PROGRAMME (SEP) This programme was a school initiative that adopted an integrated approach to school development. Unlike the SbTD, SEP was being delivered through print and ICT (audio visual materials). The programme was targeted to 18,000 KRTs and head teachers. The roll out of this programme was not as effective as expected. This was because Head Teachers felt they had a lot of work to do. Lack of adequate support from TAC tutors (whose numbers have been dwindling) was one reason. The absence of ICT facilities was also a challenge. Overall reaction to INSET was that, there was no promotional potential it provided to those who undertake programmes. Some innovations will have to be designed as KESSP is being implemented. Both SbTD and SEP were supported by DFID and FPESP. As at the close of the project, out of the targeted 36,000 KRTs under SbTD, 24,000 had received their certificates. This is because some Districts had not submitted their returns. The SEP programme has not been implemented very well. This is because most head teachers complained that they were very busy in administering FPE and had doubts as to the utility value of the certificates for promotional purposes. (2) SCHOOL ACCOUNTING SYSTEM (FMS) The main focus of this sub-component was to build capacity for financial management. The ministry contracted the services of a consultant to undertake Financial Management support and Expenditure Tracking Study. Through the support a uniform accounting system was rolled out over the country. The focus was to train head teachers and MoE technical staff on basic accounting and recording to ensure that funds were directed to the intended purposes. Through the support over 1,600 key personnel, 17,500 primary school Head Teachers and 600 peer teachers were trained. The Expenditure Tracking Study was undertaken and indicated that funds flowed efficiently and were utilized for intended purposes. The main challenge is for MoE to undertake an audit to gauge the impact of Financial Management Support.
45
(3) EDUCATION MANAGEMENT INFORMATION SYSTEM (EMIS) This component has faced many challenges. The data capture from schools has been manual and takes a long time. The analysis of data equally takes long due to the amount of data collected. EMIS SUPPORT MoE contracted a consultant to undertake an EMIS needs, design and implementation study. Following the needs assessment and design the procurement of goods and services commenced. The procurement of goods and services lots 1-10 was completed. There are issues of training and management framework that must be in place to have a fully functional EMIS. Once operational, MOE will update data and information regularly. (4) GRANTS TO DISADVANTAGED GROUPS (a) GRANTS TO NON-FORMAL SCHOOLS
During the life of the project 166 schools in Nairobi slums received grants for the procurement of instructional materials. The target schools were not beneficiaries of grants available to public primary schools since the inception of Free Primary Schools education as it took time to ensure accounting systems are in place. A lot of work has been done to prepare for the scaling up the support to non-formal schools in other areas of the country. The main challenge has been the difficulty in differentiating public and private non formal schools and ensuring that they are duly registered. The other challenge has been the multiplicity of registration authorities. (b) GRANTS TO ASALS The ministry signed a Memorandum of Understanding with the office of the President (ALRMP) to implement this sub-component. The programme targeted 15 ASLAL districts not benefiting from resources from other Development Partners. The implementation of the programme has led to the construction of classrooms, provision of water and furniture to targeted schools. Component 3: MONITORING AND EVALUATION This component has three sub-components namely, monitoring, evaluation and external audit. a) MONITORING Under this sub-component two surveys were conducted. The client satisfaction survey and baseline survey on learning achievement were completed and pointed out positive outcomes and made recommendations for follow-up actions. In addition, every year the School Instructional Materials Management Unit (SIMMU) undertakes monitoring in sample schools. The funding informs the ministry on areas to focus in strengthening the system. One of the key challenges is the lack of mechanisms to utilize the findings of studies and reports and the time it takes to have monitoring reports ready for consumption. (b) EVALUATION could not be undertaken due to delays in procurement.
46
(C) EXTERNAL AUDIT
The Ministry contracted the services of a consultant to undertake audit for three years. For each of the three years the external auditor audited the project, and presented the findings and recommendations. One of the key issues is that follow up is limited due to capacity problems with the Quality Assurance Directorate and the School Audit Unit. The use of the findings would go along way in ensuring that the findings do not recur. The other key issue that faced the programme is staff turnover due to attrition at both Headquarters and primary school levels.
PROCUREMENT OF GOODS AND SERVICES The procurement of goods, works and services for the Project was generally very slow. At the commencement of the Project there was no Procurement Department in Government Ministries. However, with the support of Technical Assistance and support from the World Bank Country Office staff procurement was carried out. The number of contracts that had not been concluded before the expiry of the project were three. These were: 1. End of Project Evaluation. 2. Study of the provision of Instructional Materials in Secondary Education. And 3. Procurement Monitoring Agent. As indicated above, there have been serious challenges in procurement capacity and lack of adequate knowledge on IDA Procurement requirements. The status of procurement is as per the attached procurement monitoring tables.
(2) ASSESSMENT OF OUTCOME OF THE OPERATIONS AGAINST OBJECTIVES (Data on Key Performance Indicators in Results Framework for FPESP) Key Performance Indicators Activities Frequency Data source
(a) Learning Achievement Mean score for std 2 – 60% Mean score for std 4 -- 49% Mean score for std 6 -- 49%
June 2006 Baseline survey in learning achievement (2000)
(b) Client Satisfaction Levels of satisfaction on quality of teaching and learning
(b) 96.2% of pupils use instructional materials provided by the teachers according to the 2006 client satisfaction survey.
December 2005 Client satisfaction survey
47
Capacity Building 51.5% of teachers use instructional materials as set out in the inspectors Handbook.
Daily 2005 Client satisfaction
000 key Resource Teachers went through SbTD core module.
18,000 specialised in guidance and counselling
18,000 specialised in Kiswahili module
Cluster meetings of KRTs have been taking place although on an irregular basis.
Every school term Minutes of TAC Tutors
75.1% of school management committees were confident that school finances are well managed.
Client Satisfaction
All primary schools produce returns on FPE funds on monthly basis.
Monthly Schools instructional materials management unit.
3. ASSESSMENT INFORMATION ON ECONOMIC FINANCIAL, SOCIAL, INSTITUTIONAL AND ENVIRONMENTAL CONDITIONS IN WHICH FPESP WAS IMPLEMENTED Prior to the implementation of Free Primary Education Programme in 2003, the country had undergone decades of weak economic growth, low productivity and high unemployment rates. The GDP rate averaged 2% over the period and was moving towards negative growth as the country approached national elections. In June 2003, the government published the Economic Recovery Strategy (ERS) paper that has guided the major reforms undertaken over the period 2003-2007. The ERS was to restore economic growth within a sustainable framework of low inflations, declining fiscal imbalances, declining net domestic borrowing and health balance of payments. The economy has since then registered a growth of 7.1%. The poor performance of the economy was manifested by low enrolment rates, low transition rates, high drop out and completion rates especially among girls and children from poor households. Poor economic performance also led to rising poverty levels which in turn impacted negatively on key education indicators. It was estimated that the proportion of the population that lived in poverty rose from 48.8 percent in 1990 to 56.8 percent in 2004. However, there has been a drop in the proportion of population living in poverty to 47% in 2007. A key objective of the government in promoting equity and socio economic development was the putting in place of strategies for leveling the playing field for all Kenyans. The objective was to increase access to socio-economic opportunities for all, especially the vulnerable, marginalised and disadvantaged groups through employment, empowerment and through improving access affordability and quality of social status. To increase access to quality and affordable basic education the government implemented Free Primary Education Program in 2003 which led to an increase in enrolment from 5.9 m in 2002 to 8 million. Children who were formerly out of school have joined primary education under the initiative. Prior to the implementation of Free Primary Education Programme, Education was more or less centrally managed from MoE Headquarters. A number of reforms have since been instituted in the education sector. These include the decentralization of procurement and financial management services to the school level, strengthening of governance and accountability through capacity building of education managers, adoption of the SWAP process, the development of a policy document on Education Training and Research--The Sessional Paper No. 1 of 2005 which was operationalized by the Kenya Education Sector Support Programme document.
48
4. BORROWER’S PERFORMANCE At project preparation, the Borrower had already commenced implementing Free Primary Education. The World Bank was keen to support the Government in its initiative quickly. Consequently, the design of the Project appears to have been hurried and was confined to limited MoE Personnel. The implementing levels were not therefore, involved in the preparation of the project. As stated earlier, the Government did not have the services of procurement officers, and the capacity for use of ICT was limited. During implementation, Project components and related activities were spread across the MoE departments. Essentially, the project was mainstreamed. The implementation of FPESP has led to a number of lessons which could be useful for the implementation of KESSP. Key among them are: (i) The need to have adequate procurement capacity. (ii) Financial management capacity. (iii) EMIS capacity. (iv) Involvement of implementing levels in programme design. (v) Mainstreaming project activities is better than having PIU’s. (vi) Capacity for monitoring and evaluation. (vii) Structures for consumption of M & E findings and recommendations. 5. BANK’S PERFORMANCE During project preparation and implementation World Bank staff concentrated on technical areas of design. These include, Guiding on Procurement Planning, Financial Management Reporting and Procurement process. The support from the World Bank in capacity building was valuable to project implementation. Key areas of support were: (a) Procurement, planning and implementation and reporting; (b) Capacity building in financial management reporting; (c) Informal guidance; and (d) Timely feed back and granting of no objections. FUTURE ARRANGEMENTS FOR SUSTAINING GAINS. (i) Strengthening EMIS system; (ii) Conducting PETS regularly; (iii) Evaluating the NFE programme; (iv) Developing an M & E plan; (v) Strengthening procurement capacity; (vi) Revitalising primary INSET; and (vii) Establishing mechanisms to utilize findings and recommendations of surveys and studies.
49
Annex 8. Comments of Cofinanciers and Other Partners/Stakeholders Comments from DFID as excerpted from “KENYA: SPRED IMPACT STUDY: How the Instructional Materials Programme was developed, established and sustained as a National Programme” by Tony Read On 27 December 2002 the National Rainbow Coalition (NARC) was elected at Kenya’s general election. At the start of January 2003 the new government announced Free Primary Education with immediate effect in accordance with NARC’s campaign commitment. The result was an immediate increase in primary school enrolment for the new school year of about 1.3 million pupils, placing a severe strain on school facilities and resources and on education budgets. The World Bank responded very swiftly to a request for support from the new government: a Vice President visited Kenya during January and a project preparation team was in place by early February. SPRED III was scheduled to end in June 2003 (but was subsequently twice extended to 2005 - see below) and funding for instructional materials at the start of 2003 was entirely dependent on GOK and DFID support, although the Governments of Sweden and Canada had also indicated their willingness to provide support to instructional materials provision with grants channelled through DFID. The World Bank preparation team now worked very closely with DFID, who provided additional consultancy support, which helped to provide continuity in the focus of development partner funding to primary education. There were many parts of primary education needing additional funding to meet FPE requirements, and the World Bank team had a broad mandate to identify where support should be provided, but the team decided to concentrate its support heavily on textbooks, in order to address one issue which would make a big difference to the provision of good quality primary education and on which they could move quickly. There was already a lot of evidence of the effectiveness of interventions to textbook support both from Kenya and elsewhere (see above). There was in place a functioning system of decentralised textbook provision, although not yet on a national scale, which had emerged from the SPRED projects and the GOK/RNE pilot project and the short-lived follow-up project. The SPRED III project had been positively evaluated by an independent team in June 2002. There were established monitoring systems in place and a specialist Textbook Management Unit was operational within the MoEST: the new project could adopt the same basic project management arrangements being used for SPRED III. Moreover, the World Bank had previously prepared the STEPS project (which had then been shelved), in which nearly half of the proposed project funding had been earmarked for textbook provision and which had also included support for curriculum reform. There were specialist consultants available to work immediately with the World Bank’s own specialists who had excellent understanding of the issues related to instructional materials provision. Finally, a national system for instructional materials provision had been defined in great detail in the draft Component Implementation Manual written in July 2002. By working extremely hard over a 3 month period with MoEST officials, other development partners and experienced consultants, the World Bank was able to complete project preparation and appraisal before the end of April 2003 for a $50 million IDA grant, $41.8 million of which was to be released during 2003 to support the per capita instructional materials allocation of approximately KSh1,000 to all public primary schools in Kenya. (The balance of the $50 million IDA grant was provided to support capacity building, school-based teacher development and support, an improved school accounting system, an Education Management Information System, the system design and programme preparation, monitoring and evaluation.) The Project Appraisal Document (PAD) stressed that the fast rate of disbursement was “critically important as the books are urgently needed in the primary schools”. It also described FPESP as “the logical development of a continuous and well tested set of reforms in textbook financing, provision, procurement, usage and management, which has been underway for the past seven years since 1996”. Proposing that the World Bank’s support should be in the form of a grant rather than a loan, the PAD included the following: “ First, Kenya is eligible for IDA Grants in FY03, being an IDA-only country (under $360 per capita). Moreover, the newly elected Government has committed itself to fighting corruption, prioritising poverty
50
reduction and providing education for all children. It is strategically important for IDA to support the new Government’s efforts, and help it to deliver results quickly to keep up the existing massive support and goodwill of the people. Poor Kenyans, as well as the donor community, will gain tremendously if the new Government can succeed in these efforts. Moreover, this project has particularly strong ownership by the Government, and it could be a very good signal and showcase for positive results throughout the country. To provide financing as a grant instead of a loan would signal the Bank’s strong support, and give it goodwill amongst all stakeholders. Second, at the project level, there is expected to be a substantial human development impact. Primary education is a major determinant of economic well-being and growth, although the return from such investments may take a longer time to realize than other types of investment. The project is supporting the new policy of FPE. However, with the introduction of the major new policy, there are some initial costs before the new routines and procedures are fully instituted, and thus some project costs could be higher in the short term than they would be in the long term. This strengthens the case for funding the project by a grant instead of a credit. The project is also aimed at helping children who previously were the losers of education policies, as their poverty excluded them from school. The project will help Kenya to move towards EFA and enhance the likelihood of meeting the MDG on education for all by Year 2015. IDA grant financing could also enhance further the impact of the project, through its demonstration effect especially for other donors, and through encouraging sustained funding of the program by the Government as the country’s fiscal situation improves. Finally, the project will also support the development of the private sector in Kenya, and particularly the publishing and printing industries, as well as bookselling and delivery companies. Third, the grant would strengthen further the partnerships with other donors. In addition to IDA, there are several other agencies and governments which are either strong supporters of the education sector already, or which are expected to become donors to the new program of FPE in the near future. The design of the project is built on close donor collaboration, and this pattern of strong donor cooperation and coordination would be enhanced and facilitated substantially by a Bank grant.” The Board of the World Bank approved the grant in June 2003 and FPESP became effective in the form of a specific sector investment project from 1 July 2003. The grant is understood to be the largest ever made by the World Bank to an education project. During the preparation of the FPESP, much work was done on banking issues, revision of documentation, the planning of training of stakeholders, monitoring and audits in order to ensure that all the systems were appropriate and in place for the extension of the instructional materials decentralisation provision nationally. It was also necessary to confirm that procurement arrangements met World Bank requirements. All this preparation work could be based on the NSIMP plan contained in the draft Component Implementation Manual of July 2002, which in turn derived from the planning and experiences within the SPRED and GOK/RNE projects. DFID funded consultants from IBD who had previous experience in designing the instructional materials provision systems under these projects to work with the World Bank during the preparation, pre-appraisal and appraisal stages of FPESP. Among the inputs by the IBD consultants were:
• Finalising of all financing and banking arrangements for national instructional materials provision with The Treasury and MoEST .
• Drawing up with the MoEST an agreed list of minimum requirements for the provision of
instructional materials to be in all primary schools and pupils throughout Kenya by the end of 2003.
• Drafting an Instructional Materials Financing System Procedures Manual, in discussion with
MoEST. This listed the operations, controls and authorisations for each stage.
51
• Undertaking a book printing survey in order to establish the capacity of Kenyan printers to manufacture textbooks and teachers’ guides in the quantities and within the time-frame required by FPESP and to the minimum production specification levels required, as well as reviewing production specifications and publishers’ experience of placing work off-shore.
• Negotiating with the commercial banks in order to draw up a Memorandum of Understanding on
the detailed operation of school instructional materials bank accounts (now called SIMBAs).
• Assisting the TMU and other sections of the MoEST in revising documentation for schools and for suppliers.
• Planning and assisting with training for schools, MoEST officials, publishers and booksellers.
• Providing assistance to the planning of the annual competitions to select instructional materials for
inclusion in the MoEST’s “Orange Book” (the approved list of primary and secondary school textbooks and other instructional materials). The work included inputs into the revision of competition documents, support to the evaluation of production specifications, evaluator training and evaluation verification.
PricewaterhouseCoopers were engaged by the World Bank as consultants to prepare a Financial Management Handbook and to plan training on financial procedures for MoEST officials and schools (head teachers and members of School Instructional Materials Selection Committees). The detailed criteria, methodology and management systems were mostly already in place and had previously been approved by the World Bank as meeting their required procedures during the preparation of the STEPS project. An independent check was now undertaken of the evaluation of the first phase of new curriculum, textbooks and teachers’ guides, which took place in January-February 2003 and the process was given a clean bill of health. The Project Appraisal Document for FPESP of April 2003 summarised the existing textbook procurement system as having: … price and quality competition at three different levels. There is competition among publishers to get their titles on the approved list, which includes price and quality factors. There is competition between publishers to promote their titles to schools and gain school adoptions, which also includes price, quality and service factors. Finally there is competition between booksellers to win supply contracts. Booksellers competition includes price and service factors … The only aspects in the procurement arrangement that need some strengthening are enhancement of the procurement procedures in the Primary Schools Instructional Materials Management Handbook. The main weakness in the current system is that, in some schools, the head teachers personally contact and solicit quotations from booksellers, instead of having the STSEs [School Textbook Selection Committees] send out Requests for Quotations to booksellers. There is therefore concern that head teachers may selectively contact booksellers of their choice. To eliminate this practice the STSCs will invite quotations in writing from as many booksellers as possible and booksellers will be required to submit their quotations in writing in sealed envelopes. As well as ensuring that this system of inviting written quotations from booksellers was incorporated into the revised Primary School Textbook Management Handbook, the World Bank engaged PricewaterhouseCoopers to manage the introduction of a uniform accounting system for public primary schools, with associated training. Monitoring and Evaluation Activities FPESP included a monitoring and evaluation component, to which $1 million was allocated. This provided for monitoring focused on key performance indicators related to student learning, pupil retention, teacher behaviour and resource use at the school level. These were to be measured through an initial baseline survey administered in approximately 250 schools in September 2003, with the assessment of pupil learning, teacher behaviour and instructional materials use repeated in the same schools in September 2004
52
and September 2005 in order to identify potential correlations between performance and a range of other factors, including instructional materials provision and usage. An evaluation was planned for the end of the project. The project also financed a bi-annual external and independent audit in the first year and an annual audit in the second and third years of the project, focused on the Textbook Management Unit and a sample of primary schools. A supervision mission of FPESP by the World Bank took place in November/December 2003, including two consultants funded by DFID so that the conclusions could inform the SPRED III project as well. This mission reported that implementation of the instructional materials component was behind schedule, although many schools had drawn down from their SIMBA accounts and bought textbooks and other instructional materials. Other findings included:
• That the TMU’s procedures, equipment, staff skills and resources needed to be strengthened. In particular, communication with districts needed to be improved.
• That, from a small sample of books examined during a recent survey, it was estimated that 18%
would not last for the required 3 to 4 years. The MoEST agreed to invoke the prescribed measures against publishers supplying defective and sub-standard books if this were found on further examination to be a widespread problem.
• That the Supplier’s Manual prepared earlier in the year had not been distributed. The MoEST
agreed to take prompt action over this to ensure that it was sent out immediately.
• That some schools were not always implementing the textbook selection processes correctly, which was attributed partly to the brevity of the training they had received and the lack of some key documents in some districts during the training sessions. The MoEST indicated that further training was planned early in 2004.
• That some of the banks who had signed the Memorandum of Understanding with the MoEST
defining bank charges for SIMBA and school no. 2 accounts were charging more than the agreed minimum level. The MoEST had already followed up on this with the banks concerned asking them to refund any incorrect amounts already collected.
• Some irregular practices had been reported (for example, in the choice of supplier, discounts and
title substitution). The MoEST was checking on these reports and taking appropriate action with any schools involved.
The Mission also anticipated the design of the planned SWAp, for which the preparation of the GOK’s education budget for the financial year 2004-5 was a critical ingredient. Another Textbooks Impact Study of SPRED III by PriceWatehouseCoopers for the GOK and DFID in November 2003 confirmed delays in instructional materials funding reaching some schools, but reported: Textbook provision was most welcome by all the schools. The process of the textbook procurement has been a uniting factor to all the stakeholders in schools. The process has increased interaction between parents, schools, publishers and booksellers through the development of sales promotion, procurement and the delivery of books to schools. At school level, a democratic participatory culture has developed through collaboration between school committees, parents, head teachers, and class subject teachers in textbook selection, ordering, development of storage facilities, conservation, and use of books. This has been further enhanced through the creation of School Textbooks Selection Committees (STSC) and School Management Committees (SMC). In addition the textbook project has had significant impact on improvement in the pupil/textbook ratio, especially in the examination subjects, leading to more effective teaching and learning in schools.
53
However, there is still a need for more books as the pupil:textbook ratios are far from the ideal of 3:1 and 2:1 in lower and upper primary respectively, in many schools across the country. However, the conclusion sounded a warning: The textbook project has certainly reduced the cost of education to parents, improved the relationship between teachers, parents and pupils and infused a culturally sensitive and responsive school management environment with respect to textbook procurement, storage, conservation and use. However, it appears equally certain that unless funding levels are enhanced and sustained, impact on family expenditure will remain minimal and the gains already made could be transient.
54
Annex 9. List of Supporting Documents Republic of Kenya. Economic Recovery Strategy. Dr. Jacinta K. Ndambuki. Draft Report on Teacher Training and Development Study Promin Consultants Ltd., June 28, 2006. Baseline Survey on Learning Achievement. Final Report. Government of Kenya. Arid Lands Resource Management Project. “The Pastoralist Communities and Free
Primary Education in Kenya: A Preliminary Survey.” Ministry of Education, Science and Technology. “Financial Tracking/Monitoring of Receipt & Utilization
of Free Primary Education Funds.” Draft Report. October 2005. Prepared by the School Instructional Materials Management Unit (SIMMU).
Ministry of Education, Science and Technology and UNESCO. “Challenges of Implementing Free Primary
Education in Kenya: Assessment Report.” December 2004. Ministry of Education, Science and Technology. “Free Primary Education: National Monitoring and
Evaluation Report.” For the period February-April 2004. Submitted in June 2004. Ministry of Education, Science and Technology. “Free Primary Education: Every Child in School…
MOEST Vision: Quality Education for Sustainable Development.” May 2003. Nairobi. Kenya. Techsphere Systems Limited. Education Management Information System (EMIS). “Inception Report for
the Design and Implementation of Education Management Information Systems (EMIS).” Report for the Ministry of Education, Science and Technology. January 6, 2005.
Ministry of Education. “Draft Midterm Report on Review of Quality Assurance and Advisory Services.”
Free Primary Education Support Project (FPESP). Grant No.H0500-KE. 2007. Ministry of Education. GOK/World Bank Infrastructure Support Project to 15 ASAL Districts. “Report on
Monitoring of the GOK/World Bank Projects in 15 ASAL Districts.” March 2007. Oxfam GB and ANCEFA. “UPE: Myth or Reality—A review of experiences, challenges and lessons from
East Africa.” Promin Consultants Limited. “Free Primary Education Support Project (FPESP): Final Report on Client
Satisfaction Survey.” Submitted to Ministry of Education, Science and Technology. December 30, 2005.
PriceWaterhouseCoopers. “Free Primary Education Support Project: Expenditure Tracking Study (Final
Report).” February 2006. Procurement and Management Consultancy Reports. DFID/IDA Free Primary Education Sponsored Project.
October-December 2003. Republic of Kenya. MOEST. Approved List of Primary School Textbooks and Other Instructional
Materials. Revised Sixth Edition, January 2006. Republic of Kenya. MOEST. Approved List of Primary School Textbooks and Other Instructional
Materials. Revised Fifth Edition, January 2005. Republic of Kenya. MOEST. Approved List of Primary School Textbooks and Other Instructional
Materials. Revised Third Edition, January 2003.
55
Financial and Audit Reports Republic of Kenya. MOEST. A Handbook of Financial Management Instructions for Primary Schools. Ernest & Young. Free Primary Education Support Project (FPESP): Grant No. H0500-KE. Management
Letter for the Six Months Period Ending December 31, 2003 and the Year ending June 30, 2004. Ernest & Young. Free Primary Education Support Project (FPESP): Grant No. H0500-KE. Management
Letter for the year ended June 30, 2005. Ernest & Young. “Free Primary Education Support Project (FPESP): Grant No.H0500-KE. Management
Letter for the year ending June 30, 2006. Ministry of Education. Free Primary Education Support Project. Financial Management Support Final
Report. February 2006. World Bank. “Free Primary Education Support Project.” Project Appraisal Document. May 23, 2003.
Human Development 1; Country Department 5; Africa Region. Washington, D.C. Other Teacher Training. SbTD Extension TAC Tutor and Zonal Inspectors Training.