Document of The World Bank Report No: ICR00001989 IMPLEMENTATION COMPLETION AND RESULTS REPORT (IDA-34760 IDA-3476A) CREDIT IN THE AMOUNT OF SDR 24.2 MILLION (US$35 MILLION EQUIVALENT) TO THE REPUBLIC OF SIERRA LEONE FOR A POWER AND WATER PROJECT September 29, 2011 Urban and Water Unit (AFTUW) Country Department AFCW1 Africa Region Public Disclosure Authorized Public Disclosure Authorized Public Disclosure Authorized Public Disclosure Authorized Public Disclosure Authorized Public Disclosure Authorized Public Disclosure Authorized Public Disclosure Authorized
Transcript
Document of
The World Bank
Report No: ICR00001989
IMPLEMENTATION COMPLETION AND RESULTS REPORT
(IDA-34760 IDA-3476A)
CREDIT
IN THE AMOUNT OF SDR 24.2 MILLION
(US$35 MILLION EQUIVALENT)
TO THE
REPUBLIC OF SIERRA LEONE
FOR A
POWER AND WATER PROJECT
September 29, 2011
Urban and Water Unit (AFTUW) Country Department AFCW1 Africa Region
Pub
lic D
iscl
osur
e A
utho
rized
Pub
lic D
iscl
osur
e A
utho
rized
Pub
lic D
iscl
osur
e A
utho
rized
Pub
lic D
iscl
osur
e A
utho
rized
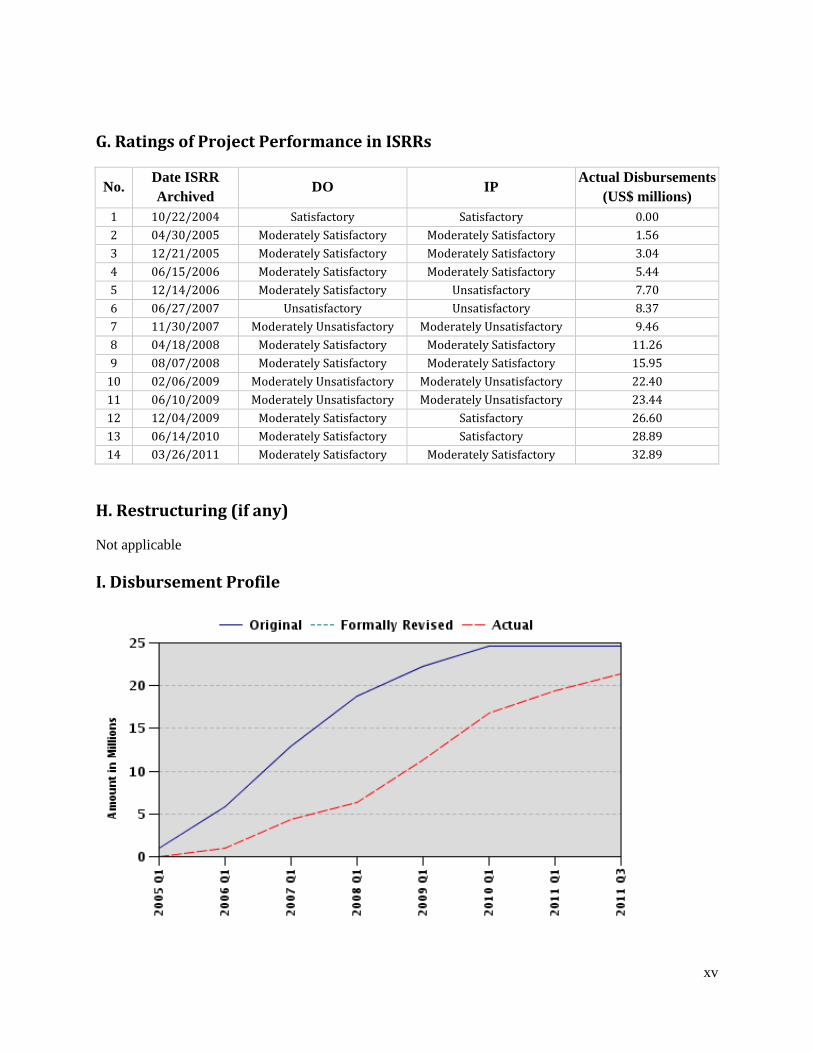
Pub
lic D
iscl
osur
e A
utho
rized
Pub
lic D
iscl
osur
e A
utho
rized
Pub
lic D
iscl
osur
e A
utho
rized
Pub
lic D
iscl
osur
e A
utho
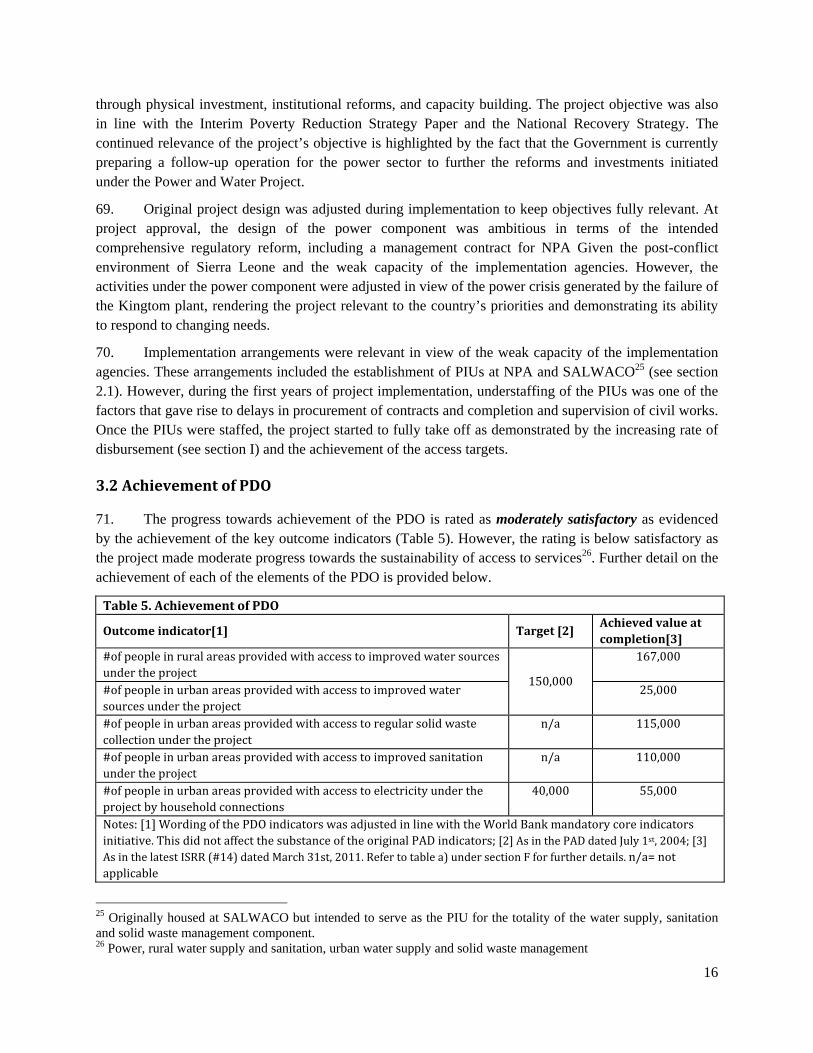
rized
CURRENCY EQUIVALENTS
Exchange Rate Effective September 1st, 2011 Currency Unit: Sierra Leonean Leones (SLL)
SLL 1.00 = US$ 0.00 US$ 1.00 = SLL 4,416.96
FISCAL YEAR: January 1 – December 31
Abbreviations and acronyms BADEA Arab Bank for Economic Development in Africa
(Banque Arabe pour le Développement Economique en Afrique)
DFID Department for International Development
EIA Environmental Impact Assessment
EMP Environmental Management Plan
EIRR Economic Internal Rate of Return
ESMF Environmental and Social Management Framework
ESMP Environmental and Social Management Plan
FCC Freetown City Council
FM Financial Management
FSWMC Freetown Solid Waste Management Company
GoSL Government of Sierra Leone
GVWC Guma Valley Water Company
ICR Implementation Completion Report
IDA International Development Association
IPP Independent Power Producer
ISRR Implementation and Status Results Report
M&E Monitoring and Evaluation
MoEP Ministry of Energy and Power
MoYS Ministry of Youth and Sports
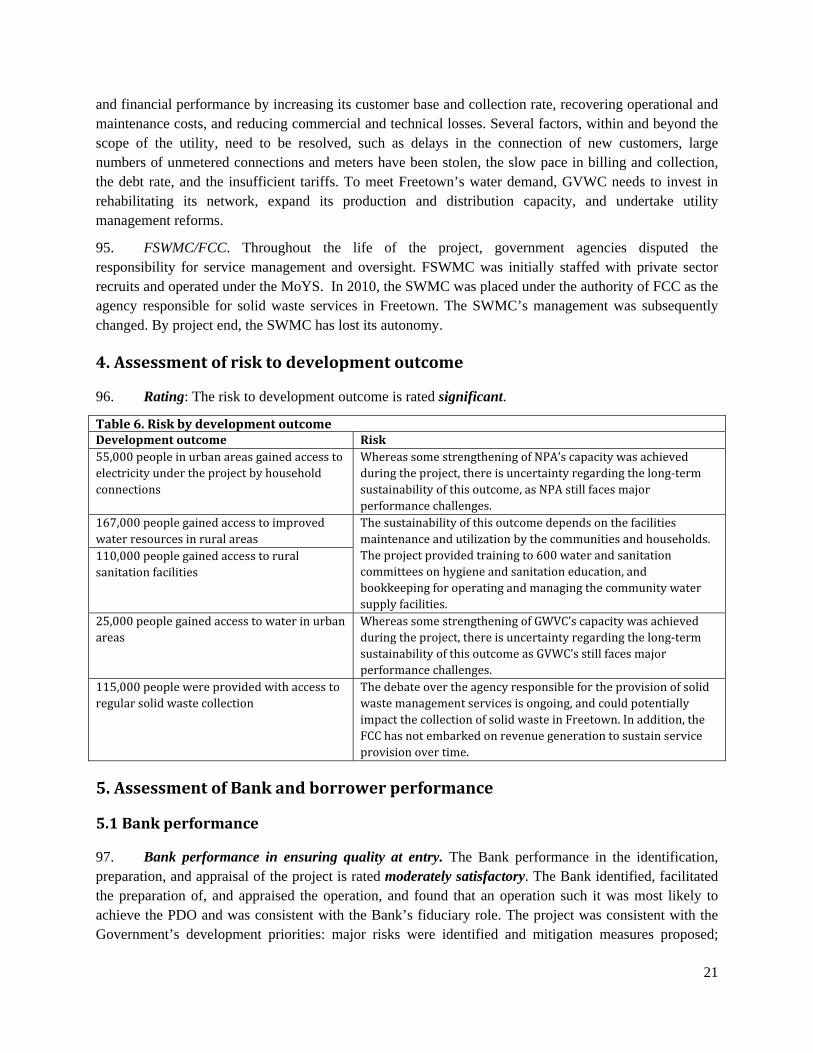
MTR Midterm Review
N/A Not applicable
NCP National Commission for Privatization
NGO Non-Governmental Organization
NPA National Power Authority
O&M Operations and Maintenance
OPEC Organization of Petroleum Exporting Countries
PAD Project Appraisal Document
PDO Project Development Objectives
PIU Project Implementation Unit
QALP Quality Assessment of Lending Portfolio
RAP Resettlement Action Plan
RPF Resettlement Policy Framework
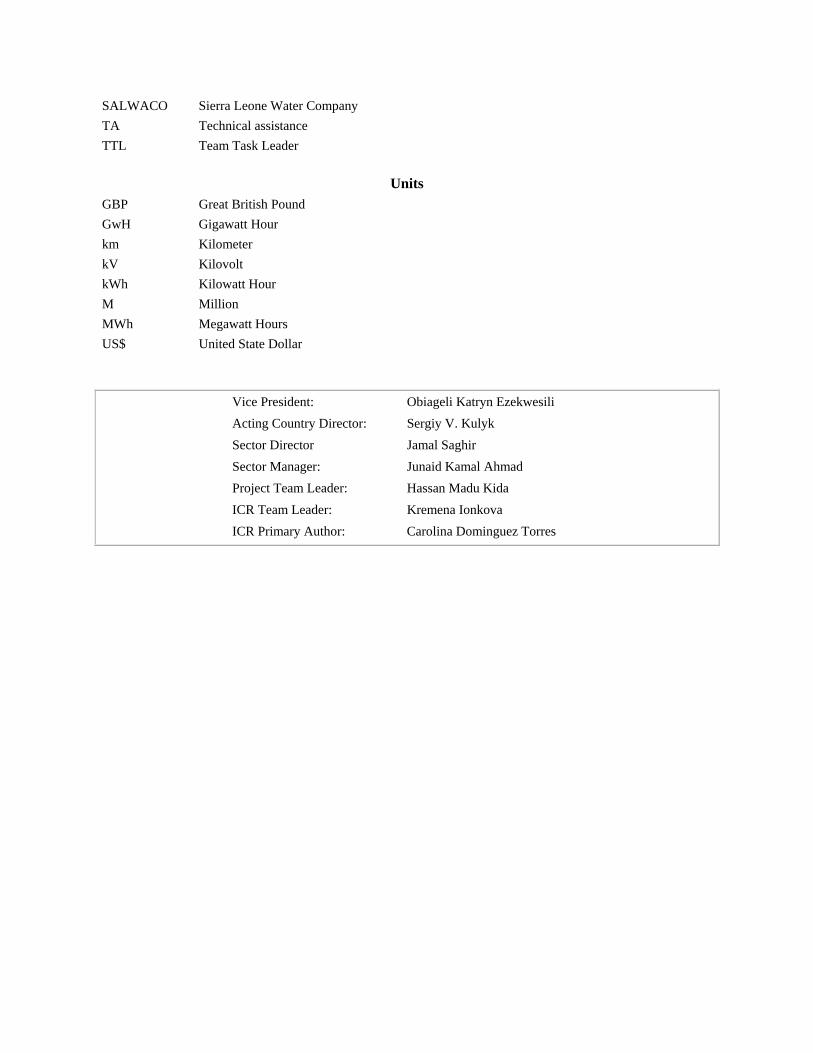
SALWACO Sierra Leone Water Company
TA Technical assistance
TTL Team Task Leader
Units
GBP Great British Pound
GwH Gigawatt Hour
km Kilometer
kV Kilovolt
kWh Kilowatt Hour
M Million
MWh Megawatt Hours
US$ United State Dollar
Vice President: Obiageli Katryn Ezekwesili
Acting Country Director: Sergiy V. Kulyk
Sector Director Jamal Saghir
Sector Manager: Junaid Kamal Ahmad
Project Team Leader: Hassan Madu Kida
ICR Team Leader: Kremena Ionkova
ICR Primary Author: Carolina Dominguez Torres
i
REPUBLIC OF SIERRA LEONE
Power and Water Project
Contents A. Basic Information .................................................................................................................................... iii B. Key Dates ................................................................................................................................................ iii C. Ratings Summary .................................................................................................................................... iv D. Sector and theme codes ............................................................................................................................ v E. Bank staff.................................................................................................................................................. v F. Results Framework Analysis .................................................................................................................... v G. Ratings of Project Performance in ISRRs .............................................................................................. xv H. Restructuring (if any) ............................................................................................................................. xv I. Disbursement Profile ............................................................................................................................... xv 1. Project context, development objectives and design ................................................................................. 1
1.1 Context at appraisal ............................................................................................................................. 1 1.2 Original project development objective (PDO) and key indicators .................................................... 4 1.3 Revised PDO and key indicators......................................................................................................... 4 1.4 Main Beneficiaries .............................................................................................................................. 5 1.5 Original components ........................................................................................................................... 5 1.6 Revised components ........................................................................................................................... 6 1.7 Other significant changes .................................................................................................................... 7
2. Key factors affecting implementation and outcomes ................................................................................ 8 2.1 Project preparation, design, and quality at entry ................................................................................. 8 2.2 Implementation ................................................................................................................................. 10 2.3 Monitoring and Evaluation (M&E) design, implementation and utilization .................................... 12 2.4 Safeguard and fiduciary compliance ................................................................................................. 12 2.5 Post-completion operation and next phase ........................................................................................ 15
3. Assessment of outcomes ......................................................................................................................... 15 3.1 Relevance of objectives, design and implementation ....................................................................... 15 3.2 Achievement of PDO ........................................................................................................................ 16 3.3 Efficiency .......................................................................................................................................... 18 3.4 Justification of overall outcome rating .............................................................................................. 20 3.5 Overarching themes, other outcomes and impacts ............................................................................ 20
4. Assessment of risk to development outcome .......................................................................................... 21 5. Assessment of Bank and borrower performance .................................................................................... 21
5.1 Bank performance ............................................................................................................................. 21 5.2 Borrower performance ...................................................................................................................... 22
6. Lessons learned ....................................................................................................................................... 24 7. Comments in issues raised by the borrower, implementing agencies, and partners ............................... 25
7.1 Borrower/implementing agencies ..................................................................................................... 25 7.2 Co-financiers ..................................................................................................................................... 25 7.3 Other partners and stakeholders ........................................................................................................ 25
ii
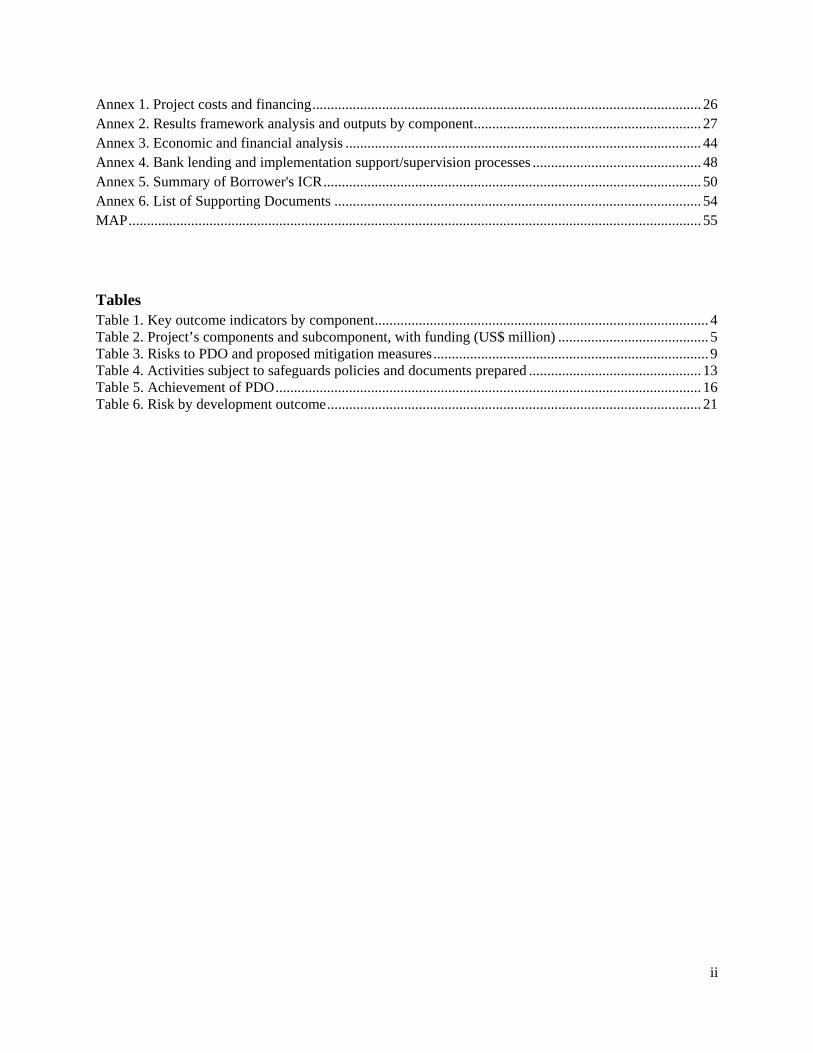
Annex 1. Project costs and financing .......................................................................................................... 26 Annex 2. Results framework analysis and outputs by component .............................................................. 27 Annex 3. Economic and financial analysis ................................................................................................. 44 Annex 4. Bank lending and implementation support/supervision processes .............................................. 48 Annex 5. Summary of Borrower's ICR ....................................................................................................... 50 Annex 6. List of Supporting Documents .................................................................................................... 54 MAP ............................................................................................................................................................ 55
Tables Table 1. Key outcome indicators by component ........................................................................................... 4 Table 2. Project’s components and subcomponent, with funding (US$ million) ......................................... 5 Table 3. Risks to PDO and proposed mitigation measures ........................................................................... 9 Table 4. Activities subject to safeguards policies and documents prepared ............................................... 13 Table 5. Achievement of PDO .................................................................................................................... 16 Table 6. Risk by development outcome ...................................................................................................... 21
iii
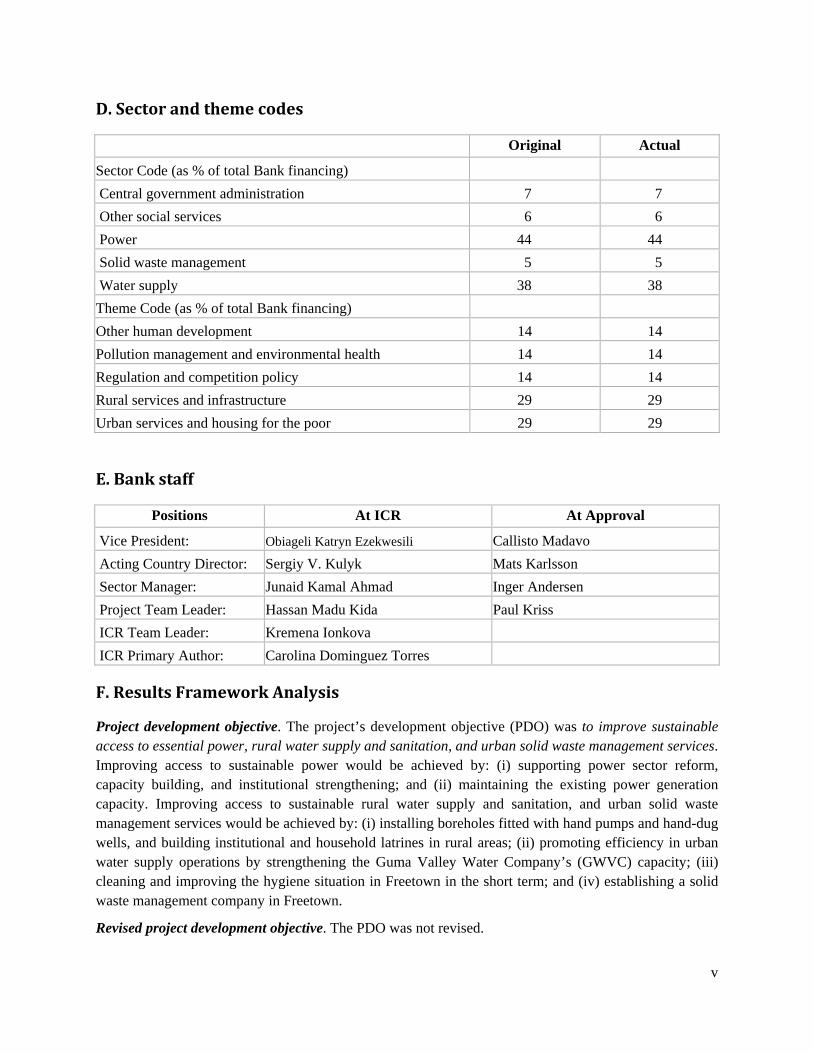
A. Basic Information
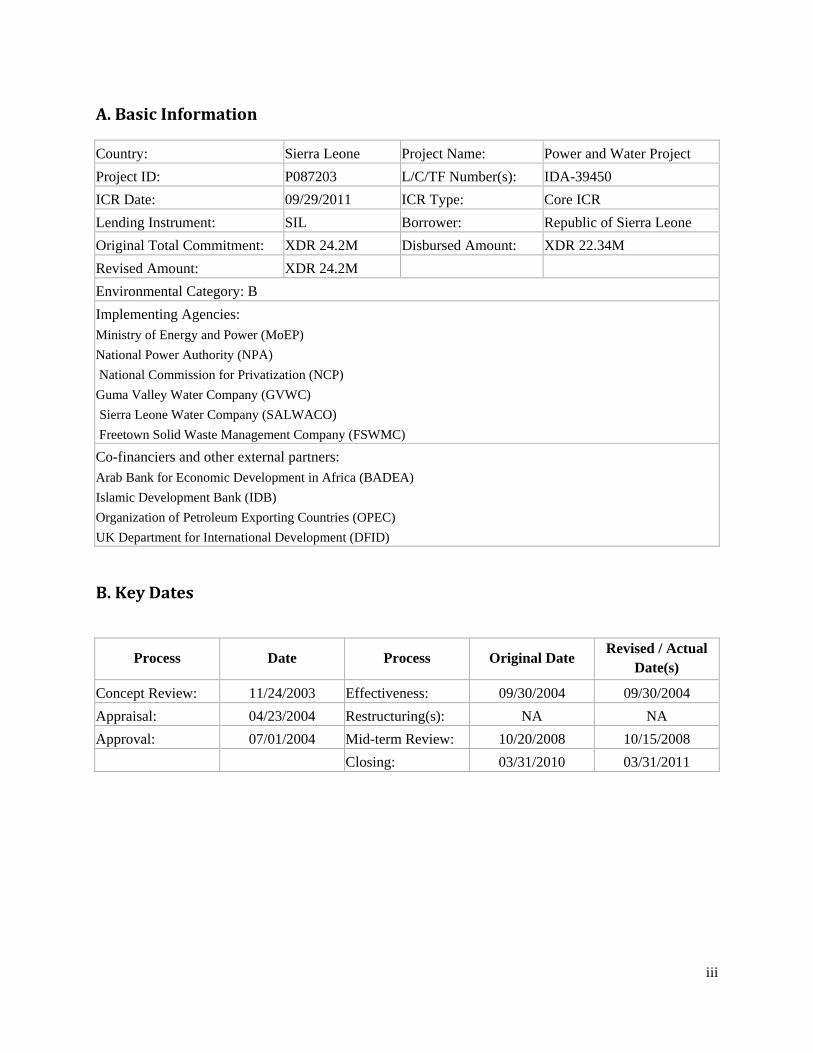
Country: Sierra Leone Project Name: Power and Water Project
Project ID: P087203 L/C/TF Number(s): IDA-39450
ICR Date: 09/29/2011 ICR Type: Core ICR
Lending Instrument: SIL Borrower: Republic of Sierra Leone
Original Total Commitment: XDR 24.2M Disbursed Amount: XDR 22.34M
Revised Amount: XDR 24.2M
Environmental Category: B
Implementing Agencies: Ministry of Energy and Power (MoEP)
National Power Authority (NPA)
National Commission for Privatization (NCP)
Guma Valley Water Company (GVWC) Sierra Leone Water Company (SALWACO)
Freetown Solid Waste Management Company (FSWMC)
Co-financiers and other external partners: Arab Bank for Economic Development in Africa (BADEA)
Islamic Development Bank (IDB)
Organization of Petroleum Exporting Countries (OPEC)
UK Department for International Development (DFID)
B. Key Dates
Process Date Process Original Date Revised / Actual
Acting Country Director: Sergiy V. Kulyk Mats Karlsson
Sector Manager: Junaid Kamal Ahmad Inger Andersen
Project Team Leader: Hassan Madu Kida Paul Kriss
ICR Team Leader: Kremena Ionkova
ICR Primary Author: Carolina Dominguez Torres
F. Results Framework Analysis
Project development objective. The project’s development objective (PDO) was to improve sustainable access to essential power, rural water supply and sanitation, and urban solid waste management services. Improving access to sustainable power would be achieved by: (i) supporting power sector reform, capacity building, and institutional strengthening; and (ii) maintaining the existing power generation capacity. Improving access to sustainable rural water supply and sanitation, and urban solid waste management services would be achieved by: (i) installing boreholes fitted with hand pumps and hand-dug wells, and building institutional and household latrines in rural areas; (ii) promoting efficiency in urban water supply operations by strengthening the Guma Valley Water Company’s (GWVC) capacity; (iii) cleaning and improving the hygiene situation in Freetown in the short term; and (iv) establishing a solid waste management company in Freetown.
Revised project development objective. The PDO was not revised.
vi
(a) PDO Indicator(s)
Indicator Baseline Value Original Target
Values (from approval documents)
Formally Revised Target
Values
Actual Value Achieved at Completion or Target Years
Indicator 1 : # of people in rural areas provided with access to improved water sources under the project Value quantitative or Qualitative)
0 150,000 167,000
Date achieved 07/01/2004 12/06/2010 03/31/2011 Comments (incl. % achievement)
Original indicator included in the PAD reads: "Access to improved water supply for 150,000 people in rural and urban areas through the project". The original target was overachieved. In latest ISRRs (# 13 and #14) the end-target was modified to 180,000.
Indicator 2 : # of people in urban areas provided with access to improved water sources under the project. Value quantitative or Qualitative)
0 150,000 25,000
Date achieved 07/01/2004 12/06/2010 03/31/2011 Comments (incl. % achievement)
Original indicator included in the PAD reads: "Access to improved water supply for 150,000 people in rural and urban areas through the project". Original target for both rural and urban areas was overachieved.
Indicator 3 : # of people in urban areas provided with access to regular solid waste collection under the project Value quantitative or Qualitative)
0 See comment 115,000
Date achieved 07/01/2004 12/06/2010 03/31/2011 Comments (incl. % achievement)
Original indicator included in the PAD reads: "Access to improved solid waste management collection services for Freetown inhabitants". Original target achieved since the service improved as a result of the project.
Indicator 4 : # of people in urban areas provided with access to improved sanitation under the project Value quantitative or Qualitative)
0 See comment 110,000
Date achieved 07/01/2004 12/06/2010 03/31/2011 Comments (incl. % achievement)
This indicator was not originally included in the PAD.
Indicator 5 : # of people in urban areas provided with access to electricity under the project by household connectionsValue quantitative or Qualitative)
0 40,000 55,000
Date achieved 07/01/2004 12/06/2010 03/31/2011 Comments (incl. % achievement)
Original indicator included in the PAD reads: "Access to improved power supply for 40,000 customers in project area". Target overachieved.
vii
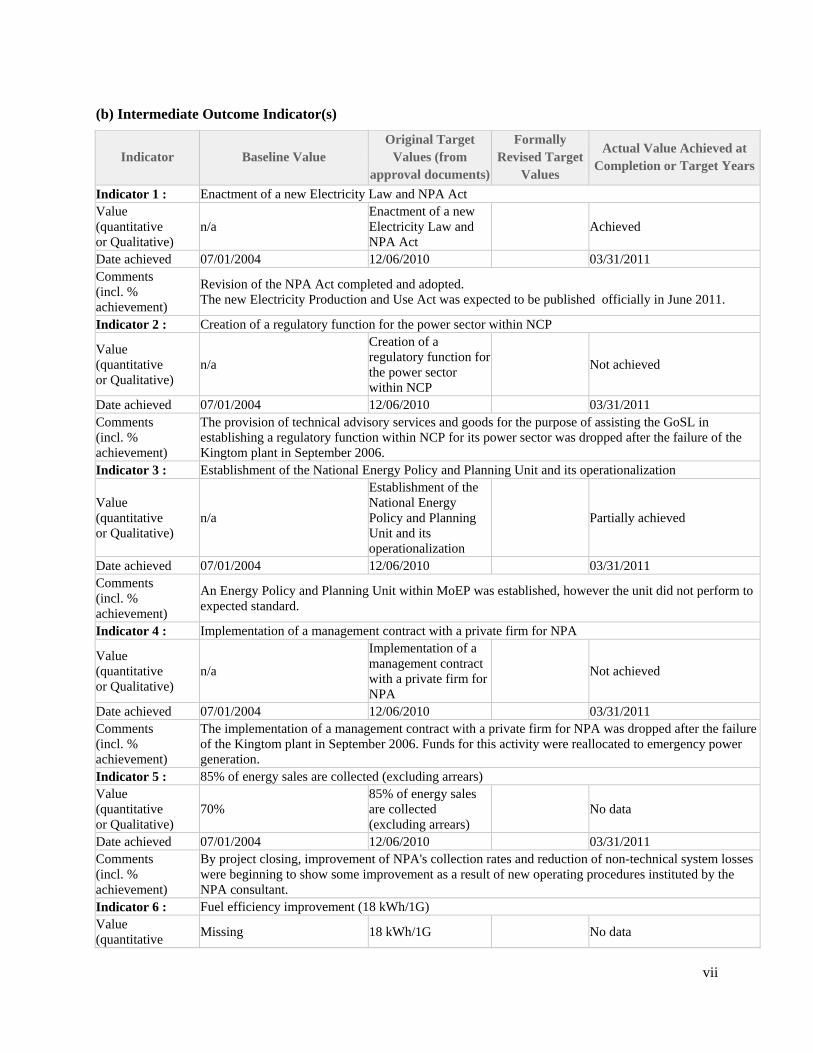
(b) Intermediate Outcome Indicator(s)
Indicator Baseline Value Original Target
Values (from approval documents)
Formally Revised Target
Values
Actual Value Achieved at Completion or Target Years
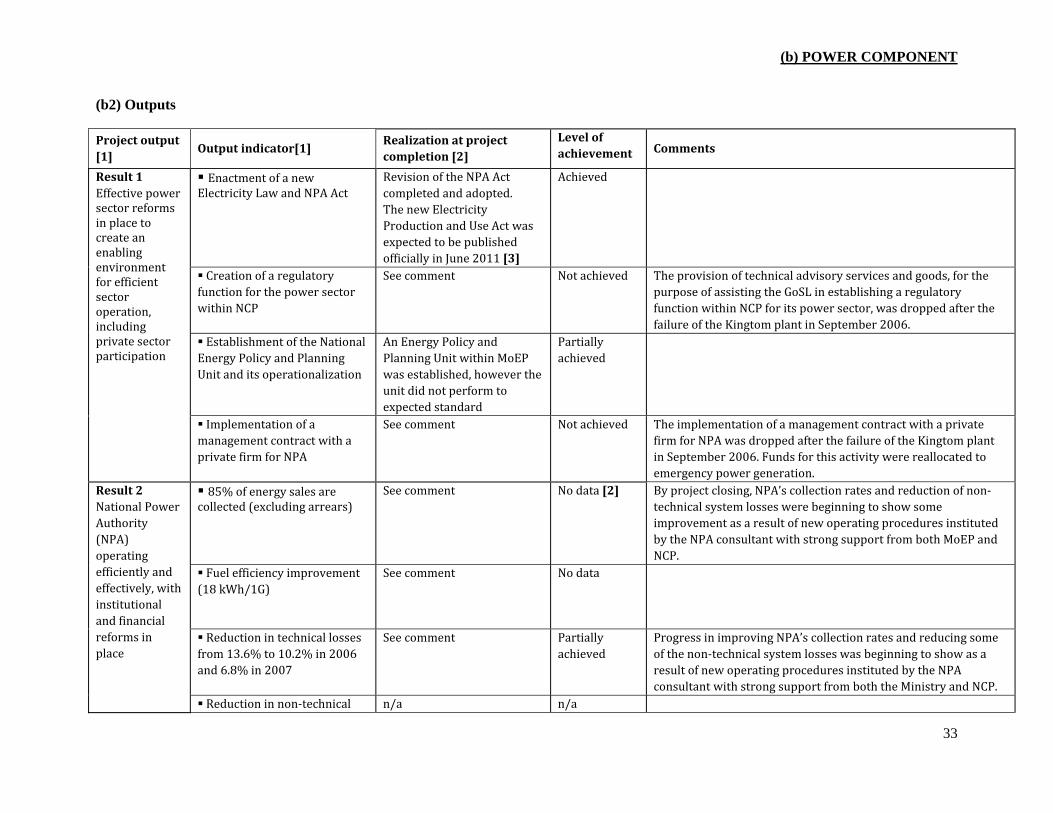
Indicator 1 : Enactment of a new Electricity Law and NPA Act Value (quantitative or Qualitative)
n/a Enactment of a new Electricity Law and NPA Act
Achieved
Date achieved 07/01/2004 12/06/2010 03/31/2011 Comments (incl. % achievement)
Revision of the NPA Act completed and adopted. The new Electricity Production and Use Act was expected to be published officially in June 2011.
Indicator 2 : Creation of a regulatory function for the power sector within NCP
Value (quantitative or Qualitative)
n/a
Creation of a regulatory function for the power sector within NCP
Not achieved
Date achieved 07/01/2004 12/06/2010 03/31/2011 Comments (incl. % achievement)
The provision of technical advisory services and goods for the purpose of assisting the GoSL in establishing a regulatory function within NCP for its power sector was dropped after the failure of the Kingtom plant in September 2006.
Indicator 3 : Establishment of the National Energy Policy and Planning Unit and its operationalization
Value (quantitative or Qualitative)
n/a
Establishment of the National Energy Policy and Planning Unit and its operationalization
Partially achieved
Date achieved 07/01/2004 12/06/2010 03/31/2011 Comments (incl. % achievement)
An Energy Policy and Planning Unit within MoEP was established, however the unit did not perform to expected standard.
Indicator 4 : Implementation of a management contract with a private firm for NPA
Value (quantitative or Qualitative)
n/a
Implementation of a management contract with a private firm for NPA
Not achieved
Date achieved 07/01/2004 12/06/2010 03/31/2011 Comments (incl. % achievement)
The implementation of a management contract with a private firm for NPA was dropped after the failure of the Kingtom plant in September 2006. Funds for this activity were reallocated to emergency power generation.
Indicator 5 : 85% of energy sales are collected (excluding arrears) Value (quantitative or Qualitative)
70% 85% of energy sales are collected (excluding arrears)
No data
Date achieved 07/01/2004 12/06/2010 03/31/2011 Comments (incl. % achievement)
By project closing, improvement of NPA's collection rates and reduction of non-technical system losses were beginning to show some improvement as a result of new operating procedures instituted by the NPA consultant.
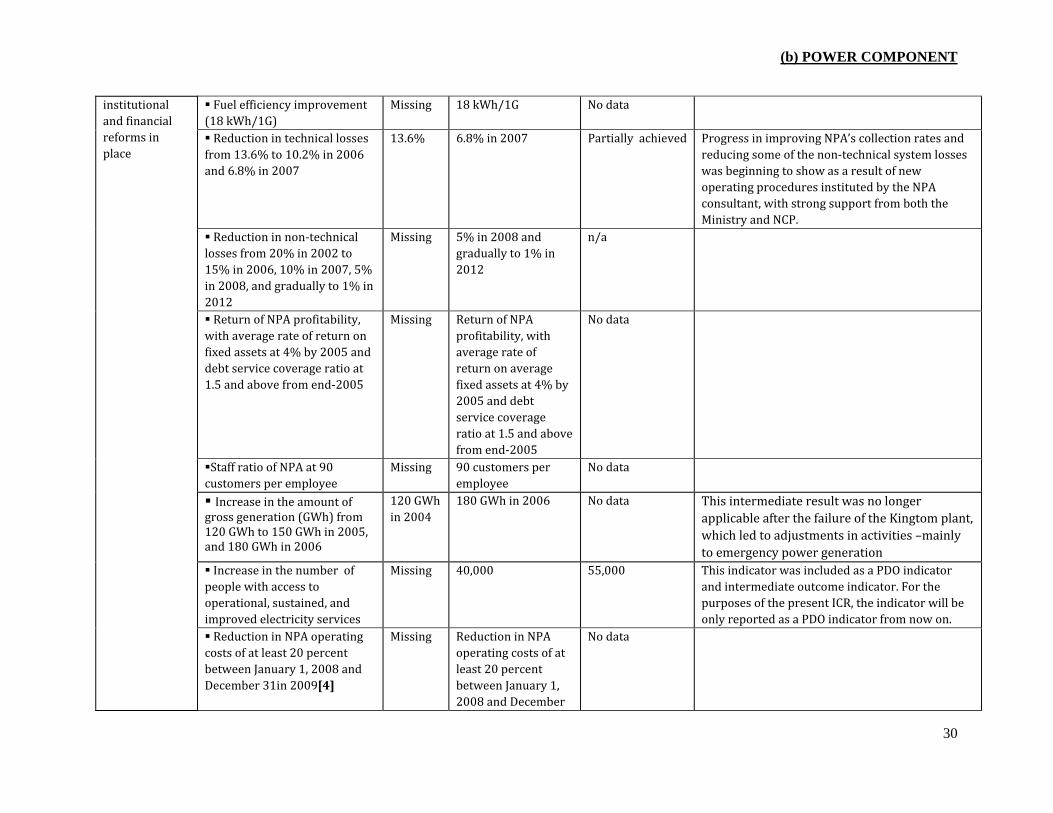
Indicator 6 : Fuel efficiency improvement (18 kWh/1G) Value (quantitative
Missing 18 kWh/1G No data
viii
or Qualitative) Date achieved 07/01/2004 12/06/2010 03/31/2011 Comments (incl. % achievement)
Indicator 7 : Reduction in technical losses from 13.6% to 10.2% in 2006 and 6.8% in 2007 Value (quantitative or Qualitative)
13.6% 6.8% in 2007 Partially achieved
Date achieved 07/01/2004 12/06/2010 03/31/2011 Comments (incl. % achievement)
Progress in improving NPA's collection rates and reducing some of the non-technical system losses was beginning to show as a result of new operating procedures instituted by the NPA consultant, with strong support from both the Ministry and NCP.
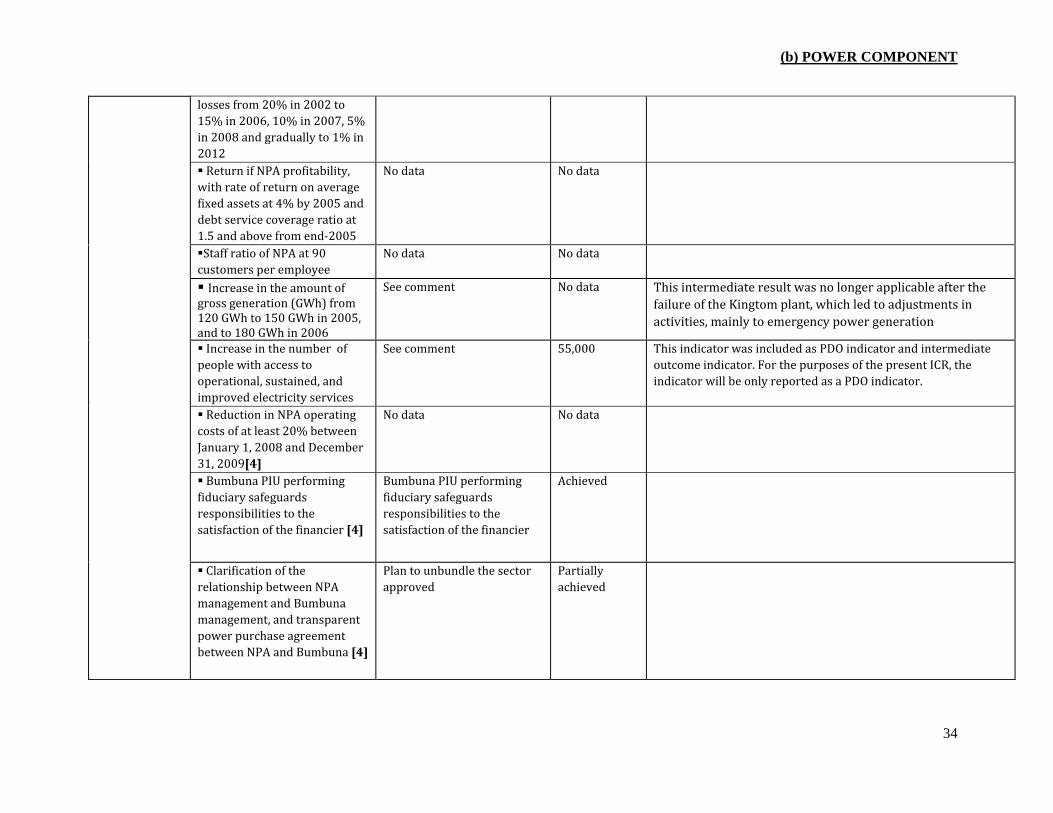
Indicator 8 : Reduction in non-technical losses from 20% in 2002 to 15% in 2006, 10% in 2007, 5% in 2008, and gradually to 1% in 2012
Value (quantitative or Qualitative)
Missing 5% in 2008 and gradually to 1% in 2012
n/a
Date achieved 07/01/2004 12/06/2010 03/31/2011 Comments (incl. % achievement)
Indicator 9 : Return of NPA profitability, with average rate of return on fixed assets at 4% by 2005 and debt service coverage ratio at 1.5 and above from end-2005
Value (quantitative or Qualitative)
Missing
Return of NPA profitability, with average rate of return on average fixed assets at 4% by 2005 and debt service coverage ratio at 1.5 and above from end-2005
No data
Date achieved 07/01/2004 12/06/2010 03/31/2011 Comments (incl. % achievement)
Indicator 10 : Staff ratio of NPA at 90 customers per employee Value (quantitative or Qualitative)
Missing 90 customers per employee
No data
Date achieved 07/01/2004 12/06/2010 03/31/2011 Comments (incl. % achievement)
Indicator 11 : Increase in the amount of gross generation (GWh) from 120 GWh to 150 GWh in 2005, and 180 GWh in 2006
Value (quantitative or Qualitative)
120 GWh in 2004 180 GWh in 2006 No data
Date achieved 07/01/2004 12/06/2010 03/31/2011 Comments (incl. %
This intermediate result was no longer applicable after the failure of the Kingtom plant, which led to adjustments in activities, mainly to emergency power generation.
ix
achievement) Indicator 12 : Increase in the number of people with access to operational, sustained, and improved electricity servicesValue (quantitative or Qualitative)
Missing 40,000 55,000
Date achieved 07/01/2004 12/06/2010 03/31/2011 Comments (incl. % achievement)
This indicator was included as a PDO indicator and intermediate outcome indicator. For the purposes of the present ICR, the indicator will be only reported as a PDO indicator from now on.
Indicator 13 : Reduction in NPA operating costs of at least 20 percent between January 1, 2008 and December 31in 2009
Value (quantitative or Qualitative)
Missing
Reduction in NPA operating costs of at least 20 percent between January 1, 2008 and December 31 in 2009
No data
Date achieved 07/01/2004 12/06/2010 03/31/2011 Comments (incl. % achievement)
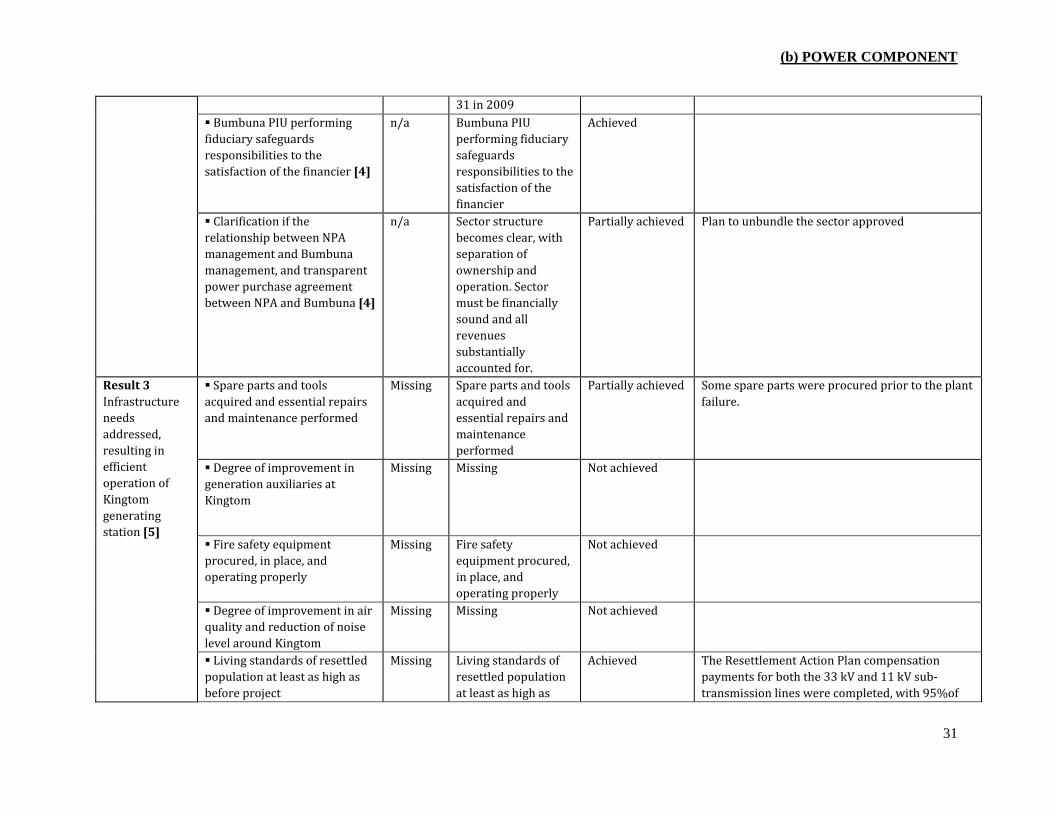
Indicator 14 : Bumbuna PIU performing fiduciary safeguards responsibilities to the satisfaction of the financier
Value (quantitative or Qualitative)
n/a
Bumbuna PIU performing fiduciary safeguards responsibilities to the satisfaction of the financier
Achieved
Date achieved 07/01/2004 12/06/2010 03/31/2011 Comments (incl. % achievement)
Not included in the PAD; Included here to reflect the adjustment of activities after the reallocation of funds to emergency power generation.
Indicator 15 : Clarification if the relationship between NPA management and Bumbuna management, and transparent power purchase agreement between NPA and Bumbuna
Value (quantitative or Qualitative)
n/a
Sector structure becomes clear, with separation of ownership and operation. Sector must be financially sound and all revenues substantially accounted for.
Partially achieved
Date achieved 07/01/2004 12/06/2010 03/31/2011
Comments (incl. % achievement)
Not included in the PAD; Included here to reflect the adjustment of activities after the reallocation of funds to emergency power generation. Plan to unbundle the sector approved
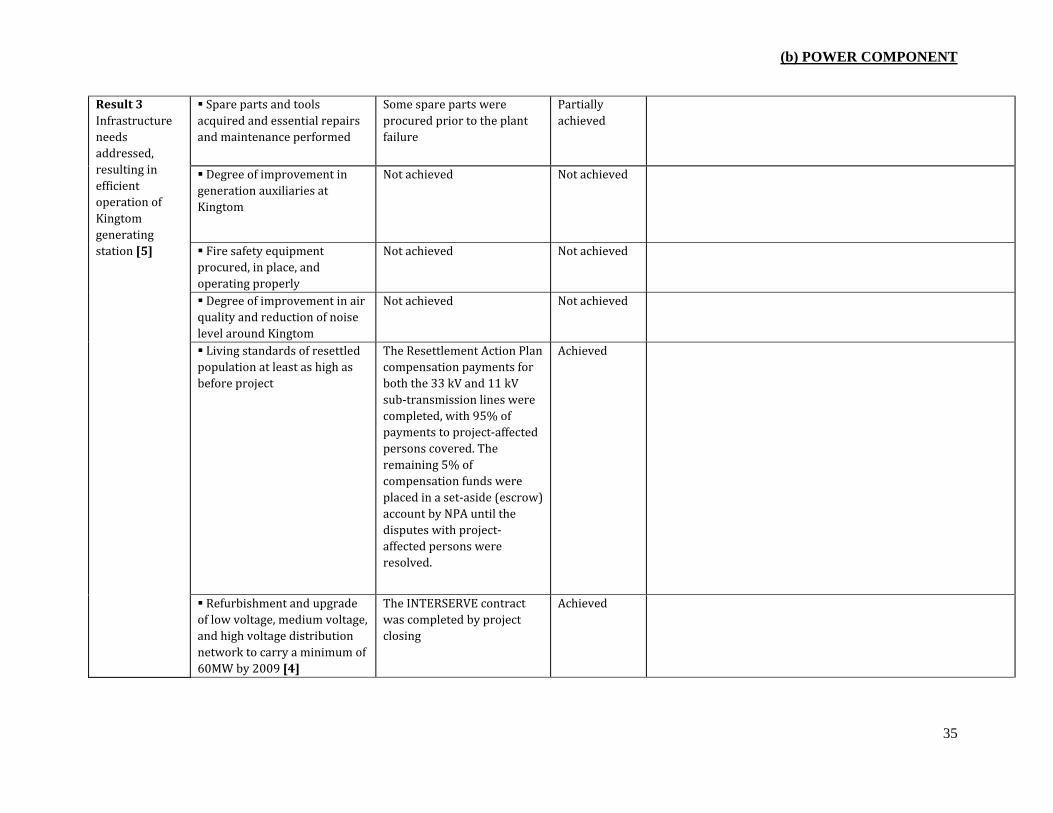
Indicator 16 : Spare parts and tools acquired and essential repairs and maintenance performed
Value (quantitative or Qualitative)
Missing
Spare parts and tools acquired and essential repairs and maintenance
Partially achieved
x
performed Date achieved 07/01/2004 12/06/2010 03/31/2011 Comments (incl. % achievement)
Some spare parts were procured prior to the plant failure.
Indicator 17 : Degree of improvement in generation auxiliaries at Kingtom Value (quantitative or Qualitative)
Missing Missing Not achieved
Date achieved 07/01/2004 12/06/2010 03/31/2011 Comments (incl. % achievement)
Indicator 18 : Fire safety equipment procured, in place, and operating properly Value (quantitative or Qualitative)
Missing Fire safety equipment procured, in place, and operating properly
Not achieved
Date achieved 07/01/2004 12/06/2010 03/31/2011 Comments (incl. % achievement)
Indicator 19 : Degree of improvement in air quality and reduction of noise level around Kingtom Value (quantitative or Qualitative)
Missing Missing Not achieved
Date achieved 07/01/2004 12/06/2010 03/31/2011 Comments (incl. % achievement)
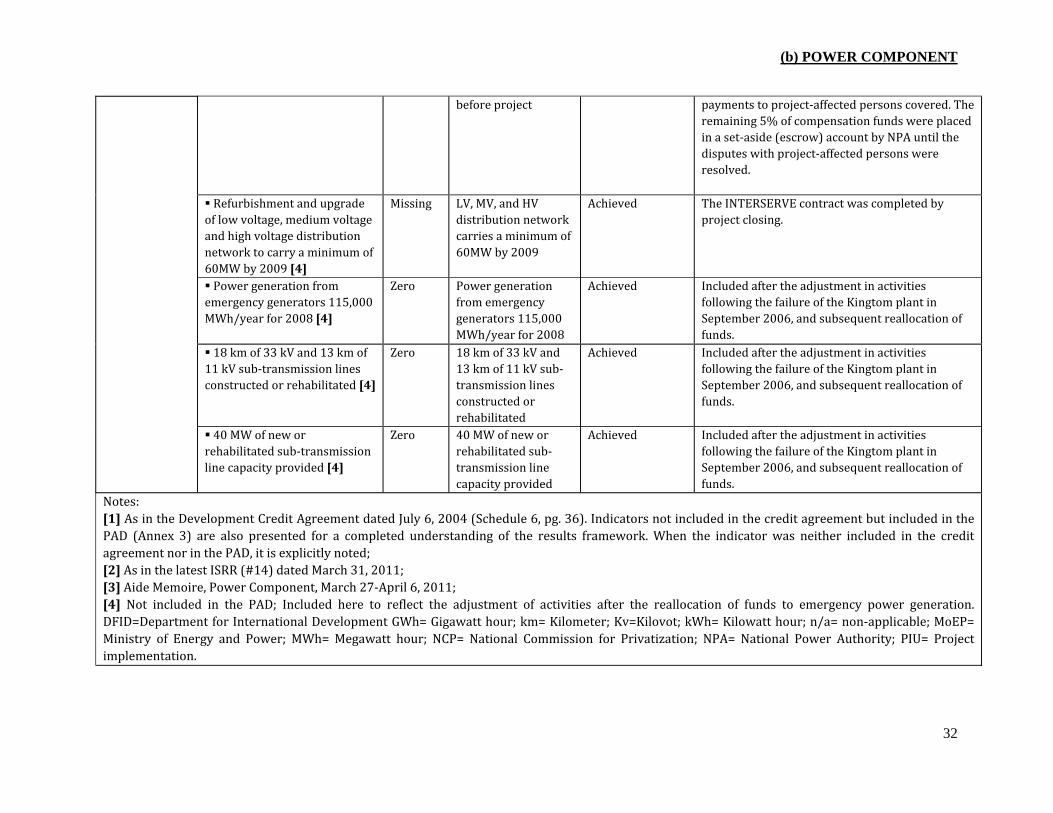
Indicator 20 : Living standards of resettled population at least as high as before project
Value (quantitative or Qualitative)
Missing
Living standards of resettled population at least as high as before project
Achieved
Date achieved 07/01/2004 12/06/2010 03/31/2011 Comments (incl. % achievement)
The Resettlement Action Plan compensation payments for both the 33 kV and 11 kV sub-transmission lines were completed, with 95% of payments to project-affected persons covered. The remaining 5% of compensation funds were placed in an escrow account by NPA
Indicator 21 : Refurbishment and upgrade of low voltage, medium voltage and high voltage distribution network to carry a minimum of 60MW by 2009
Value (quantitative or Qualitative)
Missing
LV, MV, and HV distribution network carries a minimum of 60MW by 2009
Achieved
Date achieved 07/01/2004 12/06/2010 03/31/2011
Comments (incl. % achievement)
Not included in the PAD; Included here to reflect the adjustment of activities after the reallocation of funds to emergency power generation. The INTERSERVE contract was completed by project closing.
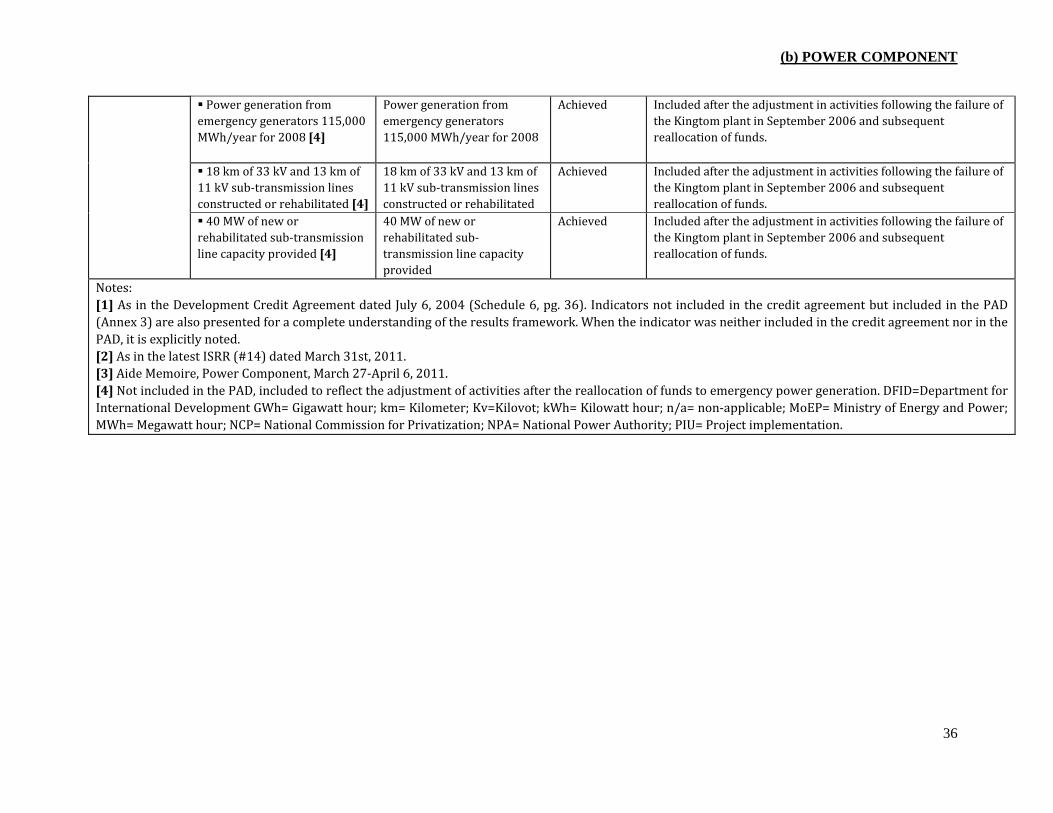
Indicator 22 : Power generation from emergency generators 115,000 MWh/year for 2008 Value (quantitative
0 Power generation from emergency
Achieved
xi
or Qualitative) generators 115,000 MWh/year for 2008
Date achieved 07/01/2004 12/06/2010 03/31/2011 Comments (incl. % achievement)
Included after the adjustment in activities following the failure of the Kingtom plant in September 2006, and subsequent reallocation of funds.
Indicator 23 : 18 km of 33 kV and 13 km of 11 kV sub-transmission lines constructed or rehabilitated
Value (quantitative or Qualitative)
0
18 km of 33 kV and 13 km of 11 kV sub-transmission lines constructed or rehabilitated
Achieved
Date achieved 07/01/2004 12/06/2010 03/31/2011 Comments (incl. % achievement)
Included after the adjustment in activities following the failure of the Kingtom plant in September 2006, and subsequent reallocation of funds.
Indicator 24 : 40 MW of new or rehabilitated sub-transmission line capacity provided
Value (quantitative or Qualitative)
0
40 MW of new or rehabilitated sub-transmission line capacity provided
Achieved
Date achieved 07/01/2004 12/06/2010 03/31/2011 Comments (incl. % achievement)
Included after the adjustment in activities following the failure of the Kingtom plant in September 2006, and subsequent reallocation of funds.
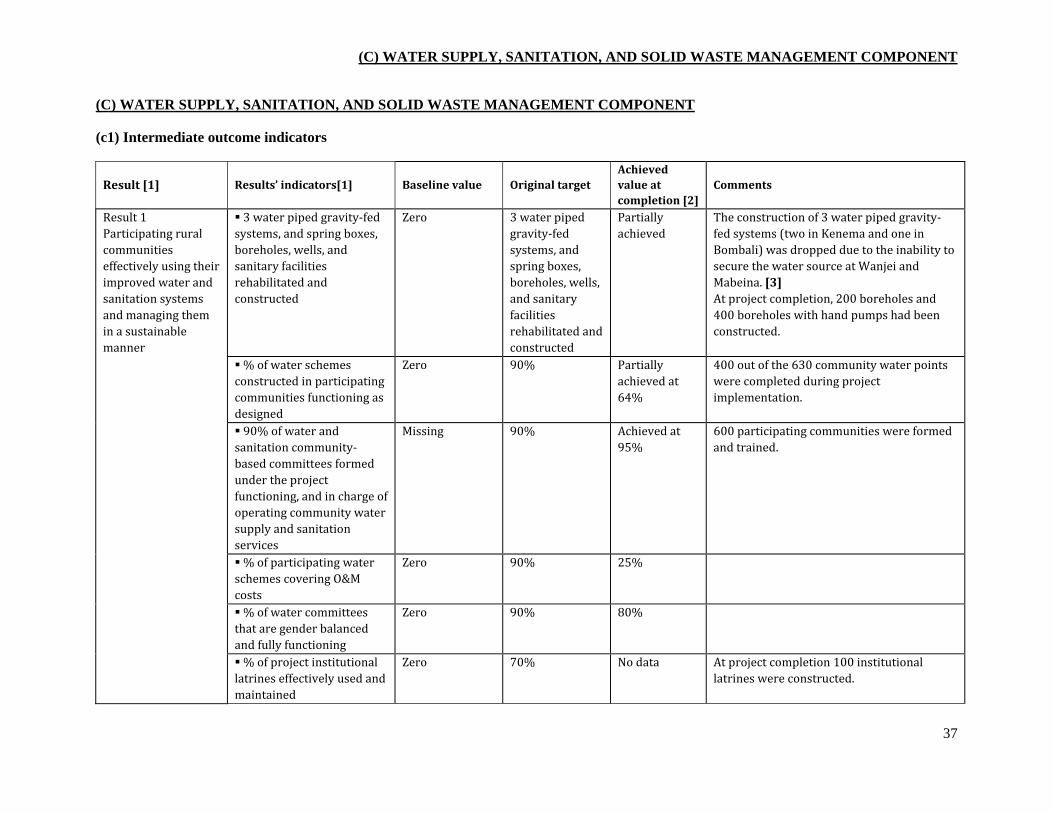
Indicator 25 : 3 water piped gravity-fed systems, and spring boxes, boreholes, wells, and sanitary facilities rehabilitated and constructed
Value (quantitative or Qualitative)
0
3 water piped gravity-fed systems, and spring boxes, boreholes, wells, and sanitary facilities rehabilitated and constructed
Partially achieved
Date achieved 07/01/2004 12/06/2010 03/31/2011 Comments (incl. % achievement)
The construction of 3 water piped gravity-fed systems (two in Kenema and one in Bombali) was dropped due to the inability to secure the water source at Wanjei and Mabeina. At project completion, 200 boreholes and 400 boreholes with hand pumps constructed.
Indicator 26 : % of water schemes constructed in participating communities functioning as designed Value (quantitative or Qualitative)
0 90% Partially achieved at 64%
Date achieved 07/01/2004 12/06/2010 03/31/2011 Comments (incl. % achievement)
400 out of the 630 community water points were completed during project implementation.
Indicator 27 : 90% of water and sanitation community-based committees formed under the project functioning, and in charge of operating community water supply and sanitation services
Value (quantitative or Qualitative)
Missing 90% Achieved at 95%
Date achieved 07/01/2004 12/06/2010 03/31/2011 Comments 600 participating communities were formed and trained.
xii
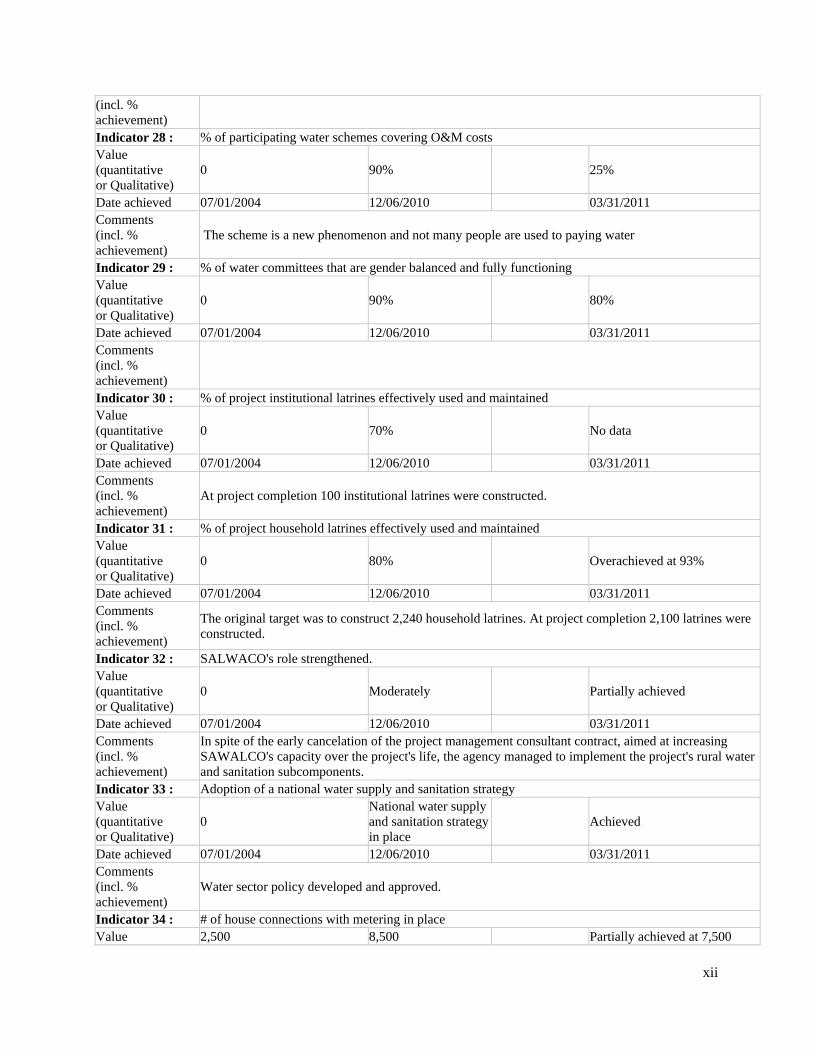
(incl. % achievement) Indicator 28 : % of participating water schemes covering O&M costs Value (quantitative or Qualitative)
0 90% 25%
Date achieved 07/01/2004 12/06/2010 03/31/2011 Comments (incl. % achievement)
The scheme is a new phenomenon and not many people are used to paying water
Indicator 29 : % of water committees that are gender balanced and fully functioning Value (quantitative or Qualitative)
0 90% 80%
Date achieved 07/01/2004 12/06/2010 03/31/2011 Comments (incl. % achievement)
Indicator 30 : % of project institutional latrines effectively used and maintained Value (quantitative or Qualitative)
0 70% No data
Date achieved 07/01/2004 12/06/2010 03/31/2011 Comments (incl. % achievement)
At project completion 100 institutional latrines were constructed.
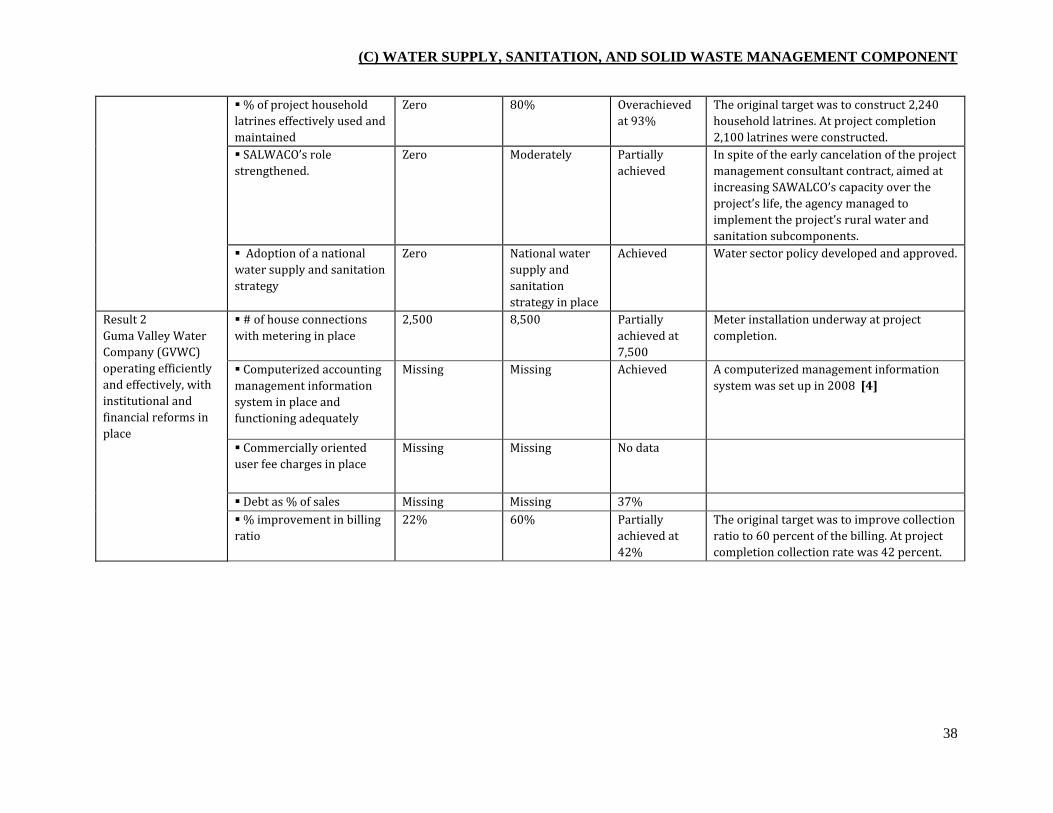
Indicator 31 : % of project household latrines effectively used and maintained Value (quantitative or Qualitative)
0 80% Overachieved at 93%
Date achieved 07/01/2004 12/06/2010 03/31/2011 Comments (incl. % achievement)
The original target was to construct 2,240 household latrines. At project completion 2,100 latrines were constructed.
Indicator 32 : SALWACO's role strengthened. Value (quantitative or Qualitative)
0 Moderately Partially achieved
Date achieved 07/01/2004 12/06/2010 03/31/2011 Comments (incl. % achievement)
In spite of the early cancelation of the project management consultant contract, aimed at increasing SAWALCO's capacity over the project's life, the agency managed to implement the project's rural water and sanitation subcomponents.
Indicator 33 : Adoption of a national water supply and sanitation strategy Value (quantitative or Qualitative)
0 National water supply and sanitation strategy in place
Achieved
Date achieved 07/01/2004 12/06/2010 03/31/2011 Comments (incl. % achievement)
Water sector policy developed and approved.
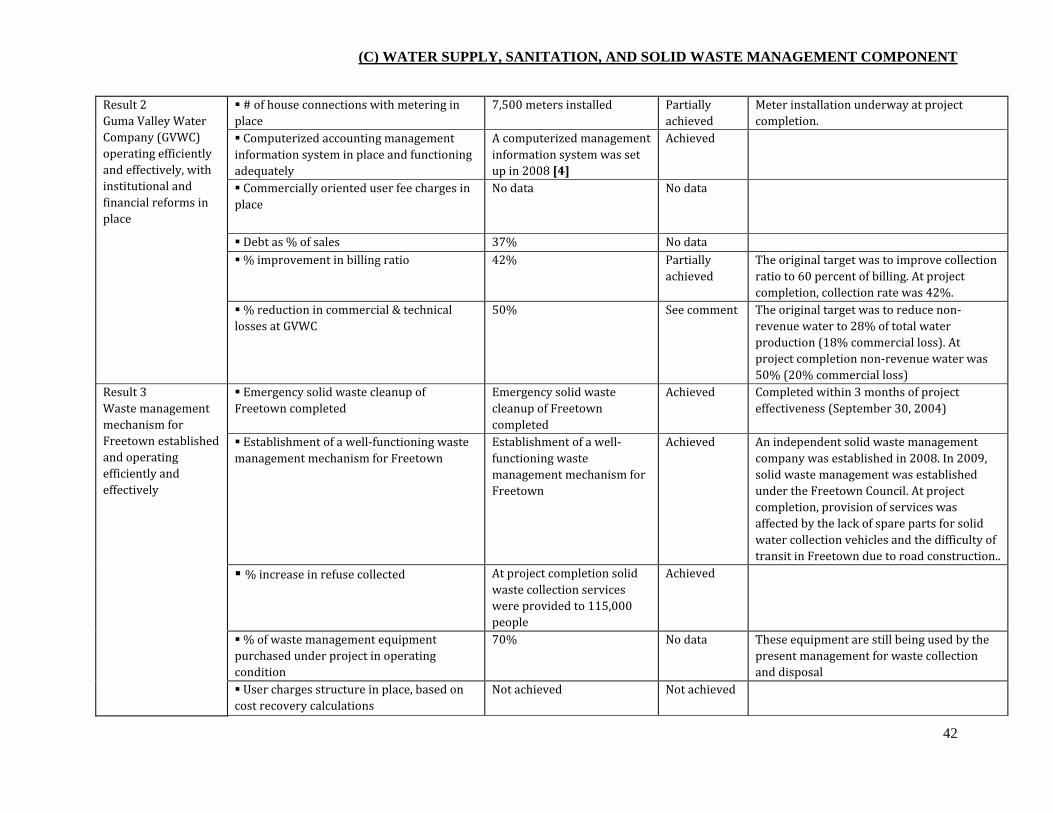
Indicator 34 : # of house connections with metering in place Value 2,500 8,500 Partially achieved at 7,500
xiii
(quantitative or Qualitative) Date achieved 07/01/2004 12/06/2010 03/31/2011 Comments (incl. % achievement)
Meter installation underway at project completion.
Indicator 35 : Computerized accounting management information system in place and functioning adequately Value (quantitative or Qualitative)
Missing Missing Achieved
Date achieved 07/01/2004 12/06/2010 03/31/2011 Comments (incl. % achievement)
A computerized management information system was set up in 2008.
Indicator 36 : Commercially oriented user fee charges in place Value (quantitative or Qualitative)
Missing Missing No data
Date achieved 07/01/2004 12/06/2010 03/31/2011 Comments (incl. % achievement)
Indicator 37 : Debt as % of sales Value (quantitative or Qualitative)
Missing Missing 37%
Date achieved 07/01/2004 12/06/2010 03/31/2011 Comments (incl. % achievement)
Indicator 38 : % improvement in billing ratio Value (quantitative or Qualitative)
22% 60% Partially achieved at 42%
Date achieved 07/01/2004 12/06/2010 03/31/2011 Comments (incl. % achievement)
The original target was to improve collection ratio to 60 percent of the billing. At project completion collection rate was 42 percent.
Indicator 39 : % reduction in commercial & technical losses of water production at GVWC Value (quantitative or Qualitative)
60% [30% commercial loss]
28% 50%
Date achieved 07/01/2004 12/06/2010 03/31/2011 Comments (incl. % achievement)
The original target was to reduce non-revenue water to 28 percent of the water production (18 percent commercial loss). At project completion, non-revenue water was 50 percent (20 percent commercial loss).
Indicator 40 : Emergency solid waste cleanup of Freetown completed Value (quantitative or Qualitative)
0 35% Achieved
Date achieved 07/01/2004 12/06/2010 03/31/2011 Comments Completed within the 3 months of project effectiveness (September 30, 2004).
xiv
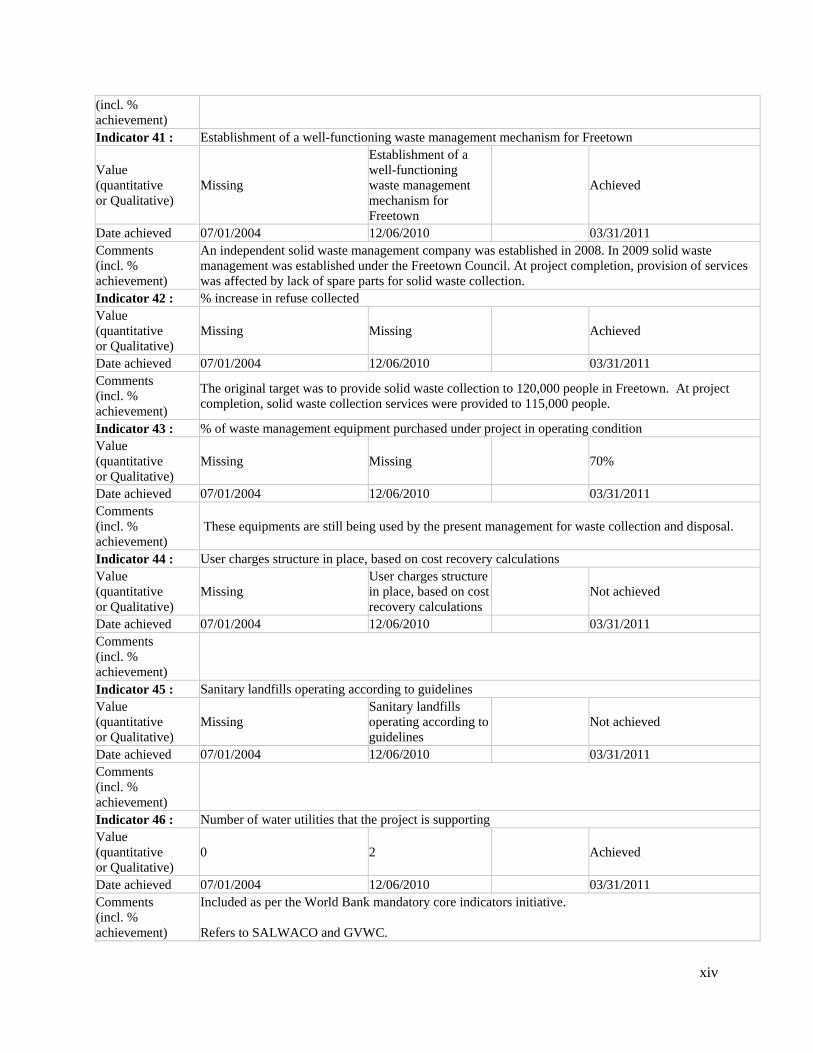
(incl. % achievement) Indicator 41 : Establishment of a well-functioning waste management mechanism for Freetown
Value (quantitative or Qualitative)
Missing
Establishment of a well-functioning waste management mechanism for Freetown
Achieved
Date achieved 07/01/2004 12/06/2010 03/31/2011 Comments (incl. % achievement)
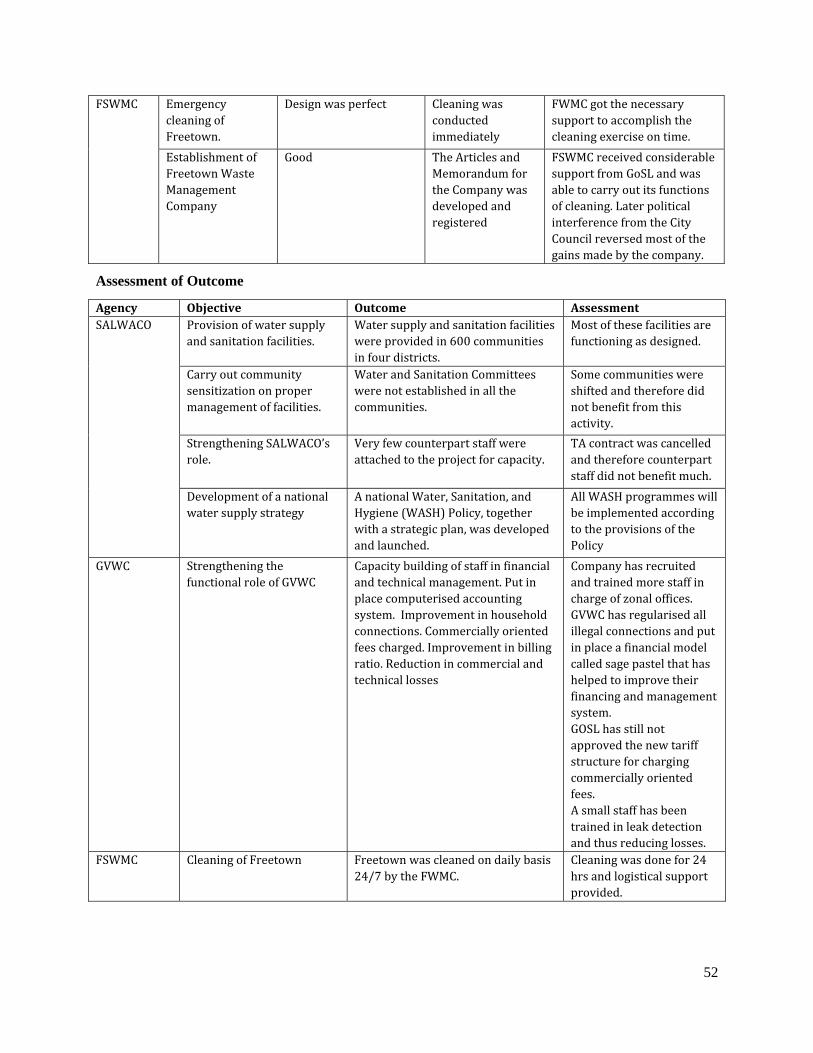
An independent solid waste management company was established in 2008. In 2009 solid waste management was established under the Freetown Council. At project completion, provision of services was affected by lack of spare parts for solid waste collection.
Indicator 42 : % increase in refuse collected Value (quantitative or Qualitative)
Missing Missing Achieved
Date achieved 07/01/2004 12/06/2010 03/31/2011 Comments (incl. % achievement)
The original target was to provide solid waste collection to 120,000 people in Freetown. At project completion, solid waste collection services were provided to 115,000 people.
Indicator 43 : % of waste management equipment purchased under project in operating condition Value (quantitative or Qualitative)
Missing Missing 70%
Date achieved 07/01/2004 12/06/2010 03/31/2011 Comments (incl. % achievement)
These equipments are still being used by the present management for waste collection and disposal.
Indicator 44 : User charges structure in place, based on cost recovery calculations Value (quantitative or Qualitative)
Missing User charges structure in place, based on cost recovery calculations
Not achieved
Date achieved 07/01/2004 12/06/2010 03/31/2011 Comments (incl. % achievement)
Indicator 45 : Sanitary landfills operating according to guidelines Value (quantitative or Qualitative)
Missing Sanitary landfills operating according to guidelines
Not achieved
Date achieved 07/01/2004 12/06/2010 03/31/2011 Comments (incl. % achievement)
Indicator 46 : Number of water utilities that the project is supporting Value (quantitative or Qualitative)
0 2 Achieved
Date achieved 07/01/2004 12/06/2010 03/31/2011 Comments (incl. % achievement)
Included as per the World Bank mandatory core indicators initiative. Refers to SALWACO and GVWC.
1. Project context, development objectives and design
1.1 Context at appraisal
1. During the civil war in Sierra Leone (1990-2001), the country’s physical infrastructure, particularly electricity, water and sanitation, suffered from widespread destruction and lack of maintenance. Projects under implementation, including a major hydropower development near the town of Bumbuna, were stopped and power sector assets fell into disrepair. The sparse coverage and unreliability of infrastructure services were recognized as major impediments to sustainable economic growth and poverty reduction. In parallel to the deterioration of infrastructure assets, the conflict took an enormous toll on the population. The 10 years of civil war resulted in 2 million of Sierra Leone's inhabitants rendered homeless, about 500,000 people driven into internal exile, and 20,000 deaths. Despite the significant gains made by the Government during the years following the end of the conflict, 70 percent of Sierra Leone's population lived on less than US$1 per day1.
2. The Power and Water Project intended to address prioritized issues across various infrastructure services (i.e. power, water supply, sanitation, and solid waste management), reflecting a comprehensive development approach.
3. Background of the power sector. After years of conflict, Sierra Leone’s power sector was in a critical stage as power infrastructure assets were dilapidated. The power system was characterized by low capacity and reliability, poor performance of the national utility, and underinvestment. The constrained interconnected power system in the Western Area of Sierra Leone was affected by massive daily blackouts. Whereas the installed generation capacity of the system was 27 MW, much of it was obsolete and available capacity declined to around 11 MW. This situation was a serious impediment to economic growth, particularly in the industrial and service sectors. The suppressed demand was estimated at about 29 GWh (or 35 percent of 2004 electricity supply) for the industrial sector, 9 GWh (or 11 percent of 2004 electricity supply) for the commercial sector, and 48 GWh (or 57 percent of 2004 electricity supply) for the domestic sector. Most of the population (79 percent) depended on kerosene as the main source of lighting, as only 16 percent had access to electricity2.
4. The cost of electricity was also a major issue. Sierra Leone was one of the countries in West Africa with some of the highest costs of electricity generation and delivery. Even with varying degrees of subsidies, these costs translated into relatively high tariffs compared to regional and global benchmarks. Together with unreliable service and poor quality of supply, these tariffs posed major competitive problems for commercial and industrial enterprises. The exploitation of Sierra Leone’s hydrological resources (such as Bumbuna) held the potential to reduce underlying weighted costs of supply to between US$0.13 and US$0.16 per kWh.
5. Given the institutional context and the weak capacity, improvement of the power sector performance was a major challenge. Even though sectoral planning and coordination was delegated to the Ministry of Energy and Power (MoEP), the sector lacked sufficient government oversight and policy
1 Government of Sierra Leone, November 2007. Sierra Leone Integrated Household Survey (SLIHS) 2003/04. Final Statistical Report. 2 Government of Sierra Leone, November 2007. Sierra Leone Integrated Household Survey (SLIHS) 2003/04. Final Statistical Report.
2
guidance. The National Power Authority (NPA) had the monopoly over power supply (including hydro), sub-transmission, and distribution. In addition, the NPA was responsible for operating the Western Area system (27.2 MW), including Freetown, and some of the main provincial centers. Local rural supply plants were operated by other Ministries, under NPA’s technical and logistical support. NPA had oversight responsibilities also for the Bo-Kenema Power System (9 MW). Associated with its inefficient management, NPA was unable to cover its cost, suffered from losses in excess of 30 percent of production, and had a poor billing and collection system in place.
6. A major part of the solution to the insufficient generation capacity included the Bumbuna Support Project (P086903), approved by the World Bank in 2005, a 50 MW hydropower facility located on the Seli River near the town of Bumbuna. Originally, the plant was expected to be commissioned in late 2006 and to start generating power in 2009. The power component of the Power and Water Project was designed to enhance Sierra Leone’s access to electrical power through a series of measures focused on improving NPA performance, in anticipation of the delivery of low-cost hydropower from the proposed Bumbuna hydroelectric plant.
7. Background of the water supply and sanitation sector. The lack of a comprehensive sectoral policy in the water supply and sanitation sector lead to large intervention gaps. The water supply and sanitation sector was overseen by the MoEP. In Freetown, services were provided by Guma Valley Water Company (GVWC) and in rural areas, by the Sierra Leone Water Company (SALWACO). There was no clear sector policy guidance provided by the Water Supply Division of the MoEP, nor was there clear division of responsibilities among the different actors in the sector. For instance, SALWACO simultaneously assumed the roles of policy provider and contract implementer. Also, there was a lack of efficient institutions in rural areas to provide systematic support to communities, and projects undertaken were not sustained.
8. Due to the lack of a clear institutional framework and a sectoral development strategy, development partners’ presence in the sector in Sierra Leone was limited, in particular to urban-oriented interventions. Under the Urban Water Supply Project (Cr. 2702-SL), implemented between April 1995 and December 2005, the World Bank focused in the urban water supply and sanitation sector, helping to expand the water production capacity in Freetown but with limited impact on the policy reforms needed to assure the commercial viability and sustainability of the facilities constructed. Also, the World Bank implemented emergency interventions targeting secondary cities3. Beside urban areas, several international and local NGOs were working in remote areas, in small-scale operations, rehabilitating and constructing water points and sanitary facilities.
9. The provision of water supply and its quality in urban and peri-urban areas was especially poor. In Freetown, GVWC provided an average daily output of 18 million gallons per day, against a daily estimated demand of 35 million gallons/day. Slum-dwellers and poor residents in Freetown relied on stand posts or unprotected wells with questionable water quality. In addition, water in Freetown was
3 The objectives of the Urban Water Supply Project (Cr. 2702-SL) were: (i) improve water supply and sanitation services in Freetown; (ii) make water supply and sanitation services more accessible to the urban poor; (iii) strengthen GVWC and other agencies involved in the water supply and sanitation sector; (iv) encourage private sector participation in the sector; and (v) assist in the preparation of water master plans and development programs for the major towns outside Freetown. In 2000, the project reallocated funds for emergency works throughout the country.
3
rationed and few customers had 24-hour supply. In peri-urban areas and densely populated poor urban areas, customers received supplies once a month or none at all. With rapid and uncoordinated expansion of urban settlements, more urban residents were likely to continue depending on vendors and tanker services, at costs far in excess of utility rates. The poor regularly paid US$0.03 to US$0.06 per bucket of water.
10. The absence of adequate intervention in rural areas led to low access to safe water supply and sanitation services, and to poor condition of infrastructure assets. Only around 30 percent of the rural population had access to safe drinking water supply from either water points, gravity-fed systems, spring boxes, or rain water harvesting, often unprotected and polluted. But even where a protected source existed, households used a combination of sources including streams and traditional wells for cooking, washing and bathing to meet their water needs. More than 60 percent of rural household had to walk more than 5 kilometers to reach the closest source of water4. Daily water consumption per capita was between 10 and 15 liters, below the basic requirements of 25 to 30 liters.
11. Access to safe sanitation was exceptionally poor at the time of appraisal. Around one in three rural dwellers practiced open defecation. Common pits were the prevalent form of sanitation in rural areas, with about 42 percent of the population using it as the main form of sanitation5.
12. Solid waste management in Freetown was a major problem, in particular due to institutional capacity constraints. Low service coverage of around 7 percent6of the urban population, substantial inefficiencies, low quality of service and labor productivity, and illegal dumping were the major difficulties in the sector. There was no billing system in place. Solid waste management responsibility was delegated to the Ministry of Youth and Sports (MoYS), which lacked institutional experience in waste management, equipment, and qualified manpower.
13. Government strategy. The project was aligned with key government strategies. Development of the power, rural water supply, and urban sanitation sectors were key elements in the country’s Interim Poverty Reduction Strategy Paper and the National Recovery Strategy. In these strategies, infrastructure and socials sectors were considered essential to revive the economy.
14. In line with the government strategies, the Power and Water Project provided funds for targeted critical investments aiming at establishing core infrastructure services that would contribute to poverty reduction and boost economic growth. In addition, it intended to support reforms in the power and water sectors.
15. Rationale for Bank assistance. The identification of the Power and Water Project grew out of sector-specific assessments of immediate and longer-term infrastructure needs as Sierra Leone was emerging from its post-conflict era. These assessments were based on experience generated by several Bank projects, notably the Power Rehabilitation Project (Cr. 2356-SL), the Freetown Infrastructure Rehabilitation Project (Cr. 2511-SL), and the Urban Water Supply Project (Cr. 2702-SL).
4 Government of Sierra Leone, November 2007. Sierra Leone Integrated Household Survey (SLIHS) 2003/04. Final Statistical Report. 5 Government of Sierra Leone, November 2007. Sierra Leone Integrated Household Survey (SLIHS) 2003/04. Final Statistical Report. 6 Government of Sierra Leone, November 2007. Sierra Leone Integrated Household Survey (SLIHS) 2003/04. Final Statistical Report.
4
16. Given the breadth of infrastructure requirements and limited available resources, strategic choices were made based on a broad overview of sector requirements and the commitments made by other development agencies. Important gaps in donor support were identified, with the aim of addressing immediate needs for power, rural water supply and sanitation, and urban solid waste management, while supporting longer term efforts to strengthen institutional capabilities and introduce policy reforms.
1.2 Original project development objective (PDO) and key indicators
17. The PDO was to improve sustainable access to essential power, rural water supply and sanitation, and urban solid waste management services. This objective would be achieved by:
Power. Supporting power sector reform, capacity building, and institutional strengthening; and maintaining the existing power generation capacity;
Rural water supply and sanitation. Construction and rehabilitation of three water piped gravity-fed systems and spring boxes; installing boreholes fitted with hand pumps and hand-dug wells; and building institutional and household latrines in rural areas;
Urban water supply. Promoting efficiency in urban water supply operations by strengthening GWVC’s capacity;
Solid waste management. Cleaning and improving the hygiene situation in Freetown in the short term; and, establishing a solid waste management company in Freetown.
18. Key outcome indicators selected for measuring and monitoring progress towards achieving the PDOs are presented in Table 1. The wording of these indicators was adjusted in line with the World Bank mandatory core indicators initiative.
Table 1. Key outcome indicators by component
Component Key outcome indicators [1]
A. Power # of people in urban areas provided with access to electricity under the project by household connections
B. Water supply, sanitation, and solid waste management
# of people in rural areas provided with access to improved water sources under the project
# of people in urban areas provided with access to improved water sources under the project
# of people in urban areas provided with access to regular solid waste collection under the project
# of people in urban areas provided with access to improved sanitation under the project
Note: [1] Wording of the PDO indicators was adjusted in line with the World Bank mandatory core indicators initiative. This did not affect the substance of the original PAD indicators.
1.3 Revised PDO and key indicators
19. The PDO was not revised as it remained relevant throughout the project implementation.
5
1.4 Main Beneficiaries
20. Power component. The project aimed at providing residents of Freetown with a more stable power supply and a sustainable platform to accommodate future power supplies7.
21. Water supply and sanitation component. In the rural water supply and sanitation subcomponent, the project aimed at providing rural residents in the districts of Bo, Kenema, Bombali, and Tonkolili with clean drinking water and adequate rural sanitation facilities, contributing to improved health. At appraisal, the population of the four districts was estimated at about 1.2 million, of which 0.7 million resided in villages.
22. In the urban water supply subcomponent, the project aimed at improving the quality of service provided by GVWC to Freetown’s water consumers.
23. In the solid waste management subcomponent, the project aimed at providing Freetown residents with a reliable, sustainable, affordable, socially acceptable, and environmentally safe solid waste collection and disposal system.
1.5 Original components
24. The project included two major components related to the power sector and the water supply, sanitation, and waste management sectors, as presented in Table 2.
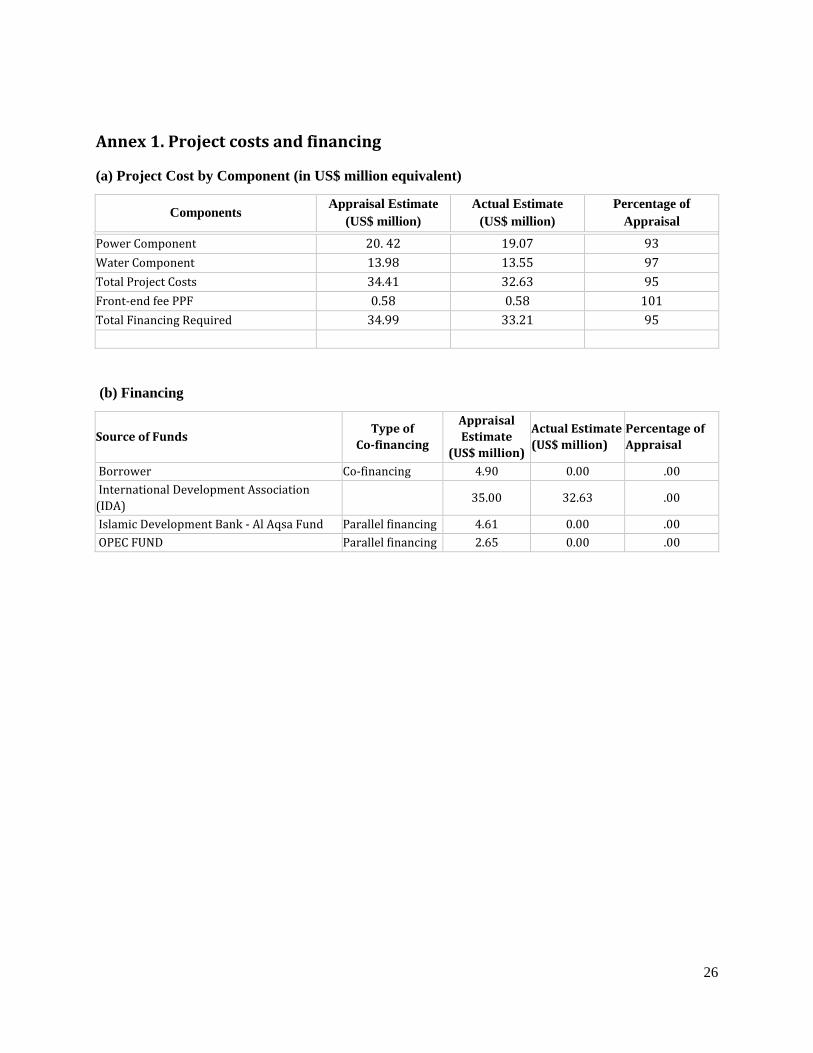
Table 2. Project’s components and subcomponent, with funding (US$ million)
Component IDA Cofinanciers
Subcomponent IDA Cofinanciers
[1] Total
A: Power
$19.50 (plus $0.5 PPF Advance)
$14.16
A.1 Power sector reform $7.86 $0.14 $8.00 A.2 Capacity building and institutional strengthening/training
$2.33 $11.78 $14.11
A.3 Infrastructure $6.10 $0 $6.10 A.4 Social impact and environmental mitigation measures
$2.37 $1.64 $4.01
A.5. Project management and supervision for the infrastructure
$0.84 $ 0.60 $1.44
B: Water supply, sanitation, and solid waste management
$14.70 (plus $0.3 PPF Advance
$0.27
B.1 Rural community water supply and sanitation
$9.03 $0.33 $9.36
B.2 Freetown solid waste management ($2.80M for IDA)
$2.80 $0 $2.80
B.3 Urban water supply $2.87 $0 $2.87 Notes: [1] OPEC, Islamic Development Bank, BADEA and DFID Figures expressed in million; IDA= International Development Association; FSWMC=Freetown Solid Waste Management Company; GVWC= Guma Valley Water Company; kV=Kilovolt; NCP= National Commission for Privatization; NPA= National Power Authority; PIU= Project Implementation Unit; PPF= Project Preparation Facility.
7 Including the 50 MW Bumbuna hydroelectric project, expected to be commissioned in late 2006 and completed in 2009.
6
1.6 Revised components
25. Power component. Originally, IDA funds were dedicated to support the Sierra Leone power sector reform, build and strengthen NPA’s capacity, and maintain and rehabilitate the existing generation capacity. However due to the advanced age (more than 30 years old) and deterioration of the equipment, in September 2006 the heavy fuel oil generators at the Kingtom plant failed. This situation left Sierra Leone with virtually no available capacity on the NPA national grid. The Government requested the reallocation of funds to emergency power generation (15MW for 2008) until power from the Bumbuna hydropower plan would become available. Therefore, the Development Credit Agreement was amended to reflect these changes (December 2007)8, which did not affect the PDO.
26. Funds originally planned to finance the management contract for the NPA9 were reallocated to emergency power generation to meet a portion of the cost of an independent power producer (IPP)10. The Government provided the remaining funds for the IPP and entered into a power purchasing agreement with the provider. In addition, International Development Association (IDA) funds were used to rehabilitate sub-transmission and distribution lines11 to allow for the distribution of power generated by the Bumbuna plant after its completion. Therefore, the implementation of the four-year management contract was dropped, with the expectation that the United Kingdom Department for International Development (DFID) would finance this activity.
27. Similarly, some of the activities under the power sector reform subcomponent were dropped to concentrate efforts on building the essential blocks of the power sector (i.e. reestablishment of generation, improvement of NPA, and delivery of upcoming power from the Bumbuna plant) after the collapse of the Kingtom plant. The activities dropped include the creation of a regulatory function for the power sector within NCP.
28. The adjustment in activities and subsequent reallocation of project funds led to amendments in the intermediate results indicators for the power component. Since formal project restructuring did not take place, intermediate outcome indicators were not formally revised. A detailed description of the intermediate indicators that were dropped and included after the reallocation of funds to power emergency generation is presented in Table b1, under section F.
8 According to the Amendment to the Development Credit Agreement (dated December 11, 2007), the words “Maintenance of the Borrower's existing power generation capacity through:" in Part A.3 of Schedule 2 to the Agreement are deleted, and a new paragraph (h) is added to said Part A.3 to read as follows: "(h) Provision of temporary leased power generation equipment at Kingtom until the Borrower has access to alternative sources of power supply”. 9 According to the Annex 4a of the PAD, regarding the implementation of a four-year management contract for NPA, the project “will finance the participation of the private sector in the power sector in Sierra Leone, through a performance based management contract for a period of four years at a cost estimated to be about US$5.0 million. The contract would be the result of a two-phase competitive process, wherein several pre-qualified bidders (Phase I) would submit offers to manage NPA to achieve a number of predetermined performance indicators. The process of selecting a management firm will be monitored through the National Commission for Privatization (NCP), which is empowered by GoSL to oversee the privatization of state-owned enterprises”. 10 The intermediate outcome indicator included in the ISRR’s to track progress on this activity was “Power generation from emergency generators 115,000 MWh/year for 2008”. 11 The intermediate outcome indicators included in the ISRRs to track progress on this activity were “18 kilometers of 33 kV and 13 kilometers of 11 kV sub-transmission lines constructed or rehabilitated” and “40 MW of new or rehabilitated sub-transmission line capacity provided”.
7
29. Water supply, sanitation and solid waste management component. Under the rural water supply subcomponent, the three planned gravity-fed systems were not built due to the inability to secure the water source at Wanjei and Mabeina. Therefore, access to rural water supply was provided only through wells and boreholes.
1.7 Other significant changes
30. Closing date. The Closing Date was extended 12 months from March 31, 2010 to March 31, 2011 to allow additional time for completion of works on the low voltage distribution network and completion of the implementation of the Resettlement Action Plan (RAP).
31. Co-financing from government sources. In the original Development Credit Agreement, dated July 6, 2004, it was established that IDA funds would finance 90 percent of some operating costs and local expenditures of the power and water components, and that parallel financing would finance the remaining 10 percent. Later on, the Government requested 100 percent of IDA funding for the mentioned items, which was adjusted in the Amendments to the Development Credit Agreement dated December 11, 2007 and May 9, 2008.
32. Counterpart funding from the OPEC fund. Counterpart funding for the power component provisioned in the original project design from the OPEC fund did not materialized. Consequently, the acquisition of spare parts and tools and essential repairs at the Kingtom plant was dropped, as this activities was to be financed by the OPEC fund 12.
33. Counterpart funding from the Islamic Development Bank. Counterpart funding for the power component provisioned in the original project design from the Islamic Development Bank (Al Aqsa Fund) did not materialized. Consequently, the rehabilitation and reinforcement of the low voltage network, the construction of two customers’ service centers, and the acquisition of prepaid meters were dropped, as these activities were to be financed by the Islamic Development Bank 13.
34. Counterpart funding from DFID (water component). The grant (TF091108) for the project became effective on November 29, 2007 with an original approved amount of GBP 4,116,000 (US$8,517,683 equivalent). The objective of the grant was to support a leak detection program and emergency repairs of pipes, sub-transmission line at water treatment plant, and distribution networks in three pilot areas in Freetown. It also financed technical assistance and capacity building to strengthen the institutional and financial capacity of GVWC to enhance the operational performance of the water utility. Due to the exchange rate deterioration between GDP and US$, the available grant fund was decreased to US$6,569,341 equivalent, resulting in a loss of about US$2 million. Accordingly, the project had to adjust planned procurement and expenditure.
12 See details in PAD Annex 4a (Detailed Project Description). 13 See details in PAD Annex 4a (Detailed Project Description).
8
2. Key factors affecting implementation and outcomes
2.1 Project preparation, design, and quality at entry
35. Project preparation. A qualified team with the required skills was in charge of project preparation, and an adequate monitoring system and related tools were established. Financial and economic analyses were conducted using tools already in place in other operations. Safeguards issues were properly covered.
36. However, rapid project preparation compromised the project’s quality at entry. Preparation took place in a rather short time (six months). This hindered proper identification of baseline indicators for most intermediate outcomes and compromised the adequacy of the participatory process. Further consultations with the GoSL and the power utility may have ensured better buy-in and commitment for the realization of the NPA management contract.
37. With regard to the power component, some elements of the project’s design were overly ambitious given the state of the power sector14 and Sierra Leone’s post-conflict environment. The project aimed at introducing a comprehensive power sector reform, including the establishment of a four-year management contract for NPA, as well as substantially improving the operational and financial performance of the utility. In light of the lack of sectoral planning, policy oversight, and meager managerial capacity at NPA, there appears to be a disconnect between the project design and actual capacity of the power component implementation agencies (MoEP, NCP, and NPA).
38. With regard to the water component, building on lessons learned from previous operations,15 the project’s design provided arrangements to deal with the weak capacity of the implementation agencies (SALWACO, GVWC, and MoYS). The design recognized the need to address SALWACO’s weak technical and financial management capacity, and included project management consultants in charge of the implementation process, who would work closely with SALWACO to build its capacity over the life of the project16. Similarly, the design recognized the need to establish sound institutional arrangements in the urban water supply sector and to strengthen GVWC’s managerial capacity, which would be addressed by hiring an external consulting firm17. For the provision of solid waste management, the project envisaged establishing an independent solid waste management company with legal and technical expertise. This model of service provision has worked successfully in other countries in Africa and was sought to be replicated in Freetown18.
39. The project provided for the establishment of two Project Implementation Units (PIU). The PIU at NPA, responsible for most activities encompassing infrastructure development, capacity building, and training and capacity building, was to be staffed with a project coordinator, a financial management
14 Refer to section 1.1. Context at appraisal. 15 These included, among others, the Urban Water Supply Project (Cr. 2428-SL) and the Power Rehabilitation Project (cr.2356-SL), both with overall unsatisfactory ICR ratings. 16 To ensure compliance the project introduced a disbursement condition as follows: “SALWACO project management consultancy firm contract signed”. 17 To ensure compliance the project introduced a disbursement condition as follows: “signature of contract with reform consultant with GVWC, sis months from credit effectiveness”. 18 To ensure compliance the project introduced a disbursement condition as follows: “establishment of FSWMC satisfactory to IDA, 18 months from credit effectiveness”.
9
specialist, a power sector technical expert, an environmental specialist, and a social specialist. The PIU housed at SALWACO19 was to be responsible for the rural water supply and sanitation, urban water supply, and Freetown solid waste management subcomponent, and implemented by a management consultant firm recruited internationally on a competitive basis. However, the management consultant contract was cancelled and the PIU at SAWALCO was left understaffed with only a project coordinator and accountant20.
40. The design of a multi-sector project was aligned with guidance presented in the Transition Support Strategy that provides for concentrating engagements and limiting demands on scarce government capacity. This has, however, added to the complexity of project implementation.
41. Risks and their mitigation. The project’s major risks and measures for their mitigation were correctly identified at project preparation, as depicted in Table 3.
Table 3. Risks to PDO and proposed mitigation measures Risk Mitigation measure Low commitment from GoSL to the project and sector reforms
New letters of sector policy received for the power and water sectors. For the water sector, LG election and institutions in place. Disbursement conditionality for the solid waste management and urban water supply subcomponents.
Complex and multi‐sectoral operation
Intense supervision missions will be required and undertaken throughout project duration due to its complex nature.
Government counter‐funding does not materialize
The issue is beyond the direct influence of the project team and needs to be addressed at the country level.
Unavailability of spare parts at SALWACO due to inadequate delivery system
Limiting the number o f types o f pumps and organization o f a spare parts depot ensuring a supply chain in the regions/districts.
Sustainability of rural water sector investments through water tariffs may not materialize
Cost recovery through community contributions will be sought and practiced. Nevertheless, the limited experience with such a practice in Sierra Leone leaves us to evaluate this risk as significant.
Upon completion, communities do not maintain and sustain the facilities constructed
Pump repairmen and caretakers to be trained at the community level.
Note: GoSL= Government of Sierra Leone; SALWACO= Sierra Leone Water Corporation
42. During project implementation nearly all the above listed risks to the PDO materialized. While adequate mitigation measures were identified during project design, implementation difficulties did not allow proper mitigation of some of these risks (see sections 2.2 and 5 below).
43. Adequacy of participatory process. Adequate consultations with stakeholders did not take place due preparation timeframe. Intended beneficiary communities under the rural water sub-component were also not consulted. Consultations were rolled into project implementation instead.
19 The Bank team and the Borrower agreed on relocating the PIU office from the premises of SALWACO to the main office of the MoEP. Aide Memoire- water component, October 21-30, 2007. 20 It lacked staff on procurement and monitoring and enforcement.
10
2.2 Implementation
44. Project restructuring. Formal restructuring of the project was proposed in 2007 but it was never formalized. The restructuring was expected to reflect changes in the project activities of the power component as well as key indicators. Reallocation of funds was instead approved in 2007 to allow the funding of the emergency power generation. Restructuring was again planned to take place shortly after extension of the closing date from March 31, 2010 to March 31, 2011, in order to formalize the changes in the intermediate indicators. However, following extension of the closing date, the Government announced that the works would be completed by July 2010. Hence, project restructuring did not take place due to the expected imminent works completion and the proximity of the closing date.
45. Quality Assessment of Lending Portfolio (QALP) by Quality Assurance Group. The QALP assessment in November 2008 considered that the likelihood of PDO achievement (at that time) moderately unlikely. It was found that the water supply, sanitation, and solid waste management development objectives were likely to achieve as they were progressing reasonably well. However, the QALP considered that the power development objective was unlikely to be achieved given the delays in project implementation. It also acknowledged that restructuring of the project was being considered by the time of the assessment.
46. Midterm Term Review (MTR) for the power component. The MTR for the power component was combined with the MTR of the Bumbuna Support Project (P086903) and conducted on February 4- 26, 2009. The recommendations following the review included: (i) strengthen implementation arrangements of the NPA to bring in line with the previous missions’ set of agreed actions for operational efficiency and transparency; (ii) resolve a number of “fiduciary lapses,” including weak recording of procurement contracts and inadequate contracts management; (iii) carry out agreed contracts, following competitive procurement for the rehabilitation the transmission line network in Freetown; and (iv) complete the transmission network routing in order to finalize the scope of resettlement and updating of the 2006 RAP.
47. MTR for the water supply and sanitation component. During the MTR for the water supply and sanitation component of the project held in October 200821, the Bank team recommended, among others actions, that:
GVWC prepare standard utility performance indicators in key operational areas, which was done by the utility with values for base year (2004) and targets (2008 to 2011). These indicators needed to be monitored regularly to assess GVWC’s operational performance;
The GVWC’s Board of Directors start playing a more active role by providing closer and effective monitoring against agreed performance targets;
SALWACO hire consultants for civil works supervision, and initiated the process of awarding contracts for the supply of hand pumps for hand-dug wells.
21 It was originally planned to take place in 2008. However, the government requested rescheduling it to allow the then-newly-recruited management at SAWALCO and FSWMC to recruit key personnel and implement key priority actions agreed with the Bank in the November 2007 and February 2008 missions.
11
Environmental specialist should improve the design of the screening checklist to ensure that they can capture the complexity of problems in the field and adequately monitor environmental issues during construction.
48. Factors that contributed to successful implementation. Among other factors:
Flexibility during implementation. The rapid response was essential to deal with the power crisis created after the failure of the Kingtom plant in September 2006. Generation capacity was not only reestablished, but exceeded the initial generation capacity by project closing.
The project continued with the work initiated by DFID of providing financial assistance for commercial and financial managers within NPA. This technical assistance (TA) initiated some limited improvement in billing and revenue collection.
49. Factors that gave rise to problems in implementation, power component. Among other factors:
Lack of commitment within Government to undertake deep reforms in the sector. In 2007, prior to the failure of the generation units at Kingtom, legal covenants were not complied with, and there was no serious effort to improve the operational and financial performance of the utility.
Lack of commitment within Government to pursue the management contract for NPA. None of the commercial or technical parameters for the NPA envisaged under a management contract could be achieved.
Following the failure of the power station, the lack of sufficient generation capacity made it impossible for the Client to meet the project’s financial covenants.
Following the failure at Kingtom plant, the emergency requirements to provide power to Freetown necessitated reallocation of funds and prioritization of activities. Some initially planned activities had to be dropped in full to free financing.
Co-financing funds were not provided, which placed further burden on the IDA resources.
The PIU at the NPA was fired by the line Ministry in 2008 due to disputes related to procurement, after which the PIU function was assumed by the General Manager of NPA and an accountant. The Bank’s recommendations to supplement capacity were not acted on, leading to weak implementation arrangements.
50. Factors that gave rise to problems in implementation, water supply, and sanitation component. Among other factors:
Disagreement within Government as to which agency should have overall responsibility for solid waste management caused significant delays and hampered project implementation.
Significant delays were created by disagreements over contractual responsibilities between SALWALCO’s and the project management consultants hired to implement the project’s rural water supply and sanitation subcomponent.
12
2.3 Monitoring and Evaluation (M&E) design, implementation and utilization
51. M&E Design. Adequate indicators were identified to monitor progress toward project development objectives. Also, key performance indicators were put in place to monitor NPA22 and GVWC23 operational and financial performance, in addition to physical indicators to track project implementation. At approval, several baseline data and target values were missing, in particular for intermediate outcome indicators related to the power component. The project design provided for hiring a consultant to assist the NPA’s PIU and NCP to produce baseline data and target values. Progress data was expected to emerge from the various executing agencies and reported to the Bank.
52. Due to weak country capacity for M&E, the project design provided for M&E to be performed by consultants. Under the power component, consultants were recruited to assist NPA’s PIU and SALWACO’s PIU, strengthening their capacity for M&E of project results. M&E reports were to be prepared on a monthly basis for the first year, and on a yearly basis thereafter. Results were to be discussed at annual stakeholder workshops.
53. M&E implementation. The PDO indicators were updated in line with the Bank’s mandatory core indicators initiative, and progress was tracked over the life of the project. However, several intermediate outcome indicators included in the PAD and Credit Agreement were not included in the Implementation and Status Results Reports (ISRR), blurring the tracking of project progress. In addition, the rearrangement of activities under the power component was not adequately reflected in the M&E framework, in particular in the ISRRs.
54. In addition, several monitoring and regulatory tools were not fully put in place and were affected by regular delays. In the 2008 MTR, the Bank team recommended that GVWC prepare standard utility indicators in key operational areas. Accordingly, GVWC prepared a list of performance indicators, with base-line values (2004) and targets for November 2008.
55. The project hired an M&E local consultant to assist SALWACO to develop the M&E framework and was asked to follow up with the monitoring of the works. This gave a clearer understanding on project implementation development.
2.4 Safeguard and fiduciary compliance
56. Environmental and social safeguards. The project triggered OP4.01 (Environmental Assessment) and OP4.12 (Involuntary Resettlement) and was classified as Category B. These policies were applicable to activities detailed in Table 4. Quality of implementation of activities in compliance
22 Operational performance: energy generated in kWh; station use in kWh; energy sold in kWh; commercial losses (%); sales billed (in kWh); revenues collected ; revenues to billed (%); total debtors ; debtors expressed as months of sales (months of sales); cost of sales ; cost of sales per kWh; generated ; cost of sales per kWh sold (Le/kWh); marine fuel oil used (kg); DFO used (kg); lubricant used (kg); kWh generated lubricant (kWWkg); number of workforce including contractors; number of customers; and number of customers per employee. Financial performance: rate of return on average fixed assets in operation; debt service coverage ratio; return on equity; net profit margin; revenue/sales ratio; gross operating margin; debt to equity ratio; collection ratio; and debtor/sales ratio. 23 Number of house connection with metering in place; computerized accounting/ MIS system in place and functioning adequately; commercially oriented fee user charges in place; debt as % of sales; % of improvement in billing ratio, and % reduction in commercial and technical losses.
13
with these policies was rated moderately satisfactory in the last ISRR (March 2011) for overall safeguards compliance.
Table 4. Activities subject to safeguards policies and documents prepared Component Subcomponent Documents prepared Power Infrastructure ‐ EIA of the Kingtom power station in Freetown [1]
‐ EIA and EMP for the 33 kV sub‐transmission line network in Freetown [1] ‐ RAP for the 33 kV and 11 kV sub‐transmission lines [2]
Water supply, sanitation and solid waste management
Rural water supply and sanitation Urban water supply Solid waste management
‐ ESMF for guidance on safeguards requirements for potential water and sanitation sub‐projects [2] ‐ EIA and EMP for boreholes, pumping stations, storage tanks, and communal water points [2] ‐ Impacts covered possible wastewater contamination from muddy pathways and standing pools and solid waste management in Freetown and vicinity [2]
Notes: [1] Prepared and disclosed in‐country and in the World Bank’s InfoShop in March 2004; [2] Prepared and disclosed in‐country and in the World Bank’s InfoShop in April 2004. EIA=Environmental Impact Assessment; EMP=Environment Management Plan; ESMF=Environmental and Social Management Framework; kV= Kilovolt; RAP=Resettlement Action Plan
57. Environmental Impact Assessment (EIA) for the Kingtom power station in Freetown. The EIA was carried out and an environmental audit was done in June 2008, which also covered associated ancillary facilities in Power Plant I, and the Japan International Cooperation Agency (JICA) projects for power generators and a sub-station. The audit assessed that progress encompassed mitigation measures for preventing further environmental damage from potential oil spills, including potential spills from the 15 MW oil-fired emergency power generation plant. After the failure of the Kingtom plant in September 2006, the implementation of environmental mitigation measures in Kingtom was discontinued by NPA. This failure to complete the environmental clean-up measures and the postponement of GoSL to undertake repairs in the sub-station were the major reasons for downgrading the progress in implementation of the EIA to moderately satisfactory in the latest ISRR (March 2011).
58. EIA and Environmental Management Plan (EMP) for the 33 kV sub-transmission line network in Freetown. The activities recommended in the EIA and later included in the EMP –with specific mitigation measures– were reviewed in June 2008. The review found implementation to be satisfactory and recommended removal of the structures threatening human health and sub-transmission line security. These structures were removed in a satisfactory manner in connection with proper disposal of materials. The only structure that posed a significant environmental damage was a gas station at the end of the 11 kV sub-transmission line, but since the project was not funding this segment of the sub-transmission line network, the EMP guidelines would apply to future possible project interventions for rehabilitating this line. As the recommended actions were completed, the implementation progress rating of the EIA and EMP was satisfactory.
59. Resettlement Action Plan (RAP) for the 33 kV and 11 sub-transmission lines. The RAP was updated in 2006 to correspond with changes in the sub-transmission line routing and clearance limits. Due to delays in construction, the RAP was updated a second time in November 2009 to take into account changes in tower locations and other technical adjustments, which in turn increased the number of
14
project-affected persons. Additionally, in January 2010, the GoSL and NPA requested the inclusion of the 11 kV sub-transmission line in the RAP, focusing on the critical structures along the existing line. The RAP compensation payments for both the 33 kV and 11 kV sub-transmission lines were completed, with 95 percent of payments to project-affected persons covered. The remaining 5 percent of compensation funds were placed in a set-aside (escrow) account by NPA until the disputes with project-affected persons were resolved. The RAP Completion Report was submitted by the local consultant and NPA in August 2011. Due to the extensive consultations, including during each update of the RAP, and the comprehensive livelihood restoration programs that were developed in a highly participatory manner24 the RAP implementation rating was highly satisfactory.
60. Environmental and Social Management Framework (ESMF) for guidance on safeguards requirements for potential water and sanitation sub-projects. The ESMF served as a functional tool for developing more detailed environment and social mitigation measures for identified sub-projects. However, the ESMF for the solid waste component was prepared only after the mid-term review (i.e. after the emergency clean-up had taken place). Nonetheless, it allowed some mitigation measures to be undertaken.
61. Resettlement Policy Framework (RPF) for boreholes, pumping stations, storage tanks, and communal water points. A RPF was completed to address potential problems arising from construction of these facilities. These potentially infringed upon owned or leased property resulting in potential temporary or permanent loss of land, crops, and other physical assets. RPF and RAP implementation progress is rated satisfactory.
62. In terms of the institutional set-up within the ministry for overall environmental management of water and sanitation projects, compliance by GoSL was inconsistent to be deemed sustainable over the long-term. For example, prior to 2008 there was no environmental specialist on the government side. While this changed in 2008 and compliance improved after an environmental specialist was assigned to SALWACO, mitigation measures were not always included in the bidding documents, which was a major shortcoming throughout implementation.
63. Procurement performance was rated moderately satisfactory in the latest ISRR (March 2011). Procurement was guided by the IDA Guidelines and provisions of the Sierra Leone Public Procurement Act. Various reviews by the Bank confirmed compliance with the provisions of the Project Agreement. In particular:
Power component. A review of NPA’s files in February 2009 found no procurement issues with respect to the Interserve contract or the contract for emergency generation. However, this component was significantly impacted by NPA's delay in timely processing of contractors’ invoices. In particular, the completion of the 33 kV line was delayed due to delays in payments to Interserve.
Water supply and sanitation component. No significant procurement issues were found with the implementation of the water supply and sanitation component. Procurement for the component was carried out by three agencies: GVWC, SALWACO, and FWMC.
24Three stakeholder committees were set up at the inter-ministerial, inter-community, and project-affected persons levels
15
64. Financial Management (FM) was rated moderately satisfactory in the latest ISRR (March 2011). Whereas the FM arrangements and systems at entry were assessed as satisfactory and adequate with agreed FM actions and met the World Bank's FM requirements, during implementation the project faced some FM challenges. These included delays in submission of the financial reports (Audited Financial Statements and Interim Financial Reports) for most part of the project implementation. This was resolved by giving repeated reminders of the submission deadlines by the Bank, follow-up meetings, which led to submission of the various reports albeit substantially delayed. For instance, NPA did not comply with its obligation to submit annual financial statements for 2009 and 2010. The observed weaknesses in the FM arrangements were improved by regular supervision FM implementation support missions and regular communication of review comments of the financial reports to the project team. Processing of withdrawal applications for project expenditures were not without challenges, in particular in terms of providing accurate documentation and correct payment information.
2.5 Postcompletion operation and next phase
65. Following the closure of the present project, a new engagement is planned in the power sector funded from the Sierra Leone Infrastructure Development Fund established in 2010. The follow-up engagement aims at continuing the implementation of the reform program to increase access to power and enhance NPA’s financial and operation performance. It will build on initiated reforms and include:
A study for an integrated resources plan for service expansion, taking into consideration physical, technical, commercial, operational, environmental and social aspects
A study of NPA’s costs and how these reflect in a cost-effective tariff
A pre-feasibility study of hydropower potential for increased capacity
Rural electrification studies
A new commercial information system (billing and collection)
Further upgrade of the distribution system
Installation of pre-paid meters
66. Contingent on the adoption of institutional reforms, a new operation consisting on building and rehabilitating transmission and distributional lines is likely to be funded with IDA funds.
3. Assessment of outcomes
3.1 Relevance of objectives, design and implementation
67. The PDO was relevant for Sierra Leone as its objectives, design and implementation arrangements were consistent with the country’s circumstances: constrained power generation and distribution capacity; limited access to water supply and sanitation in rural areas; limited performance of the urban water supply utility; and poor solid waste management collection.
68. The project objective was consistent with the country’s primary priorities, including the improvement of sustainable essential power, rural water supply and sanitation access, and provision of urban solid waste management services. In particular, the project aimed to address critical bottlenecks
16
through physical investment, institutional reforms, and capacity building. The project objective was also in line with the Interim Poverty Reduction Strategy Paper and the National Recovery Strategy. The continued relevance of the project’s objective is highlighted by the fact that the Government is currently preparing a follow-up operation for the power sector to further the reforms and investments initiated under the Power and Water Project.
69. Original project design was adjusted during implementation to keep objectives fully relevant. At project approval, the design of the power component was ambitious in terms of the intended comprehensive regulatory reform, including a management contract for NPA Given the post-conflict environment of Sierra Leone and the weak capacity of the implementation agencies. However, the activities under the power component were adjusted in view of the power crisis generated by the failure of the Kingtom plant, rendering the project relevant to the country’s priorities and demonstrating its ability to respond to changing needs.
70. Implementation arrangements were relevant in view of the weak capacity of the implementation agencies. These arrangements included the establishment of PIUs at NPA and SALWACO25 (see section 2.1). However, during the first years of project implementation, understaffing of the PIUs was one of the factors that gave rise to delays in procurement of contracts and completion and supervision of civil works. Once the PIUs were staffed, the project started to fully take off as demonstrated by the increasing rate of disbursement (see section I) and the achievement of the access targets.
3.2 Achievement of PDO
71. The progress towards achievement of the PDO is rated as moderately satisfactory as evidenced by the achievement of the key outcome indicators (Table 5). However, the rating is below satisfactory as the project made moderate progress towards the sustainability of access to services26. Further detail on the achievement of each of the elements of the PDO is provided below.
Table 5. Achievement of PDO
Outcome indicator[1] Target [2] Achieved value at completion[3]
#of people in rural areas provided with access to improved water sources under the project
150,000
167,000
#of people in urban areas provided with access to improved water sources under the project
25,000
#of people in urban areas provided with access to regular solid waste collection under the project
n/a 115,000
#of people in urban areas provided with access to improved sanitation under the project
n/a 110,000
#of people in urban areas provided with access to electricity under the project by household connections
40,000 55,000
Notes: [1] Wording of the PDO indicators was adjusted in line with the World Bank mandatory core indicators initiative. This did not affect the substance of the original PAD indicators; [2] As in the PAD dated July 1st, 2004; [3] As in the latest ISRR (#14) dated March 31st, 2011. Refer to table a) under section F for further details. n/a= not applicable
25 Originally housed at SALWACO but intended to serve as the PIU for the totality of the water supply, sanitation and solid waste management component. 26 Power, rural water supply and sanitation, urban water supply and solid waste management
17
72. Power component. The project exceeded its objective of providing access to power to 40,000 customers by providing access to about 55,000 customers. As explained in section 1.6, the failure of the Kingtom plant in September 2006 led to the reallocation of funds to emergency power generation and rehabilitation of transmission lines. Then the project sustainability focus changed from originally planned as a consequence of the rearrangement of activities to be carried under the power component. Originally, sustainability would have been achieved by establishing a comprehensive sectoral reform and strengthening NPA operational and financial performance. After the reallocation of funds, sustainability would have been achieved by reestablishing the capacity of the system to generate and transmit energy under regular circumstances after the end of the provision of emergency generation, and enhancing sector capacity towards better service provision. The project was able to establish the necessary infrastructure (i.e. rehabilitation of the 33 KV sub-transmission lines and 11 KV lines) to transmit energy from Bumbuna plant, securing energy provision to Freetown inhabitants after the power emergency generation is complete. These were major achievements given the fragile state of the sector. In addition, as a result of the project, NPA’s capacity was strengthened. The provided technical assistance paved the way for longer term reforms under pipeline operations.
73. Increase in the amount of power generation. The project responded adequately to an emergency situation and funded critical needs, including power generation (lease and fuel for an IPP) and rehabilitation of the sub-transmission and distribution lines, which allow power supply to reach the customer. With assistance under the project, 15 MW were produced following the emergency IPP.
74. Rehabilitation of the distribution and sub-transmission lines. During implementation, rehabilitation works were identified as a critical priority to deliver power from the Kingtom and Bumbuna plants27. Funds were reallocated to the rehabilitation of the 33 KV sub-transmission lines and 11 KV lines. Whereas the 33 KV sub-transmission lines were completed by project end, a small portion of the 11 KV was not finalized, though the Government proposed to complete it using own funds.
75. Power sector reform. The scope of the power sector reform changed after the failure of the Kingtom plant. In view of the emergency situation, it was considered that project efforts should respond to the power crisis, given the low feasibility of a comprehensive power sector reform under those circumstances. Nevertheless, some important institutional reforms towards a comprehensive sector reform took place, such as the elimination of NPA’s monopoly, thus allowing more entities to enter the sector, and the revision of NPA Act.
76. Water supply and sanitation component. The project achieved its objective of increasing access to rural water supply and sanitation services, urban water supply, and solid waste collection services (see Table 5). In addition, progress towards the sustainability of access to these services was achieved.
77. Rural water supply and sanitation. The number of people in rural areas provided with access to improved water sources under the project increased by 167,000, exceeding the original target of 150,000 people. This was the result of constructing 200 boreholes fitted with hand pumps and 400 hands dug wells, and the installation of 300 hand pumps. In addition, the project provided 110,000 people with access to improved sanitation. Throughout the project 100 institutional latrines – in schools, hospitals and markets - were constructed, along with the completion of 2,100 household latrines. Originally the project anticipated that hiring project management consultants would contribute to strengthening SALWACO’s
27 Initial project design envisaged limited funds (US$1.5M) for rehabilitation of the network.
18
capacity, but due to regular disagreements on interpretation of the contractual responsibilities, the contract was cancelled, factor that affected progress implementation. But SALWACO’s made significant adjustments in its implementation approach followed the termination of the contract that allowed it to deliver, showing signs of strengthened technical capacity and contributing to the sustainability of access to rural water supply and sanitation. In addition, the project contributed to building local community capacity by providing training on water supply and sanitation to about 600 water and sanitation committees.
78. Urban water supply. 25,000 people were provided with access to improved water in urban areas. Sustainability would be achieved by strengthening the institutional framework and GWVC’s operational and financial performance, and improving the overall capability of Freetown’s water system28. The technical assistance provided under the project successfully completed key activities necessary to strengthen GVWC’s capacity, such as (i) adoption of a corporate development plan that serves the blueprint for commercial development and improving operational performance, and (ii) restructuring of the water company by unbundling centralized operations to adopt a commercially-oriented structure. Whereas improvement of GWVC’s performance targets were not achieved, some progress was made to reduce technical losses and improve the collection ratio (see Table b2 under section F). In addition, the overall capability of Freetown’s water system was improved, demonstrated by increased capacity and installation of 7,500 meters. This progress, in conjunction with the development and adoption of a water sector policy, increases the likelihood that access to urban water services will be sustained over time.
79. Freetown solid waste management. 115,000 people were provided with access to solid waste collection and removal. In addition, emergency clean-up in Freetown took place within the first three months of project effectiveness, removing hundreds of tones of accumulated waste. Within one year of being established in 2008, the Freetown Solid Waste Management Company (FSWMC) was regularly collecting and disposing of solid waste in Freetown. In parallel, it started charging solid waste fees and placed itself on a path of sustainability. The quantity of waste collected and deposited at the two landfills increased from about 3,000 tons in February 2008, to 27,000 in October 2008, to 35,000 in March 2009. At project closing there was still debate within the Government over the supervisory responsibility over the service provider. In 2010, this led to placement of responsibility for FSWMC under the Freetown City Council (FCC).
3.3 Efficiency
80. The ex-post assessment of the project’s economic efficiency reveals that the EIRR was substantially higher than the opportunity cost of capital for each of the components, and thus the project achieved important efficiency gains. These estimates are based on conservative assumptions and do not take into consideration numerous benefits for which estimation was not possible due to data constraints. The estimated included in the PAD are not comparable to those estimated ex-post the scope of the activities or the valuation method is different.
81. Power component. The ex-post analysis of the economic impact of power infrastructure investments considers the economic efficiency of: (i) investments in the provision of emergency power
28 The project design provided for funding of emergency works in the eastern part of Freetown to improve service delivery and installing meters.
19
generation capacity after the failure of the Kingtom plant; and, (ii) investments in the transmission and distribution infrastructure to allow for distribution of power generated at the Bumbuna plant. These results are not comparable with those presented in the PAD as those refer to the economic analysis of power sector reforms, strengthening of NPA operational and financial performance, and rehabilitation and maintenance of the Kingtom plant.
82. The ex-post assessment of the project’s economic efficiency uses the Economic Internal Rate of Return (EIRR) approach, which estimates the economic efficiency of the project by comparing the present value of the project’s costs and benefits streams with and without the project.
83. The ex-post analysis concludes that the EIRR of the power component is 26 percent, based on rather conservative assumptions. This estimate excludes many socioeconomic dimensions of the project benefits that are difficult to quantify in monetary terms because of their nature or for which there is not data available. This EIRR exceeds an assumed opportunity cost of capital of 10 percent, cost that is expected for this kind of projects. The present values of the net benefit streams over the project’s time horizon is US$13.8 million, assuming opportunity cost of capital equal to 10 percent. Further details are provided in Annex 3.
84. Water supply and sanitation component. The ex-post analysis of the economic impact of rural water supply investments considers the economic efficiency of investments in wells and boreholes, which benefited 167,000 people with improved access to water supply. These estimates are not comparable with those presented in the PAD as those referred to the provision of rural water supply by gravity-fed systems and wells and boreholes, and do not consider time savings.
85. Similarly to the analysis made for the power component, the ex-post assessment of the project’s economic efficiency uses an EIRR approach, building on the stream of benefits of time savings associated with collecting water and the stream capital, operational, maintenance, and commercial costs.
86. The ex-post analysis concludes that the EIRR of the rural water supply subcomponent is 17 percent, based on rather conservative assumptions. This EIRR exceeds an assumed opportunity cost of capital of 10 percent, cost that is expected for this kind of projects. The present values of the net benefit streams over the project’s time horizon is US$9.8 million, assuming opportunity cost of capital equal to 10 percent. Further details are provided in Annex 3.
87. Numerous benefits were not included in the above calculation. The provision of access to improved water supply and sanitation is expected to reduce the incidence of water-borne and water-washed diseases in Sierra Leone. One set of benefits related to the health impacts are the cost-offsets (i.e. costs avoided due to less illness). Cost savings in health care are mainly due to the reduced number of treatments of diarrheal cases. Also, patients avoid costs incurred by seeking treatment, including expenditures on care, drugs and transport and the opportunity costs of time spent on seeking care. Another set of benefits related to less illness are the avoided days lost, with respect to formal or informal employment, other productive activities in the household, or school attendance. They are traditionally split into two main types: gains related to lower morbidity and gains related to less death. Finally, one of the major benefits of improving access to water and sanitation derives from the time savings associated with closer location of the facilities. Time savings occur due to the installation of water points closer to rural communities, and closer access to latrines. They translate into increased production, higher school attendance – in particular, due to the installation of latrines in schools achieved by the project – and more
20
leisure time. Due to the lack of baseline and progress data an estimation of these benefits was not attempted.
88. In addition, about 115,000 people were provided with access to regular solid waste collection under the project, generating economic benefits from improved sanitary and environmental conditions for the population leading to reduced exposure to disease. Clearing waste from communities will contribute toward the preservation of existing urban infrastructure by preventing flooding of roads, houses and other infrastructure in low lying areas. An estimation of these general benefits was not attempted due to the lack of reliable baseline data and difficulties in estimating the value of benefits associated with spill-over effects, including a drastic reduction in filth, odor, rodents and flies. For the same reason the financial benefits were equally difficult to calculate.
3.4 Justification of overall outcome rating
89. The overall outcome is rated moderately satisfactory for several reasons: (i) the project objective was relevant; (ii) it achieved its stated development objective of providing access to power, water supply and sanitation, and urban solid waste management services as demonstrated by the achievement of the targets in access; and (iii) there were important efficiency gains derived from investments made under the power and water components. However, the rating is less than satisfactory as the project made moderate progress towards the sustainability of access to services
90. The overall outcome rating is aligned with the PDO and implementation progress ratings included in the latest ISRR (#14, dated March 26 2011), both moderately satisfactory. The PDO and implementation progress ratings ranged from unsatisfactory to satisfactory during the project’s life (see section G) reflecting some shortcomings in Bank’s and client’s performance (see Section 5 below).
3.5 Overarching themes, other outcomes and impacts
91. Institutional change and strengthening. The project intended to strengthen the capacity of the utilities in the power and water supply sectors. While technical assistance was provided for this purpose and the project made progress on improving the performance of the implementation agencies by project closing, the capacity of the utilities remained weak affecting the medium- and long-term sustainability of the achieved outcomes (see section 4).
92. NPA. The follow-up project in the power sector is expected to make further progress towards commercialization of the sector. While this project does not intend to support a management contract on the NPA, it is expected that improvements in the billing and collection and the subsequently enhanced revenues would place the utility on a path of sustainability. In addition, the expanded generation capacity and sub-transmission and distribution networks would allow providing power to more customers.
93. SALWACO. Its capacity was strengthened over the life of the project, as demonstrated by the completion of civil works that, in turn, translated into increased access to rural water supply and sanitation services. The agency was also able to recruit key technical staff. However, the agency still needs to improve its performance to be able to expand access to water supply and sanitation services to rural dwellers and to finance the associated costs.
94. GVWC. In spite of increases in collection ratio and reduction of non-revenue water, upon project closure there were important challenges facing GVWC. The utility stills need to enhance its operational
21
and financial performance by increasing its customer base and collection rate, recovering operational and maintenance costs, and reducing commercial and technical losses. Several factors, within and beyond the scope of the utility, need to be resolved, such as delays in the connection of new customers, large numbers of unmetered connections and meters have been stolen, the slow pace in billing and collection, the debt rate, and the insufficient tariffs. To meet Freetown’s water demand, GVWC needs to invest in rehabilitating its network, expand its production and distribution capacity, and undertake utility management reforms.
95. FSWMC/FCC. Throughout the life of the project, government agencies disputed the responsibility for service management and oversight. FSWMC was initially staffed with private sector recruits and operated under the MoYS. In 2010, the SWMC was placed under the authority of FCC as the agency responsible for solid waste services in Freetown. The SWMC’s management was subsequently changed. By project end, the SWMC has lost its autonomy.
4. Assessment of risk to development outcome
96. Rating: The risk to development outcome is rated significant.
Table 6. Risk by development outcome Development outcome Risk 55,000 people in urban areas gained access to electricity under the project by household connections
Whereas some strengthening of NPA’s capacity was achieved during the project, there is uncertainty regarding the long‐term sustainability of this outcome, as NPA still faces major performance challenges.
167,000 people gained access to improved water resources in rural areas
The sustainability of this outcome depends on the facilities maintenance and utilization by the communities and households. The project provided training to 600 water and sanitation committees on hygiene and sanitation education, and bookkeeping for operating and managing the community water supply facilities.
110,000 people gained access to rural sanitation facilities
25,000 people gained access to water in urban areas
Whereas some strengthening of GWVC’s capacity was achieved during the project, there is uncertainty regarding the long‐term sustainability of this outcome as GVWC’s still faces major performance challenges.
115,000 people were provided with access to regular solid waste collection
The debate over the agency responsible for the provision of solid waste management services is ongoing, and could potentially impact the collection of solid waste in Freetown. In addition, the FCC has not embarked on revenue generation to sustain service provision over time.
5. Assessment of Bank and borrower performance
5.1 Bank performance
97. Bank performance in ensuring quality at entry. The Bank performance in the identification, preparation, and appraisal of the project is rated moderately satisfactory. The Bank identified, facilitated the preparation of, and appraised the operation, and found that an operation such it was most likely to achieve the PDO and was consistent with the Bank’s fiduciary role. The project was consistent with the Government’s development priorities: major risks were identified and mitigation measures proposed;
22
safeguards issues were taken into consideration; and lessons learned from previous projects in the region and country were considered and incorporated into the design. However, the rating is less than satisfactory as the project design was ambitious given the post-conflict environment and the weak institutional capacity albeit provisions made in the project’s design aiming at increasing capacity during implementation. In addition, the rapid preparation of the project compromised the quality of the participatory process and limited the collection of baseline data essential for tracking progress (see section 2.1).
98. Quality of Supervision. The Bank performance during supervision is rated moderately satisfactory. The Bank demonstrated its ability to respond to changing circumstances by first reallocating funds to emergency power generation after the failure of the Kingtom plant, and by funding the rehabilitation works in sub-transmission and distribution lines necessary to distribute electricity generated by Bumbuna. Thus, the Bank managed to respond adequately to an emergency situation in power and to assist the Government in providing emergency generation. In addition, fiduciary and safeguards supervision missions were conducted at regular intervals, except for the short gap of some months when there was no in-country FMS on the portfolio. In late 2007, the Bank team advised and agreed with the GoSL on new project and procurement management arrangements to fast-track implementation given the critical time period remaining. By March 2008, as a result of the Bank team's proactive approach, all activities had begun in earnest. Ultimately, all PDO level targets were met and in some cases exceeded by project closure.
99. However, the quality of supervision is considered less than satisfactory as there were shortcomings in the Bank’s performance during implementation. First, though the project was designed as a single multi-sectoral project, including power and water components, from the beginning the components were treated as independent projects as revealed by the assignment of sectoral Task Team Leaders (TTL), different safeguard and fiduciary specialists for the water and power components, and separate back to office reports and aide memoires. As a result, there was lack of sufficient coordination between the power and water TTLs and sector experts. Second, frequent changes in the power and water TTLs might have impacted the quality of supervision. Third, monitoring and evaluation tools were not fully put in place, as revealed by the lack of baseline and progress data and the changes in the indicators used in the ISRs. Fourth, despite changes in power component activities and the reallocation of funds, the project was not formally restructured. Fifth, many of the ISRs were reflecting progress only with the water component and not the power component. Finally, the MTR of the water component took place in October 2008, more than a year after the date provided in the Development Project Agreement (March 2007), while the MTR of the power component never took place.
100. Justification of rating for overall Bank performance. In view of the Bank performance at entry (moderately satisfactory) and during supervision (moderately satisfactory), the Implementation Completion Report (ICR) rates the overall performance of the Bank as moderately satisfactory.
5.2 Borrower performance
101. Government Performance. The Government’s performance is rated moderately unsatisfactory as there were significant shortcomings in its performance. Overall there was not a strong Government commitment to the project as manifested by:
GoSL counterpart funding was not regularly provided and also delayed project implementation;
23
Legal and financial covenants were not fulfilled;
Bureaucratic procedures in MoEP delayed the processing of withdrawal application forms and this effected project implementation. The introduction of e-signatory method of processing WA has not improved the situation much because of limited computer facilities and frequent power outage;
Difficulty in clearing items from the quay. Duty waivers were difficult to get from GoSL and imported items accrued huge demurrage charges which were difficult to settle;
Frequent changes in project staffing led to poor follow-up on project management;
Adoption of the legal and regulatory framework for the power sector was delayed;
Whereas regulatory changes were initiated, progress was negligible. The regulatory function was not embodied in a functioning unit, as an Energy Policy and Planning Unit was established in form, but did not become operational;
The process of introducing a management contract for NPA was initiated but not concluded due to lack of support within Government;
There was a lengthy discussion on the authority responsible for the provision of solid waste management services, which delayed to 2008 the establishment of a company for this purpose29.
102. Implementing agencies performance. All agencies performance is rated moderately unsatisfactory as there were significant shortcomings in their performance.
103. All implementing agencies faced serious procurement capacity constraints. GVWC had an untrained procurement officer who had limited contact with the engineering department in procurement. SALWACO and the newly-established FWMC had no procurement officer in place. To ensure procurement compliance, SALWACO signed on a full-time procurement officer; GVWC provided training for their staff and in addition, together with the FWMC, hired a part-time engineer/procurement specialist who effectively guided their procurement. Procurement under the project was therefore compliant.
104. Interim Financial Reports and Audit reports were submitted to the Bank with long delays. The FM ISRR rated the project as moderately satisfactory, but downgraded to moderately unsatisfactory at closing due to slower improvement.
105. Progress towards safeguard compliance was slow, in particular for the following actions: (i) in-country disclosure of the ESMF/RPF; (ii) recruitment of a short-term environmental consultant to apply a screening mechanism developed to monitor environmental impact of civil works; and (iii) regular and proper management of dump sites.
106. NPA’s performance is rated moderately unsatisfactory as there were significant shortcomings in its performance as implementation agency. The capacity of the PIU was especially weak, in particular after its manager was fired in late 2007. Supervision of the Interserve contract was carried out by the NPA manager on an ad-hoc basis, due to the lack of a supervision engineer within the PIU. This created
29 According to Section 5.01 (f) of the Credit Agreement, the Borrower shall establish FSWMC within 18 months of the Effectiveness Date.
24
important delays in the contract completion, which was initially planned for 12 months but it was extended for about 24 months. M&E arrangements were not fully implemented. Fiduciary compliance was poor as demonstrated by the delayed submission of audit reports to the Bank. There were also significant delays in procurement. The Bank was supposed to be consulted on any contract that NPA entered into over US$1 million, but there were some cases of misreporting. NPA and the MoEP failed at preparing a financial recovery plan in due time. During the life of the project, NPA’s operational and financial performance barely improved.
107. SALWACO’s performance is rated moderately unsatisfactory as there were significant shortcomings in its performance as implementation agency. Project implementation was not undertaken by project management consultants as originally planned, as the contract was cancelled in its early stages. In addition, changes in SALWACO’s management affected its performance. For instance, most of the civil works contracts overstretched their implementation periods by more than 100 percent. The agency faced major difficulties in finding competent and experienced local contractors to carry out drilling of boreholes and hand-dug wells. The agency did not comply with their obligations to submit audit reports to the Bank on time.
108. GVWC’s performance is rated moderately unsatisfactory as there were significant shortcomings in its performance as implementation agency. Frequent changes in management, such as the change in its Chief Executives almost every twelve months, made it difficult to improve its operational and financial performance.
109. FWMC’s performance is rated moderately unsatisfactory as there were significant shortcomings in its performance as implementation agency. The company was established only in 2008 after a lengthy debate over the agency responsible for the provision of solid waste collection services.
110. Justification of rating for overall borrower performance. In view of the Government’s and implementation agencies’ performance, the ICR rates the overall performance of the Borrower as moderately unsatisfactory.
6. Lessons learned
111. Post-conflict situations and weak institutional capacity should inform project design. The project design should be as simple as possible in a post-conflict context where there are a vast number of needs to be fulfilled. Design also needs to take into account the capacity of the implementation agencies so that the PDO is achievable. Also, the Bank needs to provide a focal point in the post-conflict country to enhance communication and facilitate project implementation.
112. Strong political commitment and leadership is essential to a successful power and water sector reform. The commitment of the Government to essential reforms in Sierra Leone was weak, as evidenced by the lack of support to a management contract for NPA and the lack of clarity regarding the competent authority for solid waste management in Freetown. These circumstances added to the poor improvement of NPA’s performance and solid waste collection in Freetown.
113. Weak institutional capacity problems jeopardize adequate service delivery and constrain project implementation. In the case of NPA, the lack of suitable management was one of the causes of the downward spiral, due to lack of finances to maintain assets and low staff competence in the challenging tasks of maintaining old assets in service. SALWACO’s poor capacity hindered its ability to supervise the
25
quality of civil works. GWVC's Chief Executives were replaced almost every twelve months and this had a deleterious effect on the delivery of service. Frequent changes in FSWMC’s management hindered the consolidation of the company at a time when it was doing important progress in the collection of solid waste in Freetown.
114. Implementation of multi-sectoral operation requires strong single leadership and coordination between sectoral teams. The project aimed at reconstructing parts of Sierra Leone’s dilapidated infrastructure by means of rehabilitated assets, expanding capacity, and enhancing institutions in several sectors. Despite being conceived as a multi-sectoral project, the project did not include any multi-sectoral component. Implementation was carried out by two different teams with different TTLs without coordination, which compromised the quality of supervision.
115. Data on the operational and financial situation of the utilities is a key element to guarantee a successful intervention. Missing baseline and progress data on the operation performance and the financial and cash flows of NPA was a key obstacle to successfully implement enhancements in its performance.
116. Procurement staff must be in place throughout the life of the project for effective implementation. Where need for capacity building is identified, this must be flagged and implemented.
7. Comments in issues raised by the borrower, implementing agencies, and partners
7.1 Borrower/implementing agencies
No comments.
7.2 Cofinanciers
No comments.
7.3 Other partners and stakeholders
No comments.
26
Annex 1. Project costs and financing
(a) Project Cost by Component (in US$ million equivalent)
Borrower Co‐financing 4.90 0.00 .00 International Development Association (IDA)
35.00 32.63 .00
Islamic Development Bank ‐ Al Aqsa Fund Parallel financing 4.61 0.00 .00 OPEC FUND Parallel financing 2.65 0.00 .00
27
Annex 2. Results framework analysis and outputs by component
This Annex provides further detail on the results frameworks analysis included under section F of the Data Sheet. It also provides information on the outputs of each of the components, by expected project results. It is organized as follows:
(A) PDO Indicators
(B) POWER COMPONENT
(b1) Intermediate outcome indicators
(b2) Outputs
(C) WATER SUPPLY, SANITATION, AND SOLID WASTE MANAGEMENT COMPONENT
(c1) Intermediate outcome indicators
(c2) Outputs
28
(A) PDO Indicators
Indicator Name [1] Baseline value
Original target [2]
Achieved value at completion [3]
Comments
# of people in rural areas provided with access to improved water sources under the project
Zero
150,000
167,000 Original indicator included in the PAD reads: “Access to improved water supply for 150,000 people in rural and urban areas through the project”. The original target was overachieved. In latest ISRRs (# 13 and #14) the end‐target was modified to 180,000.
# of people in urban areas provided with access to improved water sources under the project
Zero 25,000 Original indicator included in the PAD reads: “Access to improved water supply for 150,000 people in rural and urban areas through the project”. The original target for both rural and urban areas was overachieved. In latest ISRRs (# 13 and #14) the end‐target was 30,000.
# of people in urban areas provided with access to regular solid waste collection under the project
Zero See comment 115,000 Original indicator included in the PAD reads: “Access to improved solid waste management collection services for Freetown inhabitants”. Original target achieved since the service improved as a result of the project. In latest ISRRs (# 13 and #14) the end‐target was 120,000.
# of people in urban areas provided with access to improved sanitation under the project
Zero See comment 110,000 This indicator was not originally included in the PAD.
# of people in urban areas provided with access to electricity under the project by household connections
Zero 40,000 55,000 Original indicator included in the PAD reads: “Access to improved power supply for 40,000 customers in project area”. Target overachieved.
Notes: [1] Wording of the PDO indicators was adjusted in line with the World Bank mandatory core indicators initiative; this did not affect the substance of the original PAD indicators; [2] As in the PAD dated July 1st, 2004; [3] As in the latest ISRR (#14) dated March 31st, 2011; DFID= Department for International Development; ISRR= Implementation Status Results Report; NPA=National Power Authority; PAD= Project implementation document; PDO= Project Development Objective; NA= Not applicable
(b) POWER COMPONENT
29
(b) POWER COMPONENT
(b1) Intermediate outcome indicators
Most of the performance indicators under Result 2 and 3 below related to the outcome of the Management Contract which did not materialize after the power plant failure. Project funds were subsequently reallocated to emergency power activities. As a result, these indicators were not monitored and some of them became irrelevant.
Result [1] Results’ indicators [1] Baseline value
Original target Achieved value at completion [2]
Comments
Result 1 Effective power sector reforms in place to create an enabling environment for efficient sector operation, including private sector participation
Enactment of a new Electricity Law and NPA Act
n/a Enactment of a new Electricity Law and NPA Act
Achieved Revision of the NPA Act completed and adopted. The new Electricity Production and Use Act was expected to be published officially in June 2011 [3]
Creation of a regulatory function for the power sector within NCP
n/a Creation of a regulatory function for the power sector within NCP
Not achieved The provision of technical advisory services and goods, for the purpose of assisting the GoSL in establishing a regulatory function within NCP for its power sector, was dropped after the failure of the Kingtom plant in September 2006.
Establishment of the National Energy Policy and Planning Unit and its operationalization
n/a Establishment of the National Energy Policy and Planning Unit and its operationalization
Partially achieved An Energy Policy and Planning Unit within MoEP was established, however the unit did not perform to expected standard.
Implementation of a management contract with a private firm for NPA
n/a Implementation of a management contract with a private firm for NPA
Not achieved The implementation of a management contract with a private firm for NPA was dropped after the failure of the Kingtom plant in September 2006. Funds for this activity were reallocated to emergency power generation.
Result 2 National Power Authority (NPA) operating efficiently and effectively, with
85% of energy sales are collected (excluding arrears)
70% 85% of energy sales are collected (excluding arrears)
No data [2] By project closing, improvement of NPA’s collection rates and reduction of non‐technical system losses were beginning to show some improvement as a result of new operating procedures instituted by the NPA consultant with strong support from both the Ministry and NCP.
(b) POWER COMPONENT
30
institutional and financial reforms in place
Fuel efficiency improvement (18 kWh/1G)
Missing 18 kWh/1G No data
Reduction in technical losses from 13.6% to 10.2% in 2006 and 6.8% in 2007
13.6% 6.8% in 2007 Partially achieved Progress in improving NPA’s collection rates and reducing some of the non‐technical system losses was beginning to show as a result of new operating procedures instituted by the NPA consultant, with strong support from both the Ministry and NCP.
Reduction in non‐technical losses from 20% in 2002 to 15% in 2006, 10% in 2007, 5% in 2008, and gradually to 1% in 2012
Missing 5% in 2008 and gradually to 1% in 2012
n/a
Return of NPA profitability, with average rate of return on fixed assets at 4% by 2005 and debt service coverage ratio at 1.5 and above from end‐2005
Missing Return of NPA profitability, with average rate of return on average fixed assets at 4% by 2005 and debt service coverage ratio at 1.5 and above from end‐2005
No data
Staff ratio of NPA at 90 customers per employee
Missing 90 customers per employee
No data
Increase in the amount of gross generation (GWh) from 120 GWh to 150 GWh in 2005, and 180 GWh in 2006
120 GWh in 2004
180 GWh in 2006 No data This intermediate result was no longer applicable after the failure of the Kingtom plant, which led to adjustments in activities –mainly to emergency power generation
Increase in the number of people with access to operational, sustained, and improved electricity services
Missing 40,000 55,000 This indicator was included as a PDO indicator and intermediate outcome indicator. For the purposes of the present ICR, the indicator will be only reported as a PDO indicator from now on.
Reduction in NPA operating costs of at least 20 percent between January 1, 2008 and December 31in 2009[4]
Missing Reduction in NPA operating costs of at least 20 percent between January 1, 2008 and December
No data
(b) POWER COMPONENT
31
31 in 2009 Bumbuna PIU performing fiduciary safeguards responsibilities to the satisfaction of the financier [4]
n/a Bumbuna PIU performing fiduciary safeguards responsibilities to the satisfaction of the financier
Achieved
Clarification if the relationship between NPA management and Bumbuna management, and transparent power purchase agreement between NPA and Bumbuna [4]
n/a Sector structure becomes clear, with separation of ownership and operation. Sector must be financially sound and all revenues substantially accounted for.
Partially achieved Plan to unbundle the sector approved
Result 3 Infrastructure needs addressed, resulting in efficient operation of Kingtom generating station [5]
Spare parts and tools acquired and essential repairs and maintenance performed
Missing Spare parts and tools acquired and essential repairs and maintenance performed
Partially achieved Some spare parts were procured prior to the plant failure.
Degree of improvement in generation auxiliaries at Kingtom
Missing Missing Not achieved
Fire safety equipment procured, in place, and operating properly
Missing Fire safety equipment procured, in place, and operating properly
Not achieved
Degree of improvement in air quality and reduction of noise level around Kingtom
Missing Missing Not achieved
Living standards of resettled population at least as high as before project
Missing Living standards of resettled population at least as high as
Achieved The Resettlement Action Plan compensation payments for both the 33 kV and 11 kV sub‐transmission lines were completed, with 95%of
(b) POWER COMPONENT
32
before project payments to project‐affected persons covered. The remaining 5% of compensation funds were placed in a set‐aside (escrow) account by NPA until the disputes with project‐affected persons were resolved.
Refurbishment and upgrade of low voltage, medium voltage and high voltage distribution network to carry a minimum of 60MW by 2009 [4]
Missing LV, MV, and HV distribution network carries a minimum of 60MW by 2009
Achieved The INTERSERVE contract was completed by project closing.
Power generation from emergency generators 115,000 MWh/year for 2008 [4]
Zero Power generation from emergency generators 115,000 MWh/year for 2008
Achieved Included after the adjustment in activities following the failure of the Kingtom plant in September 2006, and subsequent reallocation of funds.
18 km of 33 kV and 13 km of 11 kV sub‐transmission lines constructed or rehabilitated [4]
Zero 18 km of 33 kV and 13 km of 11 kV sub‐transmission lines constructed or rehabilitated
Achieved Included after the adjustment in activities following the failure of the Kingtom plant in September 2006, and subsequent reallocation of funds.
40 MW of new or rehabilitated sub‐transmission line capacity provided [4]
Zero 40 MW of new or rehabilitated sub‐transmission line capacity provided
Achieved Included after the adjustment in activities following the failure of the Kingtom plant in September 2006, and subsequent reallocation of funds.
Notes: [1] As in the Development Credit Agreement dated July 6, 2004 (Schedule 6, pg. 36). Indicators not included in the credit agreement but included in the PAD (Annex 3) are also presented for a completed understanding of the results framework. When the indicator was neither included in the credit agreement nor in the PAD, it is explicitly noted; [2] As in the latest ISRR (#14) dated March 31, 2011; [3] Aide Memoire, Power Component, March 27‐April 6, 2011; [4] Not included in the PAD; Included here to reflect the adjustment of activities after the reallocation of funds to emergency power generation. DFID=Department for International Development GWh= Gigawatt hour; km= Kilometer; Kv=Kilovot; kWh= Kilowatt hour; n/a= non‐applicable; MoEP= Ministry of Energy and Power; MWh= Megawatt hour; NCP= National Commission for Privatization; NPA= National Power Authority; PIU= Project implementation.
(b) POWER COMPONENT
33
(b2) Outputs
Project output [1]
Output indicator[1] Realization at project completion [2]
Level of achievement Comments
Result 1 Effective power sector reforms in place to create an enabling environment for efficient sector operation, including private sector participation
Enactment of a new Electricity Law and NPA Act
Revision of the NPA Act completed and adopted. The new Electricity Production and Use Act was expected to be published officially in June 2011 [3]
Achieved
Creation of a regulatory function for the power sector within NCP
See comment Not achieved The provision of technical advisory services and goods, for the purpose of assisting the GoSL in establishing a regulatory function within NCP for its power sector, was dropped after the failure of the Kingtom plant in September 2006.
Establishment of the National Energy Policy and Planning Unit and its operationalization
An Energy Policy and Planning Unit within MoEP was established, however the unit did not perform to expected standard
Partially achieved
Implementation of a management contract with a private firm for NPA
See comment Not achieved The implementation of a management contract with a private firm for NPA was dropped after the failure of the Kingtom plant in September 2006. Funds for this activity were reallocated to emergency power generation.
Result 2 National Power Authority (NPA) operating efficiently and effectively, with institutional and financial reforms in place
85% of energy sales are collected (excluding arrears)
See comment No data [2] By project closing, NPA’s collection rates and reduction of non‐technical system losses were beginning to show some improvement as a result of new operating procedures instituted by the NPA consultant with strong support from both MoEP and NCP.
Fuel efficiency improvement (18 kWh/1G)
See comment No data
Reduction in technical losses from 13.6% to 10.2% in 2006 and 6.8% in 2007
See comment Partially achieved
Progress in improving NPA’s collection rates and reducing some of the non‐technical system losses was beginning to show as a result of new operating procedures instituted by the NPA consultant with strong support from both the Ministry and NCP.
Reduction in non‐technical n/a n/a
(b) POWER COMPONENT
34
losses from 20% in 2002 to 15% in 2006, 10% in 2007, 5% in 2008 and gradually to 1% in 2012 Return if NPA profitability, with rate of return on average fixed assets at 4% by 2005 and debt service coverage ratio at 1.5 and above from end‐2005
No data No data
Staff ratio of NPA at 90 customers per employee
No data No data
Increase in the amount of gross generation (GWh) from 120 GWh to 150 GWh in 2005, and to 180 GWh in 2006
See comment No data This intermediate result was no longer applicable after the failure of the Kingtom plant, which led to adjustments in activities, mainly to emergency power generation
Increase in the number of people with access to operational, sustained, and improved electricity services
See comment 55,000 This indicator was included as PDO indicator and intermediate outcome indicator. For the purposes of the present ICR, the indicator will be only reported as a PDO indicator.
Reduction in NPA operating costs of at least 20% between January 1, 2008 and December 31, 2009[4]
No data No data
Bumbuna PIU performing fiduciary safeguards responsibilities to the satisfaction of the financier [4]
Bumbuna PIU performing fiduciary safeguards responsibilities to the satisfaction of the financier
Achieved
Clarification of the relationship between NPA management and Bumbuna management, and transparent power purchase agreement between NPA and Bumbuna [4]
Plan to unbundle the sector approved
Partially achieved
(b) POWER COMPONENT
35
Result 3 Infrastructure needs addressed, resulting in efficient operation of Kingtom generating station [5]
Spare parts and tools acquired and essential repairs and maintenance performed
Some spare parts were procured prior to the plant failure
Partially achieved
Degree of improvement in generation auxiliaries at Kingtom
Not achieved Not achieved
Fire safety equipment procured, in place, and operating properly
Not achieved Not achieved
Degree of improvement in air quality and reduction of noise level around Kingtom
Not achieved Not achieved
Living standards of resettled population at least as high as before project
The Resettlement Action Plan compensation payments for both the 33 kV and 11 kV sub‐transmission lines were completed, with 95% of payments to project‐affected persons covered. The remaining 5% of compensation funds were placed in a set‐aside (escrow) account by NPA until the disputes with project‐affected persons were resolved.
Achieved
Refurbishment and upgrade of low voltage, medium voltage, and high voltage distribution network to carry a minimum of 60MW by 2009 [4]
The INTERSERVE contract was completed by project closing
Achieved
(b) POWER COMPONENT
36
Power generation from emergency generators 115,000 MWh/year for 2008 [4]
Power generation from emergency generators 115,000 MWh/year for 2008
Achieved Included after the adjustment in activities following the failure of the Kingtom plant in September 2006 and subsequent reallocation of funds.
18 km of 33 kV and 13 km of 11 kV sub‐transmission lines constructed or rehabilitated [4]
18 km of 33 kV and 13 km of 11 kV sub‐transmission lines constructed or rehabilitated
Achieved Included after the adjustment in activities following the failure of the Kingtom plant in September 2006 and subsequent reallocation of funds.
40 MW of new or rehabilitated sub‐transmission line capacity provided [4]
40 MW of new or rehabilitated sub‐transmission line capacity provided
Achieved Included after the adjustment in activities following the failure of the Kingtom plant in September 2006 and subsequent reallocation of funds.
Notes: [1] As in the Development Credit Agreement dated July 6, 2004 (Schedule 6, pg. 36). Indicators not included in the credit agreement but included in the PAD (Annex 3) are also presented for a complete understanding of the results framework. When the indicator was neither included in the credit agreement nor in the PAD, it is explicitly noted. [2] As in the latest ISRR (#14) dated March 31st, 2011. [3] Aide Memoire, Power Component, March 27‐April 6, 2011. [4] Not included in the PAD, included to reflect the adjustment of activities after the reallocation of funds to emergency power generation. DFID=Department for International Development GWh= Gigawatt hour; km= Kilometer; Kv=Kilovot; kWh= Kilowatt hour; n/a= non‐applicable; MoEP= Ministry of Energy and Power; MWh= Megawatt hour; NCP= National Commission for Privatization; NPA= National Power Authority; PIU= Project implementation.
(C) WATER SUPPLY, SANITATION, AND SOLID WASTE MANAGEMENT COMPONENT
37
(C) WATER SUPPLY, SANITATION, AND SOLID WASTE MANAGEMENT COMPONENT
(c1) Intermediate outcome indicators
Result [1] Results’ indicators[1] Baseline value Original target Achieved value at completion [2]
Comments
Result 1 Participating rural communities effectively using their improved water and sanitation systems and managing them in a sustainable manner
3 water piped gravity‐fed systems, and spring boxes, boreholes, wells, and sanitary facilities rehabilitated and constructed
Zero 3 water piped gravity‐fed systems, and spring boxes, boreholes, wells, and sanitary facilities rehabilitated and constructed
Partially achieved
The construction of 3 water piped gravity‐fed systems (two in Kenema and one in Bombali) was dropped due to the inability to secure the water source at Wanjei and Mabeina. [3] At project completion, 200 boreholes and 400 boreholes with hand pumps had been constructed.
% of water schemes constructed in participating communities functioning as designed
Zero 90% Partially achieved at 64%
400 out of the 630 community water points were completed during project implementation.
90% of water and sanitation community‐based committees formed under the project functioning, and in charge of operating community water supply and sanitation services
Missing 90% Achieved at 95%
600 participating communities were formed and trained.
% of participating water schemes covering O&M costs
Zero 90% 25%
% of water committees that are gender balanced and fully functioning
Zero 90% 80%
% of project institutional latrines effectively used and maintained
Zero 70% No data At project completion 100 institutional latrines were constructed.
(C) WATER SUPPLY, SANITATION, AND SOLID WASTE MANAGEMENT COMPONENT
38
% of project household latrines effectively used and maintained
Zero 80% Overachieved at 93%
The original target was to construct 2,240 household latrines. At project completion 2,100 latrines were constructed.
SALWACO’s role strengthened.
Zero Moderately Partially achieved
In spite of the early cancelation of the project management consultant contract, aimed at increasing SAWALCO’s capacity over the project’s life, the agency managed to implement the project’s rural water and sanitation subcomponents.
Adoption of a national water supply and sanitation strategy
Zero National water supply and sanitation strategy in place
Achieved Water sector policy developed and approved.
Result 2 Guma Valley Water Company (GVWC) operating efficiently and effectively, with institutional and financial reforms in place
# of house connections with metering in place
2,500 8,500 Partially achieved at 7,500
Meter installation underway at project completion.
Computerized accounting management information system in place and functioning adequately
Missing Missing Achieved A computerized management information system was set up in 2008 [4]
Commercially oriented user fee charges in place
Missing Missing No data
Debt as % of sales Missing Missing 37% % improvement in billing ratio
22% 60% Partially achieved at 42%
The original target was to improve collection ratio to 60 percent of the billing. At project completion collection rate was 42 percent.
(C) WATER SUPPLY, SANITATION, AND SOLID WASTE MANAGEMENT COMPONENT
39
% reduction in commercial & technical losses of water production at GVWC
60% [30% commercial loss}
28% 50% The original target was to reduce non‐revenue water to 28 percent of the water production (18 percent commercial loss). At project completion, non‐revenue water was 50 percent (20 percent commercial loss)
Result 3 Waste management mechanism for Freetown established and operating efficiently and effectively
Emergency solid waste cleanup of Freetown completed
Zero 35% Achieved Completed within the 3 months of project effectiveness (September 30, 2004)
Establishment of a well‐functioning waste management mechanism for Freetown
Missing Establishment of a well‐functioning waste management mechanism for Freetown
Achieved An independent solid waste management company was established in 2008. In 2009 solid waste management was established under the Freetown Council. At project completion, provision of services was affected by the lack of spare parts for solid water collection vehicles and the difficulty of transit in Freetown due to road construction.
% increase in refuse collected
Missing Missing Achieved The original target was to provide solid waste collection to 120,000 people in Freetown. At project completion, solid waste collection services were provided to 115,000 people.
% of waste management equipment purchased under project in operating condition
Missing Missing 70% These equipment are still being used by the present management for waste collection and disposal
User charges structure in place, based on cost recovery calculations
Missing User charges structure in place, based on cost recovery calculations
Not achieved
(C) WATER SUPPLY, SANITATION, AND SOLID WASTE MANAGEMENT COMPONENT
40
Sanitary landfills operating according to guidelines
Missing Sanitary landfills operating according to guidelines
Not achieved
Number of water utilities that the project is supporting [4]
Zero 2 Achieved. 2 Refers to SALWACO and GVWC.
Notes: [1] As in the Development Credit Agreement dated July 6, 2004 (Schedule 6, pg. 36). Indicators not included in the credit agreement but included in the PAD (Annex 3) are also presented for a complete understanding of the results framework;[2] As in the latest ISRR (#14) dated March 31, 2011; [3] Water Aid Memoire, October 21‐30, 2007; [4] Water Aid Memoire, January 29‐February 8, 2008; [5] Included as per the World Bank mandatory core indicators initiative. GVWC= Guma Valley Water Company; SALWACO= Sierra Leone Water Company.
(C) WATER SUPPLY, SANITATION, AND SOLID WASTE MANAGEMENT COMPONENT
41
(c2) Outputs
Project output [1] Output indicator[1] Realization at project completion [2]
Level of achievement Comments
Result 1 Participating rural communities effectively using their improved water and sanitation systems and managing them in a sustainable manner
3 water piped gravity‐fed systems, and spring boxes, boreholes, wells, and sanitary facilities rehabilitated and constructed
200 boreholes and 400 boreholes with hand pumps were constructed
Partially achieved
The construction of 3 water piped gravity‐fed systems (two in Kenema and one in Bombali) was dropped due to the inability to secure the water source at Wanjei and Mabeina [3],.
% of water schemes constructed in participating communities functioning as designed
400 out of the 630 community water points were completed during project implementation
64%
90% of water and sanitation community‐based committees formed under the project functioning, and in charge of operating community water supply and sanitation services
600 participating communities were formed and trained
Achieved at 95%
% of participating water schemes covering O&M costs
25% Partially achieved
The scheme is a new phenomenon and not many people are used to paying for water
% of water committees that are gender balanced and fully functioning
80% Partially achieved
% of project institutional latrines effectively used and maintained
90% No data At project completion 100 institutional latrines were constructed.
% of project household latrines effectively used and maintained
The original target was to construct 2,240 household latrines. At project completion, 2,100 latrines were constructed.
Overachieved at 93%
SALWACO’s role strengthened SAWALCO’s capacity partially improved
Partially achieved
Despite the early cancelation of project management consultant contract aimed at increasing SAWALCO’s capacity over the project’s life, the agency managed to implement the rural water and sanitation subcomponents of the project.
Adoption of a national water supply and sanitation strategy
Water sector policy developed and approved
Achieved
(C) WATER SUPPLY, SANITATION, AND SOLID WASTE MANAGEMENT COMPONENT
42
Result 2 Guma Valley Water Company (GVWC) operating efficiently and effectively, with institutional and financial reforms in place
# of house connections with metering in place
7,500 meters installed Partially achieved
Meter installation underway at project completion.
Computerized accounting management information system in place and functioning adequately
A computerized management information system was set up in 2008 [4]
Achieved
Commercially oriented user fee charges in place
No data No data
Debt as % of sales 37% No data % improvement in billing ratio 42% Partially
achieved The original target was to improve collection ratio to 60 percent of billing. At project completion, collection rate was 42%.
% reduction in commercial & technical losses at GVWC
50% See comment The original target was to reduce non‐revenue water to 28% of total water production (18% commercial loss). At project completion non‐revenue water was 50% (20% commercial loss)
Result 3 Waste management mechanism for Freetown established and operating efficiently and effectively
Emergency solid waste cleanup of Freetown completed
Emergency solid waste cleanup of Freetown completed
Achieved Completed within 3 months of project effectiveness (September 30, 2004)
Establishment of a well‐functioning waste management mechanism for Freetown
Establishment of a well‐functioning waste management mechanism for Freetown
Achieved An independent solid waste management company was established in 2008. In 2009, solid waste management was established under the Freetown Council. At project completion, provision of services was affected by the lack of spare parts for solid water collection vehicles and the difficulty of transit in Freetown due to road construction..
% increase in refuse collected At project completion solid waste collection services were provided to 115,000 people
Achieved
% of waste management equipment purchased under project in operating condition
70% No data These equipment are still being used by the present management for waste collection and disposal
User charges structure in place, based on cost recovery calculations
Not achieved Not achieved
(C) WATER SUPPLY, SANITATION, AND SOLID WASTE MANAGEMENT COMPONENT
43
Sanitary landfills operating according to guidelines
Not achieved Not achieved
Number of water utilities that the project is supporting [4]
2 Achieved Refers to SALWACO and GVWC.
Notes: [1] As in the Development Credit Agreement dated July 6, 2004 (Schedule 6, pg. 36). Indicators not included in the credit agreement but included in the PAD (Annex 3) are also presented for a complete understanding of the results framework;[2] As in the latest ISRR (#14) dated March 31st, 2011; [3] Water Aide Memoire, October 21‐30, 2007; [4] Water Aide Memoire, January 29‐February 8, 2008; [5] Included as per the World Bank mandatory core indicators initiative. GVWC= Guma Valley Water Company; SALWACO= Sierra Leone Water Company.
44
Annex 3. Economic and financial analysis
Power component
This analysis evaluates the economic impact of power infrastructure investments under Component A of the project. Specifically, the analysis considers economic efficiency of (i) investments in the provision of emergency power generation capacity after the failure of the Kingtom generators, and (ii) investments in the transmission and distribution infrastructure to allow for distribution of power generated at the Bumbuna plant. These results are not comparable with those presented in the PAD as they refer to the economic analysis of power sector reforms, strengthening of NPA operational and financial performance, and rehabilitation and maintenance of the Kingtom plant.
The ex-post assessment of the project’s economic efficiency uses the Economic Internal Rate of Return (EIRR) approach, which estimates the economic efficiency of the project by comparing the present value of project’s costs and benefits streams with and without the project.
The ex-post analysis concludes that the EIRR of the power component is 26 percent, based on rather conservative assumptions. This estimate excludes many socioeconomic dimensions of the project benefits that are difficult to quantify in monetary terms because of their nature or for which there is not data available. This EIRR exceeds an assumed opportunity cost of capital of 10 percent, cost that is expected for this kind of projects. The present values of the net benefit streams over the project’s time horizon is US$13.8 million, assuming opportunity cost of capital equal to 10 percent.
Cost-Benefit analysis. The economic feasibility analysis of the project compares estimated economic benefits of the project with its economic costs. As the project costs are given, the primary analytical challenge of this analysis is to most accurately estimate the expected benefits that occurred or are likely to occur as a result of project implementation.
It should be noted that, besides direct economic benefits, there are many other potential benefits that are not factored in the cost benefit analysis described here. This is either because estimating such benefits is impossible because of the unavailability of the data or because it is impossible to quantify the value of these benefits. Some of these potential benefits include economic development, improvements in health and welfare of beneficiary populations, improvements in public safety, sustained economic activity, improved system reliability, etc. Therefore, the estimated benefits of the project described in this analysis can be considered conservative, and we can reasonably assume that the actual economic benefits will be much larger. This analysis only takes into account direct economic benefits of the project.
The direct economic benefits considered in this analysis are:
The value of emergency power generation capacity provided; Bumbuna incremental capital cost recovery thorough additional power generation made possible
by new transmission and distribution capacity; Incremental net revenue generated by the NPA as a result of transmission and distribution
infrastructure improvements.
45
The value of the benefits of investments in generating capacity (US$29 million) is based on the total capacity provided by the investments and the average tariff of the utility30. The value of Bumbuna incremental capital cost recovery attributable to the availability of additional transmission capacity (US$13.4 million over 10 years) is based on the estimated additional power distributed to the system from Bumbuna and the Bumbuna capital recovery rate31. Estimated incremental revenue generated by the NPA as a result of transmission and distribution improvements (US$51.2 million over 10 years) is based on the additional power distributed to the system from Bumbuna and the net average tariff of the utility (average tariff less generation cost)32. The project costs are US$34.4 million for emergency generation (including US$27.8 million in fuel costs funded by the Government of Sierra Leone) and US$10.4 million for transmission and distribution improvements (including incremental annual operations and maintenance (O&M) costs of 2.5 percent of the capital costs).
Some key assumptions have significant effects on the results of the analysis, and all of these assumptions were made conservatively to avoid overestimating project benefits. One such assumption is the assumed time horizon of the project, i.e. the number of years of benefit streams that should be factored into the calculations. Since the project implementation costs are given, the longer the assumed time horizon of the project is the larger the magnitude of incremental benefits will be, and the higher the internal rate of return that will result. To remain conservative, the project horizon is limited to 10 years, even though the infrastructure created as a result of the project investments is likely to last significantly longer. This approach, in turn, limits the assumed benefits of the project for the purposes of cost-benefit analysis, even though the potential benefits of project investments are also likely to last significantly longer. Similarly to the project time horizon, system losses and revenue collection losses are assumed to remain at the current very high level in the future (while actual slight improvements in the future could lead to significant additional benefits).
Cost-benefit analysis estimates the economic feasibility of the project by calculating the present value of cost and benefit streams and by determining the internal rate of return of the project. The net discounted value of all project costs and benefits is about US$13.8 million, implying the internal rate of return of about 26 percent. This rate is significantly higher than the assumed cost of capital of 10 percent and therefore the project’s power component investments can be considered sound.
Water supply and sanitation component
At approval. A complete economic and financial analysis of this component was not conducted at time of approval, and was only conducted for the rural water supply component. For this subcomponent, the economic analysis was performed for two types of systems, as follows:
Gravity-fed system. The costs benefit calculation concluded that if water was valued at 35 US$ cents per meter cubic and benefited around 60,000 people, the EIRR was 13 percent.
Hand-dug well equipped with hand pump. The costs benefit calculation concluded that if water was valued at 35 cents, the EIRR would be negative. At 45 US$ cents per meter cubic, the EIRR
30 Bumbuna capital recovery rate, average NPA retail tariffs, and other relevant data were obtained from “Power Tariff Methodology for Sierra Leone” study by Peter Mayer. Average utility tariff is cited on page 65 of the study. 31 “Power Tariff Methodology for Sierra Leone” study by Peter Mayer, Paragraph 138, page 41. 32 “Power Tariff Methodology for Sierra Leone” study by Peter Mayer, Paragraph 138, page 43.
46
would be 6 percent, at 55 US$ cents per meter cubic it would be 13 percent, and at 65 US$ cents per meter cubic it would be 19 percent.
Therefore, at project approval, no estimate was provided for the rural sanitation, urban water supply, and solid waste management investments.
At project closing. The ex-post analysis of the economic impact of rural water supply investments considers the economic efficiency of investments in wells and boreholes, which benefited 167,000 people with access to water supply. These estimates are not comparable with those presented in the PAD as they referred to the provision of rural water supply by gravity-fed systems and wells and boreholes, and do not consider time savings.
Cost-Benefit analysis. Similarly to the analysis made for the power component, the ex-post assessment of the project’s economic efficiency uses the EIRR approach, building on the stream of benefits of time savings associated with collecting water and the cost stream of capital, operational, maintenance, and commercial costs.
The ex-post analysis concludes that the EIRR of the rural water supply subcomponent is 17 percent, based on rather conservative assumptions. This EIRR exceeds an assumed opportunity cost of capital of 10 percent, cost that is expected for this kind of projects. The present values of the net benefit streams over the project’s time horizon is US$9.8 million, assuming opportunity cost of capital equal to 10 percent.
The cost-benefit analysis refers only to the provision of rural water supply to 167,000 people. The analysis estimates that the time savings from the provision of services over a 10-year time horizon, expressed in present value using a discount rate of 10 percent, is US$9.8 million. The cost stream considers capital, operational, maintenance and commercial costs.
Numerous benefits were not included in the above calculation. The provision of access to improved water supply and sanitation is expected to have reduced the incidence of water-borne and water-washed diseases in Sierra Leone. One set of benefits related to the health impacts are the cost-offsets (i.e. costs avoided due to less illness). Cost savings in health care are mainly due to the reduced number of treatments of diarrheal cases. Also, patients avoid costs incurred by seeking treatment, including expenditures on care, drugs, transport, and the opportunity costs of time spent on seeking care. Another set of benefits related to less illness are the avoided days lost with respect to formal or informal employment, other productive activities in the household, or school attendance. They are traditionally split into two main types: gains related to lower morbidity and gains related to less death. Finally, one of the major benefits of improving access to water and sanitation derives from the time saving associated with closer location of the facilities. Time savings occur due to the installation of water points closer to rural communities and closer access to latrines. They translate into increased production, higher school attendance – in particular, due to the installation of latrines in schools achieved by the project – and more leisure time. Due to the lack of baseline and progress data, an estimation of these benefits was not attempted.
In addition, about 115,000 people were provided with access to regular solid waste collection under the project, generating economic benefits from improved sanitary and environmental conditions for the population leading to reduced exposure to diseases. Clearing waste from communities will contribute towards the preservation of existing urban infrastructure by preventing flooding of roads, houses, and other infrastructure in low lying areas. An estimation of these general benefits was not attempted due to the lack of reliable baseline data and difficulties in estimating the value of benefits associated with spill-
47
over effects, including a drastic reduction in filth, odor, rodents and flies. For the same reason, the financial benefits were equally difficult to calculate.
48
Annex 4. Bank lending and implementation support/supervision processes
(a) Task team members
Names Title Unit Responsibility/
Specialty
Lending Amarquaye Armar Program Manager SEGES Yao Badjo Senior Infrastructure Specialist AFTUW Alfred B. Gulstone Lead Power Engineer AFTEG Hassan Madu Kida Lead Water and Sanitation Spec AFTUW Paul Kriss Lead Urban Specialist EASCS Maria Concepcion J. Cruz Lead Social Development Specialist AFTCS Michel E. Layec Lead Energy Economist LCSEG Donal T. O'Leary Consultant WBIPR - HIS Christophe Prevost Sr Water and Sanitation Specialist TWISA Robert A. Robelus Consultant AFTWR Robert J. Roche Consultant AFTUW Richard Mahougnon Senou Sr Financial Analyst AFTEG Arthur Majoribanks Swatson Water and Sanitation Specialist AFTU2 - HIS Marie-Adele Tchakounte Sitchet Language Program Assistant AFTUW Richard Verspyck Consultant AFTUW Frederick Yankey Sr Financial Management Specialist AFTFM Aissata Z. Zerbo Procurement Specialist AFTUW
Supervision/ICR Joyce Olubukola Agunbiade Financial Management Specialist AFTFM Maria Concepcion J. Cruz Lead Social Development Specialist AFTCS Mathewos Woldu Senior Economist AFTUW Rita Ahiboh Program Assistant AFTEG Beatrix Allah-Mensah Social Development Specialist AFTCS Ferdinand Tsri Apronti Procurement Specialist AFTPC Yao Badjo Senior Infrastructure Specialist AFTUW Samuel Bruce-Smith Consultant AFTAR Malcolm Cosgrove-Davies Lead Energy Specialist SASDE Robert Wallace DeGraft-Hanson Financial Management Specialist AFTFM Syed Waqar Haider Sector Leader AFTEG Manush A. Hristov Senior Counsel LEGAF Mudassar Imran Senior Energy Economist AFTEG Kristine M. Ivarsdotter Senior Social Development Specialist LCSSO Fatu Karim-Turay Team Assistant AFMSL Hassan Madu Kida Lead Water and Sanitation Specialist AFTUW Paivi Koljonen Lead Energy Specialist AFTEG Mbuba Mbungu Consultant WBIGV Sameh I. Mobarek Counsel LEGPS Mark M. Moseley Lead Counsel LEGPS Marjorie Mpundu Senior Counsel LEGAF Mohua Mukherjee Senior Energy Specialist SASDE Nyaneba E. Nkrumah Senior Natural Resources Mgmt. Specialist LCSEN Oluwole Pratt Financial Management Analyst AFTFM
49
Rolande Simone Pryce Senior Country Officer LCC3C Chrisantha Ratnayake Consultant ECSS2 Robert A. Robelus Consultant AFTWR Leopold Sedogo Energy Specialist AFTEG Arthur Majoribanks Swatson Water and Sanitation Specialist AFTU2 - HIS Kremena Ionkova ICR TTL, Senior Urban Specialist AFTUW Carolina Dominguez Torres ICR Primary Author, Economist AFTUW Marie-Adele Tchakounte Sitchet Language Program Assistant AFTUW
(b) Staff time and cost
Stage of Project Cycle
Staff Time and Cost (Bank Budget Only)
No. of staff weeks US$ thousands (including travel
and consultant costs)
Lending
FY04 285.50
FY05 0.00
FY06 0.00
FY07 0.00
FY08 0.00
Total: 285.50
Supervision/ICR
FY04 0.00
FY05 195.78
FY06 151.99
FY07 258.96
FY08 374.66
Total: 981.39
50
Annex 5. Summary of Borrower's ICR
Project Background
The Sierra Leone Power and Water Project was identified out of sector-specific assessments of immediate and longer-term infrastructure needs as Sierra Leone emerged from post conflict era. These assessments were based on cumulative knowledge generated by several Bank projects including the Urban Water Supply Project, the Freetown Infrastructure Rehabilitation Project and the Power Rehabilitation Project.
Given the breath of infrastructure requirements after the rebel war and limited resources available, specific decisions were taken to immediately address the power, water supply and sanitation, and solid waste management needs of the country. Some of the development objectives identified for this project included provision of a more stable power supply system to residents of Freetown, provision of adequate and affordable potable water supply and sanitation facilities to urban and rural residents of Sierra Leone, and the provision of a more reliable, sustainable, socially acceptable and environmentally safe solid waste collection and disposable system leading to improved general health and living conditions for the people of Freetown.
In order to achieve these immediate objectives, the GoSL approached the Bank for assistance. Assessment missions were sent to Freetown that culminated in the approval of funding of SDR24’000,000 for this project. The Project Agreement (Development Credit Agreement) was signed in Freetown on July 6, 2004. The DCA contains all the budget allocations by category to the two project components.
This report ICR covers only Component B of the project.
Component B: Water Supply, Sanitation and Solid Waste Management – US$15.333 million (with US$15.00 million for IDA including PPF Advance of US$0.30 million)
B.1 Rural Water Supply and Sanitation Sub Component - (US$9.36 million with US$9.03 million for IDA). This component was to include rural water supply and sanitation interventions in four districts (Bo, Kenema, Bombali and Tonkolili). The component included: (i) water supply and sanitation civil works; (ii) financing of related consultancies, equipment and training activities required; and (iii) commencement of implementation of sector policy reforms and studies.
B. 2 Freetown Solid Waste Management Sub Component – (US$2.80 million for IDA). This component included: (i) emergency works aimed at cleaning and improving the hygiene situation in Freetown in the short-term (three months from effectiveness date), and (ii) establishment of a more permanent solution to the city’s solid waste management problems through the creation of the Freetown Solid Waste Management Company (FSWMC).
B. 3 Urban Water Supply Sub Component – (US$2.87 million for IDA). This component was to include: (i) providing funding for reform consultancies in the area of financial management and business planning, enabling the implementation of commercially-oriented reforms in GVWC; (ii) funding for emergency works in the eastern parts of Freetown and installation of meters to improve the cost recovery of the service delivery to the low-income communities; and (iii) funding for training and urgently needed equipment for GVWC.
51
Project Development Objectives
The project’s development objective is to improve sustainable access to water supply and sanitation and urban solid waste management services with the following outcomes:
RWSSP: Rural residents in targeted districts will have clean drinking water and adequate rural sanitation facilities, contributing to improved health.
FSWM: Freetown residents will have a reliable, sustainable, affordable, socially acceptable and environmentally safe solid waste collection and disposal system, leading to improved general health and living conditions.
UWSP. GVWC will be managed in a more commercially oriented way and will improve the quality of service it provides to Freetown’s water consumers.
SALWACO Construction of water and sanitation facilities
Original design altered (from gravity‐fed system to water points)
Implementation period took longer that expected
SALWACO did not benefit from technical assistance with respect to capacity building provided by Poyry. Weak capacity still remains in SALWACO. Project supervision was poor. Supervisors were few with limited technical knowledge. Limited cooperation from district councils because of their non‐involvement in selecting contractors.
Community participation and hygiene education
Design of training manual
Activity was contracted to one individual instead of to an NGO
Some community were never sensitized. Some communities were also shifted.
GVWC Institutional strengthening programme.
TA was provided by PriceWaterHouse Coopers. Corporate Development Plan.
A comprehensive CDP was prepared
GVWC used the CDP to establish zonal offices (CDP helped to bring GVWC closer to its customers)
Extension of pipe network in the eastern areas of Freetown
Design was perfect. Implementation was delayed by frequent excavation works by Sierra Leone Roads Authority
Despite all efforts to synergise with SLRA, agreed actions were not adhered to by SLRA. Excavation works still continued and affected project completion.
52
FSWMC Emergency cleaning of Freetown.
Design was perfect Cleaning was conducted immediately
FWMC got the necessary support to accomplish the cleaning exercise on time.
Establishment of Freetown Waste Management Company
Good The Articles and Memorandum for the Company was developed and registered
FSWMC received considerable support from GoSL and was able to carry out its functions of cleaning. Later political interference from the City Council reversed most of the gains made by the company.
Assessment of Outcome
Agency Objective Outcome Assessment SALWACO Provision of water supply
and sanitation facilities. Water supply and sanitation facilities were provided in 600 communities in four districts.
Most of these facilities are functioning as designed.
Carry out community sensitization on proper management of facilities.
Water and Sanitation Committees were not established in all the communities.
Some communities were shifted and therefore did not benefit from this activity.
Strengthening SALWACO’s role.
Very few counterpart staff were attached to the project for capacity.
TA contract was cancelled and therefore counterpart staff did not benefit much.
Development of a national water supply strategy
A national Water, Sanitation, and Hygiene (WASH) Policy, together with a strategic plan, was developed and launched.
All WASH programmes will be implemented according to the provisions of the Policy
GVWC Strengthening the functional role of GVWC
Capacity building of staff in financial and technical management. Put in place computerised accounting system. Improvement in household connections. Commercially oriented fees charged. Improvement in billing ratio. Reduction in commercial and technical losses
Company has recruited and trained more staff in charge of zonal offices. GVWC has regularised all illegal connections and put in place a financial model called sage pastel that has helped to improve their financing and management system. GOSL has still not approved the new tariff structure for charging commercially oriented fees. A small staff has been trained in leak detection and thus reducing losses.
FSWMC Cleaning of Freetown Freetown was cleaned on daily basis 24/7 by the FWMC.
Cleaning was done for 24 hrs and logistical support provided.
53
Evaluation of Borrower’s Performance
Bureaucratic procedures in MoFED delayed the processing of withdrawal application forms and this had an impact on project implementation. The introduction of an e-signatory method of processing WA has not significantly improved the situation because of limited computer facilities and frequent power outages;
GoSL counterpart funding was not regularly provided and also delayed project implementation; Difficulty in clearing items from the quay. Duty waivers were difficult to get from GoSL and
imported items accrued huge demurrage charges which was difficult to settle; Monitoring mission organised by MoFED was a step in the right direction
Evaluation of World Bank Performance
Delays in updating contracts in the Banks system impacted on disbursement from the Chennai office.
Quarterly Banks supervision missions and e-mail correspondences helped to improve project implementation.
Housing Bank’s financial and procurement experts in the country office assisted greatly in addressing financial and procurement issues during project implementation.
Frequent changes of TTLs also affected project implementation. New TTLs emphasise different approaches in project implementation.
Banks acceptance of 100 percent project funding was commendable.
54
Annex 6. List of Supporting Documents
Type of document Report No. Date Project Appraisal Document Report No:
28549‐SL May 21, 2004
Project Agreement Credit Number 3945 SL
July 6, 2004
Quality Assessment of Lending Portfolio(QALP) by Quality assurance group November 4, 2008 Amendment to the Development Credit Agreement December 11, 2007 Aide‐Memoire, preparation mission water supply and sanitation component October 28‐November 6, 2003
Aide‐Memoire, pre‐appraisal mission March 1‐11, 2004 Aide‐Memoire, appraisal mission April 22‐May 2, 2004 Aide‐Memoire, supervision mission water supply and sanitation component October 26‐November 1, 2004 Aide‐Memoire, supervision mission water supply and sanitation component October 21‐30, 2007 Aide‐Memoire, supervision mission water supply and sanitation component January 29‐February 8, 2008 Aide‐Memoire, supervision mission water supply and sanitation component June 26‐July 2, 2008 Aide‐Memoire, supervision mission water supply and sanitation component October 16‐30, 2008 Aide‐Memoire, supervision mission water supply and sanitation component May 4‐12, 2009 Aide‐Memoire, supervision mission water supply and sanitation component September 27‐October 2, 2009 Aide‐Memoire, supervision mission water supply and sanitation component February 14‐19, 2010 Progress report for DFID/ IDA funded projects, GVWC March 2010 Aide‐Memoire, preparation mission power component December 6‐19, 2003 Aide‐Memoire, supervision mission power component April 20‐May 4, 2005 Aide‐Memoire, supervision mission power component October 14‐22, 2005 Aide‐Memoire, supervision mission power component September 18‐October 5, 2006 Aide‐Memoire, supervision mission power component March 10‐21, 2008 Aide‐Memoire, supervision mission power component April 6‐12, 2010 Aide‐Memoire, supervision mission power component October 20‐November 2, 2010 Aide‐Memoire, supervision mission power component March 27‐April 6, 2011
Aide‐Memoire, supervision mission power component May 17‐June 15, 2011 ISRR 1 October 22, 2004 ISRR 2 April 30, 2005 ISRR 3 December 21, 2005 ISRR 4 June 15, 2006 ISRR 5 December 14, 2006 ISRR 6 June 27, 2007 ISRR 7 November 30, 2007 ISRR 8 April 18, 2008 ISRR 9 August 07, 2008 ISRR 10 February 06, 2009 ISRR 11 June 10, 2009 ISRR 12 December 12, 2009 ISRR 13 June 14, 2010 ISRR 14 March 26, 2011
BintimaniBintimani(1948 m)(1948 m)
GGoorr
iiHH
ii ll llss
LLoommaa
MMttss
..
SherbroSherbroIslandIsland
WWaarraa
WWaarraaMMttss..
KAMBIAKAMBIAB O M B A L IB O M B A L I
K O I N A D U G UK O I N A D U G U
T O N K O L I L IT O N K O L I L I
K O N OK O N O
KAILAHUNKAILAHUNK E N E M AK E N E M AB OB O
P U J E H U NP U J E H U N
B O N T H EB O N T H E
M O YM O YA M B AA M B A
P O RP O R T L O K OT L O K O
WESTERNWESTERNAREA FAREA F.R..R.
GGrree
aattSScc
aarrcciiee
ss
LLiittttllee
SSccaarr
cciieess
MMoonnggoo
BBaaggbbee
SSeellii
PPaamm
ppaannaa
RRookkeell
JJoonngg
SSeewwaa
KKiittttaamm
SShheerrbbrroo MMooaa
LakeLakeMapeMape
LakeLakeMabesiMabesi MMaannoo
PendembuPendembu
LunsarLunsar
ManoMano
RotifunkRotifunk
SongoSongoYYonibanaonibana
MasiakaMasiaka
WWaterlooaterloo
SembehunSembehun
KamakwieKamakwie
FaduguFadugu
BumbunaBumbunaAlikaliaAlikalia
KayimaKayima
GandorhunGandorhun KoinduKoindu
BueduBuedu
KurubonlaKurubonla
KamaronKamaron
TTefeyaefeya
YYengemaengema
PangumaPanguma
LagoLago
PendembuPendembu
DaruDaru
Njaiama-Njaiama-SewafeSewafe
JoruJoru
ZimmiZimmi
FairoFairo
PotoruPotoru
KribunduKribundu
SumbuyaSumbuyaMatruMatru
BlamaBlama
MomaligiMomaligi
BenduguBendugu
FalabaFalaba
BinkoloBinkolo
YYanaana
GbintiGbinti
BatkanuBatkanu
PepelPepel MasingbiMasingbi
MatotokaMatotoka
YYeleele
MongeriMongeri
DambaraDambara
MangeMange
MadinaMadinaJunctionJunction
MakeniMakeni
BoBo
KenemaKenema
KambiaKambia
PorPort Lokot Loko
MoyambaMoyamba
BontheBonthe
PujehunPujehun
KailahunKailahun
SefaduSefadu
MagburakaMagburaka
KabalaKabala
L IBERIA
KAMBIAB O M B A L I
K O I N A D U G U
T O N K O L I L I
K O N O
KAILAHUNK E N E M AB O
P U J E H U N
B O N T H E
M O YA M B A
P O R T L O K O
WESTERNAREA F.R.
Pendembu
Lunsar
Mano
Rotifunk
Songo
Shenge
Yonibana
Masiaka
Waterloo
Sembehun
Kamakwie
Fadugu
BumbunaAlikalia
Kayima
Gandorhun Koindu
Buedu
Kurubonla
Kamaron
Tefeya
Yengema
Panguma
Lago
Pendembu
Daru
Njaiama-Sewafe
Joru
Zimmi
Fairo
Potoru
Kribundu
SumbuyaMatru
Blama
Momaligi
Sulima
Bendugu
Falaba
Binkolo
Yana
Gbinti
Batkanu
Pepel Masingbi
Matotoka
Yele
Mongeri
Dambara
Mange
Lungi
MadinaJunction
Makeni
Bo
Kenema
Kambia
Port Loko
Moyamba
Bonthe
Pujehun
Kailahun
Sefadu
Magburaka
Kabala
FREETOWN
LIBERIA
G U I N E A
G U I N E AGre
atSc
arcie
s
Little
Scar
cies
Mongo
Bagbe
Seli
Pam
pana
Rokel
Jong
Sewa
Kittam
Sherbro Moa
Moa
LakeMape
LakeMabesi
YawriBay
ManoATLANTIC OCEAN
To Forecariah
To Kindia
To Ouré-Kaba
To Faranah
To Kolahun
To Monrovia
Gor
iH
i l ls
Loma
Mts
.
SherbroIsland
TurtleIslands
BananaIslands
Wara
WaraMts.
Bintimani(1948 m)
13°W 12°W 11°W
12°W 11°W
7°N
8°N
9°N
10°N
8°N
9°N
10°N
SIERRALEONE
This map was produced by the Map Design Unit of The World Bank. The boundaries, colors, denominations and any other informationshown on this map do not imply, on the part of The World BankGroup, any judgment on the legal status of any territory, or anyendorsement or acceptance of such boundaries.