Page 1
DOCUMENT RESUME
ED 422 350 TM 028 902
AUTHOR Gyagenda, Ismail S.; Engelhard, George, Jr.TITLE Applying the Rasch Model To Explore Rater Influences on the
Assessed Quality of Students' Writing Ability.PUB DATE 1998-04-00NOTE 30p.; Paper presented at the Annual Meeting of the American
Educational Research Association (San Diego, CA, April13-17, 1998).
PUB TYPE Reports Research (143) Speeches/Meeting Papers (150)EDRS PRICE MF01/PCO2 Plus Postage.DESCRIPTORS *Difficulty Level; Essay Tests; Evaluators; High School
Students; High Schools; *Item Response Theory; StatePrograms; Testing Programs; *Writing Tests
IDENTIFIERS Domain Knowledge; FACETS Computer Program; *Rasch Model;*Rater Effects
ABSTRACTThe purpose of this study was to describe the Rasch model
for measurement and apply the model to examine the relationship betweenraters, domains of written compositions, and student writing ability. Twentyraters were randomly selected from a group of 87 operational raterscontracted to rate essays as part of the 1993 field test of the Georgia HighSchool Writing Test. Each rater rated the complete set of 366 essays writtenby high school students and each essay was scored on 4 domains: (1) contentand organization; (2) style; (3) conventions; and (4) sentence formation. TheRasch model-based FACETS computer program (J. Linacre and B. Wright, 1994)was used to examine whether there were statistically significant differencesin rater severity and domain difficulty, and to explore the rater by domaininteraction effect. Results indicate significant differences between raters,between domains, and a significant interaction effect between raters anddomains. (Contains 4 tables, 8 figures, and 20 references.) (Author/SLD)
********************************************************************************
Reproductions supplied by EDRS are the best that can be madefrom the original document.
********************************************************************************
Page 2
APPLYING THE RASCH MODEL TO EXPLORE RATER INFLUENCESON THE ASSESSED QUALITY OF STUDENTS' WRITING ABILITY
U.S. DEPARTMENT OF EDUCATIONOffice of Educational Research and Improvement
EDUCATIONAL RESOURCES INFORMATIONCENTER (ERIC)
is document has been reproduced asreceived from the person or organizationoriginating it.
0 Minor changes have been made toimprove reproduction quality.
Points of view or opinions stated in thisdocument do not necessarily represent )officialpERI position or policy.
PERMISSION TO REPRODUCE ANDDISSEMINATE THIS MATERIAL HAS
BEEN GRANTED B(
Is_rro:, I Grie_o_da.
TO THE EDUCATIONAL RESOURCESINFORMATION CENTER (ERIC)
1
Ismail S. Gyagenda
and
George Engelhard, Jr.
Emory University
Division of Educational StudiesEmory UniversityNorth Decatur BuildingAtlanta, GA 30322
04CDCr)OD04 Paper presented at the annual meeting of the AmericanCD Educational Research Association, San Diego, CA; April
1998.
Page 3
2
Abstract
The purpose of this study was to describe the Rasch
Model for measurement and apply the model to examine the
relationship between raters, domains of written compositions,
and student writing ability. Twenty raters were randomly
selected from a group of 87 operational raters contracted to
rate essays as part of the 1993 field test of the Georgia
High School Writing Test. Each rater rated the complete set
of three hundred sixty six essays written by high school
students and each essay was scored on four domains: a)
content and organization, b) style, c) conventions, and d)
sentence formation. The Rasch model based FACETS computer
program (Linacre & Wright, 1984) was used to examine whether
there were statistically significant differences in rater
severity and domain difficulty, and to explore the rater by
domain interaction effect. Results indicated significant
differences between raters, between domains, and a
significant interaction effect between raters and domains.
3
Page 4
Applying the Rasch model to explore rater influenceson the assessed quality of students' writing ability.
Ability and achievement measurement is problematic. The
meaning and estimated quality of the traditional scales of
measurement "depend upon the specific set of items actually
standardized and the particular ability distribution of the
children who happened to appear in the standardizing sample"
(Wright, 1967, p. 86). This sample and item dependence
challenges the requisite objectivity of ability measuring
instruments. If height or weight measuring instruments
depended for their accuracy on the persons measured or their
texture, color, etc., their objectivity would be similarly
challenged. It is critical, therefore, to develop objective
measures in the social sciences. This paper describes the
Rasch model of measurement, which aims at meeting this
requirement, and illustrates its application by exploring the
relationship between raters, domains of written compositions,
and writing ability.
Student writing ability is increasingly being assessed
nationally and in most states (Afflerbach, 1985; Applebee,
Langer, & Mullisi 1985; Linn, Baker, & Dunbar, 1991; Zwick,
Donoghue, & Grimes, 1993). Given the high-stakes nature of
many of these large-scale performance assessments (Welch &
Miller, 1995), researchers have been concerned not only with
various factors that may influence performance assessments,
but with the unintended consequences of these tests (Bond,
1995) . The major factors influencing the assessment of
Page 5
writing ability may be related to: a) the assessment process
(rater bias or'severity, rating method); b) student
characteristics like "gender, age, ethnicity, race, social
class, or opportunity to learn" (Engelhard, 1992, p. 75); c)
factors linked to the writing task itself (prompt or domain)
or d) a combination of the above factors.
RatersRaters have been shown to influence the assessed quality
of student writing (Engelhard, 1994, 1996; Lunz, Wright, &
Linacre, 1990; Du & Wright, 1997). Engelhard (1994) examined
rater differences in assessing essays. From the 1990
administration of the Eighth Grade Writing Test in Georgia, a
sample of 264 randomly selected compositions assessed by 15
raters formed the data for the study. Fifty-one percent of
the compositions were written by female students and forty-
nine percent by males. Each essay was scored by two
operational raters on five domains (content/organization,
style, sentence-formation, usage, and mechanics). The
ratings of the validity committee were used to anchor the
calibrations of the 15 operational raters. Three facets
(writing competence, rater severity, and domain difficulty)
were utilized to calibrate the raters using the FACETS
computer program. Results indicated significant differences
between the raters, x2 (15) = 170.7, p< .01 with a high
reliability of separation index (R = .87). Unless
adjustments were made, the writing competence of the students
judged by severe raters would be underestimated.
5
Page 6
5
Du and Wright (1997), using data from the 1993 direct
writing assessment of the Illinois State Goal Programs
(IGAP), explored rater, rating scale, and writing task
effects and used the many-faceted Rasch model to adjust
student measures based on those effects. The data for the
study comprised 1734 randomly selected essays by 867 students
in grades 6 (27%), 8 (24%), and 10 (49%), and scored by 89
trained raters. Results from the study indicated that there
were significant differences in rater severity, and that the
scales and topics were further sources of significant
differences in student scores. Du and Wright concluded that
to ensure objective measurement of student writing ability,
rater, rating scale, and task variations had to be identified
and student scores had to be adjusted accordingly.
Domain
Domains refer to aspects or characteristics of essay
quality that are analyzed and separately scored. Such
aspects may include, for example, language mechanics, style,
sentence formation, spelling, or content/organization.
Research on domain influences seems scanty. However,
Gabrielson, Gordon, and Engelhard (1995) in their examination
of the effects of task choice on the writing quality of 11th
grade students used as the dependent variables the following
four domains in each essay: a) content and organization, b)
style, c) conventions, and d) sentence formation. Female
students scored significantly higher than the males on all
domains, with the largest gender differences on the
6
Page 7
6
conventions domain, which referred to the appropriate usage
of the mechanics of standard American English. White
students performed significantly higher than Black students
on all four domains, with the largest differences on the
conventions domain, followed by sentence formation, the
style, and the content and organization domains. These
results tallied with earlier research by Engelhard, Gordon,
Walker, and Gabrielson (1994).
This study extends the above research, with a focus on
the rater by domain interaction effect. The study is also
unique because of the data set it utilizes: each one of the
twenty raters rated the 366 essays. The purpose of this study .
is to apply the Rasch model to examine the rater and domain
influences on the assessed quality of student writing. The
Rasch model is used to estimate.the student abilities, the
rater severities, the domain difficulty, and the rater/domain
interaction effect.
The Rasch Model
In measuring the performance of persons on items, the
Rasch model (Wright, 1977) has one ability parameter (k) for
each person v and one difficulty parameter Si for each item
i. These parameters are used in the model to determine the
probability of person v succeeding on item i. That
probability is governed by 'the difference between the person
ability and item difficulty parameters (k- 80. Because the
probability must remain between zero and one, the difference
7
Page 8
7
(13v-8j) is expressed as an exponent of a base e(13"51) (e =
2.718) and the Rasch probability for a right answer is
e(13v4i) / [1+ e(1311-8i)] .
According to the Rasch model, the probability of a
person's success on an item depends on the difference between
that person's ability and the difficulty of the item
attempted. When that person has more ability than the item
demands, Dv is greater than 8, their difference is positive,
and the person's ability to answer that item correctly is
greater than 0.5. Conversely, when an item requires more
ability than a person has, the difference 13v-8i will be
negative, and the probability of success on the item will be
less than 0.5.
To measure person ability on a given latent trait and to
calibrate items used in estimating that ability, the
following Rasch model is used:
Prjxvi I Mi = exvi("i)/ [1 + e(Pv4i) ] .
where if person v answers item i correctly it is expressed as
xvi=1 and if wrongly, xvi=0.
The Rasch model uses a mathematical unit of measurement
known as a "logit". A person's ability in logits is their
natural log odds for succeeding on items of the kind used to
define the scale origin. The probability P for succeeding on
an item with difficulty 8 = 0 is er3/(1+e13 ) from which their
8
Page 9
8
success are P/ (1-P) = el3, the natural log of which is p. An
item's difficulty in logits is the natural log odds for
failure on that item by persons with abilities at the scale
origin. The probability P of these persons with abilities at
13=() of succeeding on an item with difficulty 8 is e-8/(1 + e-8)
from which their odds for failure are (1 P)/ P = e8, the
natural log of which is 8.
Because reporting of measured person abilities in logits
may be cumbersome for teachers or parents, it is possible to
transform the logits into other units that can be expressed
conveniently in positive integers. A linear transformation
can be used to set the location and scale to the desired
values.
Estimating and Analyzing person ability and item
difficulty
The Rasch model provides mathematical procedures to
estimate person abilities and item difficulties. The simple
manual estimation of parameters is called PROX. However,
computer programs like FACETS (Linacre & Wright, 1994) are
available to make the necessary analyses and estimates. The
analyses provide "fit" statistics to enable an evaluation of
how the data fit the Rasch model. Using squared residuals
and chi-square statistics, it is possible to flag items or
persons that are behaving unexpectedly based on the model.
For example, if a person with low ability succeeds on a very
Page 10
9
difficult item, such a person can be identified and decisions
made to investigate the case.
Applying the Rasch model
In this study, the Rasch model was used to explore the
relationship between raters, domains of written compositions,
and student writing ability.
The data for this application comprised 366 English
language compositions written by high school students. The
students' demographic characteristics were as follows: 46.7%
female and 53.3% male; 77.7% White, 17.3% Black, and 5.0%
Other. These essays were scored on four domains by 20 raters
randomly selected from a group of 87 operational raters
contracted to rate essays as part of a 1993 field test of the
Georgia High School Writing Test. The four domains were:
1. Content/Organization: measuring student competence in the
development of a controlling idea.
2. Style: measuring student competence in the control of
language to establish individuality.
3. Conventions: measuring student competence in the use of
the appropriate conventions of standard written English.
4. Sentence formation: measures student competence in the
formulation of correct sentences.
In this application, the Rasch model was used to
estimate the student abilities, the rater abilities, the
domain difficulty, and rater/domain interaction effect. The
following research questions were addressed:
10
Page 11
10
1. Are there significant rater differences using the
students' domain scores?
2 Are there significant differences in the level of domain
difficulty?
3. Are raters equally severe or lenient on all domains?
The major focus of the study was on identifying and
describing rater by domain interaction effects.
The FACETS computer program (Linacre & Wright, 1994) was
used to run the Rasch model analyses. In this case, three
facets were in the model: students, raters, and domains.
Results
Facet Map
Fig. 1 maps the elements of the three facets on a
vertical "ruler". Column 1 shows the scale ("Measure") in
logit units from -8 (corresponding to lowest student ability,
most lenient rater, or easiest domain) to 9 (corresponding to
highest student ability, most severe rater, or most difficult
domain). Column 2 shows the spread of student writing
ability with upper portion being the high ability and the
lower portion being the lower ability. The rater facet in
column 3 is centered at zero. Raters whose severity level is
below zero were more lenient than those above zero, who were
more severe. The domain facet in column 4 is also centered at
zero, with Domain 2 (Style) being the most difficult, and
Domain 4 (sentence formation) being the easiest.
Student Measures
Page 12
11
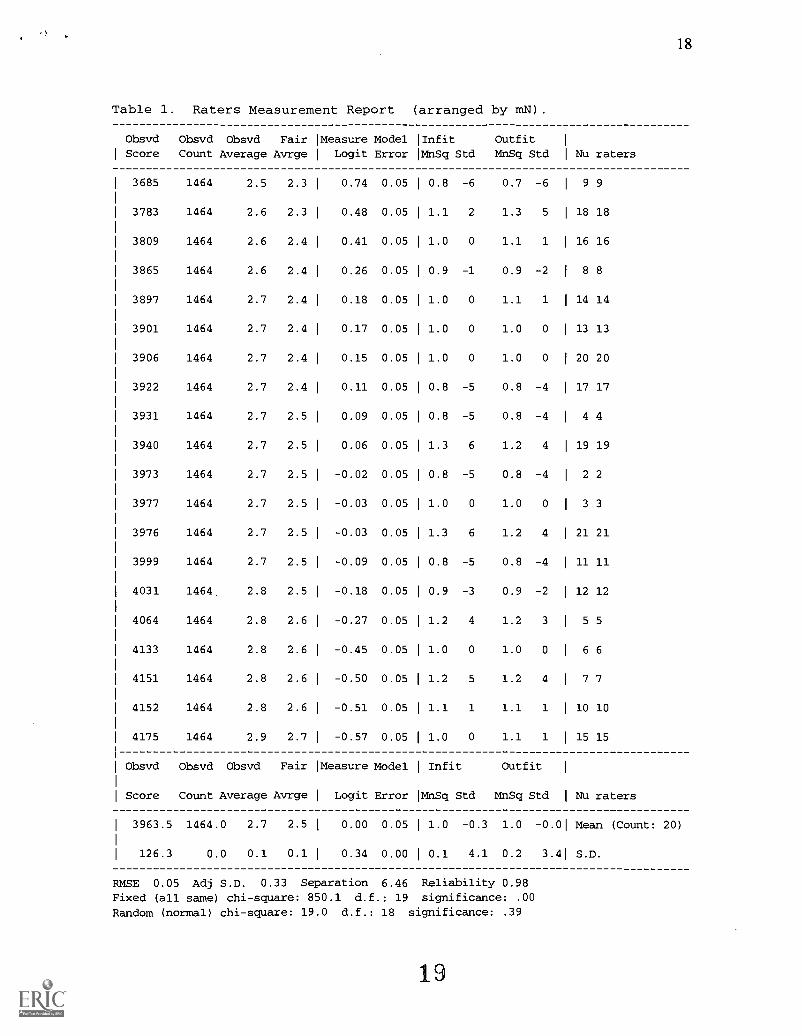
Student ability ranged from -7.45 to 8.06 and the fit
statistics showed a high reliability of separation index R =
.99. There was also significant differences in student
writing ability x2 (N =366)=45754.3, df = 365, p < .001 (see
Table 1).
Domain Measures
Table 2 shows the Domains measurement report. The style
domain was more difficult (0.66 logits), followed by
Content/Organization (.32 logits), then Conventions (-0.08
logits), and the easiest was Sentence formation (-0.91
logits) . The fit statistics indicate that the fit of the
domain difficulty ratings to the model are acceptable (Msq.
ranged between .9 to 1.1) . However, there were significant
differences in the level of difficulty between the domains (x2
(N = 4) = 2531.5, df = 3, p < .001). Figure 2, based on an
enlarged facet map scale, highlights the differences in the
levels of domain difficulty.
Rater Severity
The severity of the raters ranged from -0.57 logits for
rater 15 who was most lenient to .74 logits for rater 9 who
was most severe. Overall, rater severity falls between
+1.00 and -1.00 logits which may indicate a healthy range of
severity. However, there were still overall significant
differences between raters (x2 (N = 20) = 850.1, d.f. = 19,
p< .001 (Table 3). The outfit Msq. ranges from 0.7 to 1.1,
indicating that the fit of the ratings to the model was
Page 13
12
acceptable. Figure 3, which is based on an enlargement of the
facet map scale, clearly highlights the rater differences.
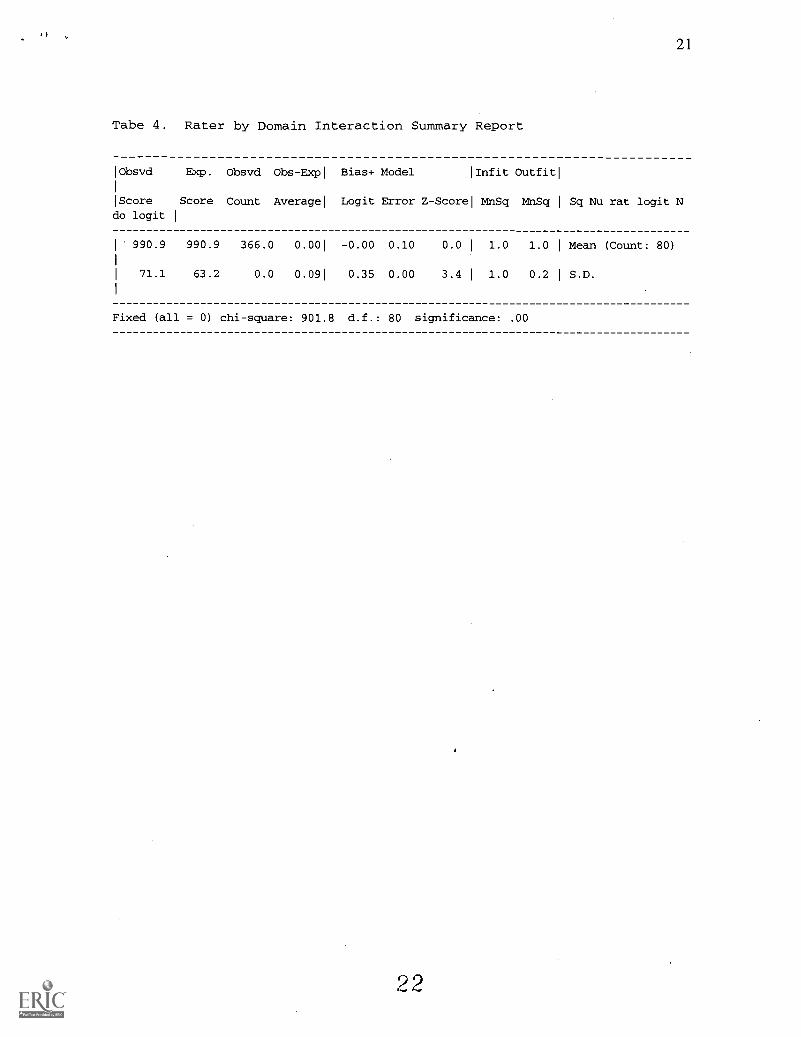
Rater/Domain Interaction
Z-scores above 2.0 or below -2.0 would indicate an
interaction effect. According to the Bias/Interaction
report, there were several raters who seemed to be too
lenient or too severe on certain domains. Z-scores ranged
from -7.8 to 7.2. For example, rater 15 with an expected
score of 1052.0 had an observed score of 983 on domain 3,
translating into a Z-score of 7.2. There was an overall
statistically significant rater by domain interaction effect
X2 (N = 80) = 901.8, df. = 80, p < 0.001 (Table 4).
Figures 4 to 7 graphically illustrate the rater by
domain interaction effect as indicated by the different Z-
scores on the four domains respectively: Content/Organization
(#1 in the output), Style (#2), Conventions (#3), and
Sentence Formation (#4). For example, in Fig. 4 regarding
the Content/Organization domain, it can clearly be seen that
raters #5, #13, and #18 have much lower (interaction) Z-
Scores than raters #17, #19, and # 21. Fig. 8 which
illustrates the rater by domain interaction effect for all
domains, indicates some rater patterns. For example, rater
# 4's Z-scores center around 0, ranging from -0.90 on
Content/Organization to 0.7 on Style compared to rater # 13
whose Z-scores range from -6.2 (too lenient) on the
Conventions domain to 6.7 (too severe) on the Style domain.
Page 14
13
Discussion and Conclusion
The finding of significant differences between raters
means that for the individual student, it matters who rates
their essay. This should not be the case. Other studies have
reported this seemingly persistent rater effect (Du & Wright,
1997; Engelhard, 1994) and it prevails in spite of intensive,
expensive, and rigorous rater training. More effort is needed
to try to minimize these differences. Perhaps, qualitative
surveys exploring rater insights about the rating process and
dynamics may provide some meaningful explanations of the
rater differences. Given the increasing nationwide acceptance
of large-scale performance assessments, many of which are
high-stakes (Welch & Miller, 1995), the need for continuous
exploration of rater differences cannot be overemphasized.
The finding of an overall significant rater by domain
interaction effect is interesting and warrants further
investigation. Although the outfit mean squares for the rater
by domain interaction (ranging from 0.7 to 1.4) is within
acceptable limits (Engelhard, 1996; Lunz, Wright, Linacre,
1990), Smith, Schmacker, and Bush (1998, p. 77) suggest that
"mean squares are more sensitive to sample size and reliance
on a single critical value for the mean square can result in
an under detection of misfit." Based on the Z-scores for the
interaction effects, raters seem to be too lenient or too
severe depending on the domain being scored, as Figures 4 to
8 illustrate. For the individual student, therefore, this
14
Page 15
14
creates another obstacle to a fair score: the student's score
should not depend on rater "bias" towards a certain domain.
The interaction also complicates the situation because it
makes it inappropriate to adjust for overall rater severity.
Therefore, the rater by domain interaction effect points to
another area of concern for administrators and test
developers.
By focusing on the individual person, rater, and domain
parameters, the Rasch model seems to be a very useful tool
for test developers and administrators who can use the
results not only to calibrate raters and domains and measure
persons, but also to identify misfitting raters and domains.
Such information is indispensable if the goal is objective
measurement.
15
Page 16
15
References
Afflerbach, P. (1985). The state assessment of writing.
Princeton, NJ: Educational Testing Service.
Applebee, A. N., Langer, J. A., & Mullis, I. (1985).
Writing: Trends across the decade, 1974-1984. Princeton, NJ:
Educational Testing Service.
Applebee, A. N., Langer, J. A., Jenkins, L. B. Mullis,
I., & Foertsch, M. A.(1990). Learning to write in our
nation's schools: Instruction and achievement in 1988 at
grade 4, 8, and 12. Princeton, NJ: Educational Testing
Service.
Bond, L. (1995) . Unintended consequences of performance
assessments: Issues of bias and fairness. Educational
Measurement: Issues and Practice, 14(3), 21-24.
Du, y. & Wright, B. D. (1997). Measuring student
writing abilities in a large-scale writing assessment. In M.
Wilson, G. Engelhard, K. Draney (Eds.), Objective
Measurement: Theory into Practice (pp. 1-24). Norwood, NJ:
Abex Publishing Corporation.
Engelhard, G. (1992). The measurement of writing
ability with a many-faceted Rasch model. Applied Measurement
in Education, 5(3), 171-191.
Engelhard, G. ( 1994). Historical views of the concept
of invariance in measurement theory. In M. Wilson (Ed.),
Oblective measurement: Theory into practice, pp. 73-99.
Norwood, NJ: Ablex Publishing Corporation.
Page 17
16
Engelhard, G. (1994). Examining rater errors in the
assessment of written composition with a many-faceted Rasch
model. Journal of Educational Measurement, 31(2), 93-112.
Engelhard, G. (1996). Evaluating rater accuracy in
performance assessments. Journal of Educatioonal
Measurement, 33 (1), 56-70.
Engelhard, G., Gordon, B, Walker, E. V., & Gabrielson,
S. (1994). Writing tasks and gender: Influences on writing
quality of black and white students. Journal of Educational
Research, 87, 197-209.
Gabrielson, S., Gordon, B., & Engelhard, G. (1995). The
effects of task choice on the quality of writing obtained in
a statewide assessment. Applied Measurement in Education,
8(4), 273-290.
Hambleton, R. K. and Jones, R. W. (1993). Comparison of
classical test theory and item response theory and their
applications to test development. Educational Measurement:
Issues and Practice, pp. 38-47.
Linacre, J. M., & Wright, B. D. (1994). A user's guide
to FACETS: Rasch measurement computer program. Chicago: MESA
Press.
Linn, R. L., Baker, E. L., & Dunbar, S. B.(1991).
Complex, performance-based assessment: Expectations and
validation criteria. Educational Researcher, 20(8), 15-21.
17
Page 18
17
Lunz, M. E., Wright, B. D., & Linacre, J. M. (1990).
Measuring the impact of judge severity on examination scores.
Aipplied Measurement in Education, 3, 331-345.
,Smith, R. M., Schmaker, R. E., & Bush, M. J. (1998).
Using item mean squares to evaluate fit to the Rasch model.
Journal of Outcome Measurement, 2 (1), 1998.
Welch, C. J. & Miller, T. R. (1995). Assessing
differential item functioning in direct writing assessments:
Problems and an example. Journal of Educational Measurement,
32(2) , 163-178
Wright B. D. (1967). Sample-free test calibration and
person measurement. Invitational Conference on Testing
Problems, pp. 85-101. Princeton, NJ: Educational Testing
Services.
Wright B. D. (1977). Solving measurement problems with
the Rasch model. Journal of Educational Measurement, 14 (2),
97-116.
Zwick, R., Donoghue, J. R., & Grimes, A. (1993).
Assessment of differential item functioning for performance
tasks. Journal of Educational Measurement, 30 (3), 233-251.
Page 19
Table 1.
ObsvdScore
Raters Measurement Report (arranged by mN).
Obsvd Obsvd Fair 'Measure Model 1Infit OutfitCount Average Avrge Logit Error 114nSq Std MhSq Std NU raters
3685 1464 2.5 2.3 0.74 0.05 0.8 -6 0.7 -6 9 9
3783 1464 2.6 2.3 0.48 0.05I
1.1 2 1.3 5I18 18
3809 1464 2.6 2.4 0.41 0.05 1.0 0 1.1 1I
16 16
3865 1464 2.6 2.4 0.26 0.05I
0.9 -1 0.9 -2 8 8
3897 1464 2.7 2.4 0.18 0.05I
1.0 0 1.1 1 14 14
3901 1464 2.7 2.4 0.17 0.05I
1.0 0 1.0 0I
13 13
3906 1464 2.7 2.4I
0.15 0.05I
1.0 0 1.0 0 20 20
3922 1464 2.7 2.4I
0.11 0.05 0.8 -5 0.8 -4 17 17
3931 1464 2.7 2.5I
0.09 0.05I
0.8 -5 0.8 -4 4 4
3940 1464 2.7 2.5 0.06 0.05I
1.3 6 1.2 4I
19 19
3973 1464 2.7 2.5I
-0.02 0.05I
0.8 -5 0.8 -4 2 2
3977 1464 2.7 2.5I
-0.03 0.05I
1.0 0 1.0 0 3 3
3976 1464 2.7 2.5 -0.03 0.05I
1.3 6 1.2 4 21 21
3999 1464 2.7 2.5I
-0.09 0.05I
0.8 -5 0.8 -4 11 11
4031 1464 2.8 2.5 -0.18 0.05I
0.9 -3 0.9 -2I
12 12
4064 1464 2.8 2.6I
-0.27 0.05 1.2 4 1.2 3 5 5
4133 1464 2.8 2.6 -0.45 0.05I
1.0 0 1.0 0I
6 6
4151 1464 2.8 2.6 1 -0.50 0.05I
1.2 5 1.2 4I
7 7
4152 1464 2.8 2.6 1 -0.51 0.05 1.1 1 1.1 1I
10 10
4175 1464 2.9 2.7 1 -0.57 0.05I
1.0 0 1.1 1I15 15
Obsvd Obsvd Obsvd Fair 'Measure Model Infit Outfit
Score Count Average Avrge 1 Logit Error 1MnSq Std MnSq Std Nu raters
18
1 3963.5 1464.0 2.7 2.5 1 0.00 0.05 1 1.0 -0.3 1.0 -0.01 Mean (Count: 20)
1 126.3 0.0 0.1 0.1 1 0.34 0.00 1 0.1 4.1 0.2 3.41 S.D.
RMSE 0.05 Adj S.D. 0.33 Separation 6.46 Reliability 0.98
Fixed (all same) chi-square: 850.1 d.f.: 19 significance: .00
Random (normal) chi-square: 19.0 d.f.: 18 significance: .39
19
Page 20
19
Table 2. Domains Measurement Report (arranged by mN).
Obsvd Obsvd Obsvd Fair 1Measure Model 1 Infit Outfit
Score Count Average AvrgeI
Logit Error 1MnSq Std MnSq Std N domains
18569
19217
19975
21509
19817.5
1096.1
7320
7320
7320
7320
7320.0
0.0
2.5
2.6
2.7
2.9
2.7
0.1
2.3I
2.4
2.5
2.8 I
2.5I
0.2I
0.66
0.32
-0.08
-0.91
0.00
0.59
0.02
0.02
0.02
0.02
0.02
0.00
1.0
I
1.1
I0.9
I 1.0
I
1.0
I
0.0
0
3
-4
0
-0.3
2.8
1.0
1.1
0.9
1.0
1.0
0.0
0
3
-2
0
0.51
2.31
2 2
1 1
3 3
4 4
Mean
S.D.
(Count: 4)
RMSE 0.02 Adj S.D. 0.59 Separation 25.35 Reliability 1.00Fixed (all same) chi-square: 2531.5 d.f.: 3 significance: .00Random (normal) chi-square: 3.0 d.f.: 2 significance: .22
20
Page 21
20
Table 3. Student Summary Report
Obsvd Obsvd Obsvd Fair 1 Calib Model 1 Infit Outfit 1
Score Count Average Avrge 1 Logit Error 1MnSq Std MnSq Std 1 Num students
216.6 80.0 2.7 2.7 1 0.79 0.23 1 1.0 -0.1 1.0 -0.11 Mean (Count: 366)
59.3 0.0 0.7 0.7 1 2.84 0.07 1 0.2 1.5 0.3 1.51 S.D.
RMSE 0.24 Adj S.D. 2.83 Separation 11.58 Reliability 0.99Fixed (all same) chi-square: 45754.3 d.f.: 365 significance: .00Random (normal) chi-square: 362.5 d.f.: 364 significance: .51
Page 22
21
Tabe 4. Rater by Domain Interaction Summary Report
IObsvd Exp. Obsvd Obs-Expl Bias+ Model IInfit Outfit'
IScore Score Count Average Logit Error Z-Scorel MnSq MnSq I Sq Nu rat logit Ndo logit I
I 990.9 990.9 366.0 0.001 -0.00 0.10 0.0 I 1.0 1.0 I Mean (Count: 80)
I 71.1 63.2 0.0 0.091 0.35 0.00 3.4 I 1.0 0.2 I S.D.
Fixed (all = 0) chi-square: 901.8 d.f.: 80 significance: .00
Page 23
22
Figure 1. FACET Map for Students, Raters, and Domains.
Itleasrl+students 1-raters
High Ability Severe+ 9 + +
1 1 1
+ 8 + +
1 1 1
+ 7 + . +
1 1 - 1
+ 6 + . +
1 1 *- 1
+ 5 + *. +
1 1 *. 1
+ 4 + ****. +
1
1 ******1
+ 3 4_ ******** 4_
1
1 *****.1
+ 2 + ******. +
1
1 *****.1
+ 1 4_ *****. +
1
1 *******1 16 18
* 0 * **** * 11 12
1
1 ****1 10 15
+ -1 + ***. +
1 1 ***. 1
+ _2 4. ***** +
1 1 ** 1
+ -3 + *** +
1 1 ***. 1
+ -4 + *. +
1 1 *. 1
+ -5 + * +
1 1 * 1
+ -6 + +
1 1 1
+ -7 + +
1 1 1
+ -8 + +
Low Ability Lenient
Measrl * = 4 1-raters
8
13
5
9
14
6
17
7
19 2 20 21 3 4
1-domains1s.1
Difficult+ +(4)
1 1
+
1 1
+ +
1 1
+ +
1 1
+-I-
1 1
+
1 1
+ +
1
+ + 3
1 1
+ +
1 1 21
* 3 *
1 1
+ 4 +
1 1 2
+ +
1 1
+ +
1 1
+ +
1 1
+ +
1 1
+ +
I I
+ +
1 1
+ +(1)
Easy
1 -domains1S.1
1
+
1
+
1
+
1
+
1
+
1
+
1
+
1
+
1
+
1
*
1
1
+
1
1
+
1
1
+
I
+
1
+
1
Page 24
0
1
0
-1
Figure 2Domain differences
23
ffi
0 1 2
Domains
3
1 = Content/Organization2 = Style3 = Conventions4 = Sentence Formation
4
4
Page 25
1
o
-1
Figure 3
Rater Differences
24
i
ii
i
o 10Raters
25
20 30
Page 26
10
8
6
4
292
(i)0
-2 -
-4-
-6-
-8 -
-1 0
Figure 4 25Rater by Domain Interaction for Content/Organization
-0- Cr)1 0
Raters
2 6
20 30
Page 27
a)
0(/)
10
8
6
4
2
0
-2 -
-4 -
-6
-8 -
-10
Figure 5Rater by Domain Interaction for Style
26
1 00 STYLE Raters
27
20 30
Page 28
Figure 6 27Rater by Domain Interaction for Conventions
Raters
Page 29
80
10
8
6
4
2
0
-2 -
-4 -
-6 -
-8 -
-10
Figure 7 28Rater by Domain Interaction for Sentence Formation
CI SF10
Raters20 30
Page 30
K1
Figure 8 29Rater by Domain Interaction for all Domains
o to-- M---*-- STYLE
a-- cawSF
1
10Raters
20 30
Page 31
U.S. Department of EducationOffice of Educational Research and Improvement (0ERI)
National Library of Education (NLE)Educational Resources Information Center (ERIC)
REPRODUCTION RELEASE(Specific Document)
I. DOCUMENT IDENTIFICATION:
ERICTM028902
Title: 4 PPLytiv 71.16- gAscH mo06-1, TO Px PLo /2-6 12-147-E--(e-
16v aliFivCES 0eV Th ACSTC5FP OVA Wy t SrliDoiiis' tal-PNG ASILI7yAuthor(s): A-414 I L 5 . GyA G 6.-A/D4 at r E71/ 6 /4/4-A.
Corporate Source:
bill oily wv,veiLs,7YPublication Date:
61-e P-n- Ogg
II. REPRODUCTION RELEASE:
In order to disseminate as widely as possible timely and significant materials of interest to the educational community, documents announced In themonthly abstract journal of the ERIC system, Resources in Education (RIE), are usually made available to users in microfiche, reproduced paper copy,and electronic media, and sold through the ERIC Document Reproduction Service (EDRS). Credit is given to thesource of each document, and, Ifreproduction release is granted, one of the following notices is affixed to the document.
If permission is granted to reproduce and disseminate the identified document, please CHECK ONE of the following three options and sign at the bottomof the page.
The sample sticker shown below will beaffixed to ell Level 1 documents
PERMISSION TO REPRODUCE ANDDISSEMINATE THIS MATERIAL HAS
BEEN GRANTED BY
TO THE EDUCATIONAL RESOURCESINFORMATION CENTER (ERIC)
Level 1
Cheek here for Level 1 release. permitting reproductionand dissemination in microfiche or other ERIC archival
media (e.g., electronic) and paper copy.
Signhere,-)please
The sample sticker shown below will beaffixed to all Level 2A documents
PERMISSION TO REPRODUCE ANDDISSEMINATE THIS MATERIAL IN
MICROFICHE, AND IN ELECTRONIC MEDIAFOR ERIC COLLECTION SUBSCRIBERS ONLY,
HAS BEEN GRANTED BY
2A
TO THE EDUCATIONAL RESOURCESINFORMATION CENTER (ERIC)
Level 2A
Check here for LeVel 2A release, permitting reproduclionand dissemination In microfiche and In electronic media
for ERIC archival collection subscribers only
The sample slicker shown below will beaffixed to ell Level 28 documents
PERMISSION TO REPRODUCE ANDDISSEMINATE THIS MATERIAL IN
MICROFICHE ONLY HAS BEEN GRANTED BY
2B
TO THE EDUCATIONAL RESOURCESINFORMATION CENTER (ERIC)
Level 28
Check here for Level 28 release, permlingreproduclion and dissemination in microeche only
Documents will be processed as Indicated provided reproduction quality permits.If permission to reproduce Is granted, but no box is checked, documents Mil be processed at Level 1.
I hereby grant to the Education& Resources Information Center (ERIC) nonexclusive permission to reproduce and disseminate this documentas indicated above. Reproductidn from the ERIC microfiche or electronic media by persons other than ERIC employees and its systemcontractors requires permission from the copyright holder. Exception Is made for non-profit reproduction by libraries and other service agenciesto satisfy information needs of educators in response to discrete Inquiries.
mAddre,:rE1149/2-y (mit/Ns/7v, oil/iv/A, ercolc0 /ion/ >Pi 1791, NOW &eCpt-NPA009 6-4
Printed Nwne/Positiorattle:
564A1L S. 6yA GenTelephore: 4c0f )re FAX (icipt.1)
721 - Si (illEMail Address:
ciya5eo peroorj .e4,4Cate
frA1)4.1, Mir(over)