DOCUMENT RESUME ED 058 846 HE 002 783 AUTHOR Jellema, William W. TITLE The Numbers Game. A Study of Enrollment Patterns in Private Colleges and Universities. INSTITUTION Association of American Colleges, Washington, D.C. PUB DATE Jan 72 NOTE 43p. EDRS PRICE MF-$0.65 HC-$3.29 DESCRIPTORS Educational Finance; *Enrollment; *Enrollment Trends; *Financial Needs; *Higher Education; *Private Colleges ABSTRACT This report presents data obtained from a survey conducted during the summer of 1970 in which private U.S. colleges and universities were asked to report on past and projected enrollment patterns for every year from 1965-66 through 1971-72. The various categories covered in the survey included freshman applications, freshman admissions, freshman head-count enrollment, total undergraduate head-count enrollment, total graduate head-count enrollment, total full-time equivalent undergraduate enrollment, and total full-time equivalent graduate enrollment. Findings generally show that enrollment has been decreasing in the last several years. Most of the participating institutions had predicted a rise in enrollment for 1970-71; however, a follow-up survey indicates that these predictions were wrong and that yet another decrease actually occurred. This constant decrease in enrollment is not only affecting institutional size but also the financial situation of the colleges. If private colleges and universities are to survive, they need to incorporate better studies, aggressive admissions programs and, above all, attractive academic programs into their regular college functions. (HS)
Transcript
DOCUMENT RESUME
ED 058 846 HE 002 783
AUTHOR Jellema, William W.TITLE The Numbers Game. A Study of Enrollment Patterns in
Private Colleges and Universities.INSTITUTION Association of American Colleges, Washington, D.C.PUB DATE Jan 72NOTE 43p.
ABSTRACTThis report presents data obtained from a survey
conducted during the summer of 1970 in which private U.S. collegesand universities were asked to report on past and projectedenrollment patterns for every year from 1965-66 through 1971-72. Thevarious categories covered in the survey included freshmanapplications, freshman admissions, freshman head-count enrollment,total undergraduate head-count enrollment, total graduate head-countenrollment, total full-time equivalent undergraduate enrollment, andtotal full-time equivalent graduate enrollment. Findings generallyshow that enrollment has been decreasing in the last several years.Most of the participating institutions had predicted a rise inenrollment for 1970-71; however, a follow-up survey indicates thatthese predictions were wrong and that yet another decrease actuallyoccurred. This constant decrease in enrollment is not only affectinginstitutional size but also the financial situation of the colleges.If private colleges and universities are to survive, they need toincorporate better studies, aggressive admissions programs and, aboveall, attractive academic programs into their regular collegefunctions. (HS)
L\1
THE NUMBERS GAME
A Study of Enrollment PatternsIn Private Colleges and Universities
by
William W. JellemaExecutive Associate and Research DirectorAssociation of American Colleges
'I ,
10 7 2
i
. -,
DUCEDEXACTLY AS
RECEIVEDFROM.
THIS DOCUMENTHAS BEEN REPRO-
THEPERSON OR ORGANIZATION
ORIG.
%HATING IT.POINTS OF
VIEW DR OPIN-
IONS STATEDO IAL
s
DO NW NECESSARILY
REPRESENTFFIC
OFFICE OFEDU
CATION POrnoNOR POLI
1
CY.
U.s. DEPARTMENTOf HEALTH.
EDUCATION&
iWELFARE
OFFICE of EDUCATION
%
The Roundup of Enrollment Data
In the early summer of 1970 ne institutions in our study wereasked to report on past and projected enrollment patterns. We soughtto obtain information for every year from 1965-66 through 1971-72on freshman applications, freshman admissions, freshman head countenrollment, total undergraduate head count enrollment, total graduatehead count enrollment, total full time equivalent undergraduateenrollment and total full time equivalent graduate enrollmalt. Thiswas a formidable request for an enormous amount of data. It tooka lot longer to fill out than it takes the reader to look over the
list. Not surprisingly, some of our respondents quailed before thetask. What is surprising is the very substantial number that wereable to supply us with all of these data.
It is also interesting to note the points at which the largestnumber of willing but unab1 ,z! respondents fail. Freshman applicationsand freshman admissions are not, apparently, such generally acceptedcategories that all colleges and universities maintain careful andeasily accessible records on them. Seventy-two institutions (thirteenper cent) were unable to supply us with data on their freshman appli-cations in 1965-66.and 81 institutions (fifteen per cent) wereunable to tell us how many freshman applicants they granted admissionin that year. Only 29 institutions (five per cent) were unable tosupply us with freshman head count enrollment for 1965-66 and lessthan three per cent failed to supply total head count and total fulltime equivalent data for that year. The data were better ior 1966-67 but some of that year's data were still too entangled in the cobwebsof history for ten or twelve per cent of our institutions. Althoughas many as eight or nine per cent of the institutions in some ofthe remaining years found data on freshmen too much of a nuisanceto report, beginning with 1967-68 the responses improved considerably.
Until 1971-72. Eleven per cent declined to project any enroll-ment data -- not merely freshman data -- for that year. Fourteenper cent declined to speculate on freshman applications and seventeenper cent declined to speculate on freshman admissions. It is
fascinating but unproductive to speculate on the reasons for omittingthe projected enrollment data for 1971-72. Perhaps some locked intothe crystal ball, did not like what they saw and, to avoid givingthe image permanency in their minds, did not record it. No doubtmost of those declining to answer thought that the shreds of evidencethey had were too slender for the projection to these kinds of data.
-2-
There are many ways to report these data but none of them, alas,is fully satisfactory. If we reduce all of the figures to a "perreporting institution" basis and develop percentagefrom that point,we have no control over the nature of the institutions that pop inand out of the data, reporting where they have information and absentingthemselves from the statistics when they do not have data. On the
other hand, to reduce the data entirely to institutions which wereable to respond to all 49 items on enrollment would lower the responserate more than necessary and make a special selection among the totalnumber of institutions about which we could know little and overwhich we would have no control. Is there, for example, a relationshipbetween the fact that an institution is unable to supply certain datafor 1965-66 and its financial condition? Perhaps, but we have noway of knowing.
What we have done, therefore, is to eliminate from any category --freshman applications, for instance -- institutions unable to supplydata for all the years. Because a smaller number of institutionsare able to supply data on freshman admissions -- to take another forinstance -- we reduce the data to a "per reporting institution" basiswhen making comparisons between categories. Because this method alsoincludes the possiblity that the data are skewed in hidden ways,comparisons between categories may be more suggestive than precise.
Reluctantly excluding, then, all institutions that failedto supply freshman application data in any year, this is theapplication picture that emerges for 431 priv3te colleges and univer-sities from 1965-66 through a projected 1971-72.
Freshman Applications
Freshman applications decreased a mild 0.3 per cent in 1966-67over the previous year and declined again the year following by1.5 per cent. A minuscule decrease in 1968-69 -- less than one tenthof one per cent -- was followed by a 4.6 increase in 1969-70. This
lent courage to private institutions and they projected a 4.6 percent additional increase in 1970-71 to be followed by a precedentshattering -- for the years covered in this study -- 5.7 per centprojected increase for 1971-72. A cumulative increase, 1965-66 through1971-72, of 13.6 per cent -- only 2.8 per cent of which had actuallybeen realized at the time the data were reported° The remainderwas projGcted to come in the next two years.
Freshman applications are needed, of r,ourse, to produce fresh-man admissions from which come freshman enrollments, which contributein turn to total enrollment, and this needs to rise to conform to
-3-
the long-range plan and, more importantly, to balance the projectedbudget -- or at least reduce its imbalance. This is very logical
and very hopeful. Logic and hope, however, do not produce increasedfreshman applications.
In 1967-68, when freshman applications declined 1.5 per cent,private colleges and universities matched this by raising theirpercentages of admissions 1.6 per cent -- and still suffered adecline in freshman head count enrollment of 1.3 per cent. Totalundergraduate head count enrollment -- thanks, apparently, totransfers and better retention -- actually increased by 2.5 per cent.
The zero per cent change in freshman applications in 1968-69prompted the extension of the strategem employed the previous year.Accordingly, private institutions raised their rate of admissionsanother 1.6 per cent -- admitting almost sixty per cent of thefreshmen who applied. The ploy was not altogether successful, however,for freshman head count enrollment actually increased only 0.4 per cent.
In 1969-70 freshman applications increased 4.6 per cent, thepercentage admitted stayed at about sixty (59.7) per cent, and, asan apparent consequence, freshman head count enrollment increased
3.2 per cent. The total undergraduate head count increased 0.7per cent -- half the amount of increase the previous year.
As respondents looked to the fall of the year in whidh theyresponded, they saw a further increase in freshman applicationsof 4.6 per cent, a slight fall in the rate of admissions to 58.4per cent, with a net gain in freshman head count enrollment of 2.5per cent. Total undergraduate head count enrollment as well astotal undergraduate full time equivalent enrollment were to increaseabout one and one half per cent.
As the ins itutions thi7t responded with predictions lookedahead a year to the fall of 1971, however, they had their eyes moreon their budgets than on their recent application-admission-enroll-ment history.
Freshman applications were projected to rise by 7 per cent;the rate of freshman admissions was projected to retl A to a ratejust under that employed in 1968 -- 57.6 per cent; ye freshmanhead count enrollment was projected to rise by a hanO ome 4.2 percent; total undergraduate head count was to rise 2.9 per cent,and total undergraduate full time equivalent enrollment by 2.7 per cent.
For institutions with a cumulative percentage increase of 10.3per cent in total head count enrollment over the five years of data
-4-
covered by the years 1965-66 through 1969-70, a projected risein 1971-72 of sltghtly less than three per cent does not seemunreasonable or overly ambitious -- except that over the five
years of known data the percentage of increase had declined eachsucceeding year until in 1970 it was less than one per cent. Like
the merchants in Herb Shriner's home town who, anxious for touristtrade, lowered the speed limit to zero and then passed a law againstbacking up, private colleges seemed to be trying by an act of will
to determine that enrollment would rise.
Using data only from institutions able to supply information
for all of the years from 1965-66 through 1971-72 eliminates anumber of institutions whose ability to predict may be less precise
than that of other institutions, partly because of an inadequate
history of data. If the data on freshman applications were reportedon a "per reporting institution" basis, the figures for the threeyears beginning 1968-69 would not be substantially different fromthose reporting above. For projected 1971-72, however, the hoped-forincrease would be 7.6 per cent rather than the 5.7 per cent reportedabove. Institutions with the most inflated expectations regardingfuture enrollment patterns often appear to be also the ones withinadequate data.
The more discouraging the past data and the more perilous thepresent situation, the higher the expectations for the future. This
is evident when the patterns of institutions by various enrol)mentgroups are compared. The table showing the percentage of increaseor decrease in freshman applications from one year to the next is
highly revealing.
Institutions in the 2001-4000 head count range appeared tohave, collectively, a more realistic view of future freshmanapplications in the light of their past record than any other group.The expectations of the 4001 and above institutions also seemedrelatively sober in the light of previous performance. And theexpectations of the group of institutions in the 1001-2000 range,while high, appeared relatively reasonable when compared with insti-tutions in the 501-1000 range -- let alone when campared with thoseenrolling 500 or less.
For all enrollment groups save one, both 1966-67 and 1967-68were years in which freshman aptlications decreased. That onegroup -- the group of institutions having the largest enrollments --experienced a mild decline in freshman applications only in 1968-69. No group could afford to take the decline in freshman applica-tions smilingly; but the most severely afflicted were the institutionsenrolling 500 students or less. They experienced, successively, a5.8 per cent decrease and th,..2n a further 12.5 per cent decrease.
The fact that the rate of decrease declined the following year
to only 1.4 per cent halted what must have seemed like the pull ofgravitational acceleration, but it was scant comfort.
However, the following year -- 1969-70 -- was a year of recovery
for all five enrollment groups. The group of largest institutionsreceived a much increased number of freshman applications, belyingnot only the decrease of the year before but the decelerated rate ofincrease of the year before that. The group of institutions enrolling2001-4000 students repeated the 2.7 per cent increase of the yearbefore and thereby overcame the losses of the previous two years.The group enrolling 1001-2000 students experienced a handsome in-crease of five per cent which complemented the 1.5 per cent increase
of the year before.
Only two enrollment groups -- those with the smallest enroll-ments -- did not make sufficient recovery in applications for 1969-
70 to exceed the numbers of applications they had received in 1965-
66. Those enrolling 501-1000 followed three years of three andfour per cent declines by a 2.1 per cent increase in 1969-70, whilethose enrolling 500 or less received a whopping 8.3 per cent increase.Coupled with the previous heavy losses noted above, however, this
still left a net loss over 1965-66 of twelve per cent.
The following two years of data in the table are based onprojections submitted by the individual institutions themselves.As already noted, the larger institutions did not let one year of
improvement carry them away in their projections. The same doesnot appear to be true for the smaller institutions.
While no one looking at application data from 1965-66 through1968-69 would have been likely to predict the 8.3 per cent increasein 1969-70 which institutions in our smallest category actuallyexperienced -- and this lent pause to too ready criticism of theircollective expectations -- nevertheless, the prediction of another8.3 per cent increase to be followed by a 21.5 uer cent increasedoes take one's breath away. Once over Niagra on an innertube isremarkable. To be follwed by a repeat performance and this in turnto be capped by a ride down the Victoria Falls seemed incredible.
What these smaller institutions were doing, of course, is lessprediction than projection -- projection of budget translated intothe enrollment increases that must be achieved if the budget pro-jections are to be met. Percentage changes of considerable magnitudecome easy where small numbers are Involved. A small college looksahead and hopes for a few more students. Yet, examined es a percent-age and in the light of previous performance, seeking those fewadditional students becomes a task of very large proportions. As
shadows thrown on the wall, these percentages cast a sobering ifsomewhat exaggerated image over their plans and prospects.
6
-6-
Freshman ApplicationsNumbers and Percentage of Change for Each Year
Between 1965-66 and 1971-72by Enrollment Groups
1-500 501-1000(N=23) (N=141)
1001-2000(N=170)
2001-4000(N=49)
4001-UP(N=48)
431InstitutionsCombined
1965-66
Percentage oChange
1966-67
Percentage oChange
1967-68
Percentage ofChange
1968-69
Percentage ofChange
1969-70
12.5
1.4
6062
5712
4997
4927
5338
-2.9
-3.9
-3.8
2.1
7)897
69834
67142
64598
65933
-1.8
-2.8
1.5
5.0
172218
1
169169
164471
166997
175407
-0.7
-2.6
2.7
2.7
83703
83098
80966
83154
85434
182363
2.5
186962
1.4
189600
-1.2
187332
5.9
198460
-0.3
-1.5
0.0
4.6
515243
514775
507176
507008
530572
Percentage ofChange
(anticipated)
1970-71(anticipated)
Percentage ofChange
(anticipated)
1971-72(anticipated)
21.5
5780
7025
6.3
11.9
70100
78411
7.9
6.4
189186
201210
2.2
2.9
87332
89901
2.0
202471
3.7
209872
4.6
5.7
554869
586419
ft
Applications and Applicants
-7-
The decline in freshman applications at many private institutions
has often been attributed to the alleged fact that each student isfiling applications with fewer colleges than his counterpart_did
formerly. This is a comforting doctrine and in local instances
certainly has validity. However, it can be a two-edged sword, cutting
in more than one direction. A decline in applications may notrepresent a decline in applicants; but an increase in applications,
by the same token, may not represent an increase in applicants.
A precise applications-to-applicants ratio that will fit neatly
into our data does not exist. Both the Educational Testing Serviceand the American College Testing Program have data on the number
of institutions to which tested candidates want their scores sent,
but for a whole catalog of reasons these cannot be made to conform
to our data with sufficient precision to justify their use. Even
small imprecisions can result in large distortions when a ratio ofapplications per applicant is applied to hundreds of thousands of
applications.
However, three of the annual profiles of college freshmenpublished by the American Council on Education contain informationthat can be used to speak to this point. Students who were fresh-
men in the fall of 1967, 1968, and 1969 were asked how many applica-
tions they made to other institutions. Their replies, when tallied,
ranged from "no other applications" -- i.e., one application --
through "six or more." Counting six -- i.e., seven -- or more asseven, adding the numbers of students and the numbers of applications,and dividing applications by students, we can arrive at an average
number of applications per student. By applying this averagenumber of arplications per freshman student to the freshman applica-
tions which our institutions reported receiving in those years wehave some basis for judging whether the percentage changes inapplications received are themselves significant or are substantially
affected by the numbers of applications freshmen send. One hundred
applications might be generated by 25 applicants sending four each.
Seventy-five applications received the next year might be a signifi-
cant 25 per cent drop; or it might be due to the fact that the
same number of applicants are sending only three applications apiece --
or that twice as many applicants are averaging one and one-half
applications each.
The American Council data with information on three years permit
us only two comparisons -- although these three years are very impor-tant ones -- and only in a limited way. With these data we can arrive
at a single applicant-applications ratio for all private four-year
-8-
institutions which appears reasonably trustworthy. Grouping theAmerican Council data into a single private college and universitycategory provides us with a rough ratio of applications to applicants
that is useful for analyzing the numbers of applications receivedby all private institutions in our study.
The freshmen who enrolled in private institutions in the fallof 1967 in the four categories used in the American Council studies --private four-year nonsectarian, Protestant four-year, Catholic four-year, private university -- collectively averaged 2.60 applications
per student. Those who enrolled in the fall of 1968 averaged 2.73applications each, and those who enrolled in the fall of 1969averaged 2.69 each.
By applying these ratios to the total number of applicationsreceived by our reporting institutions we discover that the zeropercentage change in applications between 1967-68 and 1968-69 wasactually a 4.8 per cent decrease in numbers of applicants while the
4.6 per cent increase in 1969-70 over 1968-69 was really evenbetter -- a 6.2 per cent increase in the actual number of applicants.
This is sunmarized in the table below.
Total ApplicationsReceived by 431Private Collegesand Universities
Ratio ofApplicationsto Applicants
Total Numberof Applicants
PercentageChange inApplications
PercentageChange inApplicants
1967-68 507,176 2.60 195,068
0.0 -4 . 8
1968-69 507,008 2.73 185,717
4.6 6.2
1969-70 530,572 2.69 197,239
-9--
We also have available a breekdown between independent, RomanCatholic, and Protestant institutions as well as a category forprivate universities. Unfortunately, none of the religious groupingsin our study -- independent, Catholic, Protestant -- are limitedto four-year institutions. They include "universities" as well.Moreover, American Council data are received from freshmen actuallyenrolled in an institution identified in one of these three ways.It is by no means certain that if a given freshman submitted twoother applications that these were to institutions of the same type.However, these cross-overs may tend to cancel one another. Withthese caveats in mind these sub-analyses may still offer same illumin-ation on a dark problem.
The applicant-applications ratio has not been the same forthese three general "religious" groupings. It has fallen for thoseinstitutions independent of church relationship -- although theirapplicant-applications ratio is still highest; risen for thoserelated to the Raman Catholic Church; and first rose, then fell,for institutions related to Protestant denominations -- whoseapplicant-applications ratio is lowest.
When these ratios are applied to the numbers of applicationsthese types of institutions received and are compared witth percentagesof change in numbers of applications received from one year to thenext, some striking observations may be rode. The percentages comparingapplications received in one year with applications received the nextunderstate the increase in actual applicants for independent institu-tions, understate the severity of the decline for Roman Catholicrelated institutions in 1968-69 and contradict the slight rise forthese institutions in 1969-70; and understate both the decline andthe subsequent rise for Protestant related institutions.
The following table depicts these numbers and percentages.pfchange between years.
10
INDEPENDENT
1967-68
1968-69
1969-70
CATHOLIC
1967-68
1968-69
1969-70
PROTESTANT
1967-68
1968-69
1969-70
-10-
APPLICATIONS AND APPLICANTS
Applications Received Average Number of Derived Percentage
by Colleges and Applications per Actual Number Change in
Percentage
Change in
-..0.......11....) .AL M. `V 6.0.
242,755 3.2 75,8610.2 6.9
243,235 3.0 81 0786.9 10.5
259,903 2.9 89,622
108,239 2.2 49,200-0.5 -8.8
107,680 2.4 44,8671.3 -2.7
109,071 2.5 43,628
156,182 2.1 74,372-0.06 -8.7
156,093 2.3 67,8673.53 8.2
161,598 2.2 73,454
The category "university" is not one employed in our studywhere the differentiation among institutions has been by degree
level and extent of the graduate program. Institutions offeringdoctoral programs in three areas or less, for instance, are distin-
guished fram those offering the doctorate in four or more areas.However, we can roughly approximate the term as used by the Officeof Education on which the American Council study relies. Theapplications-to-applicants ratio varies only very slightly for privateuniversities over the three year period -- 2.97, 3.07, 3.01 --but when applied to the numbers of applications our "universities"
report receiving, it suggests a considerably modified picture. In
terms of raw numbers of applications received, 1968-69 varied onlyslightly from 1967-68 -- a 0.3 per cent increase; yet the actualnumber of applicants appears to have dropped 3.0 per cent. Between1968-69 and 1969-70 the nuMber of applications increased 6.7 per centwhile the actual number of applicants increased 8.9 per cent.In other words, the virtually unchanged numbers of applicationsreceived in the first two years masks the fact that a drop in actualapplicants had taken place, while the increase in applications thethird year understates the larger increase in actual applicants.
Individual colleges, of course, are still without a basis foranalyzing their awn applications-to-applicants ratio. Unless theyhave made this kind of study among their own students they will haveno way of knowing even if the "norm" for their type of institution
applies to them. History, moreover, is no sure guide to the preciseinterpretation of the present. What may be useful to individualcol]eges, however, is the combination comfort and warning evidentin tne analyses above: a decrease in applications may not reflecta decrease in real applicants; but an increase in applications maybe equally deceptive. It is a frail instrument for the admissionsofficer to use in gauging his progress from one year to the nextor for reporting to his president on the admissions status of theinstitutionw,.
Admissions and Freshman Enrollment
The rate atWhich freihmam admissions -- applying studentsfound acceptable to the institution -- are translated into actualfreshman enrollment declined significantly for the national sampleover the years covered by these data. The percentage of freshmanstudents who, after being admitted by the institutions, actuallyshowed up declined progressively from 66 per cent in 1965-66 to64 per cent in 1966-67, then to 62 per cent, 61 per cent, 60 percent in 1969-70, and was projected to stay at the 60 per cent levelfor the next two years.
12
-12-
Among institutions classified by size of enrollment, the groupof institutions with the best record of translating admissions intoactual enrollment is the group enrolling 500 or fewer students. In
1965-66 these institutions translated 76 per cent of the freshmenthey admitted into freshman heed count enrollment. That ratetumbled downward over the next few years to 73, 71, 70, and 67per cent. For the two years of forecast aata the percentage wasexpected to rise to 72 per cent.
The group doing the poorest job of translating freshman admissionsinto freshman head count enrollment is the group with the largesttotal emollments, those enrolling 4000 students or more. From 62per cent in 1965-66 to 60 per cent the following two years, to 59per cent in 1968-69, the rate dipped to 57rioer cent in 1969-70. It
was forecast by these institutions to rise slightly to 58 per cent.
Those institutions enrolling between 501 and 1000 have apattern which resembles that of the group enrolling between 2001and 4000 students while the group enrolling 1001-2000 students hasa pattern more like that of the group with the largest enrollments --
as the table below indicates.
Freshman Head Count Enrollment as aPercentage of Freshman Admissions
1965-66 through 1971-72 by Enrollment Groups.
1-500 501-1000 1001-2000 2001-4000 4001-1AR
1965-66 76 72 66 70 62
1966-67 73 68 64 67 60
1967-68 71 64 62 66 60
1968-69 70 62 61 64 59
1969-70. 67 62 60 63 57
PercentagePoint Drop 9 10 6 7 5
1970-71(projected)
72 63 60 63 59
1971-72
(projected)
72 64 60 64 59
13
-13--
Again, the groups suffering the most maeked change are thetwo smallest enrollment groups. As the line "Percentage PointDrop" indicates, although these two groups remain more successfulin 1969-70 -- by five and ten percentage points severally -- intranslating freshman admissions into freshman enrollment than thegroup with the largest enrollments, their grip on this translationrate has weakened by nine and ten percentage points while the groupwith the largest enrollments has lost only five. All groups are onstormy seas but the pitch of the waves is steepest for the smallestinstitutions.
Freshman Enrollment as a Percentage of Total Enrollment
In 1965-66 freshmen constituted 28.4 per cent of the totalundergraduate head count enrollment in private institutions. Theirpercentage of the whole has declined in the intervening years to26 per cont. While this makes for a somewhat more even spreadamong the undergraduate classes, it also means that there has beena decline in the segment of undergraduates which is relatively lessexpensive than the remaining segments. In the typical undergraduateprogram, freshmen cost less to educate than upperclassmen. Theyare frequently concentrated in larger classes as they fulfill commondistribution requirements. Upper level courses in a student'smajor field, tutorials, independent study -- all more expensiveand less easy to program for than beginning survey or distributioncourses -- come later.
Although the "advantage" of a high ratio of freshmen to totalundergraduate enrollment has a counterbalancing disadvantage --especially in very small schools -- in the large number of smallclasses that are run at the upper level whidh could accommodatemore students at no greater instructional cost to the college, thedrop in the percentage that freshmen compose of the entire studentbody in very small institutions may be partly responsible for theseverity of the fiscal problam-there. In institutions enrolling500 or less, freshmen in the fall of 1970 had declined to 27.3 percent from 34 per cent in the fall of 1965 -- a drop of 6.7 per-centage points. In institutions enrolling 501-1000 the drop was from34.8 to 28.5 per cent -- a 6.3 percentage point _drop. In institutionsenrolling 1001-2000 the drop -- 2.3 percentage points -- wasfrom 30.8 to 28.5 per cent. In institutions enrolling 2001-4000
14
-14-
it went from 26.7 to 24.5 -- a 2.2 percentage point drop --and in institutions enrolling above 4000 it fell a scant 0.5 per-centage point from 22.4 to 21.9 per cent.*
1
*The reader familiar with statistics dealing with the attritionproblem may be troubled at this point. If only forty per cent ofthe entering freshmen at a given college graduate from that collegeon schedule -- that is, four years after matriculation -- and onlytwenty per cent more graduate eventually from some college, thatstill leaves a dropout rate of forty per cent. Since in thesecircumstances it is unlikely that any of the other classes will belarger than the freshman class, how, can these attrition figures bereconciled with figures that show freghman enrollment to be buta quarter -- or less -- of total undergraduate enrollment?
First of all, we asked the institutions resrmding to our sur-vey to respond according to HEGIS practice. This means that onlystudelts who are enrolled in higher education for the first timedirectly following high school should be identified in these dataas freshmen:- In terms of class standing, there are many studentswho are not freshmen in this pristine sense, yet who at the sametime are not sophomores. They are incoming transfers with lessthan a year of transferable credit or freshmen from the previousyear who did not achieve sophomore standing. These would be includedin the total undergraduate figure, but not in the freshmen figure.Our data are comparable to HEGIS data. According to Office ofEducation figures for all colleges and universities for fall 1970,first time degree credit students -- i.e., "freshmen" -- constitute,on a head count basis, 23.5 per cent of the total undergraduatedegree-credit enrollment.
Basic to a resolution of this apparent riddle is the realizationthat in this study we are not following a given class of studentsthrough their academic career. What we have is an aggregationof data from individual institutions and what we are comparing isany year's freshmen with all other undergraduates. This masks alot of in and out migration.
Many institutions seek to pidk up as many transfers -- fromjunior colleges and elsewhere -- as they lose from their enteringfreehman class. The extent to which institutions, individuallyor collectively, achieve this goal is not visible in the figuresavailable to us. Since our figures are for private institutionsonly, moreover, the migration of students between tax-supported andprivate institutions is lost to viaw.
15
-15--
(footnote continued)
There is, furthermore, a beguiling temptation to think of thefreshman class as one of only four classes and its percentage ofthe whole as one of four percentages that make up the 100 per centtotal. All of the students who take a fifth year -- or at leastmore than four years -- to earn a baccalaureate degree are hidden
in the undergraduate total. While this group is unlikely to belarge enough to constitute a fifth class (so that freshmen couldbe considered one of five, rather than one of four classes) it islarge enough to "put a little English" on the phenomenon.
Because we are not follawing a group of specific individuals,there is a delayed reaction that is not accounted for in these data.A drop in freshman enrollment in relation to total enrollment maybe due to better retention of previous classes -- as well as toincoming transfers -- or to an actual d -op in entering freshmen.If the drop is an actual decrease in freshmen, this will have itseffect upon subsequent classes, not onprevious classes already attendingthe institution.
Finally, the attrition rates cited above are for all of highereducation, public and private. In some states the tax-supportedinstitution is required to accept any applicant with a high schooldiploma. If the institution makes no adjustment in its curricularprogram, it may be expected to have a higher dropout rate than theprivate institution which is able to do more by way of selectingstudents for their presumed ability to succoed in college. Theattrition rate for private four-year colleges and universities asa whole is not likely to be as high as for all of higher education.
Total Enrollment -- Head Count
The proof of the pudding is in actual total enrollment. Afterthe freshman applications, the application-to-applicants ratio, andthe rate of admissions, come the important figures: the number thatactually enroll -- and the number that stay enrolled.
As mentioned earlier, the rate of increase in total head countenrollment dropped steadily for private colleges and universitiestaken as a collective whole from 3.6 per cent in 1966-67 over 1965-66 to 2.5, 1.5, and 0.7 per cent the following years. Privateinstitutions projected an increase in total enrollment of 1.6 per
16
-16-
cent in 1970-71 and 2.9 per cent in 1971-72. Putting aside the
projections for a moment, it is important to note that this declining
rate of increase came during a period of rising rate of increase --
at least until the fall of 1969 -- for higher education as a whole --
public and private, four-year and two-year. In a static situation
these declining rates of increase in private institutions would
probably have been actual decr'eases. Quite apart from the fact that
all of higher education may be looking forward to a virtually static
situation, and private higher education to a static or retrenching
position, to have experienced a declining rate of increase in the
midst of a rising rate for others is to have experienced something
very mucill like an absolute decline. A declining situation is very
different from a dynamic one both fram a psychological and, apparently,
from a cost point of view.
For some institutions it was not merely a declining rate of
increase. It was a decline, period. In the State of Alabama, for
instance, a two per cent increase in undergraduate enrollment in
the fall of 1966 over the previous year was followed by successive
decreases of 0.4, 0.3, and 8.0 per cent. (These institutions pro-
jected increases the following two years at the rates of 1.5 and
3.9 per cent.) Institutions in the State of Iowa, after a 5.9 per
cent increase ran decreases of 6.5, 1.4, and 2.4 per cent -- with
projected increases of 2.3 and 4.0 per cent attached. Ignoring the
projections, this amounts to a total net loss in Iowa in undergraduate
head count enrollment of 4.8 per cent since the fall of 1965. In
Maryland and Wisconsin, in addition to Iowa and Alabama -- all states
with at least 8 institutions reporting -- private institutions
suffered net losses in enrollment in 1969-70 over 1965-66, and in
Kentudky, Louisiana, Missouri, and Nebraska, private institutions are
below their fall 1966 enrollments. These absolute declines, togetherwith some declines in rates of increase as well as rises and falls,
are set forth in the following table. Only stateswith at leastfive institutions reporting undergraduate head count enrollment are
reported in this table.
17
Percentage of Change from Year to Year in
Total Undergraduate Head Count Enrollment by States
1965-66/66-67
1966-67/67-68
1967-68/68-69
1968-69/69-70
1969-70/70-71
(projected)
1970-71/71-';
(projected)
Alabama
2.0
-0.4
-0.3
-8.0
1.5
3.9
California
3.0
3.4
2.7
5.2
4.0
3.9
Connecticut
12.4
6.3
1.1
0.2
1.8
3.4
Florida
-5.1
13.7
6.9
4.9
2.4
2.4
Georgia
5.9
2.3
-0.3
-0.1
4.5
4.3
Illinois
4.4
1.3
0.5
1.3
-1.0
1.9
Indiana
1.4
3.0
1.7
0.6
1.3
3.1
I
1.1.1
Iowa
C.X)
5.9
-6.5
-1.4
-2.4
2.3
4.0
Kansas
8.4
3.2
0.1
-1.4
- -1.5
5.3
Kentucky
7.9
-0.9
-3.0
-0.9
5.5
3.6
Louisiana
6.0
1.8
-2.9
-3.6
0.7
3.2
Maine
2.3
7.4
3.7
4.4
3.1
2.9
Maryland
1.0
0.3
-0.7
-3.0
0.9
0.9
Massachusetts
2.1
2.5
0.3
J.6
2.7
1.4
Michigan
1.3
1.3
-0.2
0.0
0.7
2.9
Minnesota
2.7
4.0
2.4
1.2
0.8
3.3
4
1965-66/66-67
1966-67/67-68
1967-68/68-69
1968-69/69-70
1969-70/70-71
1970-71/71-,
( ro ected)
(projected)
Missouri
Nebraska
New Jersey
NV"! York
North Carolina
Ohio
Oregon
Pennsylvania
South carolina 1mb
South Dakota tO
Tennessee
Texas
virginia
Washington
West Virginia
Wisconsin
District of Columbia
2.8
1.9
-1.6
-0.9
-1.4
2. 8
4.8
-0.1
1.7
-5.0
1.2
2.2
4.0
5.5
7.7
1.5
2.1
2.2
4.8
4.4
2.4
2.2
0.9
2.1
6.2
4.2
2.6
-0.1
-1.1
6.7
5.0
2.2
1.2
-0.5
1.4
2.8
5.5
1.9
3.7
2.6
03 .
3. 9
2.3
2.9
0.6
1.3
1.2
2.0
-0.9
8.0
6.8
0.6
1.2
2.4
5.1
-3.2
2.3
0.2
2.6
5.7
00
5.1
3.6
1.5
-1.2
3,3
4.7
4.1
-1.7
0.1
2.9
1.8
3.3
14
5.9
3.4
-0.2
-0.2
0.2
1.7
,4;t
-0.5
1.5
-3.4
1.7
1.3
2. 5
2.4
4.1
3.9
-3.8
-0.4
1.9
3.5
-0.1
-1.6
-3.0
1.9
2.5
3.2
1.5
1.1
0.5
3.1
2.0
-19-
The regional picture softens the starker outline of differencesamong states but it still reflects these differences and in summaryform it reveals that the enrollment scene is not identical aroundthe country. While no region ends up, as four individual states do,with a net loss in undergraduate head count enrollment in 1969-70over 1965-66, four of the regions reveal a stunted and decliningenrollment growth. These are the regions that run straight throughthe geographic middle of the country. What makes this all the morestriking is the fact that all four of these regions made large initialincreases in 1966-67 over 1965-66. Like the seed that fell onstony soil it sprang up quidkly but soon withered. The followingtable presents the percentage of change between years from 1965-66through 1971-72. The percentages are not cumulative.
Total Undergraduate Head CountEnrollment Showing Percentage of Change
Between Years by Region
1965-66/1966-67
1966-67/1967-68
1967-68/1968-69
1968-69/1969-70
1969-70/1970-71
(projected)
1970-71/1971-72(projected)
Nation 3.6 2.5 1.5 0.7 1.6 2.9
Pacific 2.4 2.6 1.1 3.8 2.7 3.5
Mountain 4.7 5.6 8.3 -0.2 5.0 2.7
W. So. Central 3.8 0.5 -0.3 -0.4 1.7 3.6
E. So. Central 5.1 0.8 0.8 -2.2 3.4 4.1
W. No. Central 5.0 -1.0 -0.1 -1.3 0.7 3.8
E. No. Central 3.4 1.7 0.5 -0.2 0.8 2.7
So. Atlantic 2.0 5.0 2.6 0.5 1.4 2.8
Middle Atlantic 3.8 4.0 2.5 1.8 1.2 2.1
New England 2.7 3.1 1.2 3.7 2.4 1.7
20
-20-
Total Enrollment -- Full-Time Equivalent
Full-time equivalent enrollment is a somewhat imprecise category.Institutions were reminded to use for our survey the definitionsemployed when supplying information for the Office of Education'sHigher Education General Information Survey, but the method ofarriving at a "full-time equivalent" may well have varied from onecampus to another. Our data simply reflect the information suppliedby each institution. By whatever method calculated, it is, of course,a device to get behind head count figures made up of full- and part-time students to see what these figures would be if all part-timestudents could be regrouped to resen,ble full-time students. Froman educational point of view it is important to know the head countfigure -- to know how many actual persons are being accommodated inhigher education. From a financial point of view, full-time equivalentfigures are generally more useful.
The percentage relation between subsequent years of full-timeequivalent data is similar -- and sometimes very nearly equal -- tohead count relationships. The comparisons for 481 institutions arelisted below.
UndergraduateHead Count EnrollmentPercentage of Change(Increase) between Years
Undergraduate Full-Time Equivalent EnrollmentPercentage of Change'Increase) between Years
1965-66/1966-67 3.6 4.9
1966-67/1967-68 2.5 2.7
1967-68/1968-69 1.5 2.1
1968-69/1969-70 0.7 0.8
1969-70/1970-71 1.6 (projected) 1.5 (projected)
1970-71/1971-72 2.9 (projected) 2.7 (projected)
The best year -- the year of greatest increase -- for eachenrollment group in our study -- and thus for all institutions combined --is the earliest year for which we have data to compare with theprevious year. In the fall of 1966, full-time equivalent rose by
21
-21-
4.9 per cent for all institutions combined. The smallest gain was4.2 per cent for institutions in the 2001-4000 enrollment group andthe largest gain -- seven per cent -- was netted by the smallestenrollment group.
The following year, 1967, the positio.ls flipped. The enroll-ment group with the lowest rate of increase the previous year becamethe group with the highest increase simply by being the group whosepercentage slipped the least. The group with the highest percentageof increase the previous year plummetted to the lowest increase thefollowing year, dropping from seven per cent to 0.3 per cent.
One year following, this smallest enrollment group dropped stillfurther to an actual net decrease of 1.3 per cent in full-timeequivalent enrollment. Changes of this magnitude, even if alleviatedby later increases, have a violent impact on both the educationalprogram and the economy of the small institution. As crash dietershave found, alternate quick gains and swift losses are far lesshealthy than weight stability. The problem is that this is good_advice for the affluent man who -- if he has the will -- has consider-able control over his increases or decreases, but poor advice forthe impoverished who must take his feast or famine as these presentthemselves. Very small institutions, continually on the hunt forenough students to support a viable academic program, must acceptall that a good hunt produces one year to make up for the losses ofa previous -- or subsequent -- year.
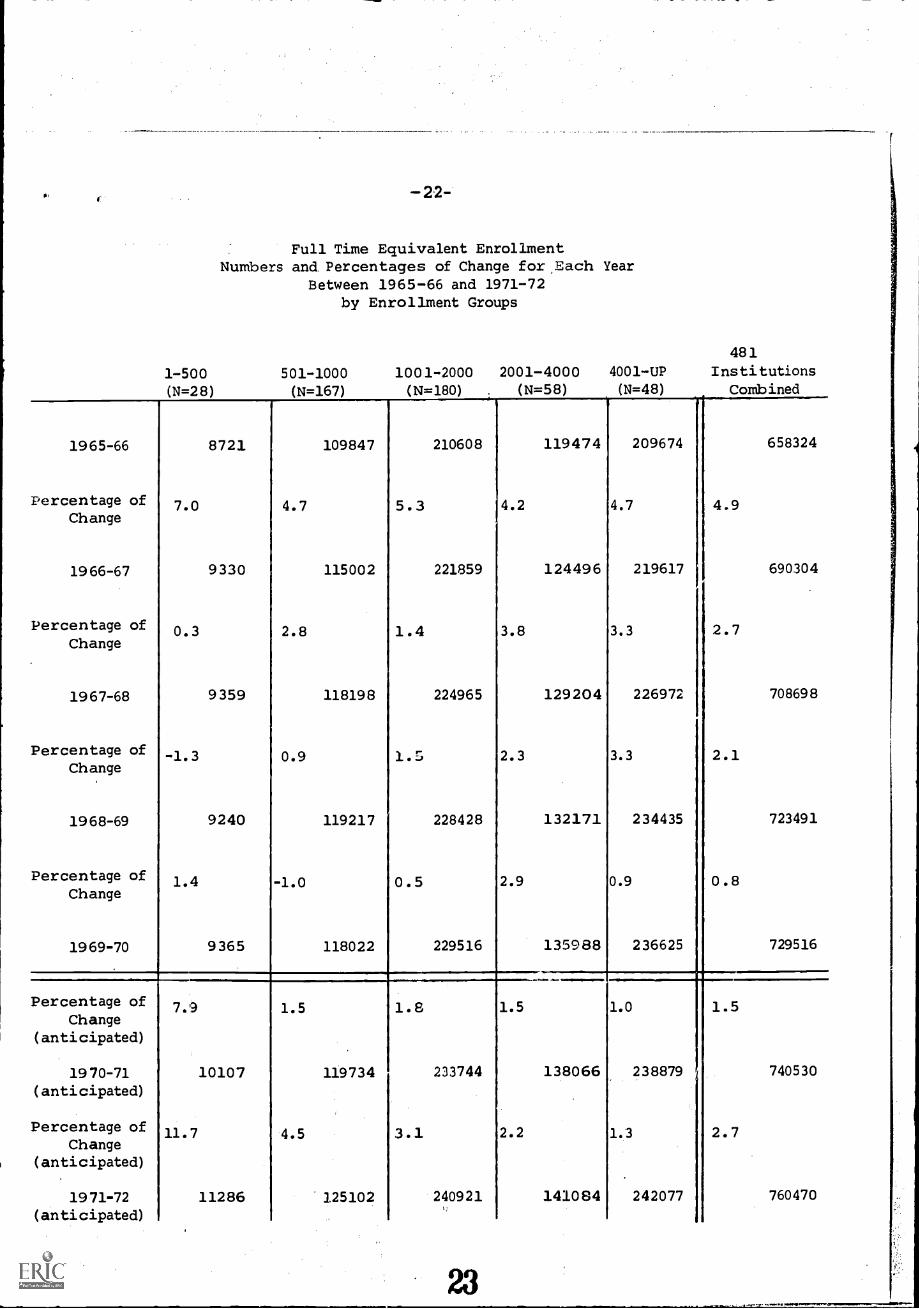
For all institutions combined, the rate of increase in full-time equivalent enrollnent has been a rapidly declining one. From4.9 per cent in 1966 it dropped to 2.7 per cent in 1967. Phis wasfollowed by further drops to 2.1 per cent in 1968 and to 0.8 percent in 1969. A recovery to 1.5 per cent was projected for 1970-71and a 2.7 per cent increase was forecast for 1971-72. These figuresare set forth in the table which follows.
- 22-
Full Time Equivalent EnrollmentNumbers and. Percentages of Change for Each Year
The rate of change in full-time equivalent undergraduate enroll-ment examined by degree levels shows that for three of the degree levelgroups -- baccalaureate, masters in three areas or less, doctoratein three areas or less -- the increase in 1966-67 over 1965-66 wasthe largest increase for Mly of the years included in our study. Thegreatest increase for the group of institutions offering the mastersdegree in four areas or more came one year later, while the greatestincrease for the group of institutions offering the doctorate infour or more areas came one year later still.
For the baccalaureate institutions there has been a progressivelylower rate of increase over the years of actual data covered by ourinitial questionnaire until in 1969-70 there was actually a slightnet decrease in full-time equivalent enrollment. The following twoyears -- 1970-71 and 1971-72 -- were forecast to be years of quickrecovery, achieving a rate of increase of 3.5 per cent.
The enrollment experience of the group of institutions offeringthe masters degree in three areas or less roughly parallels thatof the baccalaureate institutions except that 1969-70, instead ofbeing a year with a net decrease, was actually a year with nearlya two per cent increase in enrollment.
For the institutions offering the masters degree in fpur or moreareas 1969-70 also shcmed a little ski jump upturn. For the doctoralgranting institutions, however, it was a drop in the rate of increase --the first such drop for those granting the doctorate in four or moreareas.
These figures, together with the expectations these institutionshad for the following two years, are shown on the following table.
Full Time EguivaleM:EnrollmentNumbers and Percentage of Change for Each Year
Between 1965-66 and 1971-72by Degree Levels
4-5 YearBaccalaureateN=305
Masters in 3 Masters in 4 Ph.D in 3
Areas or Less Areas or More Areas or Less
N= 2 N=46 N=13
Ph. D in 4Areas or MoreN=28
1965-66
Percentage ofChange
1966-67
Percentage ofChange
1967-68
Percentage ofChange
1968-69
Percentage ofChange
1969-70
5.5
2.2
1.9
-0.3
276801
292099
298625
304152
303321
5.7
3.2
1.7
1.9
120956
127838
131982
134166
136707
2.5
2.9
0.3
1.7
86475
88602
91136
91419
92945
8.7
1.8
2.9
1.1
81983
34759
35394
36423
36817
3.1
3.4
3.6
1.3
124983
128832
133175
137957
139798
Percentage ofChange
(anticipated)
1970-71(anticipated)
Percentage ofChange
(anticipated)
1971-72
(anticipated)
2.0
3.5
309386
320298
2.3
2.6
139821
143442
0.4
1.7
93343
94886
1.1
I
2.8
37228
38278
0.7
1.1
140783
142391
25
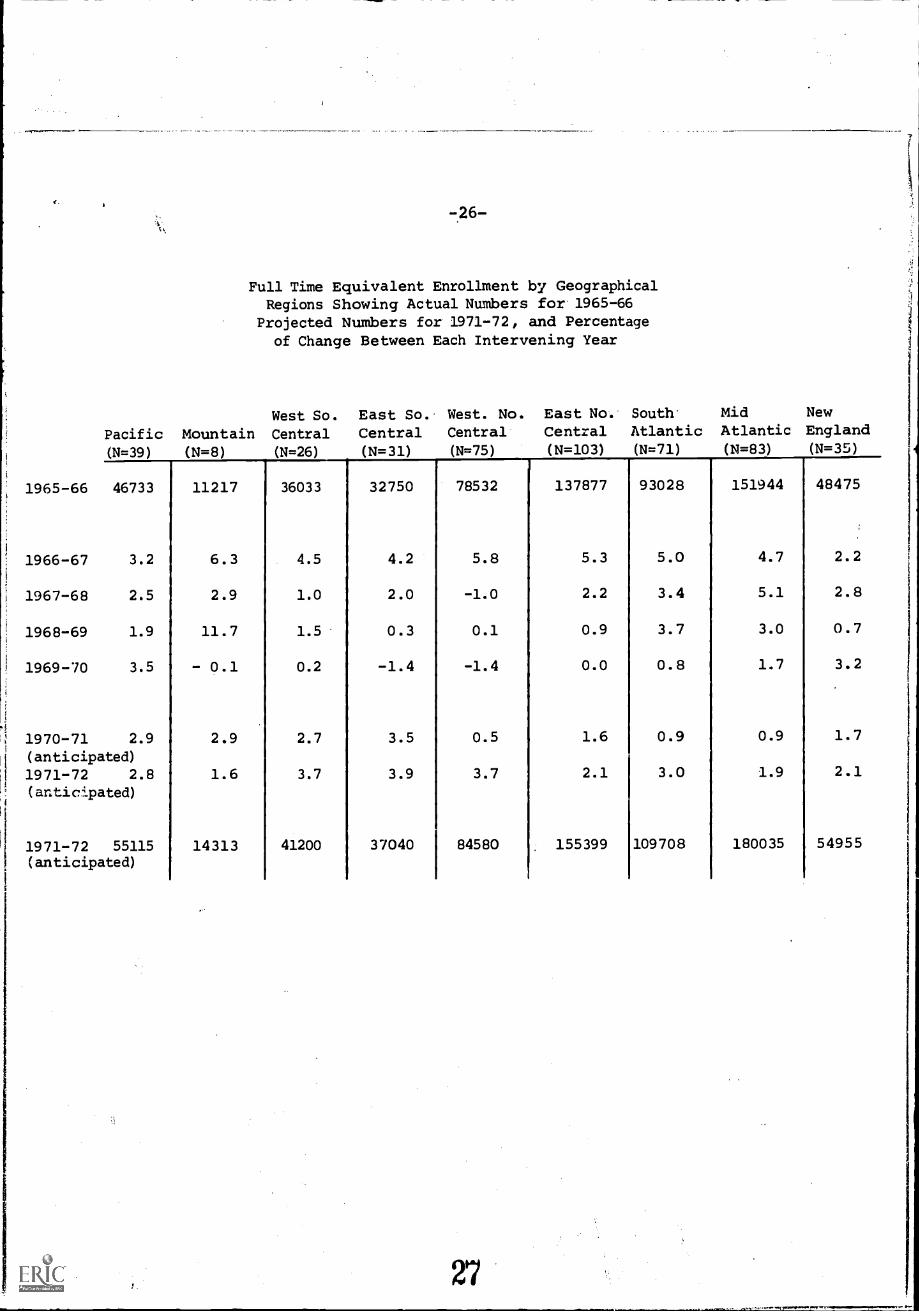
The full-time undergraduate enrollment examined by geographicalregions reveals uneven patterns. The four central regions-and theSouth Atlantic region share a pattern that Shows the percentage ofincrease in 1966-67 over 1965-66 to be the highest and the percentageof change -- decrease in some instances -- to be lawest in 1969-70over 1968-69, but the intervening two years were not, for all fiveregions, a uniform progression from higher to lower.
The Middle Atlantic region's pattern closely resembles thepattern of these five, but the Pacific and New England areas wlaich hadtheir highest rate of increase in 1969-70 over 1968-69 are distinctlydifferent from the others. The eight institutions comprising themountain region again present a wildly careening pattern of ups anddowns which hints at the patterns for individual institutions or othervery small groups of institutions. Larger groups have a smoothingeffect on the statistical pattern. With large numbers of institutionseven major changes appear mild, rather like riding a roller coasterwith the brakes on.
The full-time equivalent enrollment pattern by geographicalregions is shown in the follawing table. rbr the sake of simplicityonly the 1965-66 and 1971-72 (anticipated) enrollments are ehawntogether with the intervening percentages of changes from one yearto the next. The percentages are not cumulative.
26
t.
1965-66
1966-67
1967-68
1968-69
1969-70
1970-71(anticipa1971-72(anticipa
1971-72(anticipa
-.26-
Full Time Equivalent Enrollment by GeographicalRegions Showing Actual NuMbers for 1965-66Projected Numbers for 1971-72, and Percentageof Change Between Each Intervening Year
One year after our initial solicitation of data we wrote againto private colleges and universities asking for updated information.These follaw-up data enable us to see how the predictions made ayear earlier actually held up when tne last student arrived and thefinal nose was counted.
While many individual institutions -- it deserves reiteration --defy being taken captive by statistical averages, on the average theprivate institution failed to meet its projections.
There were some happy exceptions even among averages. Forexample, three regions met -- East North Central -- or exceeded --Pacific and New England -- their forecast head count enrollment for1970-71. All others fell short.
In all regions the forecast had been for increased enrollmentover the previous yacuc. In fact, in every case save ona -- West NorthCentral -- 1970-71 was .Lorecast to bring the highest enrollment sincethe base year, 1965-66. 4hile, in five of the nine regions, 1970-71did prove to be the 1ighL6L enrollment to that point in time, inthree regions it was the lawest since 1966-67 and in one -- West ,NorthCentral -- it very nearly returned to the 1965-66 level.
The following bar graph presents, for the nation as a whole andseparately for the nine geographical regions, the cumulative percentageincrease (or decrease) in total undergraduate head count enrollment.Enrollment in 1965-66 is taken as a base year and is represented asthe zero line. The bars which follow represent successive annualcumulative percentage changes in total undergraduate enrollment from1965-66 through (projected) 1971-72.
The heavily shaded bars represent actual data. The unshaded bars(or portions of bars) represent projected -- i.e., hoped-for -- data.The area mafked by diagonal lines -- seen only in the Pacific andNew England regions -- indicates that actuality exceeded forecast.
What is of particular interest in this graph is the differencebetween forecast and actuality for 1970-71, which the bar secondfrom the right for each group reveals, and the commentary which itoffers cm the forecast for 1971-72.
28
24
20
16
12 8
Cumulative Percentage Changes in Total Undergraduate
Head Count by Regions From One Year to the Next For
The Years 1965-66 Through 1971-72, Showing Projected
Data (Bar Outline) For 1970-71 and 1971-72, and Actual
Data (Solid Bar) For 1965-66 Through 1970-71, (Diagonal
lines indicate that performance exceeded projection.)
NATION
PACIFIC
MOUNTAIN
WEST SOUTH
EAST SOUTH WEST NORTH
EAST NORTH
SOUTH
MID
NEW
CENTRAL
CENTRAL
CENTRAL
CENTRAL
ATLANTIC
ATLANTIC
EN;;LAND
-29-
The percentage of change in undergraduate head count enrollmentby states hrq already been presented in the table on pages L7 and 18.The following table repeats the projected increases for 1970-71 andfor 1971-72 which are presented in that table and adds, for thosestates for which we have comparable data, the actual increase -- ordecrease -- for 1970-71 over 1969-70.
As will be evident from an inspection of the figures, actualenrollment exceeded predictions in nine states and matched it in one.For the other two-thirds, actual enrollments were lower than anticipated.In one state (Virginia) enrollment exceeded prediction by 8.1 percent, and in Washington by 3.6 per cent. These were more than offsetby states where enrollment reality fell short of projection by 9.6per cent (Maryland), 8.4 per cent (Kentucky), 7.6 per cent (Florida),6.5 per cent (Kansas), 5.6 per cent (Nebraska), and 5.1 per cent(South Dakota).
These figures are a sobering commentary on the projections for1971-72 which were made before institutions knew the actual figuresfor 1970-71. That commentary is reinforced by the preliminary figuresrecently released by the Carnegie Commission on Higher Education whichshow that undergraduate enrollment decreased in 1971-72 by 1.5per cent in private universities while holding for no gain in privatefour-year colleges.
Percentage of Changein Undergraduate Head Count Enrollment
1969-70/70-71(projected)
1969-70/70-71(actual)
1970-71/71-72(projected)
California 4.0 2.5 3.9
Florida 2.4 -5.2 2.4
Georgia 4.5 0.9 4.3
Illinois -1.0 -2.8 1.9
Indiana 1.3 -0.8 3.1
Iowa 2.3 -1.5 4.0
Kansas -1.5 -8.0 5.3
Kentucky 5.5 -2.9 3.6
30Y."
-30-
1969-70/70-71(projected)
1969-70/70-71(actual)
1970-71/71-72(projected)
Louisiana 0.7 -0.4 3.2
Maine 3.1 0.9 2.9
Maryland 0.9 -8.7 0.9
Midhigan 0.7 2.9 2.9
Minnesota 0.8 0.8 3.3
Missouri -1.4 -1.0 2.8
Nebraska 1.2 -4.4 2.2
New Jersey 2.1 2.5 2.2
New York 0.9 0.1 2.1
North Carolina -1.1 -0.4 6.7
Ohio 1.4 3.4 2.8
Oregon 0.3 1.5 3.9
Pennsylvania 1.2 -0.2 2.0
South Carolina 1.2 -0.6 2.4
South Dakota 2.6 -2.5 5.7
Tennessee 3.3 0.9 4.7
Texas 1.8 0.0 3.3
Virginia 0.2 8.3 1.7
Washington 1.3 4.9 2.5
West Virginia -0.4 -3.0 1.9
Wisconsin 1.9 0.2 2.5
District of Columbia 3.1 -1.4 2.0
7:7777 :
24
20
16
.12 8 4
Cumulative Percentage Changes in Total Undergraduate
Head Count by Enrollment Groups From Om Year to the
Next For The Years 1965-66 Through 1971-72, Showing
Projected Data (Bar Outline) For 1970-71 and 1971-72,
and Actual Data (Solid Bar) For 1965-66 Through 1970-71.
1-500
501-1000
1001-2000
2001-4000
4001-up
24
Cumulative Percentage Changes in Total Undergraduate
Head Count by Degree Levels From One Year to the Next
For The Years 1965-66 Through 1971-72, Showing Projected
Data (Bar Outline) For 1970-71 and 1971-72, and Actual
20
Data (Solid Bar) For 1965-66 Through 1970-71.
(Diagonal
lines indicate that performance exceeded projection.)
16
12 8
Bacca-
Masters in
Masters in
Ph.D in
Ph.D in
laureate
3 areas
4 areas
3 areas
4 areas
or less
or more
or less
or more
.1 -34-
The picture is not radically altered when one turns from_ under-graduate head count to full-time equivalent enrollment as the followinggraphs show. By regions, the most important differences are WestSouth Central -- which is doing better on a full-time equivalent basisthan on a head count basis -- and South Atlantic, which is doing worse.In the enrollment groups, only the two largest show a differencebetween head count and full-time equivalent performance. By-degreelevel groupings, only the group offering the masters degree in threeareas or less performed noticeably different in 1970-71 by full-timeequivalent from the way its performance shows up by head count.
35
24
20
16
12 8
NATION
PACIFIC
Cumulative PercentageChanges in Full-Time
Equivalent
Enrollment by RegionsFrom One Year to the
Next For
The Years 1965-66
Through 1971-72, Showing
Projected
Data (Bar Outline) For
1970-71 and 1971-72,
and Actual
Data (Solid Bar) For
1965-66 Through 1970-71.
(Diagonal
lines indicate that
performance exceededprojection.)
1111
MOUNTAIN
WEST SO.
EAST SO.
WEST NO.
EAST NO.
SOUTH
MIDDLE
NEW
CENTRAL
CENTRAL
CENTRAL
CENTRAL
ATLANTIC
AT-ANTIC
ENGLAND
24
20
16
12 8 4 0
fi
Cumulative Percentage Changes in Undergraduate
Full-Time Equivalent by Enrollment Groups From
One Year to the Next For The Years 1965-66 Through
1971-72, Showing Projected Data (Bar Outline) For
1970-71 and 1971-72, and Actual Data (Solid Bar)
For 1965-66 Through 1970-71.
Am
,
1-500
501-1000- 1001-2000
2001-4000
4001-up
24
20
16
12
Cumulative Percentage Changes in
Undergraduate Full-Time Equivalent
by Degree Levels From One Year to the Next For the Years 1965-66
Through 1971-72, Showing Projected Data (Bar Outline) For 1970-71
and 1971-72, and Actual Data (Solid Bar) For 1965-66
Through 1970-71.
(Diagonal lines indicate that performance exceededprojection.)
Bacca-
Misters in Masters in
laureate
3 areas
4 areas
or less
or sore
Ph.D in
3 areas
or less
Ph.D in
4 areas
or sore
Graduate Enrollment
-38-
In the years covered by our study the big increase in graduateenrollment came in 1966. The graduate head count increase over theprevious year was 6.9 per cent. The total full-time equivalentgraduate count rose 7.5 per cent. This was in the same year thatfreshman head count enrollment decreased 2.3 per cent and total under-graduate head count increased 3.6 per cent.
It is well for private higher education that this increase ingraduate students did not sustain itself. It did continue to increase,however, at rates considerably higher than undergraduate increases,for the follawing three years. Graduate head count enrollmentincreased by 4.6, 3.2, and 5.0 per cent while full-time equivalentgraduates progressed erratically at rates of 5.4, 3.1, and 4.8. Then,suddenly, both rates appeared to our respondents to be headed for adecline: graduate head count to a 2.7 per cent rate of increase andfull-time equivalent to 1.7 per cent. In the following year, 1971-72, these rates were projected to make a recovery of some lost groundwith rates of increase of 3.1 and 3.6 per cent respectively. If theprojections proved accurate this would mean a cumulative increase of29 per cent full-time equivalent graduates compared to a cumulativeincrease ,: 15.5 per cent full-time equivalent undergraduates overthe same time period.
Institutions in our largest enrollment category -- those enrollingmore than 4000 students -- account for as much as seven eighths *ofall graduate students enrolled in private higher education, but thecumulative increase over these seven years of data for full-timeequivalent graduate stuaents in these institutions is only 23 (22.8)per cent. The really large increases -- 71.7 per cent -- weremade by a score of institutions in the two to four thousand enroll-ment range and some two dozen institutions in the one to two thousandstudent range -- 76.2 per cent.
In other words, although they account for only one eighth ofthe graduate students -- largely, but not entirely, at the mastersdegree level -- their cumulative rate of increase was so high thatthe rate of increase for all private institutions combined -- 29per cent -- is higher than the rate of increase for those institutionsenrolling seven eighths of the graduate students -- 23 per cent.
Full-time equivalent graduate enrollment as a percentage oftotal full-time equivalent enrollment -- on a per reporting institu-tion basis -- rose slightly in each of the years covered by ourstudy from 29.7 per cent in 1965-66 to 31.9 per cent in 1969-70.It was projected to remain steady for the following two years. Whenthe rate of increase in graduate students remains higher than the
39
-39-
rate of increase in undergraduate itudents, then the proportion ofgraduate students to total enrollment will continue to rise. This
appears to be what is happening. It will have adverse implicationsfor the financial picture of most institutions. Graduate head countenrollment that was projected to increase in 1970-71 aE a modest2.7 per cent, accompanying a 1.6 per cent undergraduate head countenrollment increase, actually increased 6.2 per cent while under-graduate enrollment fell off to a 0.5 per cent increase.
Concluding Comments
Rarely does anyone attempt to describe a college or universityapart from the students who study there. Many -- and that includesmore than students -- say that students are the college. Everyinstitution of higher learning takes students very seriously. They
are the name of the game. For educational purposes, therefore,enrollments -- and the study of enrollment patterns -- are important.
Enrollments are also important fiscally. Buildings are built,programs are developed, faculties are hired, fixed expendituresare committed to students, both those already at the institution andthose that are expected. An institution that builds plant and programfor a student body that never reaches the expected size, or thatrises and then falls, is apt to be in fiscal trouble and its adminis-trators may have some explaining to do. This is not substantiallydifferent in tax-supported institutions from what it is in privatelysupported ones.
If neither the percentage of college age students actuallyattending college nor the length of time they stay enrolled increases,while the college age cohort -- whidh stands as proxy for post-secondary enrollments -- declines to a rate of increase near zero,tax-supported institutions will be scrabbling for students alongwith privately supported ones in order to justify their expandedplants and programs. This will not make the admissions task of privatelysupported institutions any easier.
All institutions are concerned with enrollments for both educa-. tional and fiscal reasons; but those that are dependent upon tuitionand fee income for forty per cent of their total operating budgetare doubly concerned.
In private institutions, not only are expenditure commitmentsmade in the expectation that enough students will arrive to vindi-cate those commitments, but the students are expected to bring with
40
A -40-
them a substantial portion of the income necessary to sustedn thecommitments. In economic terms, tax-supported and privatelysupported institutions that make commitments beyond the number ofarriving students are not different from one another. In eithercase, money is expended without yielding the expected benefit. Theeffect of miscalculation, however, is more immediately and directlyfelt by the privately supported institution where income as wellas expenditure is at stake.
Moreover, since private institutions are more likely thantax-supported ones to be substantially residential in nature, alower number of students than was expected adversely affects theincome and expenditure pattern for auxiliary enterprises. In allenrollment groups in our study except the group of institutionsenrolling more than four thousand students, auxiliary enterprises --especially residence halls -- not only pay for themselves but actuallygenerate net income whidh makes it possible for a college to provide,say, more student aid. In relation to auxiliary enterprises, a residentstudent is an asset. If he does not show up he is not merely a missingasset, he is a deficit. Debt service payments must be met on thespace he would have occupied Whether he shows or not.
If the emrollment picture is to _improve in private colleges anduniversities, many will need to be more aggressive in their pursuitof potential students and in their retention of those who actuallymatriculate. To do these things they will need better data than manyof them presently possess and better studies of where their studentscome from, why they come, and why they leave.
The pursuit and retention of students must begin with theclear articulation of an academic program that can meet the competi-tion in meaning, purpose, and relevance. It continues when thismessage is carried by an admissions office which understands thatits role is not counseling, first of all, but admission. It is
carried further by a faculty which understands that a useful testof the smallness which it applauds is the rate of retention itis able to attain through the application of intimate concern.
The data which some institutions maintain in this critical areaare sadly deficient. To judge by their ability to respond to ourrequest for data, some institutions are overlodking areas where theneed for precise data is important. To be without adequate data inan area as crucial as freshman admissions -- the replenishment ofthe student body in both quality and quantity -- is to treat casuallyan area of vital concern to the institution.
Even small miscalculations of what to expect of the future canhave major effects on a small college. The unrealistic predictions
made by a number of institutions in our study are partly the result
of an inadequate history of data, insufficiently analyzed. Unrealistic
predictions lead to financial commitments which aggravate the fiscal
imbalance.
More institutions need better studies of their students. They
need to know where they come from geographically, economically,
academically, and generally. They need to have studies that tellthem, for example, that although the same amount of energy invested
in two places elicits a comparable number of requests for admission,
it produces two very different patterns of actual enrollment. They
need to know a great deal more both about the students who do come
and the ones who do not. They need to know how many applicationstheir own students are filing -- and have filed in the past.
In years when a smaller number of applicants are generatinga larger number of applications, each institution may expect to beaffected by the phenomenon by actually succeeding in enrolling asmaller percentage of applicants than in years when more applicants
gensrate fewer applications for admission. This is the statisticalapplication of the phenomenon.
For the individual institution, however, each application does
represent a real applicant. Whether it takes its statistical shareof these students or a larger -- or smaller -- share will depend
upon how skillfully these applicants are handled. When the fishing
is poor, a few fieh may tug on many lines. At times like these,the skill of the angler becomes critical.
If the enrollment picture in private colleges and universitiesis to improve, finally, more will have to be done within a state tobring about a more effective coordination of tax-supported andprivate institutions -- including some reduction in the widening gapbetween the two types of institutions in the charges paid directlyby ehe student throlgh tuition and fees.
One of the reasonsmost frequently mentioned for the rising costof higher education -- the marked increase in college attendancehas not had anything like the effect on private institutions thatit has had on public ones. Private higher education's financialstress is largely the result of other factors. Perversely, it isoften the lack of an increase in enrollment -- cr in fact an actualdecrease in enrollment -- that has had the greater effect on privatehigher education. Some of this decrease, in some areas, appears tobe the result of a broad and rapid expansion of the community collegeoperation undertaken with insufficient regard for existing institutions.Both time and money -- especially in the comparison between thestudent charges employed by both types of institutions -- have played
42
-42-
a part.
The fiscal implications of enrollment are alluded to in theforegoing pages, but the theme is not belabored. Clearly, however,the relationship is not incidental. If private higher educationis to survive firancially it must also survive in enrollment. Toaccomplish this, both internal and external factors need to beimproved. Private colleges and universities need good data, betterstudies, aggressive admissions practices, and -- above all --attractive academic programs. They also need external help ifthey are to be successful in their bid for students. Neither theinstitutions nor their students can continue to leap ever-risingfinancial hurdles.