ED 301 404 TITLE INSTITUTION REPORT NO PUB DATE NOTE AVAILABLE FROM PUB TYPE EDRS PRICE DESCRIPTORS IDENTIFIERS ABSTRACT DOCUMENT RESUME SE 050 090 Manual on Cost-Effectiveness of Training Modalities in Population Education. Population Education Programme Service Series. United Nations Educational, Scientific ano Cultural Organization, Bangkok (Thailand). Principal Regional Office for Asia and the Pacific. BKP/88/OPE/4-2000 88 84p.; Reprinted (or adapted) from Manual on Cost-Effectiveness of Training Modalities in Population Education of the UNESCO Principal Regional Office for Asia and the Pacific (PROAP) specifying the date of issue. Gray-shaded graphs and charts may not reproduce well. UNIPUB, 4611-F Assembly Drive, Lanham, MD 20706-4391. Reports - Descriptive (141) MF01 Plus Postage. PC Not Available from EDRS *College Science; Family Planning; Higher Education; Overpcpulation; *Population Education; *Population Growth; Research; Research Design; *Research Methodology; Science Education; Science Instruction; Trainers; Training; *Training Methods; *Workshops *Population Awareness Education; Population Control This manual is the result of a regional training workshop on the cost.- effectiveness of different training strategies in population education by Unesco in Kathmandu, Nepal, June 1-8, 1987. The purpose of the manual is to enable project staff to initiate studies to determine cost - effective training strategies in population growth control education. Topics include: (1) training strategies; (2) cost effectiveness; (3) program design and instrumentation; (4) data analysis; (5) managerial considerations; (6) research proposal preparation; and (7) sample research proposal and prototype instruments. Included is a proposed line-item budget for one year of research. (ML) * Reproductions supplied by EDRS are the best that can be made * from the original document. * *
Transcript
ED 301 404
TITLE
INSTITUTION
REPORT NOPUB DATENOTE
AVAILABLE FROM
PUB TYPE
EDRS PRICEDESCRIPTORS
IDENTIFIERS
ABSTRACT
DOCUMENT RESUME
SE 050 090
Manual on Cost-Effectiveness of Training Modalitiesin Population Education. Population EducationProgramme Service Series.United Nations Educational, Scientific ano CulturalOrganization, Bangkok (Thailand). Principal RegionalOffice for Asia and the Pacific.BKP/88/OPE/4-200088
84p.; Reprinted (or adapted) from Manual onCost-Effectiveness of Training Modalities inPopulation Education of the UNESCO Principal RegionalOffice for Asia and the Pacific (PROAP) specifyingthe date of issue. Gray-shaded graphs and charts maynot reproduce well.UNIPUB, 4611-F Assembly Drive, Lanham, MD20706-4391.Reports - Descriptive (141)
MF01 Plus Postage. PC Not Available from EDRS*College Science; Family Planning; Higher Education;Overpcpulation; *Population Education; *PopulationGrowth; Research; Research Design; *ResearchMethodology; Science Education; Science Instruction;Trainers; Training; *Training Methods; *Workshops*Population Awareness Education; PopulationControl
This manual is the result of a regional trainingworkshop on the cost.- effectiveness of different training strategiesin population education by Unesco in Kathmandu, Nepal, June 1-8,1987. The purpose of the manual is to enable project staff toinitiate studies to determine cost - effective training strategies inpopulation growth control education. Topics include: (1) trainingstrategies; (2) cost effectiveness; (3) program design andinstrumentation; (4) data analysis; (5) managerial considerations;(6) research proposal preparation; and (7) sample research proposaland prototype instruments. Included is a proposed line-item budgetfor one year of research. (ML)
* Reproductions supplied by EDRS are the best that can be made* from the original document.
**
Unesco Principal Regional Office for Asia and the Pacific.Manual on cost-effectiveness of training modalities in population
education. Bangkok, 1988.69 p. (Population Education Programme Service)
1. POPULATION EDUCATION2. POPULATION EDUCATION3. POPULATION EDUCATION4. POPULATION EDUCATION5. POPULATION EDUCATION6. POPULATION EDUCATIONI. Title. II. Series
P370.76
O
TRAINING METHODS.TRAINING TECHNIQUES.COST EFFECTIVENESS.COST-BENEFIT ANALYSES.RESEARCH METHODS.RESEARCH PLANNING.
3
L
Population Education Programme Service
M A N U A L
COST- EFFECTIVENESS
OF TRAINING MODALITIESIN POPULATION EDUCATION
"*.....1%-
1111ESCII
Unesco Principal Regional Office for Asia and the Pacific, Bangkok, 1988
Published by theUNESCO Principal Regional Office for Asia and the Pacific
P.O. Box 1425, General Post OfficeBangkok 10501, Thailand
Printed in Thailand
The designations employed and the presentation of material throughoutthe publication do not imply the expression of any opinion whatsoever onthe part of Unesco concerning the legal status of any country, territory, cityor r.rea or of its authorities, or concerning its frontiers or boundaries.
5
INCP/PUOPE/4-2000
PREFACE
This Manual is the output of a Regional Training Workshopon the Cr.-A-Effectiveness of Different Training Modalities in Popula-tion Education which was organized by the Unesco PrincipalRegional Office in Asia and the Pacific in Kathmandu, Nepal from1 to 8 June 1987.
Ten participants and resource persuas from China, India,Indonesia, Maldives, Nepal, the Philippines, and Thailand took partin the workshop. The two resource persons 'h zre Dr. V.R. Gaikwad,Professor, Indian Institute of Management, India; and Dr. MilagrosIbe, Professor, College of Education, University of the Philippines,Philippines.
The Manual is a simplified presentation of how projecc staffof country projects can carry out studies on the cost effectiveness ofdifferent training modalities used in population education pro-grammes. So as not to overwhelm those who are not too familiarwith cost-effectiveness studies the data analysis is deliberately madesimple.
It is hoped that this Manual will enable the project staffof country projects to initiate studies which will help them select themost cost-effective training modalities in population education.
Such studies can go a long way towards ensuring optimal useof limited resources available for the training of population educa-tion teachers and fieldworkers.
6
TABLE OF CONTENTS
Page
Prefacei
Chapter One Training modalities in population education 1
Chapter Two Cost effectiveness: concept and process 15
Chapter Three Design and instrument 23
Chapter Four Data analysis and interpretation 1:9
iltapter Five Managerial considerations in cast effectiveness study 35
Chapter Six Guidelines for preparing a research proposal 47
Chapter Seven Sample research proposal and prototype instruments 51
Training Modalitiesin Population Education
In many countries of Asia and the Pacific, population education is recognized as oneof the leading educat;onal innovations. Population education is the education sectors'invaluable contribution towards the multi-sectoral effort designed to mitigate the negativeimpact of unplanned population growth on the development programmes of countries inthe region.'
From the beginning it was realized that population education can only be as good asthe teachers, field workers and key personnel responsible for its implementation. As such,there was a need for a massive in-service and pre-service training of teachers and field work-ers. Each country decides how it shouldgo about training the huge number of teachers andother personnel in population education.
Meaning of the Term "Modality"
A training modality is a general approach and strategy for designing and sequencingtraining inputs to produce the desired effectiveness. It has two dimensions: technical andmanagerial. The technical dimension covers the methods and instruments that are used toachieve the objectives. The managerial dimension covers how various actions/activitiesassociated with the approach and strategy are planned, organized, executed, monitored andevaluated, so that the methods/instruments and materials could be implemented effectivelyand efficiently. This dimension primarily deals with division of work (in terms of time,space and personnel for a given task and sub-task), co-ordination, supervision and control.
It is acknowledged that an intrinsically good training method or instrument maybecome ineffective due to weakness in the management process. On the other hand, anintrinsically bad method or instrument will not be effective in spite of good management.Thus, the technical and managerial dimensions of a modality, individually and interactively,determine the effectiveness of a programme.
It follows that understanding a modality will require a thorough study of the inter-nal aspects of the programme management process. It is obvious that different modalitieswill require different degrees of managerial competence and efforts, and will have differentcost centres and cost structures.
Thus, a modality is a wider concept in the sense that within a selected approach andstrategy framework it may use more than one method or instrument of training, each havingdifferent managerial connotation. Evaluating a modality (or comparing different modalities)does not merely cover the method/instrument and materials for training, but also includesthe approach, the strategy, and the managerial aspects of training along with the associatedcosts.
1Leonardo de la Crux, "Training Modalities in Population Education: The Asia and Oceania Experience" UNESCO,ROW, Bangkok, November 1980, p. 1 (mimeographed).
Training modalities 1
Two factors are generally considered in the selection of training modalities, namelythe appropriateness of the method for a particular requirement, and the economic aspect,that is, the cost.
Training modalities can be classified as follows:
1. The amount of participant activity allowed in the modality,
2. The amount of emphasis on cognitive learning, and
3. The amount of emphasis on providing experience to and scope for experi-mentation by the participants.
It should be noted that each of these three dimensions has to be treated as a conti-nuum from high to low. For example, the amount of participation can vary from highparticipation to low participation. It should also be noted that various permutations andcombinations of these dimensions can be used in a training programme. Each method hasits merits and demerits and there is as yet no empirical evidences which can vouch for onemodel of training vis-a-vis another.
Analyzing "Strategy"
Each country chooses a strategy that is most appropriate foi its particular require-ments. In deciding the strategy, the questions generally asked are:
(a) What results are desired, when, and at what costs?
(b) What alternatives are available to the country for achieving the desired results?
A question generally faced by many countries is whether the population educationprogramme should:
(1) concentrate on specific target group/s, or (2) cover all segments of the popula-tion with great intensity, or (3) be spread thinly, covering all segmentsof population withlow intensity. From these three alternative courses of action, a country has to choose oneor a combination thereof. Each alternative course has its own implications.
The first alternative is generally considered when a country has limited funds, anddesires quick results and a controllable rate of change in population growth rate. It is alsoconsidered when the political environment is such that it can handle criticisms about class/group/regional discrimination.
The second alternative is generally considered when funds am available and thecountry is not particularly concerned about the long-term effects of uncontrolled reductionin the population growth rate. It is also considered when the political environment cannothandle criticisms about class/group/regional discrimination.
The third alternative is generally considered when funds are limited and the countryis not concerned about the long-term effects of uncontrolled reduction (retardation) in thepopulation growth rate. It is also considered when the political environment cannot handlecriticisms about class/group/regional discrimination.
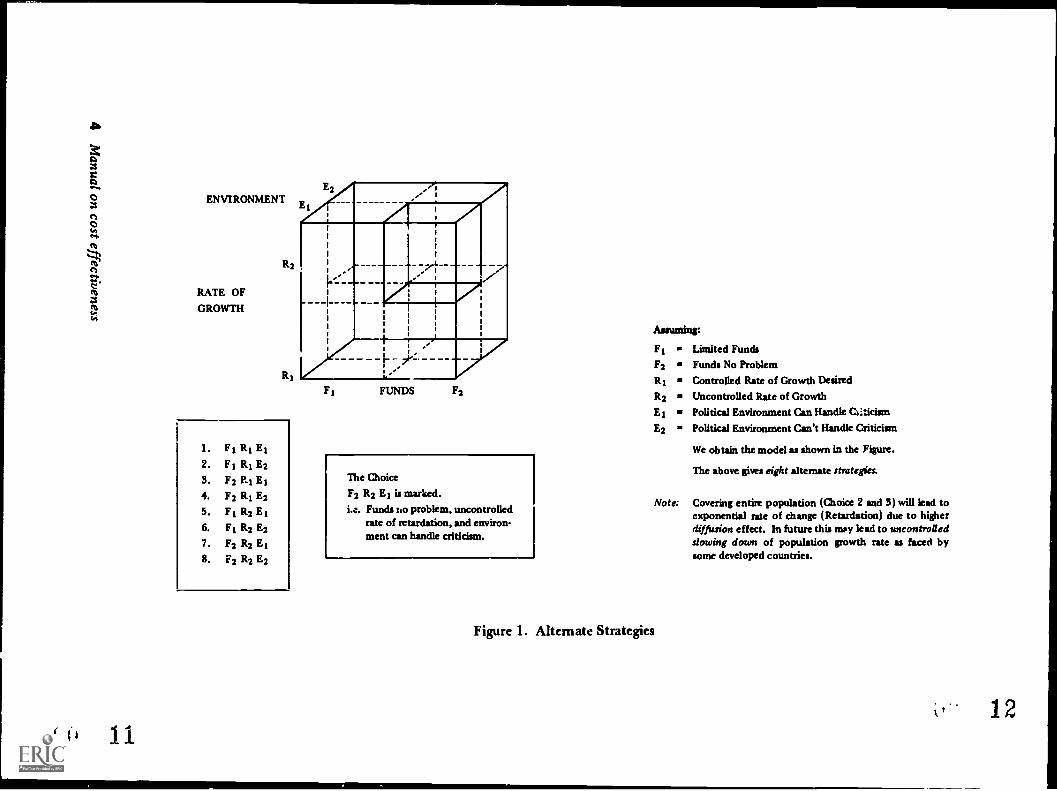
These three alternatives when considered as being dichotomous and in va;nus per-mutations and combinations lead to eight alternate strategies. (See Figure 1).
If a country decides on a "specific" target population, then the questions are:
1. Where to concentrate? Densely populated regions having high populationgrowth rates, or less densely populated regions?
2. Which class of people? Should the population programme cover low income(poor), middle income, or high income population groups?
2 Manual on cost effectiveness9
3. Which categories of persons/groups? Those already enjoying greater opportuni-ties for exposure to population education (PE) messages, or those having littleor no opportunities for such exposures.
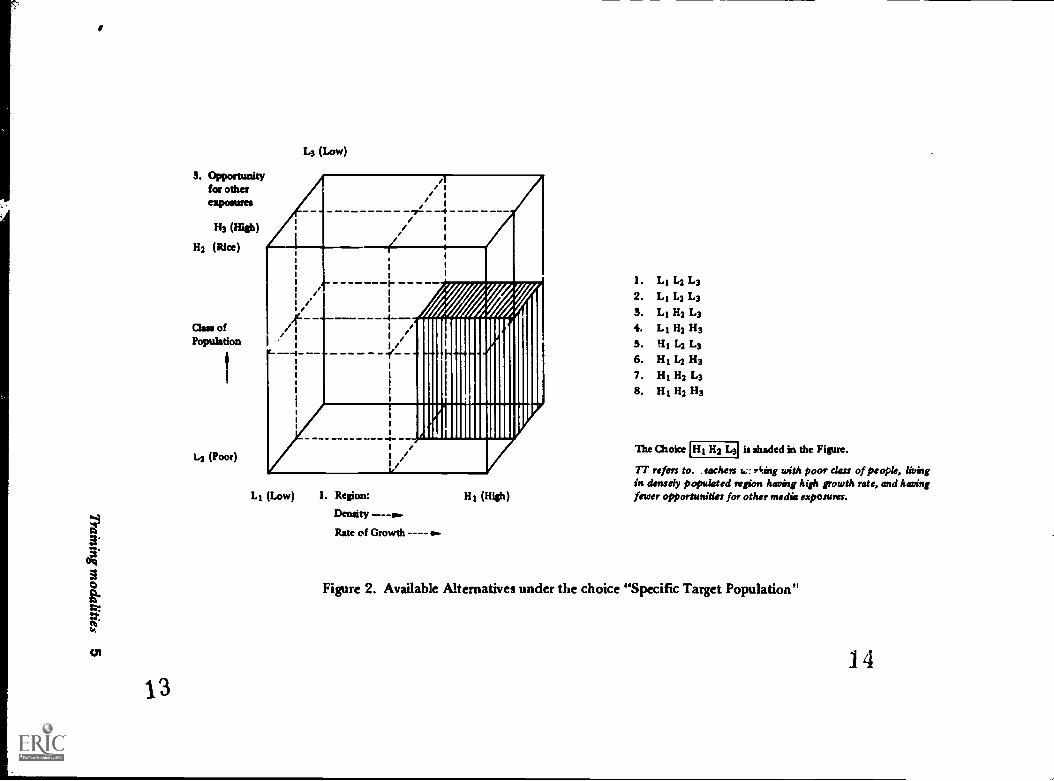
These are various alternatives from which a country can choose. The three catego-ries when considered as dichotomous and in various permutations and combinations lead toeight possible alternate strategies. (See figure 2). Each strategy has its own implications interms of costs, coverage, and intensity of training.
Training Modalities
The training modalities which are generally used in different countries in the Asianregion are the following:2
1. Hierarchical face-to-face training2. Peer group training
3. Mobile training
4. Self-learning model
5. Training via correspondence
6. Linked training
7. Training via educational radio and television8. Field operational seminar9. Internship and attachment programme
10. Eclectic training model
Each training modality is provided with a flow-chart which presents the major taskcomponents or units of operation that are related to both the main training activities andsupport services. In general, each cell (component) indicates a discrete activity and couldbe treated as a cost centre. The numbering of the cells, as far as possible, indicates thesequencing of activities, though in some complex models this may not be ski. The overallscope of the managerial process is indicated by the bracket en the right hand side.
Each of the training modalities cited above are briefly discussed below and hi thepages which follow:
1. Hierarchical Face-to-Face Training Model
In this model, the training continuum consists of successive training efforts fordifferent levels/categories of educational personnel in the descending order of the hierarchy.The initial or first step is the recruitment of experts/resource persons. The second step isface-to-face training of project/programme personnel at the national/internation 11 level.In the third step, these trained personnel train a selected group of specialists or mastertrainers at the national level. In the fourth step, these master trainers train the second groupof trainers (teacher educators, district education officers, principals, college professors, andothers). This second group, in turn (the fifth step), train teachers at the district, sub-district, or village levels. This four- step model places the teacher who is the main target ofthe training programme, at the end of the line and as a receiver of what is passed on fromthe top (see Figure 3).
2The descriptive part for this section is primarily based on the paper by R.C. Sharma. "Alternative Models of Train -
ing in Population Education in Asia and the Pacific". Unesco, PROAP, Bangkok, 1981, pp. 14 (mimeo).
Training modalities 3
10
1. Fi RI Ei2. Fi RI E23. F2 Ei Ei4. F2 RI E25. F 1 R2 E 1
6. Fi R2 E27. F2 R2 E 1
8. F2 R2 E2
F1 FUNDS F2
The Choice
F2 R2 E1 is marked.
i.e. Funds no problem, uncontrolledrate of retardation, and environ-ment can handle criticism.
fig:F1
F2
R1 3.
R2
E1
E2
Limited Funds
Funds No Problem
Controlled Rate of Growth Desired
Uncontrolled Rate of GrowthPolitical Environment Can Handle Criticism
Political Environment Can't Handle Criticism
We obtain the model as shown in the Figure.
The above gives eight alternate strategies.
Note: Covering entire population (Choice 2 and 3) will lead toexponential rate of change (Retardation) due to higherdiffusion effect. In future this may lead to uncontrolledslowing down of population growth rate as faced bysome developed countries.
Figure 1. Alternate Strategies
k_ 12
3. Opportunityfor otherexposures
H3 (High)
H2 (Rice)
Clan ofPopulation
L2 (Poor)
L3 (Low)
-- 4
L1 (Low) 1. Region:
Density
3'Rate of Growth ----
cna
3O
13
H1 (High)
1. Li L2 L32. Li L2 L33. Li H2 L34. Li H2 H35. Hi L2 L36. Hi L2 H37. Hi H2 L38. Hi H2 H3
The Choice H1 H2 L3 is shaded in the Figure.
TT refers to. . fathers t. king with poor class of people, livingin densely populated region having high growth rate, and hewingfewer opportunities for other media exposures.
Figure 2. Available Alternatives under the choice "Specific Target Population"
14
7
DI,r101,1,C111
11.11111111, It ',1411.,
771,1,rn
snit teirnt
Trainhsg Target Clientele
2
3
4SIP
5
6
Level of Training
Natiosvd/interndonal
National
National /state/province
State/province/districtsub-district
School/community
Figure 3. Hierarchical Face-to-Face Training Model
2. Peer Group Training
In this model, the principals and subject heads or co-ordinators in each secondaryschool are trained by teacher trainers through face-to-face training and they in turn are given
responsibility for training teachers in their own schools or in neighbouring schools. Eachinstitution is provided a complete set of training materials, including training manuals,teachers' guides or audio-visuals aids, evaluation tools, and so on. Each school sets up itsown schedule of training of teachers, and is required to make a report of its training pro-gramme to the district education officer, who submits the consolidated information to con-cerned officers at the regional/provincial/national levels. Under this model, supervisoryteams also visit the schools and provide on-the-spot assistance, guidance, as well as evaluationof the training programmes. (See Figure 4).
40
O
I
I I
7
Target Clientele
;Peri 'te''"IIIC1)`;
)r11 111 X11. 'nk,ptin(Illii,1, n
I "Ill
ca. he!.
neigfil,,orru;
Figure 4. Peer Group Training Model
6 Manual on cost effectiveness
15
SupportMonitoring
4
IZrgi,rial, provincialnai lona] lc veIN,
5'
Guidance,on the spotassistance I
Progress andevaluationreport
3. Mobile Training
This model consists of floating and mobile teams comprising trained, competent,and highly experienced teachers, administrators, and supervisors who conduct teachers'training prop mores in e.e schools or in designated training centres. These teams areequipped with a variety of instructional materials, aids, and equipment. The team memberscan be rotated during the course of the training, thus minimizing the absence of membersfrom their respective posts for long periods and also giving other competent teachers andadministrators the opportunity to act as trainers. The training is organized at a stretch, orduring school vacations and weekends, as may be convenient to the teachers and administra-tively feasible in a partic- lar area. (See Figure 5).
ao
1
1.11nni,:. n
)10tiupph td n 1,111FZN
I 111.14.,
1111n tun, ,1).. II
,a),,,-1111/111 ))1,
>el, 11 tn.)
non II Ill t'(
Salhool (1) sl in)))1 (2) SLI)))01 (n) I k.signated
trainingocntres
Figure 5. Mobile Training Model
4. Modular or Self-Learning Model
In this training model, materials in the form of modules are provided for the in-dependent and .direct training of teachers. The training materials and modules are designedand prepared at a central location and distributed to selected trainees. Each teacher traineelearns, on his own from these modules. A feedback system is generally incorporated in themodule, enabling the trainee to evaluate his own performance. This method requires mini-mum supervision and is easy to administer. It is more economical, entailing a minimum oflogistical problems. However, a crucial need in using this model is to ensure the motivationof teachers to use the self-learning modules (SLEM) especially when such a self-learningmethod is not associated with any reward system, (See Figure 6a).
There are three supplementary methods associated with this model. In one methodthe teachers discuss the modules after reading them, under the direction and leadership ofthe school headmaster, who acts as course manager and trainer. The headmaster has pre-viously received intensive face-to-face training in population education as well as in the useof SLEM. The module also includes a management module for the headmaster's use. (SeeFigure 6b).
Training modalities 7
16
9!
i(1)
(2)
(3)
I Pc"`'rr'""' C
I
,11,1111
H111'Ill ,I11111,it ,
It lc ,1lit 1,1 t Li I It 1'hr I
1111r.,1 tO.C1
Figure 6(a). Modular or Self-learning Training Model
6(b) 6(c)
Figure 6(b) and 6(c). Supplementary Methods for Modular andSelf-learning Training Model
The second method is a slight variation of the above. Here, the trainee's progressis monitored by a population education-trained principal or public school district supervisor
or high school principal and/or trained department head, depending upon the level of thetrainee. In this method, a manager's guide module is also provided. (See Figure 6c).
The third methods makes use of both printed materials and video/video cassettetapes. The use of the video recording system (VTR) is a recent development in some coun-
tries of the region.
5. Training via Correspondence
In this model, correspondence lessons and other learning materials are sent totrainees through the postal service. There is a regular feedback mechanism so that thetrainees' learning can be evaluated and conveyed to him. The correspondence phase is
supplemented with some kind of face-to-face training sessions at the local level, either bythe trainees' peers or the headmasters of mobile training teams. In some cases, a follow-upnational training of the trainees is carried out. (See Figure 7).
8 Manual on cost effectiveness
17
as
aoI i.imIng nl
nn lvlr le.itn
\perts:resource
Figure 7. Correspondence Training Model
( entralirclthiti)thil training
6. Linked Training
In this model the training of teachers in population education is built into the in-service training activities intended for subject areas in which population education has beenintegrated. Time is allocated for the teaching of population education within the totaltraining period. This model can be used as a supplement to other models of training.
A variation of this model is the training of primary school teachers on a staggeredbasis, through the monthly teachers' meetings organized by the ministry of education forthe professional growth of teachers and for administrative purposes. (See Figure 8).
7. Training via Educational Radio (ER) and Educational Television (ETV)
In this model specific educational/instructional programmes are developed forradio/television transmission. These programmes are transmitted regularly at pre-determinedschedules, indicating time and date. The schools are provided with radio/TV and teachersare expected to listen/view the programmes. The model can be supplemented by providingbackground resource materials before the broadcasts. The head of the school is responsiblefor conducting the training programme and sending feedback and evaluation periodically tothe district education officers of the concerned officials at the regional/national levels. Thesupply and maintenance of radio/TV equipment in schools located in remote areas is alsoorganized centrally. The model can be further supplemented with a peer training model andmodular training model to make it more effective. (See Figure 9).
Training modalities 9
18
OS
I r.titim4te hrl.St1111)10:11l'Ill,1
111rkielti
O
(1)
(2)
(3)
Figure 8. Linked Training Model
I.vpct '""'"tr'''
I sc.tizithat,t, .ttmcill III
I tl 1,.4, .11 it
r 41 I
I, 01(1 ',11H111 1;1
I III4C
7
(10)Feedback
Traasmisdon
.t
I- \ pert -,"Tt.,,,IITLf persons
I fr,160111-1,,,,17,,1,tpment
and thsthttwt.tnhat kotttm.1,trt.,4atitmatch 11.
(4)
(9)
It-t-,1,1, k ,nilthntih,it
Itt t-I the
higher .thtials
Figure 9. ER and ETV Training Models
10 Manual on cost effectiveness
19
Figure 10. Field Operational Training Model forOut-of-School Key Personnel
8. Field Operational Seminar
This model is based on participatory activities in a rural community where out-of-szhool key personnel surveys the needs of the community, identifies their problems, anddevelops programmes and materials which are need-based. This model involves the trainingof resource persons who are expected to organize the participants from a community andto guide them in a survey of their needs, the identification of problems, and the develop-ment of programmes and materials. (See Figure 10).
9. Internship and Attachment Programmes
This model involves the training of key personnel from different countries in popula-tion education, as well as in documentation. The interns work on specific areas of popula-tion education through self-study under the direction of the Unesco Regional Team onPopulation Education. This model can also be used at the national level in the training ofkey persons.
In a variation of this model, key personnel are attached for a period of one to threemonths to successful programmes in population education. Under this variation, the traineeworks as a member of the local staff and gains full experience in the substantive as well asoperational aspects of the programme (See Figure 11).
1
40411r,".1111.
Irl .11.:1 1111
VIC."
Figure 11. Internship and Attachment
Training modalities 11
20
10. Eclectic Training Model
This model combines all the above models for training different categoiies of per-sonnel as shown is Figure 12. The model envisages four main categories of personnelnamely, population education project personnel, administrators and policy level personnel;resource persons and trainers; and teachers and field workers. For each category, sometraining models have been suggested which can be reinforced or supplemented by othermodels depending upon the needs and resources of a particular country. The main strategyused in this model is that a manageable number of population education project personnel,administrators, and resource persons and trainers, requiring extensive training are trainedthrough face-to-face models. Teachers and field workers, on the other hand, are trainedthrough mobile teams and/or peer training models. The training of teachers and fieldworkers can be supplemented by modular, linked, correspondence and/or educationalradio and ETV.
It could be seen from the above brief description of various models that thesemodels vary in terms of:
i) approach and strategies, ii) tasks, sub-tasks and operational level activities,supportive services; iv) instruments of teaching/learning, v) managerial processes and effortsin planning, organizing, implementing, monitoring and evaluation, vi) cost centres and coststructures (fixed costs, variable costs and opportunity costs), vii) coverage of target popula-tion, viii) and expected intensity of learning.
O
1/
Target Groups
1',,i)tti
jI/tC11.. r' i!
ORCS, IUD r 1,cidons
And, tr.1111,1)
I ht ..1111
field ,,,,r1.ser,
1,1, CM-Lk C
nati.m.11c\ el
Training Models
Reinforcement
Reinforcement
I it, I., Li. r tt
'1.1(1,`111 i i I ,111.
Ti H
Ntolole tearr.,Peer
Reinforcement
Reinforcement\1,1111:1,
1111,,
IN 1. 1,111e
I
Source: R.C. Sharma. Alternative Models of Training in Population Education in Asia and the Pacific. Uncle°, Bangkok,1981, p. 13 (mimeo).
Figure 12. Edectic Training Model
12 Manual on cost effectiveness
21
It follows that even for two programmes following the same model the cost-etiec-tiveness may vary due to: the use of different instruments of teaching since each instrumentwill have different cost structure and managerial process; and the managerial efficiency interms of decisions associated with planning, organizing, implementing, monitoring andevalviation. All such decisions will be again in relation to time, space and tasks.
A survey of existing books and other publications revealed that countries in As'..and the Pacific are using not only one but at least three of the training modalities discussedpreviously. In some cases a combination of two or three methods is used in a given mo-dality.
It is very clear that there has hardly been any systematic study in terms of the cost-effectiveness of these modalities, anti the relative cost-effectiveness of different trainingmodalities in population education.
As illustrations, some aspects of the modalities followed iv_ (:hina and Thailand arepresented in Figures 13 and 14, respectively. However, a systematic cwt-effectiveness studyon training modalities in population education has not yet been done in eithercountry.
Face-to-Face
Mabile TeamsMethods
Correspondence
Peer Group
Note:
Strategy: Concentration on middle school teacher. 'nitially in selected regions (13)
Approach: 1. Straight, direct message on population related issues, For example, emphasizing one child per family norm.2. Use of multiple methods for greater impact.
Figure 13. Training Modality in PE in China
Training modalities 13
22
\tillistr\ .71 I ,I11,,11.1,11
1.)1
01,11 It 1,11
(1) (2)
Face-to-Face
1)11111111clit
\,)11 I or:11.11
I dlit
Face-to-Face
III
1111:'1,
,I1!
"11,,I I f i, litT.
Face-to -Face
Faoe-to-Face
Note:
1. Production and distribution of instructional materials both for primary and secondary levels; teaching4earning pack-ages; slides and sound acts; video tapes; PC newsletters.
2. Production of set of learning modules for college instructors and college students radio broadcasts.3. Production of instructional materials for specific target groups; monthly wall - newspaper; radio broadcast.4. PEU Population Education Unit.
Figure 14. Training Modalities in Population Education in Thailand
14 Manual on cost effectiveness
23
AP 11 1 1,:V ( )
Cost Effectiveness:Concept and Process
Introduction
Several programmes and strategies for training personnel have been used in the lastfew decades. Some evaluation studies of the effects of these strategies have been carriedout,using pre-experimental (sometimes referred to as non-experimental), experimental andquasi-experimental designs. However, only a few of these studies have attempted to add astudy of costs in relation to the effects.
This chapter introduces the population educator to concepts which are central to anunderstanding of cost effectiveness and the process by which it is done.
Evaluation
Evaluation may be defined as the gathering of information which can be used forforming judgements, which in turn can be the basis ior making decisions. The informationgathered in the case of training programmes includes data on effects, that is change in theattitude and perceptions of the trainees. These data are used to answer questions regardingthe effectiveness of the training programmes or the modalities and strategies used in them.Decisions concerning programme revision, expansion or discontinuation are based on theinformation gathered.
Situations which call for pragmatic and realistic decision making, as in the case offunding constraints, require a study of the costs of alternative programmes, projects, orstrategies, in order to assist administrators and managers.
Effects are the results or outcomes of an intervention, such as a modality, an ap-proach, or a strategy. The effectiveness of an intervention is the extent to which it is able toattain its intended targets or outcomes.
Cost Effectiveness Versus Cost Benefit Analysis
Cost effectiveness (CE) analysis refers to the evaluation of the costs and effects ofprogrammes with regard to their outcomes. Cost effectiveness is studied once the goal of aprogramme has been established as being worti-, lAirsuing. It has a more modest aim com-pared with a cost benefit analysis as only costs, not benefits, are compared. Closely relatedprogrammes which are considered as being alternative ways of reaching the same goal arecompared. CE analysis is used in the evaluation of training modalities as it integrates theresults of activities with their costs in way that allows the selection cif activities that yieldthe best training results at specified costs, or that provide a specified level of trainingat leastcost. Both the cost and effectiveness aspects are important and must be integrated to makegood decisions in programme development.
Cost benefit analysis, on the other hand, attempts to compare the costs and benefitsof a single programme by translating them into monetary terms and comparing the resulting
Concept and process 15
4
figures, that is, cost in dollars is compared to benefits in dollars. Problems to be tackled in acost-benefit analysis can be quite formidable, especially in the evaluation of human resourceprogrammes, because the analysis has to reckon with the problem of how to weigh futurebenefits against present benefits, or what discount rate to adopt.
When costs are combined with measures of effectiveness and all alternatives can beevaluated according to their costs and their contributions to meeting the same effectivenesscriterion, the ingredients for a CE analysis are present. It is assumed that only programmeswith similar or identical goals will be compared, and that a common measure of effective-ness will be used to assess them. Obviously, programmes with different objectives will havedifferent indicators of effectiveness, so they cannot be readily compared within the CEframework. Fortunately, in population education all the training modalities discussed inChapter Two have similar goals.
Costs. Any social intervention or programme has both an outcome and a cost. Theoutcome refers to the result of the intervention. Outcomes of training on educational inter-ventions include such indicators as knowledge gain, attitude change, favourable behaviouralintents, greater employability, and so on.
Technically, the cost of a specific intervention is the value of all of the resourcesthat it uses, had these resonance been assigned to their most valuable alternative use. Byusing resources in one way, the opportunity to use them in another way is forfeited. In thisa cost has been incurred (Levin, 1983).
Cost-effectiveness Evaluation: The Process
CE can often be done by taking the normal evaluation design and integrating it witha cost component. This means that if competent evaluators are available to contribute tothe study, the addition of the cost dimension is all that will be required. This addition canbe dont through a team approach.
How is CE analysis incorporated in an evaluation study? Questions related to effec-tiveness include the following:
1) What are the alternatives to be compared?
2) Do these alternatives share a common goal? What objectives do they have incommon?
3) What common indicators of effectiveness can be identified?
4) What evaluation research design can be used to compare the alternatives interms of the indicators of effectiveness?
Analyzing Effectiveness
Each programme objective can be used in constructing an effectiveness measures. Inthe CE approach, it is necessary to first determine the programme objectives and identifyappropriate measures of effectiveness for each.
In the case of training modalities in population education, the following may be theobjectives and their corresponding measures of effectiveness:
Objective Measure of Effectiveness
1) Heightened level of awareness andincrease in knowledge
1) Increase in score in a pre-test of know-ledge
2) Improvement of trainee's attitudewith regard to population education
2) Increase in score on an attitude scale
16 Manual on cost effectiveness
25
Objective
3) Application of learning from thetraining programme
4) Tcaching skills
5) Trainee satisfaction
6) Multiplier effects
Measure of Effectiveness
3) Behaviour tendencies as shown byscores in a situation test
4) Demonstrate(' ability to teach popula-tion education concepts
5) Positive perceptions of the trainingprogramme
6) Number of persons trained by thetrainee; number of persons outside theclassroom with whom the traineeshared his knowledge and experiences
Taking three training modalities for illustratw purposes, it is assumed that all threeare used for training teachers and field workers in population education at the provincialor state levels. The three training modalities are as follows:
A. Face-to-face conventional instruction for groups of 30 teachers each.B. Self-instructional modality through print materials complemented by audio and
video tapes.C. Correspondences course/distance !earning.
It is assumed that all three modalities have the f allowing objectives:
1) To increase the trainees' knowledge of concepts concerning the nine themesaddressed by population education.
2) To develop favourable attitudes towards the messages or thrusts of populationeducation.
3) To develop in the trainees an inclination or intention to apply the concepts andmessages learned in the training.
4) To enable the trainees to apply appropriate skills in teachinh, p ?ulation educa-tion concepts.
Since all three modalities have similar objectives, the same indicators of effectivenesscan be applied to each. The indicators corresponding to the four objectives are:1) Gain in knowledge, as indicated by the difference between the post-training
and pre-training score in a knowledge test covering the nine thrusts or themesin population education. (These nine thrusts are discussed in detail in the sec-tion on Instrumentation in Chapter Three).
2) Chanbe in attitude as indicated by the difference between the post-training andpre-training scores in an attitude scale covering the themes in population educa-tion.
3) Score on a practice or Lthaviour tendency scale relative to the concepts learnedand attitudes acquired.
4) Trainee's teaching skill as observed in a teaching demonstration and rated onan observation rating scale.
All four indicators can be measured immediately after the training. Other indicatorsof training effectiveness which can be used are the following
The number of teachers trained through each modality compared to the targettednumber can be used as an index of efficiency of the modality.
For the purpose of a cost-effectiveness analysis, focus is placed on the first threeindicators, that is, knowledge gain, attitude change, and behaviour tendency.
The evaluation of effects is based on the evaluation design used. For example, themeasures of knowledge gain and attitude change imply a pre-test and post-test design. Themeasure of behaviour tendency calls for a design using only a post-test. Designs are dis-
cussed in Chapter Three.
Estimating Cost
Every ingredient that is used to produce the effects that will be reco-ded in theevaluation must be identified and included. In a cost analysis, the ingredients needed topursue the intervention are specified and a value is placed on each of them. When the valuesof all the ingredients are added, the total cost of the intervention is established.
Each of the three modalities require ingredients in different amounts and mixes, asfor example, services of staff, equipment supplies, materials, technical expertise, and so on.
Chart 1 shows a listing of some ingredients for each of the three .:sodalities.
Questions which are important with respect to cost are as follows:
1) What costs are Incurred in carrying out each alternativ, ?
2) What is the total cost per alternative?
3) What is the amount of effect/outcome from each alternative?
4) What is the cost per unit of effectiveness?
Expenditures are commonly broken down into direct and indirect categories. Directcost corresponds to what is considered as a short-run variable cost in economic literature, asfor example, salaries and wages, supplies, and field expenses. These vary with the level ofprogramme activity. Indirect corresponds to what economists refer to as a short-run fixedor "overhead" cost, as for example, administrative, research, and evaluation costs. These donot vary with the level of programme output.
Costs may also oe categorized as follows:
1) Fixed cost or development costs,
2) Implementation costs,
3) Costs to trainee's organization, and
4) Costs to trainees themselves.
Fixed costs are those costs which are incurred in the development of a given modalityand its associated methods. These are fixed in the sense that they are incurred before theactual training is undertaken and irrespective of the number of persons to be trained. Costsincurred in designing a training curriculum and developing teaching materials and audio-visual materials are included in this category.
Implementation costs are those which are incurred during the training period. Someof these are 'fixed' costs while others vary according to the number of trainees. Fixed costsinclude the cost of such equipment as overhead projectors and film projectors purchasedspecially for the training programme. These costs do not generally vary according to num-ber of trainees. Similarly, faculty time cost (that is, salary or honorarium to teaching facul-ty) is a fixed cost, as it does not generally vary according to number of trainees. On theother hand, the costs of travel, board and lodging, teaching materials distributed to trainees,and so on are variable costs, as they vary according to number of trainees.
18 Manual on cost effectiveness
27
Costs to the trainee's organization (as for example, a school or office) are costs in-curred by the organization in the training of its personnel. These include travel cost, trainingstipend, training fees, salary during the training period, and so on. Such costs are coveredeither by the trainee's organization or by the training institutions. These should be con-sidered under appropriate cost categories. The trainee's organization may also incur theadditional cost of employing another teacher during the absence of a teacher sent for train-ing. If this is not done, the work of the absent teacher in the organization is likely to suffer.To the extent that the work suffers, the organization incurs a cost which should be takeninto account.
While undergoing training, the trainee may also incur some personal costs. Thesecan include travel cost, loss of salary for the period of training, out-of-pocket expensesduring the training period, an.1 so on. Some of these are likely to be covered under appro-priate cost categories and should be treated accordingly.
Chart 2.1. A Sample Listing of Ingredients for Three Training Modalities
Ingredient Correspondence Modular Mobile
Personnel Project DirectorProject Co-oviinatorProfessors, Lecturers &other PE expertsRegional PE officersPrincipal & Lecturers ofteachers' training' CollegesSupport Stafr
Project DirectorProject Co-ordinatorProfessors, Lecturers, &other PE experts
Staff of Training College
Support staff
Library
TV, Radio, etc.
Modules
Reference books
Postage & stationery
Project DirectorProject Co-ordinatorProfessors, Lecturers, &other PE experts
Staff of Training College
Support staff
School building and para-phernaliaLibraryFurniture
Video Audio tapes
Relevant literature
Reference booksCharts, posters, slides,films & other AV mate-rials
TransportationSubsistence AllowanceRefreshment
Extra time Release Tune
There are also some intangible costs, such as any inconvenience suffered by thetrainee and his family members during the training period. All such "inconveniences" arecosts which should be appropriately covered in calculating the costs.
Another typical breakdown of costs, includes the following components: personnel,facilities, equipment and materials, other programme inputs, and client inputs.
Facilities refer to spaces, areas and buildings. Equipment and materials refer tofurniture, equipment/apparatus, and supplies needed for the intervention. Other inputsinclude extra liability or theft insurance, or cost of special training. Client inputs includecontributions that are required of the clients or their families.
While a budget provides estimates of some of the above costs, it is often inadequatefor parposes of cost analysis. First, the budget does not include cost information on all theingredients that are used in an intervention. Contributed resources such as volunteers,
Concept and process. 19
28
donated equipment, and other unpaid inputs, as well as resources which are already paidfor, are afro not included. Sometimes a budget distorts the true cost of an ingredient. Thecosts of any particular intervention in a budget that covets a much larger unit of operationmay be difficult to isolate. Because budgets represent plans on resource allocation ratherthan actual expenditures, they cannot serve as the basis for constructing cost estimates butonly as a supplementary source of information.
Analyzing Cost
The analysis of various ingredients of cost can be based on the different categoriesof costs: a) fixed and variable, b) tangible and intangible costs, c) who bears them.
A three-demensional presentation of these is shown in Figure 1 below:
i
Whet type?
Rises vadebie
Figure 1. A 3-dimensional classification of costs
After the ingredients have been identified and their cost estimated, a cost worksheet
can be set up to analyze the cost. This is a grid which separates costs either by ingredient,or as fixed or variable costs, in terms of the constituencies which bear the cost, as for exam-ple, sponsor, government agencies, and contributors. Chart 2.2 shows a sample cost work-
sheet.
Chart 2.2. A Grid for Estimating and Distributing Costs
Ingredient Total Cost Cost to SponsorCost to ether
Gov't Agencies
Flied Costa
PersonnelFacilitiesMaterials & equipment
Variable costs
Trainees'time & inpt .
Other inputs
TotalingredientsCost
Trainee fees
[ Net Cost
20 Manual on cost effectiveness
29
This worksheet serves two purposes: to determine the total ingredient cost for anintervention, and to show how the cost of each proposed or actual intervention is distributedover different constituencies.
Chart 2.3 shows a sample worksheet accomplished for a hypothetical trainingmodality.
Chart 2.3. A Sardpk Cost Estimate Sheet for a Hypothetical TrainingModality in a Country
Some issues arise at this point. How can costs be estimated when there is no i.-:.-formation on costs, or when there are different cost estimates?
To deal with the first question, the activity to be tasted out is reckoned in terms ofsub-ingredients needed to produce the activity, rather costing out the whole activity inabstract terms.
When there are different cost estimates, it is advisable to obtain their ranges andvariation. The medium value, that is the mid-point between the highest and the lowestestimates, can be taken as the most probable one.
A cost analysis must always be referenced to a time period, that is, cost benefits andeffects of any intervention are considered with reference to a particular period of time.
A confusion that sometimes arises is the difficulty of separating the ingredients of aspecific intervention from the ingredients required for the more general programme thatcontains the intervention. In such cases, the ingredients that should be evaluated for thepurpose of a cost analysis should include only those additional ones that are required for theintervention, or the marginal cost.
For the cost effectiveness component therefore the steps are:
I) Identifying the ingredients required for each alternative,2) Estimating/setting the cost of each ingredient,
Concept and process 21
30
3) Identifying who or which agency bears the cost,
4) Calculating the total cost for each alternative,
5) Obtaining the measure of effectiveness of each alternative,
6) Computing a cost effectiveness ratio for each alternative.
Chart 2.4 shows the costs of three hypothetical training modalities for one year.Details of the process of computing the cost effectiveness ratios for these modalities arediscussed in Chapter Four.
Chart 2.4. Costs of Three Hypothetical Training Modalities
The efficiency of a modality refers to how much it can turn out relative to theinputs. For example, given three modalities each earmarked a certain sum. The modalitywhich results in a greater output is the more efficient. This concept is illustrated in ChapterFour.
22 Manual on cost effectiveness
31
Design and Instrumentation
Design is a plan or framework set up for a particular purpose. In evaluation research,the purpose of design is to enable the evaluator to answer the evaluation question and tocontrol variance.
Evaluative research designs may be categorized into three groups: pre-experimental(non-experimental), experimental, and quasi -experimental. The designs of descriptive sur-vey research are sometimes used fc:. descriptive evaluation purposes. The pre-experimentaldesigns are mainly forone-sampie studies in which randomization is not used. Where a com-parison group is used, no strict assumptions are made about its comparability to the samplewhich received the treatment or intervention.
For a design to be considered a true experimental design, it must satisfy these twocriteria: at least two groups are studied, and random selection of subjects to groups and totreatments is done.
The quasi-experimental designs, on the other hand, fail to meet the criterion ofrandomization. Except for the time series design, which may be done on just one samplemeasured repeatedly over time (hence, it is used as its own control group), most quasi-experimental studies use at least two groups.
Four evaluation designs which lend themselves to an incorporation of cost analysisare the °flowing:
1. The Two-group, Post-test Design
This is a study of two groups given different interventions or treatments. At the endof the treatment an observation measure (post-test) is taken. The design is represented inthe following symbols:
Treatment Post Test
Xi
x20,02
Here X1 and X2 stand for two training modalities. Oi and 02 refer to scores of thetreatment groups in a knowledge test or an attitude inventory. If 01 differs from 02 , it issuggested that the two treatments differ in their effects/effectiveness, as measured by acommon instrument.
2. Two-Group Pre-test/Post-test Design
In the previous di f.ign, it cannot be ascertained if the observed difference betweenthe two groups is really due to the treatment, as there is no available measure of the groups'abilities/attitudes prior to the training. Hence, it is possible that the groups differ in thepost-test simply because they were different, to start with.
Design and instrumentation 23
32
The pre-test post-test two-group design is represented this way:
01 xi03 x,
02
04
This design allows a comparison of the characteristics of the two groups at entrylevel. If they are comparable at the start, then the effectiveness of the two modalities ortreatments can be compared based on the post-test measures (02 vs 04 ). If 01 differs from03 significantly, then a statistical control for the initial edge of one group can be applied incomparing the two post-test measures.
3. Multiple-group post-test design
This is represented thus:
Strategy /Intervention Post-test
X1 01
X2 02
X3 03
X4 04
The groups are compared on the basis of the post-training measures (the Os). Anysignificant differences among these measures are attributed to the treatments or modalities(the Xs), and are interpreted as differences in effectiveness. The groups given the treatmentsare assumed to be comparable at the start.
4. Multi-group, Immediate and Delayed Post-test
Strategy Post-Test Delayed Post-Test
X1 01 1 012
X2 021 022
X3 031 032
This design works with three or more groups. The Xs stand for the treatments ortraining modalities whose effects are measured immediately after the training and again, saysix months later, in a follow-up study. The delayed post-test could give a measure of theretention of knowledge or the application of the knowledge or skills learned in the trainingprogramme to the trainee's work situation.
Since randomization in training programmes is not always possible to implement,quasi-experimental designs are considered most feasible and appropriate. However, this doesnot suggest precluding the use of strictly controlled experimental designs.
The assessment of effectiveness can be done formatively or summatively; that is,during the operation or at the end of the training programme.
Cost Effectiveness Approach
This build.; on rather standard approaches to evaluation by simply adding a costdimension to the over-all evaluation design. Thus, if an evaluation of the effectiveness ofdifferent alternatives is to be undertaken, it is necessary to provide a framework for incor-porating the cost analysis in the evaluation.
In the CE approach, the outcome can be addressed according to its own attributesrather than based on monetary units. The ratio of cost to the effectiveness data will indicatethe level of effectiveness that can be obtained from an estimated cost. Since the ratios for
24 Manual on cost effectiveness
33
different alternatives can be compared, information can be provided to decision makers onwhich alternatives seem best in terms of costs, other factors remaining constant.
Cautions about CE
When CE analysis is integrated into evaluations, the evaluation exercise is morelikely to yield the types of information that are crucial to decisions, than when costs areignored.
It should be stressed, however, that CE as an analytic tool is only a source of in-formation rather than decisions. Even the best analyses must be combined with other typesof information in order to make good decisions. The decision-maker is reminded of thefollowing points:
1) Measures of costs and effects are really only estimates of these dimensions,hence they are subject to error. Their accuracy depends on the evaluator'sability to measure the cost or effectiveness concept in an accurate way.
2) It is not possible to incorporate all of the considerations that should form thefinal decision. There are always considerations that cannot be fully incorpor-ated into the evaluation. The implication is that if differences in CE resultsfor two or more alternatives are small, the decision should be made on thebasis of other criteria rather than on comparisons of numerical ratios. As ageneral rule, ratio differences of 10 per cent or so should always be treatedwith skepticism as such differences could be due to a margin of error.
It is important to incorporate cost analysis into the evaluation design itself ratherthan to decide upon the collection of cost data as an after thought. It is much enier toobtain accurate cost estimates when analytic procedures are built into the evaluation design,than it is to collect them later on a post-hoc basis. The former makes it possible to accountmore fully for the resource ingredients that are incorporated into each alternative during theactual evaluation.
Instrumentation
Instrumentation encompasses the use of instruments by which data or informationcan be collected and quantified.
An instrument is a device used for a specific function or purpose. In evaluativeresearch, instruments include achievement tests, rating scales, checklists, or performancescales which are all aimed at assessing the effects of an intervention. Instrumentation there-fore connotes data collection and measurement.
To measure the effects of the three training modalities iaentified in this paper, threeinstruments will be needed to obtain information on effectiveness. They are:
1) a test of knowledge of population education concepts,2) an attitude rating scale, and3) a behaviour tendency scale.
The Knowledge Test
The test to measure gain in knowledge can be a multiple choice test consisting of40 to 50 items, each provided with four response options.
The knowledge test covers concepts involved in nine population education themes orthrusts as follows:
ismImmir
1) small family size and family welfare,2) delayed marriage,
34
Design and instrumentation 25
3) responsible parenthood and family planning,
4) population and other development concerns,
5) population beliefs and values,
6) urbanization and migration,
7) problems of adolescence; sex education,
8) aging and
9) status of women.
To ensure the content validity of the test, there should be at least three items foreach thrust. The composite score on the test indicates the respondents' knowledgeabilityabout population education. The higher the score, the more knowledgeable the respondent
is. Sub-scores on each of the nine components may be analyzed later to find out whichthrusts or messages have not been learned well.
Below are three sample multiple choice items from a knowledge test. In ChapterSix there is a prototype test consisting of items dealing with the nine population education
thrusts:
ie
I
V-.
The test can be given as a pre-test and post-test to determine gain in knowledge thatcan be attributed to the training or intervention. It can also be administered as a post-testonly.
A trainee's score on a 40-item test, for example, is a measure of the extent of hisknowledge of population education concepts.
26 Manual on cost effectiveness
35
There are many tests from which the trainer can draw. Among them are sampletests found in the following books:
1) Unesco ROEAP. Evaluative Research in Population Education, 1986.2) Unesco ROEAP. I ual on Evaluation 'n Population Education, 1979.
Attitude Rating Scale
This scale can be a 20-to 30-item instrument using Likert -type items, which areopinionated statements that require the respondent to register his agreement or disagree-ment. There are no right or wrong responses. The instrument is designed to gauge the res-pondent's attitudes toward such themes as:
1) small family size,
2) age at marriage,
3) equality of the sexes,4) care and respect for the elderly,5) changing role of women, and6) sex preferred for the first child.
Each response to an item has a score weight. The scores from the items are addedup.
The higher the respondent's total score, the more favourable is his attitude towardpopulation education messages and themes. Agreeing with positively oriented statementsand disagreeing with negatively oriented ones indicate a favourable attitude.
Below are sample items from an attitude rating scale. A sample attitude test isfound in Chapter Six.
40.
es
Design and instrumentation 27
36
The attitude scale can be administered at the end of a training programme, to get anindex of the trainees' attitude, or at the start and end of the training programme to get ameasure of attitude change ascribable to the training.
Behaviour-Tendency Scale
Since observation of behaviour is not always feasible, an indirect measure of be-haviour o' behaviour tendency can be obtained through situation-test items to which anindividual registers how he will most likely act in a given situation. Each response option toar. item has a corresponding score weight. The total score of an individual on all the itemsis a surrogate measure for his behaviour or tendency to act or behave. Two situation testitems are given below:
V
Stituation- test items like the above also reflect attitudes and/or values. A samplesituation-test for obtaining a measure of behaviour tendency is found in Chapter Seven.
28 Manual on cost effectiveness
37
Data Analysis andInterpretation
Two sets of analysis need to be done. The first set is an analysis of the effects ofthe modalities as specified in the evaluation design. The second set is an analysis of costeffectiveness. In the two- or three- group design using only post-test scores, the typicalperformance of individuals in each group can be measured by computing the mean oraverage scores and the standard deviations.
In designs with both pre-test and post-test scores, a mean change/gain score is com-puted by obtaining the different between the post-test and pre-test scores of each indivi-dual, and dividing the sum of these scores by the number of individuals, that is:
Mean Gain = Sum of all individuals' gainsNo. of Individuals
or M = E Post-test Score Pre-test Score)N
The mean gain scores of the groups are then compared.
Chart 4.1 shows a table of hypothetical scores from three training modalities A, Band C. The arithmetic means are computed on the assumption that the knowledge scores areinterval scale variables. Instead of mean score, the medium score (or the mid-point betweenthe highest and the lowest scores) can be used as the average score, especially when thedistribution of the scores is not normal or when the level of measurement is ordinal, notinterval.
The sums of the pre-test, post-test, and gain scores are shown together with theircorresponding mean scores.
Statistical tests of differences may be applied to determine whether the numericaldifferences are real or are chance variations only.
When experimental designs are used (that is, when randomization is applied in theselection of members into a sample and the assignment of samples to treatments), parame-tric statistical tests can be applied. The reader is referred to elementary statistics books forinformation on the t-test, z-test or F-test of mean scores' .
When randomization is not applied and when sample sizes are small, non-parametrictests of difference are recommended to determine whether the differences between the twoor three sets of scores are due to chance only, or not. For these purposes, the Sign Test, theFisher's Probability Test, the Mann-Whitney Test, and the Kruskal-Wallis Test might be
1A comprehensive description and explanation of statistical techniques for evaluation studies is found in EvaluativeResearch inPooulation Education, Chapter 4 (Unesco, Bangkok) 1986.
Data analysis 29
38
Chart 4.1. Hypothetical Pre-test, Post-test and Gain Scores on Knowledgefrom Three Training Modalities
appropriate. The reader is advised to refer `,o such books as Sidney Siegel's Non ParametricStatistics for Behavioural Sciences (1956) for details about these tests.
The second set of analysis studies costs in relation to the effects of the treatmentsbeing compared.
Analysis of Cost Effectiveness
Once the total cost of all the ingredients has been computed for each of the alter-natives being compared, the cost per client is computed and a ratio between the cost andthe corresponding effect is calculated.
Taking "gain in knowledge" as the indicator of effectiveness in the three trainingmodalities, the mean cost per trainee is divided by the mean gain score t,.; obtain the C/Eindex.
Table 4.1 shows hypothetical data for the three training modalities A,B,C, using tiefollowing indices of effectiveness:
1. Knowledge gain as measured by the difference between scores on the sameknowledge test given before and after the training.
30 Manual on cost effectiveness
39
2. Attitude change as measured by the difference between the post-training andthe pre-training score on an attitude inventory scale.
3. Behaviour tendency as measured by the score on a paper-and-pencil situationtest on how a person will likely act in a given situation.
The table shows the total cost for one year and the cost per trainee for each of themodalities costed in Chart ' 4 p. 61.
Table 4.1. Cost per Trainee for Each of Three Training Modalities
Modality Total Cost No. of Trainees Cost per TraineeA
B
C
$ 1 275 60 $ 21.25810 90 90.00
6 100 200 30.50
On a per trainee basis, modality B has the highest cost and modality A the lowestCost.
Table 4.2 presents hypothetical mean gain scores on the three indices of effectivenessfor the three training modalities, based on the data in Chart 4.1. As indicated in this table,modality A has the highest mean score for knowledge gain and the second iargest score forbehaviour tendency. Modality B has the lowest score for mean gain in knowledge as wellas for attitude change. Modality C has the highest score for attitude change.
Table 4.2. Hypothetical Mean Gain Scores on Three Indices ofEffectiveness for Three Training Modalities
ModalityKnowkdge Gain
Index of EffectivenessAttitude Behaviour Tendency
A 10.5 12 8B 4.4 6 5C 8.0 16 10
Table 4.3 presents the cost effectiveness results for the three modalities, using theknowledge gain score as the effectiveness measure. The C/E ratios are obtained by dividingthe cost per trainee by the index of effectiveness (in this case, knowledge gain).
Table 4.3. Hypothetical Cost Effectiveness Results for KnowledgeGain in Three Training Modalities
Modality Cost per Trainee EffectivenessCIE(Knowkdge Gain)
Modality A shows the lowest ratio of cost to effectiveness, the lowest cost pertrainee, and the highest effectiveness index for knowledge gain. On the average, .he cost pertrainee for 1 point of improvement in knowledge is about $ 2.01.
40
Data analysis 31
On the other hand, modality B entails the highest cost per trainee and is the leastcost effective of the three modalities. It yields the lowest gain while incurring the highestcost per unit gain.
The figures suggest that modai.ty B takes ten times as much money , o effect thesame knowledge gain as modality A, and is about six times as costly to run as modality Cin order to effect one point of improvement in knowledge.
Modality C has the second highest cost per trainee and is the second most cost effec-tive.
Table 4.4 shows the cost effectiveness ratios of the three modalities for each of thethree indices of effectiveness. The C/E ratios a. computed from the data in Tables 4.1and 4.2.
Table 4.4. Cost Effectiveness Results by Modality Basedon the Three Indices of Effectiveness
ModalityC/E Ratio Per Index of Effechbentss
Knowledge Attitude Behaviour Ten. ncy
A 2.01 1.77 2.65
B 20.46 15.00 18.00
C 3.81 1.88 3.05
Interpretation of Results
Some cost analysts prefer to use the "effectiveness cost" ratio, that is, the effective-ness measure divided by the cost incurred to bring about the effect. This is analogous tothe "output over input" concept. The ratio generally comes out as a decimal less than 1.00.
The cost effectiveness ratic's in this paper are mostly greater than 1.00 because thecost measures are generally greater than the effect measure. The greater the C/E result,the less cost effective a modality is. The lower the C/E ratio of a modality, the more costeffective it is.
In Table 4.4 we note that modality B has the lowest cost-to-effectiveness -atios forthe attitude change Lsid beha. our tendency i-Klices. Consequently, modality B is the leastcost effective (that is the most costly) on all the three effectiveness indicators.
Hypothetical data in Tables 1 to 4 indicate modality A is better than either B or Con all the three indicators of effectiveness.
Efficiency and Effectiveness
In evaluating the effectiveness of training modalities, efficiency must not be over-looked. Some modalities facilitate the training of more teachers in the same unit at thesame time, than other modalities. Other modalities are meant train a few teachers only,but more intensively than other modalities can. Hence, two fact- rs have to be considered:coverage and intensity of training.
Let us sume that three training modalities are being evaluated. Each has a targetof 1000 teachers to be trained and the results are as follows:
EffectivenessModality No. of teachers Index (Coverage)
To be trained Actually trained
A 1 000 6G0 60%
B 1 000 800 80%
C 1 000 1 000 100%
32 Manual on cost effectiveness
41
Hence in terms of breadth of coverage, modality C is the most effective since it wasably to meet 100 per cent of the target number to be trained. Modality A is the least effec-tive in coverage, having trained Only 60 per cent. Here our main index of effectiveness iscoverage. This is usually the primary consideration in training programmes aimed at trainingor developing large numbers of teachers in the shortest possible time.
Looking into the number of trained teachers meeting a criterion of effectiveness(as for example, a passing score on a test, ability to apply what was learned, or being actual-ly assigned t-, teach what was learned), the intensity index for effectiveness is computedby dividing the number of teachers who met the criterion by the number trained, as shownbelow:
Modality Number of Number who Effectiveness IndexTeachers met the Based on the Based on theTrained criterion Teachers trained targetted number
This time we see that modality B is the most effective and modality C is the leasteffective, based on the number of L-achers trained to the criterion level. On the other hand,a comparison between the number of teachers trained to the success criterion and thetargetted number of teachers to be trained (1000), shows that modality C is better thanmodality A. (.50 is better than .40).
Considering both irldices of effectiveness, modality B yields the best results.To find out the efficiency of the modalities, the costs incurred must be considered.Cost efficiency is determined by dividing the cost by the indices of effectiveness,that is, the number of teachers actually trained, and the number of trained teachers whomeet the success criterion. This is shown in the table below, using the hypothetical datathat $ 15000 has been earmarked for training 1000 teachers by each of the three modalities.
Modality Amount Number Cost per No. of successful Cost perSpent* Trained Trainee Trainees SuccessfulTrainee
The costs per trained teacher across the three modalities do not vary much. Theyrange from $ 12.50 to $ 15.00. Modality B incurs the least cost, and modality A the highestcost. In terms of cost per trainee who meets the criterion level, modality B is clearly themost cost efficient.
Standard and Actual Cost Effectiven iss Ratios
In the planning of a project or intervention, the project manager cites budget orestimated costs and expected results. These are later compared to the actual cost of run -
Data analysis 33
42
ning the project and the actual observed effectiveness. The budgeted cost divided by theexpected effects is referred to as the standard cost effectiveness ratio. On the other hand,the ratio of the actual expenditures to the observed/measured effects is the actual costeffectiveness ratio.
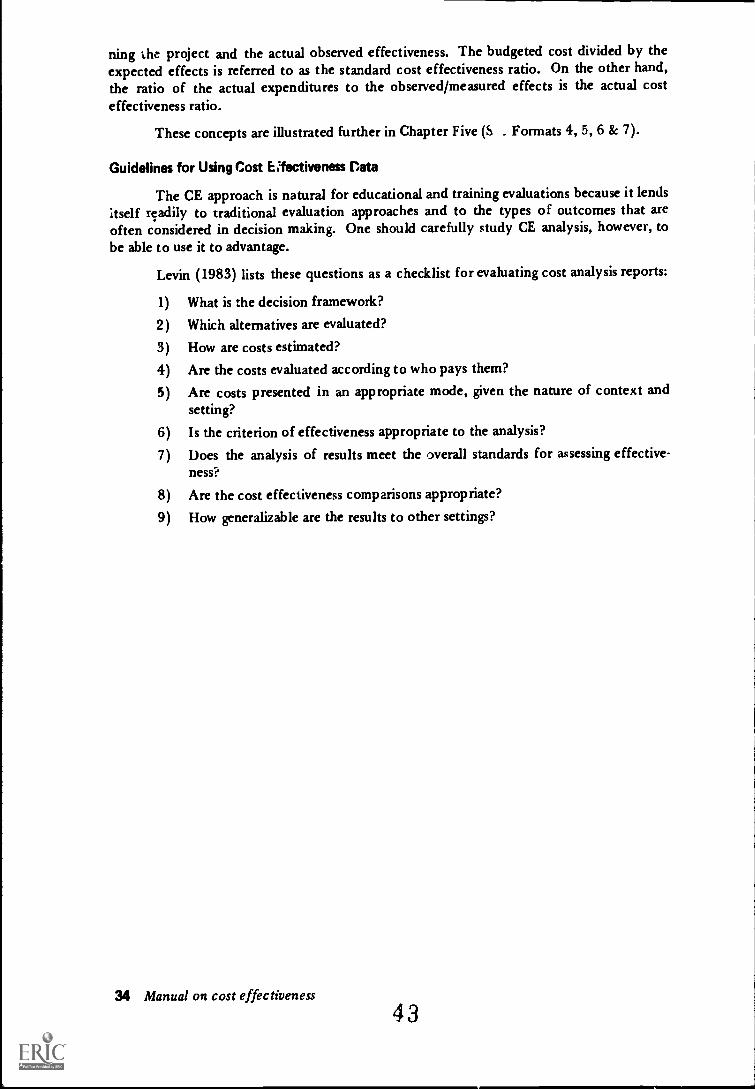
These concepts are illustrated further in Chapter Five (S _ Formats 4, 5, 6 & 7).
Guidelines for Using Cost Effectiveness Data
The CE approach is natural for educational and training evaluations because it lendsitself readily to traditional evaluation approaches and to the types of outcomes that areoften considered in decision making. One should carefully study CE analysis, however, tobe able to use it to advantage.
Levin (1983) lists these questions as a checklist for evaluating cost analysis reports:
1) What is the decision framework?
2) Which alternatives are evaluated?
3) How are costs estimated?
4) Are the costs evaluated according to who pays them?
5) Are costs presented in an appropriate mode, given the nature of context andsetting?
6) Is the criterion of effectiveness appropriate to the analysis?
7) Does the analysis of results meet the overall standards for assessing effective-ness?
8) Are the cost effectiveness comparisons appropriate?
9) How generalizable are the results to other settings?
34 Manual on cost effectiveness43
Managerial Considerationsin Cost Effectiveness Study
Understanding Managerial Dimensions
The population programme management has to decide on how various tasks/sub-tasks and associated activities should be planned, or:anized, executed, monitored, andevaluated within a given budget. It has to decide what institutions/org:_lizations are to beinvolved in the programme, at various levels and for certain activities, and now to co-ordinatethese activities. Again, at various levels of operations decisions are required in planning andorganizing sub-tasks and associated activities.
It follows that understanding a modality will require a thorough study of theseinternal aspects of the programme management process. Since different modalities willrequire different managerial structures and degrees of competence and efforts, while alsohaving different cost centres and L Jst structures, it will be necessary to (i) study the entiremanagement structure and process, (ii) identify discrete tasks and sub-tasks, (iii) considerlevels of operations, and (iv) asce, tain cost centres and cost structures.
In addition to the above, the cost effectiveness study has to tak into accout thecontextual setting. This covers external factors that are being implemented, and which mayindirectly affect various operations
Thus, we have to note that:
1) Effectiveness of training depends oil the synergic relationship and collaborationamong the three major partners of training namely, participants (trainees),trak. 4 organizations and trainers. Hence, an evaluation should provide thenecessary feedback on all these matters.
2) Training effectiveness depends not only on what happens during training butalso on what happens befo(.: the actual training (pre-training factors) and whathappens after the training has formally ended (post-training factors). Evalua-tion cannot neglect these important contextual factors.
3) Various aspects of the training process which are not direct training inputscontribute to s effectiveness. Evaluation should, therefore, also focus onthese factors.
4) The focus or the main task of evaluation should not only be in the nature ofauditing (measurin& training outcomes in terms of what has been achievedand how much), but should also be diagnostic (why has the cost effectivenessbeen low or high), and remedial (how can effectiveness be raised with somecost factors)1.
1See Udai Pareek, "Evaluation of Training", Vikalpn, Vol. 3, No. 4, October 1978, P. 291.
Managerial considerations 35
44
The diagnostic and remedial aspect of cost effectiveness is of utmost importance.The goal is not to obtain the cost effectiveness ratio per se, but, with the help of this ratio,
to fmd ways of improving effectiveness with the efficient use of given resources (costfactors).
The cost effectiveness ratio (that is, cost divided by effectiveness) can be changedeither by reducing cost or by increasing the effectiveness, or both, and since a populationeducation programme has many components, each operating as a cost centre and having
a cost structure (fixed and variable cost, opportunity cost, marginal cost, and so on),the cost reduction can take place at various component levels. Similarly, since traininginvolves various levels, which are hierarchically and/or horizontally linked, the degree ofeffectiveness at one level often determines the degree of effectiveness at other levels.
Hence, overall effectiveness can be improved by improving effectiveness at various levels.
Thus, we have to ask these questions:
1) Are the costs at various levels of operations reasonable? Can the costs atvarious levels be reduced by avoiding wastage, if any, and/or by carrying outalternate actions, without reduciAg effectiveness?
2) Can effectiveness at various levels of operation he improved by better plan-ning and organization of activities, and/or using alternate methods andinstruments, without increasing the costs?
It follows that the design of a cost effectiveness study must be able to provide dataand analysis on all the above issues.
Some Mar agerial Aspects
The following areas are generally considered in identifying managerial-related issues:
1) Inputs of personnel
2) Financial inputs
3) Equipment and materials
4) Instructional and training materials
5) Inter- and intra-institute/organization co-ordination
These are briefly discussed below:
Inputs of Personnel
The population education programme of a country specifies the inputs required ofthe personnel to implement the programme, as well as the period and duration of theirappointments. Any departures from the plan is likely to affect the effectiveness of theprogramme. Hence, it must be ascertained whether the specified number of pex,),nnelwith relevant background, experience, and qualifications were posted in time at variouslevels of operations, and if not, to what extent this was not carried out and how did thedeviations affect the performance of the programme.
Financial Aspects
Each programme plan designates fund allocations under specific headings and fo:specific tasks. Any delay in the provision of funds will delay the task and consequentlyall other related tasks and activities. Delays result in increased cost and reduced effective-
ness. Hence, it musk be established whether the amounts earmarked for various items ofexpenditure were released in full and at the time specified in the plan, and if not, whatwas the reason for the delay/reduction, and how did the deviations affect the performanceof the programme.
36 Manual on cost effectiveness
45
A related question is whether the project management staff at central and otherlevels spent the money according to the plan, and if not, what were the reasons, and howdid the deviations affect the performance of the programme.
Equipment and Materials
Details of equipment and materials are generally listed at the planning stage. It mustbe ascertained whether the equipment and materials, according to indicated specifications,and quality, and quantity, were procured and made available to the operating units/usersin time. A second question is whether proper arrangements for the training of personnel inthe use of equipments, as well as for maintenance services, were made. Any weakness onthese fronts is likely to affect the effectiveness of the programme. Hence, it must be estab-lished how a weakness on these fronts, if any, affected the performance of the programme.
Instructional and Training Materials
The programme plan providt-s for the preparation of instructional ai..1 trainingmaterials for teachers' trainers and teachers, and instructional materials for learners andCOlk -of-school educational personnel, such as those in non-formal education. It must bedetermined whether the materials were prepared, reviewed, field-tested, revised, and madeavailablz at the right time and in the required quantity to the intended users.
In case of certain training modalities, where feedback or other advisory systemsszioplement the training modality, a further question is whether the feedback and advisorysys:tms worked in time to the expected degree of performance. If not, to what extent didit fail to ,,io so and with what consequences?
Inter- and I ntra-I nstitute/Organization Co-ordination
Most of the models discussed in Chapter 1 invol"e the participation of many institu-tions/organizatioas. The overall effectiveness of the programme depends upon the degreeof performance of each participating institution. -e tasks given to different institutionsare linked and inter-related, any weakness in the performance of one (in terms of quality,quantity, and punctuality) is likely to affect the performance of others, and consequentlyof the entire programme. It must be asked whether there were any weaknesses in the co-ordination of activities of the participating organizations, and if so, to what extent was thisweak and how did this affect the overall performance of the programme. The question ofco-ordination will also be relevant in relation to an organization where various departmentsare involved in inter-related activities.
It can be seen from the above that these five management related issues will indivi-dually and interactively determine the physical and intellectual climate in which the pro-gramme will be executed, and its level of effectiveness.
Model for Identifying ManagementStructure
To understand the overall management structure and identify discrete tasks and sub-tasks, levels of operation, cost centres, and cost structures, the model that is generallyfollowed is discussed here.
A programme has specific objectives which can be achieved through the performanceof various tasks and functions. The top management's primary function is overall planning,organizing, financing and control of various tasks, in a co-ordinated manner. This is first-order management system. For each discrete task there is an operating system by which toachieve it. Since each task involves a number of sub-tasks, th: operating system will also beresponsible for planning, organizing, and monitoring the sub-tasks in a co-ordinated manner.Thus this operating system is a second-order management system. As each sub-task can be
Managerial considerations 37
416,
further divided into discrete tasks, a second-order operating system also be, a tF d-ordermanagement system. By logically dividing work into discrete tasks, a hierarchy of manage-ment and operating systems is arrived at.
It should be noted that each management/operating unit has a clearly definedpri-mary task to perform effectively and efficiently. Any weakness in the achievement of theprimary task will affect the performance of other units, as well as the overall performance.The primary task is generally defined as that task on which the "survival" of the unitdepends. In other words, the unit exists only to achieve the primary task. If it cannotachieve the primary task assigned to it, it has no right to exist.
The model that emerges from the above is presented in Figure 1.
0 Planning
0 Organizing
I %LW 11V1
First-Order Management System
OFinance
0 Control
S.T = Sub-tasks
As in case of DT -1
Third Order OS, 1_ Fourth Order MS. J
and so on
This model will help in analysing various managemen:. and operating systems inrelation to various training models discussed in Chapter 1. Once the training models are
38 Manual on cost effectiveness
47
analysed on these lines, it will be easy to identify the centres involved in direct trainingactivities and those involved in supportive/service functions. The effectiveness of each unit/centre level can be measured in relation to the task assigned to it and the cost incurred.
Guidelines for Studying Management Issues
Guideline 1. Identifying Diviskn of Work and Responsibility
Using the model given in Figure 1, the following are identified for a given trainingmodality.
(i) All tasks and sub-tasks, in such a way that all activities involved in the pro-gramme are fully accounted for;
(ii) The primary task at each management and operating level, as well as the institu-tions/organizations involved in the programme;Planned allocation of personnel and those actually posted at each unit level.Was a specific number of personnel with relevant background, experience, andqualifications posted in time at each unit level?. If not, give the reasons, thedegree of deviation, and the effect on the performance (refer to Format 1, 2and 3);
(iv) Planned allocation of funds and the amount actually provided at each unitlevel. Were various items of expenditure released without reductions and at thespecified time? If not, give the reasons, the degree of deviation, and the effecton the performance (refer to Format 1, 2 and 3);
(v) Planned allocation of equipment and materials and actual supply to each unit.Were the equipment and materials, according to pr -determined specifications,quality, and quantity, procured and made available to the operating units/usersin time? If not, state the reasons, the degree of deviation, a'd the effect on theperformance (refer to Format 1, 2 and 3);
(vi) Arrangements for maintenance, repairs, replacement of equipment and mate-rials, and for the training of operating unit personnel (users) in the use ofequipment and materials. Were the arrangements carried out according toplans? If not, give the reasons, the shortfalls, and the effect on user's perform-ance (refer to Format 1, 2 and 3).
Guideline 2: Identifying Academic/Technical Support Systems
Identify,
(i) The unit/organization responsible for the preparation of instructional andtraining materials;
(ii) Whether the materials were prepared, reviewed, field tested, revised, and madeavailable in the required quantity, at the right time to the intended users. Ifnot, give the reasons, the shortfalls, and the effect on performance ofuser units.
(iii) The feedback and other advisory systems and whether they worked in time, tothe expected degree of performance. If not, give the reasons, the shortfalls,and the effect on performance of user units.
Guideline 3: Identifying Inter- and Infra -Agency/Organization Co-ordination
Identify,
(i) Departments /agencies /institutions/organizations involved in the programme;(ii) Tasks assigned to each of the above;
Managerial considerations 39
48
(iii) Nature of the interdependence of tasks;
(iv) Process of monitoring the performance of each of the above;
(v) Performance of each of the above in relation to specified task and in relationto quantity, quality, time, and space. Identity the extent at which each depart-ment/agency/institution/organization performed its assigned functionNsk. Incase of shortfalls, give the reasons and the effected on the performance ofothers, as well as the overall performance.
Format for Analysis
The formats for analysis are presented in the following section.
40 Manual oL, cost effectiveness
49
Format 1: Component-wise Assigned Tasks, Facilities and Budgeted Costs.
Note: For each assigned task, target, penonnel, equipment and materials, enaintenanoe etc. services, and funds also attach separate sheets giving details.
5150
Format 2: Component-wise Performance and Expenditure (actual cost)
Sr.No.
Performance and Evendisuny
Discrete Task Performance Date of Expenditure
Component /Unit (in relation Compktion (in relationto target) to target)
Remarks
(I)
I
2
3
4
n
(2) (3) (4) (5) (6)
Note: For each component also attach separate sheets giving details of performance, date of completion and expenditure.
Format 3: Comparison of Expected Performance ,ind Actual Performance,and Reasors for Shortfall
Sr.No.
(1)
I
2
3
4
n
Discrete TaskComponent /Unit
(2)
Difference Between Expected and Actual Performance in Relation to
Target
(3)
Date Expenditures Reasons
(4) (5) (6)
Note: For each component also attach separate sheets giving details of the difference between expected and actual per-formance in relation to target, date and expenditure, and reasons for shortfall.
42 Manual on cost effectiveness
52
a
Format 4: Component-wise Comparison of Expected and Actual Cost-Effectiveness Ratio
Sr.No.
Discrete TaskComponent /Unit
Expected Cost andEffectiveness (a)
Actual Cost andEffectiveness Difference Reasons for
Note: For reasons about the differences in expected and actual costs, effectiveness and CE ratio also attached separate sheets giving details.(a) The plan document for the programme gives the overall costs and expected results or tarrts (effectiveness). This is expected cost and expected effectiveness. This provides a "Stan-
dard" cost-effectiveneu ratio against which actual CE ratio can be compared.
5354
Format 5: Comparison of Different Moealities in Terms of Expected and Actual CE Ratios
Sr.No. Modality
Expected CE Ratio(Based on Plan Document) Actual CE Ratio Difference between
Expected and ActualReasons forVariationCost Effec-
tivenessCE
Ratio Cost Effec-tiveness
CERatio
CostEffec-tiveness
CERatio
(1) '2) (3) (4) (5) (6) (7) (8) (9) (10) (1- i (a s)
1
2
3
4
5
6
n
Note: For each modality also attached separate sheets giving details; alit.) explain the difference among the modalities.
l
Format 6: Comparison of Expected and Actual CE Ratio in Relation to Different Dimensionsof Effectiveness for Different Modalities/Methods
Sr.No.
(1)
1
2
3
4
5
6
n
Modality/Methods
(2)
Effectiveness is Relation to Various Discrete Dimensions of Effectiveness
Note: (1) D1, D2, D3, and D4 are different dimeh-Lms of effectiveneu of t ffectiveness namely awareness, knowledge, attitude and behavioural tendency. The measurement could be eithercoverage (numbers) and/or intensity (scores);
(2) Also attach separate sheets giving details.
.857
Format 7: Comparison of Expected and Actual CE Ratios in Relation to DifferentDimensions of Effectiveness for Different components
Sr.No.
Components
Expected Cost-Effectiveness
Ratio for
Actual Cost-Effectiveness
Ratio for
Difference BetweenExpected and Actual
CE RatiosReasons
D1
D2
D3
D4
D1
D2
D3
D4
D1
D2D3 D
4D
1D , D
3D4
1
,..
3
4
5
6
n
Note: For each component also attach separate sheets giving details, also explain the difference among the modalities.
G)
Guidelines for Preparinga Research Proposal
In preparing the country project proposal for the study of cost effectiveness ofdifferent training modalities, the following guidelines will be useful. While preparing theproposal all the items listed should be covered. Other items may be added. The proposalshould provide the following:
1.0 Introduction /Background
1.1 The research problem1.2 Basic assumptions
1.3 Importance of the study1.4 Definition of terms
2.0 The Conceptual Framework
2.1 Selection of modalities
2.2 Review of effectiveness studies
3.0 Design and Methodology
3.1 Population and sample
3.2 Instruments3.3 Procedure
3.4 Data analysis3.5 Format of the report
4.0 Time Frame
4.1 Schedule of activities
5.0 Budget
Needless to say, only a meticulously prepared proposal will lead to a systematicresearch study. Efforts at this stage will go a long way in ensuring the proper coverage ofresearch areas, collection of relevant data, and systematic analysis and conclusions. Ifnecessary, an exploratory study may be conducted before finalizing the proposal. Varioussecondary sources of information, such as project documents, periodic progress reports,administrative reports, and evaluation studies, should provide the necessary backgroundand other relevant information needed for preparing the proposal.
1.0 Introduction/Badcground
The introduction should cover the following:
Guidelines 47
61
Description and discussion of the strategy and approach followed for populationeducation in the country, stating the political, economic, and social rationale behind suchstrategy and approach. (Refer to Chapter Two).
Description of all modalities already in operation in the country, as well as thefollowing details for each modality:
i) objectives and rationale,
ii) year introduced,
iii) various components (discrete tasks and sub-tasks),
iv) organizations and agencies involved,
v) vertical and horizontal linkages, and
vi) management structure (refer to Chapter Five on "Management Considera-tio s ").
(Give flo,, chart for each modality as presented in Chapter Two; for managementstructure chart, refer to Chapter Five).
Description and data on performance in relation to each modality and total (pro-grammewise and yearwise data from the beginning). Performance should be in terms of:
coverage (number of personnel of different categories trained)
supportive activities (instructional and training materials developed and distri-buted)
some measure of effectiveness, if possible (may be based on earlier evaluatiostudies)
Details of total population education expenditure incurred by the country for eachmodality, and the total cost. All items of costs should be covered, such as personnel faci-lities, materials and equipment, trainees' time and inputs. Data should also be classifiedunder the following heads: fixed costs and variable costs; tangible and intangible costs (referto Chapter Three). Information on source of funds (own funds, outside funding) shouldbe given.
Drawing from the above,
1.1 Define the research problem of the study.
1.2 Describe the basic assumptions underlying the important issues raised whiledefining the research problem.
1.3 Discuss the importance of and justification for the study.
1.4 Define the various terms to be used in the study.
Based on the justification, give the specific objectives of the proposed study. Sincethe study will be diagnostic and remedial, tiscuss how the study will be useful in the identi-fication of the reasons behind the problems and. how the findings will be used for remedialpurposes.
It should be noted that the research study itself will be evaluated at ite end, based onthe objectives cited in tile study proposal.
2.0 Conceptual and Theoretical Framework
2.1 Selection of modalities: If funds permit, all modalities used in the countryshould be covered under this study. Otherwise, select a few giving some justi-fication for each selected modality.
48 Manual on cost effectiveness
62
The justification can be based on the following.
(1) degree of effectiveness: those which seem to be more effective vs. those whichseem to be less effective.
coverage: those which seem to be covering a large number of teachers vs. thosewhich seem to cover a small number of teachers.
(iii) amount spent: those for which the expenditure is high vs. those for which it isless.
These three factors and dichotomies can be combined in eight ways.
Assumed Degree 1....' Effectiveness
High LowAmount Spent Amount Spent
High Low High Low
CoverageHigh
Low(1)
(5)
(2)
(6)(3)
(7)
(4)
(8)
Give brief description of selected modalities. (These modalities are covered undersection 2.1 above, Only additional informatior to be provided here).
2.2 Review effectiveness studies in population education undertaken so far.
3.0 Design and Methodology
3.1 Population and sample
3.1.1 Locale: Give a brief profile of the region, covering the following items:
death rate, infant mortaty, migration, fa.aily size, and so on.economic condition: rural/urban areas, class classification, number of
people below poverty line, employment opportunities, and soon.
health: facilities, common diseases and sickness people suffer from,number of doctors, midwives, nurses, and so on.
family planning: facilities, control measures taken and results (number ofoperations) (V & B), use of contraceptives, IUD, and so on.
education: literacy rate (male/female) location of primary, secondary,college education facilities, number of school teachers andstudents, drop-out rate, male-female ratio for teachers andstudents, non-formal education programmcs and their co-verage, government education administrative system, use ofmass media, and so on.
development programmes: government-sponsored and those run byvoluntary agencies and others.
3.1.2 Discuss in detail the "population" to be covered under the study.3.1.3 Sample design: Give details explaining the sample design selected for thestudy (refer to Chapter Three).
Guidelines 49
' 63
3.2 Instruments: Give details of instruments to be used for the data collectic-(refer to Chapter Four).
3.3 Procedure
3.3.1 Approach: This study can be used as a training ground for the personnelinvolved in the programme. However, outside experts should also be in-volved in the conduct of the study. Describe the personnel to be involvedin the study (which category of personnel and how they will be involved)and the role mid qualification of outside experts.
3.3.2 Management of the study
Agency and officer responsible for conducting the study
Allocation of work to different agencies/units/organizations
Co-ordination of work
Process of conducting the study (that is, meetings, visits by the managerof the team, and so on).
3.4 Data analysis: Give details about the data analysis framework and the statis-tical methods to be used.
3.5 Format of the report: Give chapter scheme, providing a brief description ofthe content of each chapter.
4.0 Time frame: indicate how much time will be required to complete the study. (Asfar as possible, the study should be completed wit1iin a year).
i.1 Schedule of operations: Describe detailed work plan and monitoring that willbe followed, concurrent with evaluation system.
5.0 Budget
5.1 Give detailed break down of costs: personnel, materials, travel, secretarialassistance, data analyr's cost, including computer use cost, report preparation,publication, and so on.
5.2 Give sources of funs from which the cost of stud,, will be met.
50 Manual on cost effectiveness
64
41i I'd) I i N
Sample Research Proposal andPrototype Instruments
This chapter illustrates the use of the guidelines in Chapter Six. It applies the con-cepts developed in Chapter Three on evaluation design and instrumentation.
The chapter consists of two parts. The first part is a proposal for a cost effectivenessstudy of training modalities; the second part presents sample instruments for use in theresearch.
A. Research Proposal: A Cost-Effectiveness Study of Three Training Modalitiesin Population Education
1.0 Introduction
Population education programmes as carried out in countries in the Asian regionhave some built in form of evaluation to determine the effects of projects in the ; rogrammeor of the programme itself. However, few countries have integrated a c ,st analysis in theevaluation.
The training of large numbers of population education teachers entails huge expendi-tures. A number of modalities for training been tried out, with no serious considera-tion given to the costs of implementing them. In the face of increasing financial constraints,costs can no longer be ignored. Funds ',lid logistical support from sponsors and donors aredwindling. Therefore, decisions on how funds are to be spent should be more carefullystudied and empirically based. Decision makers will have to confront such questions as"Are the modalities equally effective? How do the modalities compare in cost? Whichmodality entails the least cost for the best effects?" These questions imply a cost effective-ness analysis.
1.1 The Research Problem
This study aims to evaluate three commonly used training modalities in populationeducation in country K, in terms of their effectiveness and U. cost of using them.
The three training modalities to be evaluated for effectiveness are: (i) mobile train-ing, (ii) modular, that is, use of print and audio-materials, and (iii) institute-based seminars.
Specifically, the study aims to answer these questions:
1) How do the three training modalities compare in improving the trainees' know-ledge of population concepts?
2) Which training modality resuacs in more favourable attitude change in thetrainees?
Sample research proposals 51
65
3) What are the effects of the three training modalities on the trainees?
3.1 Behaviour iLient/tendercy?
3.2 Skills in teaching population education concepts?
4) What costs are incurred through each modality?
5) Which training modality is the least expensivt on a per trainee basis?
6) Which training modality is the most cost effective?
7) Which training modality i3 Lhe most effective in terms of:
7.1 Breadth of coverage?
7.2 Intensity of effectiveness?
7.3 Efficiency?
1.2 Basic Assumptions
In this study it is assumed that:
1) All the three training modalities have the same objectives.
2) For all the three modalities, the same instruments of evaluation can be used.
3) Costs for capital outlay, like buildings and infrastructures, need not be includedin the costing of the training modalities, unless funds are specifically ea markedfor these and are tangible.
4) Measures of knowledge, attitude and behaviour intent are continuous interval
scale variables.
1.3 Importance of the Study
The research is expected to yield empirical data on the relative costs of using dif-ferent training modalities and approaches, to guide decision makers, programme planners,
and policy makers on the choice of modalities for maximum effects.
The study is also envision ?.d to provide insights on how population education con-cepts can be best learned, as well as to help diagnose the weaknesses of some training pro-grammes. Knowing the weakness of individual programmes will facilitate the introductionof remedial measures and the modification of a programme to increase its effectiveness.
1.4 Definition of Terms
Effectiveness refers to the extent at which the objectives of a programme, project, orintervention are attained.
Indicator of effectiveness refers to a measure by which to ascertain whether theobjectives have been attained.
Effects refer to the .-,u'comes or results of an intervention or treatment.
Cost, in this study, refers to the value of all the resources and ingredients needed tocarry out a training modality.
Cost efj"?cti7ieness is the ratio of cost or the expense in carrying out a project (in thiscase, a training modality) to its outcome or effectiveness. The ratio is obtained by dividingthe cost per trainee by the measure of effectiveness.
Training modality is a general approach and strategy of designing and sequencingtraining inputs to produce the desired effectiveness. It may use more than one method orinstrument of training.
52 Manual on cost effectiveness
66
Efficiency is the ratio of output to input.
Cost efficiency is the ratio of cost to the number of persons trained.
2. The Conceptual Framework
The main independent variable in this study is the training modality. The dependentvariables are:
(1) Effectiveness as measured by knowledge gain, attitude change, and effects onbehaviour and teaching skills, and
(2) Cost of carrying out the training.
This is illustrated in the following research paradigm:
The paradigm indicates that the training modality leads to the indicated outcomes,which are associated with certain costs and efficiency.
3. Design and Methodology
This study will use the multiple group pre-test post-tes . design in evaluating theeffectiveness of the three training modalities. The design is represented as follows:
01b X1 °laX2 °2a
03b X3 03a
Where Obs are measures obtained before the training
Oas are measures obtained after the training
Xs are the three training modalities
This design will be used for measuring effectiveness as indicated by
1) Knowledge gain, and
2) Attitude change.
An alternative design is the multiple group post-test only design. It is representedas follows:
Xi 01X2 02X3 03
Here the Xs and Os represent training modalities and post-test measures, respectively.
Sample research proposals 53
67
This design is used to determine the effectiveness of the modalities in terms of in-dicators of behavioural intent or tendency.
In case of a follow-up of the trained teachers, and an observation study of their skillin teaching population education concepts, say six months after the training, the multiplegroup, immediate and delayed post-test design will be used. In symbols, the design is:
Training Modality Immediate Post test Delayed Post-test
X1 °11 012X2 021 022X3 031 032
3.1 Population and Sample
The sample population consists of teachers to be trained in population educationthrough any of these modalities: (a) seminars conducted by a college or institute of educa-tion, (b) mobile training team, and (c) modular training through print modules and audiotapes.
The sampl.e will consist of:
a) Two batches of 25 to 30 teachers trained through nodality A.
b) 50 teachers trained through modality B.
c) 30 teachers trained through modality C.
Since the training batches will (-vac at specific times and the mobile training will becarried out within a pre-set schedule, the teachers cannot be selected through randomsampling.
3.2 Instruments
Four instruments will be used, corresponding to the research questions on (a) know-ledge gain, (b) attitude change, (c) behavioural intent or tendency, and (d) teaching skills.The instruments are as follows:
1) A knowledge test consisting of 40 items of the multiple choice type, with fourresponse options per item, will be used. The trainees' total score on this test is
a measure of his knowledge of population concepts.
The test will be administered before the start and at the end of the training. Thedifference between the post-training and pre-training scores is the measure of gain in know-ledge.
2) An attitude scale consisting of 20 Likert-type items will be used to measuretrainee attitude toward population themes and messages. The respondent isinstructed to register his agreement or disagreement with each statement. Eachresponse has a weight on scale of 1 to 5. The respondent's total score reflectshis attitude. The higher the score, the more favourable the attitude. The 20-item scale will yield a minimum score of 20 and a maximum score of 100.
3) The instrument to measure behaviour intent or behaviour tendency is a situa-tion test. It consists of 10 situations. each posing a problem and asking therespondent to identity which of the behaviours described he or she will mostlikely do in a particular situatica. Each response option nas a weighted score.The total score from the 10 items is an index of the respondents' behaviourintent/tendency. The higher the score, the better the behaviour intent index.
54 Manual on cost effectiveness
63
4) A teacher performance scale will be to rate the trainee's tea 'sing skills.This is an observation rating scale to be filled out by an observer . watchesa teacher actually teaching. The teacher is rated on a 5-point scale, to mea-sure ten teaching skills. The higher the total score, the better is the teacher'steaching performance. The minimum and maximum stores 10 and 50,respectively.
All these four instruments are illu- rated through sample items in the latter part ofthis chapter.
3.3 Procedure
The knowledge test and the attitude scale will be administered before and after thetraining, to each training modality group. The behaviour intent scale and the teacher per-formance scale will be administel ed after the training. The teacher performance scale willbe used again six months after the training, in a follow-up of the teaches trainees.
3.4 Data ArAyses
Mean pre-Lest and post-test scores and standard deviations of the scores on each ofthe instruments will be computed. Appropriate statistical tests will be used to r-,mpare theeffectiveness measures of the groups trained by the three modalities.
The costs of conducting training by each modality will be computed, based on thefollowing main ingredients: personnel, facilities, equipment, other programme inputs andclient inp .ts.
The cost per trainee under each modality will be computed. This cost will then becompared to each effectiveness index. The ratio of cost per trainee to the effectivenessindex is the cost effectiveness measure.
The cost effectiveness ratios of the three training modalities will then be compared.The modality with the lowest cost effectiveness ratio is the most cost effective for a giveneffectiveness index.
The ..;ficiency of each training modality will be computed by eutaining the ratio ofthe effectiveness to the inputs.
Effectiveness in terms of coverage is obtained by dividing the number of teachersactually trained by the targeted number to be trained.
The interr' Ls, index of effectiveness of each modality is the ratio of the number cfteach.:r.. trained who meet a criterion level of performance, to the total number of teacherstrained.
Tables similar to ti.ose in Chapter Four will be set up for the cost effectivenessanalysis.
4. Time frame: This research is estimated to take at least one year from the date of ap-proval of the proposal.
4.1 Schedule of Activities: This is shown in the Gantt Chart on the next page.
Sample research proposals 55
69
Gantt Chart for Schedule of Activities
IP III 11111111111111111
MEE
5. Budget
Line-Item Budget for One Year of Research
Personal Services $14,750
Project Director's honorarium $3,000Research Associate 2,250Two (2) Research Assistants 3,900Clerk Typist 1,000Utility man/aide 750Honoraria for two (2) consultants 415
per consultation for 2 x 20 consultations 600Travel and per diem 3,000Honoraria and incentives for co-operators/
informants 2" 0
Training $ 750
Equipment 1,500
Expendables: materials, paper etc. $1,000Non-expendables: furniture, etc. 500
Miscellaneous 1,400
Computerization of data 750Printing of report 250Sundry: postage, communication, etc. .t00
Sub-total $18,400.00
Contingency 10% 1,840.00
GRAND TOTAL $20,240.00
56 Manual on cost ef. 'ivenels
70
B. Prototype Instruments*
1. Knowledge Test
Instruction: Check ( V ) the space before the correct answer.
Concept I: Small family size andfamily welfare.
1. The immediate goal of population education is to:
(a) stress family planning as a means of regulating fertility be-haviour
(b) sl. N down populations growth(c) provide background information for rational and responsible
behaviour concerning population related matters(d) adopt a two-child family norm
2. Which phrase does not describe famity planning?
(a) limiting the number of children(b) a wa) of ensuring a high quality of life for the family(c) disallowing unwanted children(d) regulating and spacing the birth of children
3. Which of these refers to she biological capacity of a women to reproduce?
(a) fertility
(b) fecundity(c) heredity(d) morbidity
4. A good quality of life may be attained by
(a) small family size, high income(b) large family size, high income(c) small family size, low income(d) large family size, low income
5. Which of the following phrases defines the concept of "complet-d family size"?(a) the total number of living children born to a woman during her
reproductive period(b) the total number of children born to a woman, including stillbirths
(c) the total number of members in the nuclear family father,mother and children
(d) the number of children ever born to a womaii, including thosewho died after birth
6. Spacing of births results in
(a) proper nutrition of mother and child(b) lower infant mortality rate(c) reduced incidence of defective children(d) all of the above
The answer key is presented at the end of the chapter
71
Sample research proposals 57
7. Which of the following gives the best meaning of "quality of life" in the popu-lation education context?
(a) having the basic necessities and the important aids to modernliving
(b) enjoying life that is free from the cares of looking after toomany children
(c) seeing that children are given all that they desire
(d) being able to lead a healthy, comfortable and cultured life
8. Who are the most Featly affected in terms of decreased mortality when im-
proved health services are introduced to a country?
(a) old people
(b) infants
(c) young adults
(d) school-aged population
Concept II: Delayed Marriage
1. Which of these would most likely result from delayed marriage?
(a) ill health to the mother-to-be
(b) fewer children being born
(c) better income for the family
(d) more defective children
2. As a general rile, a delayed marriage is likely to result in
(a) higher fertility
(b) higher sex impulse
(c) lower fertility
(d) lower sex impulse
Concept III: Responsible Parenthood
1. What does "responsible parenthood" mean?
(a) complete control of all the activities of the family
(b) achieving a high quality of life for all members of the family
(c) allowing maximum freedom to all members of the family
(d) having enough money to meet the food needs of all membersof the family
2. "A woman is capable of conceiving a child for about one week each month"
(a) The statement is true
(b) The statement is false
(c) The statement is half true
(d) The statement is incomplete
58 Manual on cost effectiveness
2
3. Sex education is the concern of
..._ (a) the home
(b) the school
(c) both (a) and (b)(d) neither (a) nor (b)
Conce t IV: Population and Other Development Concerns
1. Which group of factors must be known to estimate the populatio.1 of a fewyears hence?
(a) birth rate, family size, death rate(b) birth rate, death rate, migration rate(c) birth rate, infant mortality rate, death rate(d) birth rate, family size, infant mortality
2. The difference between the birth rate and the death rate is called the rate of(a) growth
(b) fertility(c) natural increase
(d) population growth3. To compute the growth rate of the population of a country, person must know
the natural increase and
(a) migration rate of the r.ationals(b) migration rate of the foreigners(c) net migration rate;d) number of country home visits during the year
4. Which of the following groups of demographic factors is indicative of a devel-oped country?
(a) high birth rate, high death rate, low infant mortality rate(b) high birth rate, low death rate, low infant mortality rate(c) low birth rate, low death rate, low infant mortality rate(d) low birth rate, high death rate, high infant mortality rate
5. Which of the following shapes of the population pyramid represent that of acountry whi, has been a developed country for a number of years?
A [\ s(z(a) (b) (c) (d)
6. Which is the set of consequences of rapid population growth?
(a) arable land scarcity, industrialization, overcrowding of schools.(b) arable land scarcity, unemployment, overcrowding of schools.(c) unemployment, overcrowding of schools, industrializ&on.(d) industrialization, high school drop-out rate, high mortality rate.
Sample research proposals 59
'73
7. country has a high ..lependency group if it has a big population of people.
(a) under 15 years of age
(b) 65 years of age and over
(c) between 45 and 65 years of age
(d) both under 15 years of age and 65 years of age and above
8. Which factor does not affect population distribution?
(a) physical or natural factors
(b) cultural factors
(c) demographic factors
(d) biological factors
Concept V: Population Beliefs and Values
1. How does breastfeeding affect fertility?
(a) it improves the health of the mother.
(b) it delays ovulation.
(c) it prevents conception.
(d) it decreases sex impulse.
2. In countries where sex education has been taught, we are likely to see
(a) fewer abortions
(b) more sexual promiscuity
(c) more incidence of sex violence
(d) reduced birth rate
3. In countries where sex equality is promoted, one is likely to find
(a) more family planning practices
(b) more divorces
(c) problems of homosexuality
(d) none of the above
4. In the present age, the main basis of economic progress is
(a) advanced technology
(b) more natural resources
(c) nr.mber of population
(d) strong leadership
Concept VI: Urbanization and Migration
1. Where will sex violence and ..bortion likely to occur?
(a) in the heavily popt.lated areas in the city
(b) in the rural areas
(c) in the industrialized parts of the country
(d) among the working class
60 Manual on cost effectiveness
74
2. A head count of the population that is taken periodically is called a
(a) poll
(b) census
(c) registration
(d) demographic survey
3. Overcrowded areas in the city, often referred to as "slums", are caused by
(a) lack of space in the city(b) low rent in the slums
(c) afety in city life
(d) heavy inflow of migrants from the rural areas
4. Which of these will likely be the most effective measure for reducing overcrow-ding in the city?
(a) building more houses in the suburbs(b) putting more efforts on rural development and encot, ig a
small family size
(c) fast industrialization of the city(d) all of the above
Concept VII: Problems of Adolescence
1. Drug addiction incidents are likely to occur among youth
(a) with very nigh ambitions
(b) from migrant families
(c) from broken families
(d) in rural arias
2. The real sign that a girl is becoming a woman is the
(a) development of the breasts(b) growth of pubic hair
(c) onset of menstruation
(d) widening of the hips
3. "Wet dreams" are due to the discharie of excess semen in a boy's sex organ.This is referred to as
(a) circumcision
(b) nocturnal emission
(c) transmission
(d) castration
4. A basic knowledge of the human reproductive process helps one unde.stand
(a) man's full development
(b) sexual impulse
(c) avoidance of pregnancy(d) man's social nature
Sample research proposals 61
755
5. Sexual intercourse during ovulat'on
(a) causes menstrual flow
(b) may result in pregnancy
(c) prevents pregnancy
(d) is not medically advisable
Concept VIII: Aging
1. The number of old people is likely to be -eater in
(a) a developed country
(b) a developing country
(c) an underdeveloped country
(d) both (a) and (c)
2. Generally, women as compared to men have
(a) longer lives
(b) shorter lives
(c) mare income
(d) better jobs
3. Old people usually cling to their old beliefs and become resistant to change,especially when it comes to health care and services. This results in in-
cidence of discases and mortality
(a) low low
(b) low high
(c) high high
(d) high low
Concept IX: Sex Equality
1. In relation to men, women are
(a) subordinate to men if they are younger
(b) superior to men if they are older
(c) equal to men if they are of the same age
(d) equal to men regardless of age
62 Manual on cost effectiveness
'76
2. Attitude scale
Samples rating scale to measure attitudes towardspopulation education
Instruction
Circle the letter that matches the extent of your agreement or disagreement witheach of the folio ing statements. The letters have these meanings:
SA strongly agreeA agree
U undecidedD disagree
SD strongly disagree
Concept: Small family size
1. Married couples should be free tohave as many children as theyde -ire.
2. Having a large famil, (more thanfour children) is a gou.1 economicinsurance for old age.
3. A large family is a happy family.4. The more children a farm family
has, the higher will be its per capitaproduction.
Concept: Age at marriage
1. The ideal age at marriage for womenshould be at least 25 years old.
2. To avoid having more children,early marriage should be discour-aged.
SA = 1 A = 2
Concept: Sex-related values
U = 3
1. Sex education is one of the solutionsto rapid population growth in thecountry.
2. Sex education tends to encouragepre-marital sex relationships.
Concept: Equality of the sexes
1. Women shouli be encouraged towork as much as men outside thehome.
2. The first child in the family mustbe male.
77
,.,
/
I f
II
....... s
A'
s.
D = 4 SD = 5
4
1.
4,
di
Sample research proposals 63
3. Women should have equal rights asmen in decision making.
4. If the family can efford to send onlyone child to school, that child must:).e a boy.
5. Women doctors are not as good asmen doctors.
Concept: Respect for the aged
1. The welfare of the old people is aresponsibility of the government.
2, It is th, responsi' ility of everymember of the family to look afterits elders.
Concept: Emerging roles of women
1. Women should go to the battle fieldto defend their country.
2. Women should help their husban,Isto earn a living.
3. A Behaviour-Intent Scale
Instruction: Mark ( ) the option that you think is correct.
Concept: Population Education Programme
1. If you are requested to give a lecture on population education at a local school,
what will be your reaction-
(a) Ignore the invitation because the topic is not appropriate.
(b) Accept the invitation but talk on other subjects nore appro-priate to children.
(c) f xept t''e invitation and talk on the subject in detail.
(d) Ask for more time to decide.
2. You are a member of a teachers' union. You are requested to provide a lecture
on the role of teachers in implementing the population programme. Whichmessage will you er 'iasize in the lecture?
(a) Teat rs have a responsibility to implement the populationeducation provamme.
(b) Teachers should ignore the population programme because theproblem is not of their creation.
(c) Teachers should attempt to study more about me populationeducation programme.
(d) Teachers should oppose the programme.
64 Manual on cost effectiveness
78
Concept: Age at marriage
3. You are asked by the members of Parliament to come to the naticaal legislatureto advise them on the age at marriage. What will you suggest to Parliament?
(a) Decrease the age at marriage for both male and female.(b) Increase the age at mar.iage for both male and female.(c) Keep the present age law but suggest counselling for would-be
couples.
(d) Present no definite opinion.
Concept: Equality of the sexes
4. You have two children -- a son and a daugh+er. The government has providedyou a seat in a prest4ens college and you are allowed to send either your sonor daughter, both of whom have just completed high school. How will youbehave?
(a) Enroll your son.
(b) Enroll your daughter.
(c) Enroll whoever gets the higher score in the entrance exam.(d) Enroll whoever is elder.
Concept: Small family size and family welfare
5. Mr. and Mrs. Cruz have been married six years and have two daughters. Theyget different advice from relatives and friends:
(a "Keep trying to have children until you get a son."(b) "Be content with your two daughters. They are as good as sons."(c) "Try for anotl _ child but stop at three children."(d) "Leave everything to Providence or God's Will."
If you were in Mr. and Mrs. Cruz .. ,,lace, which advice are you likely to follow?
Concept: Aging
6. You've been living with your aging father for the past ten years. Your familyfeels that they should live separately from your father. What wmld you do?
(a) Put him in a separate house and visit him regularly.(b) Ask other relatives to take in.(c) Continue to live with him with due respect and care.(d) Continue to live with him but without caring for him.
Concept: Family planning
7. In the presence of your wife, your friend asks you about the various contracep-tive methods. How will you respond to this querry?
(a) Explain everything in detail to him.(b) Explain everything to him but only after your wife has left.(c) Do not answer him.(d) Direct him to a family planning worker or clinic.
Sample research proposals 65
79
4. A Scale for Rating Teaching Skills
Rating scale for teaching skills in population education.
Teacher: ....._ Rater
Plea 3e rate the performance of the teacher on the following teaching skills by check-ing (N,/ ) the appropriate column.
Skills Excel-lent
Verygood
Good Poor Verypoor
1. Writing lesson plans
2. Citing relevant examples toillustrate concepts
3. Presenting population conceptsclearly
4. Integrating population educa-tion concepts
5. Using appropriate visual aids,(charts, boardworks, flash cards,etc.)
6. Preparing visual aids (charts,boardworks, flash cards, etc.)
7. Constructing test items
Answer and Scoring Key
1. Knowledge Test
Concept I Small family size and family welfare
1) c2) c3) b4) a5) a6) d7) d8) b
Concept II Delayed marriage
1) b2) c
Concept III Responsible parenthood
1) b2) b3) c
66 Manual on cost effectiveness
0'
Concept IV Population and other development concerns
1) b2) c3) c4) c
5) b6) b7) d8) d
Concept V Population beliefs and values
1) b2) d3) a4) a
Concept VI Urbanization and migration
1) a2) b3) d4) b
Concept VII Problems of adolescence
1) c2) c3) b4) c5) b
Concept VIII Aging
1) a2) a3) c
Concept IX Sex equality
1) d
2. Attitude Scales
The scoring is:
SA = 5A = 4U = 3D = 2
SD = 1
In items marked with an asterisk (*), the scoring is reversed, i,e.