DOCUMENT RESUME ED 308 283 CE 052 519 AUTHOR ;rice, M. Gayle TITLE An Evaluation of the Expanded Food and Nutrition Education Program in Kansas. PUB DATE May 89 NOTE 48p.; Master's thesis, Pittsburg State University. PUB TYPE Dissertations/Theses - Master Theses (042) -- Reports - Evaluative/Feasibility (142) EDRS PRICE MF01/PCO2 Plus Postage. DESCRIPTORS Adult Education; *Eating Habits; Extension Education; Federal Programs; Hunger; *Nutrition; *Nutrition Instruction; Poverty; *Program Effectiveness; Program Evaluation; *Program Validation IDENTIFIERS *Food Consumption; Kansas ABSTRACT A study of the Kansas Cooperative Extension's Expanded Food and Nutrition Education Program (EFNEP) was intended to determine the effectiveness of instruction provided by this federally funded program. The program endeavors to benefit low income families by improving participants' food and nutrition practices, behaviors, and food consumption patterns. Only 5.5 percent of the 115 subjects (selected by proportional random sampling and typical of EFNEP participants nationwide) ate the recommended number of servings from the four basic food groups before receiving the instruction, but 22.1 percent of them did so after the instruction. Participants' scores improved an average of 12.2 percent in desirable food and nutrition practices and behaviors after instruction. The 12 lessons of instruction were provided by nutritional assistants, who used one-to-one or small group techniques. The following recommendations were made: (1) repeat the study, using a control group and striving for increased consistency with which data are collected and (2) study the influence of educational level on homemakers' ability to improve as a result of participation in EFNEP. (The document includes a 10-item bibliography and data collection instruments called the Expanded Food and Nutrition Education Program Family Record; the Homemaker Food Consumption 24-Hour Food Recall; and the Food and Nutrition Practice Checklist.) (CML) *********************************************************************** Reproductions supplied by EDRS are the best that can be made from the original document. ***********************************************************************
Transcript
DOCUMENT RESUME
ED 308 283 CE 052 519
AUTHOR ;rice, M. GayleTITLE An Evaluation of the Expanded Food and Nutrition
Education Program in Kansas.PUB DATE May 89NOTE 48p.; Master's thesis, Pittsburg State University.PUB TYPE Dissertations/Theses - Master Theses (042) -- Reports
ABSTRACTA study of the Kansas Cooperative Extension's
Expanded Food and Nutrition Education Program (EFNEP) was intended todetermine the effectiveness of instruction provided by this federallyfunded program. The program endeavors to benefit low income familiesby improving participants' food and nutrition practices, behaviors,and food consumption patterns. Only 5.5 percent of the 115 subjects(selected by proportional random sampling and typical of EFNEPparticipants nationwide) ate the recommended number of servings fromthe four basic food groups before receiving the instruction, but 22.1percent of them did so after the instruction. Participants' scoresimproved an average of 12.2 percent in desirable food and nutritionpractices and behaviors after instruction. The 12 lessons ofinstruction were provided by nutritional assistants, who usedone-to-one or small group techniques. The following recommendationswere made: (1) repeat the study, using a control group and strivingfor increased consistency with which data are collected and (2) studythe influence of educational level on homemakers' ability to improveas a result of participation in EFNEP. (The document includes a10-item bibliography and data collection instruments called theExpanded Food and Nutrition Education Program Family Record; theHomemaker Food Consumption 24-Hour Food Recall; and the Food andNutrition Practice Checklist.) (CML)
***********************************************************************Reproductions supplied by EDRS are the best that can be made
from the original document.***********************************************************************
AN EVALUATION OF THE EXPANDED FOOD
AND NUTRITION EDUCATION PROGRAM IN KANSAS
A Thesis Submitted to the Graduate School In Partial
Fuilfiliment of the Requirements for the
Degree of Master of Science
By
M. Gayle Price
PITTSBURG STATE UNIVERSITY
Pittsburg, Kansas
May 1989
U.S, DEPARTMENT OF EDUCATIONOffice of ducational Research and Improvement
EDU TIONAL RESOURCESERIC)INFORMATION
CENTE
his document has been reproduced asreceived from the pertiOn Of Organizationonginating d
C Minor changes have been made to improvereproduction quality
Points of view or opinionSetatedrIthiSdOcumen( do not necessarily represent officialOERI position or policy
"PEP .MISSION TO REPRODUCE THISMATERIAL HAS BEEN GRANTED BY
f
TO THE EDUCATIONAL RESOURCES
INFORMATION CENTER (ERIC"
BEST COPY AVAILABLE
APPROVED:
Thesis Adviser
Committee Member
Committee Member
( , ir3
ACKNOWLEDGEMENTS
The researcher would like to recogniz3 her advisor, Dr. Frank
Slapar, Department of Technical Education, Pittsburg State University,
for his encouragement, willingness to give of his time, and guidance in
writing this thesis. Extended to him is a sincere, thank you.
The researcher would like to express appreciation to: Mrs. Sue
Hippensteel and Dr. Jesse Hudson, who served on the thesis committee,
for their help and expertise.
Sincere appreciation and love is expressed to the researcher's
husband, Dave, whose love, encouragement, understanding, and patience
were essential to the successful completion of this thesis.
Finally the researcher wishes to dedicate this thesis to her
parents, Mr. and Mrs. Loyd Elbrader, without their guidance,
encouragement, support and unconditional love, the researcher would not
have achieved her educational goals.
J. i
r r, " A: . L.,
A
TABLE OF CONTENTS
CHAPTER
I. INTRODUCTION
PAGE
1
Statement of the Problem 2
Delimitations 3
Limitations 3
Definition of Terms 4
Significance of the Study 5
II. REVIEW OF LITERATURE 6
History and Development 6
Paraprofessionals 9
24-Hour Recall Method 9
EFNEP Recommendations andConsiderations 10
Similar Evaluation Studies 11
Kansas EFNEP 11
III. OVERVIEW 14
Sampling ProcedureMeasuring InstrumentsAnalysis of Data
IV. RESULTS
Food Consumption DataNutrition Behavior Data
V. SUMMARY
APPENDICES
ConclusionsRecommendations
15
16
17
18
23
26
27
27
28
29
Appendix A. - Family Record 30Appendix B. - 24-Hour Recall 31
Appendix C. - Food and Nutrition PracticeChecklist 32
Appendix D. - Kansas EFNEP Programs 34Appendix E. - Income Guidelines 35
Appendix F. - Synectics Scoring Methodfor 24-Hour Recall 36
Appendix G. - Score Sheet 37
Appendix H. - Eating Right is Basic to AdultCurriculum 39
BIBLIOGRAPHY 41
iii
0
ABSTRACT TO THESIS
Kansas' Cooperative Extension's Expanded Food and Nutrition
Education Program (EFNEP) is a federally funded nutrition education
program to benefit low-income families. This evaluation was done to
document the effectiveness of the program in Kansas.
This evaluation of Kansas EFNEP used 115 EFNEP homemakers which
were selected by proportional random sampling procedures. Homemakers
received nutrition instruction. Pre-evaluation and post-evaluation data
from nutrition practices ckecklist and food intake records were
compared.
A Kansas EFNEP Homemaker Demographic Characteristic Profile was
determined and found to be typical of EFNEP homemakers nation-wide.
Results from the evaluation provide documentation that food and
nutrition practices, behaviors and food consumption patterns are
improved from pre-evaluation to post-evaluation due, in part, to EFNEP.
iv
LIST OF TABLES
TABLE
I. Number of EFNEP Subjects from each County usedin the Evaluation
II. Selected Demographic Data Mean on EFNEP Homemakersand State
III. Percentage of EFNEP Homemakers Receiving FoodStamps by County and State
PAGE
15
18
19
IV. Percentage of EFNEP Homemakers Participatingin WIC Program 19
V. Percentage of EFNEP Homemakers with Children in ChildNutrition Programs
VI. Percentage Distribution of EFNEP Homemakers
VII. Percentage of EFNEP Homemakers Attaining VariousLevels of Education by County and State
VIII. Ethnic Background of EFNE7 Homemakers in Kansas
IX. Pre- and Post-Evaluation Means and Ideal Scoreson the 24-Hour Food Recall (Appendix B) for KansasEFNEP Homemakers by County and State
X. Pre- and Post-Evaluation Percentages of EFNEP Homemakerswith 1-1-1-1 or 2-2-4-4 Food Intake Pattern byCounty and State
XI. Pre- and Post-Evaluation Means and Percent Improvementfor EFNEP Homemakers on Food and Nutrition Checklist(Appendix C) by County and State
v
7
20
20
21
22
23
25
26
CHAPTER I
INTRODUCTION
The Kansas Cooperative Extension's Expanded Foods and Nutrition
Education Program (EFNEP) is a federally funded nutrition education
program that is designed to aid low-income families. The purpose of the
EFNEP, as federally mandated, is to assist hard-to-reach low-income
families, concentrating on those with young children, to improve their
diets by teaching them basic nutrition principles.
In rovember 1968, the United States Department of Agriculture
(USDA) initiated the EFNEP which began operation in early 1969. The
EFNEP was to function within the present framework of the Federal,
State, and County Extension Service.
The Expanded Foods and Nutrition Education Program polici's of
October 1983, stated:
The objectives of the Expanded Food and NutritionEducation Program are to assist low-income familiesand youth acquiring the knowledge, skills, attitudesand changed behaviors necessary for nutritionallysound diets and to contribute to their personaldevelopment and the improvement of total familydiet and nutritional welfare (1).
Participation in the Expanded Food and Nutrition Education Program
should result in:
*Improved diets and nutritional welfare for the total family.*Increased knowledge of the essentials of humannutrition.
*Increased ability to select and buy foods thatsatisfy nutritional needs.*Improved practices in food production, preparation,storage, safety, and sanitation.* Increased ability to manage food budgets andrelated resources such as Food Stamps (1).
Nutrition Assistant (NA) or Paraprofessional - Iridividuals trained byprofessional Home Economist to teach in EFNEP.
Low-Income - Income level at or below 125% of poverty level; at orbelow $14,563 annually for a family of four.
Kansas EFNEP Counties - The four counties in Kansas that operate anEFNEP (1988). Those counties were: Crawford, Sedgwick,Shawnee, and Wyandotte.
EFNEP Family History Record - Instrument used to gather demographicinformation about EFNEP homemaker. The instrument is used toenroll homemakers in the EFNEP.
Food and Nutrition Practice Checklist/Behavior Checklist - Evaluationinstrument to help identify homemaker behaviors and practicesconcerning foods and nutrition.
Homemaker Food Consumption: 24-Hour Food Recall - Evaluation instrumentused to document eating habits. Individual food intake isrecorded for a given 24-hour period.
EFNEP Curriculum - Eating Right Is Basic 2; a competency-basedcurriculum that contains 19 lessons that cover basic nutritionprinciples and concerns.
Referral Agencies/Community Program - Agency or Program designed tomaintain or improve the lives of low-income individuals.
Eating Right Is Basic: Adult Curriculum - ERIC 2 - "Competency Based"nutrition education curriculum designed by Michigan StateUniversity Cooperative Extension especially for EFNEP.
5
Significance of the Study
This evaluation was done in order to document the changes in a
homemaker's ability to apply basic nutrition knowledge and improve
dietary practices due to EFNEP.
Budgets are shrinking and more cost effective methods must be found
if EFNEP is to reach those clients with the greatest needs. The program
has the potential for maintaining and/or improving people's health
through better diets and for maximizing resources through knowledgeable
food purchasing (3).
The EFNEP must continue to operate efficiently. It must constantly
provide documentation of its effect on the improvement of human lives;
or face the reality of funding cut-backs or a curtailment of funding in
the future.
Kansas EFNEP has suffered a partial phase out of county programs.
These phase outs were due, in part, to the lack of funding and the
Kansas Cooperative Extension Service's desire to maintain quality
programs. This evaluation should provide documentation ia support of
the existing EFNEP in Kansas.
2
CHAPTER II
REVIEW OF LITERATURE
History and Development
As the Twenty-First Century approaches, the cries of hunger in
America, "the land of plenty", still are heard all too frequently.
Hunger in America has been a concern of many since the Great Depression
of the thirties. The painful cries became even more prevalent in the
early sixties (10). In response to the hunger situation of the sixties,
the USDA, in the Expanded Food and Nutrition Education Program
Historical and Statistical Profile stated:
During th.4 early 1960's evidence was accumulatingabout the appalling living conditions endured bymillions of Americans. Vivid glimpses of poverty andsqualor were constantly shown by the news media. The
attention of concerned Americans turned increasinglytoward the plight of less fortunate Americans. Andone of the most shocking realizations was that, in themidst of a land of plenty, children were going tobed unfed. A country that provided food for millionsof people in other countries had somehow managed tooverlook the hunger of its own citizens (4).
The poor living conditions which haunted the lives of millions of
Americans in the 1960's began to surface; and the government had to
respond. "It became apparent that hunger, malnutrition and starvation
were not confined to any one geographic region. The problem affects
whites and blacks; it appeared in the cities and rural areas" (4). It
was this atmosphere that leo to the creation of the Expanded Food and
Nutrition Educatic Program (EFNE ?).
1
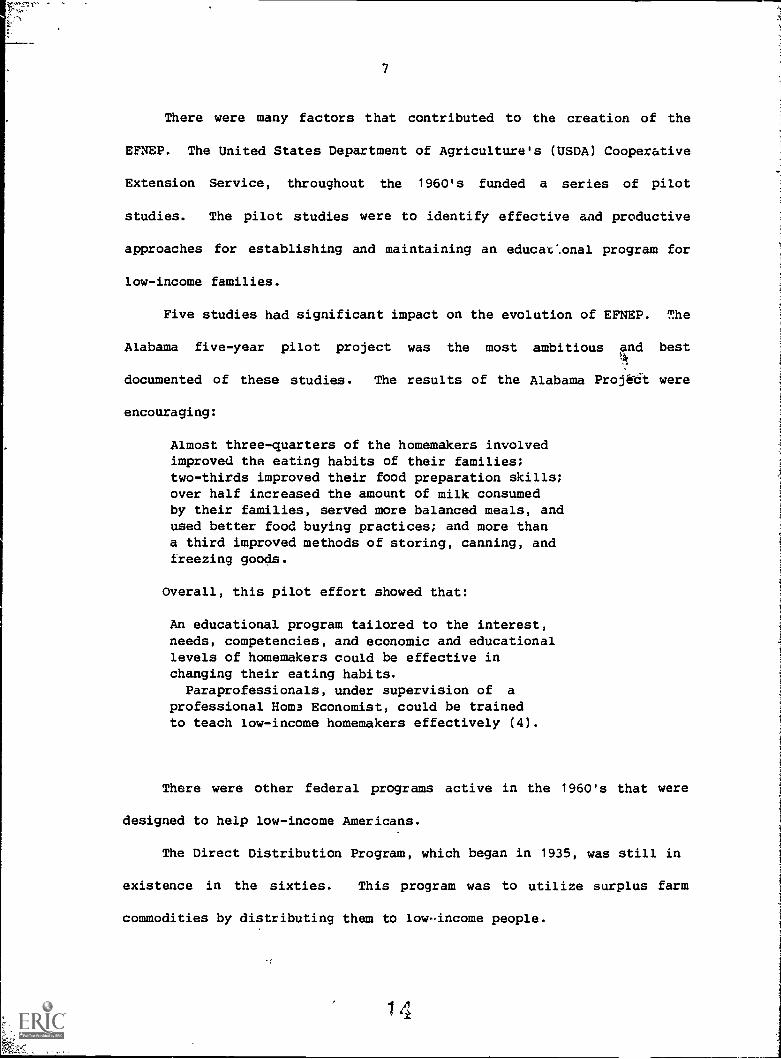
There were many factors that contributed to the creation of the
EFNEP. The United States Department of Agriculture's (USDA) Cooperative
Extension Service, throughout the 1960's funded a series of pilot
studies. The pilot studies were to identify effective and productive
approaches for establishing and maintaining an educational program for
low-income families.
Five studies had significant impact on the evolution of EFNEP. The
Alabama five-year pilot project was the most ambitious ed best
documented of these studies. The results of the Alabama Proj.66t were
encouraging:
Almost three-quarters of the homemakers involvedimproved the eating habits of their families;two-thirds improved their food preparation skills;over half increased the amount of milk consumedby their families, served more balanced meals, andused better food buying practices; and more thana third improved methods of storing, canning, andfreezing goods.
Overall, this pilot effort showed that:
An educational program tailored to the interest,needs, competencies, and economic and educationallevels of homemakers could be effective inchanging their eating habits.
Paraprofessionals, under supervision of a
professional Hom3 Economist, could be trainedto teach low-income homemakers effectively (4).
There were other federal programs active in the 1960's that were
designed to help low-income Americans.
The Direct Distribution Program, which began in 1935, was still in
existence in the sixties. This program was to utilize surplus farm
commodities by distributing them to lowincome people.
14
8
The Food Stamp Program, also, reappeared in the 1960's. The
objective of this program was to provide additional economic resources
to participants which would ir.:rease food buying power and provide a
larger variety in food choice.
Neither of these two programs was designed to change the
participants' behavior or to have a lasting beneficial effect on the
participants' lives.
Since its inception, EFNEP education and instruction has been
guided by the following fundamental principles:
Information must be based on the latest availableresearch, taking into account nutritionknowledge, instruction technology andmethodology for reaching and working with low-income groups. Teaching must be focusedto produce measurablu behavior change inthe target population, and measureweat ofthat behavior change must be an integral partof program activity (4).
In January 1968, the Office of the Secretary of Agriculture
presented a report to the Extension Committee on Policy (ECOP) entitled
the Nutritional Status of Low-Income Families in the United States. The
Cooperative Extension Service (CES) responded to the report by proposing
a comprehensive nutrition education program which would target
low-income families with young children. In November 1968, the
Department of Agriculture provided a ten-million dollar grant from
Section 32 funds of an Act to Amend the Agricultural Adjustment Act of
August 1935 (1). These initial funds provided for multiple program
sites in each state and for employment of Nutrition Assistants in 513
waits. The Nutrition Assistants were to use the one-to-one teaching
method, as well as other methods tested in the initial pilot studies
(4).
15
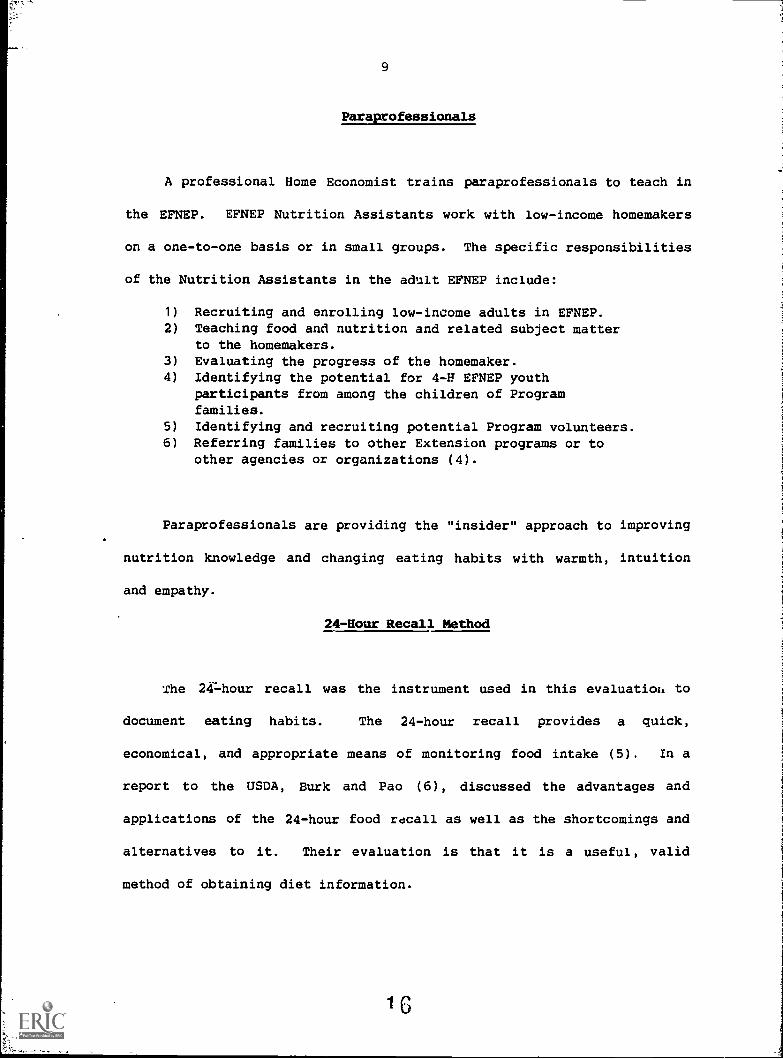
Paraprofessionals
A professional Home Economist trains paraprofessionals to teach in
the EFNEP. EFNEP Nutrition Assistants work with low-income homemakers
on a one-to-one basis or in small groups. The specific responsibilities
of the Nutrition Assistants in the adult EFNEP include:
1) Recruiting and enrolling low-income adults in EFNEP.2) Teaching food and nutrition and related subject matter
to the homemakers.3) Evaluating the progress of the homemaker.4) Identifying the potential for 4-H EFNEP youth
participants from among the children of Programfamilies.
5) Identifying and recruiting potential Program volunteers.6) Referring families to other Extension programs or to
other agencies or organizations (4).
Paraprofessionals are providing the "insider" approach to improving
nutrition knowledge and changing eating habits with warmth, intuition
and empathy.
24-Hour Recall Method
The 24 -hour recall was the instrument used in this evaluatiou to
document eating habits. The 24-hour recall provides a quick,
economical, and appropriate means of monitoring food intake (5). In a
report to the USDA, Burk and Pao (6), discussed the advantages and
applications of the 24-hour food recall as well as the shortcomings and
alternatives to it. Their evaluation is that it is a useful, valid
method of obtaining diet information.
I 6
-1
10
EFNEP Recommendations and Considerations
In 1979-80, the U.S. General Accounting Office carried out a
limited study of the EFNEP and made several recommendations to the
Secretary of Agriculture. The recommendations were:
1) Encourage state and local EFNEP officials to developand test various innovative methods for reaching morefamilies within the constraints of available resources.
2) Evaluate the methods that are developed and disseminateto all EFNEP officials information on those foundto be feasible and effective.
3) Develop (1) objective and measurable standards forjudging program effectiveness and (2) the evaluationand feedback tools needed to measure programperformance against such standards.
4) Provide additional guidance and training to state andlocal program officials on supervisory andrecord-keeping requirements and responsibilities.
5) Develop specific criteria for state program officials touse in selecting program sites and allocating funds amongthe sites.
6) Encourage increased state and local EFNEP coordinationwith other nutrition-related programs for reachingmore families.
7) Ensure adequate evaluations of the sixteen pilot projectswhich are exploring ways of increasing Food StampFamilies' participation in EFNEP (3).
From this limited study a federally mandated study was to be
conducted by the Extension Service, Science and Education, United States
Department of Agriculture (USDA). From this mandated study the
following recommendations were made:
1) EFNEP can be best justified by linking healthstatus to low-income families:a) because of fewer resources they are at greaternutritional risk;b) imbalances in consumption are linked with higherincidence of nutrition-related diseases and disorders;c) low-income families can least afford the cost ofhealth problems.
2) Targeting of services needs to be carefully planned bystates to ensure that the "neediest" are getting theservices.
1 7'
11
3) Cost effectiveness needs to be improved.4) A national task force needs to determine the feasibility.5) Program curriculum should be developed and consideration
given to program delivery methods and a definitionof "completion" provided.
6) EFNEP should fid ways to coordinate with other agenciesand enhance the effects of all in reaching goals.
7) Paraprofessionals should be focusing their effortson teaching.
8) Program reviews of units should be comprehensive, frequentand objective enough to strengthen and improve programs orto eliminate the weak and ineffective.
9) A national task force should re-define and re-design therecord and reporting system (7).
Similar Evaluation Studies
A California EFNEP evaluation study conducted from 1980 to 1983
concluded that EFNEP is making a significant improvement in the eating
habits, food attitudes and nutrition-related knowledge and behavior of
its target audience. An evaluation study in Maryland recently showed
that, even after twenty months, EFNEP graduated homemakers retained
their knowledge and improved dietary habits (8). "The Orleans Parish,
Louisiana, Evaluation Study (1983-86) also indicated that low-income
homemakers enrolled in the program improved their dietary practices.
Homemakers sustained this improvement in dietary behavior for six to
twelve months after graduation and at a significant level when compared
to entry" (2).
Kansas EFNEP
From February 1969 to August 1971, twenty-one counties in Kansas
(Appendix 0) had established EFNEP. Beginning in September 1972 through
December 1975, thirteen of the original twent; one counties had phased
18
12
out the EFNEP; leaving only Crawford, Douglas, Geary, Riley, Saline,
Sedgwick, Shawnee and Wyandotte counties. These counties operated for
the next ten years without fail. Then from May 1985 to June 1986, four
other counties had their EFNEP phased out. This phase out was due, in
part, from lack of funding. The remaining counties: Crawford,
Sedgwick, Shawnee and Wyandotte, will be used in this evaluation study.
From October 1, 1986 through September 30, 1987, 2,558 EFNEP
homemakers had been reported served by the four counties. During this
same time, 888 homemakers, or approximately 35%, had graduated from the
program. There were 1,229 homemakers, or 48% enrolled, that reported
they received Food Stamps.
From October 1, 1987 through February 1, 1988, the four counties
reported an average 'enrollment of 1,148 homemakers.
The Expanded Food and Nutrition Educti.on Program, since its
inception in 1968, has been continuously challenged and evaluated to
determine effectiveness in meeting the program's objectives. Cost
effective, productive programs are a must during difficult economic
times. Documentation of program results are necessary to help ensure
continued funding and the existence of a federal nutrition education
program. "Indeed, it is important for any program to be self-reflective
and to provide feedback so that it can improve and grow with the
changing needs of the population it serves" (5).
In recent years (1982-1987), unemployment rates in the United States
have dropped from about 11% to around 6%, but there has been a
considerable increase in the number of people who live in poverty.
10
13
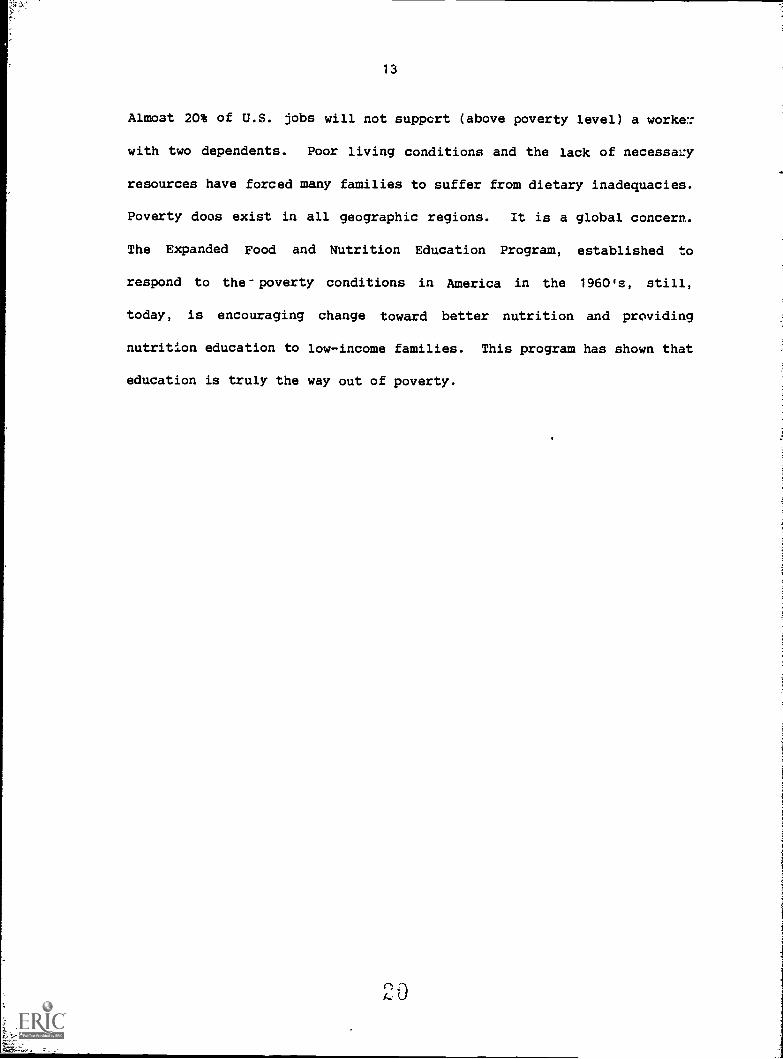
Almost 20% of U.S. jobs will not support (above poverty level) a worker:
with two dependents. Poor living conditions and the lack of necessary
resources have forced many families to suffer from dietary inadequacies.
Poverty dons exist in all geographic regions. It is a global concern.
The Expanded Food and Nutrition Education Program, established to
respond to the-poverty conditions in America in the 1960's, still,
today, is encouraging change toward better nutrition and providing
nutrition education to low-income families. This program has shown that
education is truly the way out of poverty.
1
CHAPTER III
OVERVIEW
This evaluation examined the dietary practices and nutrition
knowledge of lcw-income homemakers (Appendix E) enrolled in the Kansas
Expanded Food and Nutrition Education Program. In each of the four
participating counties (Appendix D), EFNEP homemakers were recruited by
a County Nutrition Assistant and the researcher used a proportional
random sampling procedure to select the subjects used in the evaluation.
There were 115 Kansas EFNEP homemakers selected for this study. The 115
subjects represented approximately ten percent of the total number of
homemakers enrolled in the Kansas EFNEP (January 1988). Demographic
data were collected at the time the homemaker was enrolled by the
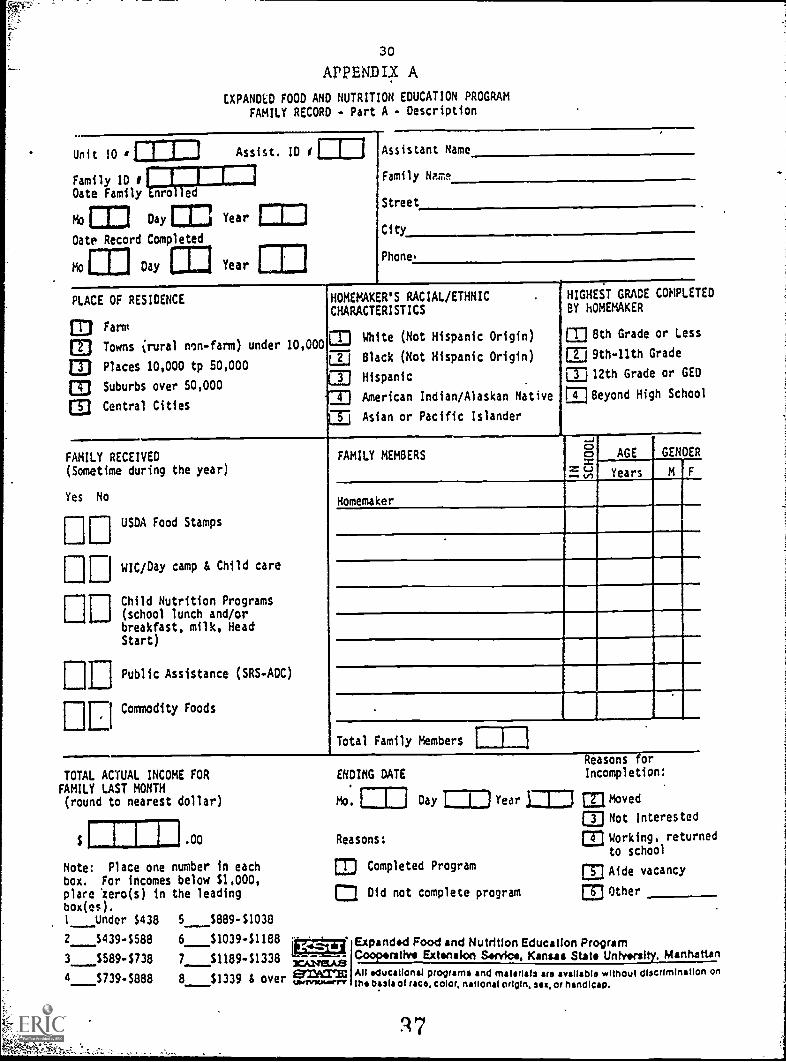
Nutrition Assistant. The EFNEP Family Record Form was used to gather
these data (Appendix A). The Nutrition Assistants administered the
pre-evaluation instruments, which were the Homemaker Food Consumption:
24-Hour Food Recall (Appendix B) and the Food and Nutrition Practice
Checklist (Appendix C), to each of the EFNEP subjects. After
pre-evaluating was completed, the Nutrition Assistant began teaching the
subjects using a one-to-one and/or small group approach. The curriculum
used were the "competency based" Eating Right Is Basic 2, adult
materials (Appendix H). Upon completion of the twelve basic ERIB 2
lessons, the Nutrition Assistants administered a post-evaluation. The
post-evaluation instruments were the same as those administered in the
pre-evaluation.
2 I.
15
Suppling Procedure
The subjects used in this evaluation did not have previous EFNEP -1
annual reports, the
EFNEP Homemaker Characteristic Profile nationally was an individual with
instruction. Based upon previous studies and EFNEP
annual income below poverty level, 66% receive food stamps, 35% are
enrolled in WIC (Women, Infant and Children Program), most have children
under 5 years old, and 60% are from racial minorities. The EFNEP Family
Record Form (Appendix A) was used to determine the Kansas EFNEP
Homemaker Characteristic Profile.
Subjects were selected based upon each county's EFNEP homemaker
enrollment in proportion to the total average Kansas EFNEP Homemaker
enrollment from October 1987 to January 1988.
Percentages used to determine the sample were an average percent
from October 1987 to January 1988. TABLE I shows the percentages used
and the number of EFNEP subjects that were evaluated from each county.
TABLE I
NUMBER OF EFNEP SUBJECTS FROM EACH COUNTY USED IN THE EVALUATION
Kansas-EFNEP County Average % Totalenrollment by countyOct. 1967-Jan. 1988
10. How often do your children eat a noon meal (lunch or secondmeal) that includes foods from 3 or more of the Food Groups?
11. How often do your children eat an evening meal (third meal)that includes foods from 3 or more of the Food Groups?
19
33
APPENDIX C (cont.)
FOOD ANO NUTRITION PRACTICES CHECKLIST
(Continued)
12. How often do you plan for at least four or five days' mealsbefore you go shopping for groceries?
13. How often do you shop for food with a shopping list?.,.
14. How often do you "charge" your food purchases?
_
15. How often do you compare prices among different brands of afood item?
16. How often do you check food advertisments before shopping?
17. How often do you run out of food stamps, food money or food?
18. How often do you consider calories when planning meals?
19. How often do you serve packaged, canned or frozen dinnersas the main dish of a meal?
20. When you have the bones of beef or poultry, how often do youuse them to make soup?
21. When preparing a recipe from scratch, how often does it turnout as you had expected?
22. Do you leave cooked or leftover food on the table, counter,nr stove for two hours or more?
23. How often do you store cooked foods in an uncovered containerin the refrigerator?
24. How often do you exercise vigorously (for example, snow shoveling,
walking briskly, mowing lawn, sports) at least 2 or 3 times aweek?'
lmommmummimaxisomrsii.ANSWER ONLY IF YOU CAN VEGETABLES.
25. How often do you use a pressure canner when canning vegetables?
SCORE I
SCORE II
CHANGE (II-I)
9/86
Grace M. Lang, Extension Specialist, Expanded Food and Nutrition Education Program
Expanded Food and Nutrition Education ProgramatPmilt":,-.1 Cooperative Extension Service, Kanus State University, ManhattanErrjarm, All educational programs and materials are available without discrimination on°HMI.""rr I the basis of ram color, national origin, am or handicap.
*Guidelines are provided by the Department of Health and Human Services andpublished in the February 12, Federal Register (Vol. 53, No. 19; p. 4214). EFNEPcounties may put these revised income guidelines into effect May 1, 1988.
These income guidelines affect several social services. The guideline atthe 130 percent level (or below) will be u ed by the Food Stamp and free schoollunch programs, Guidelines at the 185 percent level (or below) will be usedby "reduced- price" school lunch, WIC, and Commodity Food programs.
SOURCE: Letter from Nancy Leidenfrost, National Program Leader, EFNEP,March 4, 1988--received 4/04/88.
Copy prepared by: Grace M. Lang, Extension Specialist,Expanded Food and Nutrition Education Program
Expanded Food and Nutrition Education ProgramCooperative Extension Service, Kansas State University, ManhattanAll educational programs and materials are available without discrimination onthe basis of race, color, national origin, sex, or handicap.
APPENDIX F
Spectics Method of Scoring the 24-Hour Food Recall
SCORING TABLE FOR TWENTY -FOUR -HOUR DIET
To find the Twenty-four-Hour Diet score:
1. Select the appropriate table (below) on the basis of the number of milk servings reported in Iteml, FAMILY RECORDB (0,1, al or more). NOTE: Circled numbers ( , ® ) are the highest score possible in a food group: For number of servingslarger than the circled number, use the circled number. Example, for 3 servings of milk, use the 0 MILK SERVINGStable.
2. Select the proper column of the table on the bash of the number of meat servings reported in Item B.
3. Select the proper area of the table on the basis of the number of vegetable/fruit servings reported in Item 9 (0, 1. 2. 3. ® ormore).
4. Find the proper line of the table oa the basis of the number of bread/cereal servings reported in Item 10.
The number to the right of this (in type style "74") is the Twenty-four-Hour Diet score. Enter the diet score at the appropriate"months in program" time on the homemaker's FOOD AND NUTRITION PROGRESSION RECORD.
errATic All educational programs and materials an available withoul discrimination on,12"7""rrf the basis of race, color, national origin, sex, on handicap,
45
39
APPENDIX H
EATING RIGHT IS BASIC 2Adult Curriculum
No.
Name Date Enrolled
Address Phone No.
Beginning Food Recall Score
Ending.Food Recall Score
Basic Lessons (check as completed)
1. Making Heals from What's on Hand
2. Planning Hakes tha Difference
3. Let's Hake Something Simple/Home Invaders
4. Shopping Basics
5. Nutrients We Need
6. Fruits
7. Vegetables
8. Milk and Cheese
9. Bread, Cereal and Pasta
10. Heat, Poultry, Fish and Eggs
11. Dried Beans and Peas/Protein Pairs
12. Putting It All Together
Additional Lessons
13. Feeding Baby Solid Food
14. Feeding Your Preschool Child
15. Gardening
16. Food Preservation
17. Eating Right & Light
18. Soups
19.
20.
4 6
41
Bibliography
1. United States Department of Agriculture. Extension Service.Expanded Food and Nutrition Education Program Policies. Oct. 1983.
2. United States Department of Agriculture. Extension Service."EFNEP-Nutrition Education In Action," by Nancy Leidenfrost.Extension Review (Spring 1987) Vol. 58. No. 2. p. 11.
3. United States General Accounting Office. Report to the Secretaryof Agriculture. "Areas Needing Improvement In The Adult EFNEP."Washington, D. C. September 4, 1980.
4. United States Department of Agriculture. Science and EducationAdministration. The Expanded Food and Nutrition EducationProgram-Historical and Statistical Profile. Program Aide No. 1230.Washington, D. C. March 1979.
5. Block, Amy and others. California EFNEP Evaluation Study.Cooperative Extension-University of California. Division ofAgriculture and Natural Resources. Berkeley, CA. 1985.
6. Burk, M. C. and E. M. Pao. "In Methodology for Large-scale Surveysof Household and Individual Diets." Home Economics Research Report40. pp. 55-65. United States Department of Agriculture.Washington, D. C. 1976.
7. United States Department of Agriculture. Extension Service Scienceand Education. Implications of the Results from, "An Assessment ofthe Objectives, Implementation and Effectiveness of the AdultEFNEP," for Program Policy and Practice. (George W. Mayeske,project director). Washington, D. C. February 1982.
8. United States Department of Agricultyre. Expanded Food andNutrition Education Program...Teaching Nutrition to Low-IncomeFamilies. Washington, D. C. January 1984.
9. Dawber, T. R., Pearson, G., Anderson, P. et al. DietaryAssessment-The Framingham Study II. Reliability of Measurement.Am. J. Clin. Nutrition. 11:226-34. 1962.
10. Lang, Grace. College of Human Ecology. Kansas State University,Manhattan, Kansas, 1983. (Doctor's thesis.)