DOCUMENT RESUME ED 368 510 PS 022 349 AUTHOR Lee, Valerie E. Loeb, Susanna TITLE Where Do Head Start Attendees End Up? One Reason Why Preschool Effects Fade Out. PUB DATE 24 Jan 94 NOTE 40p.; Support for this study was received from the American Educational Research Association 1992-93 Grants Program. PUB TYPE Reports Research/Technical (143) EDRS PRICE MF01/PCO2 Plus Postage. DESCRIPTORS Academic Achievement; *Early Experience; *Educational Quality; Followup Studies; Grade 8; Junior High Schools; *Junior High School Students; *Outcomes of Education; *Preschool Education IDENTIFIERS *Long Term Effects; *Project Head Start ABSTRACT A study investigated the relationship between the quality of schools subsequently attended by adolescents and their preschool experience. In particular, the study differentiated the characteristics of middle-grade schools attended by 8th grade students who had experienced either Head Start, other preshools, or no preschool. School quality was defined broadly, in terms of social composition, academic rigor, safety, and social relations. After taking into account family background and demographics, the study found that former Head Start attendees are being educated in schools of significantly lower quality than are their 8th-grade counterparts who did not attend preschool, and particularly compared to peers who attended other preschools. No matter how beneficial the Head Start experience was initially for its participants, such benefits are likely to be undermined if these students are thereafter exposed to lower quality schooling. The particularly low quality of middle-grade schools attended by former Head Start participants explains, at least in part, why Head S art effects often fade out over time. (Author) *********************************************************************** * Reproductions supplied by EDRS are the best that can be made * * from the original document. * ***********************************************************************
Transcript
DOCUMENT RESUME
ED 368 510 PS 022 349
AUTHOR Lee, Valerie E. Loeb, SusannaTITLE Where Do Head Start Attendees End Up? One Reason Why
Preschool Effects Fade Out.PUB DATE 24 Jan 94NOTE 40p.; Support for this study was received from the
American Educational Research Association 1992-93Grants Program.
PUB TYPE Reports Research/Technical (143)
EDRS PRICE MF01/PCO2 Plus Postage.DESCRIPTORS Academic Achievement; *Early Experience; *Educational
Quality; Followup Studies; Grade 8; Junior HighSchools; *Junior High School Students; *Outcomes ofEducation; *Preschool Education
IDENTIFIERS *Long Term Effects; *Project Head Start
ABSTRACTA study investigated the relationship between the
quality of schools subsequently attended by adolescents and theirpreschool experience. In particular, the study differentiated thecharacteristics of middle-grade schools attended by 8th gradestudents who had experienced either Head Start, other preshools, orno preschool. School quality was defined broadly, in terms of socialcomposition, academic rigor, safety, and social relations. Aftertaking into account family background and demographics, the studyfound that former Head Start attendees are being educated in schoolsof significantly lower quality than are their 8th-grade counterpartswho did not attend preschool, and particularly compared to peers whoattended other preschools. No matter how beneficial the Head Startexperience was initially for its participants, such benefits arelikely to be undermined if these students are thereafter exposed tolower quality schooling. The particularly low quality of middle-gradeschools attended by former Head Start participants explains, at leastin part, why Head S art effects often fade out over time. (Author)
************************************************************************ Reproductions supplied by EDRS are the best that can be made *
U.& DEPARTMENT OF EDUCATIONMc* of Educational Research end Improvement
EDUCATIONAL RESOURCES INFORMATIONCENTER (ERIC)
%kills document has bean reproduced asreceived from the person or organitahonalienating itMinor changes have Won made to improvereProductron quality
Pants ol wow or opinions stated in this docu-ment do not necessarily represent &hoistOERI positIon ur poky
Where Do Head Start Attendees End Up?
One Reason Why Preschool Effects Fade Out
Valerie E. Lee and Susanna LoebUniversity of Michigan
January 24, 1994
"PERMISSION TO REPRODUCE THISMATERIAL HAS BEEN GRANTED BY
TO THE EDUCATIONAL RESOURCESINFORMATION CENTER (ERIC).-
We wish to acknowledge the generous support for this study from theAmerican Educational Research Association 1992-93 Grants Program, and toRichard Shavelson, Grants Program Committee Chair. We appreciate theassistance of Julia B. Smith and Fong-ruey Liaw for data management in theearly phase of this study, and of Robert G. Croninger for helpful commentson an earlier draft. Address all correspondence to: Professor Valerie E.Lee, School of Education, University of Michigan, Ann Arbor, Michigan48109.
2
BEST C
Where Do Head Start Attendees End Up?
Where Do Head Start Attendees End Up?
One Reason Why Preschool Effects Fade Out
Abstract
This study investigates the relationship between the quality of schools
subsequently attended by young adolescents and their preschool experience.
In particular, the study differentiates the characteristics of middle-grade
schools attended by 8th grade students who earlier experienced Head Start,
other preschools, or did not attend preschool. School quality is defined
broadly, in terms of social composition, academic rigor, safety, and social
relations. After taking into account family backgrouhd and demographics,
the study concludes that former Head Start attendees are being educated in
schools of significantly lower quality than their 8th-grade counterparts
who did not attend preschool, and particularly compared to peers who atten-
ded other preschools. No matter how beneficial the Head Start experience
was initially for its young participants, such benefits are likely to be
structurally undermined if these students are thereafter exposed to
schooling of systematically lower quality. The particularly low quality of
middle-grade schools attended by former Head Start participants explains,
at least in part, why Head Start effects often fade out over time.
Where Do Head Start Attendees End Up?
1
Where Do Head Start Attendees End Up?
One Reason Why Preschool Effects Fade Out
Background
The social policy agenda is again focussing attention on Project Head
Start, as federal funding for, and access to, this program which provides
preschool education for socially disadvantaged children is being increased.
Although its early and inflated claims of "breaking the cycle of poverty,"
"innoculating children against poverty," or enabling poor children to
"start school on an equal footing with their more privileged peers" have
become more realistic over time (Schorr, 1989; Woodhead, 1988; Zigler,
1987; Zigler & Valentine, 1979), public support for Head Start has remained
constant. The program is generally perceived to be one of the few enduring
successes of the Johnson administration's "war on poverty" (Conger, 1988;
Glazer, 1988). The title of Zigler and Muenchow's recent book (1992)
describes Head Start as "America's most successful educational experiment."
Effects of Head Start
Fading effects. Several strong studies have demonstrated that Head
Start has short-term cognitive, affective, and social benefits for poor
children (e.g., Lee, Brooks-Gunn, & Schnur, 1988; McKey et al., 1985).
Other preschool programs for disadvantaged children have shown similar
regression results for this outcome, indicating that the final model
explains variance in teacher-student relations quite poorly (R2 of only
1.7%). Before and after statistical adjustment, when compared to students
who did not attend preschool (NPS), students with Head Start experience
attend schools which evidence significantly poorer relations between
teachers and students (.046 units before adjustment [p < .001] amd .028
after adjustment (p < .05). There is no significant difference between HS
14
Where Do Head Start Attendees End Up?
12
and OPS students on this outcome. Relations between teachers and students
are described significantly less positively in schools attended by minority
students, especially Hispanics. Curiously, students with fewer financial
resources (needs ratio) and less educated parents rate social relations in
their schools more positively than their peers with more educated parents.
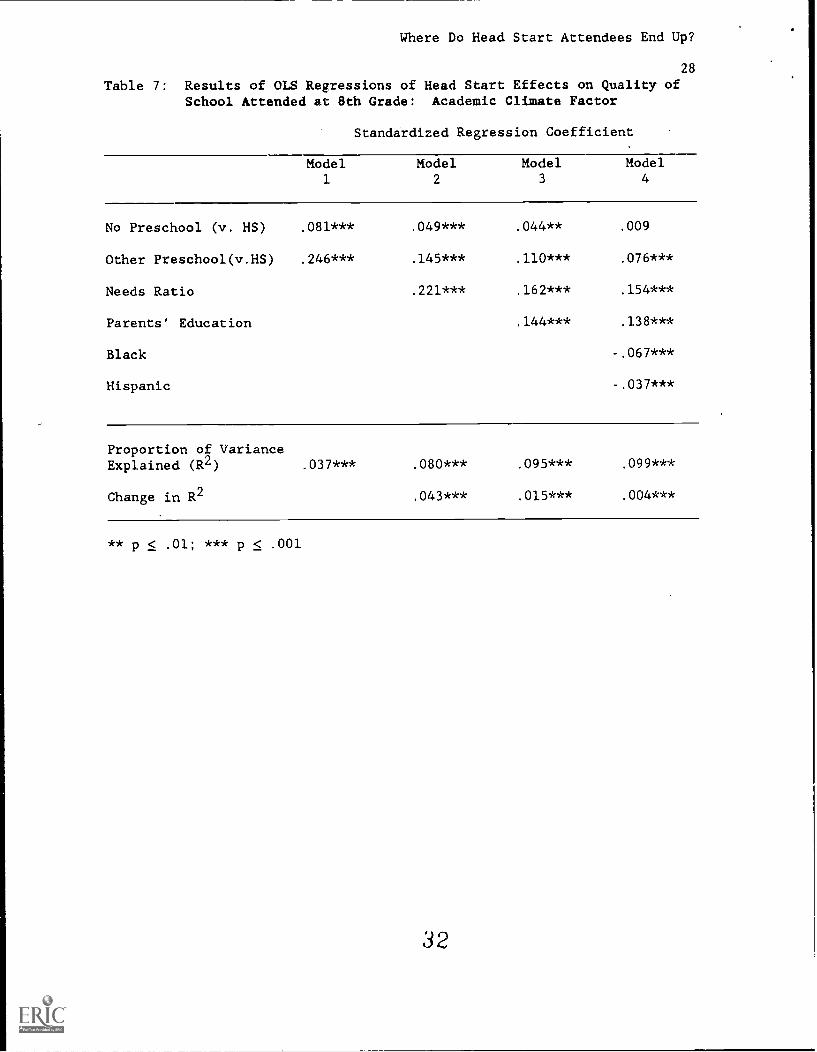
School academic climate. The academic climate of schools attended by
students who attended other preschools is significantly better than those
where former Head Start students are enrolled (an effect of .246 units
before adjustment, .076 including adjustment). There are no differences
between the HS and NPS groups (see Table 7). Other demographic factors
(needs ratio, parental education, race/ethnicity) show strong associations
with academic climate. A modest but significant proportion of variance in
this outcome is explained by the final model (R2 of 9.9%), and each model
change was also highly significant.
Insert Tables 7 and 8 about here
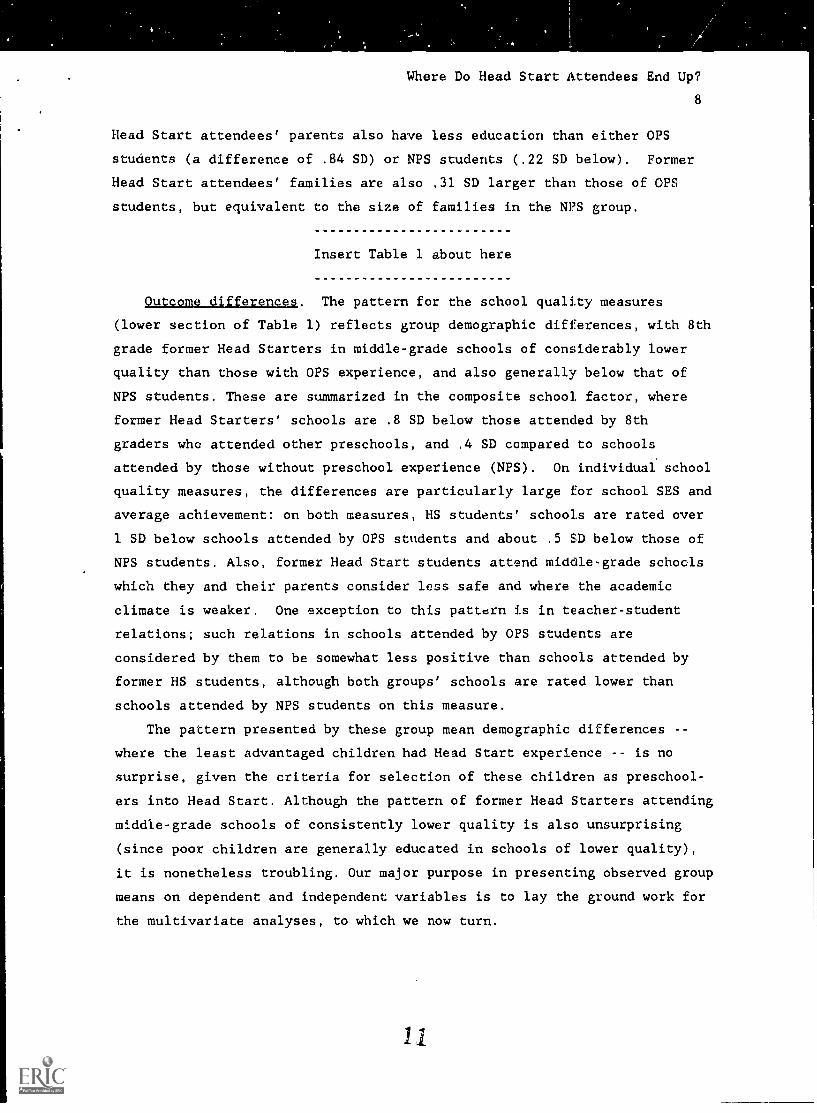
Composite school quality factor. The pattern of former Head Start
students attending schools of lower quality than either comparison group is
summarized by the results for the school quality composite index, which are
shown in Table 8. Again, the magnitude of the two Head Start contrasts
decreases with subsequent statistical adjustments. Both contrasts remain
statistically significant below the .001 probability level, however, even
in the full model (Model 4). After taking family economic condition,
parents' education, and children's race and ethnicity into account, 8th
graders who attended Head Start attend schools of lower quality than their
counterparts who did not attend preschool (an effect compared to NPS of
.04) and particularly in comparison to those 8th graders who had a
preschool experience other than Head Start (a contrast with OPS of .135).
Model 4 explains a quarter (24.2%) of the variance for the school quality
composite.
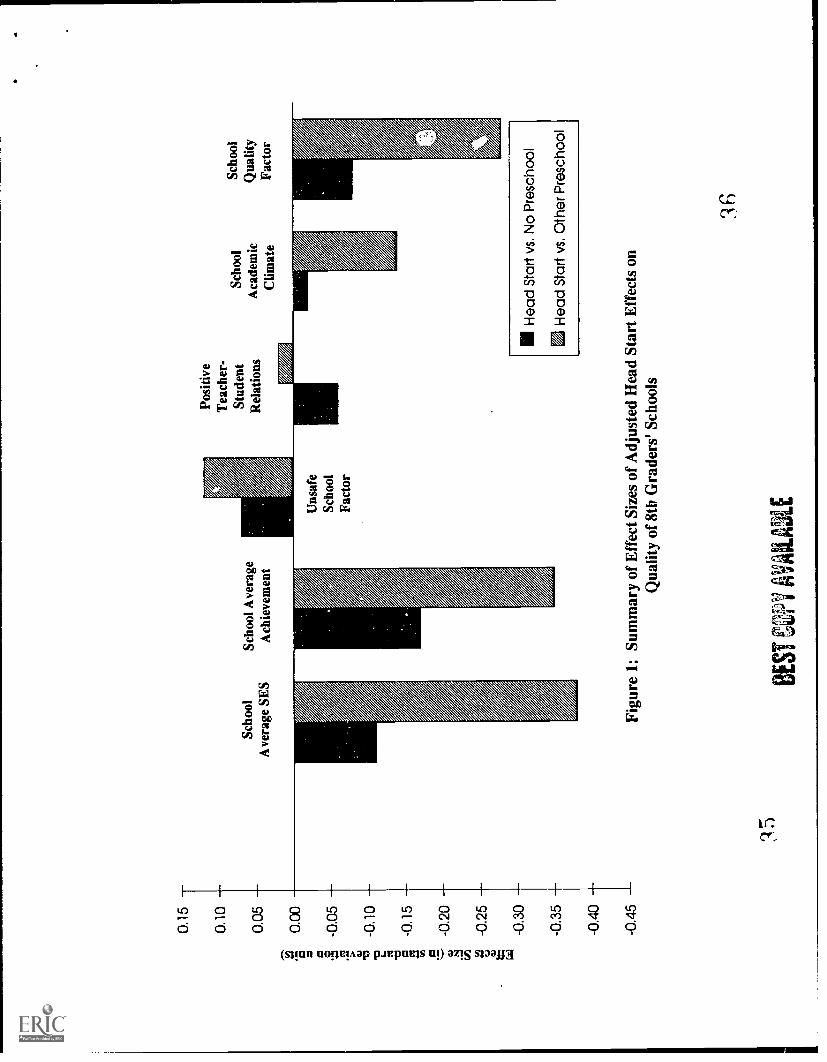
Summary of regression results. A summary of results of the residual
preschool contrasts (Model 4) from Tables 3-8 is presented in Table 9 and
Figure 1. To facilitate comparison across the outcomes, and to discuss the
results in a meaningful metric, coefficients representing the Head Start
group were reversed and recomputed in effect size (SD) units,9 with Head
Start contrasted with the NPS group (column 1) and the OPS group (column
15
Where Do Head Start Attendees End Up?
13
2). Significance levels are taken from Tables 3-8. Negative effects
indicate that 8th graders who attended Head Start scored lower than the two
preschool contrast groups. Because the coding of the unsafe school factor
is opposite from the other dependent measures, Head Start effects here are
positive (i.e., these students are in more unsafe schools).
Insert Table 9 and Figure 1 about here
Table 9 shows that compared to students who attended other preschools,
former Head Starters are in schools of considerably lower SES, lower
average achievement, and of lower overall quality; these effects are of
medium magnitude (close to .4 SD for the first two outcomes, close to .3 SD
for the composite). Moreover, Head Start students attend less safe schools
and schools with lower academic climate than OPS students; while small in
magnitude (.1-.2 SD), the probability of obtaining these effects by chance
is nevertheless very low. Small but highly significant differences favor
former NPS students over former Head Start attendees in terms of the
average SES, average achievement, and overall quality of the schools they
attend as 8th graders. We conclude that on 5 out of 6 measures of school
quality considered here, even taking substantial demographic group differ-
ences into account, students who attended Head Start as preschoolers
possess a residual disadvantage in comparison with their peers who did not
attend preschool, and are particularly disadvantaged compared to those who
attended non-Head Start preschools.
The summary results from Table 9 are displayed in Figure 1, where effect
sizes are also presented in SD units. It is clear from this graph that,
over the several dimensions with which we defined school quality, former
Head Start students are particularly disadvantaged in comparison to their
counterparts with other preschool experience (the gray bars), although the
comparion of students with Head Start experience to those who did not
attend preschool (the black bars) also shows former Head Starters at a
residual disadvantage. Recall that these effects are computed net of the
demographic characteristics of these students and their families.
16
Where Do Head Start Attendees End Up?
14
Discussion
Implications of These Findings
Eovtam. We draw several implications from theseresults. The first, while unsurprising, is nevertheless troubling in terms
of the equality of educational opportunity afforded to the nation's chil-
dren. Due primarily to the local funding and residential basis for school
attendance in the United States, our most disadvantaged children must
attend our lowest quality schools -- where learning levels are lower and
the climate is not academically stimulating, where poverty is concentrated;
in schools which are unsafe, and which are characterized by less harmonious
relations between staff and students. These findings lead to the conclusion
that American children who need the best educational environments to lift
them from poverty are actually enrolled in our nation's lowest quality
schools. Here, "quality" is defined not only in terms of accumulated
learning, but also by several rather basic environmental factors associated
with educational progress.
Why do Head Start effects fade out? The second implication concerns the
long-term efficacy of Head Start participation for children living in
poverty. Our results suggest one important substantive explanation for
many other studies' conclusions that many of the effects of preschool
intervention for poor children fade out over time (especially the cognitive
effects). Even with the reasonably well established research conclusion --
that poor children accrue substantial immediate cognitive and social compe-
tence benefits from participation in Head Start -- this study finds that
Head Start "alumni/ae" attend systematically inferior schools thereafter,
over and above the disadvantages which accrue from their likelihood of
special social disadvantage (minority status, low family income, less
parental education, and the like). No matter how strong the early "boost"
received by these children from their Head Start experience, the fact that
their subsequent education is in lower quality schools (and that that
learning is likely to be inferior in those schools) would seem to undermine
any early advantage.
What might explain why young adolescents with preschool experience in
Head Start end up in even more inferior schools than their social back-
ground characteristics would predict? A possible explanation relates to
the types of children who actually experience Head Start. Several studies
!?
Where Do Head Start Attendees End Up?
15
have demonstrated that Head Start programs more than two decades ago
enrolled children who were especially cognitively and socially disadvan-
taged, even in comparison to income-eligible children who attended other
preschools or did not attend preschool at all (Hebbler, 1985; Lee et al.,
1988; Schnur et al., 1992). This situation suggests that persons respon-
sible for implementing social programs are anxious to serve the "most
deserving" applicants, particularly when prc,gram availability is limited.
From a social service perspective, the aim of selecting children with the
greatest need for the program is reasonable, even noble. That the Head
Start policy of seeking out the most disadvantaged children continues to
this day was confirmed by administrators of several Head Start centers in
our local area, although these people suggested no special cognitive
criteria.10
Social Policy Issues
The purpose of this study was not to evaluate the long-term effects of
Head Start, and thus is not a policy study per se. Nevertheless, these
findings (and the educational conclusions we draw from them) have some
implications for social policy. The findings concernirg the strong associ-
ation between children's social disadvantage and the quality of the schools
they attend (in effect, a de facto segregation of schools by family
economic condition) suggest that our nation's policies which allow disad-
vantaged children to be concentrated in low-quality schools actually
promote an increase in socially-induced learning differentials as children
advance through the educational system. While the rhetoric of conventional
wisdom invokes education as a major solution for many of the problems
accruing to children growing up in poverty, the facts suggests that
stratification in school quality by social condition -- a practice our
nation allows through the sanctity of local control -- may in fact be part
of the problem.
Our conclusions concerning the residual disadvantage of young adoles-
cents who attended Head Start, in terms of the quality of the middle-grade
schools they attend, also have serious implications for social policy.
Although the nation is poised to invest even more in poor young children,
by virtue of its support for expanding preschool programs like Head Start,,
how to affect these children's deficient educational progress thereafter
receives less scrutiny. These findings suggest that either deliberate
18
Where Do Head Start Attendees End Up?
16
federal, state, and local policies concerning the education of disadvan-
taged children or, perhaps, a lack of attention to the results of allowing
poverty to be concentrated by geographic area, systematically undo with one
hand something to which we devote substantial resources with the other.
The results also suggest a potential political reality. Perhaps it is
the case that our nation is only willing to offer a helping hand to poor
children at the very beginning of their formal education, with the
expectation that this relatively inexpensive "boost" would be sufficient,
and that a more sustained (and certainly more expensive) commitment to the
education of poor children is politically unpalatable. The underfunding of
more substantial compensatory educational efforts, such as Project Follow
Through, offers support to the existence of this reality (Kennedy, 1978;
Zigler & Muenchow, 1992). This would suggest that, at least for some, the
provision of a quality education is not a political "right," but rather a
privilege afforded to those children and their families who can afford to
seek it out -- even in the public sector.
We find some cause for at least a bit of optimism in one current federal
educational policy. In its proposal for reauthorization of the Elementary
and Secondary Education Act, the Clinton administration has called for a
shift in the targeting of Chapter 1, the federal government's "flagship
program" for funding compensatory education (Miller, 1993). The Administra-
tion's proposal seeks to shift the impact of Chapter 1 away from eligible
individuals and toward the schools they attend, with the hope of improving
the entire environment of schools which enroll large numbers of poor chil-
dren. Although this proposal seems to take for granted that poor children
will be concentrated in poor schools, the proposed change seems at least to
recognize the appropriateness of targeting more federal dollars to schools
which enroll mostly poor children (i.e., more resources would be devoted to
schools which need them the most). The results of this study would seem to
support the idea behind the federal policy change in Chapter I as one
avenue for improving the education of poor children. Reviving or expanding
the Follow Through model would be another.
We are anxious that our words which challenge some basic notions upon
which our nation's social,policies concerning the education of children in
poverty rest not be construed as a lack of support for Head Start. We
firmly believe that Head Start is a worthwhile program, and our earlier
studies have confirmed its efficacy. However, we question a public policy
1 9
Where Do Head Start Attendees End Up?
17
which directs resources at the entry po4nt of schooling while simultane-
ously allowing serious structural inequalities to obviate these early
effects, however beneficial they may be. We reiterate here an idea stated
elsewhere: "Inducing sustained and successful academic experiences for
children of poverty throughout their educational careers, rather than
focusing on efforts to "fix" the problem with one-year preschool programs
(however successful they may be), is absolutely essential" (Lee et al.,
1990).
c." 0
Where Do Head Start Attendees End Up?
18
Technical Notes
1. While there is general agreement about the fading effects of Head Startin the cognitive and affective domains, social gains (e.g., graduatingfrom high school, staying out of prison) have been more enduring(Natriello, McDill, & Pallas, 1990; Schweinhart & Weikart, 1986).While there is some dispute about whether such "outcomes" are appropri-ate measures upon which Head Start should be evaluated, neverthelesssuch long-term social gains have been used frequently o "sell" HeadStart.
2. We spoke with Head Start centers in a large urban area, in a mixedsuburban area, and in a rural area in our state in Spring 1993.Administrators of all three centers confirmed that multiple criteriawere considered in selecting participants from the applicant pool, inaddition to the most important criterion for eligibility: family incomebelow the federal poverty guidelines.
3. We use the term "middle-grade schools" here, since the NELS:88 studyincluded any type of school attended by 8th graders. Only about half ofthese schools were middle schools or junior high schools (includinggrades 6-9), while about one-fifth were elementary schools (includinggrades K-8), and one-sixth included high school. Almost every concei-vable grade span was captured in this sample (Ingels, et al., 1990b).
4. The twc-stage sampling plan for NELS involved oversampling of two typesof schools -- private schools and schools with high minority enroll-ments. Although the NELS design weights (which we employed in all ouranalyses) allow analytic results from these data to be generalized tothe 1988 American 8th grade school population, the oversampling wasmeant to provide stable estimates for certain subgroups. In the case ofthis study, this oversampling was particularly useful, as it provided aconsiderable number of minority students (and the low-income schoolsthey attend).
5. In order to accurately capture the characteristics of the schoolsattended by these children, we note that the aggregation of student andparent variables used to define schools included the entire NEL:88sample, and not just the sample for this study.
6. Although NELS:88 includes measures of 8th graders' achievement in fourcurricular areas, we considered these as more likely to serve as accumu-lated measures which probably reflected the quality of schools attendedduring the intervening period (i.e., between preschool and 8th grade)more than cognitive status prior to preschool entry. In selectingconfounding variables, two considerations are important: (a) to controlbias which might have influenced selection into the "treatment" at theoutset, and (b) not to include measures which would inappropriatelyexplain away the treatment effect (Anderson et al., 1980). We considered8th grade achievement to fall into the latter category. We rejected theinclusion of other measures of individual students' academic behaviorsand attitudes as control variables for the same reason.
7. An alternative strategy we considered (also suggested by Anderson etal., 1980) is the use of matched-sample comparison groups. The appeal
21
Where Do Head Start Attendees End Up?
19
of matching is twofold: (1) comparisons are between racially andsocially equivalent groups to former Head Start attendees, and (2)analysis is more straightforward (i.e., simple t-tests between groupdifferences). We actually constructed such matched-sample comparisongroups with NELS data, matching OPS and NPS groups to the HS sample byrace/ethnicity and SES quartiles. Although the matching was successfulfor such nominal variables as race, quartile matching for SES resultedin small residual (but statistically significant) group differences onfamily income and parents' education. Since the comparison groups con-structed this way were relatively small (especially for the OPS group),statistical power correspondingly weakened due to an increase in theType II error rate. Thus, we reluctantly abandoned matching in favor ofthe ANCOVA strategy described herein.
8. We follow the lead of Rosenthal and Rosnow (1984, p.360), who describe asubstantive interp etation of effect size magnitudes measured in SDunits: effects of .2 and below are ^small"; effects between .2 and .5are "medium," and those over .5 are "large." These criteria were alsoused by the Head Start Synthesis Project (McKey et al., 1985) and by Leeet al., (1988, 1990).
9. This computation involved (a) dividing the appropriate unstandardizedregression coefficients from the final models in Tables 3-8 by the SD ofthe comparison group -- OPS or NPS -- on each measure (from Table 1),and (b) changing the sign from the standardized regression coefficientsfrom Tables 3-8. This method of computing effect sizes is advocated byRosenthal and Rosnow (1984), and is used in several other studies whichfocus on Head Start (e.g., Lee et al., 1988, 1990; McKey et al., 1985).
10. This explanation hints that former Head Start students' specialproclivity to attend low-quality schools might not be sustained if wewere able to include in our model a measure of students' cognitivestatus before they began preschool. Unfortunately, since no such measureis available in the NELS data file, we may not test this hypothesis.However, controlling for social background (which our model assumes tohave remained relative constant between preschool and 8th grade) shouldaccount for the the special social disadvantage of Head Start students.The appropriateness of introducing an ability control into our analyticmodel, even from a theoretical stance, is questionable in our opinion.Children are not "selected" into American public schools on thiscriterion.
92
Where Do Head Start Attendees End Up?
20
References
Anderson S., Auguier, A., Hauck, W.W., Oakes, D., Vandaele, W., & Weisberg,H.I. (1980). Statistical methods for comparative studies: Techniauesfor bias reductiort. New York: Wiley.
Bryk, A.S., Lee., V.E., & Holland, P.R. (1993). Catholic schools and thecommon good. Cambridge, MA: Harvard University Press.
Conger, J. (1988). Hostages to fortune: Youth, values, and the publicinterest. American Psych212giat, 43, 291-300.
Lojjzcss_ms.fjsstl.oLusta_p_tbh§_startinttluadeiachool district.Washington, DC: U.S. Department of Health and Human Services,Administration for Children, Youth, and Families, Head Start Bureau.
Duncan, G.J., Smeedling, T., Willard, R. (1992). The incredible shrinkingmiddle class. American Demographics, 14(2), 34-38.
Glazer, N. (1988). Education, training, and poverty: What worked? In N.
Glazer (Ed.), The limits of social policy (pp.59-85). Cambridge, RA:Harvard University Press.
Hebbler, K. (1985). An old and a new question on the effects of earlyeducation for children from low income families. LAILuslaaalEvaluation and Policy Analysis, l(3), 207-216.
Ingels, S.J., Abraham, S.Y., Karr, R., Spencer, B.D., & Frankel, M.R. (1989December). NationaLIAUPation Lon.f.i.t201D111..51.1.111.1LIiMLL_Ye..2I1student component. Data file user's manual (NCES 90-464), Washington,DC: U.S. Department of Education, Office of Educational Research andImprovement.
Ingels, S.J., Abraham, S.Y., Rasinski, K.A., Karr, R., Spencer, B.D., &Frankel, M.R. (1990a March). National Education Lonlalitudirldof1988. Base year: Parent component. Data file user's manual (NCES90-466). Washington, DC: U.S. Department of Education, Oc.ice ofEducational Research and Improvement.
Ingels, S.J., Abraham, S.Y., Rasinski, K.A., Karr, R., Spencer, B.D., &Frankel, M.R. (1990b March). National Education Longitudir_iaLatu1988, Base year: School component. Data file user's manual. NCES90-482. Washington, DC: U.S. Department of Education, Office ofEducational Research and Improvement.
Kennedy, M.M. (1978). findings from the Follow Through Plannee VariationStudy. Educational Researcher, 2, 3-11.
Kozol, J. (1991). Savage inequalities: Children in America's schools. NewYork: Crown.
Lazar, I., & Darlington, R. (1982). Lasting effects of early education: Areport from the consortium for longitudinal studies. Monographs of theSociety for Research in Child Development, 47(2/3, No. 195).
Where Do Head Start Attendees End Up?
Lee, V.E., Brooks-Gunn, J., Schnur, Eeffect sustained? A longitudinalchild:cen attending Head Start, noprograms. Child Development, .61,
21
& Liaw, F-R. (1990). Are Head Startfollow-up comparison of disadvantagedpreschool, and other preschool495-507.
Lee, V.E., Brooks-Gunn, J., & Schnur, E. (1988). Does Head Start work: A1-year follow-up comparison of disadvantaged children attending HeadStart, no preschool, and other preschool programs. DevelopmentalPsychology, 2.4(2), 210-222.
Lee, V.E. & Marks, H.M. (1992). Who goes where? Choice of single-sex andcoeducational independent secondary schools. Sociology of Education,63(3), 226-253.
McKey, R.H., Condelli, L., Granson, H., Barnett, B., McConkey, C., & Platz,M. (1985). The impact of Head Start on children. families, andcommunities. Washington, DC: CSR.
Miller, J.A.program.poverty
Miller, L.B.program:727-741.
(1993, August 4). Change in course eyed for flagship federalFocus of aid would shift from individual tutoring to high-
schools. Education Week, 1, 42.
& Bizzel. R.P. (1983). Long-term effects of four preschoolSixth, seventh, and eighth grades. Child Development, 54,
Miller, L.B. & Bizzel. R.P. (1984). Long-term effects of four preschoolprogram: Ninth- and tenth grade results. Child Development, 55,1570-1587.
Natriello, G., McDill, E.L., & Pallas, A.M. (1990). Schoolingdisadvantaged children. Racing against catastrqphe. New York:
Teachers College Press.
Newman, K.S. (1993). Declinin fortunes. The withe in of the American
dream. New York: Basic Books.
Orland, M.E. (1990). Demographics of disadvantage: Intensity of childhood
poverty and its relationship to educational achievement. In J.I.
Goodlad & P. Keating (Eds.), Access to knowledge: ArLagLnda j'(_)rournation's schools (pp.43-58). New York: College Entrance Examination
Board.
Rosenthal, R. & Rosnow, R.L. (1984). Essutiglajlijighgziaral_ItalamillMethodq and data analysis. New York: McGraw Hill.
Rutter, M. Maughan, B., Mortimore, P., Ouston, J., & Smith, A. (1979).
fifteenth9usand hours: Secqnciary schools and their effects on
children. Cambridge, MA: Harvard University Press.
Schnur, E., Brooks-Gunn, J., & Shipman, V.C. (1992). Who attends programs
serving poor children? The case of Head Start attendees andnon-attendees. Journal of Applied Developmental Psychology, 13,405-421.
24
Where Do Head Start Attendees End Up?
22
Schorr, L.B. (1989). Within our reach: Breaking the cycle_91_Alultza=aga.New York: Anchor Books.
Schweinhart, L.J. & Weikart, D. (1986). The effects of the Perry PreschoolProgram on youths through age 15 -- A summary. 6§t.ht,.._&iz_i_§_t2gng,
Zigler, E. & Muenchow, S. (1992). insidemost succes4iml educatIonal_p_mtringnI. New York: Basic Books.
Zigler, E.F. & Valentine, J. (Eds.) (1979). Project Head Start: A legacyof the war on poverty. New York: Free Press.
Where Do Head Start Attendees End Up?
22
Table 1: Means and Standard Deviations of Model Variables for 8th GradersWho Attended Head Start, Other Preschool Programa, and NoPreschool
sample Size(a)
Head Other No Total
Start Preschool Preschool Sample
2,111 6,240 6,486 .14,837
Independent Variables:
o Family 22,461Income($)(b) (23,170)
o Family Size 4.73(1.55)
o Needs Ratio(c) 1.90(1.97)
o Parents' 13.01Education(Yrs) (2.06)
o Race/Ethnicity (Proportions)BIack .413
Hispanic .162
White .425
Dependen Variables:
o School Average -.364
SES (.386)
o Average 47.32
Achievement (4.80)
o Unsafe School .965
Factor (.879)
o Tchr-Stdnt .359
Relations Fac. (.661)
o School Academic -.717Climate Factor (.656)
o Composite Schl -.544
Quality Factor (.714)
53,153(40,712)
33,018(24,589)
39,689(34,504)
4.36 4.72 4.61
(1.18) (1.44) (1.42)
4.64 2.77 3.39
(3.55) (2.14) (2.97)
15.32 13.50 14.14
(2.74) (2.25) (2.63)
.072 .084 .126
.051 .105 .097
.877 .811 .777
.091 -.202 -.115(.436) (.373) (.439)
52.19 49.88 50.31
(4.59) (4.46) (4.87)
.462 .645 .627
(.898) (.883) (.904)
.318 .419 .364
(.741) (.722) (.723)
-.326 -.587 -.510
(.821) (.718) (.766)
.171 -.238 -.116
(.853) (.744) (.821)
a. Samples sizes are presented unweighted. Means and standard deviationsare c, puted using the NELS:88 student design weights.
b. Standard deviations (SD) are in parentheses under their respectivemeans. As race/ethnicity is a categorical variable, SD's are ommitted.
c. The needs ratio is computed as family income divided by the adjustedpoverty threshold for'1988 (U.S. Census, 1992:461).
'26
Where Do Head Start Attendees End Up?
23
Table 2: Zero-order Correlations Between Individual School QualityMeasures (a)
AverageAchievement
Unsafe SchoolFactor
Tchr-StudentRelations Fac.
School AcademicClimate Factor
School AverageSES
AverageAchievement
Unsafe SchoolFactor
Teacher-StudentRelations Factor
.793 -.407
-.502
-.114
-.172
.356
.490
.506
-.728
-.438
a. Although these are measures of schools, correlations were computed atthe student level. This is because analyses were conducted at thatlevel.
27
Where Do Head Start Attendees End Up?
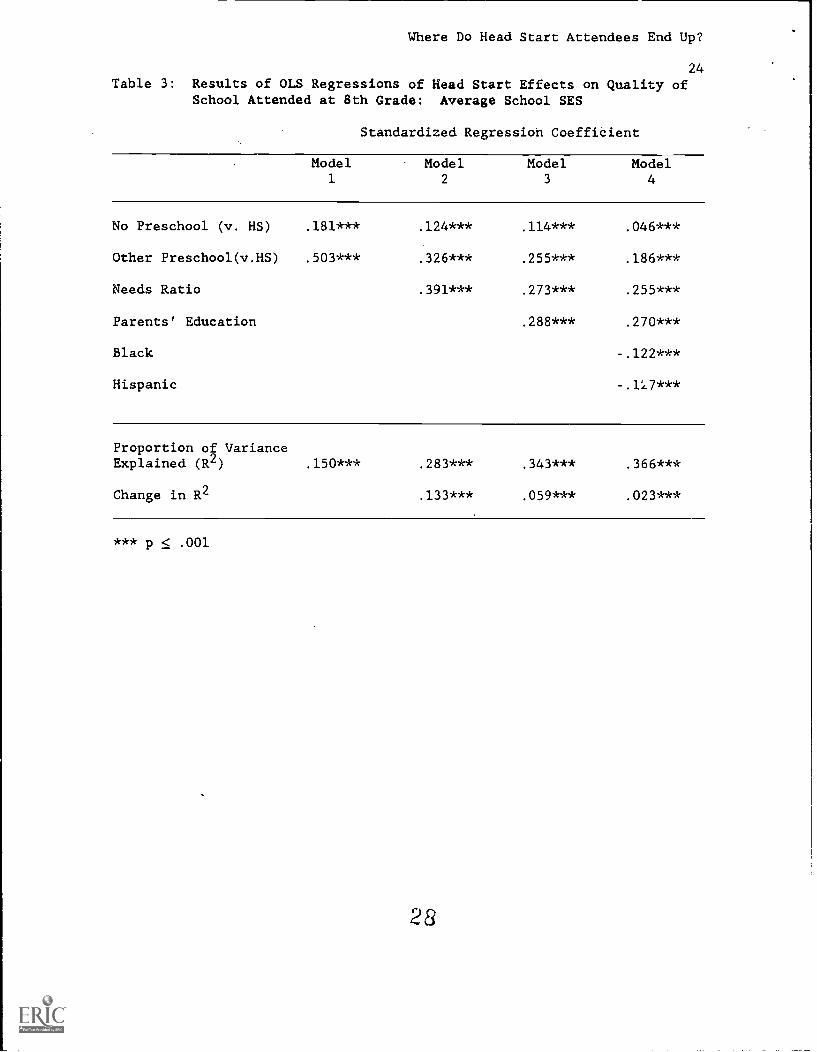
24Table 3: Results of OLS Regressions of Head Start Effects on Quality of
School Attended at 8th Grade: Average School SES
Standardized Regression Coefficient
Model1
Model2
Model3
Model4
No Preschool (v. HS)
Other Preschool(v.HS)
Needs Ratio
Parents' Education
Black
Hispanic
.181***
.503***
.124***
.326***
.391***
.114***
.255***
.273***
.288***
.046***
.186***
.255***
.270***
-.122***
-.1.7***
Proportion of VarianceExplained (R2)
Change in R2
.150*** .283***
.133***
343***
.059***
.366***
.023***
*** p < .001
28
Where Do Head Start Attendees End Up?
25
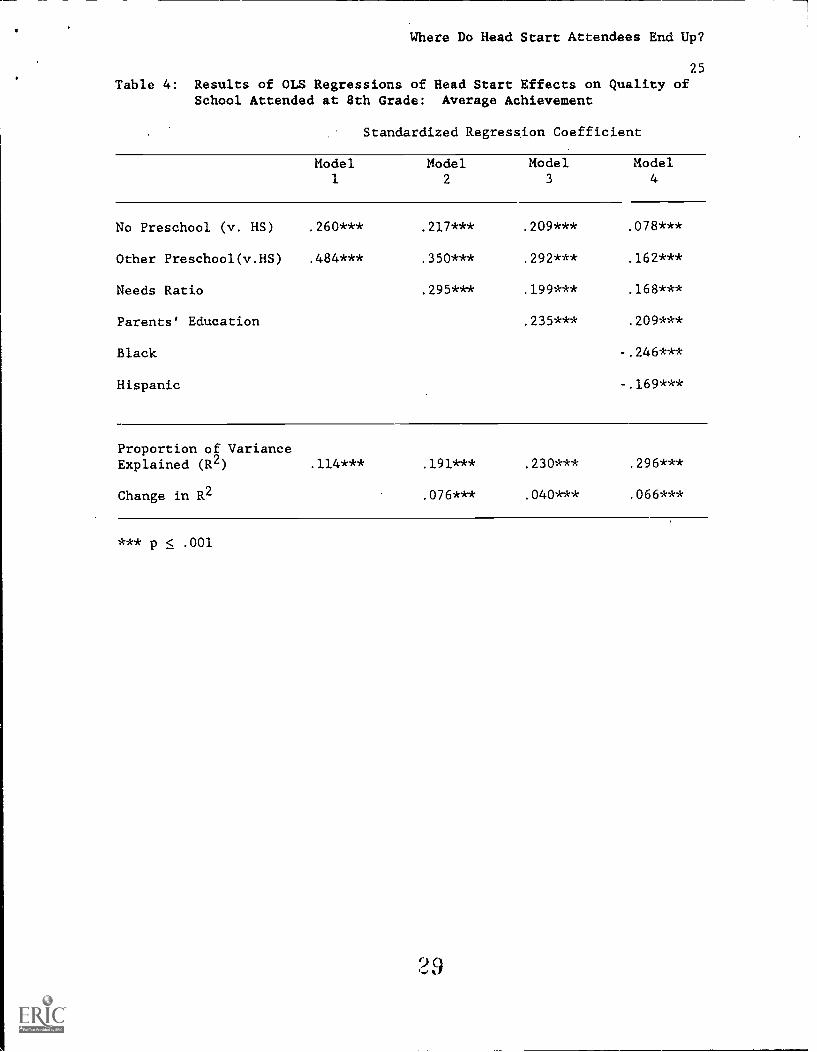
Table 4: Results of OLS Regressions of Head Start Effects on Quality ofSchool Attended at 8th Grade: Average Achievement
Standardized Regression Coefficient
Model1
Model2
Model3
Model4
No Preschool (v. HS)
Other Preschool(v.HS)
Needs Ratio
Parents' Education
Black
Hispanic
.260***
.484***
.217***
.350***
.295***
.209***
.292***
.199***
.235***
.078***
.162***
.168***
.209***
-.246***
-.169***
Proportion of VarianceExplained (R2)
Change in R2
.114*** .191***
.076***
.230***
.040***
.296***
.066***
*** p < .001
29
Where Do Head Start Attendees End Up?
26
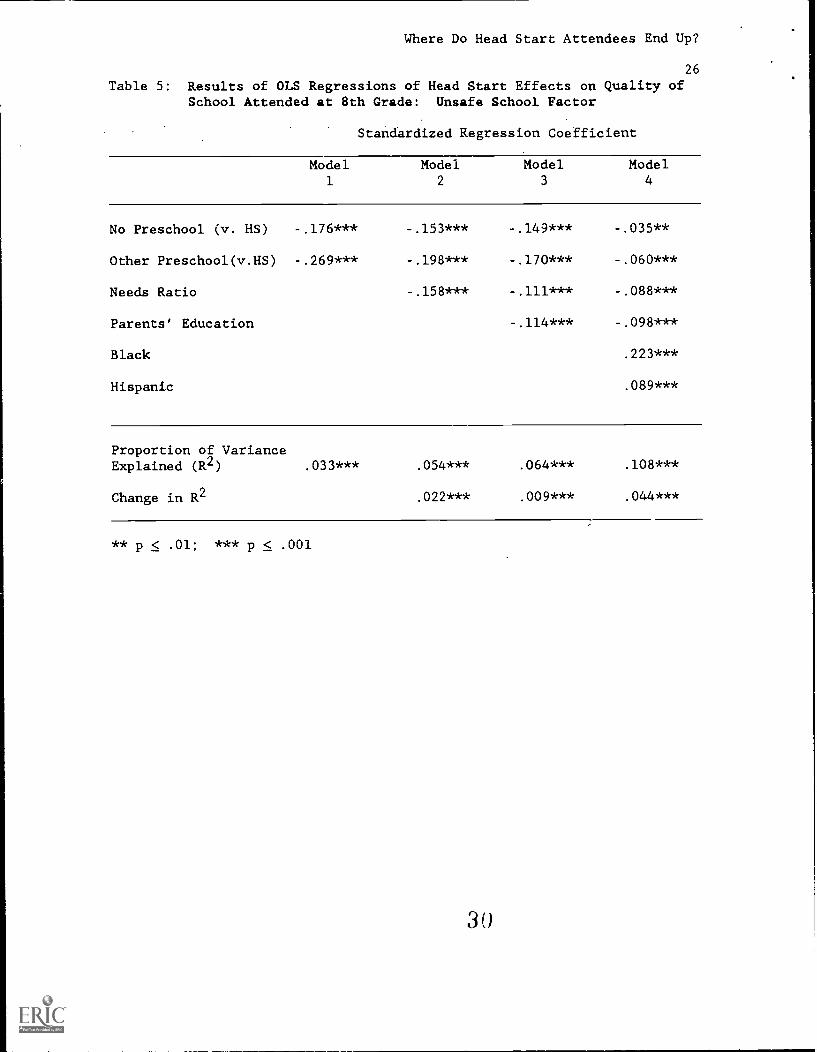
Table 5: Results of OLS Regressions of Head Start Effects on Quality ofSchool Attended at 8th Grade: Unsafe School Factor
Standardized Regression Coefficient
Model1
Model2
Model3
Model4
No Preschool (v. HS)
Other Preschool(v.HS)
Needs Ratio
Parents' Education
Black
Hispanic
-.176***
-.269***
-.153***
-.198***
-.158***
-.149***
-.170***
-.111***
-.114***
-.035**
-.060***
-.088***
-.098***
.223***
.089***
Proportion of VarianceExplained (R2)
Change in R2
.033*** .054***
.022***
.064***
.009***
.108***
.044***
** p < .01; *** p < .001
Where Do Head Start Attendees End Up?
27
Table 6: Results of OLS Regressions of Head Start Effects on Quality ofSchool Attended at 8th Grade: Teacher Student Relations
Staneardized Regression Coefficient
Model1
Model2
Model3
Model4
No Preschool (v. HS)
Other Preschool(v.HS)
Needs Ratio
Parents' Education
Black
Hispanic
.046***
-.020
.056***
.008
-.065***
.057***
.020
-.045***
-.047***
.028*
-.011
-.054***
-.059***
-.047***
-.088***
Proportion of VarianceExplained (R2)
Change in R2
.004*** .008***
.004***
.009***
.002***
.017***
.008***
* p < .05; *** p < .001
31
Where Do Head Start Attendees End Up?
28
Table 7: Results of OLS Regressions of Head Start Effects on Quality ofSchool Attended at 8th Grade: Academic Climate Factor
Standardized Regression Coefficient
Model1
Model2
Model3
Model4
No Preschool (v. HS)
Other Preschool(v.HS)
Needs Ratio
Parents' Education
Black
Hispanic
.081***
.246***
.049***
.145***
.221***
.044**
.110***
.162***
.144***
.009
.076***
.154***
.138***
-.067***
-.037***
Proportion of VarianceExplained (R2)
Change in R2
.037*** .080***
.043***
.095***
.015***
.099***
.004***
** p < .01; *** p < .001
32
Where Do Head Start Attendees End Up?
29
Table 8: Results of OLS Regressions of Head Start Effects on Quality ofSchool Attended at 8th Grade: Composite School Quality Factor
Standardized Regression Coefficient
Model1
Model2
Model3
Model4
No Preschool (v. HS)
Other Preschool(v.aS)
Needs Ratio
Parents' Education
Black
Hispanic
.181***
.417***
.137***
.278***
.307***
.129***
.222***
.214***
.226.:**
.040***
.135***
.193***
.209***
-.098***
-.171***
Proportion of VarianceExplained (R2)
Change in R2
.094*** .176***
.082***
.212***
.036***
.242***
.029***
** p < .01; *** p < .001
Where Do Head Start Attendees End Up?
30
Table 9: Summary of Effect Sizes of Adjusted Head Start Effects on Qualityof 8th Grader's School
Outcome Variable
o School Average SES
o Average Achievement
o Unsafe School Factor
o Positive Teacher-Student Relations
o School Academic Climate
o Composite SchoolQuality Factor
Head Start vs.No Preschool
Head Start vs.Other Preschool
-.11***(a) -.38***
...17*** -.35***
07* .12***
-.06* .02
-.02 -.14***
-.08*** -.28***
o 2 < .05; *** < .001
a. Effect size computed by dividing the unstandardized regressioncoefficient for each outcome variable (from Tables 3-7) by the standarddeviation of the comparison group for that variable.
0.15
0.10
0.05
0.00
-0.0
5
-0.1
0
-0.1
5
-0.2
0
-0.2
5
-0.3
0
-0.3
5
-0.4
0
-0.4
5
5
Scho
olA
vera
ge S
ES
Scho
ol A
vera
geA
chie
vem
ent
Posi
tive
Tea
cher
-St
uden
tR
elat
ions
Scho
olA
cade
mic
Clim
ate
Scho
olQ
ualit
yFa
ctor
Uns
afe
Scho
olFa
ctor
III H
ead
Sta
rt v
s. N
o P
resc
hool
Hea
d S
tart
vs.
Oth
er P
resc
hool
Figu
re 1
: Sum
mar
y of
Eff
ect S
izes
of
Adj
uste
d H
ead
Star
t Eff
ects
on
Qua
lity
of 8
th G
rade
rs' S
choo
ls
BE
ST N
ri A
VA
LU
E
Where po Head Start Attendees End Up?
32
Appendix A: Details of Variable Construction
Independent Variables:
Preschool Experience. A three-level categorical variable was created fromparents' reports of whether or not 8th graders attended Head Start(BYP38C) or any preschool or nursery school 02,YP38B). Students whoseparents responded "yes" to BYP38C were coded as Head Start students,remaining students whose parents responded "yes" to BYP38B were codedas attending Other Preschools. Students whose parents responded "no" toBYP388 or BYP38C were coded in the No Preschool group. Students whoseparents answered BYP388 with "I don't know" or who didn't respond toeither item were dropped from the analysis, resulting in a loss of9,166 students (38.2% of the sample). In regressions, two dummy varia-bles were created, with Head Start as the base group: No-Preschool (vs.Head Start) and Other Preschool (vs. Head Start).
Family Income. Taken from parents' reports of total family income in 1987(BYP80). Categories were recoded into dollar amounts.
Family Size. From parents' report, the total number of parents andsiblings. Used the NELS variable; BYFAMSIZ. Close to normallydistributed, with slight positive skew.
Needs Ratio. Computed by dividing family income by the 1988 figure for theadjusted poverty threshold (using the CPI) for each family size. For
each family size, these figures are: one person: $5,534; two persons:
$7,077; 3 persons: $8,667; four persons: $11,108; five persons:$13,141; six persons: $14,834; seven persons: $16,763; eight persons:$18,628; nine or more persons: $22,169 (Congressional Budget Office,1988). The metric represents the multiple of the poverty thresholdrepresented by each family's income, with higher numbers representinghigher adjusted income. A value of 1.00 suggests family income at thepoverty threshold, values over 1 above the poverty threshold, and lessthan 1 below the poverty threshold.
Parents' Education. From parents' reports (BYPARED), the parent's highestyear of education, recoded into total years of education (i.e., highschool graduation-12, college graduation 16). Close to normallydistributed, with slight positive skew.
Race/Etnicity. Taken from parents' report (RACE). All students whoserace/ethnicity was not reported as Black or Hispanic were coded in theWhite category. In regressions, dummy variables for Black (Black-1,else-0) and Hispanic (Hispanic-1, else-0) were used, with Whites as thecomparison group.
Dependent Variables:
Several steps were involved in creating the dependent variables. First,
variables describing school quality were created on the entire NELS studentsample (i.e., the students missing preschool information were not droppedfrom the aggregations), including student and parent reports about theschool, and were standardized on that sample. Second, these variables wereaggregated to the school level. Third, these aggregates were combined
Where Do Head Start Attendees End Up?
33
with measures from principals into composites. Last, the school-levelaggregates were appended back to the student file, so that each studentrecord contained descriptive information on the school he or she attendedin the 8th grade, created from a random sample of students in the school.These latter variables were used as dependent variables in regressionanalyses. The following describes the components and psychometriccharacteristics of each composite we created.
School Average SES. School-level aggregate of social class z-scorecomposite created from parents' reports (BYSES). The social classmeasure includes family income, parents' education, parents' occupa-tional prestige, and a composite of education-related possessions inthe home. Normally distributed variable.
Average Achievement. School-level aggregate of four student achievementtests (mathematics, science, reading, social studies). On the entireNELS student file, composite test score is standardized to mean-50,SD-10. Normally distributed variable.
Unsafe School Factor. This composite variable is normally distributed withhigh reliability (Cronbach alpha .82). It was created with principalcomponents factor analysis, using varimax rotation. Its 7 componentsinclude 3 measures of students' reports of the seriousness of certainproblems in their schools: physical conflicts among students (BYS58D),student possession of weapons (BYS58J), and physical abuse of teachers(BYS58J); and a positive reponse to students' statement, "I don't feelsafe in this school (BYS59K). It includes parents' response (reversed)to the statement, "My child's school is a safe place" (BYP74I), and 2items taken from principals' descriptions of problems in their schools:possessions of weapons (BYSC49I) and physical abuse of teachers(BYSC49J).
Teacher-Student Relations Factor. This composite variable is normallydistributed with high reliability (Cronbach alpha .90). Created withprincipal components factor analysis, using varimax rotation. Includesstudents' positive responses to 6 items: "Students get along well withteachers".(BY359A), "The teaching in this school is good" (BYS59F),"Teachers are interested in students" (BYS59G), "Teachers praise myefforts" (BYSS59H), "In class I feel put down by teachers" (reversed)(BYS59I), and "Most of my teachers listen to what I say" (BYS59J).
School Academic Climate Factor. This composite variable is normally distri-buted with high reliability (Cronbach alpha .90). It was created withprincipal components factor analysis, using varimax rotation. Its
12 components come from 3 sources: (a) students' reports of serious-ness of certain problems in their schools (student tardiness -- BYS58A;student absenteeism -- BYS58B: students cutting classes BYS58C); (b)the principal's report on the seriousness of the same problems in theschool (BYSC49A, BYSC49B, BYSC49C); and parents' responses to thefollowing statements: "The school places a high priority on learning"(BYP74A), "Homework assigned is worthwhile" (BYP74B), "My child ischallenged in school" (BYP74C), "The school is preparing students wellfor high school" (BYP74G), and "The school is preparing students wellfor college" (BYP74H).
Where Do Head Start Attendees End Up?
34
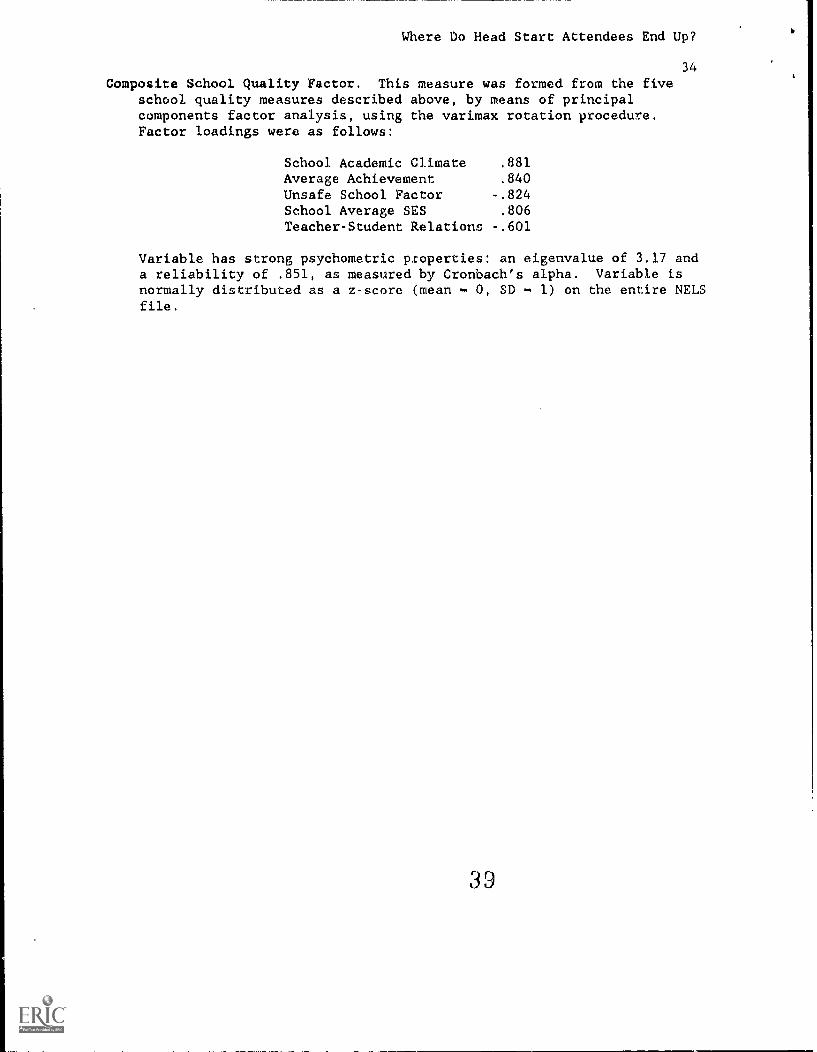
Composite School Quality Factor. This measure was formed from the fiveschool quality measures described above, by means of principalcomponents factor analysis, using the varimax rotation procedure.Factor loadings were as follows:
School Academic Climate .881
Average Achievement .840
Unsafe School Factor -.824
School Average SES .806
Teacher-Student Relations -.601
Variable has strong psychometric properties: an eigenvalue of 3.17 anda reliability of .851, as measured by Cronbach's alpha. Variable isnormally distributed as a z-score (mean - 0, SD - 1) on the entire NELSfile.
39
Where Do Head Start Attendees End Up?
35
Appendix B: Means for MIdel Variables for Included and ExcludedCases (a,b)
a. Virtually all the NELS respondents that were excluded from this studywere those whose parents had either: (a) not responded to the NELS itemBYP38 describing the child's preschool experience, or (b) had responded"I don't know" to that item.