DOCUMENT RESUME ED 395 020 TM 025 037 AUTHOR Wild, Cheryl L.; And Others TITLE Concurrent Validity of Verbal Item Types for Ethnic and Gender Subgroups. GRE Board Professional Report No. 84-10P. INSTITUTION Educational Testing Service, Princeton, N.J. SPONS AGENCY Graduate Record Examinations Board, Princeton, N.J. REPORT NO ETS-RR-89-23 PUB DATE Dec 89 NOTE 48p. PUB TYPE Reports Research/Technical (143) Information Analyses (070) EDRS PRICE MF01/PCO2 Plus Postage. DESCRIPTORS Comparative Analysis; *Concurrent Validity; *Ethnic Groups; Grade Point Average; Higher Education; Majors (Students); Reading Comprehension; Sample Size; *Sex Differences; Test Construction; *Test Items; Test Validity; *Undergraduate Students; *Verbal Tests IDENTIFIERS Analogies; *Graduate Record Examinations ABSTRACT The verbal item types of the Graduate Record Examinations (GRE) were itudied to explore possible reasons for any differences found in subgroup performance and validity. Statistical differences among item types in active forms of the GRE verbal measure were documented; experimental subtests of matching statistical characteristics for the item types were developed; and correlations of the matched and operational item type scores with self-reported grade point averages were compared. Comparisons were made by gender and ethnic group within undergraduate major field categories. Sample sizes ranged from 1,815 to 1,930 for the 8 new test editions between October 1985 and April 1987. Results suggest that all verbal item types studied exhibited concurrent validity, with only small differences among the item types. All the item types were valid, and they were very highly correlated. Because of this overlapping variance, little concurrent validity is lost by deleting any one item type. Reading comprehension items may, overall, be slightly more valid than the other item types; and the analogy item type may contribute slightly less to the concurrent validity of the verbal measure. However, these small differences do not suggest any specific revisions to the verbal measure of the GRE General Test. An appendix discusses equating the item-type subscores. (Contains 16 tables, 2 figures, and 24 references.) (Author/SLD) *********************************************************************** Reproductions supplied by EDRS are the best that can be made from the original document. ***********************************************************************
Transcript
DOCUMENT RESUME
ED 395 020 TM 025 037
AUTHOR Wild, Cheryl L.; And Others
TITLE Concurrent Validity of Verbal Item Types for Ethnicand Gender Subgroups. GRE Board Professional ReportNo. 84-10P.
IDENTIFIERS Analogies; *Graduate Record Examinations
ABSTRACTThe verbal item types of the Graduate Record
Examinations (GRE) were itudied to explore possible reasons for anydifferences found in subgroup performance and validity. Statisticaldifferences among item types in active forms of the GRE verbal
measure were documented; experimental subtests of matchingstatistical characteristics for the item types were developed; andcorrelations of the matched and operational item type scores withself-reported grade point averages were compared. Comparisons weremade by gender and ethnic group within undergraduate major fieldcategories. Sample sizes ranged from 1,815 to 1,930 for the 8 new
test editions between October 1985 and April 1987. Results suggest
that all verbal item types studied exhibited concurrent validity,
with only small differences among the item types. All the item types
were valid, and they were very highly correlated. Because of thisoverlapping variance, little concurrent validity is lost by deleting
any one item type. Reading comprehension items may, overall, be
slightly more valid than the other item types; and the analogy item
type may contribute slightly less to the concurrent validity of the
verbal measure. However, these small differences do not suggest anyspecific revisions to the verbal measure of the GRE General Test. An
appendix discusses equating the item-type subscores. (Contains 16
tables, 2 figures, and 24 references.) (Author/SLD)
Copyright 1989 by Educational Testing Service. All rights reserved.
Concurrent Validity of Verbal Item Types
For Ethnic and Gender Subgroups
ABSTRACT
The validity of the Graduate Record Examinations (GRE) has been a high-priority research topic. Research to date concerning the GRE verbalmeasure suggests that for the GRE, as for the Scholastic Aptitude Test,the reading comprehension and sentence completion item types appear tocarry the weight of the predictive validity of the verbal measure.However, this finding may have been a result of differences in difficultyand discrimination (as suggested by Schrader [1984a]), rather than aresult of inherent differences in the item types.
The purpose of the present study was to examine the verbal item types forthe GRE to explore possible reasons for any differences found in subgroupperformance and validity. Statistical differences among item types inactive forms of the GRE verbal measure were documented, experimentalsubtests of matching statistical characteristics for the item types weredeveloped, and correlations of the matched and operational item typescores with self-reported grade point averages wer compared.Comparisons were made by gender and ethnic group within undergraduatemajor field categories.
The results of this study suggest that all the verbal item types studiedexhibit concurrent validity. Differences among the item types are small.All the item types are valid, and they art very highly correlated.
Because of this overlapping variance, little concurrent validity is lostby deleting any one item type. Results suggest that, of the four itemtypes, reading comprehension may, overall, be slightly more valid thanthe other item types. The analogy item type may contribute slightly lessthan the other item types to the concurrent validity of the verbalmeasure. However, these differences are small and do not suggest anyspecific revisions to the verbal measure of the GRE General Test.
CONCURRENT VALIDITY OF VERBAL ITEM TYPES
FOR ETHNIC AND GENDER SUBGROUPS
Cheryl L. Wild, W. Miles Ma:seek, and Stephen L. Kofflerwith Henry I. Braun and William Cowell
The purpose of the study described in this paper was to ilivtJtigate theconcurrent validity of the item types in the Graduate RecordExaminations (GRE) General Test verbal measure within various ethnic andgender subgroups. The present study provides information about one ofthe relevant factors necessary to help assess whether the item types inthe verbal measure are appropriate for use in the examination. In
deciding whether an item type is appropriate for continued use in anexamination, it is important to consider a number of factors in additionto concurrent validity. Among these additional factors are reliability,time available for testing, predictive validity, construct validity,appropriateness of the distribution of item difficulties, face validity,and impact on subgroups. Thus, results from this study will provide onlya partial indication of the continuing appropriateness of the existingtest specifications for the verbal section of the GRE General Test.
LITERATURE REVIEW
The literature review is divided into three major parts. The first
presents an overview of all the GRE Tests and discusses the purpose ofthe verbal measure. Because the current interest in item type validityfirst surfaced in research on the SAT verbal measure, the SAT literatureis reviewed next. The GRE verbal measure consists of the same item typesas the SAT verbal measure, thus, findings about the SAT verbal measurecould have important implications for the GRE General Test. Finally, the
research on the verbal measure of the GRE General Test is discussed.
Background of the GRE Tests
The Graduate Record Examinations are administered to applicants tograduate and professional schools, and scores are typically used bygraduate admissions committees and fellowship sponsors as one of severalpieces of information in making admissions decisions.
The program offers a General Test and 17 Subject Tests intended forstudents who have majored as undergraduates in the subjects the tests
measure. The GRE General Test measures verbal, quantitative, andanalytical abilities and consists of seven 30-minute sections. Six
sections of the General Test contribute to the examinees' test scores;one unidentified, separately timed section has trial questions that are
not included in the examinees' test scores.
The verbal component of the General Test is the central focus of thispaper and is described in the 2988-l989 Gn Information Bulletin:
2
The verbal ability measure is designed to test one's ability toreason with words in solving problems. Reasoning effectively in averbal medium depends primarily upon the ability to discern,comprehend, and analyze relationships among words or groups ofwords and within larger units of discourse such as sentences andwritten passages....
The verbal measure consists of four question types: analogies,antonyms, sentence completions, and reading comprehension sets....
Analogy questions test the ability to recognize relationships amongwords and the concepts they represent and to recognize when theserelationships are parallel....
Although antonym questions test knowledge of vocabulary moredireetly than do any of the other verbal question types, thepurpose of the antonym questions is to measure not merely thestrength of one's vocabulary but also the ability to reason from agiven concept to its opposite....
The purpose of the sentence completion questions is to measure theability to recognize words or phases that both logically andstylistically complete the meaning of a sentence....
The purpose of the reading comprehension questions is to measurethe ability to read with understanding, insight, anddiscrimination. This type of question explores the examinee'sability to analyze a written passage from several perspectives,including the ability to recognize both explicitly stated elementsin the passage and assumptions underlying statements or argumentsin the passage as well as the implications of those statements orarguments... (p. 28-31).
Research about the SAT Verbal Measure
The major impetus for focusing on verbal item type research for the GREoriginates from findings from the College Board Validity Study Service.Ramist (1981), in a routine compilation of validity results for theCollege Board, found that the reading subscore of the SAT (readingcomprehension and sentence completion item types) correlated higher withfreshman grade point average than did the vocabulary subscore (antonymand analogy item types). This indicated that the reading subscore mighthave greater predictive validity than the vocabulary subscore.
Ramist reported the results from 96 colleges that conducted validitystudies in which the subscores were predictors. For those colleges, thereading subscore was almost identical to the full SAT verbal score withrespect to average correlations with the freshman grade point average.In fact, In 441 of the schools, the reading subscore correlation withgrade point average was actually higher than the total verbal scorecorrelation. Similar mean correlations with the verbal subscore as .predictors were considerably lower. The average zero order correlations
3
were as follows:
SAT Verbal Score .374
Reading Subscore .370
Vocabulary Subscore .320
In a related study, Schrader (1984a) found that, for the SAT, vocabularyitem types provided a substantially greater number of difficult itemsthan did the reading item types. Schrader's results suggest that antonymand analogy items are likely to have lower biserial correlations thanreading comprehension and sentence completion items. However, thisfinding is not conclusive because these differences could have resultedin part from the manner in which items were selected for the test.Specifically, antonym and analogy items are typically used to obtain thedifficult items required by the test specifications. Since, for all itemtypes, more difficult items tend to have lower biserials, the finding maybe an artifact of the differences in the spread of difficulties among theitem types. Further, interpretation of the results is complicated by thefact that subscores are not based on separately timed sections.
Evidence from another SAT study conducted by Schrader (1984b) suggestedthat the relative validities of vocabulary and reading subscores varywith different criteria. In that study, Schrader reported highercorrelations for vocabulary subscores than for reading subscores withessay, multiple-choice, and total composition scores on the EnglishComposition Test and with the Test of Standard Written English. However,he found higher correlations for reading subscores than for vocabularysubscores with other Achievement Test scores, high school rank and self-reported course grades.
In a third related study, Schrader (1984c) examined the validity of theSAT verbal item types for predicting first-year grades. He obtainedsimple and multiple correlations for the four item types when scores werebased on all items of each type and when scores were based on subsets ofeight items of each type matched for difficulty. Although the resultsfrom this study must be interpreted with caution because only one editionof the SAT verbal measure was studied, the results indicated that thefour item types are about equal in predictive validity when differencesin difficulty are controlled.
In summary, the reading comprehension and sentence completion item types(the reading subscore) tend to carry the weight of the predictivevalidity of the verbal measure of the SAT. However, this finding may bea result of differences in difficulty and discrimination (as suggested bySchrader's studies), rather than a result of inherent differences in theitem types.
GRE General Test Research
There has been less research conducted about the differential validity ofthe GRE vocabulary and reading item types than there has been for theSAT. Differences such as those observed for the SAT would not appear in
4
routine GRE validity or summary data reports because subscores are notreported for the GRE General Test. Further, it would be difficult toobtain and interpret predictive validity results from existing databecause sample sizes for GRE validity data are small and subscores wouldhave to be obtained frcm a test not constructed to report them. As a wayof addressing the sample size difficulties, GRE studies on verbal itemtypes have generally used a concurrent validity approach (i.e., examiningthe relationship between a predictor and a criterion measure obtained atthe same time as the predictor).
Wilson (1984) examined the relative contribution of a vocabulary subscore(composed of antonym and analogy items) and a reading subscore (composedof sentence completion and reading comprehension items) based on the GREverbal measure to the prediction of self-reported undergraduate gradepoint average (SR-UGPA) for students in 12 undergraduate major fields.Wilson's results for the GRE were comparable to Ramist's findings on theSAT. Reading subscore correlations with SR-UGPA were about .04 higherthan the vocabulary subscore correlations (.30 vs. .26). Combining thetwo item types increased the correlations with SR-UGPA by less than .01.However, scores were derived from items in existing test editions, and,therefore, there was no control for item difficulty or item-testcorrelation. And, as Schrader (1984c) showed, the differences may beconfounded by differences in difficulty and item-test correlation.
Wilson (1986) extended his previous study and investigated thepossibility that item type validity might vary by sex or ethnic group,but he did not control for differences in difficulty or item-testcorrelation of the various item types. Rock, Werts, and Grandy (1982)examined the psychometric properties of the GRE item types for Blackfemale, Black male, White female, and White male social science majors.In both studies there was no evidence of psychometric bias in any of theitem types.
Thus, the research for the GRE suggests that, as for SAT, the readingcomprehension and sentence completion item types appear to carry theburden of the predictive validity of the verbal measure. However,similar to the SAT findings, this result may be a consequence ofdifferences in difficulty and discrimination instead of variations in theitem types.
Procedures for the current study were developed based on the literaturereviewed above and are described in detail in the next section.
PROCEDURES
rurDose and Overview
The purpose of this study was to investigate the validity of the itemtypes in the GRE verbal measure within various ethnic and gendersubgroups. Previous research about the item type validity issue (Wilson,1984) was based on item type scores constructed from operational testforms. Although the study's results were informative, subscores obtainedfrom operational test forms confound differences in item type validity
5
with the differences in difficulty and discrimination of the items chosen
for inclusion in a particular test. Operational tests are assembled tohave prespecified average difficulties, spreads of difficulty, andaverage discrimination indices. Since the reading comprehension itemsare in sets, there is usually less flexibility in adjusting the
difficulty in these items. Thus, the discrete items are usually used toadjust the statistical characteristics of a test form in order to meet
the statistical specifications.
To avoid this confounding, experimental subtests of different item typeswith matching statistical characteristics were developed for this studyand administered with an operational test. To better understand theimplications of the results of the experimental data for operationaltests, comparisons between existing GRE test editions and experimentaleditions are made. Thus, the data analysis can be divided into two majorparts: (1) an analysis of the statistical characteristics of item typesin existing and experimental GRE test editions and (2) an analysis ofmultiple correlations of item type subscores with self-reportedundergraduate grade point averages.
The analysis of the statistical characteristics will address thefollowing questions:
1. What are the mean item difficulties and mean item-testcorrelations (correlations with the total 76-item verbal score) forthe reading comprehension, sentence completion, analogy, andantonym item types in existing editions of the GRE verbal measure?Do these vary from edition to edition?
2. What are the mean item difficulties and mean item-testcorrelations (correlations with the 64-item experimental score) forthe reading comprehension, sentence completion, analogy, andantonym item types in the experimental editions? How do these
compare to each other and to those of operational editions?
The multiple correlational analyses will address the following questions:
3. When matched on statistical characteristics, do readingcomprehension, sentence completion, analogy, and antonym item typescontribute equally to the concurrent validity of the GRE verbalmeasure?
4. Are there differences in the concurrent validity of readingcomprehension, sentence completion, analogy, and antonym item typesfor Black female, Black male, Hispanic female, Hispanic male, Whitefemale, and White male groups?
5amples
Statistical characteristics of operational verbal item types wereobtained from test analysis reports for eight GRE General Test finalforms (Cowell & Tessema, 1986a, b, c, d; Cowell, Tessema, & Black, 1987a,
b, c, d). These reports are based on spaced samples of all examinees at
6
the first administrations of a test. The sample sizes ranged from 1,815to 1,930 for the eight new test editions given between October 1985 andApril 1987.
Data on the experimental subtests were collected from three GREadministrations to obtain a sufficiently large sample size for minoritygroups. Analyses were based on native English-speaking examinees testedin June 1985, December 1985, and February 1986. No attempt was made toselect only recent college graduates. Ethnic group, gender, self-reported undergraduate grade point average (SR-UGPA), undergraduate majorfield, and undergraduate institution were determined from responses tothe questions asked of examinees when they register for the test. Blackfemale, Black male, Hispanic female, Hispanic male, White female, andWhite male groups had sufficiently large sample sizes for inclusion inthe correlational analyses.
Regression analyses were computed for each undergraduate institutionseparately to avoid the problems of comparability created by poolinggrades across institutions. Of the 91,562 total examinees, 83,843indicated the uadergraduate institutions they attended. They attended2,193 different institutions. For the purposes of this study, it wasdetermined that the 300 undergraduate institutions with the greatestnumber of examinees would be used. Sixty-six percent of the totalexaminees attended these institutions. From the pool of 300institutions, those attended by at least 10 examinees of the specificethnic-by-gender combination (e.g., Black females) were included in thatethnic group-by-gender analysis.
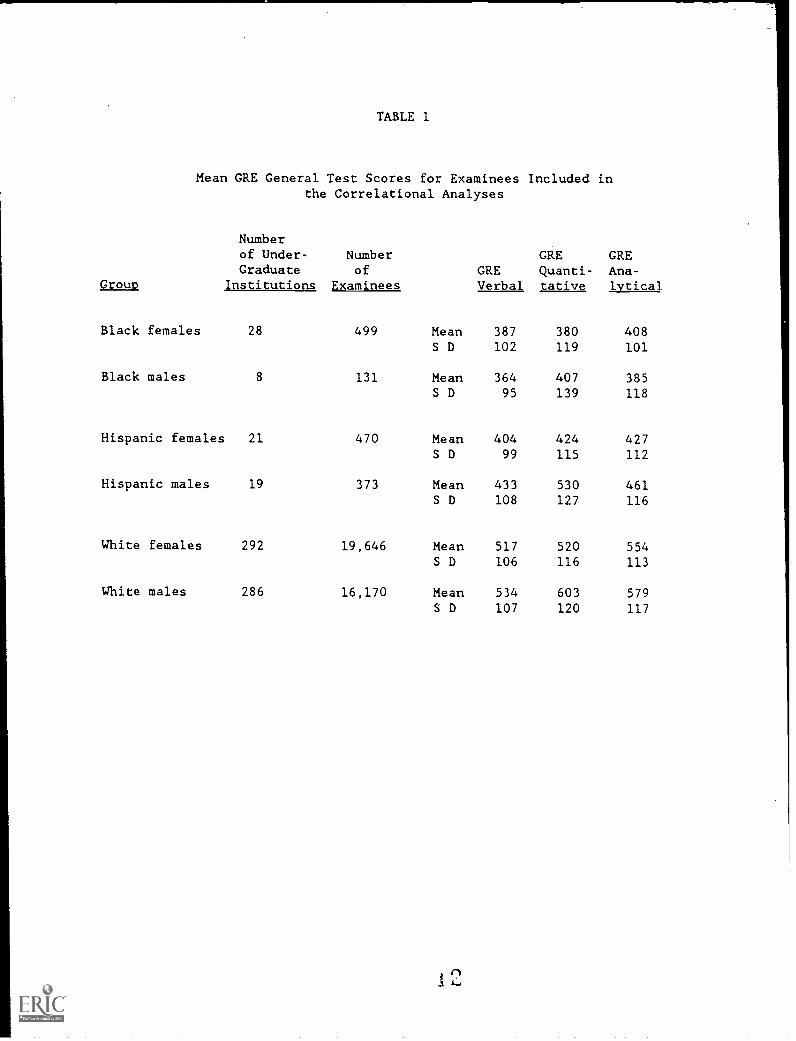
Table 1 summarizes the mean GRE General Test scores for the examineesactually included in the data analysis. For example, among the 300institutions, 292 had at least 10 White female native English-speakingexaminees for a total of 19,646 female examinees. The Black malesconstituted the smallest sample, 131 examinees from 8 undergraduateinstitutions.
Comparison of the GRE General Test scores for examinees in this studywith those from summaries of test takers across a three-year period(Educational Testing Service, 1986) suggests that this sample iscomparable in performance to a national sample of test takers. In thenational sample, women performed best on the analytical score and menperformed best on the quantitative score. This pattern is also presentin the data collected for this study. Mean scores by ethnic group arealso generally comparable to those of the national sample.
Experimental Subtests
Sixteen-item subtests of each of the four verbal item types (readingcomprehension, sentence completion, analogy and antonym) were constructedfor this study. The subtests had the same statistical and subject matterspecifications--i.e., the same mean and standard deviation of difficulty,the same mean biserial correlation, and the same balance of science andnonscience content. It was desirable to obtain scores on all four itemtypes for each examinee. However, only one 30-minunk experimental
1 1 \C"
TABLE 1
Mean GRE General Test Scores for Examinees Included inthe Correlational Analyses
Numberof Under-Graduate
Numberof GRE
GREQuanti-
GREAna-
Group Institutions Examinees Verbal tative lvtical
Black females 28 499 Mean 387 380 408S D 102 119 101
Black males 8 131 Mean 364 407 385S D 95 139 118
Hispanic females 21 470 Mean 404 424 427S D 99 115 112
Hispanic males 19 373 Mean 433 530 461S D 108 127 116
White females 292 19,646 Mean 517 520 554S D 106 116 113
White males 286 16,170 Mean 534 603 579
S D 107 120 117
8
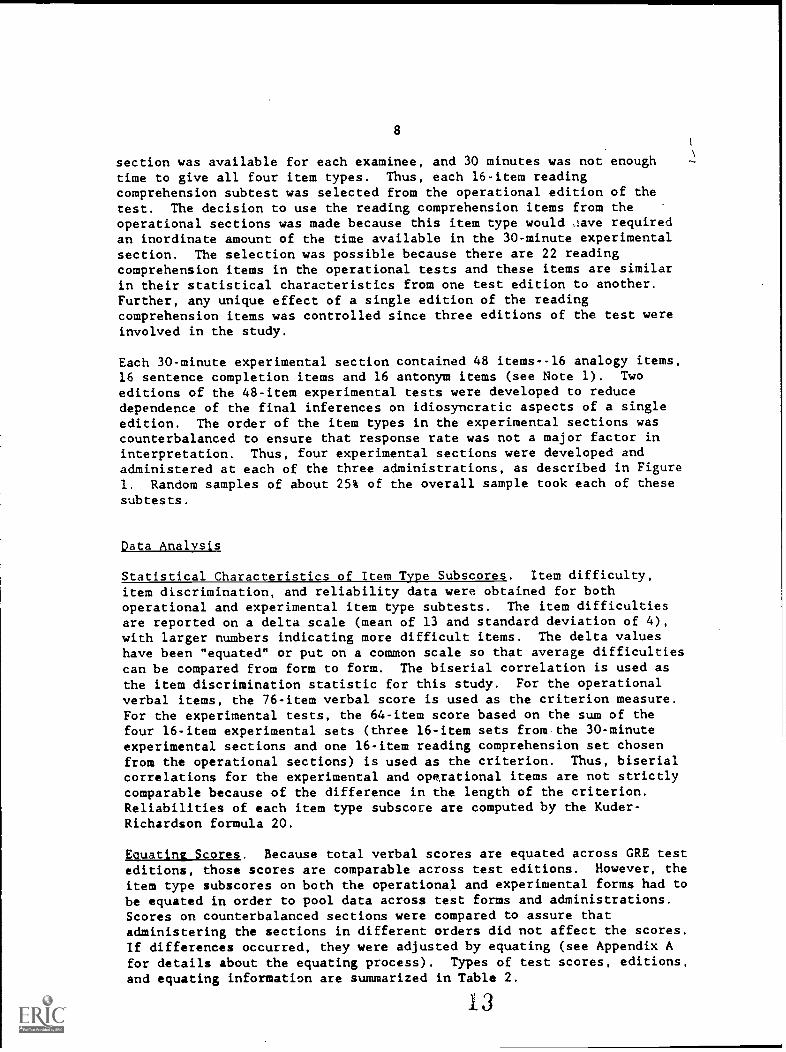
section was available for each examinee, and 30 minutes was not enoughtime to give all four item types. Thus, each 16-item readingcomprehension subtest was selected from the operational edition of thetest. The decision to use the reading comprehension items from theoperational sections was made because this item type would ,lave requiredan inordinate amount of the time available in the 30-minute experimentalsection. The selection was possible because there are 22 readingcomprehension items in the operational tests and these items are similarin their statistical characteristics from one test edition to another.Further, any unique effect of a single edition of the readingcomprehension items was controlled since three editions of the test wereinvolved in the study.
Each 30-minute experimental section contained 48 items--16 analogy items,16 sentence completion items and 16 antonym items (see Note 1). Twoeditions of the 48-item experimental tests were developed to reducedependence of the final inferences on idiosyncratic aspects of a singleedition. The order of the item types in the experimental sections wascounterbalanced to ensure that response rate was not a major factor ininterpretation. Thus, four experimental sections were developed andadministered at each of the three administrations, as described in Figure1. Random samples of about 25% of the overall sample took each of thesesubtests.
Data Analysis
Statistical Characteristics of Item Type Subscores. Item difficulty,item discrimination, and reliability data were obtained for bothoperational and experimental item type subtests. The item difficultiesare reported on a delta scale (mean of 13 and standard deviation of 4),with larger numbers indicating more difficult items. The delta valueshave been "equated" or put on a common scale so that average difficultiescan be compared from form to form. The biserial correlation is used asthe item discrimination statistic for this study. For the operationalverbal items, the 76-item verbal score is used as the criterion measure.For the experimental tests, the 64-item score based on the sum of thefour 16-item experimental sets (three 16-item sets from the 30-minuteexperimental sections and one 16-item reading comprehension set chosenfrom the operational sections) is used as the criterion. Thus, biserialcorrelations for the experimental and opexational items are not strictlycomparable because of the difference in the length of the criterion.Reliabilities of each item type subscore are computed by the Kuder-Richardson formula 20.
Bouating Scores. Because total verbal scores are equated across GRE testeditions, those scores are comparable across test editions. However, theitem type subscores on both the operational and experimental forms had tobe equated in order to pool data across test forms and administrations.Scores on counterbalanced sections were compared to assure thatadministering the sections in different orders did not affect the scores.If differences occurred, they were adjusted by equating (see Appendix Afor details about the equating process). Types of test scores, editions,and equating information are summarized in Table 2.
13
Order 1
Order 2**
FIGURE 1
Experimental Section Design
Questions Edition 1 (H61)* Edition 2 (H62)
1-16 Antonym I Antonym II
17-32 Sentence Completion I Sentence Completion II
33-48 Analogy I Analogy II
Questions Edition 1 (H63) Edition 2 (H64)
1-16 Analogy I Analogy II
17-32 Sentence Completion I Sentence Completion II
33-48 Antonym I Antonym II
*H61, H62, H63, and 1-164 refer to the particular experimental form designations.
**Note that Order 2 is a counterbalancec form of Order 1.
15
TABLE 2
Summary of Type of Test Scores, Editions, and Eguatings
Number of
Subset of
Number of Counterbalanced Possible
Score
Items
Which Score Editions
Orders
Equatings
1.
Verbal Total
76
14
04*
2.
Reading Comprehension
22
14
04
Operational (RC-0)
3.
Sentence Completion
14
14
04
Operational (SC-0)
4. Analogies --
18
14
04
Operational (ANA-0)
5. Antonyms -- Operational
22
14
04
(ANT-0)
6.
Reading Comprehension
16
1,2
40
4
Matched (RC-M, 16-item
subset of RC-0)
7.
Sentence Completion
Matched (SC-M, 16 items
from the experimental
section)
16
8.
Analogies Matched (ANA-
16
M, 16 items from the
experimental section)
9.
Antonyms Matched (ANT-
16
M,
16 items from the
experimental section)
*Operational forms are already equated.
2 2 2
24
24
24
11
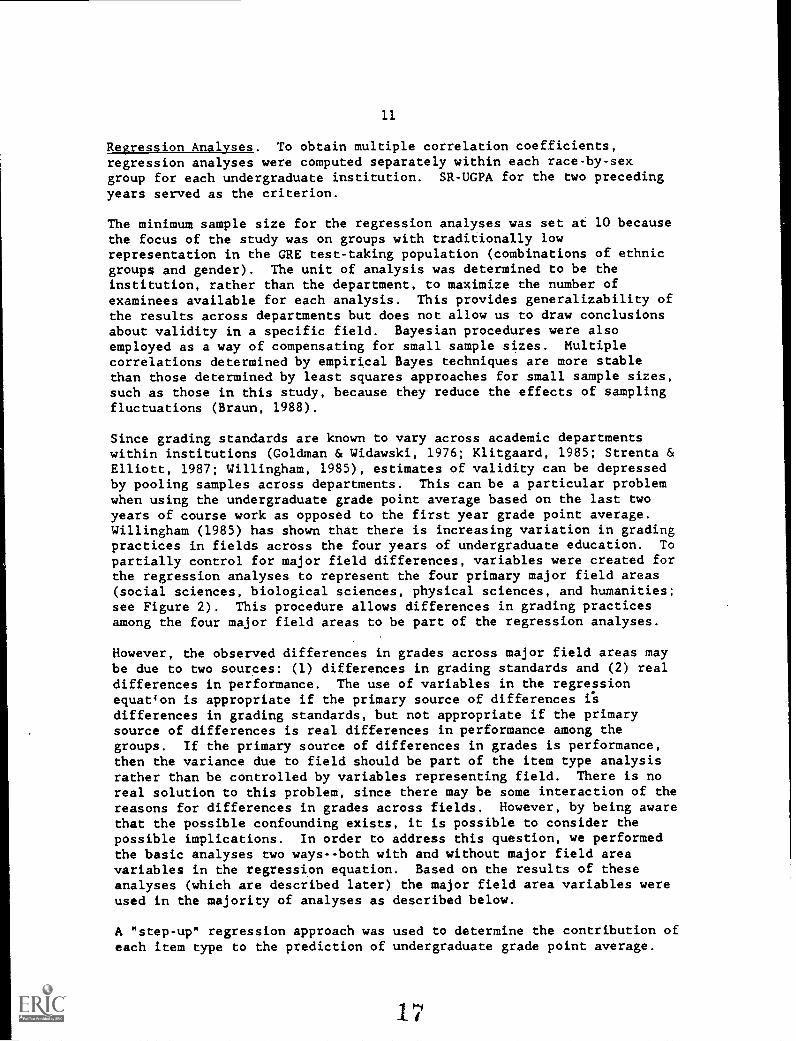
Regression Analyses. To obtain multiple correlation coefficients,regression analyses were computed separately within each race-by-sexgroup for each undergraduate institution. SR-UGPA for the two precedingyears served as the criterion.
The minimum sample size for the regression analyses was set at 10 becausethe focus of the study was on groups with traditionally lowrepresentation in the GRE test-taking population (combinations of ethnicgroups and gender). The unit of analysis was determined to be theinstitution, rather than the department, to maximize the number ofexaminees available for each analysis. This provides generalizability ofthe results across departments but does not allow us to draw conclusionsabout validity in a specific field. Bayesian procedures were alsoemployed as a way of compensating for small sample sizes. Multiplecorrelations determined by empirical Bayes techniques are more stablethan those determined by least squares approaches for small sample sizes,such as those in this study, because they reduce the effects of samplingfluctuations (Braun, 1988).
Since grading standards are known to vary across academic departmentswithin institutions (Goldman & Widawski, 1976; Klitgaard, 1985; Strenta &Elliott, 1987; Willingham, 1985), estimates of validity can be depressedby pooling samples across departments. This can be a particular problemwhen using the undergraduate grade point average based on the last twoyears of course work as opposed to the first year grade point average.Willingham (1985) has shown that there is increasing variation in gradingpractices in fields across the four years of undergraduate education. To
partially control for major field differences, variables were created forthe regression analyses to represent the four primary major field areas(social sciences, biological sciences, physical sciences, and humanities;see Figure 2). This procedure allows differences in grading practicesamong the four major field areas to be part of the regression analyses.
However, the observed differences in grades across major field areas maybe due to two sources: (1) differences in grading standards and (2) realdifferences in performance. The use of variables in the regressionequat4on is appropriate if the primary source of differences ildifferences in grading standards, but not appropriate if the primarysource of differences is real differences in performance among thegroups. If the primary source of differences in grades is performance,then the variance due to field should be part of the item type analysisrather than be controlled by variables representing field. There is noreal solution to this problem, since there may be some interaction of thereasons for differences in grades across fields. However, by being awarethat the possible confounding exists, it is possible to consider thepossible implications. In order to address this question, we performedthe basic analyses two ways--both with and without major field areavariables in the regression equation. Based on the results of theseanalyses (which are described later) the major field area variables wereused in the majority of analyses as described below.
A "step-up" regression approach was used to determine the contribution ofeach item type to the prediction of undergraduate grade point average.
1"
FIGURE 2
Fields Classified as Humanities, Social Sciences,
Biological Sciences, and Physical Sciences
HUMANITIES
SOCIAL SCIENCES,
BIOLOGICAL SCIENCES
Archaeology
continued
Agriculture
Architecture
Education (including
Anatomy
Art History
M.A. in Teaching)
Audiology
Classical Languages
Educational
Bacteriology
Comparative Literature
AdMinistration
Biochemistry
Dramatic Arts
Geography
Biology
English
Government
Biomedical Sciences
Far Eastern Languages
Guidance and Counseling Biophysics
and Literature
History
Botany
Fine Arts, Art, Design Industrial Relations
Dentistry
French
and Personnel
Entomology
German
International
Environmental
Linguistics
Relations
Science/Ecology
Music
Journalism
Forestry
Near Eastern Languages Law
Genetics
and Literature
Library Science
Home Economics
Philosophy
Physical Education
Hospital and Health
Religious Studies or
Planning (City, Commu-
Services
Religion
nity, Urban, Regional)Administration
Russian/Slavic Studies Political Science
Medicine
Spanish
Psychology, Clinical
Microbiology
Speech
Psychology,
Other Foreign Languages Educational
Other Humanities
Psychology, Experi-
mental/Developmental
SOCIAL SCIENCES
Psychology, Other
American Studies
Psychology, Social
Anthropology
Public Administration
Business and Commerce
Social Work
Communications
Sociology
Economics
Other Social Sciences
From 1986-87 GRE Information bulletin
BIOLOGICAL SCIENCES,
continued
Public Health
Speech-Language
Pathology
Veterinary Medicine
Zoology
Other Biological
Sciences
PHYSICAL SCIENCES
Applied Mathematics
Astronomy
Chemistry
Computer Sciences
Engineering,
Aeronautical
Engineering, Chemical
Engineering, Civil
Engineering, Electrical
Engineering, Industrial
Engineering, Mechanical
Molecular And Cellular Engineering, Other
Biology
Geology
Nursing
Mathematics
Nutrition
Metallurgy
Occupational Therapy
Oceanography
Pathology
Physics
Pharmacology
Statistics
Pharmacy
Other Physical Sciences
Physical Therapy
Physiology
13
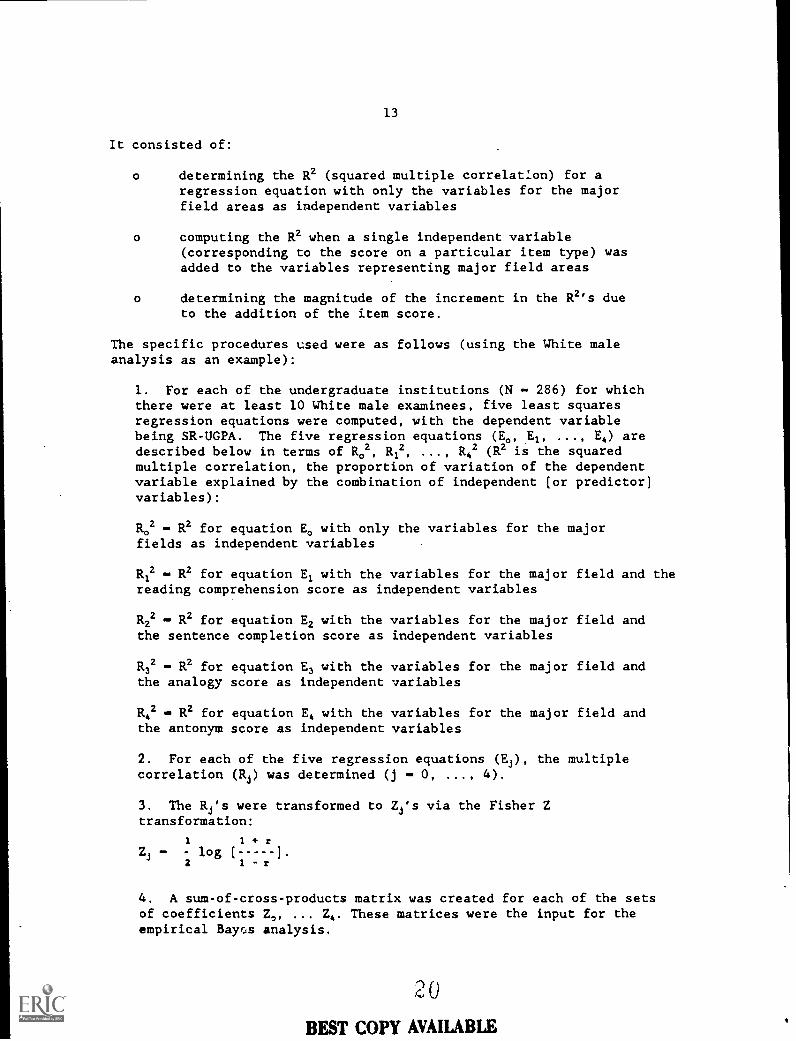
It consisted of:
o determining the R2 (squared multiple correlation) for aregression equation with only the variables for the majorfield areas as independent variables
o computing the R2 when a single independent variable(corresponding to the score on a particular item type) wasadded to the variables representing major field areas
o determining the magnitude of the increment in the R2's dueto the addition of the item score.
The specific procedures used were as follows (using the White maleanalysis as an example):
1. For each of the undergraduate institutions (N 286) for whichthere were at least 10 White male examinees, five least squaresregression equations were computed, with the dependent variablebeing SR-UGPA. The five regression equations (E., El, ..., E4) aredescribed below in terms of R02, R12, ..., R42 (R2 is the squaredmultiple correlation, the proportion of variation of the dependentvariable explained by the combination of independent [or predictor]variables):
R.2 R2 for equation E. with only the variables for the majorfields as independent variables
R12 R2 for equation El with the variables for the major field and thereading comprehension score as independent variables
R22 R2 for equation E2 with the variables for the major field andthe sentence completion score as independent variables
R32 R2 for equation E2 with the variables for the major field andthe analogy score as independent variables
R42 . R2 for equation E4 with the variables for the major field andthe antonym score as independent variables
2. For each of the five regression equations (Es), the multiplecorrelation (Rd was determined (j 0, ..., 4).
3. The Ri's were transformed to Zj's via the Fisher Ztransformation:
1 1 rZj - log [
2 1 - r
4. A sum-of-cross-products matrix was created for each of the setsof coefficients Z,, Z. These matrices were the input for theempirical Bayr,s analysis.
20
BEST COPY AVAILABLE
14
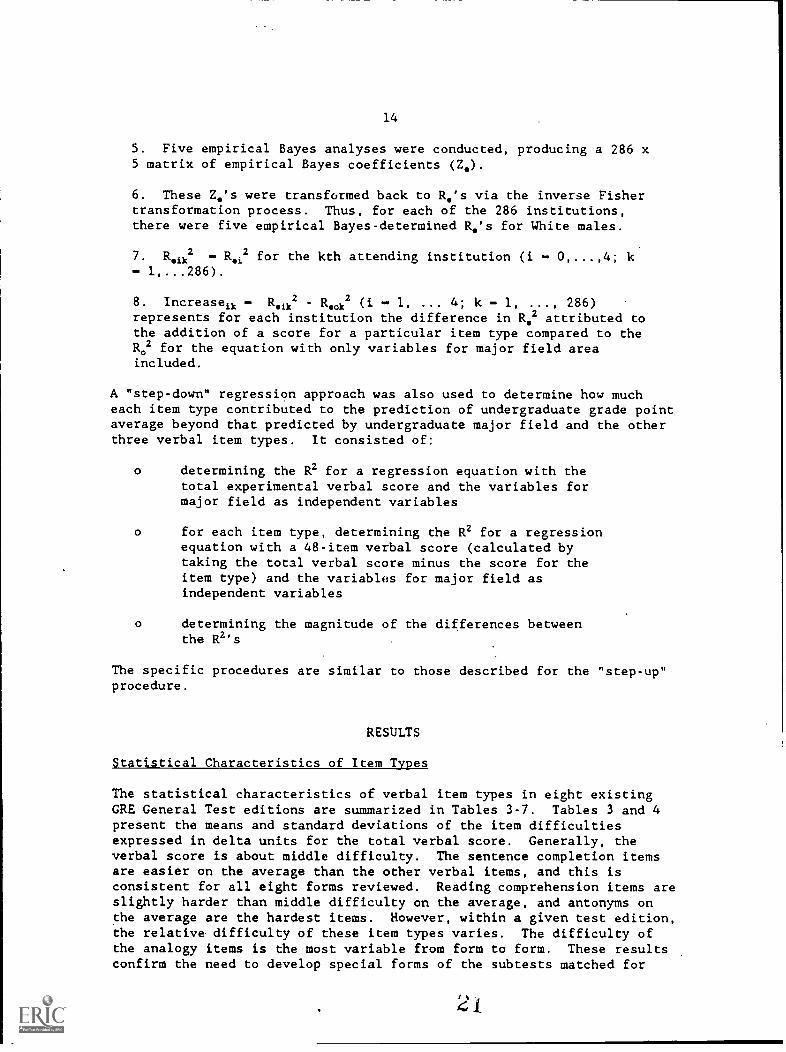
5. Five empirical Bayes analyses were conducted, producing a 286 x5 matrix of empirical Bayes coefficients (Z.).
6. These Z.'s were transformed back to R's via the inverse Fishertransformation process. Thus, for each of the 286 institutions,there were five empirical Bayes-determined R.'s for White males.
7. R 112 R.i2 for the kth attending institution (i 0,...,4; k
8. Increaseik ..., 286)Ripik2 Reok2 1, 4; k 1,represents for each institution the difference in R,2 attributed tothe addition of a score for a particular item type compared to theR02 for the equation with only variables for major field areaincluded.
A "step-down" regression approach was also used to determine how mucheach item type contributed to the prediction of undergraduate grade pointaverage beyond that predicted by undergraduate major field and the otherthree verbal item types. It consisted of:
o determining the R2 for a regression equation with thetotal experimental verbal score and the variables formajor field as independent variables
o for each item type, determining the R2 for a regressionequation with a 48-item verbal score (calculated bytaking the total verbal score minus the score for theitem type) and the variables for major field asindependent variables
o determining the magnitude of the differences betweenthe R2's
The specific procedures are similar to those described for the "step-up"procedure.
RESULTS
Statistical Characteristics of Item Types
The statistical characteristics of verbal item types in eight existingGRE General Test editions are summarized in Tables 3-7. Tables 3 and 4present the means and standard deviations of the item difficultiesexpressed in delta units for the total verbal score. Generally, theverbal score is about middle difficulty. The sentence completion itemsare easier on the average than the other verbal items, and this isconsistent for all eight forms reviewed. Reading comprehension items areslightly harder than middle difficulty on the average, and antonyms onthe average are the hardest items. However, within a given test edition,the relative difficulty of these item types varies. The difficulty ofthe analogy items is the most variable from form to form. These resultsconfirm the need to develop special forms of the subtests matched for
2i
TABLE 3
Means of Equated Deltas and Difference of the Mean of the Equated Deltasof Each Item-Type Subset from the Mean of the Equated Deltas of Total Verbal
by Test Form
Mean Equated Delta Differences from Mean Deltaof Total Verbal
Delta is an index of item difficulty related to the proportion correct, p.Delta 13 + 4z, where z is the standard normal deviate corresponding to thearea under the normal curve of 1-p. Values of delta range from 6 for very easyitems to 20 for very difficult items. Middle difficulty for an item is definedas the level at which half of the group would know the answer and theremaining half would guess at random. For the verbal sections, composed of5-choice items, middle difficulty reference delta is 12.0.
The equated delta for an item is the estimated difficulty level of theitem for the GRE reference group; a spaced sample of those who took Forms3DGR1, 3DGR2, or 31=3 of the GRE General Test at the October 1981administration.
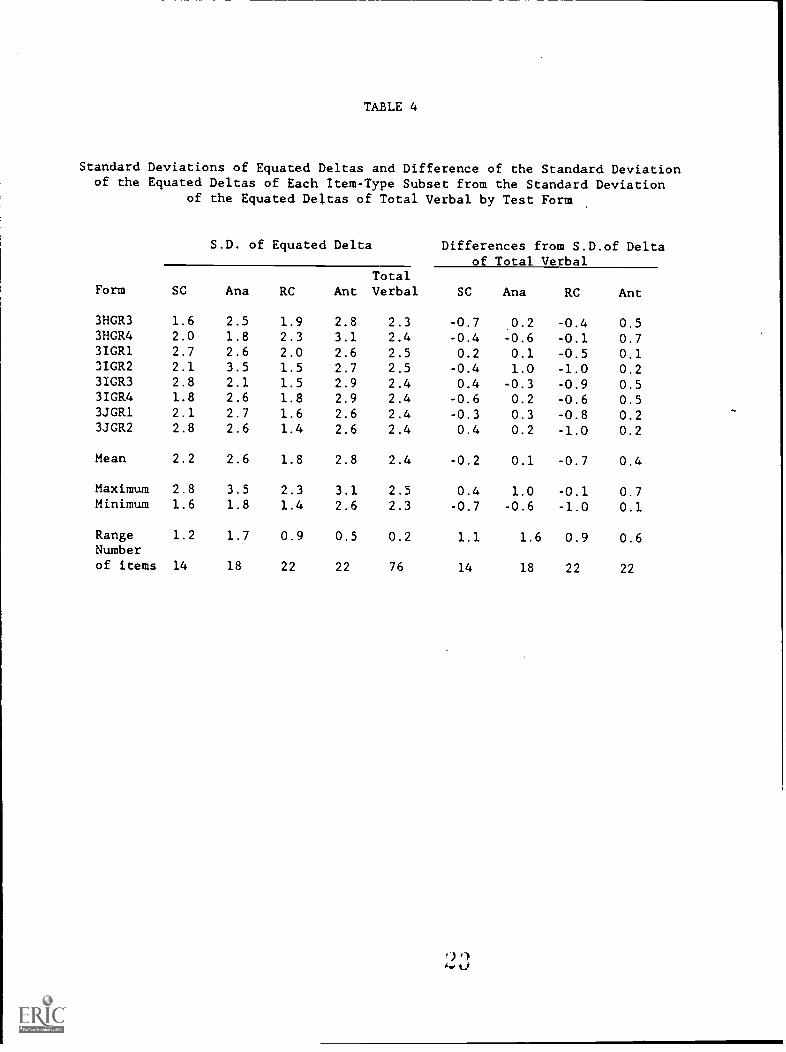
TABLE 4
Standard Deviations of Equated Deltas and Difference of the Standard Deviationof the Equated Deltas of Each Item-Type Subset from the Standard Deviation
of the Equated Deltas of Total Verbal by Test Form
Form
S.D. of Equated Delta Differences from S.D.of Deltaof Total Verbal
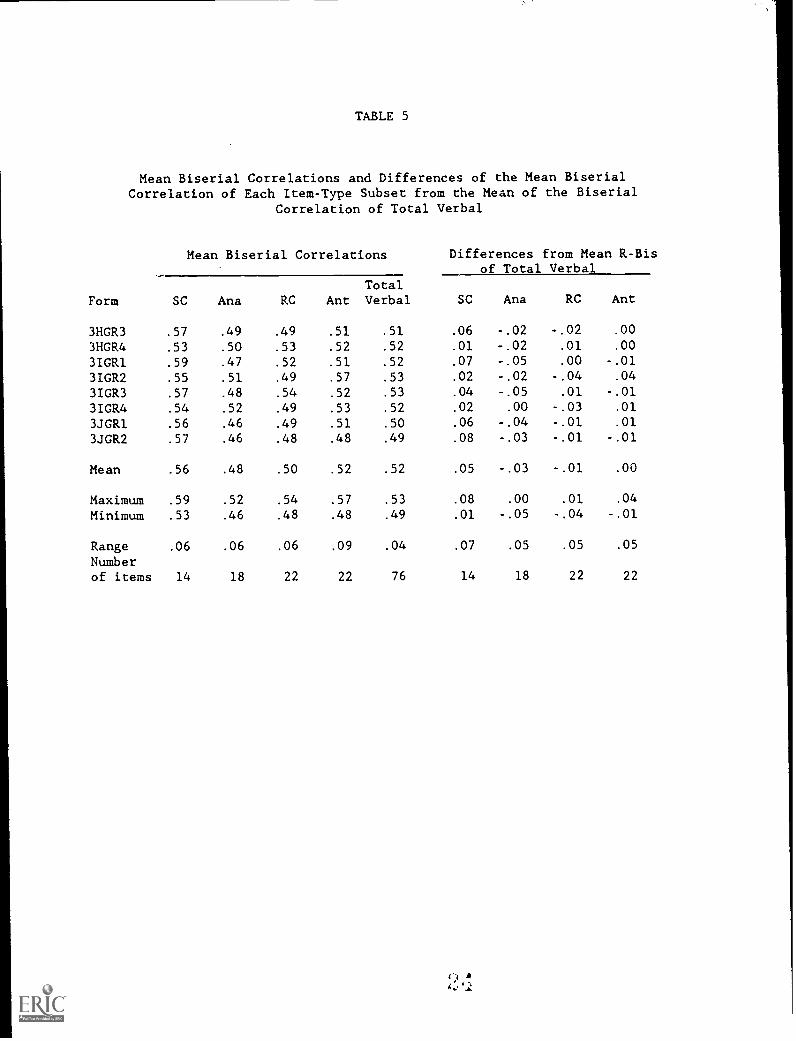
Mean Biserial Correlations and Differences of the Mean BiserialCorrelation of Each Item-Type Subset from the Mean of the Biserial
Correlation of Total Verbal
Form
Mean Biserial Correlations Differences from Mean R-Bisof Total Verbal
SC Ana RC AntTotalVerbal SC Ana RC Ant
3HGR3 .57 .49 .49 .51 .51 .06 -.02 -.02 .00
3HGR4 .53 .50 .53 .52 .52 .01 -.02 .01 .00
3IGR1 .59 .47 .52 .51 .52 .07 -.05 .00 -.01
3IGR2 .55 .51 .49 .57 .53 .02 -.02 -.04 .04
3IGR3 .57 .48 .54 .52 .53 .04 -.05 .01 -.01
3IGR4 .54 .52 .49 .53 .52 .02 .00 -.03 .01
3JGR1 .56 .46 .49 .51 .50 .06 -.04 -.01 .01
3JGR2 .57 .46 .48 .48 .49 .08 -.03 -.01 -.01
Mean .56 .48 .50 .52 .52 .05 -.03 -.01 .00
Maximum .59 .52 .54 .57 .53 .08 .00 .01 .04
Minimum .53 .46 .48 .48 .49 .01 -.05 -.04 -.01
Range .06 .06 .06 .09 .04 .07 .05 .05 .05
Numberof items 14 18 22 22 76 14 18 22 22
TABLE 6
Standard Deviations of Biserial Correlations and Differences of theStandard Deviation of the Biserial Correlation of Each Item-Type Subsetfrom the Standard Deviation of the Biserial Correlation of Total Verbal
by Test Form
S.D. Biserial Correlation Differences from S.D. R-Bisof Total Verbal
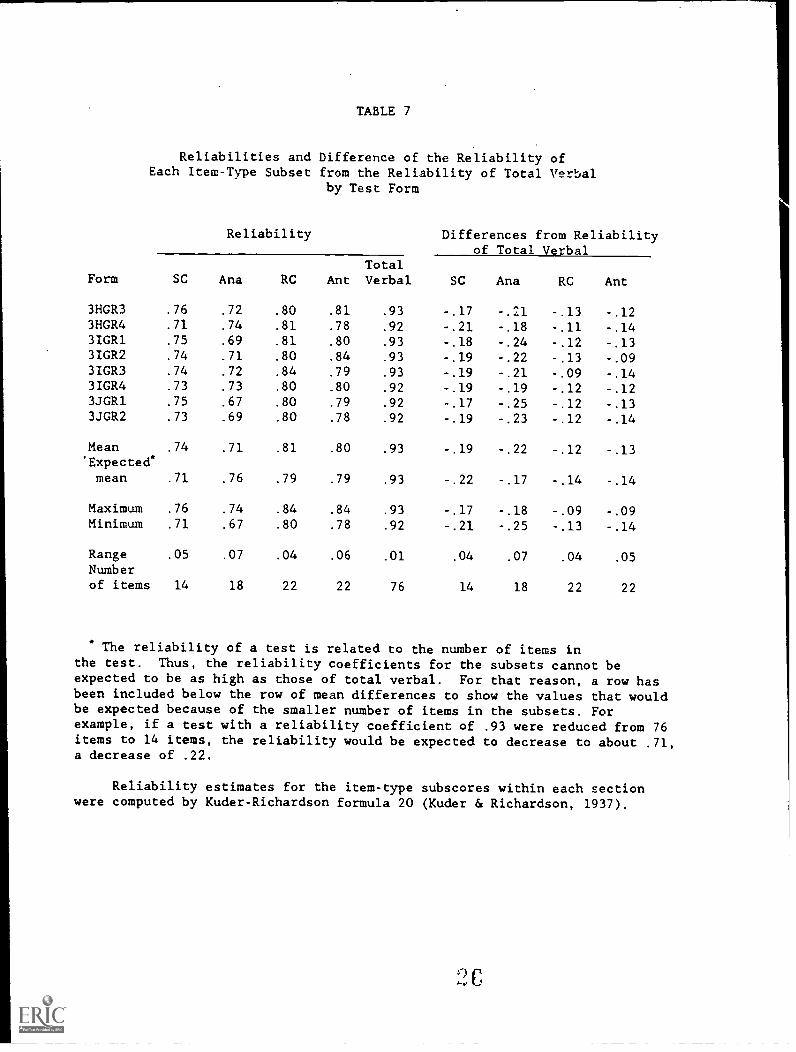
* The reliability of a test is related to the number of items inthe test. Thus, the reliability coefficients for the subsets cannot beexpected to be as high as those of total verbal. For that reason, a row hasbeen included below the row of mean differences to show the values that wouldbe expected because of the smaller number of items in the subsets. Forexample, if a test with a reliability coefficient of .93 were reduced from 76items to 14 items, the reliability would be expected to decrease to about .71,a decrease of .22.
Reliability estimates for the item-type subscores within each sectionwere computed by Kuder-Richardson formula 20 (Kuder & Richardson, 1937).
1
20
difficulty and discrimination rather than use the subtests available inoperational editions as Wilson (1986) did.
The standard deviations (Table 4) of item difficulties gives anindication of the spread of the difficulties of items by item type. Thereading comprehension items tend to have the least spread in itemdifficulties of the verbal item types, while antonyms tend to have thegreatest spread.
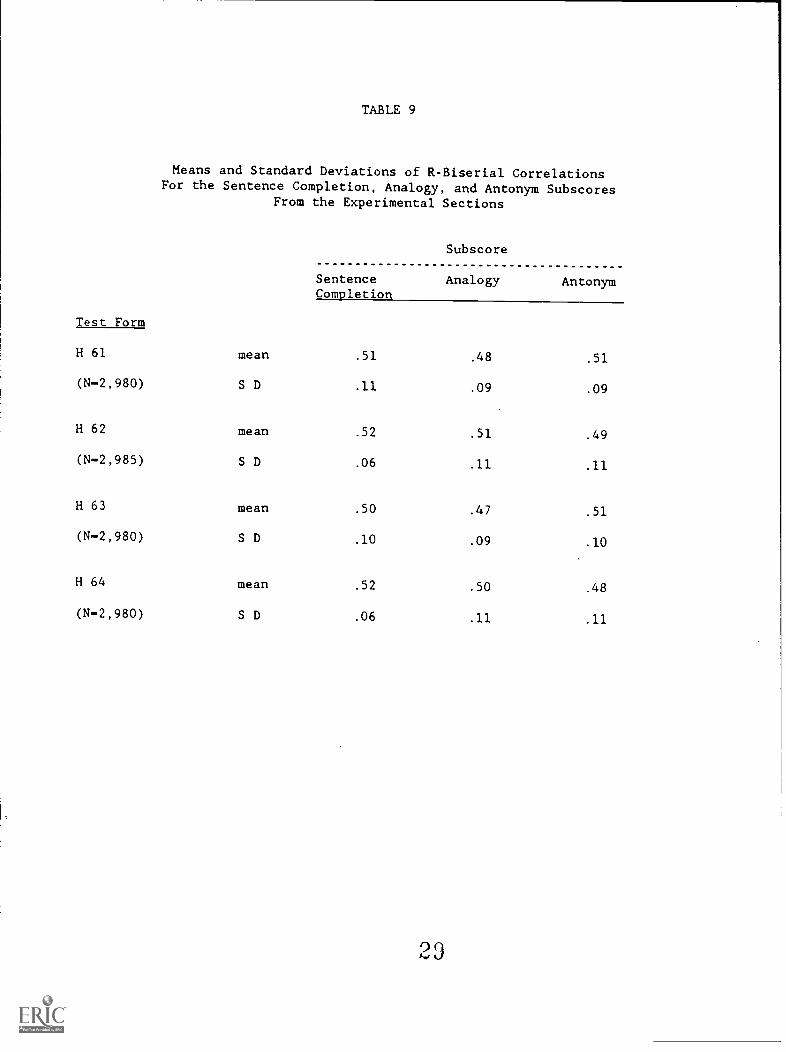
Tables 5 and 6 present the means and standard deviations of biserialcorrelations for the verbal measure. Sentence completion items tend tohave the highest average biserial correlations while analogies have thelowest. However, these relationships vary considerably from form toform.
Table 7 shows that the reliability of the total verbal score isconsistently .92 or .93. The reliability of a score is closely relatedto the number of items contributing to the score and the discriminationpower of the items. As would be expected, scores based on the two itemtypes (reading comprehension and antonyms) with the most items (22) aremore reliable than scores based on the other two item types. The 14-itemsentence completion item type is slightly more reliable than the 18-itemanalogy item type. This difference in reliability is consistent with thesubstantially higher average biserial correlations of the sentencecompletion items found in Table 5.
The statistical characteristics of verbal item types in the experimentalsections used for this study are summarized in Tables 8-10. The meanequated deltas of the experimental sections range from 11.7 to 12.6. Theaverage biserial correlations range from .47 to .54, with readingcomprehension slightly higher and analogies slightly lower on theaverage. Although the mean biserials are not the same for all theexperimental sections, they are less variable than within ir.dividualoperational forms.
Table 11 provides data about the self-reported undergraduate grade pointaverage for the examinees according to their major field areas. Thisinformation helps in the interpretation of the regression analyses, whichincluded major field as a variable. The mean deviations provide a way ofcomparing UGPA for the four major field areas while controlling for thedifferences in grades across the institutions. Since the unit ofanalysis is the institution and since grading scales vary acrossinstitutions, the mean deviations in grades by field were calculated inthe following way:
1. The mean UGPA for all examinees within an institution wasdetermined.
2. Within the institution, the mean UGPAs for all examinees accordingto their major field areas were determined.
3. The mean residual UGPA for each major field area was determined bysubtracting the mean determined in #1 above from each of the fourmeans determined in #2 above.
94d I
TABLE 8
Means and Standard Deviations of Equated DeltasFor the Sentence Completion, Analogy, and Antonym Subscores
From the Experimental Sections
Test Form
SentenceCompletion
Subscore
Analogy Antonym
H 61 mean 12.2 12.7 12.0
(N-2,980) S D 1.8 1.7 1.9
H 62 mean 12.3 12.6 12.5
(N-2,985) S D 1.6 2.0 1.7
H 63 mean 12.2 12.5 12.1
(N-2,980) S D 1.9 1.6 1.9
H 64 mean 12.2 12.4 12.6
(N-2,980) S D 1.7 1.8 1.8
TABLE 9
Means and Standard Deviations of R-Biserial CorrelationsFor the Sentence Completion, Analogy, and Antonym Subscores
From the Experimental Sections
Test Form
SentenceCompletion
Subscore
Analogy Antonym
H 61 mean .51 .48 .51
(N-2,980) S D .11 .09 .09
H 62 mean .52 .51 .49
(N-2,985) S D .06 .11 .11
H 63 mean .50 .47 .51
(N-2,980) S D .10 .09 .10
H 64 mean .52 .50 .48
(N-2,980) S D .06 .11 .11
TABLE 10
Means and Standard Deviations of Equated Deltas and BiserialCorrelations of the Matched Sets of Reading Comprehension Items
Form
3GGR2 3GGR3 3GGR4
Equated Delta Mean 11.7 11.8 11.7
S D 1.8 1.9 2.0
Biserial Correlation Mean .53 .51 .54
S D .06 .11 .09
Reliability .745 .745 .725
TABLE 11
Mean Deviations of Examinee and School Mean UGPAFor Each Major Field For Combinations
of Ethnic and Gender Groups
Numberof Under-Graduate Social Biological Physical
Group Institutions Humanities Science Science Science
Black females 28 .056 .099 .010 -.021
Black males 8 .011 -.030 -.138 .350
Hispanic females 21 -.027 .062 -.126 .003
Hispanic males 19 .388 -.114 -.268 -.032
White females 292 .118 .030 -.099 .011
White males 296 .167 -.028 -.186 .025
25
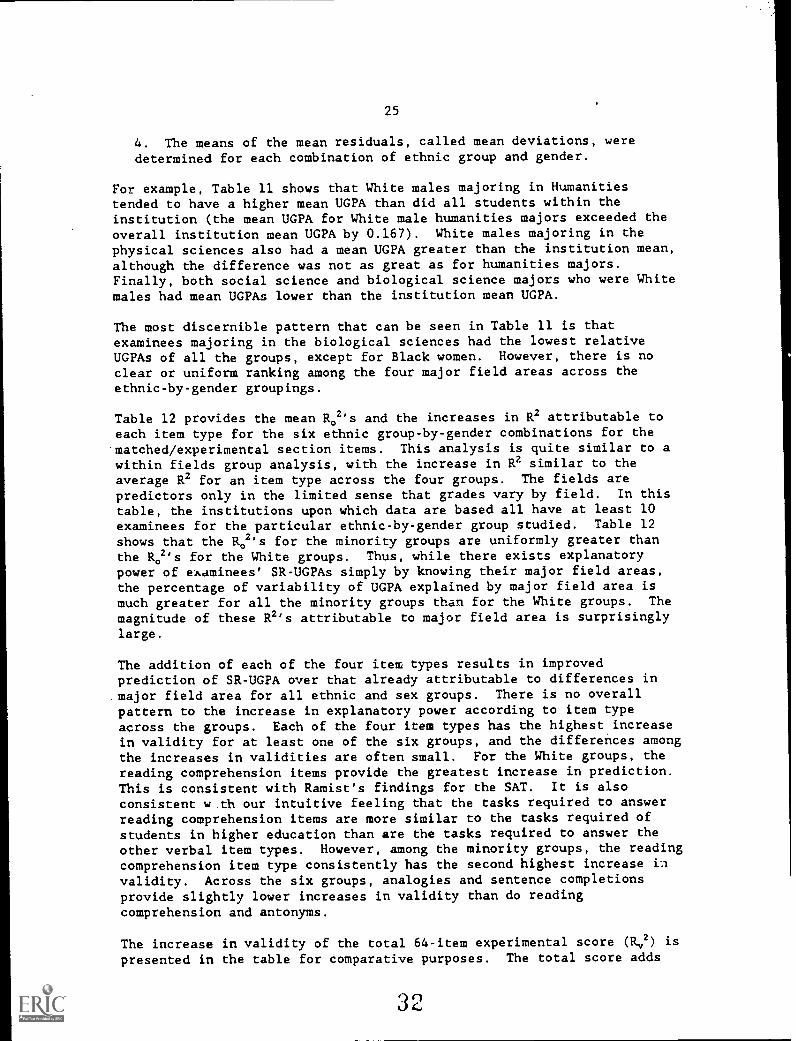
4. The means of the mean residuals, called mean deviations, weredetermined for each combination of ethnic group and gender.
For example, Table 11 shows that White males majoring in Humanitiestended to have a higher mean UGPA than did all students within theinstitution (the mean UGPA for White male humanities majors exceeded theoverall institution mean UGPA by 0.167). White males majoring in thephysical sciences also had a mean UGPA greater than the institution mean,although the difference was not as great as for humanities majors.Finally, both social science and biological science majors who were Whitemales had mean UGPAs lower than the institution mean UGPA.
The most discernible pattern that can be seen in Table 11 is thatexaminees majoring in the biological sciences had the lowest relativeUGPAs of all the groups, except for Black women. However, there is noclear or uniform ranking among the four major field areas across theethnic-by-gender groupings.
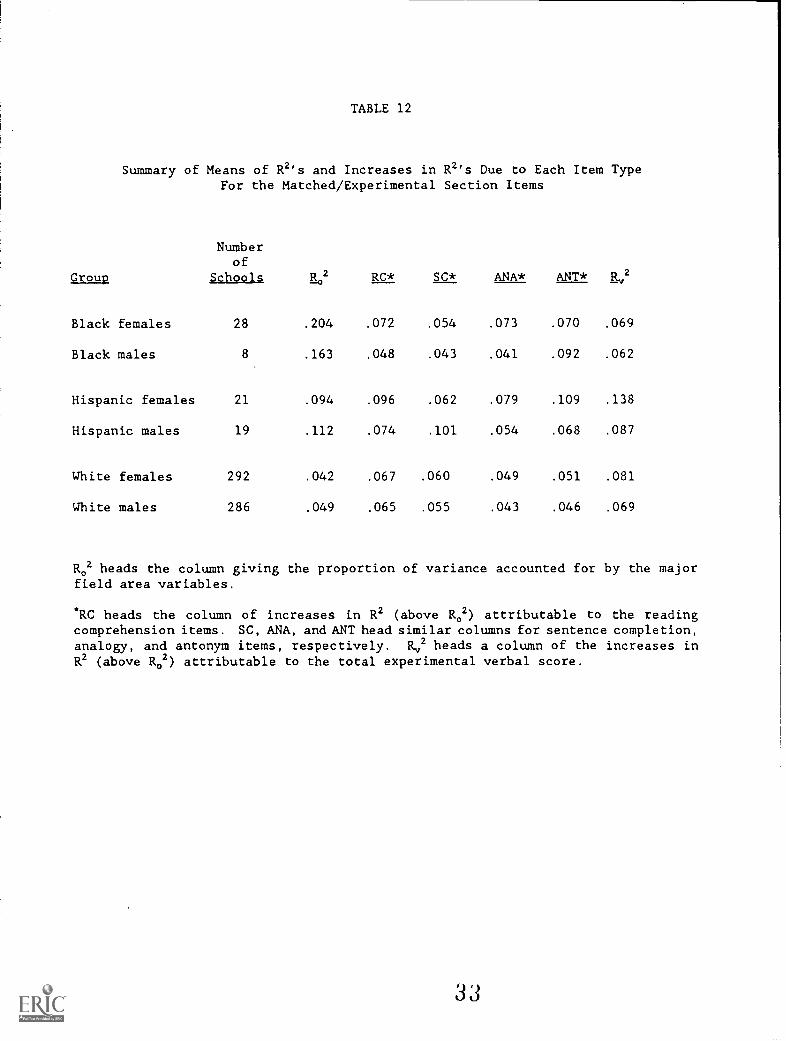
Table 12 provides the mean R02's and the increases in R2 attributable toeach item type for the six ethnic group-by-gender combinations for thematched/experimental section items. This analysis is quite similar to awithin fields group analysis, with the increase in R2 similar to theaverage R2 for an item type across the four groups. The fields arepredictors only in the limited sense that grades vary by field. In thistable, the institutions upon which data are based all have at least 10examinees for the particular ethnic-by-gender group studied. Table 12
shows that the R02's for the minority groups are uniformly greater thanthe 12.02's for the White groups. Thus, while there exists explanatorypower of examinees' SR-UGPAs simply by knowing their major field areas,the percentage of variability of UGPA explained by major field area ismuch greater for all the minority groups than for the White groups. The
magnitude of these R2's attributable to major field area is surprisinglylarge.
The addition of each of the four item types results in improvedprediction of SR-UGPA over that already attributable to differences inmajor field area for all ethnic and sex groups. There is no overall
pattern to the increase in explanatory power according to item typeacross the groups. Each of the four item types has the highest increasein validity for at least one of the six groups, and the differences amongthe increases in validities are often small. For the White groups, the
reading comprehension items provide the greatest increase in prediction.This is consistent with Ramist's findings for the SAT. It is also
consistent w th our intuitive feeling that the tasks required to answerreading comprehension items are more similar to the tasks required ofstudents in higher education than are the tasks required to answer theother verbal item types. However, among the minority groups, the readingcomprehension item type consistently has the second highest increase in
validity. Across the six groups, analogies and sentence completionsprovide slightly lower increases in validity than do readingcomprehension and antonyms.
The increase in validity of the total 64-item experimental score 00 ispresented in the table for comparative purposes. The total score adds
3')
TABLE 12
Summary of Means of R2's and Increases in R2's Due to Each Item TypeFor the Matched/Experimental Section Items
Numberof
Group Schools R 2 RC* SC* ANA* ANT* rtv2
Black females 28 .204 .072 .054 .073 .070 .069
Black males 8 .163 .048 .043 .041 .092 .062
Hispanic females 21 .094 .096 .062 .079 .109 .138
Hispanic males 19 .112 .074 .101 .054 .068 .087
White females 292 .042 .067 .060 .049 .051 .081
White males 286 .049 .065 .055 .043 .046 .069
R02 heads the column giving the proportion of variance accounted for by the majorfield area variables.
*RC heads the column of increases in R2 (above R02) attributable to the readingcomprehension items. SC, ANA, and ANT head similar columns for sentence completion,analogy, and antonym items, respectively. Rv2 heads a column of the increases inR2 (above R02) attributable to the total experimental verbal score.
3 9u
27
most to the validity for Hispanic females and males and least to the
validity for Black males, Black fewles, and White males.
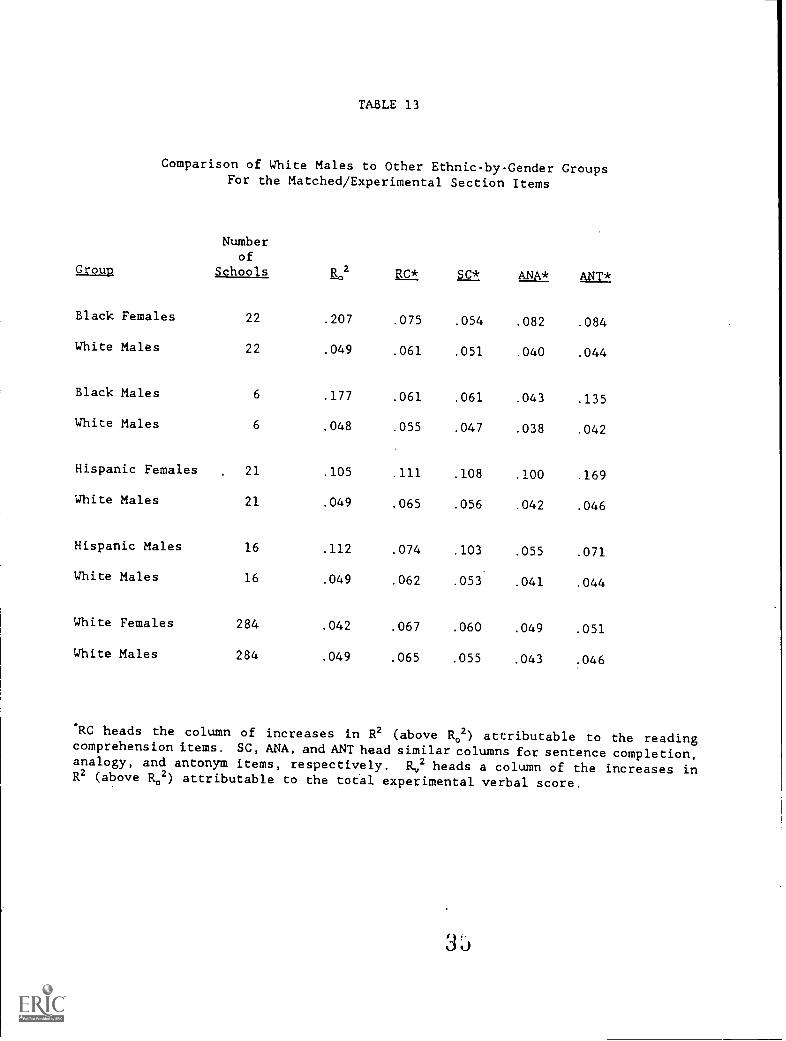
Table 13 provides data similar to that in Table 12 for a slightly
different population. There was concern that making comparisons amongthe groups in Table 12 might be confounded by the particular schoolsincluded in each sample because a different grouping of schools comprisedeach ethnic-by-gender sample. As a result, the analysis in Table 13 foreach group and for White males was based on the same undergraduate
institutions. Thus, Table 13 allows one to compare the increase invalidity for each item type for White males to the increase in validityfor each item type for each of the other groups in an analysis based onthe same institutions. Comparing the results from Table 13 to those in
Table 12 indicates no change in the general pattern.
Table 14 provides the mean squared multiple correlations of item typescore with self-reported undergraduate grade point average excluding
undergraduate major field area variables. If the primary source ofdifferences in grades across major field areas is differences in gradingstandards, the effect of including the major field area variables wouldbe to reduce noise in the criterion variable and thus increase theobserved validities. If the primary source of differences in grades isactual differences in student performance, the effect of including themajor field area variables would be to reduce the true variance in thecriterion measure and thus decrease the observed validity. A comparisonof Tables 12 and 14 shows that the proportion of variance accounted forby the item type scores and total score is higher when undergraduatemajor field area is included in the regression equation. For example,
the variance accounted for by the 64-item experimental score alone forWhite males is .059, while the increase in validity of the 64-itemexperimental score after controlling for major field areas is .069. Thepatterns of item type validity within each sex-by-ethnic group are quiteconsistent in Tables 12 and 14.
These results suggest that it is appropriate to use the major field areavariables because the primary source of differences in grades acrossmajor field areas appears to be coming from different grading standards.To some extent it appears not to matter which procedure is followed sincethe pattern of relative validities among the four item types is the same.For these reasons, the remainder of the analyses include the major fieldarea variables.
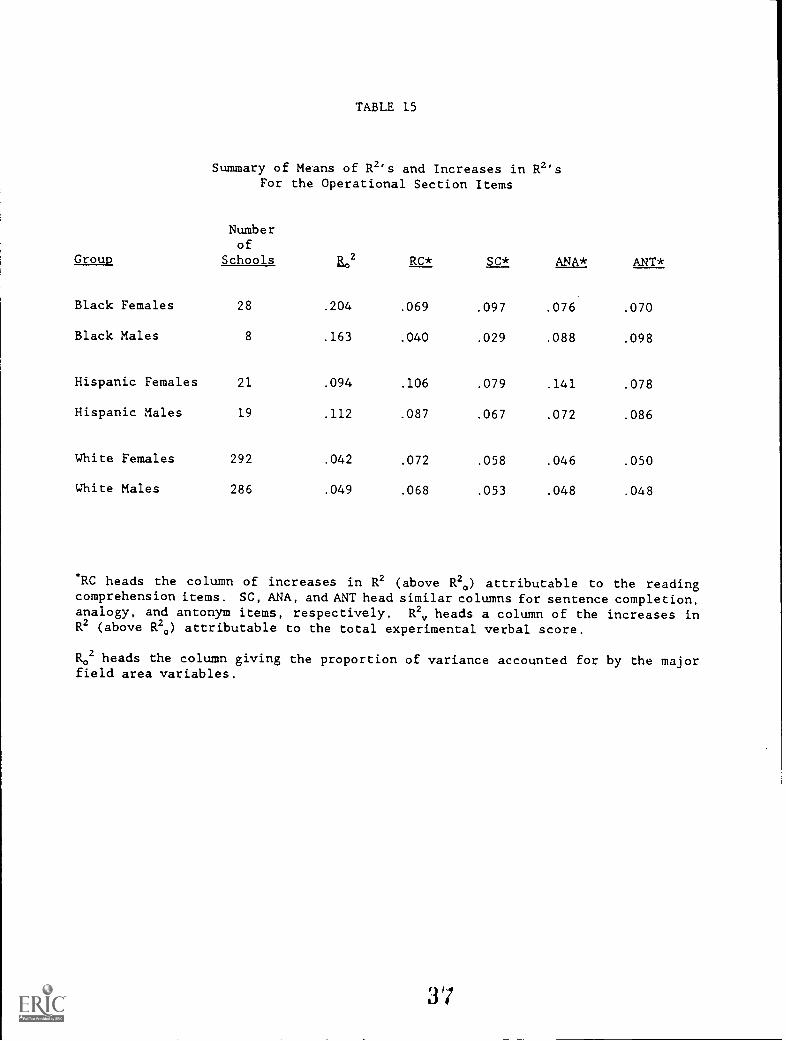
Table 15 provides, for the subscores based on operational items,information similar to that found in Table 12 based on matched sets of
items. A comparison of the results in Tables 12 and 15 will provideevidence about whether the differences in R2 are similar for thesubscores based on the matched and unmatched sets of items.Although the R2's differ, the pattern of results in Table 15 isessentially similar to the pattern found in Table 12. The increases invalidity for the minority groups were greater than the increases invalidity for the White groups (except for Black males and females forreading comprehension and Black males for sentence completion). Also,
the same pattern exists of higher increases for reading comprehension forWhite groups, but not for minority groups.
34
TABLE 13
Comparison of White Males to Other Ethnic-by-Gender GroupsFor the Matched/Experimental Section Items
Numberof
Gro_Lp Schoo s R 2 RC* SC* ANA* ANT*
Black Females 22 .207 .075 .054 .082 .084
White Males 22 .049 .061 .051 .040 .044
Black Males 6 .177 .061 .061 .043 .135
White Males 6 .048 .055 .047 .038 .042
Hispanic Females 21 .105 .111 .108 .100 .169
White Males 21 .049 .065 .056 .042 .046
Hispanic Males 16 .112 .074 .103 .055 .071
White Males 16 .049 .062 .053 .041 .044
White Females 284 .042 .067 .060 .049 .051
White Males 284 .049 .065 .055 .043 .046
*RC heads the column of increases in R2 (above R02) attributable to the readingcomprehension items. SC, ANA, and ANT head similar columns for sentence completion,analogy, and antonym items, respectively. Ec2 heads a column of the increases inR2 (above R02) attributable to the tot'al experimental verbal score.
Group
Black Females
Black Males
TABLE 14
Summary of Means of R2's* Due to Each Item TypeFor the Matched/Experimental Section Items
Excluding Major Field Area Variables
Numberof
Schools R 2gt2
Rrc 2 Rsc 2 R 2 antarm
28 .067 .047 .048 .029 .068
8 .039 .036 .033 .060 .022
Hispanic Females 21 .071 .041 .040 .046 .070
Hispanic Males 19 .061 .097 .047 .048 .079
White Females
White Males
292 .059 .051 .040 .043 .071
286 .054 .045 .033 .035 .059
*R,..,2 heads the column of proportion of variance accounted for by the readingcomprehension items when the major field area variables are not included asindependent variables. R52, and Rant2 head similar columns for sentencecompletion, analogy, and antonym items, respectively. Rt2 heads the column ofproportion of variance accounted for by the total experimental verbal score whenthe major field area variables are not included as independent variables.
TABLE 15
Summary of Means of R2's and Increases in R2'sFor the Operational Section Items
Numberof
Group Schools R 2 RC* SC* ANA* ANT*
Black Females 28 .204 .069 .097 .076 .070
Black Males 8 .163 .040 .029 .088 .098
Hispanic Females 21 .094 .106 .079 .141 .078
Hispanic Males 19 .112 .087 .067 .072 .086
White Females 292 .042 .072 .058 .046 .050
White Males 286 .049 .068 .053 .048 .048
"RC heads the column of increases in R2 (above R20) attributable to the readingcomprehension items. SC, ANA, and ANT head similar columns for sentence completion,analogy, and antonym items, respectively. R2,, heads a column of the increases inR2 (above R20) attributable to the total experimental verbal score.
R02 heads the column giving the proportion of variance accounted for by the majorfield area variables.
37
31
Comparing the results from the two tables shows that for the two White
groups, the differences in R2's were negligible. For the combinations of
minority ethnic groups by gender, there were noticeable differences in
R2's, although there was 1,o apparent pattern. These results indicate
that the item type validities may be confounded by the differences in
difficulty and item-test correlations for minority examinees, but not
necessarily for White groups. Alternatively, these differences mayresult from the smaller sample sizes for the minority groups.
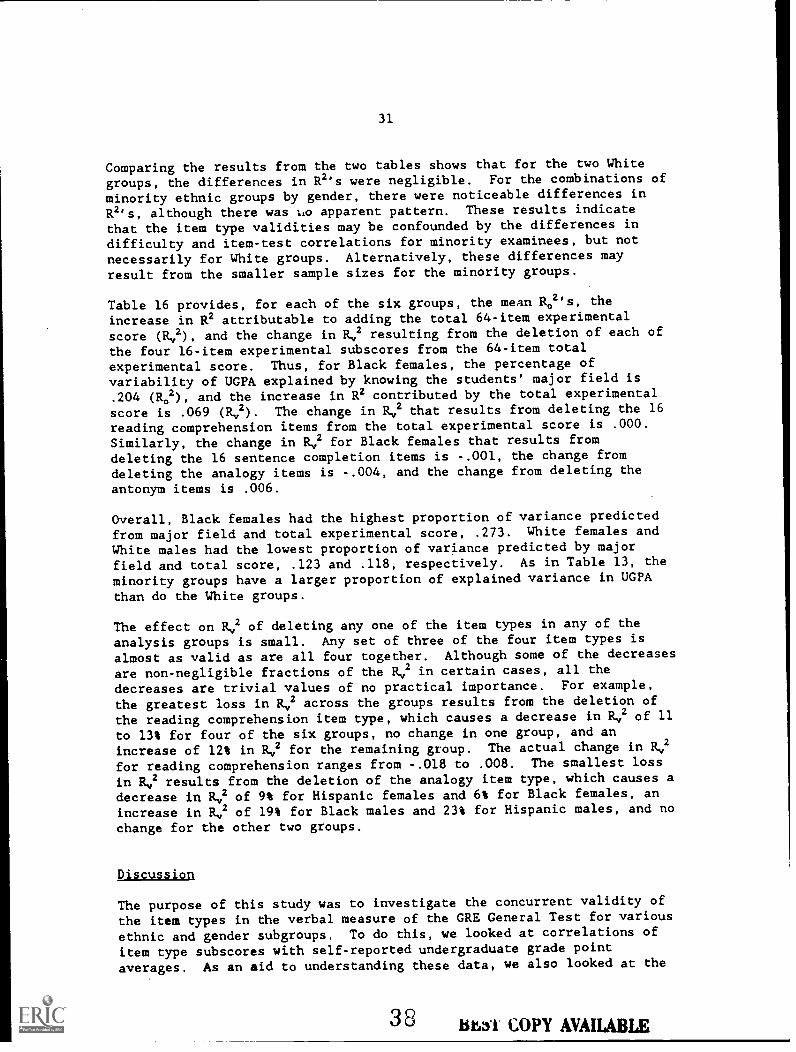
Table 16 provides, for each of the six groups, the mean R02's, the
increase in R2 attributable to adding the total 64-item experimental
score 00, and the change in R2 resulting from the deletion of each of
the four 16-item experimental subscores from the 64-item total
experimental score. Thus, for Black females, the percentage ofvariability of UGPA explained by knowing the students' major field is.204 (R02), and the increase in R2 contributed by the total experimental
score is .069 00. The change in R,2 that results from deleting the 16reading comprehension items from the total experimental score is .000.
Similarly, the change in R,2 for Black females that results fromdeleting the 16 sentence completion items is -.001, the change fromdeleting the analogy items is -.004, and the change from deleting the
antonym items is .006.
Overall, Black females had the highest proportion of variance predictedfrom major field and total experimental score, .273. White females and
White males had the lowest proportion of variance predicted by majorfield and total score, .123 and .118, respectively. As in Table 13, the
minority groups have a larger proportion of explained variance in UGPA
than do the White groups.
The effect on R. of deleting any one of the item types in any of the
analysis groups is small. Any set of three of the four item types is
almost as valid as are all four together. Although some of the decreases
are non-negligible fractions of the R2 in certain cases, all thedecreases are trivial values of no practical importance. For example,
the greatest loss in R2 across the groups results from the deletion of
the reading comprehension item type, which causes a decrease in R2 of 11
to 13% for four of the six groups, no change in one group, and an
increase of 12% in R2 for the remaining group. The actual change in Rv2
for reading comprehension ranges from -.018 to .008. The smallest loss
in R,2 results from the deletion of the analogy item type, which causes a
decrease in R2 of 9% for Hispanic females and 6% for Black females, an
increase in R,,2 of 19% for Black males and 23% for Hispanic males, and no
change for the other two groups.
p/scussion
The purpose of this study was to investigate the concurrent validity of
the item types in the verbal measure of the GRE General Test for various
ethnic and gender subgroups. To do this, we looked at correlations of
item type subscores with self-reported undergraduate grade point
averages. As an aid to understanding these data, we also looked at the
3 8 brast COPY AVAILABLE
TABLE 16
Effect on R2 of Deleting Each of the Four Experimental SubscoresFrom the Total Experimental Score
Group R 2 IV R 2 4-
Change in R,2 from Deleting
R,2 RC* SC* ANA* ANT*
Black Females .204 .069 .273 .000 -.001 -.004 .006(N-28)
Black Males .163 .062 .225 -.007 .008 .012 -.007(N..8)
White Females .042 .081 .123 -.010 -.004 .000 -.001(N-292)
White Males .049 .069 .118 -.008 -.003 .000 .000(N..286)
*RC heads the column of changes in Rv2 from deleting the reading comprehension itemsfrom the total experimental score. SC, ANA, and ANT head similar columns forsentence completion, analogy, and antonym items, respectively.
33
statistical characteristics of the item types in existing editions of theGRE General Test and in the experimental tests used in this study.Overall, the results do not suggest any specific revisions to the itemtype composition of the verbal measure of the GRE General Test.
The review of the item type statistics based on operational test forms(Tables 3-7) illustrates the potential problems with drawing conclusionsabout item type validity from operational data. The number of items per
item type varies from 14 to 22, and the reliability and biserialcorrelation by item type varies, as does the difficulty of the item type.In operational forms, the sentence correction item type is generally the
easiest. The mean difficulty of the analogy item type varies more thanany other item type from form to form. Antonyms tend to be the item type
with the highest average item difficulty and the greatest variability ofitem difficulty within an edition. Reading comprehension items tend to
vary least in difficulty within an edition. The data in Tables 8-10
suggest that we were at least somewhat successful in minimizing the
statistical differences among item type scores in the experimental
sections.
One unexpected finding of this study is the substantial proportion ofvariance in UGPA that is accounted for by the students' major field
areas. In Table 12, one finds that the proportion of R2 accounted for bymajor field area ranges from a low of .042 for White females to a high of.204 for Black females. Major field area accounts for about twice asmuch of the variance in the Hispanic groups and three to four times asmuch of the variance in the Black groups than it does in the White
groups. These are very large differences in proportions of variance,especially cormidering the relatively modest proportions of variance inUGPA typically found to be predicted by test scores in validity studies.Table 16 shows that, for Black females and males and for Hispanic males,the addition to R2 attributable to adding the total 64-item experimentalscore to major field area was less than the R2 attributable to major
field area alone. This is true even though the increase in R2 due toadding the total experimental score to the major field area variable ishigher for Hispanic males than it is for either of the White groups.
These results suggest that great caution should be used in designingvalidity studies using undergraduate grades as criterion measures.Evidence cited by Willingham (1985) suggests that upper division gradesdo differ by field and that these differences are due to variations ingrading practices. For the 300 institutions in this study, the gradesfor the last two years of undergraduate school across major field areasappear not to be interchangeable. It would seem that researchersstudying the relative under- or overprediction of grades for differentsubgroups in a population would also need to consider whether the groupsbeing compared are really alike in their course-taking patterns.
The item type validity patterns are not consistent across groups. For
White females and White males, the reading comprehension item type is themost valid and the sentence completion item type the next most valid,while analogies and antonyms tend to add slightly less to the predictionequation. For the White group, this same finding is consistent in theoperational and experimental data. However, different item types have
.; 0
34
the highest concurrent validities in the minority subgroups. In theexperimental data, the reading comprehension item type does consistentlyhave the second highest increase in validity of all the item types in theminority subgroups, even though there is no one item type that isconsistently best for all minority groups. Across the six groups,analogies and sentence completions provide slightly lower increases in1,ralidity than do the other two item types.
The results for the White groups--that the reading comprehension andsentence completion item types are more valid than the analogy andantonym item types--are consistent with the results obtained by Ramist(1981) from predictive validity studies of the SAT and by Wilson (1984,1986) in predictive validity studies of the GRE. Most of the students inthose studies were White. In the present study, the higher validity ofthe reading comprehension and sentence completion item types for theWhite groups was evident in the data from both the item type subscoresbased on the operational items and the matched sets of experimentalitems. This suggests that, for White students, the greater validities ofreading comprehension and sentence completion do not result fromincidental differences in difficulty and discrimination in operationaltest forms. Even when these factors are controlled, the analogy andantonym item types are less valid for White students. Thus, it ispossible that these differences in validity for White students may be dueto differences in the skills being measured by the different item types.It should be noted, however, that the differences in validity among thefour item types for White students are not great.
The results for the minority groups do not follow this same pattern,although reading comprehension items were consistently the second mostvalid item type in the experimental data for minority students. Overall,the differences in validity among the four item types seem to be greaterfor minority groups than for White groups.
In addition to investigating how much each item type contributedindividually to the concurrent validity, the effect of eliminating anyone item type from the total score was compared. It appears that any setof three of the four item types is almost as valid as are all fourtogether. This occurs because the four item types are so highlycorrelated. This finding was consistent for all ethnic-by-gender groupcombinations. Across the six groups, deletion of the readingcomprehension item type resulted in the greatest loss in validity anddeletion of the analogy item type resulted in the least loss in validity.However, these results are not consistent for all groups. Hispanicexaminees show the greatest loss in validity from the deletion of thesentence completion item type. For the two Black groups, deletion of thedifferent item types showed no consistent pattern of gains or losses invalidity.
The results of this study suggest that all the verbal item types studiedcontribute to the concurrent validity of the verbal measure. Differencesamong the item types are small. Although all the item types contributeto the concurrent validity, there is a great deal of commonality amongthem. As a result, little concurrent validity is lost by deleting anyone item type. The results suggest that, of the four item types, reading
41.
35
comprehension may be slightly more consistently valid than the other itemtypes across all groups. The analogy item type may contribute slightlyless than the other item types to the concurrent validity. These
differences are small and do not suggest any specific revisions to itemtype composition of the verbal measure of the GRE General Test. However,
the results do suggest that dropping any one of the four item types wouldnot have serious implications for the validity of the verbal score. Of
course, a high reliability is necessary on a test that is used to make
decisions about individuals. Thus, even if an item type were dropped,the current number of items in the test would need to,remainapproximately the same to maintain the current level of reliability. As
suggested in the introduction to this paper, any decision about thecontent of a test requires the consideration of a number of issues inaddition to concurrent validity.
,i2
37
References
Angoff, W. H. (1984) Scales, Norms, and Equivalent Scores. Princeton,
NJ: Educational Testing Service.
Braun, H. I. (1988) Empirical Bayes Methods: A Tool for ExploratoryAnalysis. In the Proceedings from the 1987 Invitational MultilevelConference, Princeton. NJ (eds. R. D. Bock and L. Burstein). New
York, NY: Academic Press.
Cowell, W. R., & Tessema, A. (1986a). Graduate Record ExaminationsGeneral Test, Test Analysis of Form 3HGR3. Internal Reference Document(SR-86-110). Princeton, NJ: Educational Testing Service.
Cowell, W. R., & Tessema, A. (1986b). Graduate Record ExaminationsGeneral Test, Test Analysis of Form 3HGR4. Internal ReferenceDocument (SR-86-132). Princeton, NJ: Educational Testing Service.
Cowell, W. R., & Tessema, A. (1986c). Graduate Record ExaminationsGeneral Test, Test Analysis of Form 3IGR1. Internal ReferenceDocument (SR-86-141). Princeton, NJ: Educational Testing Service.
Cowell, W. R., & Tessema, A. (1986d). Graduate Record ExaminationsGeneral Test, Test Analysis of Form 3IGR2. Internal ReferenceDocument (SR-86-148). Princeton, NJ: Educational Testing Service.
Cowell, W. R., Tessema, A., & Black, W. (1987a). Graduate RecordExaminations General Test, Test Analysis of Form 3IGR3. InternalReference Document (SR-87-07). Princeton, NJ: Educational TestingService.
Cowell, W. R., Tessema, A., & Black, W. (1987b). Graduate RecordExaminations General Test, Test Analysis of Form 3IGR4. InternalReference Document (SR-87-17). Princeton, NJ: Educational TestingService.
Cowell, W. R., Tessema, A., & Black, W. (1987c). Graduate RecordExaminations General Test, Test Analysis of Form 3JGR1. InternalReference Document (SR-87-127). Princeton, NJ: Educational TestingService.
Cowell, W. R., Tessema, A., & Black, W. (1987d). Graduate RecordExaminations General Test, Test Analysis of Form 3JGR2. InternalReference Document (SR-87-128). Princeton, NJ: Ed .ltional TestingService.
Educational Testing Service (1986). 1986-87 GRE information bulletin.Princeton, NJ: Educational Testing Service.
Educational Testing Service (1987). 1987-1988 GRE information
Goldman, R. D., & Widawski, M. H. (1976). Why college grade pointaverage is difficult to predict. Educational and PsychologicalMeasurement, 36, 381-390.
Klitgaard, R. (1985). Choosing elites. New York: Basic Books.
Kuder, G. F., & Richardson, M. W. (1937). The theory of the estimationof test score reliability. Psychometrica, 2, 151-160.
Ramist, L. (1981). Validity of SAT verbal subscores. InternalEducational Testing Service memorandum, February 12, 1981.
Rock, D. A., Werts, C. & Grandy, J. (1982). Construct validity of theGRE Aptitude Test across populations -- an empirical confirmatorystudy. GRE Board Professional Report (78-1P). Princeton, NJ:Educational Testing Service.
Schrader, W. B. (1984a). A survey of item and test analysis results forSAT-verbal item types. College Entrance Examinations Board ResearchReport No. 84-7). Princeton, NJ: Educational Testing Service.
Schrader, W. B. (1984b). The relation of SAT reading and vocabularyscores to measures of high school performance. College EntranceExaminations Board Research Report (No. 84-7). Princeton, NJ:Educational Testing Service.
Schrader, W. B. (1984c). The validity of SAT-verbal item types. CollegeEntrance Examinations Board Research Report (No. 84-7). Princeton,NJ: Educational Testing Service.
Strenta, A. C., & Elliott, R. (1987). Differential Grading StandardsRevisited. Journal of Educational Measurement, 24(4), 281-291.
Wilson, K. M. (1984). The relationship of GRE item-type part-scores toundergraduate grades. Graduate Record Examinations Board Report (81-22). Princeton, NJ: Educational Testing Service.
Wilson, K. M. (1986). The relations of scores based on GRE General Testitem types to undergraduate grades: An exploratory study for selectedsubgroups. Graduate Record Examinations Board Report (83-19P).Princeton, NJ: Educational Testing Service.
Willingham, W. W. (1985). Success in college. New York: CollegeEntrance Examination Board.
39
Notes
1. Two additional methods of matching were also considered. Subtestscould be constructed by selecting matched sets of items from within anoperational edition of the test, although this matching procedure wouldresult in fewer items in each subtest (probably not more than eight).These operational subtests would therefore have lower reliabilities thanthe proposed experimental subtests. In addition, the operationalsubtests would not meet the content specifications in the overall test,and the matching would be on the item difficulty only, not on the item-test correlations.
The second method considered was to give the reading comprehensionitems in an experimental section of the test as well as the discreteverbal item types. The disadvantage of this approach was that examineeswould take only one of the experimental pretests and would therefore havescores on either reading comprehension or one score for each of the threediscrete item types. Thus, it would not have been possible to see if thematched item types were adding equally to the correlation with self-reported undergraduate grade point average.
41
Appendix A
Equating the Item-Type Subscores
The three operational forms used in this study, Forms 3GGR2, 3GGR3,
and 3GGR4, were spiraled (packaged and distributed to examinees in
alternating sequence) at domestic test centers at the October 1984 test
administration. The four experimental sections, however, were notadministered at that administration. Because the three forms wereadministered to randomly equivalent groups, the ability levels of the
groups taking each of the three forms are assumed to be equivalent. To
facilitate comparison among the various scores, the raw scores on Form
3GGR2 were converted to a scale with a mean of 50 and a standard
deviation of 10. Then, the scores derived from the operational sectionsof Forms 3GGR3 and 3GGR4 were equated to the common scale by setting rawscore means equal to the corresponding 3GGR2 scaled score standard
deviation. This method (Angoff, 1984) is known as Design I (randomgroups--one test administered to each group). Scores are defined as
equivalent if their standard-score deviates in their respective,randomly-equivalent groups are equal. These operational scores were usedat subsequent administrations for linking the scores on the matched item-
type subsets (i.e., matched on item difficulty and discrimination
indices) to the common scale.
All four experimental sections were administered at each of three testadministrations: June 1985, December 1985, and February 1986. Because
the sample sizes were largest for the December 1985 administration, data
for that administration were used to equate scores derived from the
experimental sections. Raw scores derived from the operational sectionswere converted to scaled scores using the score conversion equations
derived from the October 1984 data. Then, the raw scores derived fromthe experimental sections were equated to the common scale using the
corresponding operational scores as an external anchor test. This method
(Angoff, 1984) is known as Design IV (nonrandom groups--one testadministered to each group, common equating test administered to both
groups).
.The score conversion equations based on the October 1984 and December
1985 data were used to convert all the raw scores to the common scale.
These scores could then be pooled across administrations for the
subsequent analyses.
4
42
Equating the Item-Type Subscores
Data from four test administrations were used in the scaling,equating, and subsequent analysis of item-type subscores for this study:
October 1984
December 1985
June 1985
February 1986
Forms 3GGR2, 3GGR3, and 3GGR4 were spiraled atdomestic test centers. Scores derived from theoperational sections of Form 3GGR2 were scaled to amean of 50 and a standard deviation of 10. Scoresderived from the operational sections of Forms 3GGR3and 3GGR4 were equated to the common scale bysetting raw score means equal to the corresponding3GGR2 scaled score mean and raw score standarddeviations equal to the corresponding 3GGR2 scaledscore standard deviation.
Form 3GGR3 was administered with the fourexperimental sections. Raw scores derived from theoperational sections were converted to scaled scoresusing the score conversion equations derived fromthe October 1984 data. Raw scores derived from theexperimental sections were equated to the common .
scale using the corresponding operational scores asan external anchor test.
Form 3GGR2 was administered with the fourexperimental sections. Raw scores derived from theoperational and experimental sections were convertedto scaled scores using the score conversionequations derived from the October 1984 and December1985 data.
Form 3GGR4 was administered with the fourexperimental sections. Raw scores derived from theoperational and experimental sections were convertedto scaled scores using the score conversionequations derived from the October 1984 and December1985 data.