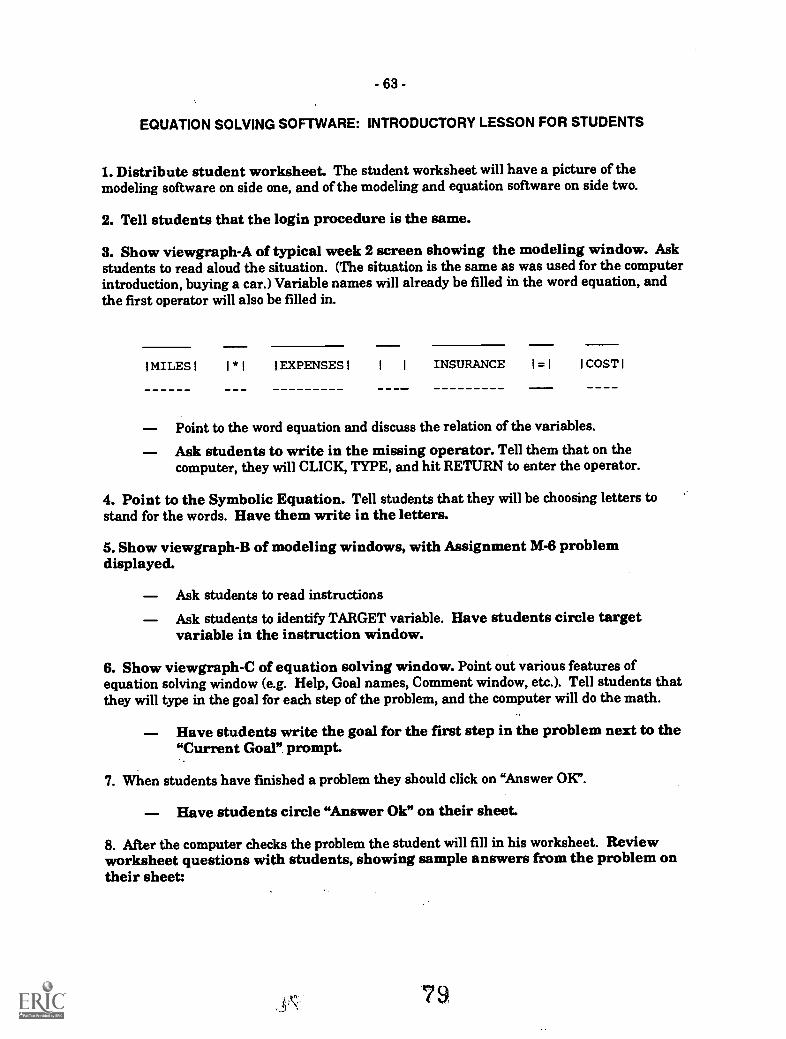
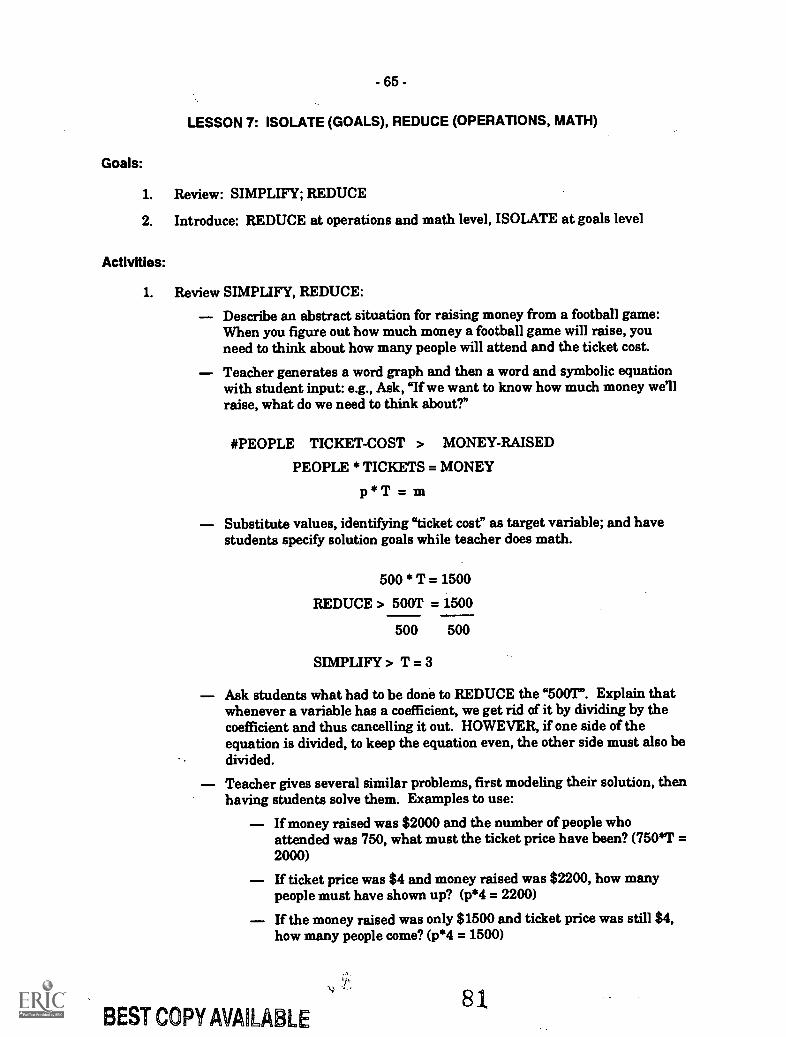
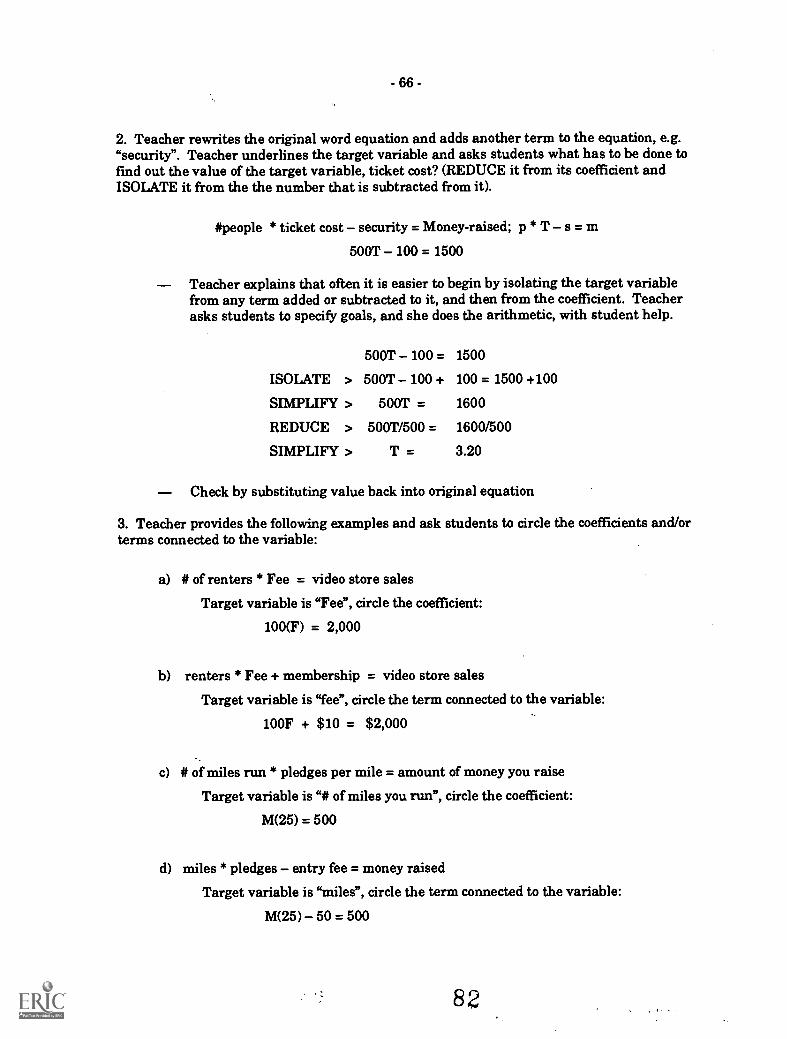
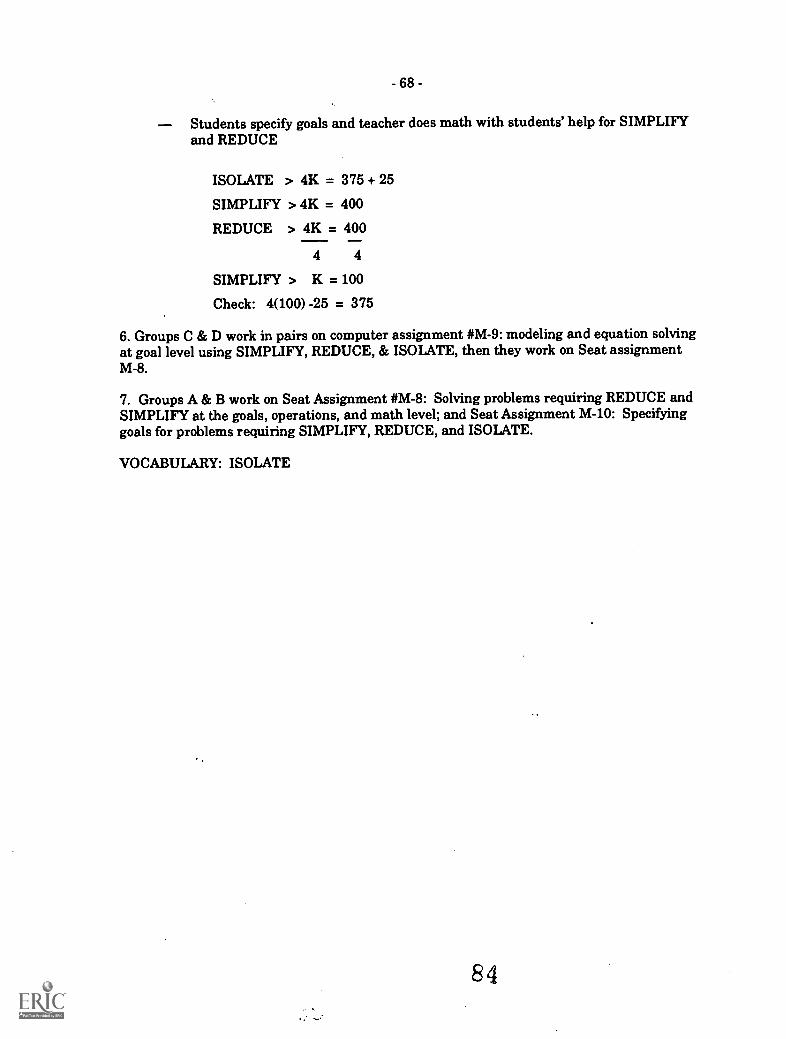
ED 404 100 AUTHOR TITLE INSTITUTION SPONS AGENCY REPORT NO PUB DATE CONTRACT NOTE AVAILABLE FROM PUB TYPE EDRS PRICE DESCRIPTORS DOCUMENT RESUME SE 053 264 Robyn, Abby; And Others Implementing a Novel Computer-Related Algebra Course. RAND Note. Rand Corp., Santa Monica, Calif. National Science Foundation, Washington, D.C. RAND/N-3326-NSF/RC 92 R168D90023 201p. RAND, 1700 Main Street, P.O. Box 2138, Santa Monica, CA 90407-2138. Guides Classroom Use Instructional Materials (For Learner) (051) Reports Evaluative/Feasibility (142) Tests/Evaluation Instruments (160) MF01/PC09 Plus Postage. *Algebra; *Computer Assisted Instruction; *Curriculum Development; Curriculum Evaluation; High Schools; High School Students; Lesson Plans; *Mathematics Curriculum; Mathematics Education; Microcomputers; Problem Solving; Program Implementation; Student Attitudes IDENTIFIERS NCTM Curriculum and Evaluation Standards ABSTRACT The standards developed for reform in mathematics education by the National Council of Teachers of Mathematics (NCTM) de-emphasize the algorithmic manipulation of mathematical symbols. The NCTM takes the *position that the rapidly changing workplace is an environment that requires problem-solving skills with computers being used to perform routine mathematical computations. This report describes the computer-based information curriculum module developed for beginning algebra to meet the challenges of the proposed reform. The RAND Algebra Tutor Project has been developing and piloting intelligent computer tools for first-year algebra students. Varios problems led to the development of a full curriculum in order to successfully implement computer-assisted instruction. The curriculum departed from traditional algebra instructions in these ways: the pedagogy stressed situational learning in real-life problems, introducing a conceptual framework before local skills practice and used indictive instruction and cooperative learning. The curriculum achieved mixed effectiveness. In general, students were more successful at creating and using qualitative models than quantitative models. Appendix A contains the 12 teacher lessons plans for the linear equations unit and related student materials. Appendix B contains the evaluation measures for the arithmetic text, pre/post tests, student course evaluations, and unit evaluations. (Contains 36 references.) (MDH) ********************************************************************** Reproductions supplied by EDRS are the best that can be made from the original document. ***********************************************************************
Transcript
ED 404 100
AUTHORTITLE
INSTITUTIONSPONS AGENCYREPORT NOPUB DATECONTRACTNOTEAVAILABLE FROM
PUB TYPE
EDRS PRICEDESCRIPTORS
DOCUMENT RESUME
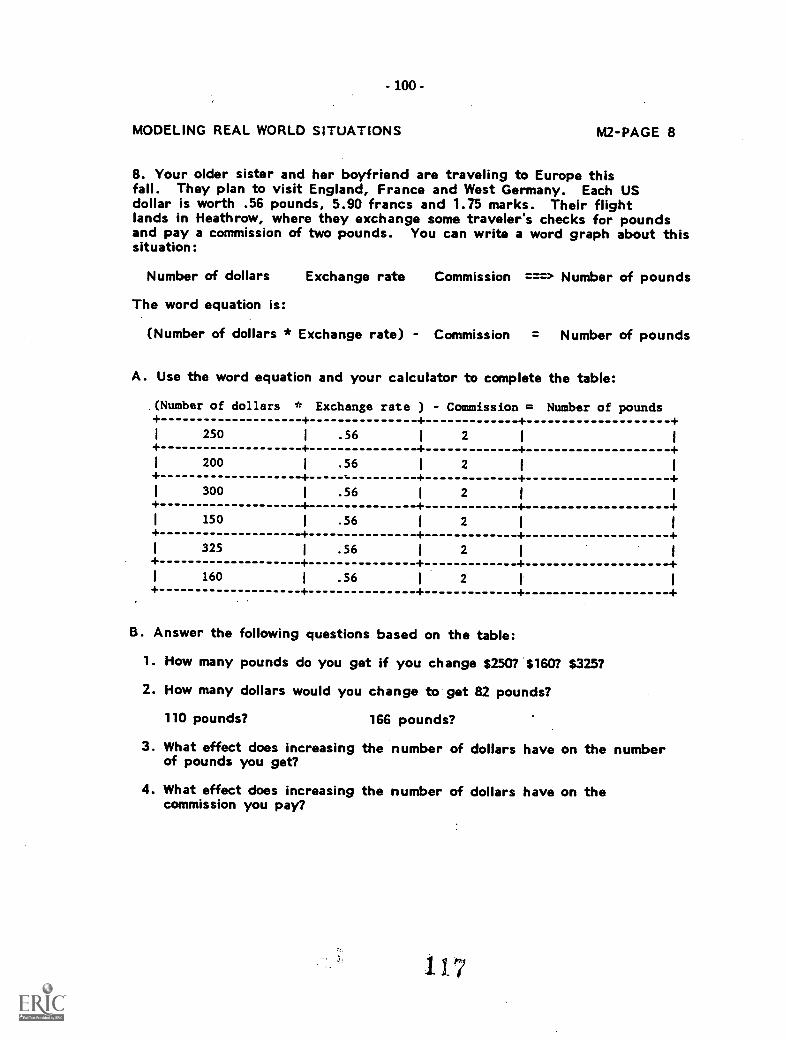
SE 053 264
Robyn, Abby; And OthersImplementing a Novel Computer-Related Algebra Course.RAND Note.Rand Corp., Santa Monica, Calif.National Science Foundation, Washington, D.C.RAND/N-3326-NSF/RC92R168D90023201p.RAND, 1700 Main Street, P.O. Box 2138, Santa Monica,CA 90407-2138.Guides Classroom Use Instructional Materials (For
MF01/PC09 Plus Postage.*Algebra; *Computer Assisted Instruction; *CurriculumDevelopment; Curriculum Evaluation; High Schools;High School Students; Lesson Plans; *MathematicsCurriculum; Mathematics Education; Microcomputers;Problem Solving; Program Implementation; StudentAttitudes
IDENTIFIERS NCTM Curriculum and Evaluation Standards
ABSTRACTThe standards developed for reform in mathematics
education by the National Council of Teachers of Mathematics (NCTM)de-emphasize the algorithmic manipulation of mathematical symbols.The NCTM takes the *position that the rapidly changing workplace is anenvironment that requires problem-solving skills with computers beingused to perform routine mathematical computations. This reportdescribes the computer-based information curriculum module developedfor beginning algebra to meet the challenges of the proposed reform.The RAND Algebra Tutor Project has been developing and pilotingintelligent computer tools for first-year algebra students. Variosproblems led to the development of a full curriculum in order tosuccessfully implement computer-assisted instruction. The curriculumdeparted from traditional algebra instructions in these ways: thepedagogy stressed situational learning in real-life problems,introducing a conceptual framework before local skills practice andused indictive instruction and cooperative learning. The curriculumachieved mixed effectiveness. In general, students were moresuccessful at creating and using qualitative models than quantitativemodels. Appendix A contains the 12 teacher lessons plans for thelinear equations unit and related student materials. Appendix Bcontains the evaluation measures for the arithmetic text, pre/posttests, student course evaluations, and unit evaluations. (Contains 36
Implementing a Novel Computer-RelatedAlgebra Course
Abby Robyn, Cathleen Stasz,David McArthur, Tor Ormseth,Matthew Lewis
BEST COPY AVAILABLE
"PERMISSION TO REPRODUCE THISMATERIAL HAS BEEN GRANTED BY
Elizabeth Gill
TO THE EDUCATIONAL RESOURCESINFORMATION CENTER (ERIC)."
U.S. DEPARTMENT OF EDUCATIONOffice of Educational Research and Improvement
EDUCATIONAL RESOURCES INFORMATIONCENTER (ERIC)
_IN This document has been reproduced as4-- received from the person or organization
originating itMinor changes have been made to improvereproduction quality.
Points of view or opinions stated in this document do not necessarily represent officialOE RI position or policy.
The research described in this report was supported by the National Science Foundationunder Grant No. R168D90023 and by RAND using its own research funds.
RAND is a nonprofit institution that seeks to improve public policy throughresearch and analysis. Publications of RAND do not necessarily reflect theopinions or policies of the sponsors of RAND research.
Published 1992 by RAND1700 Main Street, P.O. Box 2138, Santa Monica, CA 90407-2138
A RAND NOTE I N-3326-NSF/RC
Implementing a Novel Computer-RelatedAlgebra Course
Abby Robyn, Cathleen Stasz,David McArthur, Tor Ormseth,Matthew Lewis
Supported by theNational Science Foundation
RAN D
- iii
PREFACE
The research reported in this Note is part of an ongoing series of studies to develop
and field test an intelligent computer tutor for basic algebra and describes, in particular, a
model for transferring technology into the classroom. This project was supported by RAND,
using its own funds; and it incorporated software developed with a grant from the National
Science Foundation as a part of its Applications of Advanced Technologies Program.
5
- v -
SUMMARY
The crisis in education articulated in A Nation At Risk (1983) and the Carnegie report
(1986) has focused extensively on the poor mathematics performance of American students.
This concern is reflected in the 1986 National Assessment of Education Progress (Dossey et
al., 1988) and in the complaints of employers that workers do not have appropriate skills to
contribute successfully to a technology-dominated workplace (Romberg, 1987). In response to
the call for reform, the National Council of Teachers of Mathematics (NCTM) proposed a new
set of standards for K-12 mathematics instruction (Romberg, 1987). It suggests a variety of
fundamental content changes for mathematics education. At the most general level, the
NCTM standards emphasize the need for students to learn higher-order thinking and
problem-solving skills. Conversely, the standards deemphasize the rote or algorithmic
manipulation of mathematical symbols, arguing both that the rapidly changing workplace
demands the acquisition of flexible problem-solving skills and that computers should take
over the computation of routine mathematical results.
The NCTM standards lead to several specific questions concerning the content of
mathematics courses and the role of computers in the classroom. What problem-solving and
higher-order thinking skills should replace traditional ones in the classroom? What
techniques should be used to teach these new skills? How should computers be introduced
into these courses to support students' thinking by doing routine mathematical
computations? Should computers be used simply as a problem-solving resource or should
they take a more active role in teaching students?
The RAND Algebra Tutor Project has been developing and piloting intelligent
computer tools for first-year algebra students. However, inadequate training, new
instructional, pedagogical, and organizational goals, and logistical problems all contribute to
the difficulty of effectively implementing computer-assisted instruction. It has become clear
to us that successful implementation of a technology-based course requires the development
of a full curriculum, comprising a set of support materials that permit the classroom culture
to change to take advantage of the tools and new curriculum content. In this Note, we
describe the curriculum module for beginning algebra that we developed to meet the
challenges discussed above.
6
-vi-
THE CURRICULUM
The curriculum we developed departed from traditional algebra instruction in three
ways: The pedagogy stressed new techniques situating learning in real-life problems,
introduced a conceptual framework before local skills practice, and used inductive instruction
and cooperative learning; the course content included innovative topics-modeling, covariate
relationships, and problem-solving strategies; and the teaching tools included daily access to
an intelligent tutoring system. A multidisciplinary team composed of computer scientists,
cognitive and educational psychologists, implementation and curriculum experts, and
teachers developed the cognitive goals for the course and the course materials. Curriculum
materials included teacher lesson plans, parallel computer and non-computer activities for
students, and evaluation instruments.
Content Goals
The course subject matter centered on teaching students various model-building skills,
similar to those noted in NCTM and other related research (e.g., Fey, 1984; Thompson and
Rathmell, 1988; Usiskin, 1985). By model-building skills we mean the ability to see how
formal mathematical objects can relate to the real worldfor example, how equations can
provide powerful descriptions, or models, of the interactions among real-world objects or
properties. Model building includes several skills rarely taught in traditional classrooms:
formulating which objects or properties of a real-world situation should be represented as
mathematical objects or variables; data gathering, representation, and building qualitative
models; translating qualitative models into quantitative ones; and making inferences about
the behavior of variables.
Pedagogical Goals
The pedagogical goals adhered to the principles that problem solving should reflect the
real world and take advantage of computer capabilities. Thus, coursework problems should
be grounded. jn natural situations such as after school jobs, rock concerts, and pollution, and
problem solving should reflect the cooperative arrangements frequently found in the
workplace. Moreover, whenever possible, learning should occur through induction rather
than didactic presentation, and global skills such as strategic goals for problem solving
should be taught before the skills of symbol manipulation.
Computer Tools
Two computer environments were built to help students engage in each of the main
activities involved in model building, formulation, data gathering and representation,
- vii -
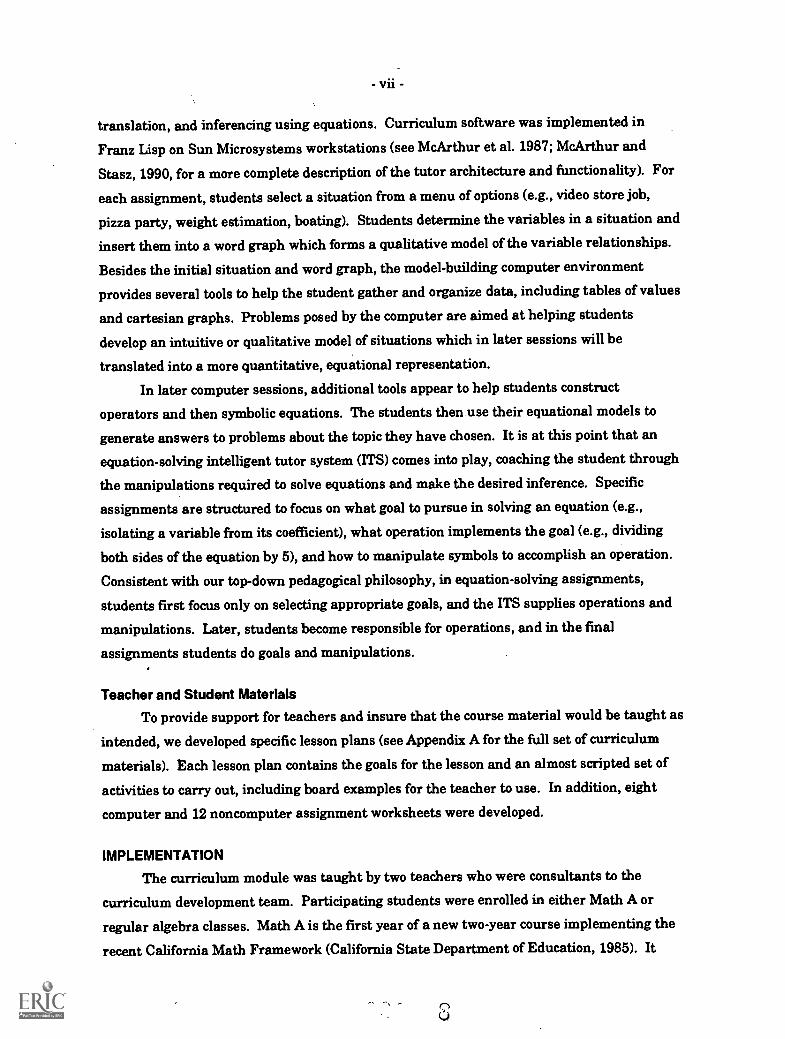
translation, and inferencing using equations. Curriculum software was implemented in
Franz Lisp on Sun Microsystems workstations (see McArthur et al. 1987; McArthur and
Stasz, 1990, for a more complete description of the tutor architecture and functionality). For
each assignment, students select a situation from a menu of options (e.g., video store job,
pizza party, weight estimation, boating). Students determine the variables in a situation and
insert them into a word graph which forms a qualitative model of the variable relationships.
Besides the initial situation and word graph, the model-building computer environment
provides several tools to help the student gather and organize data, including tables of values
and cartesian graphs. Problems posed by the computer are aimed at helping students
develop an intuitive or qualitative model of situations which in later sessions will be
translated into a more quantitative, equational representation.
In later computer sessions, additional tools appear to help students construct
operators and then symbolic equations. The students then use their equational models to
generate answers to problems about the topic they have chosen. It is at this point that an
equation-solving intelligent tutor system (ITS) comes into play, coaching the student through
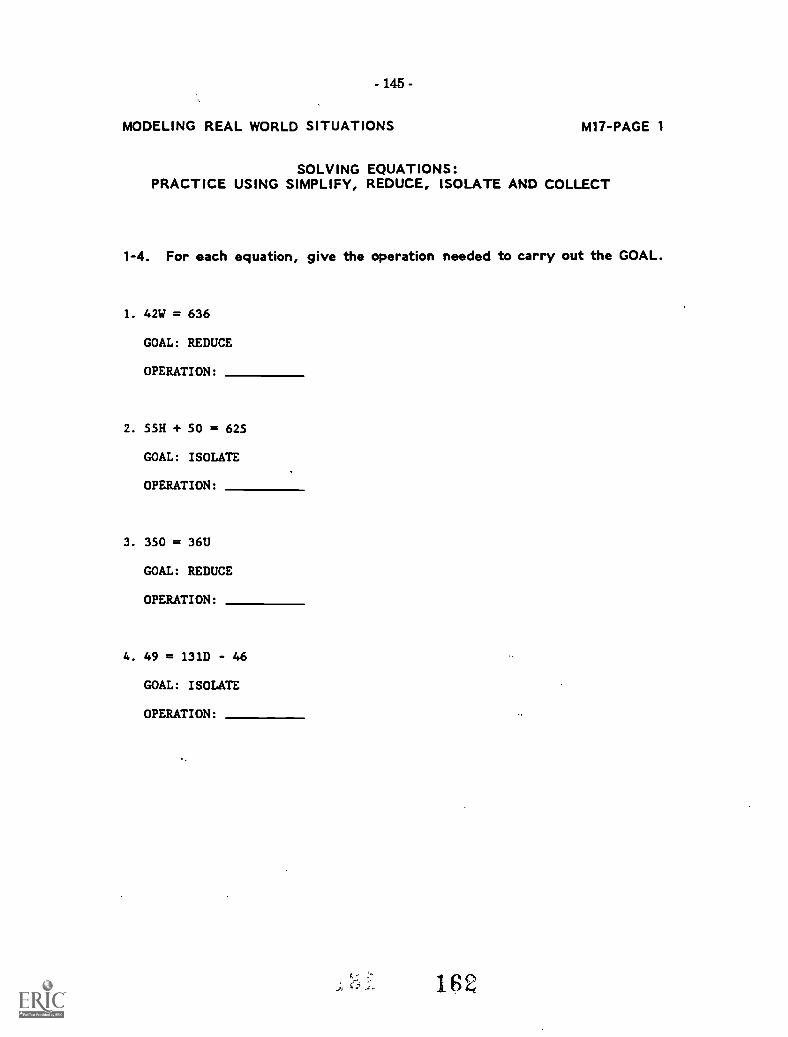
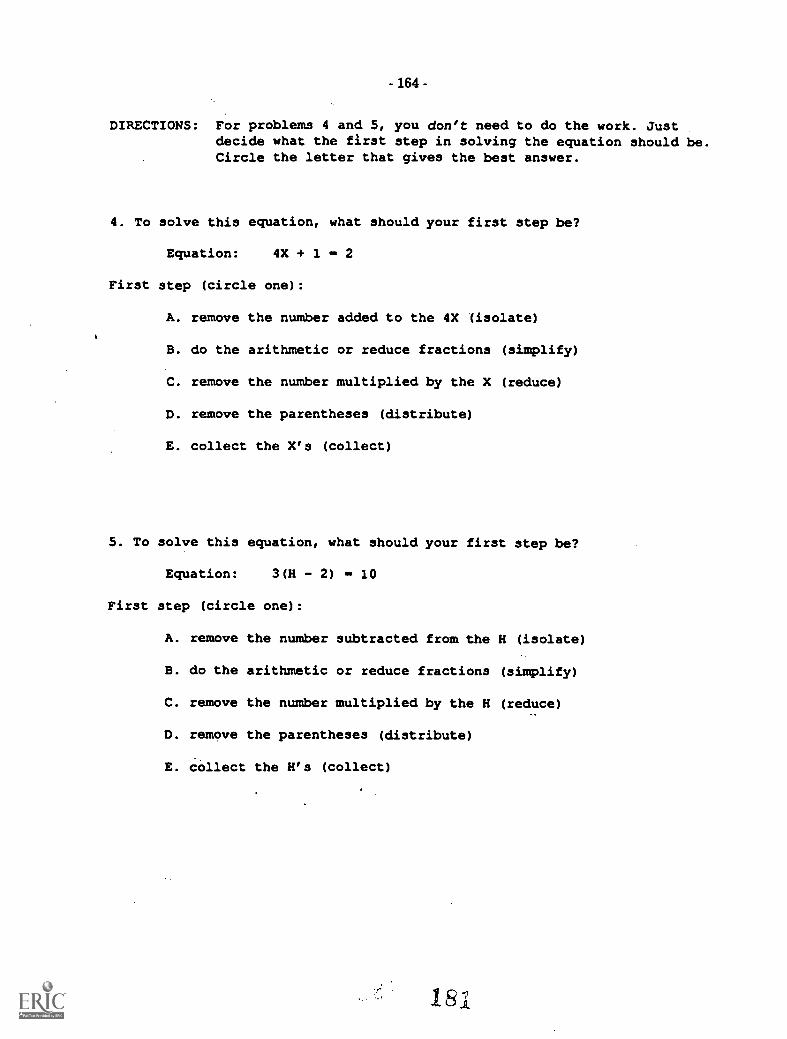
the manipulations required to solve equations and make the desired inference. Specific
assignments are structured to focus on what goal to pursue in solving an equation (e.g.,
isolating a variable from its coefficient), what operation implements the goal (e.g., dividing
both sides of the equation by 5), and how to manipulate symbols to accomplish an operation.
Consistent with our top-down pedagogical philosophy, in equation-solving assignments,
students first focus only on selecting appropriate goals, and the ITS supplies operations and
manipulations. Later, students become responsible for operations, and in the final
assignments students do goals and manipulations.
Teacher and Student Materials
To provide support for teachers and insure that the course material would be taught as
intended, we developed specific lesson plans (see Appendix A for the full set of curriculum
materials). Each lesson plan contains the goals for the lesson and an almost scripted set of
activities to carry out, including board examples for the teacher to use. In addition, eight
computer and 12 noncomputer assignment worksheets were developed.
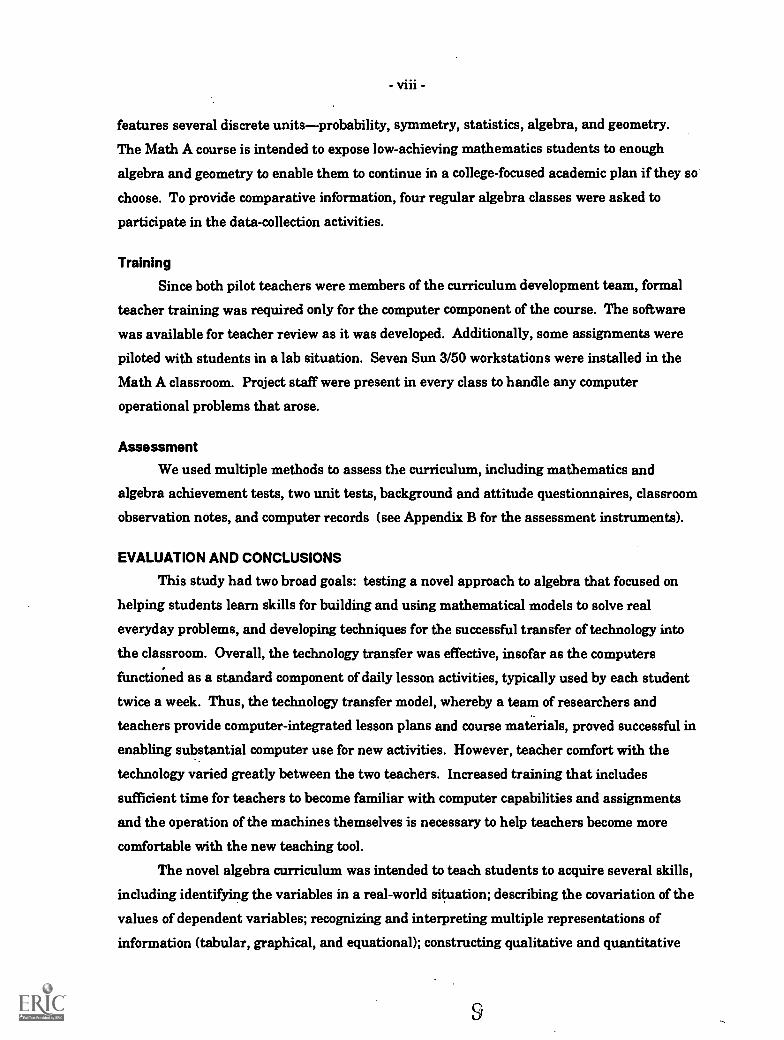
IMPLEMENTATION
The curriculum module was taught by two teachers who were consultants to the
curriculum development team. Participating students were enrolled in either Math A or
regular algebra classes. Math A is the first year of a new two-year course implementing the
recent California Math Framework (California State Department of Education, 1985). It
features several discrete unitsprobability, symmetry, statistics, algebra, and geometry.
The Math A course is intended to expose low-achieving mathematics students to enough
algebra and geometry to enable them to continue in a college-focused academic plan if they so
choose. To provide comparative information, four regular algebra classes were asked to
participate in the data-collection activities.
Training
Since both pilot teachers were members of the curriculum development team, formal
teacher training was required only for the computer component of the course. The software
was available for teacher review as it was developed. Additionally, some assignments were
piloted with students in a lab situation. Seven Sun 3/50 workstations were installed in the
Math A classroom. Project staff were present in every class to handle any computer
operational problems that arose.
Assessment
We used multiple methods to assess the curriculum, including mathematics and
algebra achievement tests, two unit tests, background and attitude questionnaires, classroom
observation notes, and computer records (see Appendix B for the assessment instruments).
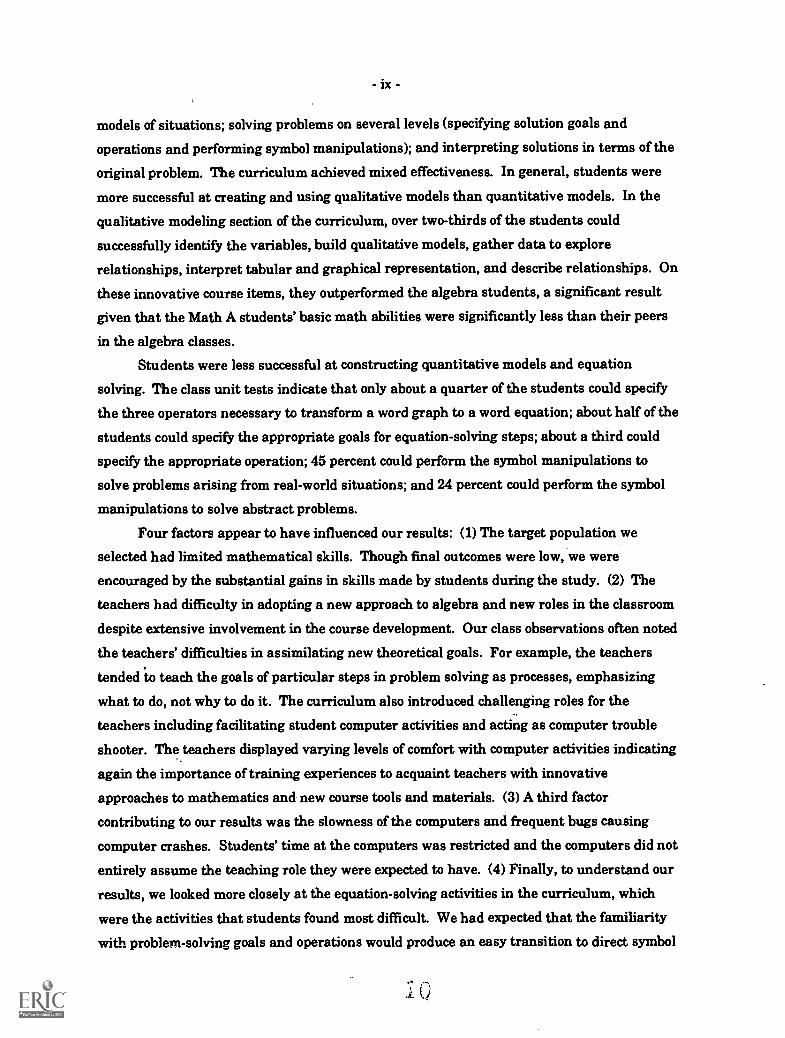
EVALUATION AND CONCLUSIONS
This study had two broad goals: testing a novel approach to algebra that focused on
helping students learn skills for building and using mathematical models to solve real
everyday problems, and developing techniques for the successful transfer of technology into
the classroom. Overall, the technology transfer was effective, insofar as the computers
functioned as a standard component of daily lesson activities, typically used by each student
twice a week. Thus, the technology transfer model, whereby a team of researchers and
teachers provide computer-integrated lesson plans and course materials, proved successful in
enabling substantial computer use for new activities. However, teacher comfort with the
technology varied greatly between the two teachers. Increased training that includes
sufficient time for teachers to become familiar with computer capabilities and assignments
and the operation of the machines themselves is necessary to help teachers become more
comfortable with the new teaching tool.
The novel algebra curriculum was intended to teach students to acquire several skills,
including identifying the variables in a real-world situation; describing the covariation of the
values of dependent variables; recognizing and interpreting multiple representations of
information (tabular, graphical, and equational); constructing qualitative and quantitative
models of situations; solving problems on several levels (specifying solution goals and
operations and performing symbol manipulations); and interpreting solutions in terms of the
original problem. The curriculum achieved mixed effectiveness. In general, students were
more successful at creating and using qualitative models than quantitative models. In the
qualitative modeling section of the curriculum, over two-thirds of the students could
successfully identify the variables, build qualitative models, gather data to explore
relationships, interpret tabular and graphical representation, and describe relationships. On
these innovative course items, they outperformed the algebra students, a significant result
given that the Math A students' basic math abilities were significantly less than their peers
in the algebra classes.
Students were less successful at constructing quantitative models and equation
solving. The class unit tests indicate that only about a quarter of the students could specify
the three operators necessary to transform a word graph to a word equation; about half of the
students could specify the appropriate goals for equation-solving steps; about a third could
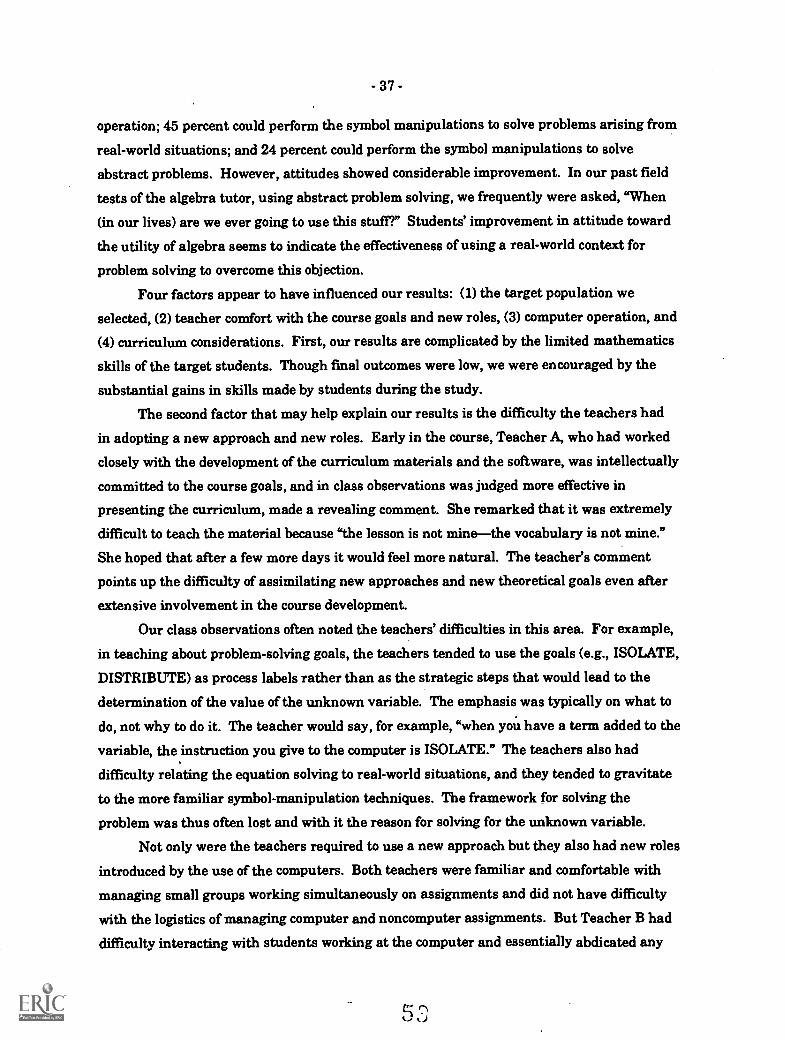
specify the appropriate operation; 45 percent could perform the symbol manipulations to
solve problems arising from real-world situations; and 24 percent could perform the symbol
manipulations to solve abstract problems.
Four factors appear to have influenced our results: (1) The target population we
selected had limited mathematical skills. Though final outcomes were low, we were
encouraged by the substantial gains in skills made by students during the study. (2) The
teachers had difficulty in adopting a new approach to algebra and new roles in the classroom
despite extensive involvement in the course development. Our class observations often noted
the teachers' difficulties in assimilating new theoretical goals. For example, the teachers
tended to teach the goals of particular steps in problem solving as processes, emphasizing
what to do, not why to do it. The curriculum also introduced challenging roles for the
teachers including facilitating student computer activities and acting as computer trouble
shooter. The teachers displayed varying levels of comfort with computer activities indicating
again the importance of training experiences to acquaint teachers with innovative
approaches to mathematics and new course tools and materials. (3) A third factor
contributing to our results was the slowness of the computers and frequent bugs causing
computer crashes. Students' time at the computers was restricted and the computers did not
entirely assume the teaching role they were expected to have. (4) Finally, to understand our
results, we looked more closely at the equation-solving activities in the curriculum, which
were the activities that students found most difficult. We had expected that the familiarity
with problem-solving goals and operations would produce an easy transition to direct symbol
- x -
manipulation. Students had only one computer assignment to practice direct symbol
manipulation. Students' poor equation-solving skills may indicate that more practice in
direct symbol manipulation is desirable or that the top-down approach to problem solving
was not effective in promoting acquisition of equation-solving skills. Students may require
more familiarity with symbol manipulation before they are able to specify problem-solving
goals. Though their overall posttest equation-solving scores were low, students did make
significant gains in their skills, particularly in nonabstract equation solving. Students were
twice as successful in solving equations that arose from real-world situations as they were in
solving exactly the same type of equation presented abstractly. We speculate that situating
equations allow students to draw on their intuitive and experiential resources and is more
intrinsically motivating.
NEXT STEPS
Our next step is an expanded version of the curriculum module described above to
include material on statistics. We will use the technology transfer model successfully fielded
in this pilot but will devote more attention to teacher training and teacher assimilation of
course goals.
ii
- xi
ACKNOWLEDGMENTS
We are indebted to the adventurous teachers, students, and administrators of Santa
Monica High School for their cooperation and patience in allowing us to pilot the innovative
approach to algebra reported here. In particular, we would like to thank Catherine Baxter,
who spent countless hours helping to develop and edit the courseware and transform it into a
teachable curricular unit.
We would also like to thank Jeff Rothenberg for his thoughtful comments which
greatly improved the comprehensibility of this document; James Hodges who provided
statistical consulting for the design and analysis of this study; and Rosa Meza, Donna White
and Joyce Gray who ably assisted in the preparation of this manuscript for publication.
CONTENTS
PREFACE iii
SUMMARY
ACKNOWLEDGMENTS xi
FIGURES AND TABLES xv
Section1. INTRODUCTION 1
2. THE CURRICULUM 4Approach to Curriculum Development 4Content Goals 5Pedagogical Goals 6The Computer Tools 7
Teacher and Student Materials 12
A Typical Lesson 14
3. IMPLEMENTATION 17The Study Participants 17
Teacher and Student Training 18Classroom Operations and Data-Gathering Procedures 19
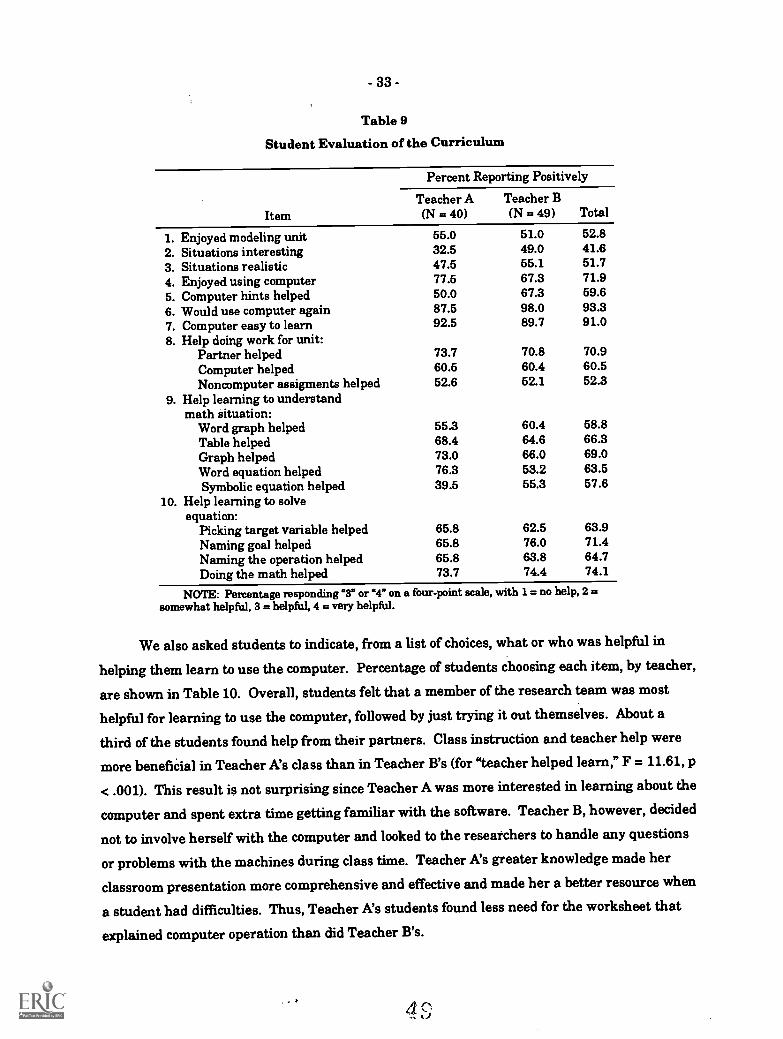
4. EVALUATION OF THE CURRICULUM 21Evaluation Design 21Student Characteristics and Attitudes 22Student Learning 25Math A Student Outcomes and Changes 27Classroom Observations 31Student Evaluation of the Curriculum 32
1. Student Characteristics 222. Attitudes Towards Math at Pretest 243. Computer Experience 254. Arithmetic and Algebra Achievement Scores for All Students 265. Algebra Achievement by Teacher 276. Unit Test Results by Teacher 287. Standardized Subtest Scores by Teacher 288. Significant Changes in Mathematics Attitudes 319. Student Evaluation of the Curriculum 33
10. Student Evaluation of Help to Learn Computer Use 3411. Best and Worst Features of the Curriculum 34
- 1 -
1. INTRODUCTION
The crisis in education articulated in A Nation At Risk (1983) and the Carnegie report
(1986) has focused extensively on the poor mathematics performance of American students.
This concern is reflected in the 1986 National Assessment of Educational Progress (Dossey et
al., 1988) and in the complaints of employers that workers do not have appropriate skills to
contribute successfully to a technology-dominated workplace (Romberg, 1987). In response to
the call for reform, the national council of teachers of mathematics (NCTM) proposed a new
set of standards for K-12 mathematics instruction (Romberg, 1987). It suggests a variety of
fundamental content changes for mathematics education. At the most general level, the
NCTM standards emphasize the need for students to learn higher-order thinking and
problem-solving skills. Conversely, the standards deemphasize the rote or algorithmic
manipulation of mathematical symbols, arguing both that the rapidly changing workplace
demands the acquisition of flexible problem-solving skills and that computers should take
over the computation of routine mathematical results.
The NCTM standards lead to several specific questions concerning the content of
mathematics courses and the role of computers in the classroom. What problem-solving and
higher-order thinking skills should replace traditional ones in the classroom? What
techniques should be used to teach these new skills? How should computers be introduced
into these courses to support students' thinking by doing routine mathematical
computations? Should computers be used simply as a problem-solving resource or should
they take a more active role in teaching students?
The RAND Algebra Tutor Project has been working for the last four years on
developing and piloting intelligent computer tools for first-year algebra students. Our work
began with the development of an intelligent tutoring system (ITS)'to help students learn
symbol manipulation skills for solving problems in basic algebra (McArthur, 1987; McArthur
et al., 1987; McArthur et al., 1988; McArthur and Stasz, 1990). Consistent with the NCTM
standards, subsequent versions of our ITS have focused on helping students learn more
"strategic" reasoning skills in algebra, leaving the "tactics" of symbol manipulation to the
computer. For example, one version decomposes solving equations into several levels of
decisionmaking and requires students to specify only the goals or operations needed to solve
an equation (e.g., "collect terms" or "add 5 to both sides") whereas the ITS executes the lower-
level symbol manipulation that implements these instructions.
15
- 2 -
We have found that in partnerships where much of the underlying mathematical
manipulation is being handled by the computer, students have opportunities to focus on
important aspects of problem solving (e.g., defining variables, describing relationships among
variables, developing strategies for problem solution) that are often difficult to include in
traditional classroom instruction. However, we have also found that shifting the emphasis of
our algebra tutor from more conventional content and pedagogy to such partnerships leads to
problems integrating the technology into the classroom. Like other tutoring systems
(Schoenfeld and Verban, 1988, Strudler and Gall, 1988), the algebra tutor suffered from
implementation difficulties (see Robyn et al., 1989; Stasz et al., 1989).
Inadequate training, new instructional, pedagogical, and organizational goals, and
logistical problems all contributed to the difficulty of effectively implementing computer-
assisted instruction. We found that the classroom culture placed priority on covering a given
set of topics in a certain amount of time. Topics were taught didactically, and the pace of the
class was fast and textbook driven. The teacher and students were intent on covering
material relevant to the textbook and traditional test items. Tests emphasized skill in
abstract symbol manipulation. In addition, the teacher did not monitor students' work at the
computer, limiting her coaching to students engaged in noncomputer activity. As a result,
the nontraditional computer approach that we introduced, emphasizing higher-level
cognitive skills of problem-solving strategy, was not evaluated as part of the coursework and
hence had little value for students or teachers.
Given these fairly typical classroom features (Tobin, 1987), it has become clear that
implementing a technology-based course requires more than just the development of
computer tools that focus on novel mathematical skills. Successful implementation demands
the dev'elopment of a full curriculum, comprising a set of support materials that permit the
classroom culture to change to take advantage of the tools and new curriculum content.
Supports include lessons that directly integrate computer activities into the coursework,
training for teachers in managing the curriculum and technology, and a class setting freed
from having to teach to traditional tests and from traditional instructional sequences. We
believe these materials are as important as content and technology changes in improving the
quality of learning of mathematics in our classrooms.
In this Note we describe the curriculum module for beginning algebra that we
developed to meet the challenges discussed above. Our curriculum by no means addresses all
the problems associated with the reform of mathematics education and with the use of
computers in the classroom. Rather, it should be viewed as a prototype computer-based
course that attempts to address, in an integrated rather than piecemeal way, some problems
C
- 3 -
of mathematics curriculum content reform, the novel use of computers in the classroom, and
implementation problems that arise from these content and technology changes.
In Section 2 we describe the development and content of the curriculum. We discuss
our overall approach to curriculum development, the specific novel mathematical topics we
targeted, as well as the design of the computer software and teacher and student materials.
Section 3 discusses the implementation of the module, student and teacher training
procedures, and our assessment procedures. Section 4 evaluates the curriculum and its
implementation, and we conclude in Section 5 with a discussion of the study results and
proposed modifications of the curriculum.
- 4 -
2. THE CURRICULUM
The curriculum we developed departed from traditional algebra instruction in three
ways: The pedagogy stressed new techniques situating learning in real-life problems,
introduced a conceptual framework before local skills practice, and used inductive instruction
and cooperative learning; the course content included innovative topicsmodeling, covariate
relationships, and problem-solving strategies; and the teaching tools included daily access to
an intelligent tutoring system. Curriculum materials included teacher lesson plans, parallel
computer and noncomputer activities for students, and evaluation instruments. In this
section we elaborate on these aspects of the curriculum beginning with our overall approach
to curriculum development.
APPROACH TO CURRICULUM DEVELOPMENT
Designing a new curriculum that encompasses the features outlined above is a
complex undertaking that requires different kinds of expertise. Although computer scientists
and programmers can design computer-based learning tools, they may have little knowledge
of how to use computers in classrooms. To ensure the viability of computer tools and, more
generally, to develop a curriculum that would realistically transfer from the context of
development to the context of actual use, we formed a multidisciplinary curriculum
development team. This teamcomposed of computer scientists, cognitive and educational
psychologists, and implementation and curriculum expertsdetermined the cognitive goals
for the course and the basic course outline. The proposed outline was then reviewed by
several teachers, two of whom joined the development team. Two subgroups formed to
develop the course package; one group concentrated on computer software and the other on
teacher lesson plans. Throughout the three-month development period both teams met
frequently to ensure that software design meshed with other curriculum activities. The
highly interactive process led to frequent adjustments and modifications as materials were
actually developed and tested with a few students in a laboratory setting.
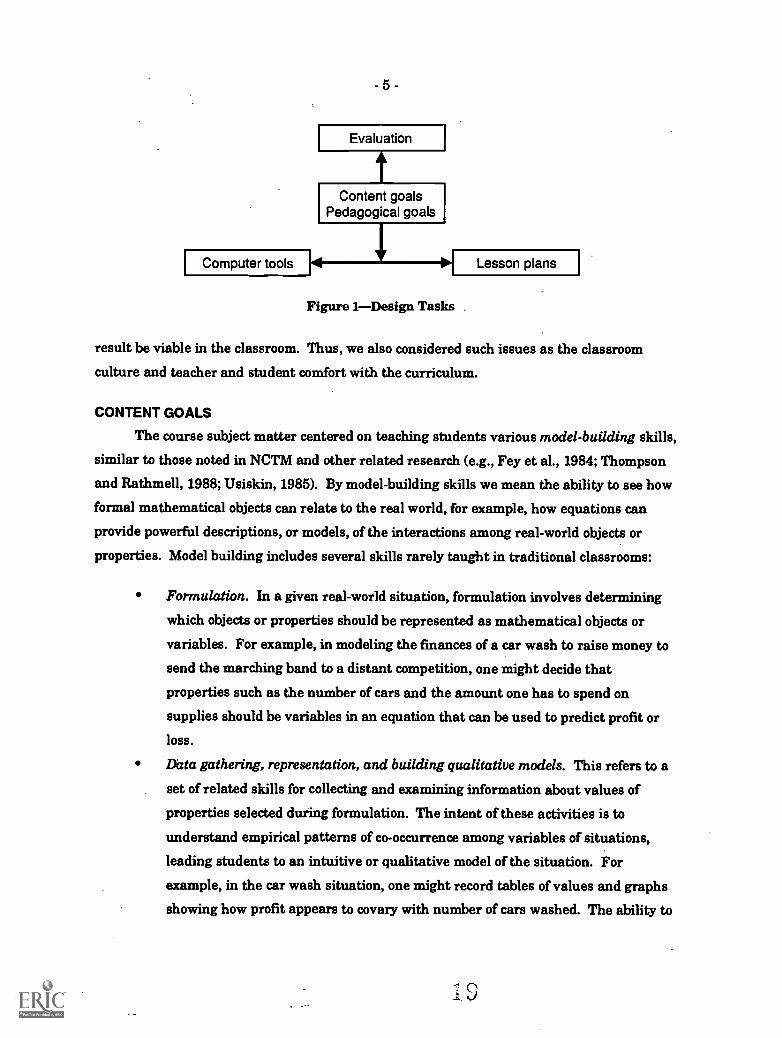
Figure 1 illustrates how we conceived the design task. Central to our planning were
content goalsthe specific kinds of knowledge and skills we wanted students to learnand
pedagogical goalsthe ways of learning and teaching course material we wished to promote.
These informed the development of software tools and lesson plans and dictated the
evaluation measures. Underlying this framework was a consistent concern that the end
- 5 -
Evaluation
Content goalsPedagogical goals
Computer tools j1Figure 1Design Tasks
Lesson plans
result be viable in the classroom. Thus, we also considered such issues as the classroom
culture and teacher and student comfort with the curriculum.
CONTENT GOALS
The course subject matter centered on teaching students various model-building skills,
similar to those noted in NCTM and other related research (e.g., Fey et al., 1984; Thompson
and Rathmell, 1988; Usiskin, 1985). By model-building skills we mean the ability to see how
formal mathematical objects can relate to the real world, for example, how equations can
provide powerful descriptions, or models, of the interactions among real-world objects or
properties. Model building includes several skills rarely taught in traditional classrooms:
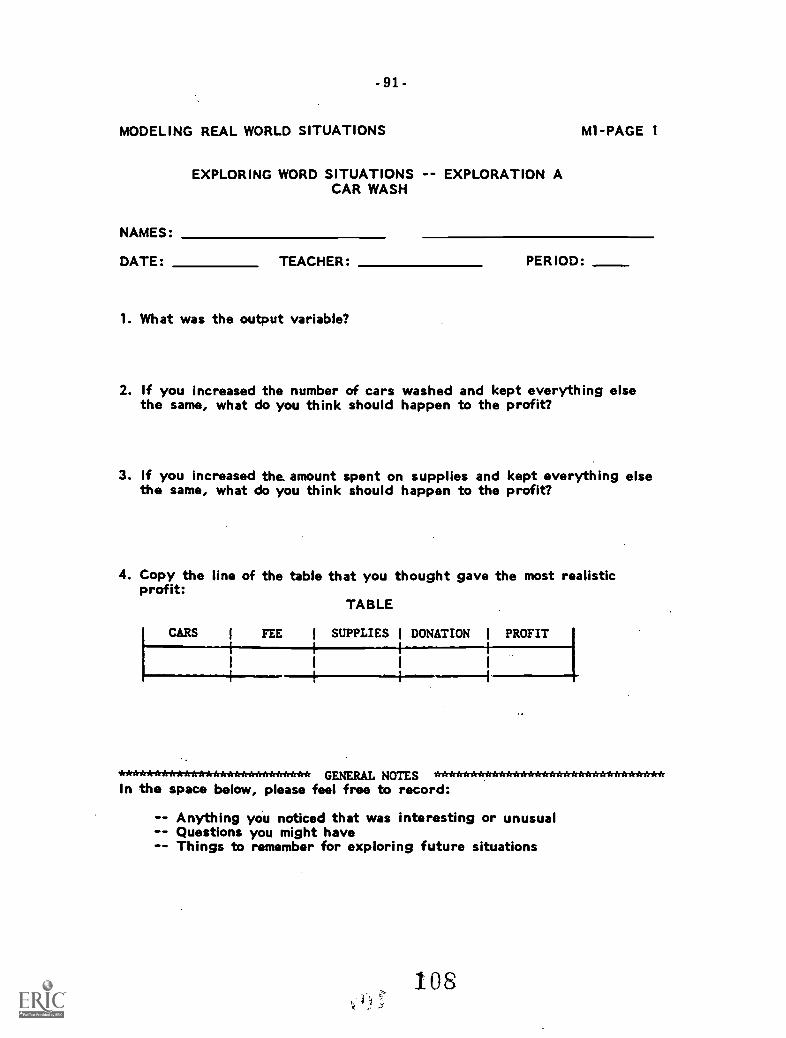
Formulation. In a given real-world situation, formulation involves determining
which objects or properties should be represented as mathematical objects or
variables. For example, in modeling the finances of a car wash to raise money to
send the marching band to a distant competition, one might decide that
properties such as the number of cars and the amount one has to spend on
supplies should be variables in an equation that can be used to predict profit or
loss.
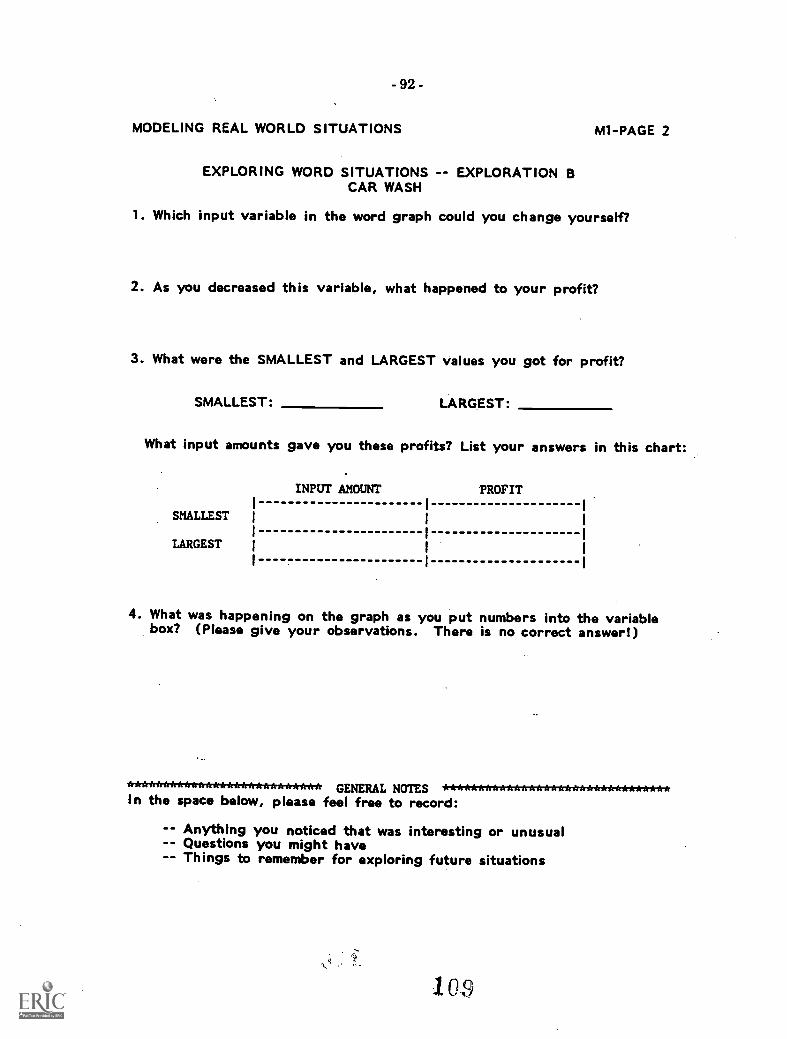
Data gathering, representation, and building qualitative models. This refers to a
set of related skills for collecting and examining information about values of
properties selected during formulation. The intent of these activities is to
understand empirical patterns of co-occurrence among variables of situations,
leading students to an intuitive or qualitative model of the situation. For
example, in the car wash situation, one might record tables of values and graphs
showing how profit appears to covary with number of cars washed. The ability to
I 0
- 6 -
use multiple representations of relationships is key to successful comprehension
of patterns in data (Kaput, 1989).
Translation of qualitative models into quantitative ones. Translation involves
positing an equational representation that captures the observed patterns of
interrelations of the formulated situational properties. For example, in the car
wash situation, translation may involve postulating an equation that relates the
variable for profit to variables representing the amount spent on supplies, the fee
charged per car, and so on. This skill is related to hypothesis generation.
Inferencing or prediction involves answering questions about the situation at
issue, either by manipulating equational representations or using less formal
guess-and-test or extrapolation techniques that use graphs and tables. For
example, given a problem in which one must infer the required duration of
exercise to achieve a given weight loss, one can use an equational model for the
situation or perhaps consult graphs and tables of values. This skill is related to
hypothesis testing.
PEDAGOGICAL GOALS
Our pedagogical approach also introduced some departures from traditional algebra
instruction.
Learning about mathematical tools in the context of natural situations. One
general principle we adhered to was that students needed to learn algebra as a
tool for solving problems in everyday life. Problems should be grounded in
natural situations and problem solving should reflect the cooperative
arrangements frequently found in the real world. High school algebra
coursework often focuses on abstract principles (e.g., the commutative rule) and
algorithms for solving abstract problems (e.g., the FOIL technique for multiplying
factors). Word problems are often thinly disguised wrappers for equally abstract
problems that seem to have little relevance to students' concerns. The new
NCTM math standards, other research (e.g., Fey et al., 1984; Schoenfeld, 1985;
Collins, Brown, and Newman, 1989), and our own experience underscore the
value of an approach grounded more in the real world. All coursework problems
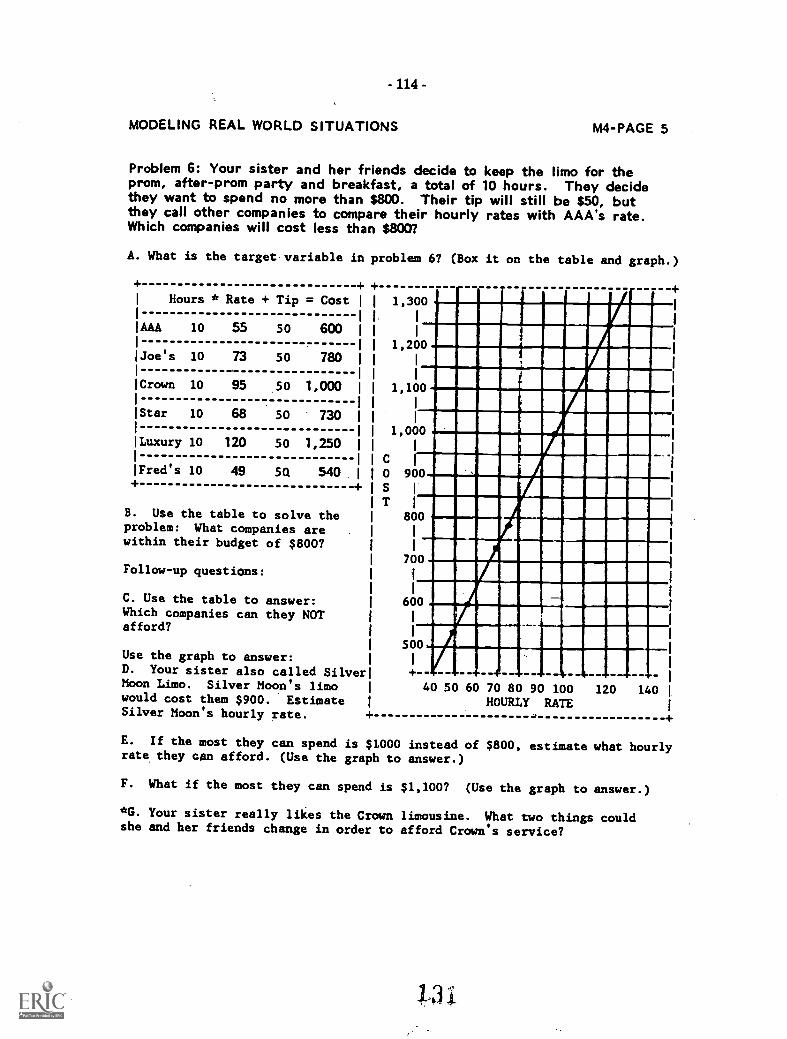
arose from familiar situations. We selected topics that were relevant to the lives
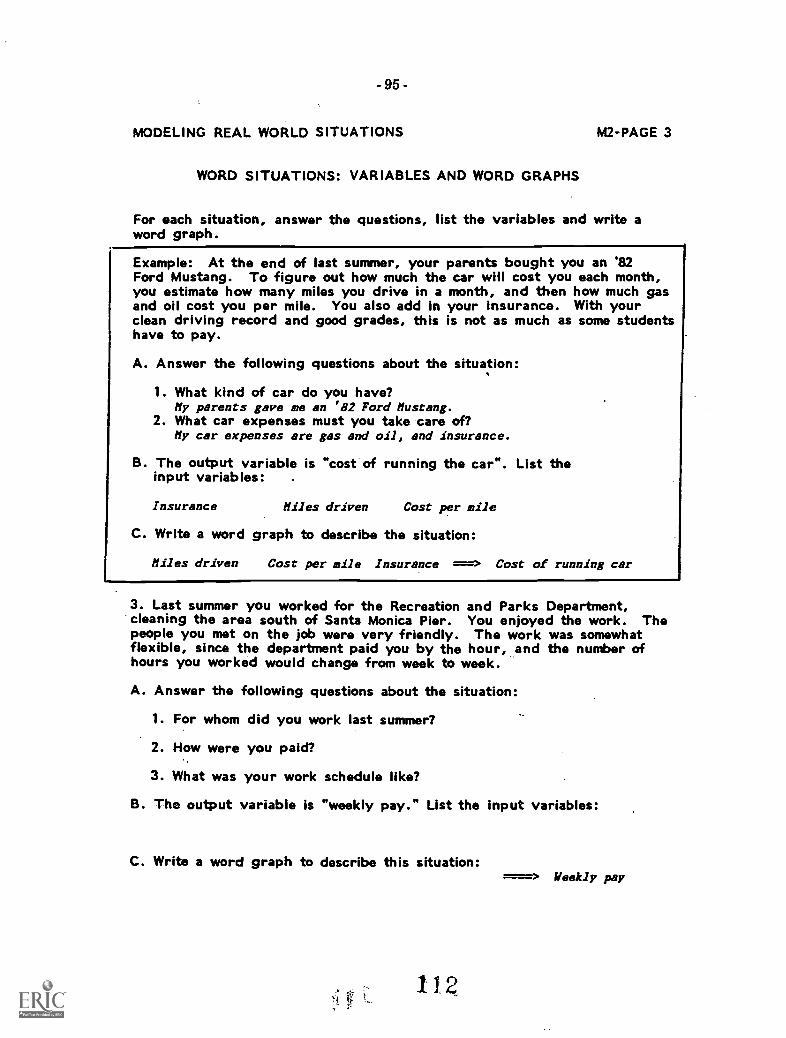
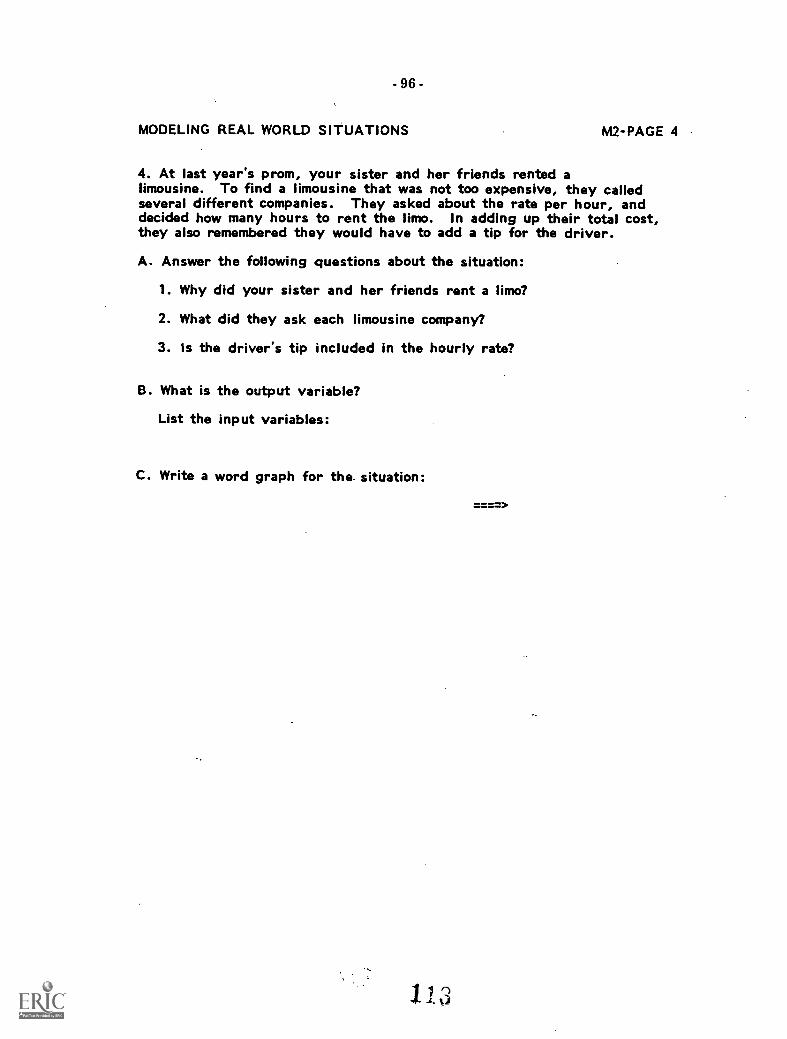
of 1980s teenagers, such as after school jobs, rock concerts, renting limousines for
the prom, and pollution of the local bay.
2'-
-7-
Global before local skills. A second pedagogical principle underlying the
curriculum was that students should be introduced to more global skills before
learning the skills for local operations (e.g., Brown, Collins and Duguid, 1988).
Thus, strategic goals for problem solving were introduced before specific symbol
manipulation techniques or algorithms. For example, students were taught to
specify the goals for each step in an equation solution before they were taught the
mathematics for accomplishing the goal. As discussed below, the computer
supported this approach by automatically doing the symbol manipulation.
Learning through inquiry as well as didactic presentation of material. Whenever
possible, material was introduced in ways that fostered inductive instruction
rather than by didactic presentation. The computer activity on covariation, for
example, required that students input different values for several variables and
then note the effect on an output variable. Students described how variables
might affect each other (e.g., positively, inversely) on an accompanying
worksheet. In this way, students were often able to use their strong informal
skills for describing relationships to form intuitive mathematical models of
relationships among variables before learning how to formalize them using
equations and how to manipulate the equations.
Group collaborative learning. When appropriate, students worked cooperatively
so that they could acquire skills in cooperative problem solving and take
advantage of the opportunities for more effective discussion and exploration
offered by this type of interaction (Slavin, 1986). Seatwork activities, such as an
assignment to construct a qualitative model for a T-shirt sale and build a table to
explore the effects of changes in the amounts of the variables, were often carried
out in groups of four students. All computer work was conducted by pairs of
students.
THE COMPUTER TOOLS
Different computer environments, including several common tools, were built to help
students engage in each of the main activities involved in model building, formulation, data
gathering and representation, and translation and inferencing using equations. More
generally, these activities reflect the basic organization of the course materials and
assignments. Early lessons and assignments focused on helping students determine which
aspects of verbal situations represented the mathematical objects or variables of interest.
21BEST COPY AVAILABLE
- 8 -
Then the students acquired skills for building input-output flow models of abstracted
situations. Following this, students explored covariate relationships among variables by
changing values of variables and observing the propagated effect on other variable values.
Once students had an opportunity to develop a qualitative understanding of the relationships
among variables, they were coached in expressing algebraic or quantitativemodels of the
relationships. Finally, the students learned to manipulate formalized equations to answer a
variety of specific questions about the situation. Here the embedded algebra ITS provided
several levels of coaching. Below, we discuss computer environments for each of these main
activities in the overall lesson plan.
Computer Environment for Formulation and Development of Qualitative Models
Curriculum software was implemented in Franz Lisp on Sun Microsystems
workstations (see McArthur et al., 1987; McArthur and Stasz, 1990, for a more complete
description of the tutor architecture and functionality). For each assignment, students can
select a situation from a menu of options (e.g., video store job, pizza party, weight estimation,
boating). The tutor keeps track of which assignments and situations students have
completed. The first time a student selects a situation he or she must always complete a
model-building activity that specifies component variables. Subsequently, the computer will
automatically rebuild the models, graphs, and tables that the student might have
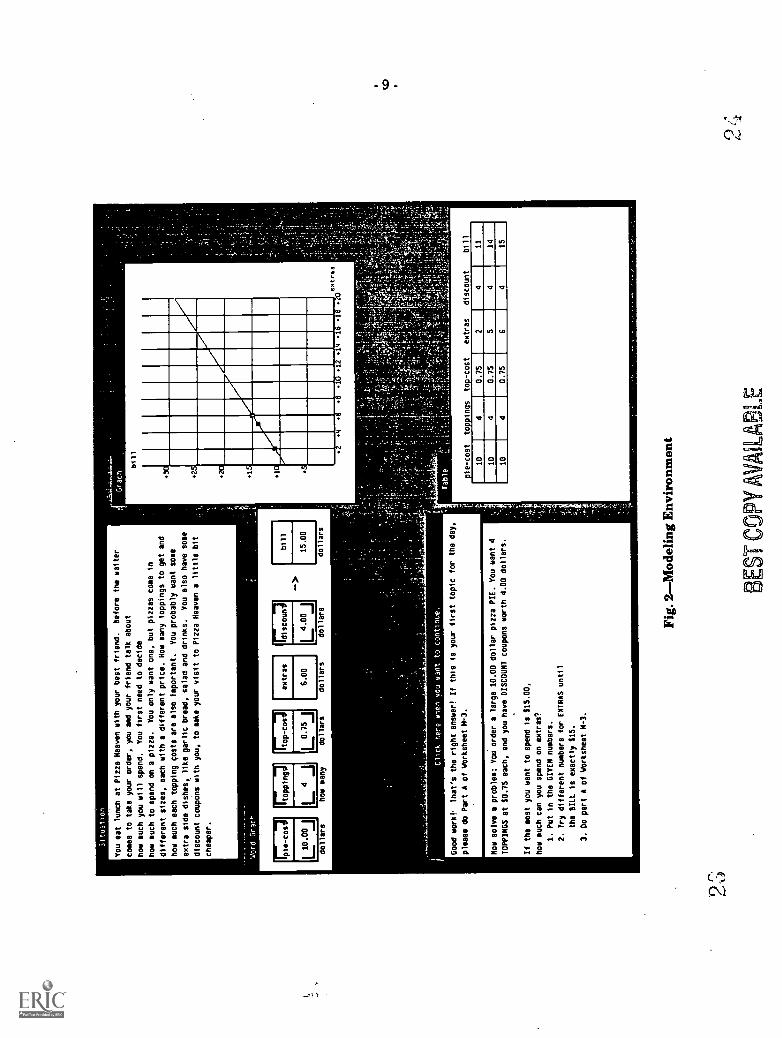
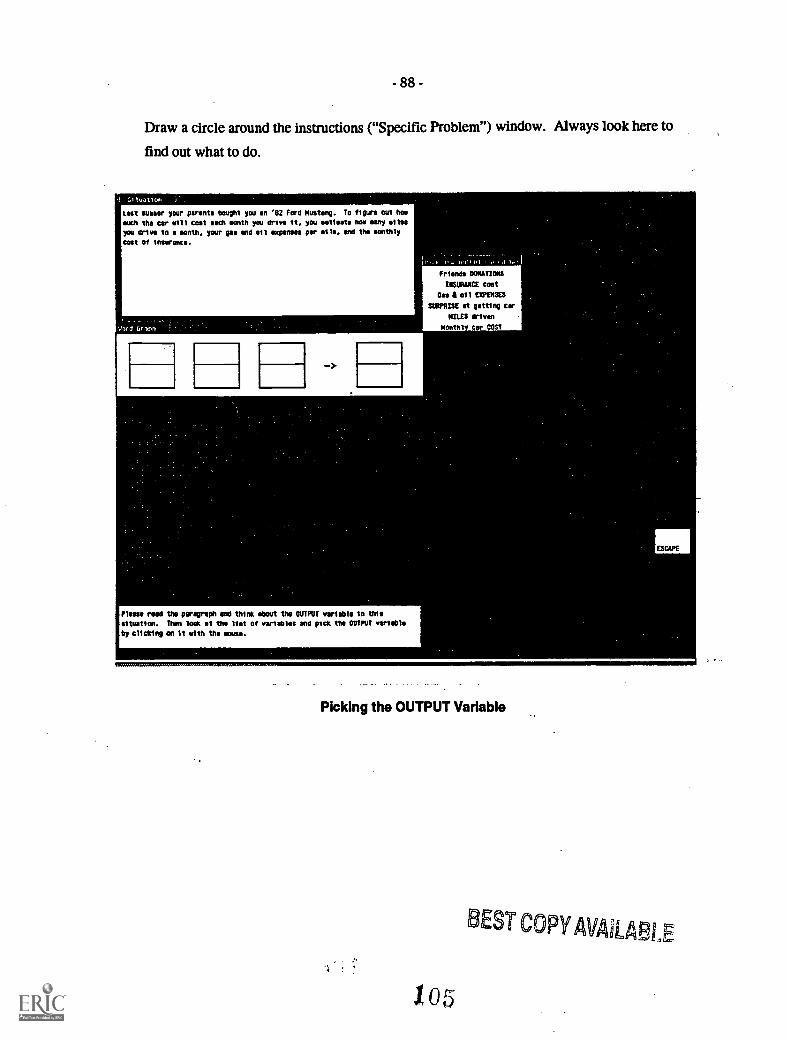
constructed in previous sessions. Figure 2 shows the model-building software interface for
an early assignment where students are interested in determining the variables in a
situation and gathering data to form a qualitative model of variable relationships. The
situation to be modeled is described verbally in the "situation window" at the upper left.
Notice that the situation description is not a verbal problem but an informal description of
variable relationships. Later, the student will answer several specific questions based on
this situation. Below the situation description is a "word graph" where the student inserts
variables he or she has identified from a menu. The variables relate the dependent variable
to various independent factors. Using the word graph, the student can input values for
selected variables. The tutor then computes the appropriate values for other variables, based
on an underlying equation that relates the variables.
In the early assignment shown in Fig. 2, the student's goal is to use guess-and-test
strategies to understand co-occurrence relationships among variables and to answer specific
questions. Students insert values into the word graph boxes and the environment provides
several tools in which the data are automatically plotted to help the student gather and
organize the data. These tools include tables of values (lower right) and cartesian graphs
22
2
SituitIon
You eat lunch at Pizza Heaven with your best friend.
Before the waiter
copes to take your order, you and your friend talk about
how much you will spend.
You first need to decide
how much to spend on a pizza.
You only want one, but pizzas come in
different sizes, each with a different price. Now many toppings to get and
how much each topping costs are also ',portant.
You probably want some
extra side dishes, like garlic bread, salad and drinks.
You also have some
discount coupOns with you, to make your visit to Pizza Heaven a little bit
cheaper.
',lord Grath
ME
V12
0.00
1
dollars
1212
:1
L°J
how many
extras
>bill
121.75j
6.00
12.0
0115.00
dollars
dollars
dollars
dollars
Croon
bill
Click here den you want to continue.
Good works
That's the right answer! If this is your first topic for the day,
please do Part A of Ybrksheet M-3.
Now solve a problem: You order a large 10.00 dollar pizza PIE. You want 4
TOPPINGS at $0.75 each, and you have DISCOUNT coupons worth 4.00 dollars.
If the most you want to spend is 115.00,
how much can you spend on extras?
1. Put in the GIVEN numbers.
2. Try different numbers for EXTRAS until
the BILL is exactly 515.
3. Do part A of Worksheet H-3.
eras
ie-cost
toppings
top -cost
extras
discount
bill
10
40.75
24
11
10
40.75
54
14
10
40.75
64
15
Fig.
2M
odel
ing
Env
iron
men
t
BE
ST C
OPY
AV
AIL
AB
LE
0/'
-10-
(upper right). In addition, the student is guided in data gathering by specific problems
(lower left). After students have a chance to freely explore varying values for variables, the
problems generally constrain the student to explore covariation of pairs of variables. Here,
students can vary the amount spent on "extras" (side dishes) while the pie cost, toppings cost,
number of toppings, and discount coupon value stay the same. The data gathered in this
"constrained exploration" permit the student to observe a positive linear relationship
between the amount spent on the "extras" and the total bill. In addition to answering
specific questions, these early assignments were to help students develop an intuitive or
qualitative model of situations which in later sessions would be translated into a more
quantitative, equational representation.
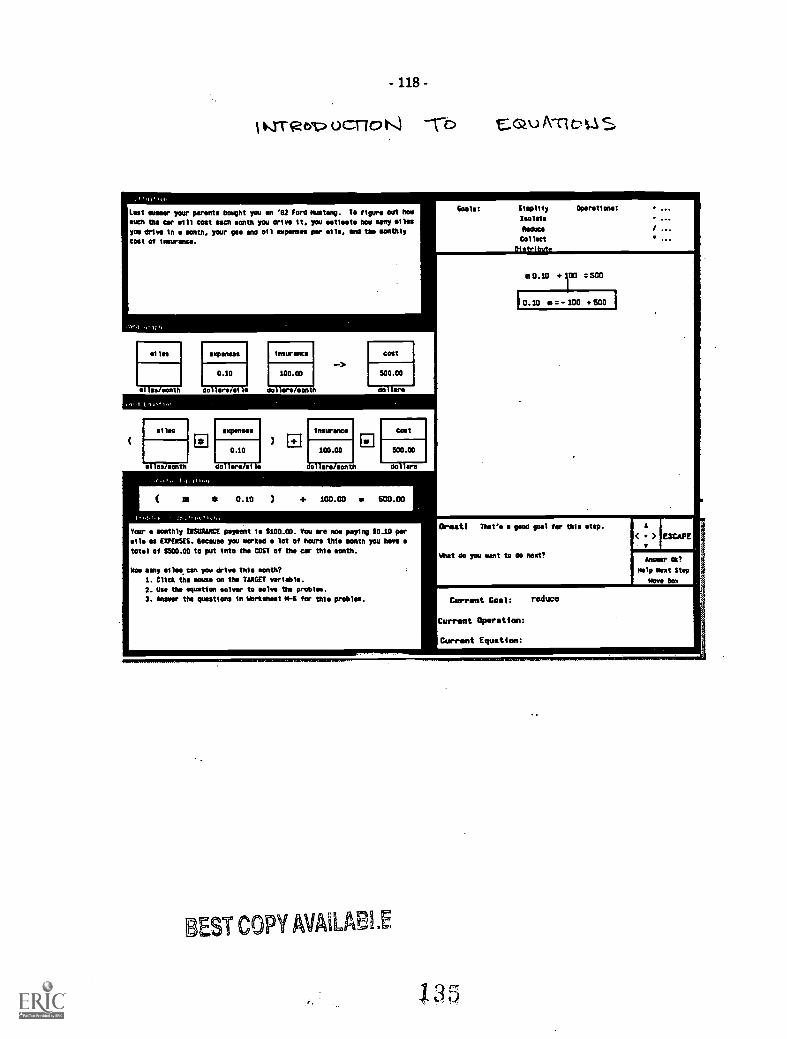
Computer Environment for Translation and Answering Specific Questions
In later assignments students could choose to work with the same situations they
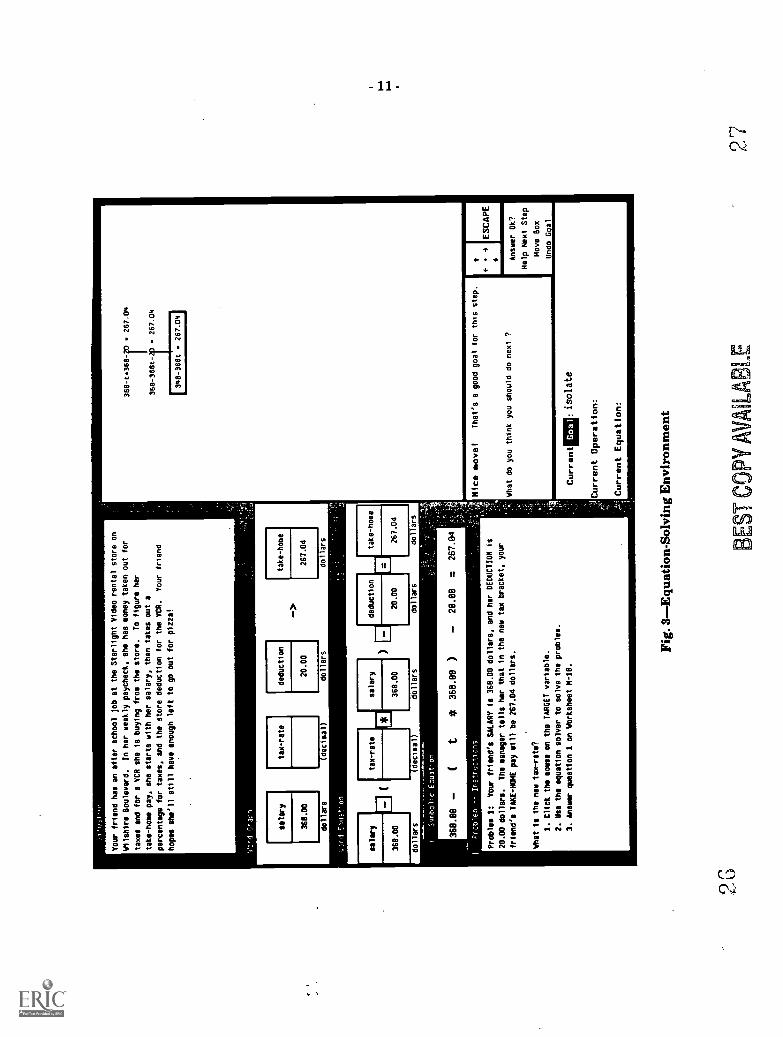
informally investigated on a previous day. As Fig. 3 shows, many computer tools (e.g., the
situation description and word graph) are retained in later sessions. In addition, several
tools appear to help students construct operators (*, I, +, -) and equations for the situation
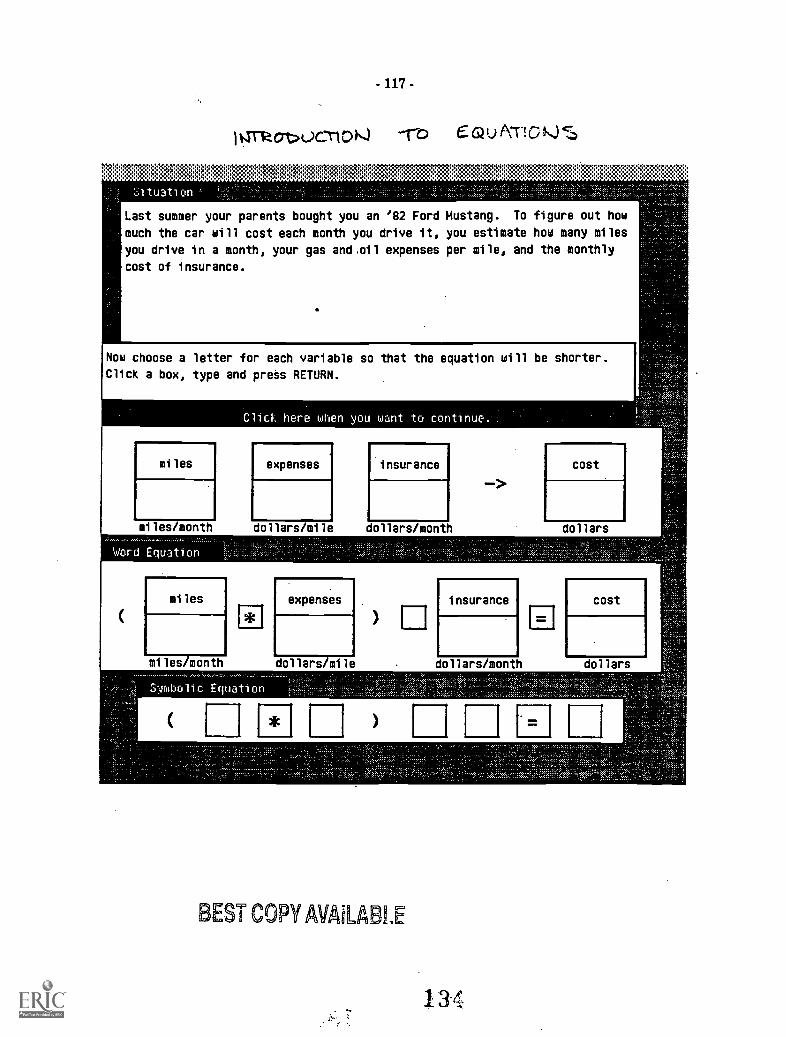
and to answer specific problems. Equations are first represented as "word equations" (below
the word graph in Fig. 3), which look like word graphs with operators connecting the "boxes"
that represent variables. Next, symbolic equations are computed from word equations by
substituting letters for variable boxes (see Fig. 3). Subsequently, students are given a series
of problems about the topic. The students can then use their equational models to generate
answers. It is at this point that the equation-solving ITS comes into play, coaching the
student through the manipulations required to make the desired inference.
The algebra ITS embeds several kinds of knowledge that help it tutor students in
solving equations. It knows the subjectthe ITS is an expert in solving problems in simple
symbolic algebra; it knows the studentit can infer limited diagnostic models of the
students' knowledge of algebra; and it knows something about teachingit includes some
simple rules of pedagogy that help it determine what information to provide and when to
provide it. The ITS's knowledge of algebra is articulate in a way that enables students to
learn the different skills for solving equations in a systematic and top-down fashion. When
solving an algebra problem, the ITS reasons separately about what goal to pursue (e.g.,
isolating the unknown), what operation implements the goal (e.g., adding 5 to both sides of
the equation), and how to manipulate the symbols to accomplish an operation. Because the
ITS algebra knowledge is articulate, we can structure specific student assignments to focus
on each of these different levels of knowledge. In Fig. 3, for example, the student is solving
25
0
Your friend has an after school job at the Starlight Video rental store on
Wilshire Boulevard.
In her weekly paycheck, she has money taken out for
taxes and for a VCR she is buying fros the store.
To figure her
take-home pay, she starts with her salary, then takes out a
percentage for taxes, and the store deduction for the VCR.
Your friend
hopes she'll still have enough left to go out for pizza!
rd,,rash
salary
360.
00
dollars
tax-rate
decimal)
deduction
20.00
dollars
take-home
267.04
dollars
salary
tax-rate
salary
deduction
368.00
368.00
20.00
dollars
deci
mal
rdollars
dollars
SW
4,01
1CPw3tnon
take-home
267.04
dollars
360.08
(t
* 368.88
)28.88
=267 04
Prc,blen
Ir'struc,:iCns
Problem 1:
Your friend's SALARY is 360.00 dollars, and her DEDUCTION is
20.00 dollars.
The manager tells her that in the new tax bracket, your
friend's TAKE-HOME pay will be 267.04 dollars.
What is the new tax-rats?
1. Click the souse on the TARGET variable.
2. Use the equation solver to solve the problem.
3. Answer question 1 on Worksheet M-18.
Nice move)
That's a good goal for this step.
what do you think you should do next /
+
a
ESCAPE
Answer Ok?
Help Next Step
Move Box
Undo 6.0
Current: isolate
Current Operation:
Current Equation:
Fig.
3E
quat
ion-
Solv
ing
Env
iron
men
t
BE
ST C
OPY
AV
AiL
AB
LE
6
- 12 -
the symbolic equation developed to reflect the problem posed in the problem window at the
lower left. Once developed, the symbolic equation automatically appears in the equation-
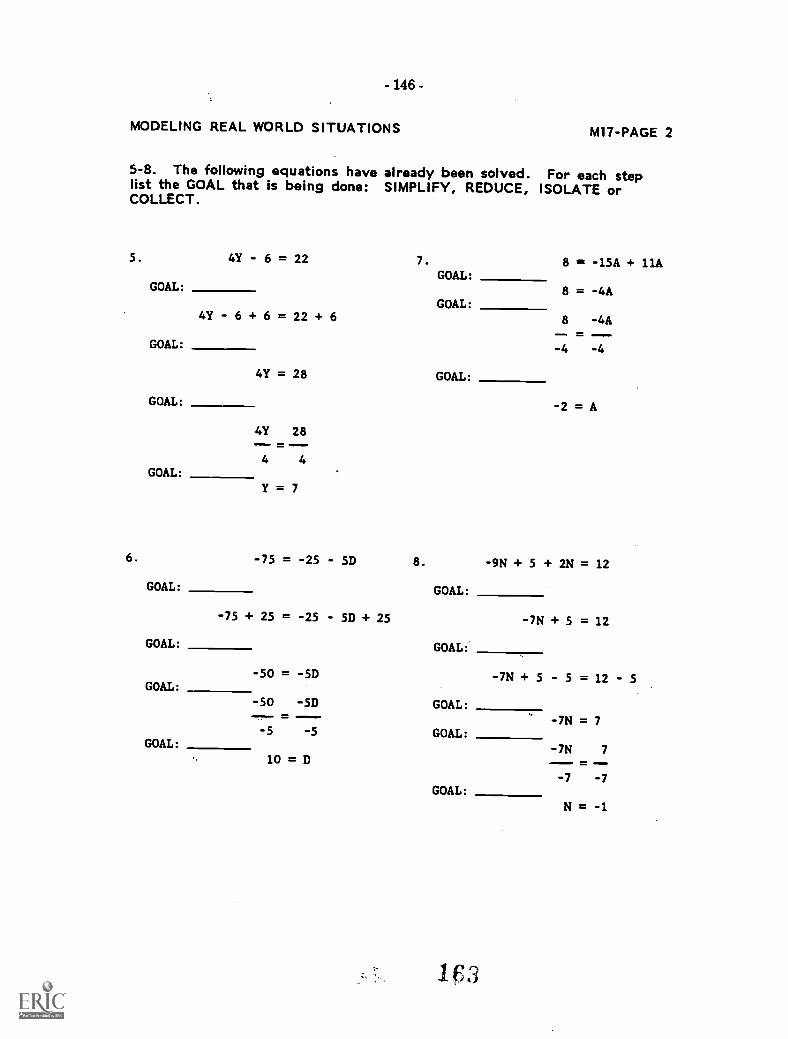
solver windows on the right. In this example, the student is working at the goal level,
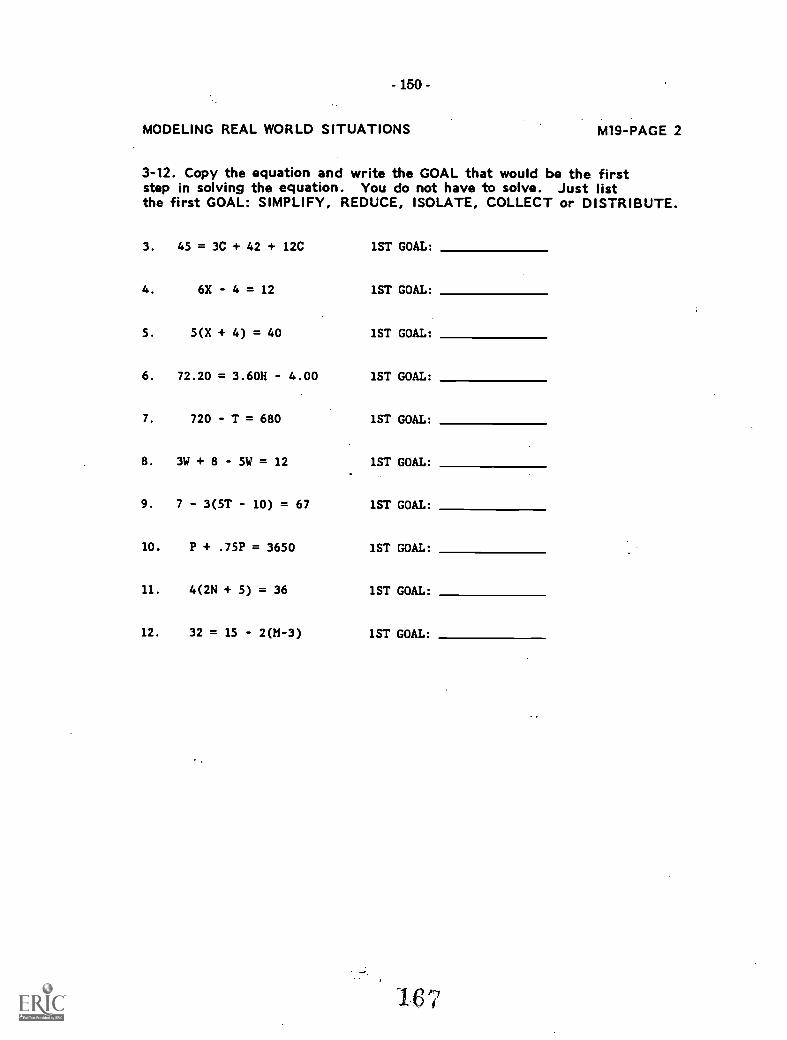
specifying appropriate goals for each step of the equation. Goals include SIMPLIFYING the
equation, ISOLATING the variable, COLLECTING terms, REDUCING and
DISTRIBUTING. The ITS, in this example, is prompting the student for the goal for the
next step in solving the equation (lower-right window) and, if the goal the student selects can
be executed, the ITS will automatically implement the operation and manipulation necessary
to carry out the goal. In this way, learning and problem solving involve role sharing between
the computer and student. The current step in solving the equation is indicated by a box.
Student-computer role profiles are defined for each assignment and determine what
work will be done by student and by machine. This permits flexible cooperation. Consistent
with our top-down pedagogical philosophy, in equation-solving assignments the standard role
profile dictates that the student will first select only goals and that the ITS will supply
operations and manipulations. Later, students become responsible for operations, and in the
final assignments students do goals and manipulation. Thus, only at the end of the course
will students do the "symbol crunching" that is central to most introductory algebra courses.
The algebra ITS also embeds several other pedagogical rules. In the model-building
activities, students can select correct variables, operators, or symbols. If they make two
errors in a row, the computer supplies the correct term. In the data collection/covariation
activities, students continue collecting data until they feel they have the right answer. The
activity is open-ended, allowing for unlimited exploration, and no coaching is provided. In
the equation-solving environment, students have access to the equation solver by asking for
"help." The tutor will specify the conditions for that step in the equation and the goal,
operation, or symbol manipulation as appropriate for the problem. If further help is
requested, the tutor will illustrate how to perform the step. Students can also ask the tutor
to check whether any equation in the solution tree is correct.
TEACHER AND STUDENT MATERIALS
Teacher Materials
To provide support for teachers and insure that the course material would be taught as
intended, we developed specific lesson plans (see Appendix A for full set of curriculum
materials). Introductory material in the curriculum package describes the course goals and
the pedagogical techniques to be used. A typical lesson begins with a review of a previous
topic. The teacher next introduces the topic of the day and provides practice exercises for the
- 13 -
topic that are completed by the class and then reviewed with the teacher. Then individual
(or small group) practice is conducted either through noncomputer or computer assignments.
Each lesson plan contains the goals for the lesson and an almost scripted set of activities to
carry out, including board examples for the teacher to use. Specific lessons are included for
introducing the various computer environments. Teachers also have available printed review
sheetsused for warm-ups and practice activities, noncomputer assignment sheets,
computer assignment sheets, and vugraphs of materials for whole class review. The lesson
plans, computer assignments, and tests for each of the two units were developed by the
research staff with teacher input, and most of the review assignments and noncomputer
assignments were developed by the teachers with staff input. We hoped by this process to
thoroughly acquaint the teachers with the course goals, pedagogy, and materials.
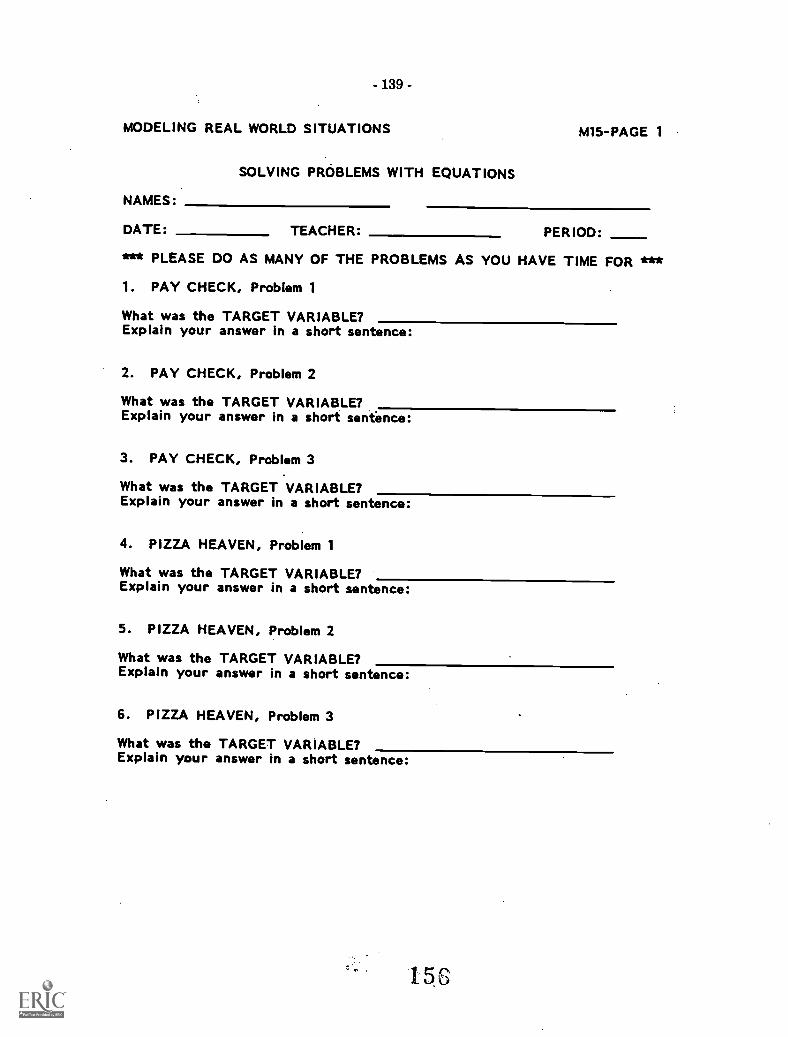
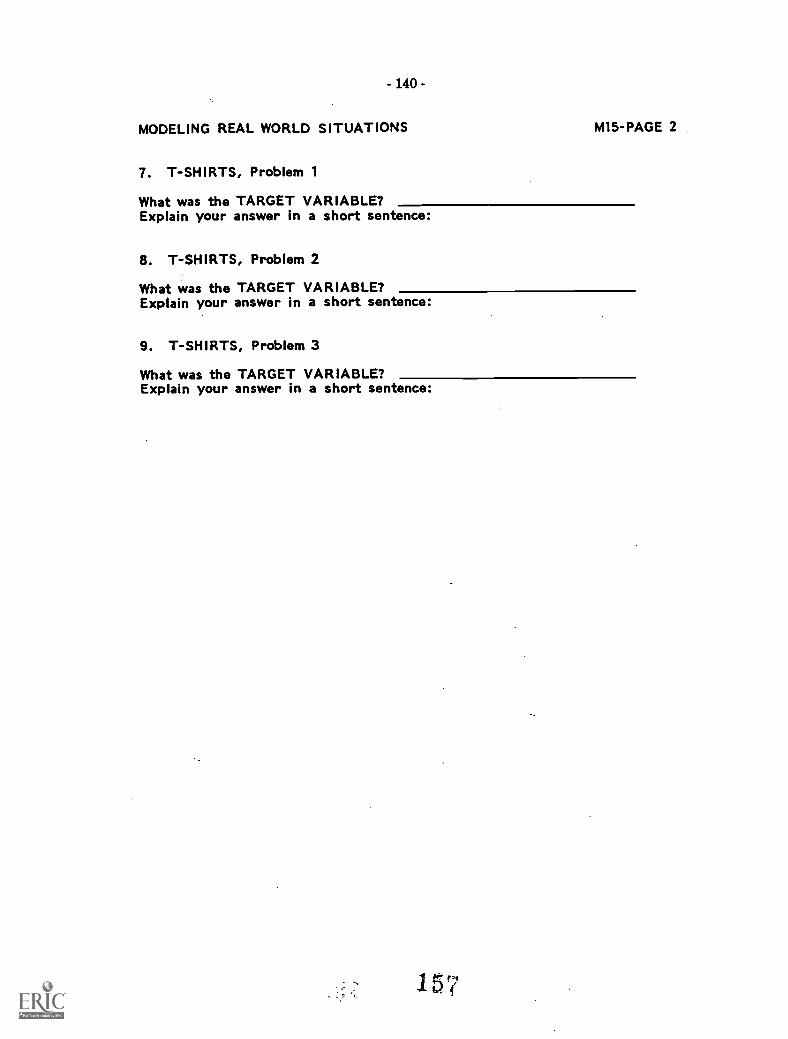
Student Materials
Twenty assignments were prepared for studentseight computer assignments and 12
noncomputer assignments. Students received booklets that contained all of their assignment
worksheets. Each computer assignment was accompanied by a brief worksheet on which
students could record the situations selected and the results of their explorations and note
the methods they had used. These worksheets were designed primarily to provide hardcopy
records of student computer work for teacher use and to make computer and noncomputer
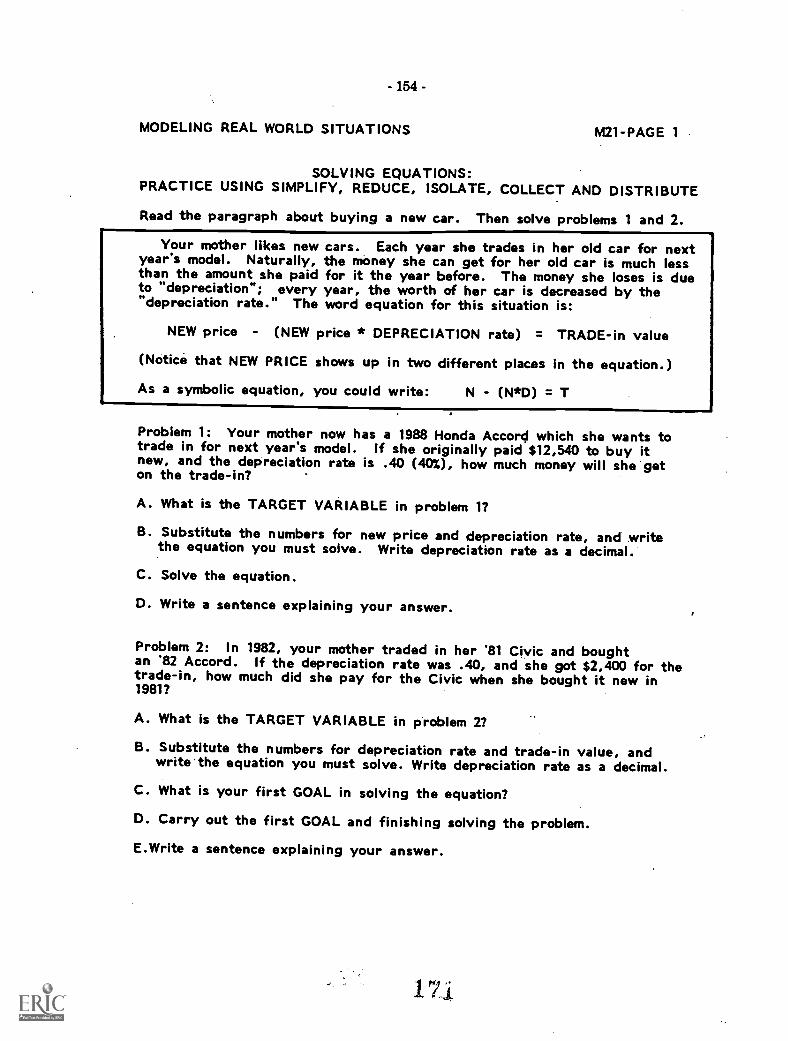
assignments more alike. Whenever possible, noncomputer assignments parallel computer
assignments but do not necessarily share the same features. For example, in exploring
covariation on the computer, an underlying equation permits the tutor to compute a missing
value. In paper assignments, the equation is explicit and is computed by students. In
equation solving with the tutor, the student can solve an equation by specifying goals while
the computer handles all the symbol manipulation. In noncomputer assignments, students
can specify a goal for a specific solution step, but until they can perform the symbol
manipulation corresponding to the goal, they cannot move the solution ahead to the next
step.
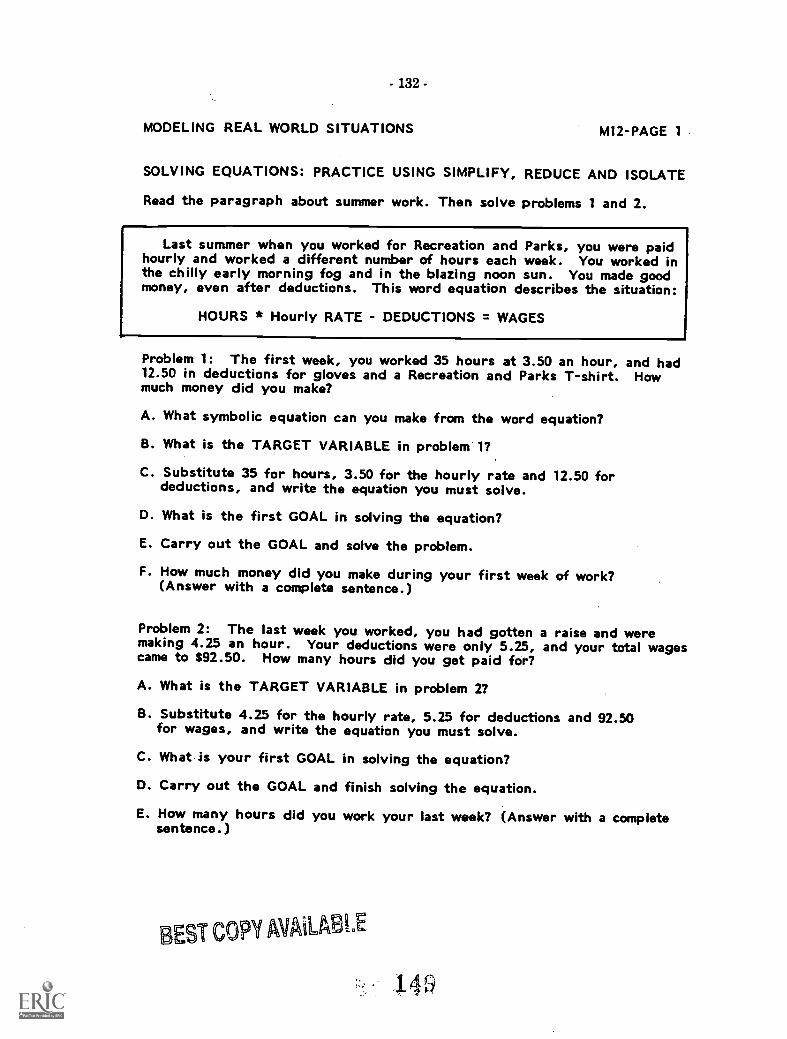
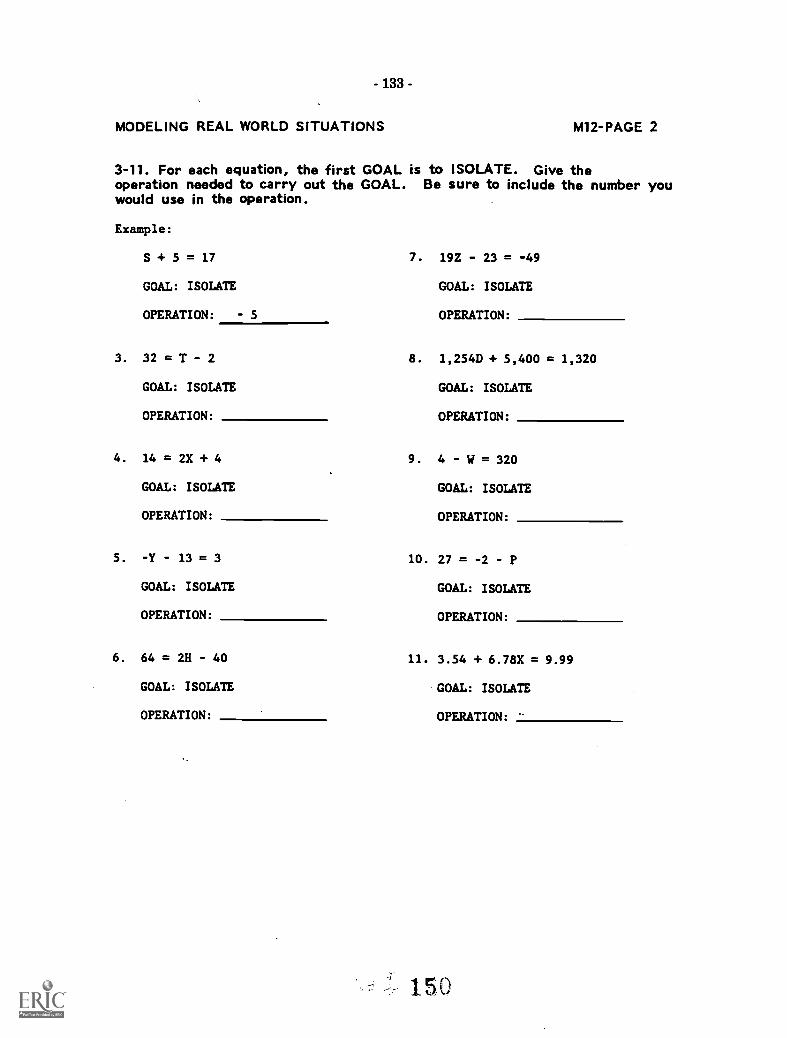
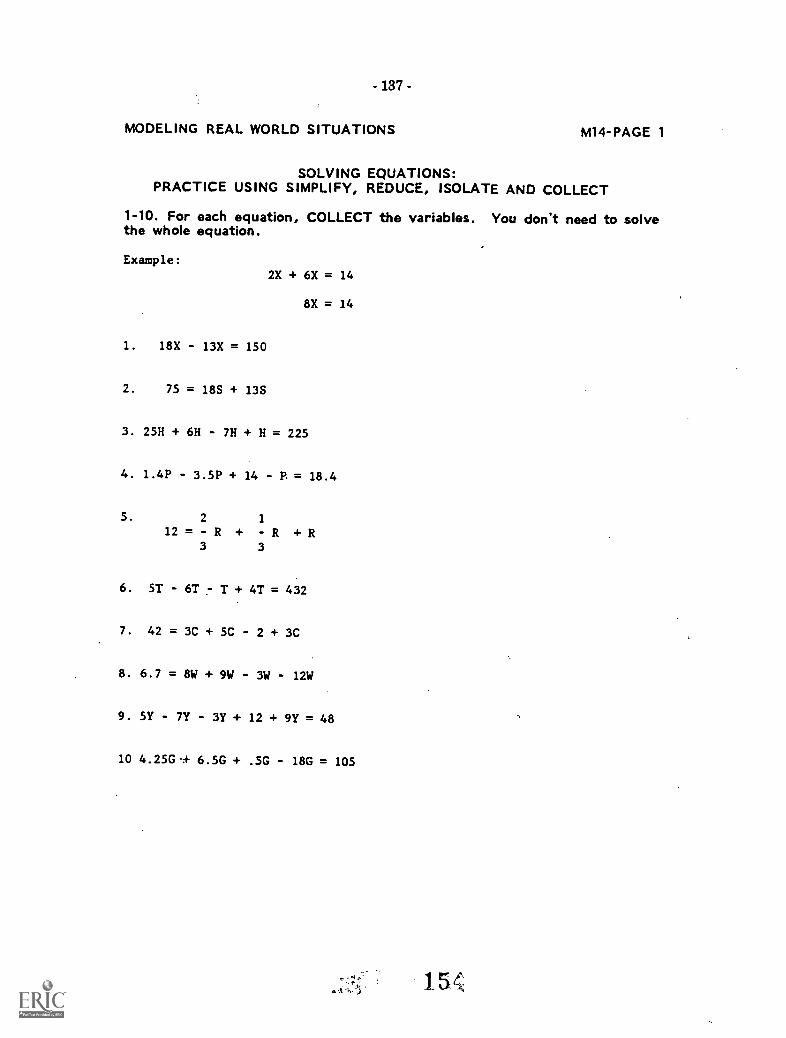
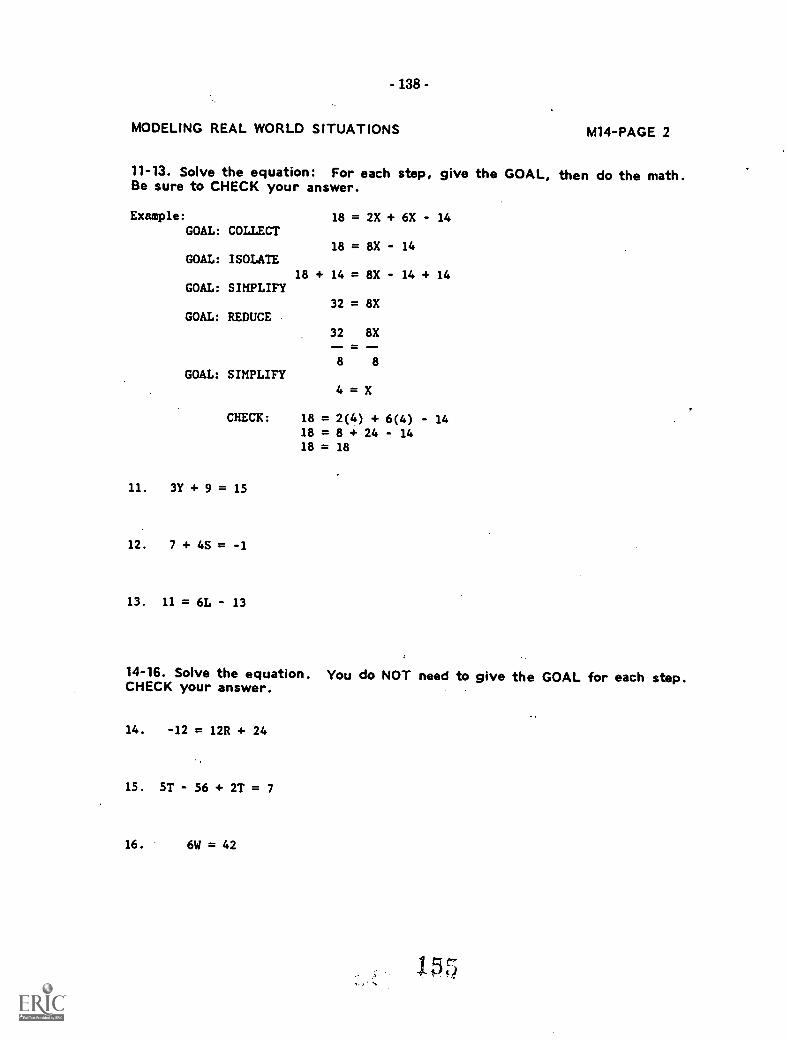
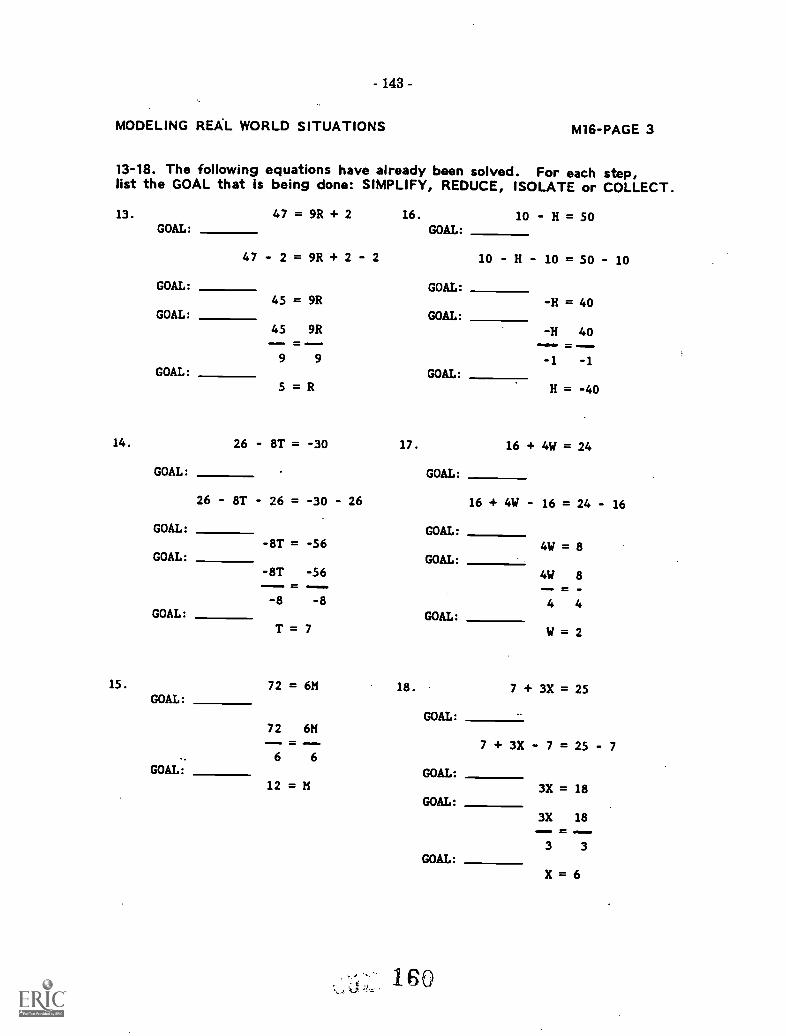
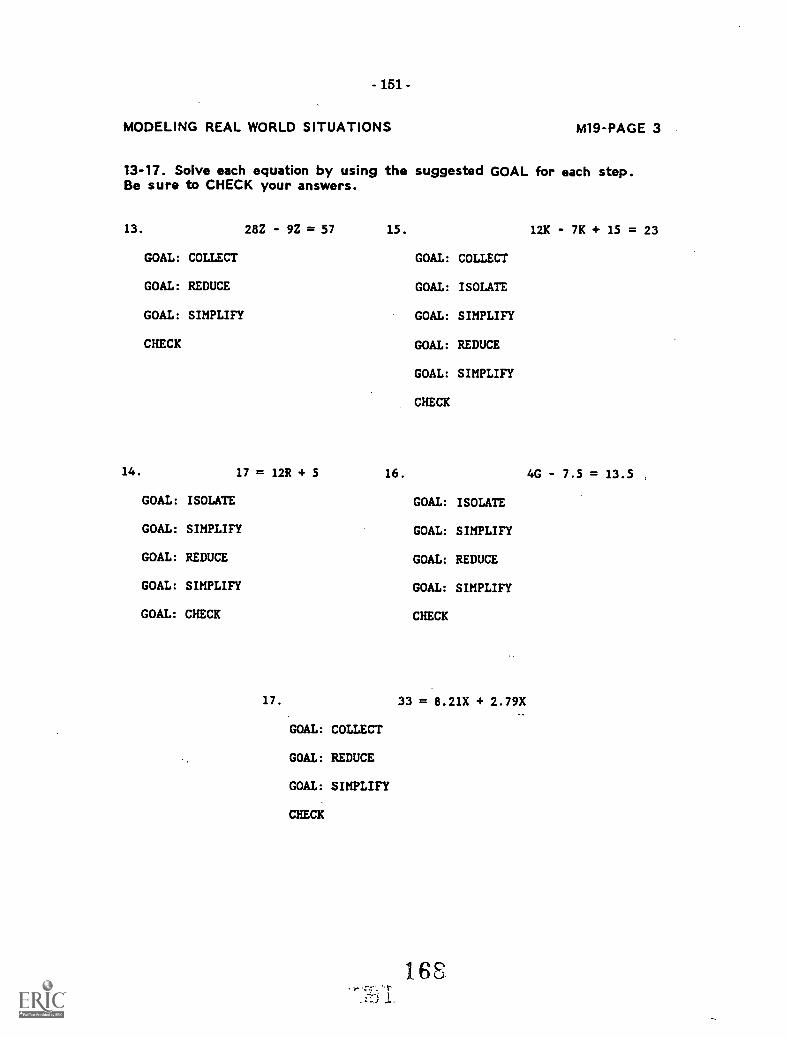
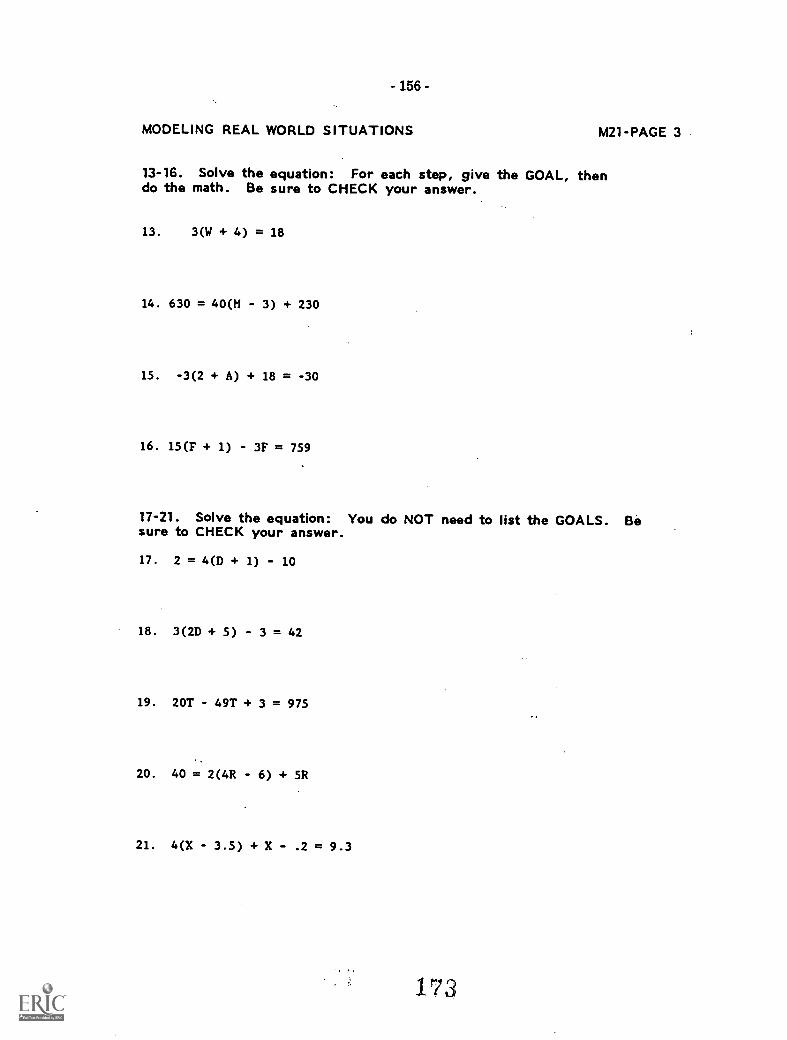
Noncomputer assignments provide practice in (i) specifying goals and operations for a
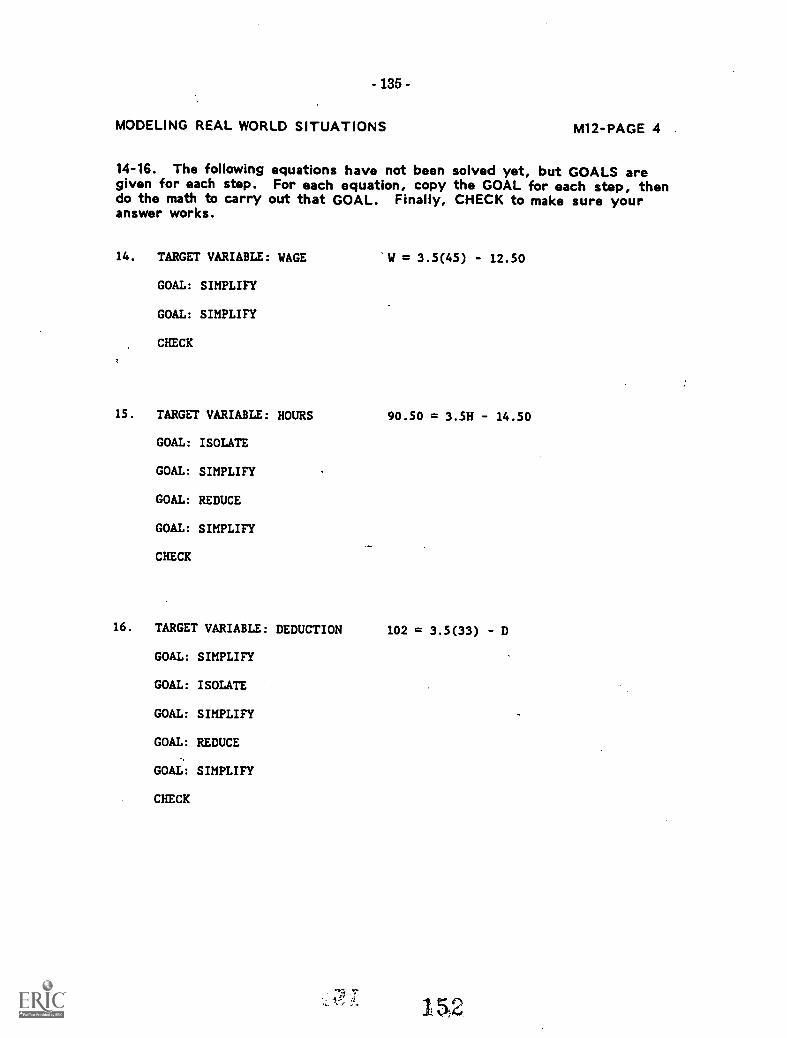
given step in a solution; (ii) completing the symbol manipulation for the specified goal/or
operation; (iii) solving an entire problem by specifying the goals and completing the symbol
manipulations; and (iv) symbol manipulation (without goal specification). Generally, the
opening problems in a noncomputer assignment are situation-based (like the computer
problems), whereas the remainder are more abstract and provide students computational
practice.
-14-
A TYPICAL LESSON
To see how all the different pieces of the curriculum package fit together, imagine, for
a moment, a typical classroom day during the second week of the curriculum. Students
arrive and find the day's activities listed on the board: Warm-up; Introduction to graphing;
Worksheet #4 or Computer Assignment #3. With a bit of noise, some corn chips snatched out
of a bag, and a search for pencils, the class settles down to do the warm-up review exercise
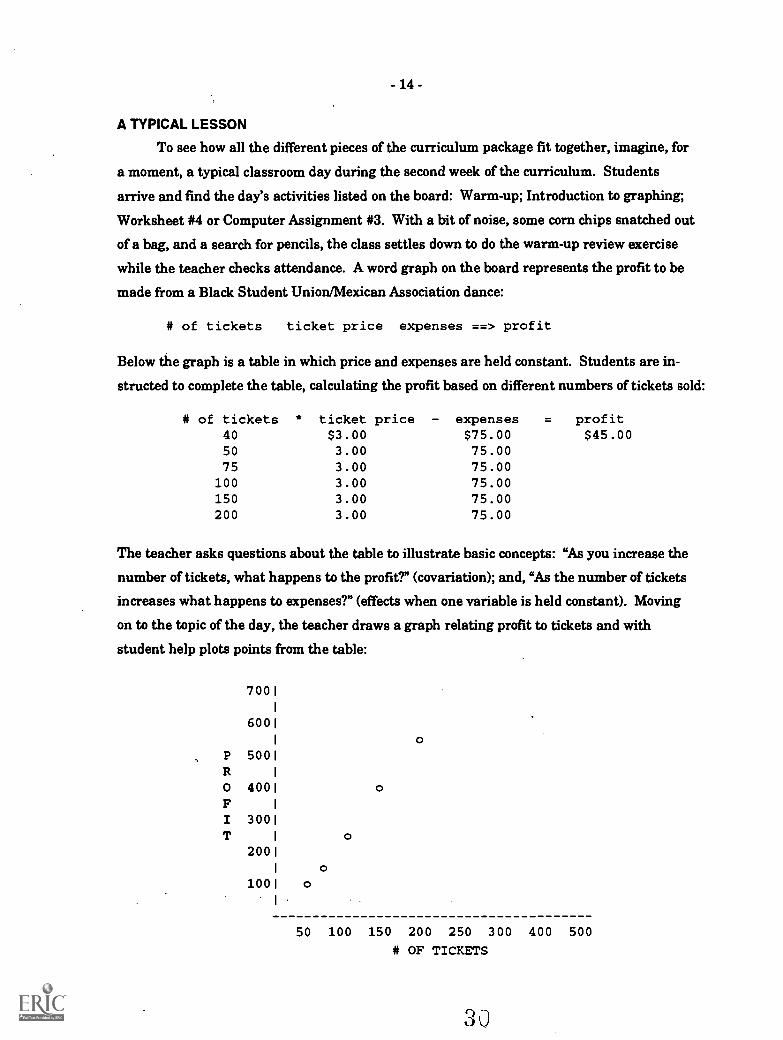
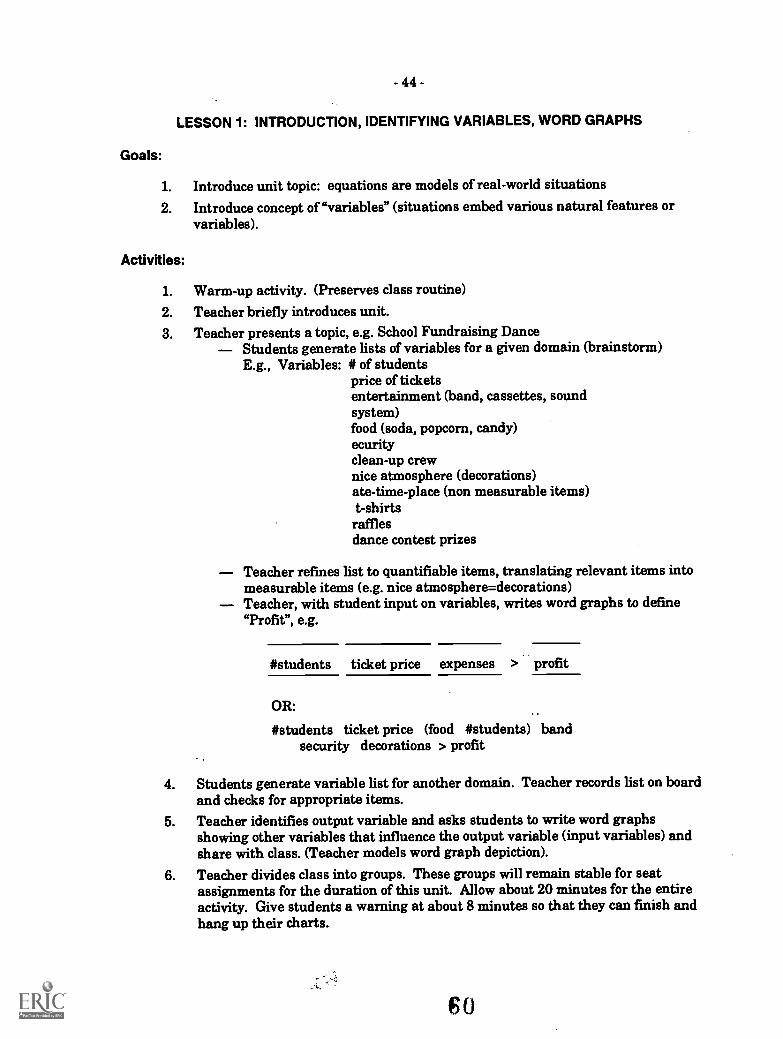
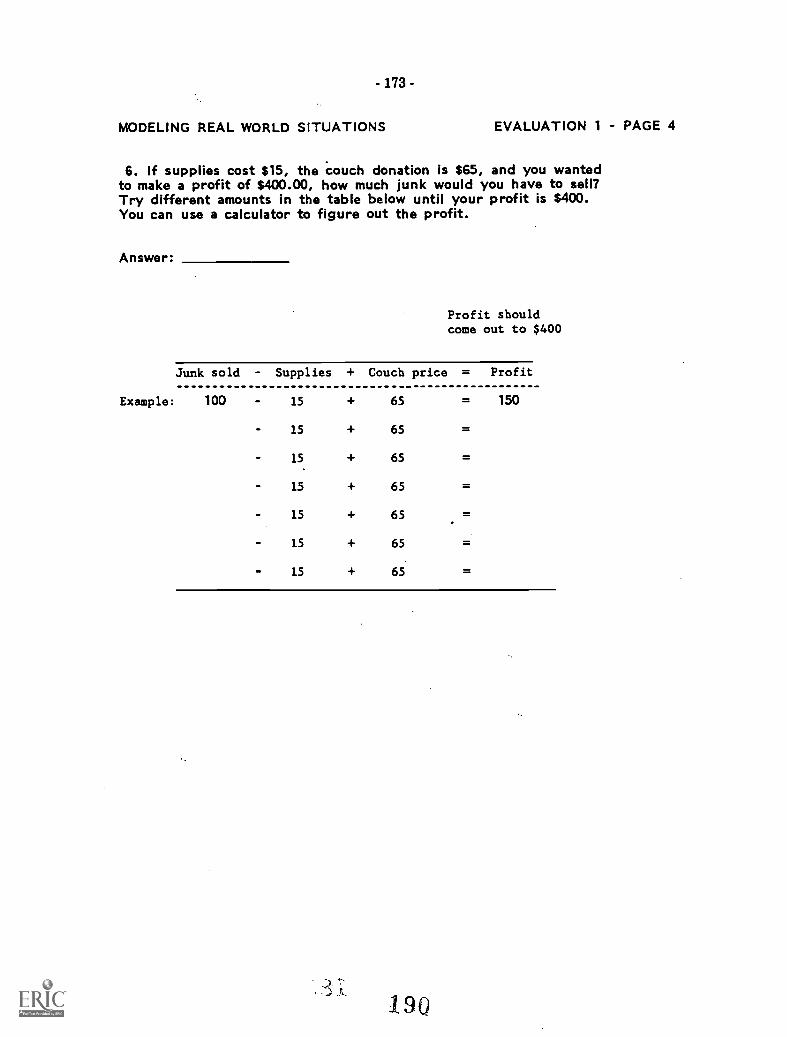
while the teacher checks attendance. A word graph on the board represents the profit to be
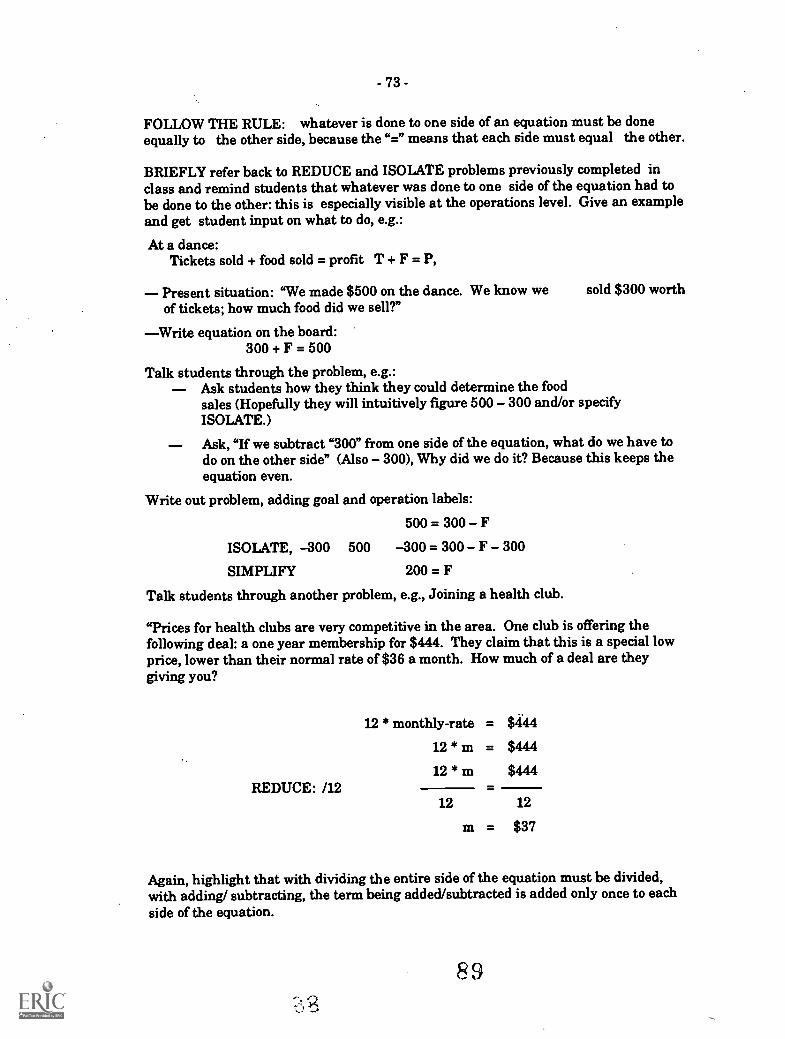
made from a Black Student Union/Mexican Association dance:
# of tickets ticket price expenses ==> profit
Below the graph is a table in which price and expenses are held constant. Students are in-
structed to complete the table, calculating the profit based on different numbers of tickets sold:
# of tickets40
50
75
100150200
* ticket price$3.003.003.003.003.003.00
- expenses$75.0075.0075.0075.0075.0075.00
= profit$45.00
The teacher asks questions about the table to illustrate basic concepts: "As you increase the
number of tickets, what happens to the profit?" (covariation); and, "As the number of tickets
increases what happens to expenses?" (effects when one variable is held constant). Moving
on to the topic of the day, the teacher draws a graph relating profit to tickets and with
student help plots points from the table:
7001
6001
I
P 5001
R I
O 4001
F I
I 3001
T I
2001
I 01001
50 100 150 200 250 300 400 500
# OF TICKETS
30
- 15 -
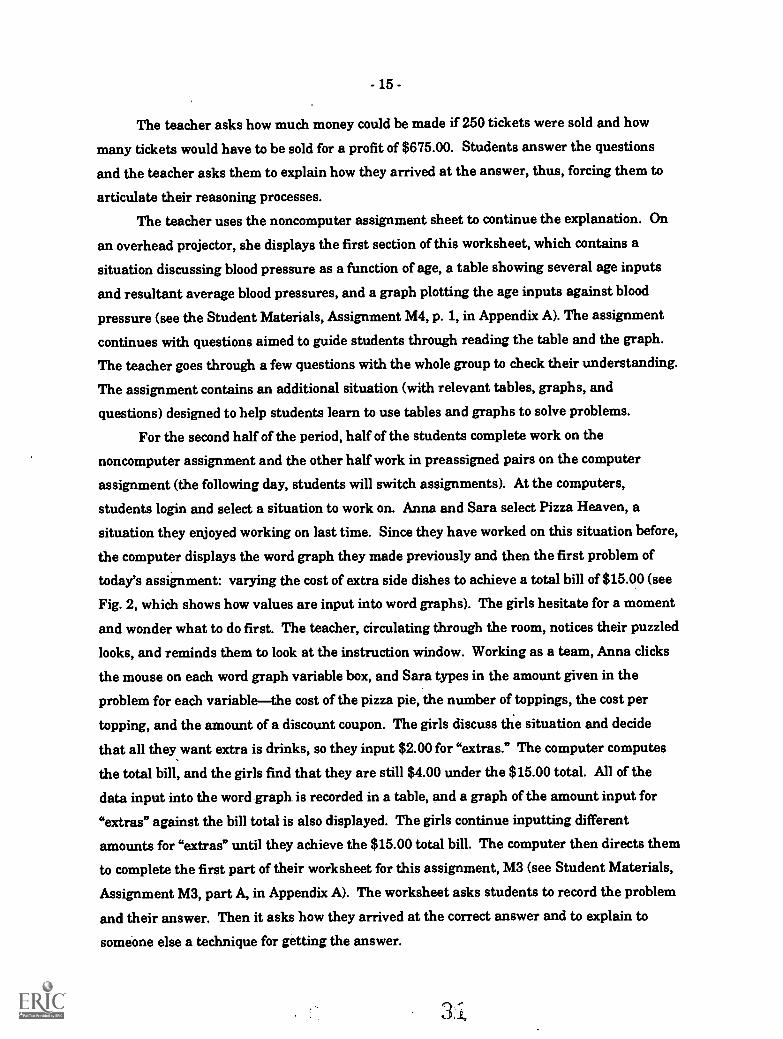
The teacher asks how much money could be made if 250 tickets were sold and how
many tickets would have to be sold for a profit of $675.00. Students answer the questions
and the teacher asks them to explain how they arrived at the answer, thus, forcing them to
articulate their reasoning processes.
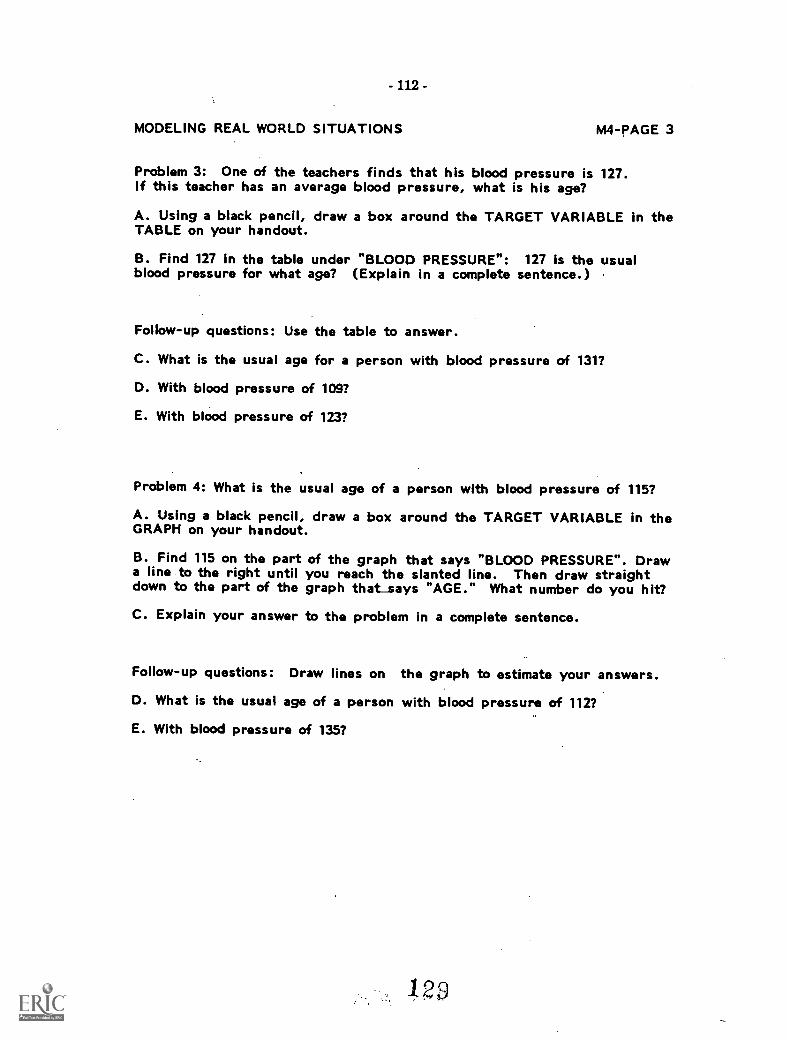
The teacher uses the noncomputer assignment sheet to continue the explanation. On
an overhead projector, she displays the first section of this worksheet, which contains a
situation discussing blood pressure as a function of age, a table showing several age inputs
and resultant average blood pressures, and a graph plotting the age inputs against blood
pressure (see the Student Materials, Assignment M4, p. 1, in Appendix A). The assignment
continues with questions aimed to guide students through reading the table and the graph.
The teacher goes through a few questions with the whole group to check their understanding.
The assignment contains an additional situation (with relevant tables, graphs, and
questions) designed to help students learn to use tables and graphs to solve problems.
For the second half of the period, half of the students complete work on the
noncomputer assignment and the other half work in preassigned pairs on the computer
assignment (the following day, students will switch assignments). At the computers,
students login and select a situation to work on. Anna and Sara select Pizza Heaven, a
situation they enjoyed working on last time. Since they have worked on this situation before,
the computer displays the word graph they made previously and then the first problem of
today's assignment: varying the cost of extra side dishes to achieve a total bill of $15.00 (see
Fig. 2, which shows how values are input into word graphs). The girls hesitate for a moment
and wonder what to do first. The teacher, circulating through the room, notices their puzzled
looks, and reminds them to look at the instruction window. Working as a team, Anna clicks
the mouse on each word graph variable box, and Sara types in the amount given in the
problem for each variablethe cost of the pizza pie, the number of toppings, the cost per
topping, and the amount of a discount coupon. The girls discuss the situation and decide
that all they want extra is drinks, so they input $2.00 for "extras." The computer computes
the total bill, and the girls find that they are still $4.00 under the $15.00 total. All of the
data input into the word graph is recorded in a table, and a graph of the amount input for
"extras" against the bill total is also displayed. The girls continue inputting different
amounts for "extras" until they achieve the $15.00 total bill. The computer then directs them
to complete the first part of their worksheet for this assignment, M3 (see Student Materials,
Assignment M3, part A, in Appendix A). The worksheet asks students to record the problem
and their answer. Then it asks how they arrived at the correct answer and to explain to
someone else a technique for getting the answer.
-16-
When Anna and Sara complete their worksheet, they continue with the next computer
problem, which requires them to use a graph to determine the price of pizza for a given bill
value if all other variables are held constant. The girls click on the graph's "bill" axis at the
location that corresponds to the value for the bill, and the computer visually computes the
corresponding value on the "pizza" axis. The computer then asks them to record their
exploration on a worksheet, which also asks what "pizza" input would produce a very high
"bill" output. Since there is still ten minutes left in the period, the girls select a second
situation"Heal-the-Bay"and complete similar problems. When they are finished, they
logout and return to their seats.
32
-17-
3. IMPLEMENTATION
We implemented the novel curriculum over five weeks in the fall of 1988 in a local
high school. In this section, we describe the teachers and students who participated in the
study, teacher and student training, and classroom operations and data-gathering
procedures used in this study.
THE STUDY PARTICIPANTS
Teachers
The curriculum module was taught by two teachers who serve as consultants to the
RAND Algebra Tutor projects and were members of the curriculum development team.
Teacher A is a young woman with several years of secondary school math instruction
experience. She is interested in curricular innovation and the use of technology. She is a
member of the UCLA California Mathematics Framework Project, helped launch a computer
program at a Los Angeles Unified School District magnet school, and was designated by the
high school to design an innovative "Math A" course curriculum. As a member of the
project's curriculum development team, she had responsibility for developing many of the
noncomputer assignments and extensively reviewed the teacher lesson plans and software
specifications.
Teacher B is a senior member of the same high school faculty and has over 20 years of
mathematics teaching experience. She has been actively involved in curricular reform and
designed a statistics course for the high school. She has made presentations at national
conferences on such topics as "Liberal Arts Math," "Integrating Computers in Math Courses,"
"Finite Math Topics," and "Statistics and Probability in the Traditional Course of Study." In
recognition of her expertise, she was selected as a Woodrow Wilson Fellow in Statistics at
Princeton and received her school district's outstanding faculty award. Teacher B's classes
participatedin both of the Algebra Tutor Project's previous field studies (see McArthur and
Stasz, 1990; Robyn et al., 1989; Stasz et al., 1989). During the curriculum development
phase of this study, Teacher B helped develop and review materials but took a less active role
in the project than Teacher A.
Students
Participating students were enrolled in either Math A or regular algebra classes.
Math A is the first year of a new two-year course implementing the recent California Math
Framework (California State Department of Education, 1985). It features several discrete
- 18 -
unitsprobability, symmetry, statistics, algebra, and geometry. The course is intended to
expose students to enough algebra and geometry to enable them to continue in a college-
focused academic plan. The course targets less-successful students who typically are low
achievers in an algebra class. Our curriculum module comprised the introductory algebra
unit in the Math A course.
All four Math A classes participated in the study. Two sections were taught by each of
the teachers. Parent consent was obtained for participation in the data-collection activities.
The average class size was about 32, although actual daily attendance was about 28
students. To provide comparative information, four regular algebra classes were asked to
participate in the data-collection activities. Classes were selected to match as closely as
possible the periods of the Math A classes (one class time could not be matched), and each
class was taught by a different teacher to avoid a teacher effect. All of these classes
progressed at about the same pace through the same textbook. At the time of the study, the
algebra students were working on linear equations and factoring.
TEACHER AND STUDENT TRAINING
Since both pilot teachers were members of the curriculum development team, formal
teacher training was required only for the computer component of the course. The software
was available for teacher review as it was developed. During two laboratory sessions,
materials designed to train students to use the tutor for the modeling and equation
construction environments were demonstrated by staff members. The teachers then coached
students through the relevant computer assignments. The equation-solving software was not
available for laboratory piloting but was available to the teachers shortly before it was used
in the classroom.
The two teachers differed dramatically in the amount of time they spent learning
about the computer software and hardware. The difference seemed to be a function of the
teachers' own interests, the constraints of teaching and class preparation duties, and other
professionafiesponsibilities. Teacher B spent approximately five hours in computer training
(the time spent at the two lab sessions) and Teacher A spent about ten hours (including
additional lab sessions with students and individual exposure), and about 20 additional
hours (approximately an hour during each day of the implementation) debugging software.
The teachers received little preliminary training on troubleshooting computer
problems; project staff attended every class and were expected to handle any emergencies.
Just before the curriculum module began, Teacher B decided that she did not want to be
responsible for student work at the computer, so project staff took over this task. The
341
- 19 -
teacher felt too pressured to monitor the computer work in addition to teaching new course
material. Teacher A, on the other hand, decided to handle all class activities with a minimal
amount of help from project staff. Thus, she received additional instruction about
troubleshooting computer problems.
Student training materials enabled the teacher to instruct the whole class at once.
Using an overhead projector and transparencies of the Sun workstation operation, the
teacher walked the students through login procedures and the different computer
environments and activities before the students actually sat down at the computers (see
Teacher Lesson Plans, pp. 7-9 and pp. 24-25, in Appendix A). Teacher A spent about an
hour introducing the computer and various environments and Teacher B spent about 20
minutes.
CLASSROOM OPERATIONS AND DATA-GATHERING PROCEDURES
Seven Sun 3/50 workstations were installed in the Math A classroom. Project staff
were present in every class to handle any computer operational problems that arose. The
curriculum was designed to span 13 days, but teachers were not required to adhere to a rigid
schedule. Teachers were encouraged to set their own pace and they taught the course in 20
days. Class observation data indicate that teachers spent about ten days on the modeling
portion of the curriculum and about 15 days on equation solving; this time was
proportionately equal to the original schedule.
We used multiple methods to assess the curriculum, including mathematics and
algebra achievement tests, two unit tests, background and attitude questionnaires, classroom
observation instruments, and computer records. (See McArthur and Stasz, 1990, and Stasz
et al., 1989, for further description of our overall approach to data collection). These
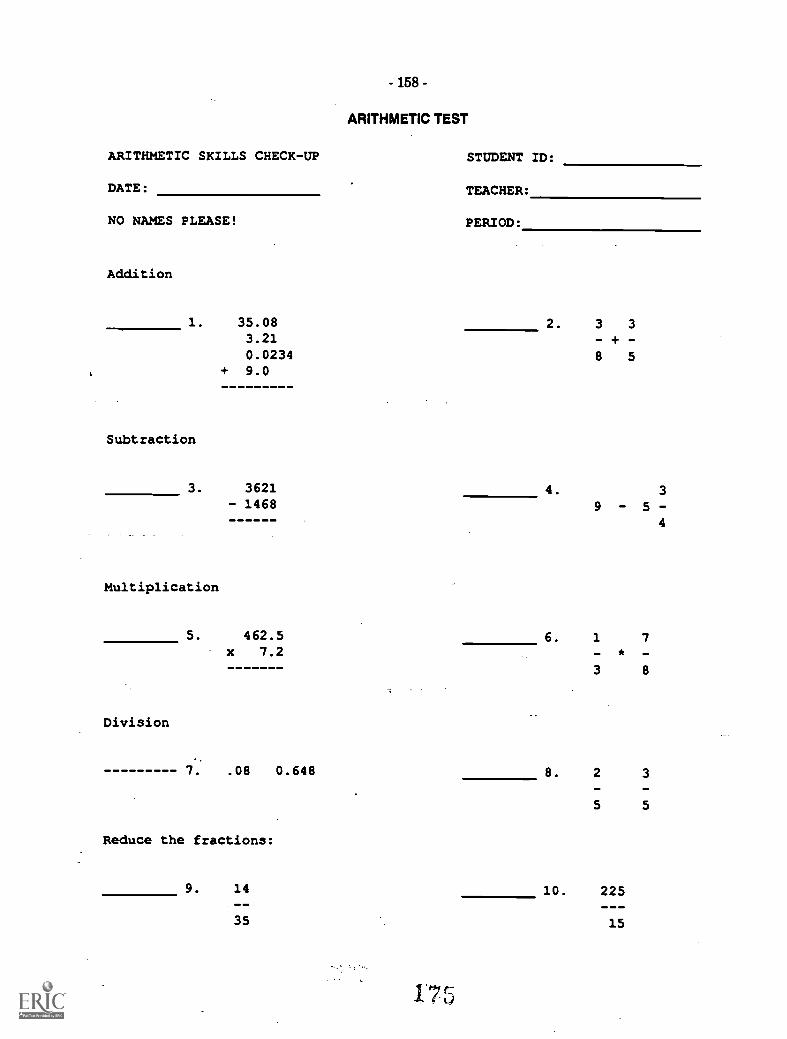
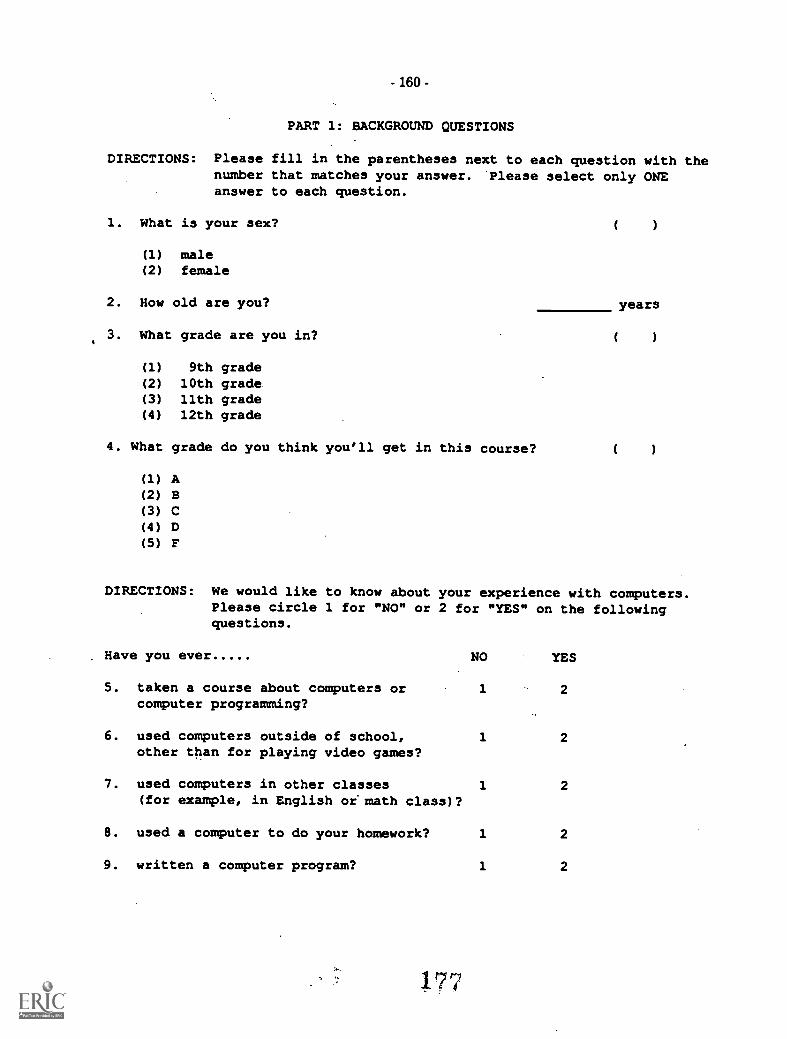
instruments are included as Appendix B. Students took an arithmetic skills test to measure
arithmetic ability and a pretest and posttest that assessed studentexperience with and
attitudes toward computers and mathematics and their problem-solving skills. The skills
test included traditional abstract equation-solving problems, as well as novel problems
featured in the curriculum (e.g., identifying variables in a natural situation, constructing an
equation to represent a natural situation, solving problems related to the situation, and
specifying problem-solving strategies). The set of background questions (e.g., gender, age,
grade in school, past mathematics courses, feelings about algebra, computer experience) have
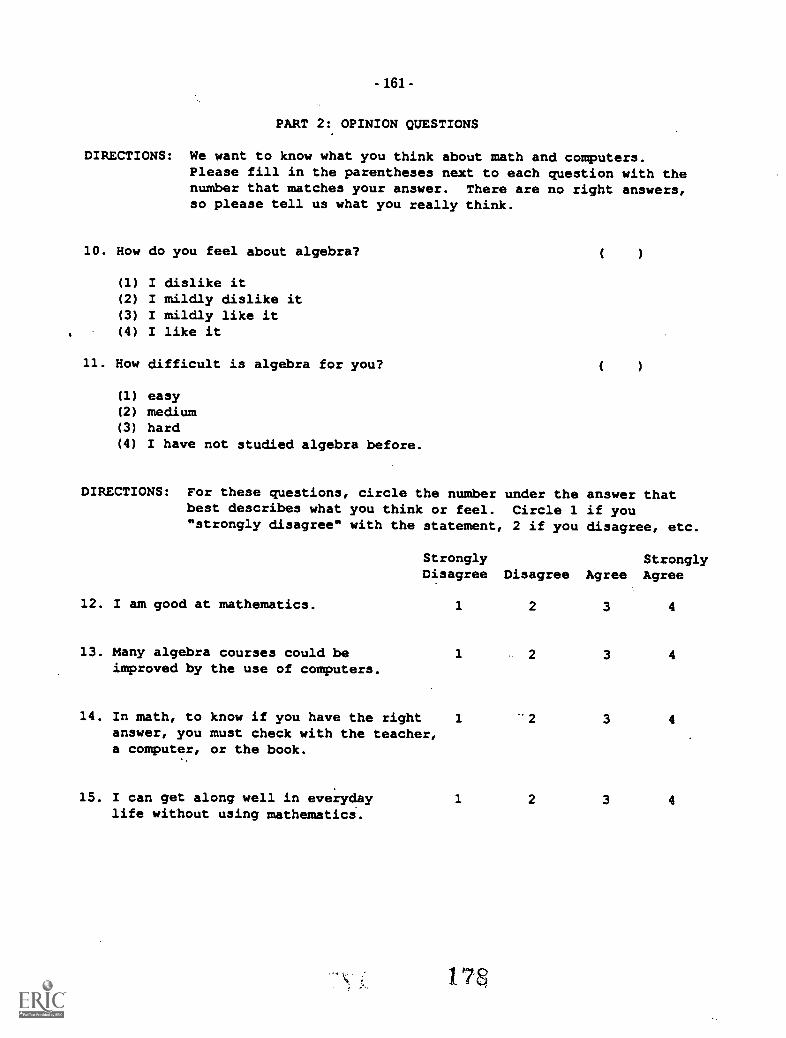
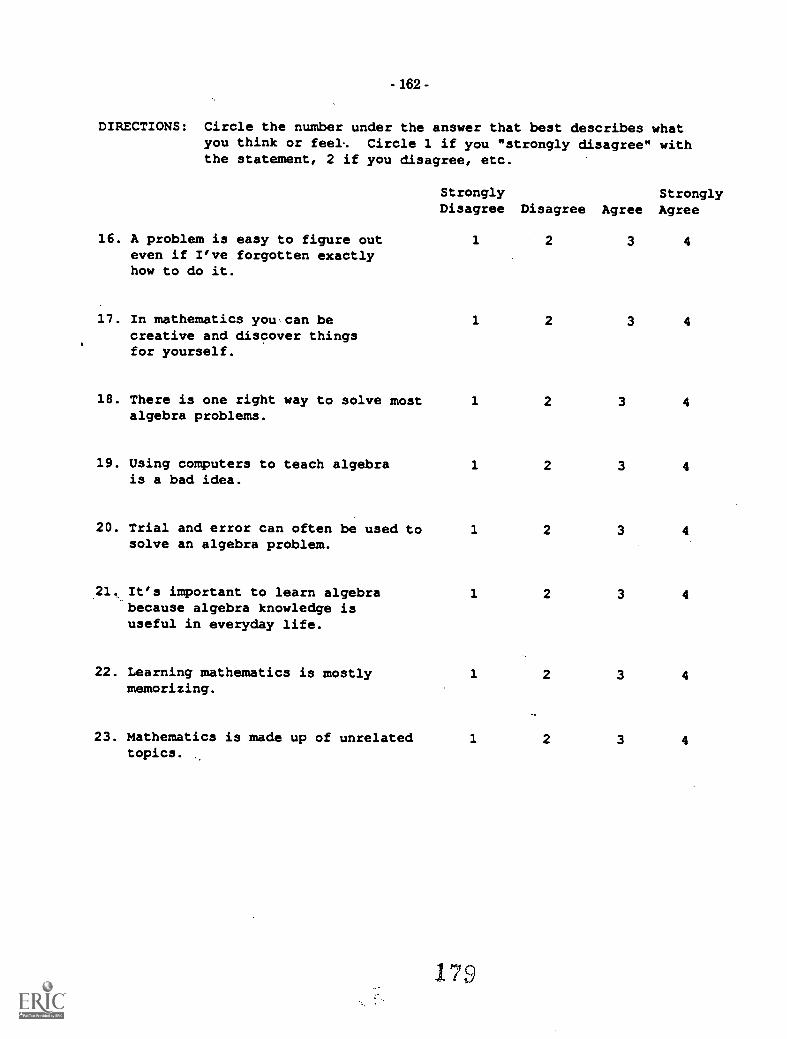
been tested and refined over the course of several Algebra Tutor projects. The attitude
questions, also used in our previous research, were developed by the research team or
adopted from other studies (e.g., Schoenfeld, 1985; Carpenter et al., 1980). These
BEST COPY MAILABLE
-20-
instruments were also given to four Algebra 1 classes. The pretest was administered just
after the algebra students completed lessons on linear equations. The posttest, given five
weeks later, followed lessons on factoring. Thus, algebra students' knowledge of equation
solving at pretest was similar to the Math A students' knowledge at posttest.
Math A students also completed two unit testsone on identification of variables and
covariation and the other on equation solving. These are described more fully in Sec. 4. The
posttest for Math A students also included student ratings of the course. Computer records
automatically recorded student time on the computers and assignments completed. To
assess implementation of the novel curriculum, project staff kept daily class observation
records of the topics presented, the effectiveness of the teacher's presentation, student
experiences with the class and computer activities, and general computer operation. These
records also included teacher comments about the course and general student progress.
35
-21-
4. EVALUATION OF THE CURRICULUM
In this section we discuss our overall approach to evaluating the curriculum and
present student outcomes. We examine these outcomes with respect to intended and actual
implementation of the curriculum, as indicated in classroom observations of teaching and
learning. Finally, we examine students' evaluation of the course and assess the curriculum's
limitations.
EVALUATION DESIGN
The evaluator seeking to determine the effectiveness of any instructional program has
a wide range of alternative designs from which to choose (e.g., Campbell and Stanley, 1966;
Cook and Campbell, 1979). Choosing which is best depends on a number of factors, including
the types of decisions (and decisionmakers) on which the evaluation focuses and the
feasibility of implementing the design (Shavelson et al., 1986).
Generally, two questions are raised in most curriculum evaluations: How much do
students gain in knowledge, skills, and attitudes from the instructional intervention? Is
what they learn the same as what students learn in traditional courses that are intended to
teach the same subject matter (Shavelson et al., 1986)? In this study, we weight the question
of knowledge gain as more important than the question of equivalence of outcomes. We
believe this focus appropriate for a curriculum development project which is innovative in
content, pedagogical approach, and supporting instructional materials. Thus, our evaluation
approach is more formative than summative (see Flagg, 1990, for approaches to formative
evaluation of educational technologies). The aim is to pilot test a prototype curriculum and
gather data to understand which aspects of the curriculum were successful and which need
revision.
A third evaluation question, less often addressed, concerns implementation: What
factors in the implementation process influence the program's success or failure? This
question is particularly important for instructional programs that include new technologies,
since the technology itself may pose unique barriers to implementation in a school setting
(e.g., Newman, 1989; Robyn et al., 1989). Thus, our evaluation was sensitive to teachers' and
students' attitudes about and use of the computer-aided aspects of the curriculum as well as
their overall evaluation of the instructional activities.
Although the question of comparability of student outcomes between Math A and
regular algebra students was of secondary importance, our design included regular algebra
- 22 -
students as a "comparison" group.1 We were interested in how the Math A students
compared with "regular" algebra students on several dimensions, such as arithmetic
achievement, algebra knowledge, demographics, attitudes, and other background
characteristics. Knowledge of these types of differences might enable us to better understand
effects (or lack of them) from the novel curriculum. Several of our attitude questions assess
attitudes and beliefs about mathematics that reflect student experiences with traditional
mathematics instruction; for example, that mathematics is mostly memorizing. If Math A
students' attitudes show greater changes relative to algebra students in beliefs of this type,
then we have some indication that the novel curriculum may have helped effect such
changes.
STUDENT CHARACTERISTICS AND ATTITUDES
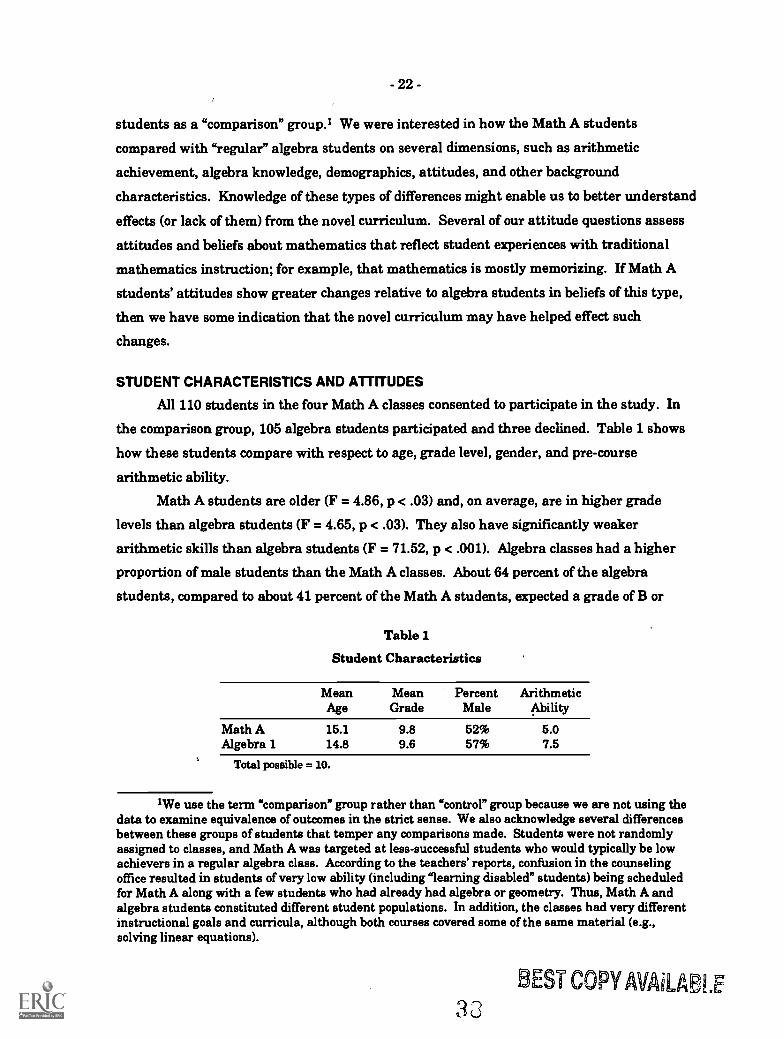
All 110 students in the four Math A classes consented to participate in the study. In
the comparison group, 105 algebra students participated and three declined. Table 1 shows
how these students compare with respect to age, grade level, gender, and pre-course
arithmetic ability.
Math A students are older (F = 4.86, p < .03) and, on average, are in higher grade
levels than algebra students (F = 4.65, p < .03). They also have significantly weaker
arithmetic skills than algebra students (F = 71.52, p < .001). Algebra classes had a higher
proportion of male students than the Math A classes. About 64 percent of the algebra
students, compared to about 41 percent of the Math A students, expected a grade ofB or
Table 1
Student Characteristics
Mean Mean Percent ArithmeticAge Grade Male Ability
Math A 15.1 9.8 52% 5.0Algebra 1 14.8 9.6 57% 7.5
Total possible =10.
1We use the term "comparison" group rather than "control" group because we are not using thedata to examine equivalence of outcomes in the strict sense. We also acknowledge several differencesbetween these groups of students that temper any comparisons made. Students were not randomlyassigned to classes, and Math A was targeted at less-successful students who would typically be lowachievers in a regular algebra class. According to the teachers' reports, confusion in the counselingoffice resulted in students of very low ability (including learning disabled" students) being scheduledfor Math A along with a few students who had already had algebra or geometry. Thus, Math A andalgebra students constituted different student populations. In addition, the classes had very differentinstructional goals and curricula, although both courses covered some of the same material (e.g.,solving linear equations).
BEST COPY AVAiLABLE
33
-23-
higher in the course. Algebra students liked algebra more than Math A students (71.4 and
51.8 percent, respectively; chi square 16.75, p < .001). Twenty percent of the algebra
students judged algebra to be "easy," compared to only 4 percent of the Math A students (chi
square = 10.75, p < .005).
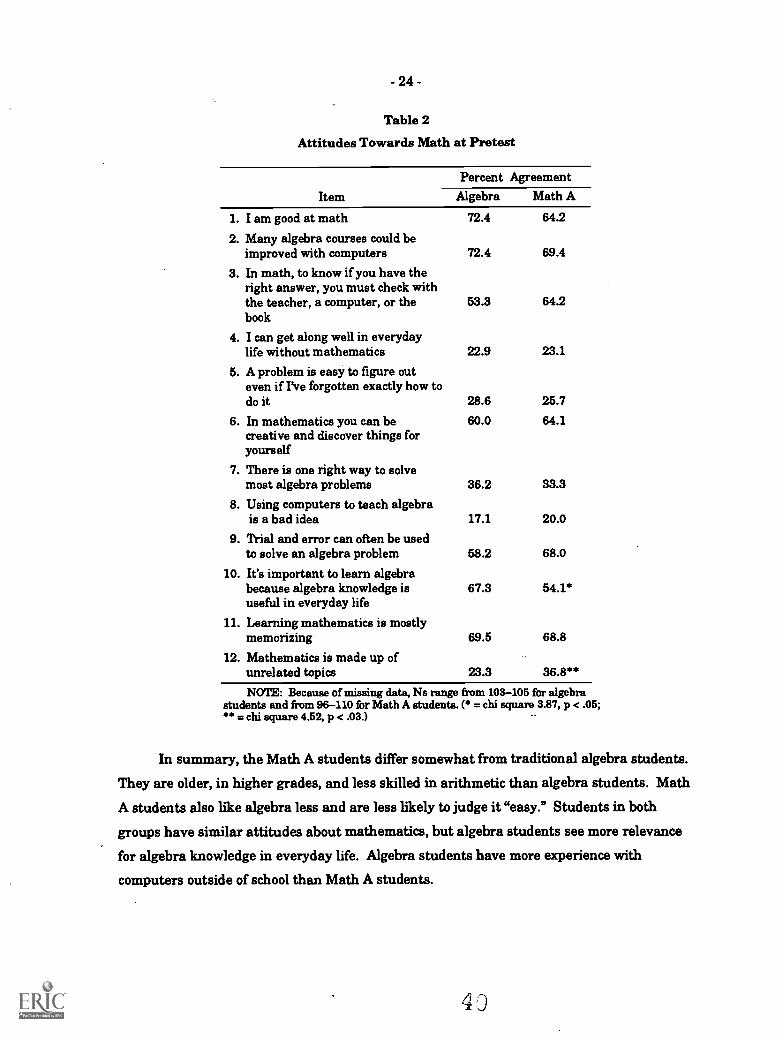
We asked students several questions about their feelings toward mathematics and
toward computers. Students answered on a four-point scale (1 = strongly disagree to 4 =
strongly agree). Table 2 shows percentage agreement (percentage responding "3" or "4") with
these statements for Math A and algebra students. Table 2 indicates that algebra students
may have more confidence in their mathematics ability, although the difference between
Math A and algebra students is not significant (item 1). Similarly, both groups look for
external verification of their work (item 3), but the Math A students appear more disposed to
do so. A majority of students in both groups think computers can improve algebra
instruction (items 2 and 8). Items 4 and 10 assess how highly students value mathematics.
Responses here appear somewhat inconsistent. About a quarter of the students in both
groups saw little value in mathematics (item 4), but over half thought algebra was useful in
life (item 10). Algebra students saw significantly more value in learning algebra than did
Math A students. A second attitude about mathematics learning concerns discovery versus
memorization (item 11). We would like students to see mathematics as a logical structure
rather than as just a body of disconnected "facts." Most students believe that mathematics is
mostly memorizing. In spite of this, a high percentage of students also believe that discovery
is possible (item 6). Items 5 and 9 concern similar attitudes about mathematical thinking.
Clearly, a majority of students believe that trial and error is a useful strategy. Few students,
on the other hand, had faith in their ability to figure out a problem. This is perhaps
consistent with their view that mathematics is mostly memorizing. If students believe that
mathematics consists of memorizing formulas, then they will not go back to "first principles"
to reason the answer to a question. Finally, item 12 concerns students' attitudes toward
mathematics as a body of knowledge. Math A students appear significantly more likely to
view mathematics as comprising unrelated topics than do algebra students.
We also asked students about their experiences with computers (see Table 3). Overall,
students have a wide variety of experience with computers. Algebra students are
significantly more likely to use computers outside of school (chi square = 13.08, p < .001) and
to use computers to do their homework (chi square = 3.88, p < .05). A large proportion of
students have taken courses about computers and nearly 40 percent of students in both
groups have written computer programs.
3S
-24-
Table 2
Attitudes Towards Math at Pretest
Percent AgreementItem
1. I am good at math
2. Many algebra courses could beimproved with computers
3. In math, to know if you have theright answer, you must check withthe teacher, a computer, or thebook
4. I can get along well in everydaylife without mathematics
5. A problem is easy to figure outeven if I've forgotten exactly how todo it
6. In mathematics you can becreative and discover things foryourself
7. There is one right way to solvemost algebra problems
8. Using computers to teach algebrais a bad idea
9. Trial and error can often be usedto solve an algebra problem
10. It's important to learn algebrabecause algebra knowledge isuseful in everyday life
11. Learning mathematics is mostlymemorizing
12. Mathematics is made up ofunrelated topics
Algebra Math A
72.4 64.2
72.4 69.4
53.3 64.2
22.9 23.1
28.6 25.7
60.0 64.1
36.2 33.3
17.1 20.0
58.2 68.0
67.3 54.1*
69.5 68.8
23.3 36.8**
NOTE: Because of missing data, Ns range from 103-105 for algebrastudents and from 96-110 for Math A students. (* = chi square 3.87, p < .05;** = chi square 4.62, p < .03.) --
In summary, the Math A students differ somewhat from traditional algebra students.
They are older, in higher grades, and less skilled in arithmetic than algebra students. Math
A students also like algebra less and are less likely to judge it "easy." Students in both
groups have similar attitudes about mathematics, but algebra students see more relevance
for algebra knowledge in everyday life. Algebra students have more experience with
computers outside of school than Math A students.
4
-25-
Table 3
Computer Experience
Have You Ever. ..
Percent Responding "Yes"
Algebra(N = 105)
Math A(N = 110)
Taken a course about computersor computer programming?
70 65
Used computers outside of schoolother than for playing games?
75 51
Used computers in other classes? 50 49
Used a computer to do yourhomework?
36 24
Written a computer program? 42 39
STUDENT LEARNING
To assess changes in student learning, we administered an algebra achievement test
to the Math A students before and after the curriculum unit, and, for purposes of comparison,
to the algebra students after their instruction in solving simple linear equations.2 Students
also took an arithmetic test to determine initial arithmetic ability, apart from algebra
knowledge. Finally, Math A students took two "unit" tests that measured learning of
concepts specific to the new curriculum. Unit test results will be discussed in detail below.
Table 4 shows test scores for the 65 Math A students and 64 algebra students who
completed all of their respective tests. This comparison eliminates students who entered the
courses late, dropped out of the courses, or were absent on testingdays.3
Algebra students scored significantly higher than Math A students on the arithmetic
test (F = 33.37, p < .001) and algebra posttest (F = 24.09, p < .001). What is most striking,
2We gave two tests to the Algebra I classes as well as the Math A classes. However, the algebrastudents cover the material on linear equations quite early in the semester, so the first of the tests wasin effect a posttest, occurring immediately after students had received instruction in the relevant topics.The results of the second test, which was given at the end of the semester, are quite similar to the firstand show a slight, statistically insignificant decrease toward the end of the semester (change score = -.2on a test with 12 possible points). Thus, for purposes of comparing achievement, we use the first testgiven to the algebra students and the second given to the Math A students. On the other hand, wherechanges in attitude are concerned, we felt justified in using both algebra students' tests, since theissues in question relate to the way in which algebra is taught generally and is not content-specific.
3We conducted separate analyses to determine if these scores were significantly different for thegroup of 44 algebra and 49 Math A students who missed one or more of these tests. T-tests betweentotal scores of students taking all tests as compared with those missing, for each of the three tests, werenot significant. Thus, there is no bias with respect to achievement between these two groups.
- 26 -
Table 4
Arithmetic and Algebra Achievement Scores for All Students(Means and Standard Deviations)
ChangeArithmetic Pretest Posttest Score
Students Mean S.D. Mean S.D. Mean S.D. Mean S.D.
Math A 5.17 2.38 1.80 1.72 4.75 2.86 2.94 2.18Algebra 7.42 2.04 7.07 2.50
NOTE: Maximum possible scores are 10 on the arithmetic test and 12 on the pretests or posttests. Changescore is the posttest minus the pretest.
however, is that both algebra students and Math A students did so poorly on the posttest,
correctly answering only about half of the questions on average. Nevertheless, we were
encouraged to see that the Math A students did show significant improvement from pretest
to posttest (t = 10.86, p < .001). Moreover, among the Math A classes, Teacher A's students
did significantly better than Teacher B's (change score 3.65 and 2.17, respectively; t = 2.88,
p < .01).
We also examined group differences on two subsets of items: Six "innovative" items
and six "traditional" items. Innovative items, for example, assessed students' ability to select
(from a list of operations) the operation that would transform the equation to the next
appropriate step or to identify the variables in a word problem. Traditional items required
students to solve an equation presented in symbolic form (e.g., 3(Y 2) = 12; 5.2T - 10.3 =
10.5). Algebra students completed about three (of six) traditional items correctly on the
posttest. Math A students, on the other hand, do slightly better than algebra students on the
innovative items at posttest, and show small gains from pretest to posttest.
For Math A students, the small gain in innovative items is encouraging, since the
novel curriculum stressed these skills over solving symbolic equations. Analysis of subset
test scores by teacher indicates that Teacher A's students had significantly higher change
scores than did Teacher B's on both types of items.
Given such low test scores, these results are not very compelling from a curriculum
developer's perspective. However, we have other data on the Math A studentsteacher
evaluations, unit tests, class notes, tutor usageto determine which aspects of the
curriculum were more successful than others and what kinds of changes might be made. We
examine these data in more detail below.
-27-
MATH A STUDENT OUTCOMES AND CHANGES
Since the primary purpose of this evaluation is to assess how the novel curriculum
changed students' knowledge, skills, and attitudes, below we analyze data for the Math A
students alone. First, we more closely examine their achievement on the algebra test and
unit tests. Then we assess changes in student attitudes. For these analyses, we are also
interested in whether any teacher differences arise.
Math A Achievement
Although student performance on the algebra achievement test was low overall, some
classes did better than others. Table 5 shows algebra achievement data by teacher. Both
teachers' students had had equivalent arithmetic and algebra knowledge at pretest. Teacher
A's students did significantly better at posttest than Teacher B's students (t = 1.99, p < .05).
Change scores (posttest minus pretest) for the total test and various subsets of item types
indicate that Teacher A's students outperformed Teacher B's students across the board.
Unit Test ResultsTwo unit tests were administered during the course. The first test was given after
students completed curriculum topics on identifying variables, developing qualitative models,
and exploring covariation using tables and graphs. The second unit test was given after
completion of the full curriculum module and assessed the construction of quantitative
NOTE: Maximum possible scores are 10 on the arithmetic test, 12 on the pretest andposttest. Change scores represent average change from a base of six items each.
BEST COPY AVAILABLE
-28-
Table 6 shows average student scores, by teacher, on each of the two tests. In contrast
to their performance on the algebra achievement test, both teachers' students did fairly well
on the first unit tests, although less well on the second. Teacher A's students scored slightly
higher than Teacher B's students, but this difference is not statistically significant.
To examine student achievement in greater detail, we constructed several subsets of
items and, for the sake of comparison, standardized subset scores on a ten-point scale (see
Table 7). These data reveal several important differences. First, students were twice as good
at solving symbolic equations that were situated in a real-world problem than solving similar
equations presented abstractly. In a "situated" equation (see Fig. 3 for an example), the
student is asked to solve a symbolic equation derived from the word problem and word graph.
The student is also asked to identify the target variable and the goal before solving the
problem. Students did better on these types of problems than on similar equations (e.g., 3Y +
9 = 12) presented alone. This finding reinforces the belief that problem-solving should be
grounded in meaningful contexts so that students can learn to "mathemetize" or construct
the links between formal algebraic expressions and the actual situations to which they refer
(e.g., Clement, 1982). It appears that meaningful problems, such as those included in our
Table 6
Unit Test Results by Teacher
Teacher A Teacher B
N Mean S.D. N Mean S.D.
Unit Test #1 49 5.01 1.39 58 4.80 1.46Unit Test #2 55 4.20 2.23 53 3.72 2.61
NOTE: Maximum score for #1 and #2 were 6 and 11 points, respectively.
curriculum, can improve over current mathematics instruction, which does not engage
students' interpretive and meaning construction capacities (cf. Resnick, 1987). The
challenge, then, is to determine what constitutes a "meaningful" problem to teenage
mathematics students. We obtained some feedback from students on this and other aspects
of the curriculum, which we report below.
Table 7 also indicates that students did fairly well at identifying the target variable
and choosing the goal for a particular step. Furthermore, Teacher A's students did
significantly better than Teacher B's on these two types of items. Our classroom observation
data indicate that Teacher B did not reinforce target identification in her presentation,
whereas Teacher A covered this topic in at least two different sessions and received an
average rating of 2.5.4
Students did less well at checking and interpreting answers. The low score for
"checking" is somewhat disappointing. There is some evidence that successful math learners
engage in more metacognitive behaviors, such as checking. It seems reasonable that a less-
routinized approach to mathematics, such as that fostered in our curriculum, could
substantially improve learning, including developing metacognitive or strategic behaviors for
solving problems (cf. Resnick, 1987). However, it appears that students failed to check even
when they were specifically instructed to do so. It may be that checking is not a typical
activity for these students and that the instruction alone did not induce them to pick up this
metacognitive habit. Our observational data indicate that neither teacher reinforced
checking during their classroom instruction: Only one observer noted any presentation of
this topic, to which a rating of "1" (not effective) was assigned.
Changes in Attitudes
Next we examine changes in attitudes toward mathematics. Here, we are interested
in whether Math A students' attitudes change in the anticipated direction (either an increase
or decrease in agreement, depending on the statement) relative to algebra students. This
analysis compared what percentage of Math A students' (N = 65) attitudes changed relative
to the algebra students (N = 64).
4Observers in each class noted topic numbers from a list of possible topics and rated theteacher's presentation on a three-point scale: 1= not effective, 2 = satisfactory, and 3 = very effective.Observers were members of the research team who had helped develop the curriculum and thus wereknowledgeable about curriculum objectives and intent. Although their ratings may be very subjective,they do give some indication of whether the teacher covered the curriculum material or taught it asoriginally intended.
45
-30-
Students in both groups tended to have higher expectations for their course grade at
posttest. We observed a dramatic shift, however, in their feelings about algebra. As reported
above, at pretest the algebra students liked algebra significantly more than did Math A
students. By the end of the course, Math A students' feelings changed in the positive
direction, and algebra students' feelings were more negative: 42.2 percent of Math A
students had more positive feelings, compared with only 9.4 percent of algebra students (chi
square = 22.65, p < .001). Over a third of the algebra students reported more negative
feelings about the subject.
Students' feelings about the difficulty of algebra also changed. Although the difference
was not significant (chi square = 9.10, p < .06). Math A students felt they had less difficulty
with algebra (21.5 percent changed in the direction of "easier") whereas algebra students had
more difficulty (21.9 percent changed in the direction of "harder").
We also found several important changes in attitudes toward mathematics (see Table
8).6 First, algebra students were less likely than Math A students to change their attitudes
in either direction. As Table 8 indicates, Math A students were more likely, at the end of the
course, to believe that correct answers must be checked with an outside source. This may be
due to their experience with the computer during the semester, since the computer could
check the correctness of any solution line or problem at the student's request. Math A
students increased their belief in their ability to figure out a problem, whereas algebra
students felt less able to do this. Math A students were also more likely to discount a trial-
and-error approach to problem solving. Over a third of the Math A students increased their
perception of algebra as useful for everyday life; one-fourth of the algebra students showed a
-decrease in this perception. This suggests that we were somewhat successful in our attempts
to show that algebra is a useful tool for everyday life. It also suggests that learning algebra
problem solving in the context of real-world situations (as did the Math A students) may
demonstrate this usefulness to students, as opposed to learning algebra in the context of
abstract symbol manipulation. Finally, Math A students were less likely to see mathematics
as comprising unrelated topics. This suggests that the curriculum achieved its intended goal
of teaching students to see the relationships between mathematical concepts and different
representations of the same concept.
To measure attitude changes from pretest to posttest, we calculated a difference score bysubtracting the pretest rating from the posttest rating. A positive result indicated more agreementwith the statement, a negative result indicated less agreement and a zero result indicated no change inthe student's attitude. Chi-square tests (student type by change) determined significant changesbetween groups.
- 31
Table 8
Significant Changes in Mathematics Attitudes
In math, to know if you have theright answer, you must check withthe teacher, a computer, or the book
A problem is easy to figure out evenif I've forgotten exactly how to do it
Trial and error can often be usedto solve an algebra problem
It's important to learn algebrabecause algebra knowledge is usefulin everyday life
Mathematics is made up of unrelatedtopics
% of Students at End of Course Who
Disagree More Agree More
A 14.6 A 25.0M 24.6 M 41.5
A 23.4 A 7.8M 18.5 M 29.2
A 10.9 A 28.1M 30.8 M 20.0
A 25.0 A 12.0M 16.9 M 35.4
A 15.6 A 14.0M 32.3 M 21.5
NOTE: A = algebra students, M = Math A students. For all items, p < .05.
CLASSROOM OBSERVATIONS
At least one observer was present in every class and completed an observation form
(described in Sec. 3). These observations provide data on time allocated to various classroom
activities, assessments of teacher effectiveness for the various topics, and general
assessments, such as how well the students did with the computer.
On average, teachers spent about 12 minutes at the beginning of the class to "settle"
the students and warm up for the lesson. This was followed by about 14 minutes of lecture
and 28 minutes for either noncomputer or computer work. The two teachers varied
somewhat in the time spent on these activities. Teacher A spent more time for warm-up and
lecturing (about 29 minutes) than did Teacher B (about 22 minutes; t = 2.64, p < .01). As a
result, Teacher B's students had about 10 minutes more computer or noncomputer time than
Teacher A's students (t = -3.60, p < .001).
Observation data show that Teacher A circulated among the students working at the
computer more than Teacher B (about 87 percent and 17 percent ofclasses, respectively; chi
square = 9.76, p < .002). As mentioned above, this matches their respective interest in
working with the computer. Observers also gave general assessments of how well the
students did with the lesson and how well they worked at the computer. Teacher A's classes
received higher ratings than Teacher B's in both areas. Observers judged students
performance with the lesson as "satisfactory" or "very well" about 86 percent ofthe time for
Teacher A, as compared to 48 percent for Teacher B (chi square = 7.013, p < .01).
-32-
Performance with the computers was "satisfactory" or "very well" for 89 percent of Teacher
A's classes and 50 percent of Teacher B's classes (chi square = 7.127, p < .01). Observers also
noted that computer crashes disrupted student work somewhat in both classes"a lot" in 21
percent of Teacher A's classes (4 of 19 classes observed) and 29 percent of Teacher B's (5 of 17
classes observed). Overall, computers were problem free only about one-fourth of the time.
On average, students in Teacher A's classes spent about 2.40 hours using the computer, and
Teacher B's students spent about 2.22 hours (F = 0.65, p < .4215). However, the distribution
of time over students was different, with a median time of 2-3 hours for Teacher A and 1-2
hours for Teacher B (chi square = 18.86, p < .009). Since computer crashes interrupted the
time-keeping program, these numbers underestimate the actual time spent.
STUDENT EVALUATION OF THE CURRICULUM
As part of the posttest, Math A students were asked to evaluate the curriculum.
Student satisfaction with various aspects of the curriculum is shown in Table 9. The first
seven items in Table 9 register overall impressions about the course. These data indicate
that about half of the students enjoyed the unit on "Modeling Real World Situations." They
found the situations (e.g., car wash, Heal the Bay) more realistic than interesting. Teacher
B's students found the situations more interesting than Teacher A's (mean rating 2.53 and
2.2, respectively, F = 5.16, p < .03). Three-fourths of the students enjoyed using the computer
and 70 percent found the computer hints helpful. The computer was easy to learn to use and
most students would use it again.
Item 8 asked students to rate how helpful working with a partner, computer
assignments, or noncomputer assignments were for doing the work on the modeling unit.
Responses were very consistent across both classes and show that working with a partner
was the most helpful. Furthermore, computer assignments were more helpful than
noncomputer assignments.
Item 9 asked students to rate, using the same scale described above, how helpful
various exercises were for understanding situations mathematically. Overall, most students
felt these different exercises were helpful. However, students varied in their responses
across teachers. Teacher A's students found making a table, using a graph, and writing a
word equation more helpful, whereas Teacher B's students preferred making word graphs
and writing symbolic equations. Finally, students rated helpfulness of various activities for
learning to solve an equation (item 10). Again, student ratings of helpfulness were high
overall and fairly consistent across teachers.
4 3
-33-
Table 9
Student Evaluation of the Curriculum
Item
Percent Reporting Positively
Teacher A(N = 40)
Teacher B(N = 49) Total
1. Enjoyed modeling unit 55.0 51.0 52.8
2. Situations interesting 32.5 49.0 41.6
3. Situations realistic 47.5 55.1 51.7
4. Enjoyed using computer 77.5 67.3 71.9
5. Computer hints helped 50.0 67.3 59.6
6. Would use computer again 87.5 98.0 93.37. Computer easy to learn 92.5 89.7 91.0
8. Help doing work for unit:Partner helped 73.7 70.8 70.9
This study had two broad goals: testing a novel approach to algebra that focused on
helping students learn skills for building and using mathematical models to solve real
everyday problems, and developing techniques for the successful transfer of technology into
the classroom. This pilot project gave us useful insights into both the effectiveness of the
curriculum itself and of the implementation process for a computer-integrated course. In this
section we discuss our findings concerning the techniques for technology transfer and the
effectiveness of the curricular approach, and we conclude by proposing curriculum
modifications based on our findings.
TECHNOLOGY TRANSFER
Overall, as described in the evaluation section, the technology transfer was effective,
insofar as the computers functioned as a standard component of daily lesson activities,
typically used by students twice a week. Thus the technology transfer model, whereby a
team of researchers and teachers provide computer-integrated lesson plans and course
materials, proved successful in enabling substantial computer use for new activities. The
integration of computer tasks directly into lesson materials is an implementation approach
that differs radically from the more typical practice in which a teacher occasionally takes a
math class to a lab to use a software package that seems to fit some aspect of a lesson, for
example, providing drill and practice in an activity already available in the textbook. In
implementing the technology transfer, we were also concerned about methods for providing
student and teacher training and making effective use of a limited number of machines.
Teaching students to use the computers and their various environments was
accomplished as a whole class activity requiring only a moderate amount of class time. In
classes where students received the lessons designed to train them in using the computer
(Teacher A's.classes), students easily completed assignments with a minimum of staff or
teacher coaching. Moreover, students reported enjoying using the computers and were able
to master the operation of the various environments.
Class observation records and student reports indicate that the cooperative work
groups for computer and noncomputer assignments were effective in sparking discussion and
reflection. Given economic and logistical considerations, classrooms are likely to have only a
limited number of computers (Office of Technology Assessment, 1988) and thus sharing
becomes a natural tactic to increase student computer time. However, we found that this
necessity proved to be a surprising asset, if organizedproperly. We found that having
5;
- 36 -
specific tasks for each student helped keep one student from dominating the activity. For
example, we had one student do the mouse clicking while the other input material from the
keyboard, and this process kept both students active while inspiring some thoughtful
negotiation about which data were to be input. The necessity of sharing produced effective
work sessions. It would be valuable to have a more controlled study of the benefits of
cooperative versus independent learning and to extend the work of Leinhardt (1989) in
determining which tasks are best accomplished in a group and how group work can be
managed for the most effective productivity.
Teacher comfort with the technology varied greatly as was reflected by the variation
between Teacher A and Teacher B in the time spent instructing students in computer
operation and circulating among students working at the computers. Increased training that
includes sufficient time for teachers to become familiar with computer capabilities and
assignments and with the operation of the machines is necessary to help teachers become
more comfortable with the new teaching tool.
CURRICULUM EFFECTIVENESS
The novel algebra curriculum was intended to teach students to acquire several skills,
including identifying the variables in a real-world situation; describing the covariation of the
values of dependent variables; recognizing and interpreting multiple representations of
information (tabular, graphical, and equational); constructing qualitative and quantitative
models of situations; solving problems on several levels (specifying solution goals and
operations and performing symbol manipulations); and interpreting solutions in terms of the
original problem.
The curriculum achieved mixed effectiveness. In general, students were more
successful at creating and using qualitative models than quantitative models. In the
qualitative modeling section of the curriculum, over two-thirds of the students could
successfully identify the variables, build qualitative models, gather data to explore
relationshipi, interpret tabular and graphical representations, and describe relationships. In
fact, they outperformed the algebra students on these innovative itemsa significant result
given that the Math A students' basic math abilities were significantly less than their peers
in the algebra classes.
Students were less successful at constructing quantitative models and equation
solving. The class unit tests indicate that only about a quarter of the students could specify
the three operators necessary to transform a word graph to a word equation; about half of the
students could specify the appropriate goals; about a third could specify the appropriate
- 37 -
operation; 45 percent could perform the symbol manipulations to solve problems arising from
real-world situations; and 24 percent could perform the symbol manipulations to solve
abstract problems. However, attitudes showed considerable improvement. In our past field
tests of the algebra tutor, using abstract problem solving, we frequently were asked, "When
(in our lives) are we ever going to use this stuff?" Students' improvement in attitude toward
the utility of algebra seems to indicate the effectiveness of using a real-world context for
problem solving to overcome this objection.
Four factors appear to have influenced our results: (1) the target population we
selected, (2) teacher comfort with the course goals and new roles, (3) computer operation, and
(4) curriculum considerations. First, our results are complicated by the limited mathematics
skills of the target students. Though final outcomes were low, we were encouraged by the
substantial gains in skills made by students during the study.
The second factor that may help explain our results is the difficulty the teachers had
in adopting a new approach and new roles. Early in the course, Teacher A, who had worked
closely with the development of the curriculum materials and the software, was intellectually
committed to the course goals, and in class observations was judged more effective in
presenting the curriculum, made a revealing comment. She remarked that it was extremely
difficult to teach the material because "the lesson is not minethe vocabulary is not mine."
She hoped that after a few more days it would feel more natural. The teacher's comment
points up the difficulty of assimilating new approaches and new theoretical goals even after
extensive involvement in the course development.
Our class observations often noted the teachers' difficulties in this area. For example,
in teaching about problem-solving goals, the teachers tended to use the goals (e.g., ISOLATE,
DISTRIBUTE) as process labels rather than as the strategic steps that would lead to the
determination of the value of the unknown variable. The emphasis was typically on what to
do, not why to do it. The teacher would say, for example, "when yoU have a term added to the
variable, the instruction you give to the computer is ISOLATE." The teachers also had
difficulty relating the equation solving to real-world situations, and they tended to gravitate
to the more familiar symbol-manipulation techniques. The framework for solving the
problem was thus often lost and with it the reason for solving for the unknown variable.
Not only were the teachers required to use a new approach but they also had new roles
introduced by the use of the computers. Both teachers were familiar and comfortable with
managing small groups working simultaneously on assignments and did not have difficulty
with the logistics of managing computer and noncomputer assignments. But Teacher B had
difficulty interacting with students working at the computer and essentially abdicated any
- 38 -
teacher role in computer work for most of the course. She did not feel comfortable with the
software and could not allocate the time necessary to learn about its capacities or about
problems students might encounter using the computers. Her introductions to the computer
environments were cursory and she relied instead on project staff to introduce students to
the computers and to coach their work. Teacher A circulated easily among students doing
computer and noncomputer work. However, she was sometimes frustrated by her lack of
expertise in dealing with computer problems, which she felt diminished her control and
authority in the classroom, since she was dependent on project staff to conclude assignments.
New approaches to mathematics and new roles introduced by advanced technology require
teacher training to enable teachers to assimilate new goals and become comfortable with
course material and tools.
A third factor contributing to our results was the slowness of the computers running
the software and the frequent bugs causing computer crashes. Though students frequently
had 25-30 minutes available to work at the computers, their actual time was restricted by
machine difficulties. Thus the computers did not entirely assume the teaching role they were
expected to have, placing more of a burden on the teachers and limiting student learning
while the students waited for computer access. To be effective in a classroom situation,
software needs to be error free and hardware processing must occur with reasonable speed.
Finally, to understand our results, we looked more closely at the equation-solving
activities in the curriculum, which were the activities that students found most difficult.
Though their overall posttest equation-solving scores were low, students did make significant
gains in their skills, particularly in nonabstract equation solving. Students were twice as
successful in solving equations that arose from real-world situations as they were in solving
exactly the same type of equation presented abstractly. We speculate that situating
equations allows students to draw on their intuitive and experiential resources and is more
intrinsically motivating. This conclusion supports contentions that curriculum that expands
students' understanding of the mathematical representations of real-world situations is both
more engaging for students and trains students in skills demanded in the modern workplace
(see Romberg, 1987; and Office of Technology Assessment, 1988).
A secondary problem with the equation-solving portion of the curriculum was
terminology, which became a burden for teachers and students. In particular, rather than
reifying or making explicit problem-solving actions, the labels for equation-solving goals
seemed abstract to students (and teachers) and became just one more meaningless bit of
information to be memorized. Additionally, the pacing of assignments meant that the second
half of the course, on equation solving, was handled much more quickly than the modeling
-39-
section. Students had very little opportunity to practice direct symbol-manipulation
techniques. Only one computer assignment asked students to directly solve equations. We
had expected, however, that the familiarity with goals and operations would produce an easy
transition to direct symbol manipulation. Students' poor equation-solving skills may indicate
that more practice in direct symbol manipulation is desirable or that the top-down goals
approach to problem solving was not effective in promoting acquisition of equation-solving
skills. Students may require more familiarity with symbol manipulation before they are able
to specify problem-solving goals.
CURRICULUM MODIFICATIONS
In addition to test results and student feedback, our classroom observations and
teacher feedback suggest several needed changes to the curriculum and supporting tutor
software.
1. The connection between the qualitative and quantitative components of the
curriculum need to be made clearer. Students did not always relate the graphical and
tabular models to equational ones. A clearer connection needs to be established
between the word equation students constructed in preliminary modeling and the
symbolic equations they are later asked to solve. Graphical and tabular activities
should be integrated into the equation-solving section of the curriculum.
2. New graphical representations need to be designed and integrated with existing
quantitative representations. For example, tutor graphing capacities need to be
expanded so that students can plot their own points as they collect data and gain a
better understanding of the equation line.
3. Students need more coaching on the construction of equations to represent natural
situations, particularly selecting appropriate operators. A computer activity letting
students explore the relationship between two codependent variables would be one
helpful approach.
4. Students are reluctant to read any textual instructions. Having students read aloud to
staff indicated that they were comfortable with the vocabulary, but there seems to be a
universal principle operating of doing the least possible work. More noticeable
messaging techniques (e.g., computer-generated voice messages) need to be
investigated.
5. "Mindlessness" (Salomon, 1985) is a related problem. To accomplish a task, students
will often plug in values, or click the mouse through a menu of options with no plan in
mind, until the computer performs the task. Motivation and engagement thus become
BEST COPY AVAILABLE
-40-
key concerns. On a technical level, this argues for the elimination of menus, or
perhaps a staged introduction of menus once students have mastered doing activities
"by hand." In addition, it will be important to increase the perceived cost of making a
high number of errorsa frequent effect of mindless choices. In constructing
computer activities, we also need to guard against contrived activities and to develop
activities that require thinking and engagement. For example, the sequence of
activities to develop and transform a qualitative representation from a word graph to a
symbolic equation was tedious and lent itself to the mindless use of menus.
6. Students need more instruction in inquiry techniques and systematic ways to collect
data (e.g., holding all but the one variable under investigation constant when studying
covariation) and in reflective techniques (e.g., looking at the effect of a problem-solving
command on the complexity of the resultant equation). Attention to the way
assignments are framed should also help guide students in more thoughtful behavior.
7. Course terminology needs to be revised so that it is more meaningful. Learning and
teaching terminology became a main stumbling block of the course, focusing attention
on the names for mathematical processes rather than the reasons for them.
8. More attention needs to be given to providing students with direct practice in symbol-
manipulation skills. It may be advantageous to introduce some practice with symbol-
manipulation skills together with the use of explicit goals and operations.
9. We must continue to develop interesting and realistic natural situations for students
to explore.
NEXT STEPS
Our next step is to develop an expanded version of the curriculum module described
above, which will include material on statistics and functions.1 We will use the technology
transfer model successfully fielded in this pilot but will devote more attention to teacher
training and teacher involvement in the initial definition of course goals. We also plan to
upgrade the'Computer configuration and to pursue extensive lab pilots of the revised and new
software. The existing curriculum module will be modified in accordance with the
recommendations outlined above and the results of preliminary lab studies. We plan to test
the expanded curriculum with both Math A and algebra students in the 1990-1991 school
year.
1The new curriculum development and test is funded by a grant from the U.S. Department ofEducation Fund for the Improvement and Reform of Schools and Teaching.
ALGEBRA CURRICULUM: INTRODUCTION TO LINEAR EQUATIONS UNIT
MODELING REAL WORLD SITUATIONS
Theoretical concepts:
1. Equations are models of real-world situations. Situations embed various featuresor natural variables
2. Real world situations can be analyzed in terms of natural variables.3. Values of dependent variables covary. Several kinds of questions about the
qualitative relationship among dependent variables can be answered, and insome cases the specific values of a variable can be determined by usinginformation derived from exploring dependency relationships.
Behavioral goals:
1. Students will be able to enumerate variables in natural situations2. Students will be able to use the computer tools.3. Students will be able to describe dependency relations through the use of word
graphs and tables4. Students will be able to classify various kinds of qualitative covariation
5. Students will be able to answer questions about natural situations (bothdiscovery types of questions, such as finding the unknown, and achieving specificvalue types) using various intuitive means like guess-and-test and tables ofvalues
6. Students will become familiar with the semantics of graphs and tables7. Students will be able to extend a given graph/table by predicting or estimating
further values8. Students will be able to translate the variables in a given situation into word
equations
Pedagogy:
1. The teaching style should be facilitative, eliciting information from students, andencouraging students to become increasingly independent in their work. Teachers shouldprovide the scaffolding on which students can build their own understanding. The teacher'sgoal should be to fade-out her coaching as students become independently able
2. Review, introduction of new topic, guided practice, and independent practice are thetypical lesson elements.
- 43
3. Understanding of the use of equations as models for real world situations should bedeveloped before introducing equations; thus, the unit on linear equations begins byintroducing students to the elements of equations: (i) variables as quantifiable descriptors ofnatural situations, (ii) the dependencies among variables, (iii) the way variables covary.
4. Students should focus on the concepts of variables and covariation before they areable to write or solve equations.
5. Multiple forms of representation (wordgraphs, tables, Cartesian graphs), are usedso that students see that equations are only one way of getting information about a problem,and that data can be represented in various ways.
6. Students gain understanding by observing and recording changes, and answeringquestions that lead to generalized understanding.
7. Cooperative learning groups are used to enhance motivation, sharing of ideas, andcourse ownership
59
- 44 -
LESSON 1: INTRODUCTION, IDENTIFYING VARIABLES, WORD GRAPHS
Goals:
1. Introduce unit topic: equations are models of real-world situations
2. Introduce concept of "variables" (situations embed various natural features orvariables).
Activities:
1. Warm-up activity. (Preserves class routine)
2. Teacher briefly introduces unit.
3. Teacher presents a topic, e.g. School Fundraising DanceStudents generate lists of variables for a given domain (brainstorm)E.g., Variables: # of students
Teacher refines list to quantifiable items, translating relevant items intomeasurable items (e.g. nice atmosphere=decorations)Teacher, with student input on variables, writes word graphs to define"Profit", e.g.
4. Students generate variable list for another domain. Teacher records list on boardand checks for appropriate items.
5. Teacher identifies output variable and asks students to write word graphsshowing other variables that influence the output variable (input variables) andshare with class. (Teacher models word graph depiction).
6. Teacher divides class into groups. These groups will remain stable for seatassignments for the duration of this unit. Allow about 20 minutes for the entireactivity. Give students a warning at about 8 minutes so that they can finish andhang up their charts.
60
-45-
Activity directions:1. Ask each group to select a recorder and presenter
2. Working on large sheets of newsprint, each group formulates a list ofquantifiable variables for a different domain.
3. When the list is completed, the recorder should raise his/her hand, andthe teacher will help the group identify an output variable.
4. The group should construct a word graph for the domain5. When the chart is finished, the recorder should bring it to the front and
hang it on the blackboard.7. Teacher should review each list, checking for quantifiable items, and eliciting
additional items from the class. Have a student from the group share the word-graph with the rest of the class.
1. Practice enumerating variables of natural situations
2. Investigate dependency relationships through the use of word-graphs and tables,and exploratory and problem oriented computer activities
3. Answer questions about natural situations using intuitive means such as guess-and-test, and tables of values
4. Become familiar with computer operation
Class Activities
1. Review variables and word graphs by having students brainstorm variable listtogether. After teacher identifies an output variable, students should suggest input variablesto complete a word graph.
2. Teacher introduces computer through whole-class worksheet covering keyboard,mouse, login; and specifically the screen format and problem input for word-graphs (menu,value boxes, table of values). SEE LESSON SCRIPT AND VIEWGRAPH MASTERS ONFOLLOWING PAGES.
Worksheet also allows teacher to walk students through a sample computerproblem and then gives student a chance for guided practice. Using theworksheet, the teacher explains how the tables will be built, the type of questionsstudents will encounter, and how to enter data.
3. Groups A & B working in pairs complete Computer Assignment #M-1. GroupsC & D work on Seat Assignment #M-2. Sample worksheets follow this lesson.
Computer Assignment #M-1:
1. Select Topic. Students will be presented with a menu of topics. All studentsshould select CAR WASH for their first topic. Worksheet M-1 is directly keyed tothe CAR WASH topic. After completing CAR WASH, students may select anytopic. They will not need to complete a worksheet for subsequent topics chosenfor the first assignment.
2. Formulation. Students will select the appropriate variables for the topic wordgraph.
3. Unconstrained exploration. Students will begin by entering values into any ofthe word graph boxes. They will have an opportunity to vary the values at will.Their explorations will be recorded in a table. Students will have anunconstrained opportunity to explore covariation.
4. Constrained Exploration. In this activity, all but two of the variables will beanchored. Students can change values in one box of the word graph and observehow values in the other box covary. A table of values will record students' work.Students are given various kinds of qualitative questions to answer about therelationship between the unanchored variables.
-47-
Seat Assignment #M-2: Students will explore situations by answering questionsshowing their comprehension of the situation, identifying variables in the situation,constructing wordgraphs, filling in tables, and answering questions that involvereading tables.
VOCABULARY: word graph, computer-terms
, ea
-48-
INTRODUCTION LESSON: THE RAND COMPUTER TUTOR
1. Introduce the computer Today, we are going to begin using the computers to do someexploring and problem solving. You'll be looking at situations and variables like we weredoing in class yesterday. The computer will let you explore what happens when you enterdifferent amounts for the variables. You'll be using tables (and later in the week, graphs) tohelp you keep track of what you find out. Everybody will work in pairs at the computer. I'llassign pairs after we have a look at how to use the computer. Be sure to work only with yourassigned partner so that the computer can keep track of your assignments.
2. Distribute Computer Get Acquainted sheets.
3. Review computer operation:
A. LOGGING ON SLIDE 1
1. Login: The computer will ask the student to type in their Student ID #. Both partnersshould type in their ID Vs. Students should check to see that they have typed their numberscorrectly. Use DELETE or BACKSPACE to correct any errors, and then hit RETURN. If onepartner is absent, only enter the ID of the student using the computer.
2. Choose a topic: Every time you finish logging-on, the computer will put up a menu andask you to select a topic. The first time you use the computer, please select CAR WASH,after that choose any topic that interests you.
3. The Mouse: To select a topic, move the mouse on its board to move the arrow on thescreen onto the topic, then click the mouse. You can click any button. One partner shouldplan to handle the mouse, and the other partner should plan to type. Trade jobs about halfway through.
B. SCREEN SLIDE 2
1. Point out the position on the screen of:
The SituationThe Word GraphThe Instructions windowThe graph and table
2. Ask students to draw a circle around the Instructions window, or mark it with a coloredpen. STUDENTS SHOULD ALWAYS BEGIN BY READING THE INSTRUCTIONWINDOW TO FIND OUT WHAT TO DO.
C. KEYBOARD SLIDE 3 Point out position of numbers; ask students to put a check onthe RETURN key, and then to circle BACKSPACE and DELETE.
D. PICKING VARIABLES SLIDE 4
1. Instruction Window: Ask a student to read the instructions in the Instructions window.Sometimes a special message will appear (ADD EXTRA MESSAGE TO SLIDE: "Click on the
4
-49-
OUTPUT variable. Click here to continue.") The special messages have a black bar. Click onthe black bar to get rid of the message and continue on.
2. Situation Window: Ask a student to read the situation.
3. Menu:
The first task is to select the OUTPUT variable. Explain OUTPUT (e.g. theresult in the situation; the overall concern in the situation). Ask students toselect the OUTPUT variable. Have students write the correct OUTPUT variablein the wordgraph on their sheets.Explain INPUT variables (e.g. the factors that the output variable depends on).Ask students to name the INPUT variables. Tell students that two on the list arewrong. If students select an incorrect variable explain why it is wrong (non-quantifiable, or insufficient information in the situation). Have students writethe correct variable names on their sheets.
E. EXPLORING WITH DIFFERENT VALUES SLIDE 5
1. Instruction Window: Ask a student to read the instructions.
2. Entering numbers: Explain that students will click on a variable box, the box turnsblack, the student types a number and then must hit RETURN, then the number appears inthe box. To correct an error, click on the box again and enter the number you want.Elicit values from the students that they think are realistic. Under each variable box, thereis a guide to the appropriate units for the answer. Cents are entered as decimals, e.g. ".04".Have students write the numbers in the variable boxes. If necessary, help students arrive atrealistic values by offering ranges, e.g. MILES will probably be between 300-1200;EXPENSES might be 2-6 cents/mile; INSURANCE might be $50 - 1500/mo.
Explain that as soon as students fill in all but one of the boxes, the computer will computethe last value.Simulate the computer, compute and write in the output value. Have students write thevalue for the output variable.REMEMBER: To enter numbers: CLICK, TYPE, hit RETURN
3. Table of values: After the student enters values for all of the input variables, the set ofexploratory values will be automatically entered and saved on the table. Have studentsenter the numbers from the word graph onto the table.
4. Assignment sheet: After trying 4 sets of numbers, students are asked to fill out theirassignment sheet. Partners should work together to complete the assignment. Each studentshould fill out a copy to keep.
F. EXPLORING WITH ONE FREE VARIABLE BOX SLIDE 6
1. Instruction Window: Ask a student to read the instructions.
2. Typing the GIVENS: Explain that the GIVENS are the amounts already told in theinstructions (e.g. EXPENSES = .04). Students will see that the boxes for GIVEN values areall framed in black. Ask students to enter the GIVENS on their sheet, while teacher entersthem on viewgraph.
R5
-50-
3. Entering varying amounts: Elicit a value for MILES and simulate the computer tocompute the COST. Have students enter the values on their worksheet.
4. Assignment sheet: Students should always remember to check the instructions window.Sometimes they will be asked to go on to another problems, and sometimes they will be askedto complete a section on the assignment sheet. Briefly review how to fill out the assignmentsheet.
5. Topic completion: When students finish a topic, the menu will reappear. Studentsshould select a new topic if time permits.
4. Pair Assignment1. Assign pairs. Students in Groups A & B should work at the computers and
students in Groups C & D should do their seatwork. Tell students that the Groups C & Dstudents will use the computers tomorrow. STUDENTS SHOULD ONLY WORK WITHTHEIR ASSIGNED PARTNER. If the partner is absent, the student should work alone.Computer data will be collected for the assigned partners, and also the computer will keeptrack of their work by ID #.
66
-51-
LESSON 3: USING GRAPHS
Goals:
1 Investigate variable relationships through the use of word-graphs and tables
2. Answer questions about natural situations using intuitive means such as guess-and-test, and tables of values
3. Become familiar with computer operation
4. Become familiar with the semantics of graphs and tables
Activities:
1. Review use of tables. Using one of the domains from earlier in the week, teacheridentifies output variable and has students identify input variables. After developing a wordgraph, make a chart anchoring all but two of the variables. Have students provide valuesand help teacher do math to construct a table. Ask several questions about the relationshipsevidenced in the table.
2. Teacher helps students identify output variables in several situations. Students practiceformulating problems for translation into word graphs distinguishing between the outputand input variables.
3. Discuss graphing. Review the placement of variables and method for plotting points, andthe meaning of various graphs.
4. Groups C & D complete Computer Assignment #M-1 (in pairs), and groups A & B work onSeat Assignment #M-2.
-52-
LESSON 4: TABLES, GRAPHS, TARGET VARIABLES
Goals:
1. Investigate variable relationships through the use of word graphs and tables
2. Solving simple quantitative discovery-type, and achievement-type problems usinginformal means, like guess-and-check, table-lookup, and 2d graph reading.
3. Extend a given graph/table by estimating or predicting further values.
Activities:
la. Review situation modeling:
Abstract situation: a school subsidized trip to Sacramento to learn about state government.Students identify variables and construct word graph; possibilities include:
lb. Review table and graphs: (Using review sheet for Day 4)
Word equation is: (miles * mile-rate) + (days * day-rate) = total-cost
Students complete table using a calculator (Part A of review sheet).
Based on the table, students answer the specific questions in Part B of the review sheet: 1 &2 are questions about the cost of various mileage combinations; 3 & 4 are about relationshipsbetween variables.
On blackboard or viewgraph, construct a graph for purpose of reviewing graphing lesson:
-53-
+ +
I I I I I I I I I I
300+---+---+---+---+---+---+---+ +
I I I I I I I Ilo I (Based on data in table).
Total I I I I I I I I I 1
cost 275+---+---+---+---+---+---+---+ +
1 I I I I I I I I 1
I I I I I I I I I I
250+---+---+---+---+---+---+---+ +
1 1 I I I 1 01 I I 1
I I I I I I 1 I I I
225+---+---+---+---+---+---+---+ +1111111111I I I I I I I I I I
2. Referring back to some of the questions asked in the review activity, the teacherintroduces the term "target variable", having students circle the target variable for eachquestion. Note that while the word graph remains the same, our interest can shift todifferent variables, i.e. we have different "target variables" depending on what we want tofind out about.
On review sheet: Part B, question 1, has TOTAL-COST as a target variable, because we areasking how much the rental will cost based on a certain distance. Part B, question 2, hasMILES as a target variable because we want to know how far the cousin can drive and staywithin a set cost.
3. Continuing on with the above problem, the teacher introduces the notion of findingoptimal values when a table doesn't have exactly the right value in it.
On the computer, this means moving from seeing how variables relate to each other in ageneral sort of way, to achieving a known and desired value.
E.g. if the number of days (3) and the day-rate (34) stay the same, how far can the cousindrive and spend exactly 175 dollars?
.1j 69
-54-
There are two methods that are used (in seatwork and on the computers) for finding ananswer:
i. generate new lines for the table, and "zero in" on the desired number for theTARGET VARIABLE:
E.g. We know that 266 miles gives 160.52 dollars, so we can keep trying highernumbers of miles until we get a number that works. (Answer: 331.81 repeatingor about 332 miles)
ii. draw lines on the graph to estimate an answer:To demonstrate: First connect points already on graph to make a line showing therelationship of miles and total-cost (all other numbers are set).
Then show interpolation from the TOTAL-COST desired to the correct number ofMILES by drawing lines from the y-axis to the slanting line, then down to the x-axis.
Once one problem has been demonstrated, call on students to solve similar problems in thesame situation:
How far can the cousin drive and spend exactly $190? $250?How much will it cost your cousin to drive 600 miles? 350 miles?
4. Groups A & B complete Computer Assignment #M-3 in pairs; Groups C & D work on SeatAssignment #M-4.
Computer Assignment #M-3
1. Solving problems with tables and graphs.
2. Where students are starting fresh on a new topic, they will also beselecting variables and constructing word graphs.
Seat Assignment #M-4: Given situations, students model situation, identifyrelevant target variable, and use tables and graphs to solve problems.
Goals
-55-
LESSON 5: TRANSLATING WORD GRAPHS TO WORD EQUATIONSAND SYMBOLIC EQUATIONS
1. Investigate variable relationships through the use of word-graphs and tables
2. Answer questions about natural situations using intuitive means such as guess-and-test, and tables of values
3. Extend a given graph/table by estimating or predicting further values.
4. Evaluate students' ability to perform activities specified in week's goals
Activities
1. ALTERNATIVE REVIEW ACTIVITY. Teacher presents an abstract situation, e.g. buyingice cream with various toppings and various scoop sizes. Students model the situation,construct word graph, table, and graph, and answer questions using tables and graphs.
"You are going to Puffin's Frozen Yogurt Shop for dessert after watching Samohi'sMidsummer Night's Dream" and want to make sure you can afford the concoction you willorder. What do you need to think about when you are estimating your yogurt cost? (perhapslist on board student suggestions):
Size of yogurt, number of toppings, discount coupons, total cost
"Now let's make a word graph of this situation:
Size-Price #-of-topping Topping-Price Discounts -> Total cost
"Let's make a table of the situation. Give me suggestions for:"size-price $1.00"number of toppings? 2"Price for each topping? .50"Discounts .50
Fill in table with student input:
Size-Price I #-of-toppings I Topping-Price. .
I Discounts I Total cost
1.00 2 .50 .50 1.50
32.00 3 .50 0 3.50
12.50 1 .75 .65 2.60
Now tell students that SIZE-PRICE, TOPPING-PRICE and DISCOUNT will stay the same.Ask for input for #-of-toppings and calculate total cost for several values.
- 56 -
Size-Price I #-of-toppings I Topping-Price I Discounts I Total cost
"How much would 3 toppings cost?" ($3.00)"How much would 8 toppings cost?" ($5.50)"If you had $5.00, how many toppings could you buy? (7 toppings)
2. Teacher briefly notes that algebra is another technique for answering questions, andtoday the class will work on translating word-graphs into equations so that students can usethe equations to solve problems.
3. Using the word-graph from # 1 above, the teacher begins introducing translation processSTARTING WITH with terms being added or subtracted.
E.g.,
Size-Price #-of-toppings Topping-Price discounts -> Total cost
Ask whether the toppings are added or subtracted from the bill, and whether the discount isadded or subtracted; fill in these two operators.
Size-Price + (#-of-toppings Topping-Price) discounts = Total cost
Using several examples, students identify whether term is being added orsubtracted from equation, e.g.,
"Would a tip for the person behind the counter be added or subtractedfrom the total cost?" (added)
72
-57-
"Would a daily special discount on your flavor be added orsubtracted from the total cost?" (subtracted)
4. Teacher goes on to identify terms being multiplied, e.g.:
Size-Price + (#-of-toppings * Topping-Price) discounts = Total cost
Teacher should try to explain the distinction between adding and multiplying inseveral different ways, e.g.:
Multiplication as cumulative addition (one topping @ .50 is forstrawberries, one topping @ .50 is for M&Ms, one topping @ .50 is fornuts)
When only one topping is being bought, it is like adding the cost of asingle topping in. But, when you want more than one topping, you haveto figure the price for each one, and then find out how many you areordering to get the total amount that this will add to your bill.
5. Guided practice: Students work several translation problems on their own. Teacherprovides situation and word-graph and then checks problems with whole class.
Situation: Buying new outfit at Santa Monica Place.
1. Equation writing and solution is tied to real-world situations for motivationalreasons, and because translation of problems into equations and answering questions usingequations is a primary goal, whereas symbol manipulation is a subsidiary goal.
74
- 59 -
2. We are trying to implement a general rule of permitting students to focus on one, ora few activities, while still having them see how the specific activity fits into the overallcontext of mathematical thinking, thus maintaining situated learning.
3. Along with maintaining situated learning, we are implementing he principles ofscaffolding and fading, i.e., having the student do one, or a few activities, while the tutor doesthe rest, with increasing amount of activity being turned over to the student and the tutorfading out.
4. To encourage students to plan problem solutions, they are introduced to equationsolution through the specification of strategic goals in problem solving. They are notrequired to manipulate symbols at this introductory period, so that they can focus entirely onplanning. We hope this will not only encourage strategic planning, but reduce the stressinvolved in having to apply several different types of math processes at once.
5. As strategic planning becomes instantiated, students are introduced to a lower levelcognitive goal, specifying solution operations. At the outset, operations are specifically tiedto goals.
6. The process for moving from a real-world problem into an equational representationis broken down into the following steps: (i) formulating a problem into a word graph; (ii)translating the word graph into a word equation; (ii) symbolically representing the wordequation; (iv) substituting values.
7. Although the tutor models the translation of a real-world problem into anequational representation, and we will have students try to write equations, the tutorcurrently provides no coaching for problem translation. (The reason for this is that problemtranslation is a heuristic skill that has not been well-articulated so that a teacher coulddiscuss it, or a computer could automate it.)
-60-
LESSON 6: SIMPLIFY (GOALS, MATH), REDUCE (GOALS)
Goals:
1. Review: Wordgraphs; target variable; word equations; signed numbers
1. Review word graphs. Teacher describes the abstract situation, "Knowing the profit from aschool dance":
The senior class is holding a dance to help pay for yearbooks. It's going to be a sock-hop in the gym, using taped music. The students are trying to figure out their profitdepending on what they charge and how many tickets they sell.
Asking for student help with the variables, the teacher generates an appropriate wordgraphwith student input:
Tickets sold Charge > Profit
2. Teacher translates word graph to word equation, with student input; and then intosymbolic equation.
Tickets sold * Charge = Profit
t * c = P
3. Teacher substitutes values, the seniors sell 100 tickets, and charge $4.00 a ticket. Shecircles the target variable "profit" and then asks students what has to be done to find out thevalue of the target variable. Label the goal and process of "combining numbers" asSIMPLIFYing:
100 * $4 = PTeacher asks students to solve the equation, and then checks the answer on the board.
Teacher and/or students generate several more equations, using different values for"tickets" and "charge". (Each time, the teacher asks students for suggestions on howmanylickets will be sold, and what the charge should be.) Students solve each newequation, and teacher checks it on the board.
4. Teacher rewrites original word equation, and changes the target variable to one of theinput variables, circling the target variable. She elicits from the students that the targetvariable is multiplied by a number, and then explains that to find out the value of the targetvariable, we need to get the target variable by itself, this goal will be called REDUCE.
tickets * Charge = profit
t * C = p20(C) = 100
-61-
Teacher labels the goal and does the arithmetic
REDUCE > C = 100
20
Ask students what the next goal would be (SIMPLIFY), and finish solution.
SIMPLIFY > C = 5
Explain that to check the answer it should be substituted back into the originalequation. Teacher substitutes value and asks students to do arithmetic
4. Use another situation involving rate of speed * Time = distance:
You're going to a rock concert in Santa Barbara. Your average speed is 45 mph, andthe distance is 90 miles. How long will it take to get there?
The teacher writes the equation, substitutes values, then asks students for the targetvariable. The teacher circles the target variable and asks students for the goal(REDUCE)
s * T = d45 (T) = 90
Students specify REDUCE teacher does arithmetic 90/45 = TStudents specify next goal, SIMPLIFY, teacher does arithmetic
Define coefficient a number multiplied to a variable
5. Teacher notes that multiplication can be represented in many different ways: 20 * C
20 x C 20(C) 20C
Using the equation from "4" above, have students circle the coefficient, thenrepresent the multiplication in several different ways
6. Teacher briefly reviews how signed numbers are combined. Display chart which canremain visible during the class:
To combine numbers with same signs, add the numbers. The answer has the sign ofthe numbers:
..-6 5 = 11 +3 +4 = +7
To combine numbers with different signs, subtract the smaller number from thelarger. The answer has the sign of the larger number:
10 +2 = 8 +14 4 = +10
Multiply or divide numbers with like signs and the answer is positive:
5 * 4 = +20 +3 * +4 = +12
Multiply or divide numbers with unlike signs and the answer is negative:
+5 * 5 = 25
. 4.-
77
-62-
11. Teacher asks the class to do the following problems. Students do problems and teacherchecks answers:
speed * time = distance
1. You're going to a rock concert in San Diego. This time the speed is 50mph and thedistance is 100 miles. How long will it take to get there?
Teacher writes on board: 50 * t = 100
She asks students for the target variable and circles it.
She asks for first goal:
(If students say SIMPLIFY, ask them to explain, trying to elicit that there arenot two numbers multiplied together but a number and a variable. So the goalis REDUCE.)
Teacher does math: t = 100
50
Teacher asks for next goal:
Students do math.
The teacher uses the same procedure with the next problem: This time a group is going to arock concert at the Orange County center. They know it will take one hour to get there, andthe distance is is 35 miles. How fast are they driving?
12. Teacher briefly introduces goal level software SEE LESSON ON FOLLOWING PAGE.
13. Groups A & B work in pairs on computer assignment #M-6 (15min): Modeling situationsand solving equations using the goals SIMPLIFY and REDUCE.
14. Class assignment (15min): All groups are responsible for Assignment # M-5 (Seat)"Combining signed numbers." (Marcy Sheets AA31-32). Groups C & D are also responsiblefor Assignment #M-7 an exercise involving specifying goals for problems requiringSIMPLIFY and REDUCE.
EQUATION SOLVING SOFTWARE: INTRODUCTORY LESSON FOR STUDENTS
1. Distribute student worksheet. The student worksheet will have a picture of themodeling software on side one, and of the modeling and equation software on side two.
2. Tell students that the login procedure is the same.
3. Show viewgraph-A of typical week 2 screen showing the modeling window. Askstudents to read aloud the situation. (The situation is the same as was used for the computerintroduction, buying a car.) Variable names will already be filled in the word equation, andthe first operator will also be filled in.
INILES 1 I * I I EXPENSES I I I INSURANCE I =I I COST I
Point to the word equation and discuss the relation of the variables.
Ask students to write in the missing operator. Tell them that on thecomputer, they will CLICK, TYPE, and hit RETURN to enter the operator.
4. Point to the Symbolic Equation. Tell students that they will be choosing letters tostand for the words. Have them write in the letters.
5. Show viewgraph-B of modeling windows, with Assignment M-6 problemdisplayed.
Ask students to read instructions
Ask students to identify TARGET variable. Have students circle targetvariable in the instruction window.
6. Show viewgraph-C of equation solving window. Point out various features ofequation solving window (e.g. Help, Goal names, Comment window, etc.). Tell students thatthey will type in the goal for each step of the problem, and the computer will do the math.
Have students write the goal for the first step in the problem next to the"Current Goal" prompt.
7. When students have finished a problem they should click on "Answer OK".
Have students circle "Answer Ok" on their sheet.
8. After the computer checks the problem the student will fill in his worksheet. Reviewworksheet questions with students, showing sample answers from the problem ontheir sheet:
79
-64-
What was the target variable? (expenses)
Explain your answer in a short sentence. (The expenses for the car were 5cents a mile.)
9. Remind students that they can choose any topics they want, and that theyshould complete as many topics (and problems) as they can.
2. Introduce: REDUCE at operations and math level, ISOLATE at goals level
Activities:
1. Review SIMPLIFY, REDUCE:
Describe an abstract situation for raising money from a football game:When you figure out how much money a football game will raise, youneed to think about how many people will attend and the ticket cost.
Teacher generates a word graph and then a word and symbolic equationwith student input: e.g., Ask, "If we want to know how much money we'llraise, what do we need to think about?"
#PEOPLE TICKET-COST > MONEY-RAISED
PEOPLE * TICKETS = MONEY
p * T = m
Substitute values, identifying "ticket cost" as target variable; and havestudents specify solution goals while teacher does math.
500 * T = 1500
REDUCE > 500T = 1500
500 500
SIMPLIFY > T = 3
Ask students what had to be done to REDUCE the "500T". Explain thatwhenever a variable has a coefficient, we get rid of it by dividing by thecoefficient and thus cancelling it out. HOWEVER, if one side of theequation is divided, to keep the equation even, the other side must also bedivided.
Teacher gives several similar problems, first modeling their solution, thenhaving students solve them. Examples to use:
If money raised was $2000 and the number of people whoattended was 750, what must the ticket price have been? (750*T =2000)
If ticket price was $4 and money raised was $2200, how manypeople must have shown up? (p*4 = 2200)
If the money raised was only $1500 and ticket price was still $4,how many people come? (p*4 = 1500)
BEST COPY AVAILABLE8 1
-66-
2. Teacher rewrites the original word equation and adds another term to the equation, e.g."security". Teacher underlines the target variable and asks students what has to be done tofind out the value of the target variable, ticket cost? (REDUCE it from its coefficient andISOLATE it from the the number that is subtracted from it).
#people * ticket cost security = Money-raised; p * T s = m
500T 100 = 1500
Teacher explains that often it is easier to begin by isolating the target variablefrom any term added or subtracted to it, and then from the coefficient. Teacherasks students to specify goals, and she does the arithmetic, with student help.
Check by substituting value back into original equation
3. Teacher provides the following examples and ask students to circle the coefficients and/orterms connected to the variable:
a) # of renters * Fee = video store sales
Target variable is "Fee", circle the coefficient:
100(F) = 2,000
b) renters * Fee + membership = video store sales
Target variable is "fee", circle the term connected to the variable:
100F + $10 = $2,000
c) # of miles run * pledges per mile = amount of money you raise
Target variable is "# of miles you run", circle the coefficient:
M(25) = 500
d) miles * pledges entry fee = money raised
Target variable is "miles", circle the term connected to the variable:
M(25) 50 = 500
82
-67-
4. Teacher briefly review meaning of SIMPLIFY and ISOLATE and REDUCE.
ISOLATE means to remove a term added or subtracted to a variable, so that itwill stand alone
REDUCE means to remove a coefficient from the variable, so the variable willstand alone
SIMPLIFY means to combine numbers
5. List these three goals on the board, and then ask students to specify the appropriate goalsfor the following problems:
renters * fee salaries = video store Sales
r*f+m = S 100 * $2 $44 = S
Explaining that the store owner wants to know what his sales will be, askstudents to underline the target variable, the one they want to know about(SALES).
Ask if there's anything there with it, i.e. does it need to be ISOLATED orREDUCED. Since it's already alone, what is our goal (i.e., what needs to be doneto find out how much money the video place has made? (SIMPLIFY)
Check answer in original equation
In the next problem, explain that the owner wants to know how many renters he'llneed to earn $4000. Ask students to underline the target variable, the variable theywant to find out about. Ask them if it's alone, if not, what strategy do they have to useto begin to solve the problem?
R($2) $44 = $4,000
ISOLATE > $2R = 4000 -44
Ask for the next step (REDUCE or SIMPLIFY) and illustrate its results (Notethat students could use either strategy and on the computer they can try bothand see which they prefer.):
REDUCE: R = $4000 44 -OR- SIMPLIFY: R(2) = 3956
$2
Pursue the solution, having students specify the next goalUse the following problem based on selling tickets to earn a profit. Ask studentsto help write the word graph and then the word equation:
ticket price * #kids expenses = profit
Teacher labels target variable "#kids" then: t*Ke= p
Teacher substitutes values: $4 * K $25 = $375
4K 25 = $375
-68-
Students specify goals and teacher does math with students' help for SIMPLIFYand REDUCE
ISOLATE > 4K = 375 + 25
SIMPLIFY > 4K = 400
REDUCE > 4K = 400
4 4
SIMPLIFY > K = 100
Check: 4(100) -25 = 375
6. Groups C & D work in pairs on computer assignment #M-9: modeling and equation solvingat goal level using SIMPLIFY, REDUCE, & ISOLATE, then they work on Seat assignmentM-8.
7. Groups A & B work on Seat Assignment #M-8: Solving problems requiring REDUCE andSIMPLIFY at the goals, operations, and math level; and Seat Assignment M-10: Specifyinggoals for problems requiring SIMPLIFY, REDUCE, and ISOLATE.
VOCABULARY: ISOLATE
-69-
LESSON 8: ISOLATE (OPERATIONS, MATH)
Goals:
1. Review: SIMPLIFY; REDUCE; ISOLATE
2. Introduce: ISOLATE at operations and math level
3. Introduce tutor software for combined goal-operations problem solving
Activities:1. Check some of the problems from seat assignment 4 as a review of SIMPLIFY, REDUCE,and ISOLATE at the goal level, and SIMPLIFY and REDUCE at the operations and mathlevel.
2. Introduce the operations and math needed to ISOLATE. With the video rentals situation,use the following equation requiring ISOLATE, with the target variable RENTERS, e.g.
Fee * Renters Salaries = Profit
$2 * R $200 = $4,000
Elicit next step from students:
ISOLATE > 2R 200 + 200 = 4,000 + 200
Ask students what had to be done to move the "200" to the otherside. Explain that toISOLATE a variable with a term added or, subtracted from it, do the opposite, i.e., inthis case, add "200" so the terms will cancel each other out. HOWEVER, to keep theequation equal, whatever is added (or subtracted) from one side, must be added (orsubtracted) from the other side.
Complete the problem solution, having students first specify the goal, then help withthe math, as follows:
SIMPLIFY >
2R 200 + 200 = 4,000 + 200
2R = 4,200
REDUCE >Operation needed forREDUCE is divide each
side by 2 (/ 2)
SIMPLIFY >
2R 4,200
2 2
R = 2,100
3. Work through second problem, getting student input for the solution:
85
- 70 -
This time, suppose the fee for renting videos is still $2 per video, but salaries have increasedto $400. If profit dropped to $3,600. How many renters were there? The equation is:
Fee * Renters Salaries = Profit
2 * R 400 = 3,600
ISOLATE >Operation:
+ 400 2R 400 + 400 = 3,600 + 400
SIMPLIFY > 2R = 4,000
REDUCE >Operation:
/ 2 2R 4,000
2 2
SIMPLIFY > R = 2,000
4. Explain giving operations on the computer:
reading the problem and picking the target variable is the same as when doingonly the GOALS
to solve problems, first give the GOAL as before. Then when the computerhighlights the line that says "Current operation:", type the OPERATION youneed to carry out the GOAL.
OPERATIONs given to the computer have three parts:
1. +, * or / to show whether something is to be added to, subtracted from,multiplied by or divided into each side, respectively.
2. a space
3. the number that's supposed to be added, subtracted, multiplied or divided
Thus, dividing each side by 2 is given by "/2".
Adding 400 to each side is "+ 400".
NB: "/2" won't work (no space), nor will "+400".
After the OPERATION is given, the computer will write out the next step of theequation and ask for the next GOAL again.When a solution has been found, checking the answer is just as in previouscomputer sessions.
5. Groups A & B will each do Computer assignment M-11 (15min each) and then begin Seatassignment #M-12. Groups C & D will work on Seat assignment #M-12.
8
- 71 -
Computer Assignment #M-11: Modeling and equation solving usingSIMPLIFY, ISOLATE, REDUCE with the goal and operations level software.
Seat Assignment #M-12: problem solving using SIMPLIFY, REDUCE andSOLATE at goals, operations, and math levels.
87
- 72 -
LESSON 9: THE EQUALITY OF AN EQUATION
Goals:
1. Review: SIMPLIFY, REDUCE, ISOLATE
2. Introduce: Concept of equation as an equality
Activities:
1. Alternate Review Activity to review problems requiring SIMPLIFY, REDUCE, ISOLATEat goals, operations, and math levels, e.g.,
Ex: Total number of students buying yearbooks: 4 classes each have 30 kids, all but4 in each class buys the book:
4(30 4) = # kids buying
SIMPLIFY: Goals: SIMPLIFY -> 4(26) = # of kids
SIMPLIFY -> 104 = # of kids buying yearbooks
Ex: Each of the 11 members of the swim team sold the same number of carnationson last Valentine's Day. If they made $440, how much money did each swimteam member bring in?
11 * amount = 440
REDUCE: /11 11a/11= 440/11
Do division a = $40
Each team member sold $40 worth of flowers.
Ex: On your trip to Hawaii this winter, you have decided that you don't want tomake the trip from Maui to Oahu that you have already paid for. You don'tremember what the total cost of the original ticket was, but the trip to Mauiwas going to cost you $516. You end up getting a refund check in the mail for$172 for the unused part of your ticket (the hop to Oahu you didn't take). Howmuch must that original total ticket cost?
Total Price refund = Maui trip
P $172 = $516
ISOLATE: +172 P $172 + $172 = $516 +$172
Do addition P = $688
2. Use scale or some other manipulative to portray that an equation is an equality.
Explore with students what happens as different quantities are added and subtracted:
"Equations works like balance beams (see-saws) and the place where they balancesis the equal sign. In order for the equation to remain an equation, you MUST
88
-73-
FOLLOW THE RULE: whatever is done to one side of an equation must be doneequally to the other side, because the "=" means that each side must equal the other.
BRIEFLY refer back to REDUCE and ISOLATE problems previously completed inclass and remind students that whatever was done to one side of the equation had tobe done to the other: this is especially visible at the operations level. Give an exampleand get student input on what to do, e.g.:
At a dance:Tickets sold + food sold = profit T + F = P,
Present situation: "We made $500 on the dance. We know we sold $300 worthof tickets; how much food did we sell?"
Write equation on the board:300 + F = 500
Talk students through the problem, e.g.:Ask students how they think they could determine the foodsales (Hopefully they will intuitively figure 500 300 and/or specifyISOLATE.)
Ask, "If we subtract "300" from one side of the equation, what do we have todo on the other side" (Also 300), Why did we do it? Because this keeps theequation even.
Write out problem, adding goal and operation labels:
500 = 300 F
ISOLATE, 300 500 300 = 300 F 300
SIMPLIFY 200 = F
Talk students through another problem, e.g., Joining a health club.
"Prices for health clubs are very competitive in the area. One club is offering thefollowing deal: a one year membership for $444. They claim that this is a special lowprice, lower than their normal rate of $36 a month. How much of a deal are theygiving you?
REDUCE: /12
12 * monthly-rate = $44412*m = $44412 * m $444
12 12
m = $37
Again, highlight that with dividing the entire side of the equation must be divided,with adding/ subtracting, the term being added/subtracted is added only once to eachside of the equation.
89
- 74 -
If there is time, DEMONSTRATE that doing different things to the two sides of anequation makes it NO LONGER AN EQUALITY.
3 * X = 15 <- WE KNOW THAT X = 5)
divide only one side by 3.. .
X = 15 <- but we knew that X had to be 5 from before
CHECK by SUBSTITUTING! 3 * 15 = 15
45 = 15 <- not possible
3. Help students complete the "Money Bags" worksheet.
4. Groups C & D complete Computer assignment # M-11, and groups A & B work on Seatassignment #M-12.
1. Review SIMPLIFY, REDUCE, ISOLATE. Teacher presents a high school car washsituation. With student input she generates the word & symbolic equation, and then theteacher substitutes values, designating the target variable, "cars":
fee * Cars expenses = profit
f(C) e = p
4C 10 = 90
Teacher asks: What do we want to know about? she underlines target variable
Teacher asks students for goal, then operation, then math e.g.: What's our firststep? (ISOLATE) What do we have to do to ISOLATE? (+ 10) How do we dothat? (+10 to both sides, etc.)
Pursue problem to its solution, then check answer in original problem.
2. Introduce COLLECT:
a) Teacher generates situation involving manipulatives (e.g. different types of fruit,or color-coded groups of students), students physically "collect" themselves intoappropriate groups to solve problem.
b) Teacher rewrites word equation from "1" above, to include spray wax jobs. Carsis still the target variable. We want to find out how many Cars will have to bewashed and waxed to make a profit of $440.00. Underline target variable:
f*C+(w*C)-e=p
Teacher substitutes values: $4 * C + ($5 * C) 10 = $440
4C + 5C 10 = 440
Ask students for next step; explain why ISOLATE and SIMPLIFY are not appro-priate yet; reinforce any responses about adding the two instances of the variable.
ISOLATE requires there be only ONE instance of the variableSIMPLIFY combines NUMBERS
Introduce the term COLLECT combine like variables. Explain that thecoefficients of the variable are combined.
Continue on with the problem, eliciting goals, and explaining operations andmath.
91
- 76 -
$440 = 4C + 5C -10
COLLECT > $440 = 9C -10
ISOLATE; +10 $440+10 = 9C -10 + 10
SIMPLIFY $450 = 9C
ISOLATE; /9 $450 = 9C
9 9
SIMPLIFY > 50 = C
Ask students to substitute value of "C" into original equation to check results.(Refer to Order of Operations chart as necessary.)
$450 = (50 * $4) + (50 * $5)
3. Use the following two situations to provide more practice using COLLECT. Studentsshould help establish word graphs and the translation into word equations, specify goals anddo math.
During the presentation emphasize the conditions that dictate a specific strategy step, andthe occasions when a choice of strategic steps is available.
a) Situation: Your group is going to a banquet. The total cost (C) of the banquet to thegroup depends on the total number of people that are going (P), the cost of food perperson (F), and the admission cost per person (A).
The equation is: F*P + A*P = C
Specific problem example:
Assuming your group has $600, admission price is $5, and the cost of food per personwill be $20, how many people from your group can go to the banquet?
b) Situation: You want to collect energy in atomic particles in a physics experiment.The particles are generated by a cyclotron, and pass through three energy boostingrings before being captured in a lead box. The total energy (E) you capture dependson the number of particles (N) you capture, the energy given to each particle by ring1 (A), the energy given to each particle by ring 2 (B), the energy given to eachparticle by ring 3 (C).
The equation is: A*N + B*N + C*N = E
Specific problem example:Assuming you want to collect a total of 10000 units of energy, and that ring 1 giveseach particle 2 units of energy, ring 2 gives 3 units of energy, and ring 3 gives eachparticle 5 units, how many particles do you need to collect?
4. Groups A & B working in pairs, Computer assignment #M-15, and work on Seatassignment #M-14.
5. Groups C & D, Complete Seat assignments #M-14 and M-16.Computer Assignment # M-15: Problem solving usingSIMPLIFY, REDUCE, ISOLATE, COLLECT goals & operations level.
- 77 -
Seat Assignment #M-14: Problem solving with SIMPLIFY, REDUCE, ISOL,COLLECT at goals, operations, math level. Seat Assignment #M-16: Problem solvingwith SIMPLIFY, REDUCE, ISOLATE, COLLECT at goals and operations level.
93
- 78 -
LESSON 11: DISTRIBUTE (GOALS)
Activities:
1. Review equation solving.
2. Introduce DISTRIBUTE.
Present situation: A computer club wants to raise $100 for a modem. They meet 8days each month, and each time they have to pay $5 cleaning charge for the meetingroom. What kind of fee should they charge at each meeting to cover their expenses ndraise $100?
days(fee cleaning) = modem
d(Fc)=m8 (F 5) = 100
Ask students what they think is the first step. If inappropriate answers are given,counter by specifying conditions that must be met for the step. If students don't know,suggest completing the multiplication, using the distributive rule. Goal is toDISTRIBUTE. Complete the problem at the goal level, with students specifying goalsand teacher doing math.
GOAL LEVEL:
8(F-5) = 100
DISTRIBUTE > 8F 40 = 100
ISOLATE > 8F = 100 + 40
SIMPLIFY > 8F = 140
REDUCE > F = 140
8 8
SIMPLIFY > F = 17.50
Replace answer in original equation to test whether it's correct.
3. Do another problem using the same equation. This time, the club thinks they can get themodem for a discount, $80.00. They still meet 8 days, but they've been so neat that thecleaning fee is only $3.00. Complete the problem with students specifying goals and teacherdoing math:
days(Fee cleaning) = modem
8 (F 3) = 80
DISTRIBUTE > 8F 24 = 80ISOLATE > 8F =80+ 24
SIMPLIFY > 8F = 104
94
-79-
REDUCE > F = 104
8 8
SIMPLIFY) F = 13.00
4. Use the following situation and do two more problems requiring DISTRIBUTE. Havestudents help write equation and then specify goals and help perform symbol manipulationswhen appropriate.
Problem AThe science class is going on a field trip to Griffith Park Observatory. The studentshave to pay a lunch fee and a bus fee of $2.00. Twenty-five students are going on thetrip. The school is providing $137.50 for the trip. How much can each person spend onlunch?
students (lunch fee + bus fee) = trip cost
s(L+b)=t25 (L + 2) = 137.50
Problem BThe school was so pleased that all the students wanted to go on the trip, that theyagreed to provide $180.00 for the trip. Now all 32 students are going. How much willeach person haveor lunch now?
32 (L + 2) = 180
5. Groups C & D working in pairs, complete Computer Assignment #M-18 and SeatAssignment #M-17. Groups A & B work on Seat Assignments #M-17 and #M-19.
Seat Assignment #M-17: Problem solving withSIMPLIFY, REDUCE, ISOLATE, & COLLECT at goals,operations, and math levels. Assignment #M-19:specifying goals for all commands.
9.5
-80-
LESSON 12: DISTRIBUTE (OPERATIONS, MATH)
Activities:
1. Review material from Seat Assignment #17.
2. Introduce DISTRIBUTE at the operations and math level. Use the following situation.Have students help develop word equation. As the problem is being solved the studentsshould specify goals and the teacher should explain the math involved in DISTRIBUTing.
The football team wants to buy an end of season thank-you present for all thecheerleaders. They decide to buy a corsage and a box of candy for each girl.There are 6 cheerleaders; flowers are $2.50 each. The team has collected $45.00.How much can they afford to spend on candy for each girl?
# of girl cheerleaders(flowers + candy) = team money
Explain that the term outside the parentheses is to be multiplied againsteach of the terms inside the parentheses; teacher continues on elicitinggoals and doing math with students' help.
3. Ask students to do the following problems. Check problems together:
a. What if the team thinks they can get candy for $4.00 and want to know howmuch they can spend on flowers, (total team money stays at $45.00):
6 (F + 4.00) = 45
b. What if the team decides to include the cheerleaders' manager, so now there's 7gifts; they spend $3.75 for flowers; they collected $47.25. How much could theyspend on candy?
7 (3.75 + C) = 47.25
c. What if the team decides to buy thank you presents for all the song leaders, too.If they spend $3.00 on flowers, $4.50 on candy, and haNe collected $75.00; howmany people can they buy presents for? #of people (flowers + candy) = teammoney
P (3.00 + 4.50) = 75
Note: on the computer, this problem needs to begin by SIMPLIFYING
4. Introduce students to the math level software. Tell students that after specifying the goalfor each step in the problem solution, they will be asked to type in the actual next line of theequation. Calculators will be available. Example:
2d + 3 = 23
Goal: ISOLATE
Equation: 2d +3 -3 = 23 -3
96
-81-
Students can do as much figuring in their head or with a calculator as theywant. For example students could enter the ISOLATE equation, above, inany of the following ways:
Equation: 2d = 23 -3
Equation: 2d = 20
5. Groups AB and CD in pairs, 15 min each set of groups, complete Computer Assignment#M-20. Students individually work on Seat Assignment #M-21.
Computer Assignment #M-20: Problem modeling and problem solving atmath level.
Seat Assignment #M-21: Problem modeling and problem solving.
97
-82-
GLOSSARY
ACTIVITY PROFILEA complete specification for each model-building activity andequation-solving activity whether: (i) it is to be done by the student, (ii) by the tutor, or (iii)not done at all (or done implicitly by the tutor).
ACHIEVEMENT QUESTIONSSpecific questions about a natural situation in which theoutput variable is known, and the student must infer what the values of other variables mustbe for the output variable to achieve its desired value. Example: "If total sales = 300
and you want total sales to be 250, what must cost-per-unit be set to toachieve this goal?"
DISCOVERY QUESTIONS Specific questions about a natural situation in which theoutput variable is unknown, and the student must infer what it is given the values of othervariables. Example: "If total sales = 300 - 3*cost-per-unit, and cost-per-unit is 20, what willtotal sales be?" ,lp CHECKING AN ANSWERIn solving a symbolic equation, theinterpretation of the answer back in terms of the original statement of the specific problem.
EQUATION-SOLVINGActivities that take a specific problem and equational model of anabstract situation (symbolic equation) and make an inference about the value of the targetvariable in the specific problem. We somewhat arbitrarily divide this into 5 subactivities: (i)mapping the specific problem onto the equational model, (ii) reasoning about goals, (iii)reasoning about operations, (iv) symbol manipulation, and (v) checking an answer arrived atby symbol manipulation against the original specific problem.
EQUATIONS:
SYMBOLIC EQUATIONEquation where all operators and words denoting variables arerepresented using traditional algebraic syntax: single letter variables, and operators like, *, I.
WORD EQUATIONEquation where operators are in traditional algebra, but variables areEnglish labels. The variables may be just the English labels, or variable boxes. For example:
I profit I I #students I I cost/ticketI I expenses I
I I = I I* I I I I
I I I I I I I I
GOAL REASONINGIn solving a symbolic equation, the determination of which goal tofollow; for example "isolate".
GRAPHS:
WORD GRAPHDescription of a situation where all variables are represented usingvariable boxes, but operators are not. Graphical version of "y=f(x,z,...)".
EST COPY AVAIABLE
98
-83-
I profit I I #students I I cost /ticket) I expenses I
I I < I I I I I I
I I I I I I I I
2D GRAPHA standard graph plotting values of two natural variables against eachother. Both axes are labelled with the names of the variables.
MAPPING A SPECIFIC PROBLEMIn solving a symbolic equation, the activity ofinterpreting a specific problem in terms of an equational model. This breaks down intoseveral subactivities: (i) identifying the variable being solved for in the equation, (ii)identifying the other variables and substituting into the equation values given in the specificproblem.
MODEL-BUILDINGActivities that transform a natural-language description of anabstract situation into an equational model that can be used to answer many specificquestions. We somewhat arbitrarily divide this into 3 subactivities: (i) formulation, (ii)translation, and (iii) symbolization.
OPERATION REASONINGIn solving a symbolic equation, the determination of whichoperation to apply; for example "+9".
PROBLEM FORMULATIONProcess of taking an ill-defined description of a situation intoa list of variables that define the situation, possibly also identifying the input and outputvariables. More specifically, for our purposes, we define formulation as converting a wordstatement representation of a problem into a word graph.
PROBLEM TRANSLATIONProcess of taking a situation that has been defined to the pointof a variable list or word statement, and turning it into a word equation.
PROBLEM SYMBOLIZATIONProcess of transforming a word equation of an abstractsituation into a symbolic equation.
SITUATIONS:
ABSTRACT SITUATIONA "real world" situation that encodes a relationship between twoor more natural variables. The situation is abstract in the sense that specific values are notgiven for the variables. Example: 'Jill has 10 more than 3 times as many marbles as Jim.' isan abstract situation involving 2 natural variables, marbles' and `Jim's marbles'.
SPECIFIC SITUATION/PROBLEMAn abstract situation where values of some naturalvariables are given. Example: 'Jill has 10 more than 3 times as many marbles as Jim. Jillhas 58 marbles' is a specific situation. These are typically the kinds of things that are thebasis for "problems" in textbooks. A specific situation is described where one or more naturalvariables are not given values (i.e., unknown), but their value(s) can be inferred from theabstract situation constraints, and given variable values.
SYMBOL MANIPULATIONIn equation solving, the actual writing of a new equation thatfollow from the previous one by some algebraic transformation.
-84-
TABLE OF VALUESA columnar table that encodes numeric values for covarying naturalvariables in a situation. Each column represents values for a different variable. Each rowrepresents values for different variables at the same time (i.e., each row represents a*specific* situation). Each column is headed by the name of the variable it represents.
VARIABLES:
ANCHORED VARIABLE A variable which the system has decided will now beprotected from change by the student. The student cannot type different values intothe variable box representing the variable. An anchored variable will be denoted by avariable box whose border is thicker.
INPUT VARIABLEIn an abstract situation, the variable that is intuitively thecausally independent one. The term "independent variable" is thus often usedsynonymously. For example, "unit price of widgets" is an input variable; "total numberof widgets sold" is a variable that (may) causally depend on it. Note, typically,equations of functions that relate variables express the natural output variable as afunction of the input variable. In cases were there is no causal dependency amongvariables, the input variable is simply the one that is algebraically in the inputposition. For example, in "Sara's age is 5 more than 3 times Bill's age", "Bill's age" isthe input variable. Note that it is more difficult to solve for the input variable, whenthe equation expresses the natural output variable as a function of the input variables,since substitution alone will not work.
NATURAL VARIABLEA feature of a real world situation that can take on differentvalues. We assume the values can be represented by numbers. Examples: the age ofBob, the net profit of a sale.
OUTPUT VARIABLEIn an abstract situation, the variable that is intuitively thecausally dependent one. The term "dependent variable" is thus often usedsynonymously. For example, "total number of widgets sold" is an output variable; "unitprice of widgets" is an input variable that may causally determine it. Note, typically,equations of functions that relate variables express the natural output variable as afunction of the input variable. In cases were there is no causal dependency amongvariables, the output variable is simply the one that is expressed algebraically as afunction of another. For example, in "Sara's age is 5 more than 3 times Bill's age","Sara's age" is the output variable. Note that it is easier to solve for the algebraicallyoutput variable, when the equation expresses the natural output variable as a functionof the input variables, since substitution alone will work.
TARGET VARIABLEThe variable the student must solve for in an algebraicequation, or the variable for which an equation has already been solved. (E.g., in"unit-price = gross- income/units- sold ", "unit-price" is the target variable). Note thattarget variables are distinct from output or dependent variables. Output variables arecausally dependent on input variables. A target variable is one that has been, orshould be, solved for algebraically. In general, algebra abstracts away from causalityin powerful ways; input and output variables can be targets, at differenttimes.
VARIABLE BOXSomewhat graphical representation of a variable, including its name, anda slot for a numeric value. For example:
.10
-85-
I profit
I 1000
WORD STATEMENTStatement of an abstract situation in English. Example: 'Thenumber of widgets sold is 300 less 2 times the unit cost of a widget'.
WORD STATEMENT PROBLEMSProblems where enough of the variables of a wordstatement are turned into constants that new information can be inferred. This inference isthe problem. Example: "The number of widgets sold is 300 less 2 times the unit cost of awidget' If the number of widgets sold was 150, what was the unit cost of a widget?'"
t
SCREEN
- 86-
STUDENT MATERIALS
Welcome to the
BANDAlgebra Tutor
KEYBOARD /17
LOGIN (For each student):
1. Type student ID.
Press RETURN.
2. Type first name.
Press RETURN.CHOOSE A TOPIC:
1. After you-login, choosethe topic you want.
For the first lesson,you should choose CARWASH.
2. Click the mouse on CARWASH.
4,.02
Esc
2
$
5
A 67
9S
IB
TU
CT
RL
CA
PS
LO
CK
AS
DF
_
GH
.
JK
.
L
.
IIrR eTUR0
1
SHIF
TZ
IX
IC
IV
103
The Keyboard
SHIF
LOGOUT:
1. If you haven't finished
your topic, click the
mouse on ESCAPE or press
the ESCAPE button.
2. When you see the list
of topics, click the
mouse on QUIT.
104
I
- 88 -
Draw a circle around the instructions ("Specific Problem") window. Always look here to
find out what to do.
lest suer your parents bought you en '82 Ford Mustang. To figure out hoe
such the car will cost each eontn you drive It, you satinet. hoe any silos
you drive In e eenth, your gas end oil expenses per elle, end the monthly
cost of insirsnes.
>
Friends DONATIONS
INSURANCE east
Gas 8 oil EDISES
SURPRISE at getting car
MILES driven
Nonthl ter COST
ESCAPE
Please reed the paregreph end think about the OUTPUT variable in this
situation. Then look at the list of variables and pick the OUTPUT variable
by clicking on it with the mouse.
Picking the OUTPUT Variable
BEST COP/Al/ALMS
-89-
Lest sumer your parents bought you an '62 Ford Mustang. To figure out how
ouch the car will cost each month you drive it, you estimate hoe asny miles
you drive in a month, your gee and oil expense,: per mile, end the monthly
cost of insurance.
riles expenses insurance > cost
miles /month dollers/sile dollars/month dollars
miles expenses insurance coat
Nom ouch mill your monthly COST be'
Moe you know what the variables are, so try different
INPUT numbers end awe chat monthly COST you get:
1. For each box: click, type a number and press RETURN
2. Try four different mats of numbers.
3 Oo pertAof Vorkshmet N-1.
Go ahead and try different numbers in the mord
graph.
Using the WORD GRAPH and TABLE
106
BEST COPY AVAILABLE
-90-
bl tuition
Last sumer your parents bought you en '82 Ford Mustang. 7o figure out how
Such the car will cost each sonth you drive lt, You estleoto now any olloo
you drive in a month, your gas and oil expenses per mile, end the monthly
cost of insurance.
YArl or pn
Nom does :weber of MILES you drive effect monthly COST'? These ore the
GIVEN umbers: You expect your gas & oil EXPENSES to be $0.15 a mile. Your
Insurance mill be $175.00 a meth.
To see how MILES drivon effects monthly COST:
1. Put in as GIVEN numbers.
2. Try four different numbers for MILES end watch hoe
COST Changes.
3. Oo pert A of worksheet M-1.
6rIpt,
Cost
miles exams insurance C011t
200 0 15 200 230
300 0.20 175 235
100 025 150 175
500 0 15 235 310
100 0 15 175 190
200 0.15 175 205
300 0 15 175 220
Exploring How One Variable Affects Another
BEST COPY MAILABLE
107
- 91-
MODELING REAL WORLD SITUATIONS
EXPLORING WORD SITUATIONS -- EXPLORATION ACAR WASH
NAMES:
Ml-PAGE 1
DATE: TEACHER: PERIOD:
1. What was the output variable?
2. If you increased the number of cars washed and kept everything elsethe same, what do you think should happen to the profit?
3. If you increased the. amount spent on supplies and kept everything elsethe same, what do you think should happen to the profit?
4. Copy the line of the table that you thought gave the most realisticprofit:
CARS
TABLE
FEE I SUPPLIES I DONATION I PROFIT
GENERAL NOTESIn the space below, please feel free to record:
- - Anything you noticed that was interesting or unusual- - Questions you might have- - Things to remember for exploring future situations
108
- 92 -
MODELING REAL WORLD SITUATIONS M1-PAGE 2
EXPLORING WORD SITUATIONS -- EXPLORATION BCAR WASH
1. Which input variable in the word graph could you change yourself?
2. As you decreased this variable, what happened to your profit?
3. What were the SMALLEST and LARGEST values you got for profit?
SMALLEST: LARGEST:
What input amounts gave you these profits? List your answers in this chart:
SMALLEST
LARGEST
INPUT AMOUNT PROFITI I
I I
I I
4. What was happening on the graph as you put numbers into the variablebox? (Please give your observations. There is no correct answer!)
leirgrinWrint"*****frintfrietriefrtrfriefrint GENERAL NOTESIn the space below, please feel free to record:
-- Anything you noticed that was interesting or unusual- - Questions you might have- - Things to remember for exploring future situations
- 93 -
MODELING REAL WORLD SITUATIONS
UNDERSTANDING WORD SITUATIONS
M2-PAGE 1
For each situation, answer the questions, list the variables and write atleast one question that interests you about each situation.
Example: When cooking a turkey, you need to think about the weight ofthe bird and the temperature to cook it. Turkeys usually cook at 325degrees. A six-pound turkey needs to cook for 2 hours, while an eightpound turkey needs 2 hours and 40 minutes at the same temperature. Yourfamily plans to serve a twenty pound bird at 4:00.
A. Answer the following questions about the situation:
1. At what temperature do you cook turkey?Turkey is cooked at 325 degrees.
2. What do you need to know about the turkey to know its cooking time?You need to know how much the turkey weighs and what temperature tocook it at.
B. List the variables:Turkey weight Cooking time Temperature
C. Write at least one question of interest based on the situation:1. Now long does a twenty-pound turkey take to cook?2. What time must the turkey go in the oven to be ready to eat
at 4:00 p.m.?
1. After last year's prom, the Band Parents prepared a pancakebreakfast. When calculating the cost of making all the pancakes, theythought about how many couples would come to the breakfast, how manypancakes each couple would eat, and how much the batter would costfor each pancake.
A. Answer the following questions:
1. What did the Band Parents try to calculate?
2. What factors did they have to take into account?
B. List the variables:
C. Write at least one question of interest based on the situation:
-94-
MODELING REAL WORLD SITUATIONS M2-PAGE 2
2. To feed an older puppy, you must give It around six cups of dogfood a day. Sparky is our 10 month-old black Labrador puppy. We buy herdry dog food in bags. Each bag of dog food we buy for her containstwenty-five cups of food.
A. Answer the following questions:
1. How many cups of food should we give Sparky each day?
2. How big are the bags of dog food?
B. List the variables:
C. Write at least one question of interest based on the situation:
- 95 -
MODELING REAL WORLD SITUATIONS M2-PAGE 3
WORD SITUATIONS: VARIABLES AND WORD GRAPHS
For each situation, answer the questions, list the variables and write aword graph.
Example: At the end of last summer, your parents bought you an 112Ford Mustang. To figure out how much the car will cost you each month,you estimate how many miles you drive in a month, and then how much gasand oil cost you per mile. You also add in your insurance. With yourclean driving record and good grades, this is not as much as some studentshave to pay.
A. Answer the following questions about the situation:
1. What kind of car do you have?My parents gave me an 'B2 Ford Mustang.
2. What car expenses must you take care of?My car expenses are gas and oil, and insurance.
B. The output variable is "cost of running the car". List theinput variables: .
Insurance Miles driven Cost per mile
C. Write a word graph to describe the situation:
Miles driven Cost per mile Insurance -- Cost of running car
3. Last summer you worked for the Recreation and Parks Department,cleaning the area south of Santa Monica Pier. You enjoyed the work. Thepeople you met on the job were very friendly. The work was somewhatflexible, since the department paid you by the hour, and the number ofhours you worked would change from week to week.
A. Answer the following questions about the situation:
1. For whom did you work last summer?
2. How were you paid?
3. What was your work schedule like?
B. The output variable is "weekly pay." List the input variables:
C. Write a word graph to describe this situation:=> Weekly pay
11.2
-96-
MODELING REAL WORLD SITUATIONS M2-PAGE 4
4. At last year's prom, your sister and her friends rented alimousine. To find a limousine that was not too expensive, they calledseveral different companies. They asked about the rate per hour, anddecided how many hours to rent the limo. In adding up their total cost,they also remembered they would have to add a tip for the driver.
A. Answer the following questions about the situation:
1. Why did your sister and her friends rent a limo?
2. What did they ask each limousine company?
3. Is the driver's tip included in the hourly rate?
B. What is the output variable?
List the input variables:
C. Write a word graph for the. situation:
- 97 -
MODELING REAL WORLD SITUATIONS M2-PAGE 5
USING TABLES: INCREASING AND DECREASING RELATIONSHIPS
For each situation, complete the table and answer the questions.
5. Last summer you worked for the Recreation and Parks Department.Based on the word graph you wrote, you can make a word equation to showhow much you would earn before deductions are taken out.
Number of hours * Hourly wage Pay
A. Use this word equation and your calculator to complete the table:
Hours * Hourly wage = Pay+ + + -+
1 16 1 4.251 1
+ + + +1 20 1 4.25
1 1
+ + + +1 32 1 4.25
I I
+ + + +1 45 i 4.25
1 1
+ + + -+
1 88 1 4.251 1
+ + + +1 120 1 4.25
1 1
+ + + +
B. Answer the following questions about the table:
1. What is your pay for 16 hours of work? 45 hours? 120 hours?
2. How many hours did it take to get paid $85? $136? $374?
3. Does increasing your hours increase or decrease your pay?
4. Does decreasing your hours increase or decrease your pay?
5. What input variable stayed the same in this table?
-98-
MODELING REAL WORLD SITUATIONS M2-PAGE 6
6. You didn't receive all of your pay because of deductions. Youcalculate that 85 cents per hour was deducted. So your take home wage was$3.40 per hour. The word equation which shows how much pay you took homelooks like this:
Number of hours * Take-home wage = Take-home pay
A. Use the word equation and your calculator to complete the table:
Hours * Wage = Take-home pay+ + + +
I16
I3.40
I I
+ + + +
I20
I3.40
I I
+ + + +
I32 I 3.40
I I
+ + + +
I45
I3.40
I I
+ + + +
I110
I3.40
I I
+ + + +
I 120I
3.40I I
+ + + +
B. Answer the following questions about the table:
1. What is your take-home pay for 120 hours? 32 hours? 20 hours?
2. How many hours did you work to take home $374? $153? $687
3. What effect does increasing your hours have on your take-home pay?
115
- 9 9 -
MODELING REAL WORLD SITUATIONS M2-PAGE 7
*7. Answer the following questions, based on the tables in 5 and 6:
A. How many hours did you have to work to make $374 before deductions?
How many hours did you work to take home $374?
For which did you have to work more hours, taking home $374 orgetting $374 before deductions?
B. How many hours did you have to work 'to make $68 before deductions?
How many hours did you work to take home 68?
For which did you have to work more hours, taking home $68 orgetting $68 before deductions?
What was the difference in hours you had to work?
C. To take home the same amount of money, do your hours have toincrease or decrease when deductions are taken out?
EST COPY AVA LADLE 11$
- 100 -
MODELING REAL WORLD SITUATIONS M2-PAGE 8
8. Your older sister and her boyfriend are traveling to Europe thisfall. They plan to visit England, France and West Germany. Each USdollar is worth .56 pounds, 5.90 francs and 1.75 marks. Their flightlands in Heathrow, where they exchange some traveler's checks for poundsand pay a commission of two pounds. You can write a word graph about thissituation:
Number of dollars Exchange rate Commission ===> Number of pounds
The word equation is:
(Number of dollars * Exchange rate) - Commission = Number of pounds
A. Use the word equation and your calculator to complete the table:
(Number of dollars * Exchange rate ) - Commission = Number of pounds+ + + + +1 250 I .56
I2
1 1
+ + + + +1 200
I .561
21 I
+ + + + +1 300
I.56
1 2I 1
+ + -+ +- +I 150 I .56 I 2 I I+ + + + +I 325 I .56 I 2 I I+ + + + 4-I 160 I .56 I 2 I 1+ + + + +
B. Answer the following questions based on the table:
1. How many pounds do you get if you change $250? $160? $325?
2. How many dollars would you change to get 82 pounds?
110 pounds? 166 pounds?
3. What effect does increasing the number of dollars have on the numberof pounds you get?
4. What effect does increasing the number of dollars have on thecommission you pay?
117
- 101 -
MODELING REAL WORLD SITUATIONS M2-PAGE 9
9. Their second stop is southern France, which reminds them of SantaMonica. When they go to get French francs, they must pay a commission of20 francs. The word equation for francs is:
(Number of dollars * Exchange rate) - Commission = Number of francs
A. Use the word equation and your calculator to complete the table:
(Number of dollars * Exchange rate) Commission = Number of francs+ + + + +
1 250 1 5.90 1 20 1 1
+ + + + +
1 200 1 5.90 1 20 1 1
+ + + + +
1300 1 5.90 1 20 1 1
+ + + + +
1150 1 5.90 1 20
1 1
+ + + +
1 325 1 5.90 1 201 1
+ + + +1 160 .1 5.905. 1 20 1 1
+ + + + +
B. Answer the following questions based on the table:
1. What effect does decreasing the number of dollars have on the numberof francs you get?
2. What effect does increasing the number of dollars have on thecommission you must pay?
3. What effect does increasing the number of dollars have on theexchange rate?
11
BEST CI PY AVAILABLE
- 102 -
MODELING REAL WORLD SITUATIONS
HANDOUT FOR WORKSHEET M2
5. PAY
A. Complete the table by calculating the pay.
Hours * Hourly wage = Pay+ + + +
I16 1 4.25
I I
+ + + +
I20 1 4.25
I I
+ + + +
I32 1 4.25
I I
+ + -+ +
I45 1 4.25 1 I
+ -+ + +
I 88 1 4.25I I
+ + + +
I120 4.25 I I
+- + ..+ +
PAGE 1
B. Answers:
1. 16 hours: 45 hours- 120 hours
2. $85: $136 $374:
3.
4.
5.
119
- 103 -
MODELING REAL WORLD SITUATIONS
6. TAKE-HOME PAY
A. Complete the table by calculating the take-home pay.
Hours * Wage = Take-home pay+ + -+ -I-
116 1 3.40 1 1
+ + + +
120 1 3.40 1 1
+ + + +
132 1 3.40 1 1
+ + + +45 1 3.40 1 1
+ + + +
1110 1 3.40 1 1
+ + + +
1120 1 3.40
1 1+
B. Answers:
PAGE 2
1. 120 hours: 32 hours 20 hours-
2. $374 $153: $68:
3.
120
- 104 -
MODELING REAL WORLD SITUATIONS
8. EXCHANGING DOLLARS FOR POUNDS
A. Complete the table:
PAGE 3
(Number of dollars * Exchange rate ) - Commission = Number of pounds+ + + -+ +
I 250 I .56I 2 I 1
+ + + -+ +
1200 I .56 1
2I I
+ + -+ + +
1300
1.56
12
I I
+ + -+ -+ +
1 1501
.56I
2 1 1
+ + 4- +
1325
-4--
1.56
12
I
+ + -+ + +
1 1601
.56I
2I 1
+ + + + +
B. Answers:
1. $250 $160: $325
2. 82 pounds: 110 pounds: 166 pounds:
3.
4.
12j
- 105 -
MODELING REAL WORLD SITUATIONS
9. EXCHANGING DOLLARS FOR FRANCS
A. Complete the table:
PAGE 4
(Number of dollars * Exchange rate) - Commission = Number of francs
+ -+ + -+ +
1250 1 5.90 1 20 1 1
+ + -+ + +
1200 1 5.90 1 20
1 1
+ + -+ + +
1300 1 5.90 1 20
1 1
+ + + -+ +
1150 1 5.90 1 20
1 1
+ + -+ + -+
1325 1 5.90 1 20 I 1
+ + + + +
1160 1 5.90 1 20 1 1
+- + + -+ +
B. Answers:
1.
2.
3.
"122
- 106 -
MODELING REAL WORLD SITUATIONS
GROUP EXERCISE: JIMMY Z T-SHIRT SALE
- DAY 5
Surf-And-Sun clothing store has just opened at the revitalized mall.The sales manager is planning a special sale of Jimmy Z T-shirts toattract business. To find out how much the special sale will cost thestore, the manager must take into account all these factors: the number ofJimmy Z T-shirts the store will order for the sale, how much Jimmy Z willcharge for each shirt, money for advertising, and the amount for hiring atemporary salesperson. Fortunately, the manager can also count on a"new business" rebate Jimmy Z has promised to give the store.**
In your group, discuss the variables in this situation.
1. What is the output variable?
2. What are the input variables?
A.
B.
C.
D.
E.
3. Write a word graph which describes the situation:
-==.
** A REBATE is money that a seller returns to the buyer. For example, aperson .who buys a new car often pays the full price, but then getsmoney back from the dealer or the car manufacturer (like Ford or GM).This is called a rebate.
- 107 -
MODELING REAL WORLD SITUATIONS DAY 5
4. For each input variable, answer the following questions. Write youranswers on the chart below.
-- Write the name of the variable in the first row.
- - Write the effect of the variable in the second row: Does thevariable make the output increase or decrease?
-- Write the SIZE of the effect in the third row: If you change thevariable by 1, will the output also change by 1, or will it changeby a bigger number?
-- If the variable makes a "big" change in the output, answer thisquestion: What other input variable is it multiplied with?Put your answer in row four.
- - In the last row, write the operator which should go with thevariable: , - , or *. (Hint: You should have two 's, one -, andtwo variables multiplied together.)
+ + + + + + +I I Variable I Variable I Variable 1 Variable 1 Variable 1
1 1 A 1 B 1 C 1 D 1 E 1
+ + + + + -+ +1 Name of 1
I I I I I
1 Variable 1I I I I I
I I I I I I I
+ + + + + .-+ +I Effect: 1
I I I I I
I Increase orlI I I I I
1 decrease 1I I I I I
+ + + + + + +1 Size of 1
I I 1 I I
1 Effect: 1 1I 1 1 I I
1 or "big" 1 I I I I I
+ + + + + -+ -+1 Multiplied 1
I I I I I
1 by... 1I I I I I
I I I I I i I
+ -+ + + -+ + -+1 Operator:
I I I I 1 I
I + 9 9 *. I I I I I I
I I I I I I I
+ + + 4- + -4 4-
5. Based on the chart, write the word equation which describes the situation:
* )
124
- 108 -
MODELING REAL WORLD SITUATIONS M3-PAGE 1
SOLVING PROBLEMS WITH TABLES AND GRAPHSEXPLORATION A
NAMES:
DATE TEACHER: PERIOD:
TOPIC NAME:
1. What question were you trying to answer?
2. What answer did you get? (Answer in a short sentence.)
3. In the list below, circle the way(s) you found your answer:(You can circle more than one.)
1. Guess and test2. Made a lucky guess3. Thought about the situation and estimated the amount4. Tried numbers until I got the right one5. Did some math to get the amount6. Figured out the answer in my head, with pencil & paper, or
calculator7. Looked on graph8. Looked in table
4. Suppose your partner were absent. How would you explain to yourpartner how you got your answer?
GENERAL NOTESIn the space below, please feel free to record:
-- Anything you noticed that was interesting or unusual-- Questions you might have-- Things to remember for exploring future situations
- 109 -
MODELING REAL WORLD SITUATIONS
SOLVING PROBLEMS -- EXPLORATION B
M3-PAGE 2
1. What question were you trying to answer?
2. What answer did you get? (Answer in a short sentence.)
3. For a record of this exploration, label the axes with the names of thevariables. Then sketch the diagonal line from the graph:
OUTPUT:
INPUT
4. Suppose you wanted the output variable to come out very HIGH. Usingthe graph, figure out approximately what the amount of the inputvariable should be. Put your answer in this table:
HIGH ESTIMATEDOUTPUT VARIABLE AMOUNT INPUT VARIABLE AMOUNT
I I
I I I
5. Suppose your partner were absent. How would you explain to yourpartner how you used the graph to get your answer?
126
-110 -
MODELING REAL WORLD SITUATIONS M4-PAGE 1
ANSWERING QUESTIONS USING TABLES AND GRAPHS
Read the paragraph about blood pressure and look at the table andgraph. Then go to page 2 and solve the specific problems.
Blood pressure depends upon many factors -- age, weight, health. Whenthe Kaiser Mobile Health Center arrived at Samohi, teachers and staffvolunteered to have their blood pressure taken. The Kaiser health workershad a formula for finding what a person's average blood pressure should bebased on their age.
Written as a word equation, the formula relating blood pressure and age is:
(Age of person * .44) 101 = Average blood pressure
The word equation has been used to make a table. The numbers in the tableare also shown in a graph of BLOOD PRESSURE against AGE.
TABLE
(Age * .44Blood
) + 101 = pressure
38 .44 101 118
19 .44 101 109
68 .44 101 131
50 .44 101 123
58 .44 101 127
GRAPH4IM . Ob. MAIO MOI 1135
B 130LO 125O 1
D 120
P 115R I
E 110S
S 105U
4.-
R 100E
A. 4
10 20IM dB. Mvre
30AGE
40 50 60 701
27
MODELING REAL WORLD SITUATIONS M4-PAGE 2
Write your answer to each question on the handout sheet.
Problem 1: A 38 year-old woman wants to know what the average bloodpressure for her age is.
A. Using a color pencil, put a box around the TARGET VARIABLE in theTABLEon your handout.
B. Find 38 in the AGE column of the table: What should the blood-pressureof a 38-year old woman be? (Answer with a complete sentence.)
Follow-up questions: Use the table to answer.
C. What should the blood pressure of a 58-year old be?
D. The blood pressure of a 19-year old?
Problem 2: About what blood pressure does the average 40-year old have?
A. Using a color pencil, put a box around the TARGET VARIABLE in theGRAPH on your handout.
B. Find 40 years on _the part of the graph that says "AGE." Draw a linestraight upwards from the 40 until you reach the slanted line. From thispoint, draw a line to the left until you reach the part of the graph thatsays "BLOOD PRESSURE." What number do you hit there?
C. Explain your answer in a complete sentence.
Follow-up questions: Draw lines on the graph to estimate-your answers.
D. What blood pressure should a 65-year old have?
E. A 25-year old?
F. How old are you?
According to the graph, what should your own blood pressure be?
If you have had your blood pressure measured before, what was it?
How different is it from what you estimated on the graph?
BEST COPY AMIABLE
128.
- 112 -
MODELING REAL WORLD SITUATIONS M4-PAGE 3
Problem 3: One of the teachers finds that his blood pressure is 127.If this teacher has an average blood pressure, what is his age?
A. Using a black pencil, draw a box around the TARGET VARIABLE in theTABLE on your handout.
B. Find 127 in the table under "BLOOD PRESSURE": 127 is the usualblood pressure for what age? (Explain in a complete sentence.)
Follow-up questions: Use the table to answer.
C. What is the usual age for a person with blood pressure of 131?
D. With blood pressure of 109?
E. With blood pressure of 123?
Problem 4: What is the usual age of a person with blood pressure of 115?
A. Using a black pencil, draw a box around the TARGET VARIABLE in theGRAPH on your handout.
B. Find 115 on the part of the graph that says "BLOOD PRESSURE". Drawa line to the right until you reach the slanted line. Then draw straightdown to the part of the graph thatsays "AGE." What number do you hit?
C. Explain your answer to the problem in a complete sentence.
Follow-up questions: Draw lines on the graph to estimate your answers.
D. What is the usual age of a person with blood pressure of 112?
E. With blood pressure of 135?
- 113 -
MODELING REAL WORLD SITUATIONS M4-PAGE 4
Read the paragraph about renting a limousine. Then solve problems 5 and 6.
When your sister and her friends rented a limousine for last year'sprom, they called several companies to ask about hourly rates. Theythought about how many hours to rent the limo, and remembered to add a tipfor the driver. The word equation for this situation might be:
(Hours * Hourly rate) + Tip = Total cost
Problem 5: AAA Limo has the perfect limousine at $55 per hour, with a $50tip. If your sister's friends want to keep the limo for the prom and theprom break/ t (8 pm Friday to 6 am Saturday), how much will they spend?
A. What is the target variable in problem 5? (Box it on the table and graph.)
Hours * Rate + Tip = Cost
10 55 50 600
6 55 50 380
12 55 50 710
4 55 50 270
8 55 50 490
+
-+
B. Use the table to solve theproblem: How much will it cost touse the limo from 8 pm to 6 am?
Follow-up questions:C. If they use the limo just togo to the prom (8 pm to midnight),how much will it cost?(Use table.)
900
I
800
700
600C 1
o rS 500T
- - -
1
400
300 .
D. If they go to the prom and 4 5 6 7 8 9 10 11 12 13 14after-prom .party (8 pm to 4 am), HOURSwhat will the total cost be? +-
Use the graph to answer the following questions:E. Approximately how much would it cost to rent the limo for 5 hours?
F. For 7 hours? G. For 14 hours?
aST COPY MAURY13 0.
- 114-
MODELING REAL WORLD SITUATIONS M4-PAGE 5
Problem 6: Your sister and her friends decide to keep the limo for theprom, after-prom party and breakfast, a total of 10 hours. They decidethey want to spend no more than $800. Their tip will still be $50, butthey call other companies to compare their hourly rates with AAA's rate.Which companies will cost less than $800?
A. What is the target variable in problem 6? (Box it on the table and graph.)
+ +Hours * Rate + Tip = Cost
AAA 10 55 50 600
Joe's 10 73 50 780
Crown 10 95 .50 1,000
Star 10 68 50 730
Luxury 10 120 50 1,250
Fred's 10 49 5Q 540
B. Use the table to solve theproblem: What companies arewithin their budget of $800?
Follow-up questions:
C. Use the table to answer:Which companies can they NOTafford?
Use the graph to answer:D. Your sister also called SilverMoon Limo. Silver Moon's limowould cost them $900. EstimateSilver Moon's hourly rate.
C
1,300
1,200
1,100
r
111,000
0 900
S I
T800
700
600
500
40 50 60 70 80 90 100HOURLY RATE
120 140
E. If the most they can spend is $1000 instead of $800, estimate what hourlyrate they can afford. (Use the graph to answer.)
F. What if the most they can spend is $1,100? (Use the graph to answer.)
*G. Your sister really likes the Crown limousine. What two things couldshe and her friends change in order to afford Crown's service?
- 115 -
MODELING REAL WORLD SITUATIONS
PRACTICE USING SIGNED NUMBERS
1d6
M5 -PAGE 1
TO DISCOVER THE ROMANTIC WORDS OF THE BOY VOLCANO:
Do any exercise below and find your answer at the bottom of thepage. Shade in the letter above each correct answer. .
WHEN YOU FINISH, THE BOY VOLCANO'S WORDS WILL REMAIN!
178 +.-345 =
403 -177 =
(-397)(8) =2632-7
690 + -255 =
800 -499 =
(56)(90) ff.708010
83 + 24 + -19 =
-2094 67 =
(-12)(-12)(-12) =4956-84
15 +19 + -26 +11 =
232 7508 =
(-5)(6)(-7)(8) =0
-60076 + -90 -48 =/ -3768k -6 )(
_3)
REIM R 01E1111Ern0)CV
ti COOD
CON OCO(0
OO
(0
A D D
co
111 AOCO
MCIco O
O
A
O
1111111111
CO0CD
(')
CO
1 Q 9
- 116 -
MODELING REAL WORLD SITUATIONS M5 -PAGE 2
Why did the ant run across the cracker box?Do any exercise below and find your answer in the corresponding answer column. Theletter of the exercise goes in the box that contains the number of the answer. Keepworking and you will discover the answer to the title question.
Last summer your parents bought you an '82 Ford Mustang. To figure out how
much the car will cost each month you drive it, you estimate how many miles
you drive in a month, your gas and.oil expenses per mile, and the monthly
cost of insurance.
Now choose a letter for each variable so that the equation will be shorter.
Click a box, type and press RETURN.
Click here when you want to continue. :
Symbolic Equation
BEST COPY MUM
134
- 118 -
1141-$2 eiV) UCTIO IN) 'TO .c32.)
Lest seams your parents bought you en '02 Ford Mustang. To figure out hoe
much the car sill cost mach south you drive it, you estiaste has may atlas
you drive In s month. your gin and oil expenses par silo, and the oenthly
cost of insurance.
Goals:
insurance
100.00
dollerm/aonth
> cost
500.00
dollars
insuranca
100.00
*liars/month
Cast
500.00
dollars
ID * 0.10 ) + 100.00 a 500.00
Your a monthly INSURANCE psyment is 0100.00. You are nos paying $0.10 per
ells um EXPENSES. *Meuse you worked s lot of hours this month you two s
total of $000.00 to put Into Ma COST of Me car this south.
Nos ashy atlas. an you drive this month?
1. Click the mouse on the TARGET variable.
2. Use the equation solver to soles the problem.
3. Anew the questions In Woreshest for this problem.
SisplIfy Operations:
Isolate
Nedom
Collect
Otetribute
lump :500
I0.10 a: 100 SOO I
Croat! That's a good goal for this step.
Whet do you sent to do next?Miaow Ot?
Help Next Step
Novo boo
Current Goal: reduce
Current Operation:
Current Equation:
BEST COPY AVAL ABLE
1.0
- 119 -
MODELING REAL WORLD SITUATIONS M6-PAGE 1
SOLVING PROBLEMS WITH EQUATIONS
NAMES:
DATE: TEACHER: PERIOD:
*** PLEASE DO AS MANY OF THE PROBLEMS AS YOU HAVE TIME FOR ***
1. CAR WASH, Problem 1
What was the TARGET VARIABLE?Explain your answer in a short sentence:
2. CAR WASH, Problem 2
What was the TARGET VARIABLE?Explain your answer in a short sentence:
3. HEAL THE BAY-I, Problem 1
What was the TARGET VARIABLE?Explain your answer in a short sentence:
4. HEAL THE BAY-I, Problem 2
What was the TARGET VARIABLE?Explain your answer in a short sentence:
5. HEAL THE BAY-II, Problem 1
What was the TARGET VARIABLE?Explain your answer in a short sentence:
6. HEAL THE BAY-II, Problem 2
What was the TARGET VARIABLE?Explain your answer in a short sentence:
7. FISHING TRIP, Problem 1
What was the TARGET VARIABLE?Explain your answer in a short sentence:
8. FISHING TRIP, Problem 2
What was the TARGET VARIABLE?Explain your answer in a short sentence:
i36
- 120 -
MODELING REAL WORLD SITUATIONS
SOLVING EQUATIONS: SIMPLIFY AND REDUCE
M7-PAGE 1
Read the paragraph about changing money. Then solve problems 1 and 2.
Last summer you and four friends went to Baja. All the money you spenton meals, lodging and gas was in pesos. You converted your U.S. dollarsinto pesos according to this word equation:
Number of DOLLARS * Exchange RATE = Number of PESOS
You could write a symbolic equation like this:
D * R = P
Problem 1: The exchange rate is 2,174 pesos for each U.S. dollar. Howmany pesos did you spend on meals, lodging and gas, if you changed $375?
A. What is the TARGET VARIABLE in problem 1?
B. Putting the numbers into the symbolic equation, you have:
375 * 2,174 = P
Copy the equation.
C. What is your first GOAL in solving the equation?
D. Carry out the GOAL and solve the problem.
E. How many pesos did you spend? (Answer with a complete sentence.)
Problem 2: The exchange rate was 2,174 pesos to a U.S. dollar. Youwanted to exchange enough dollars to get 543,500 pesos.
A. What is the TARGET VARIABLE in problem 2?
B. Putting the numbers into the symbolic equation, you have:
D * 2,174 = 543,500
Copy the equation.
C. What is your first GOAL in solving the equation?
1 3 7
- 121 -
MODELING REAL WORLD SITUATIONS Ml-PAGE 2
3-12. Copy the equation and write the GOAL that would be the firststep in solving the equation: either SIMPLIFY or REDUCE. You do not haveto solve. Just list the
3. 77 - 19 = S
4. P = 336 - 500
5. 62 = 2Y
6. 5.67W = 89.32
first GOAL.
1ST GOAL-
1ST GOAL.
1ST GOAL-
1ST GOAL:
7. 78 - 47 = T 1ST GOAL.
8. 480 = C * 24 1ST GOAL:
9. 199 + 34 = R 1ST GOAL.
10. W = 46 * 71 1ST GOAL:
11. 1.08 - 5.92 = S 1ST GOAL.
12. 56N = 25 + 97 1ST GOAL.
- 122 -
MODELING REAL WORLD SITUATIONS M8-PAGE 1
SOLVING EQUATIONS: PRACTICE USING SIMPLIFY AND REDUCE
1-7. SIMPLIFY each equation:
1. X= 105 - 35
2. -17 - 82 = S
3. Y = -43 + 64 - 52
4. 2.3 + 1.2 = R
2 3
5. W = - + -3 4
6. 23(12) = C
7.
102
=P51
- 123 -
MODELING REAL WORLD SITUATIONS M8-PAGE 2
8-12. For each equation, the first GOAL is to REDUCE. Give theoperation needed to carry out the GOAL. Be sure to include the number youwould use in the operation.
Example:
35X = 105
GOAL: REDUCE
OPERATION: / 35
8. 45*B = 61
GOAL: REDUCE
OPERATION:
9. -567 = 2K
GOAL: REDUCE
OPERATION.
10. 6C = 30
GOAL: REDUCE
OPERATION.
11. 25 = -6Z
GOAL: REDUCE
OPERATION.
12. 4.50 = 2.30H
GOAL: REDUCE
OPERATION:
- 124 -
MODELING REAL WORLD SITUATIONS
13-17. Solve each equation by using REDUCE and SIMPLIFY.
Example:
GOAL: REDUCE
GOAL: SIMPLIFY
5W = 25
5W 25=
5 5
W = 5
13. 21 = 3S
14:
15.
16.
17.
GOAL: REDUCE
GOAL: SIMPLIFY
GOAL: REDUCE
GOAL: SIMPLIFY
GOAL: REDUCE
GOAL: SIMPLIFY
GOAL: REDUCE
GOAL: SIMPLIFY
GOAL: REDUCE
GOAL: SIMPLIFY
13T = 40
3.4 = SC
121 = 36D
57R = 19
141
M8-PAGE 3
- 125 -
MODELING REAL WORLD SITUATIONS M8-PAGE 4
18-24. Solve the equation: For each step, give the GOAL (eitherSIMPLIFY or REDUCE), then do the math. Be sure to CHECK your answer.
18. 439Y = 612
19. 1.50 = - .25A
20. 5X = 12 + 3
21. 49 - 7 = 6W
22. 3T = 3.6
23. -25C = 45 + 13
24. .35 + .15 = .20F
142
-126 -
MODELING REAL WORLD SITUATIONS
SOLVING PROBLEMS WITH EQUATIONS
M9-PAGE 1
NAMES:
DATE: TEACHER: PERIOD:
*** PLEASE DO AS MANY OF THE PROBLEMS AS YOU HAVE TIME FOR ***
1. CAR WASH, Problem 1
What was the TARGET VARIABLE?Explain your answer in a short sentence:
2. CAR WASH, Problem 2
What was the TARGET VARIABLE?Explain your answer in a short sentence:
3. PAY CHECK, Problem 1
What was the TARGET VARIABLE?Explain your answer in a short sentence:
4. PAY CHECK, Problem 2
What was the TARGET VARIABLE?Explain your answer in a short sentence:
5. PIZZA HEAVEN, Problem 1
What was the TARGET VARIABLE?Explain your answer in a short sentence:
6. PIZZA HEAVEN, Problem 2
What was the TARGET VARIABLE?Explain your answer in a short sentence:
- 127 -
MODELING REAL WORLD SITUATIONS
7. HEAL THE BAY-I, Problem 1
What was the TARGET VARIABLE?
M9-PAGE 2
Explain your answer in a short sentence:
8. HEAL THE BAY-I, Problem 2
What was the TARGET VARIABLE?Explain your answer in a short sentence:
9. HEAL THE BAY-II, Problem 1
What was the TARGET VARIABLE?Explain your answer in a short sentence:
10. HEAL THE BAY-II, Problem 2
What was the TARGET VARIABLE?Explain your answer in a short sentence:
11. T-SHIRTS, Problem 1
What was the TARGET VARIABLE?Explain your answer in a short sentence:
12. T-SHIRTS, Problem 2
What was the TARGET VARIABLE?Explain your answer in a short sentence:
13. FISHING TRIP, Problem 1
What was the TARGET VARIABLE?Explain your answer in a short sentence:
14. FISHING TRIP, Problem 2
What was the TARGET VARIABLE?Explain your answer in a short sentence:
- 128 -
MODELING REAL WORLD SITUATIONS M10-PAGE 1
SOLVING EQUATIONS: SIMPLIFY, REDUCE AND ISOLATE
Read the paragraph about changing money. Then solve problems 1 and 2.
Our travelers to Baja arrived on a Sunday without any pesos. They hadto exchange their money at a money changer rather than at the bank. Thiscost them a hefty exchange fee. The word equation for the situation is:
Number of DOLLARS * Exchange RATE - FEE = Number of PESOS
Problem 1: If the exchange rate was 2,174 pesos to the dollar, and theexchange fee was 10,000 pesos, how many pesos could you get for ;400?
A. What symbolic equation can you make from the word equation?
B. What is the TARGET VARIABLE in problem 1?
C. Substituting 400 for number of dollars, 2,174 for exchange rate and10,000 for the fee, the equation you must solve is:
400 * 2174 - 10,000: P
Copy the equation.
D. What is your first GOAL in solving the equation?
E. Carry out the GOAL and complete the problem.
F. How many pesos could you get for ;400? (Answer with a complete sentence.)
Problem 2: The rate is 2,174 pesos to the dollar, the fee is 10,000 pesos,and you got a total of 750,900 pesos. How many dollars did you change?
A. What is the TARGET VARIABLE in problem 2?
B. Substitute 2,174 for rate, 10,000 for fee and 750,900 for number ofpesos, and write the equation you must solve.
C. What is your first GOAL in solving the equation for problem B?
145
- 129 -
MODELING REAL WORLD SITUATIONS M10-PAGE 2
3-12. Copy the equation and write the GOAL that would be the firststep in solving the equation: SIMPLIFY, REDUCE or ISOLATE. You do nothave to solve. Just list the first
3. 5 + Y = 25
GOAL.
1ST GOAL:
4. 23 = 2 + 3K 1ST GOAL:
5. C - S = 16 1ST GOAL'
6. R = 720 * 9 - 14 1ST GOAL:
7. ZX + 199 = 22 1ST GOAL:
8. 2S + 7.2 = 8.8 1ST GOAL:
9. F - 42 = 105 1ST GOAL:
10. 14,000W - 350 = 49,350 1ST GOAL:
11. 4.2L - 3.4 = 6.8 1ST GOAL:
12. 5.16P = 3.95 1ST GOAL:
- 130 -
MODELING REAL WORLD SITUATIONS
SOLVING PROBLEMS WITH EQUATIONS
NAMES:
M11-PAGE 1
DATE: TEACHER: PERIOD:
ee e PLEASE DO AS MANY OF THE PROBLEMS AS YOU HAVE TIME FOR lee*
1. CAR WASH, Problem 1
What was the TARGET VARIABLE?Explain your answer in a short sentence:
2. CAR WASH, Problem 2
What was the TARGET VARIABLE?Explain your answer in a short sentence:
3. PAY CHECK, Problem 1
What was the TARGET VARIABLE?Explain your answer in a short sentence:
4. PAY CHECK, Problem 2
What was the TARGET VARIABLE?Explain your answer in a short sentence:
5. PIZZA HEAVEN, Problem 1
What was the TARGET VARIABLE?Explain your answer in a short sentence:
6. PIZZA HEAVEN, Problem 2
What was the TARGET VARIABLE?Explain your answer in a short sentence:
- 131
MODELING REAL WORLD SITUATIONS
7. HEAL THE BAY-I, Problem 1
What was the TARGET VARIABLE?
MU-PAGE 2
Explain your answer in a short sentence:
8. HEAL THE BAY-I, Problem 2
What was the TARGET VARIABLE?Explain your answer in a short sentence:
9. HEAL THE BAY-II, Problem 1
What was the TARGET VARIABLE?Explain your answer in a short sentence:
10. HEAL THE BAY-II, Problem 2
What was the TARGET VARIABLE?Explain your answer in a short sentence:
11. T-SHIRTS, Problem 1
What was the TARGET VARIABLE?Explain your answer in a short sentence:
12. T-SHIRTS, Problem 2
What was the TARGET VARIABLE?Explain your answer in a short sentence:
13. FISHING TRIP, Problem 1
What was the TARGET VARIABLE?Explain your answer in a short sentence:
14. FISHING TRIP, Problem 2
What was the TARGET VARIABLE?Explain your answer in a short sentence:
14
- 132 -
MODELING REAL WORLD SITUATIONS M12-PAGE 1
SOLVING EQUATIONS: PRACTICE USING SIMPLIFY, REDUCE AND ISOLATE
Read the paragraph about summer work. Then solve problems 1 and 2.
Last summer when you worked for Recreation and Parks, you were paidhourly and worked a different number of hours each week. You worked inthe chilly early morning fog and in the blazing noon sun. You made goodmoney, even after deductions. This word equation describes the situation:
HOURS * Hourly RATE - DEDUCTIONS = WAGES
Problem 1: The first week, you worked 35 hours at 3.50 an hour, and had12.50 in deductions for gloves and a Recreation and Parks T-shirt. Howmuch money did you make?
A. What symbolic equation can you make from the word equation?
B. What is the TARGET VARIABLE in problem 1?
C. Substitute 35 for hours, 3.50 for the hourly rate and 12.50 fordeductions, and write the equation you must solve.
D. What is the first GOAL in solving the equation?
E. Carry out the GOAL and solve the problem.
F. How much money did you make during your first week of work?(Answer with a complete sentence.)
Problem 2: The last week you worked, you had gotten a raise and weremaking 4.25 an hour. Your deductions were only 5.25, and your total wagescame to $92.50. How many hours did you get paid for?
A. What is the TARGET VARIABLE in problem 2?
B. Substitute 4.25 for the hourly rate, 5.25 for deductions and 92.50for wages, and write the equation you must solve.
C. Whatis your first GOAL in solving the equation?
D. Carry out the GOAL and finish solving the equation.
E. How many hours did you work your last week? (Answer with a completesentence.)
BEST COPY AVAiLABLE
ds 9
-133-
MODELING REAL WORLD SITUATIONS M12-PAGE 2
3-11. For each equation, the first GOAL is to ISOLATE. Give theoperation needed to carry out the GOAL. Be sure to include the number youwould use in the operation.
Example:
S + 5 = 17 7. 19Z - 23 = -49
GOAL: ISOLATE GOAL: ISOLATE
OPERATION: - 5 OPERATION-
3. 32 = T - 2 8. 1,254D + 5,400 = 1,320
GOAL: ISOLATE GOAL: ISOLATE
OPERATION: OPERATION:
4. 14 = 2X + 4 9. 4 - W = 320
GOAL: ISOLATE GOAL: ISOLATE
OPERATION- OPERATION:
5. -Y - 13 = 3 10. 27 = -2 -P
GOAL: ISOLATE GOAL: ISOLATE
OPERATION: OPERATION-
6. 64 = 2H - 40 11. 3.54 + 6.78X = 9.99
GOAL: ISOLATE GOAL: ISOLATE
OPERATION: OPERATIONS
150
-134-
MODELING REAL WORLD SITUATIONS M12-PAGE 3
12-13. The following equations have already been solved. You need towrite the name of the TARGET VARIABLE and the GOAL used in each step ofthe solution.
Example:
TARGET VARIABLE: WAGE (tq W = 4.5(40) - 10.50
GOAL: SIMPLIFYW = 169.50
12. TARGET VARIABLE- ____ 100 = 4.75H - 18.75
GOAL:
100 + 18.75 = 4.75H - 18.75 + 18.75GOAL-
118.75 = 4.75HGOAL:
GOAL
118.75 4.75H
4.75 4.75
25=H
13. TARGET VARIABLE: 97.50 = 3.25(32) - D
GOAL:
97.50 = 104 - DGOAL:
97.50 - 104 = 104 - 104 - DGOAL:
-6.50 = -DGOAL-
GOAL:
-6.50 -D
6.50 = D
151
- 135 -
MODELING REAL WORLD SITUATIONS M12-PAGE 4
14-16. The following equations have not been solved yet, but GOALS aregiven for each step. For each equation, copy the GOAL for each step, thendo the math to carry out that GOAL. Finally, CHECK to make sure youranswer works.
14. TARGET VARIABLE: WAGE
GOAL: SIMPLIFY
GOAL: SIMPLIFY
CHECK
15. TARGET VARIABLE: HOURS
GOAL: ISOLATE
GOAL: SIMPLIFY
GOAL: REDUCE
GOAL: SIMPLIFY
CHECK
16. TARGET VARIABLE: DEDUCTION
GOAL: SIMPLIFY
GOAL: ISOLATE
GOAL: SIMPLIFY
GOAL: REDUCE
GOAL: SIMPLIFY
CHECK
W = 3.5(45) - 12.50
90.50 = 3.5H - 14.50
102 = 3.5(33) - D
- 136 -
MODELING REAL WORLD SITUATIONS M12-PAGE 5
17-20. Solve the equation: For each step, give the GOAL, then do the math.Remember to CHECK your answer.
17. W = 3.5(120) - 17.50
18. 120 = 3.5H - 34.00
19. 95 = 3.5H - 13.50
20. 120 = 3.5(45) - D
15 3
-137 -
MODELING REAL WORLD SITUATIONS M14-PAGE 1
SOLVING EQUATIONS:PRACTICE USING SIMPLIFY, REDUCE, ISOLATE AND COLLECT
1-10. For each equation, COLLECT the variables. You don't need to solvethe whole equation.
Example:
2X + 6X = 14
8X = 14
1. 18X - 13X = 150
2. 75 = 18S + 13S
3. 25H + 6H - 7H + H = 225
4. 1.4P - 3.5P + 14 - P = 18.4
5. 2 1
12 =-R + -R +R3 3
6. 5T - 6T - T + 4T = 432
7 . 42 = 3C + 5C - 2 + 3C
8. 6.7 = 8W + 9W - 3W - 12W
9. 5Y - 7Y - 3Y + 12 + 9Y = 48
10 4.25G 6.5G + .5G - 18G = 105
154
- 138 -
MODELING REAL WORLD SITUATIONS M14-PAGE 2
11-13. Solve the equation: For each step, give the GOAL, then do the math.Be sure to CHECK your answer.
Example: 18 = 2X + 6X - 14
GOAL: COLLECT18 = 8X - 14
GOAL: ISOLATE18 + 14 = 8X - 14 + 14
GOAL: SIMPLIFY32 = 8X
GOAL: REDUCE
32 8X=
8 8GOAL: SIMPLIFY
4 = X
CHECK: 18 = 2(4) + 6(4) - 1418 = 8 + 24 - 14
18 = 18
11. 3Y + 9 = 15
12. 7 + 4S = -1
13. 11 = 6L - 13
14-16. Solve the equation. You do NOT need to give the GOAL for each step.CHECK your answer.
14. -12 = 12R + 24
15. 5T - 56 + 2T = 7
16. 6W = 42
- 139 -
MODELING REAL WORLD SITUATIONS
SOLVING PROBLEMS WITH EQUATIONS
M15-PAGE 1
NAMES:
DATE: TEACHER: PERIOD:
*** PLEASE DO AS MANY OF THE PROBLEMS AS YOU HAVE TIME FOR ***
1. PAY CHECK, Problem 1
What was the TARGET VARIABLE?Explain your answer in a short sentence:
2. PAY CHECK, Problem 2
What was the TARGET VARIABLE?Explain your answer in a short sentence:
3. PAY CHECK, Problem 3
What was the TARGET VARIABLE?Explain your answer in a short sentence:
4. PIZZA HEAVEN, Problem 1
What was the TARGET VARIABLE?Explain your answer in a short sentence:
5. PIZZA HEAVEN, Problem 2
What was the TARGET VARIABLE?Explain your answer in a short sentence:
6. PIZZA HEAVEN, Problem 3
What was the TARGET VARIABLE?Explain your answer in a short sentence:
- 140 -
MODELING REAL WORLD SITUATIONS
7. T-SHIRTS, Problem 1
What was the TARGET VARIABLE?
M15-PAGE 2
Explain your answer in a short sentence:
8. T-SHIRTS, Problem 2
What was the TARGET VARIABLE?Explain your answer in a short sentence:
9. T-SHIRTS, Problem 3
What was the TARGET VARIABLE?Explain your answer in a short sentence:
1 57
- 141 -
MODELING REAL WORLD SITUATIONS M16-PAGE 1
SOLVING EQUATIONS: SIMPLIFY, REDUCE, ISOLATE AND COLLECT
Read the paragraph about renting a limousine. Than solve problems 1 and 2.
Your sister and her senior friends rented a limo for last year's prom.To find out how much they would have to spend, they asked about hourlyrates at each company, and decided how much to tip the driver and how longto keep the limo. The word equation that describes the situation is:
HOURS * Hourly RATE TIP = Total COST
Problem 1: The rate for AAA Limo's service was $55 per hour. Yoursister and her friends tipped the driver $50, and ended up spending $490all together. How many hours did they rent the limo?
A. What symbolic equation can you make from the word equation?
B. What is the TARGET VARIABLE in problem 1?
C. Substitute the numbers for hourly rate, tip and total cost, and writethe equation you must solve.
D. What is the first GOAL in solving the equation?
E. Carry out the first GOAL and then solve the rest of the equation.
F. How many hours did your sister and her friends rent the limo?(Write a sentence to explain your answer.)
Problem 2: Your sister and her friends decide to use the limo for tenhours at a rate of $55 dollars per hour and tip the driver $50. They wantto know how much they will spend.
A. What is the TARGET VARIABLE in problem 2?
B. Substitute the numbers for hours, hourly rate and tip, and write theequation you must solve.
C. What is your first GOAL in solving the equation?
D. Carry out the first GOAL and then solve the rest of the equation.
E. Write a sentence to explain your answer.
BEST COPY AVAILABLEIL 5 8
- 142 -
MODELING REAL WORLD SITUATIONS M16-PAGE 2
3-9. Copy the equation and write the GOAL that would be the firststep in solving the equation. You do not have to solve. Just listthe first GOAL: SIMPLIFY, REDUCE, ISOLATE or COLLECT.
3. X + 3 = 25 1ST GOAL:
4. 5.5P + 3P = 250.5 1ST GOAL:
5. 1.65Q - 4.55 = 75.65 1ST GOAL:
6. 456.7 = X + .65 1ST GOAL-
7. 463D = 59,230 1ST GOAL
8. 50 = 8M + 6M 1ST GOAL-
9. 3.5N = 4.5 + 6.7 1ST GOAL.
10-12. For each equation, give the operation you would need to carry outthe GOAL.
Example:
46.5S - 3 = 14.5 11. 2,105D - 1,200 = 43,000
GOAL: ISOLATE GOAL: ISOLATE
OPERATION: + 3 OPERATION:
10. 600T = 2,100 12. 840 = 900 - D
GOAL:.REDUCE GOAL: ISOLATE
OPERATION: OPERATION:
- 143 -
MODELING REAL WORLD SITUATIONS M16-PAGE 3
13-18. The following equations have already been solved. For each step,list the GOAL that is being done: SIMPLIFY, REDUCE, ISOLATE or COLLECT.
13. 47 = 9R + 2 16. 10 - H = 50GOAL: GOAL.
47 - 2 = 9R + 2 - 2 10 - H - 10 = 50 - 10
GOAL:
GOAL:
GOAL:
45 = 9R
45 9R= atwa
9 9
5 = R
GOAL.
GOAL:
GOAL:
- H = 40
- H 40=
- 1 -1
H = -40
14. 26 - 8T = -30 17. 16 + 4W = 24
GOAL. GOAL
26 - 8T - 26 = -30 - 26 16 + 4W - 16 = 24 - 16
GOAL: GOAL:-8T = -56 4W = 8
GOAL: GOAL:-8T -56 4W 8
= ommor -
-8 -8 4 4GOAL- GOAL:
T = 7 W = 2
15. 72 = 614 18. 7 + 3X = 25GOAL:
GOAL:72 611
= 7 + 3X - 7 = 25 - 76 6
GOAL GOAL:12 = 11 3X = 18
GOAL:
3X 18=
3 3GOAL.
X = 6
160
- 144 -
MODELING REAL WORLD SITUATIONS M16-PAGE 4
19-21. Copy each equation. Solve it using the suggested GOALS and CHECKyour answer.
19. 4R = 44GOAL: REDUCE
GOAL: SIMPLIFY
CHECK
20. X + 9 = -5GOAL: ISOLATE
GOAL: SIMPLIFY
CHECK
21. 52 + 21P = 10GOAL: ISOLATE
GOAL: SIMPLIFY
GOAL: REDUCE
GOAL: SIMPLIFY
CHECK
181
- 145 -
MODELING REAL WORLD SITUATIONS M17-PAGE 1
SOLVING EQUATIONS:PRACTICE USING SIMPLIFY, REDUCE, ISOLATE AND COLLECT
1-4. For each equation, give the operation needed to carry out the GOAL.
1. 42W = 636
GOAL: REDUCE
OPERATION.
2. 55H + 50 = 625
GOAL: ISOLATE
OPERATION-
3. 350 = 36U
GOAL: REDUCE
OPERATION
4. 49 = 131D - 46
GOAL: ISOLATE
OPERATION:
1 62
-146-
MODELING REAL WORLD SITUATIONS M17-PAGE 2
5-8. The following equations have already been solved. For each steplist the GOAL that is being done: SIMPLIFY, REDUCE, ISOLATE orCOLLECT.
5. 4Y - 6 = 22 7.
GOAL.8 = -15A + 11A
GOAL: 8 = -4AGOAL:
4Y - 6 + 6 = 22 + 6 8 -4A=
GOAL -4 -4
4Y = 28 GOAL:
GOAL: -2 = A
4Y 28
4 4GOAL:
Y = 7
6. -75 = -25 - 5D 8. -9N + 5 + 2N = 12
GOAL: GOAL:
-75 + 25 = -25 - 5D + 25 -7N + 5 = 12
GOAL: GOAL:
-50 = -5D -7N + 5 - 5 = 12 - 5GOAL
-50 -5D GOAL:= -7N =
-5 -5 GOAL:GOAL -7N 7
10 = D =-7 -7
GOAL-
N = -1
163
-147-
MODELING REAL WORLD SITUATIONS M17-PAGE 3
9-11. Copy each equation. Then solve using the suggested GOALSand CHECK your answer.
9. -8 = 2Y - 3YGOAL: COLLECT
GOAL: REDUCE
GOAL: SIMPLIFY
CHECK
10. 9W - 27 + 4W = 12
GOAL: COLLECT
GOAL: ISOLATE
GOAL: SIMPLIFY
GOAL: REDUCE
GOAL: SIMPLIFY
CHECK
11.
GOAL: COLLECT
GOAL: ISOLATE
GOAL: SIMPLIFY
CHECK
4 = 3K - 3 - 2K
12-14. Solve the equation: For each step, give the GOAL, then do the math.Be sure to CHECK your answer.
12. 20 + 2M = 64
13. 150 = -9X - 6X
14. 8 = 5G 2G - 27
-148-
MODELING REAL WORLD SITUATIONS M18-PAGE 1
SOLVING PROBLEMS WITH EQUATIONS
NAMES:
DATE: TEACHER: PERIOD:
*** PLEASE DO AS MANY OF THE PROBLEMS AS YOU HAVE TIME FOR ***
1. PAY CHECK, Problem 1
What was the TARGET VARIABLE?Explain your answer in a short sentence:
2. PAY CHECK, Problem 2
What was the TARGET VARIABLE?Explain your answer in a short sentence:
3. HEAL THE BAY-II, Problem 1
What was the TARGET VARIABLE?Explain your answer in a short sentence:
4. HEAL THE BAY-II, Problem 2
What was the TARGET VARIABLE?Explain your answer in a short sentence:
5. HEAL THE BAY-II, Problem 3
What was the TARGET VARIABLE?Explain your answer in a short sentence:
6. FISHING TRIP, Problem 1
What was the TARGET VARIABLE?Explain your answer in a short sentence:
7. FISHING TRIP, Problem 2
What was the TARGET VARIABLE?Explain your answer in a short sentence:
8. FISHING TRIP, Problem 3
What was the TARGET VARIABLE?Explain your answer in a short sentence:
165
-149 -
MODELING REAL WORLD SITUATIONS M19-PAGE 1
SOLVING EQUATIONS:SIMPLIFY, REDUCE, ISOLATE, COLLECT AND DISTRIBUTE
Read the paragraph on phone calls. Then solve problems 1 and 2.
On some long distance phone calls, you pay a certain amount of moneyfor the first few minutes you talk. This amount of money is called a"flat fee", and the first few minutes are called your "minimum time".After the first few minutes, you are charged a cheaper amount for eachminute you talk. The word equation for this situation is:
Problem 1: The phone company in your area charges a flat fee of 90cents for the first 2 minutes on this type of call. After the 2-minuteminimum time, you must pay 40 cents per minute. What will an 11-minutecall cost you?
A. What is the TARGET VARIABLE in problem 1?
B. Substitute the numbers for fee, rate, minutes and minimum time, andwrite the equation you must solve.
C. What is the first GOAL in solving the equation?
D. Carry out the GOAL and solve the equation.
E. Write a sentence that explains your answer.
Problem 2: The phone company charges your big brother a whopping $48.10for calling his girlfriend in Alaska. The flat fee is 90 cents, theminute rate is 40 cents per minute, and the minimum time is 2 minutes.How long did your brother talk?
A. What is the TARGET VARIABLE in problem 2?
B. Substitute the numbers for fee, rate, minimum time and cost, and writethe equation you must solve. Write cost, fee and rate in cents.
C. What is your first GOAL in solving the equation?
BEST COPY AVALABLE
166
- 150 -
MODELING REAL WORLD SITUATIONS M19-PAGE 2
3-12. Copy the equation and write the GOAL that would be the firststep in solving the equation. You do not have to solve. Just listthe first GOAL: SIMPLIFY, REDUCE, ISOLATE, COLLECT or DISTRIBUTE.
3. 45 = 3C + 42 + 12C 1ST GOAL:
4. 6X - 4 = 12 1ST GOAL:
5. 5(X + 4) = 40 1ST GOAL:
6. 72.20 = 3.60H - 4.00 1ST GOAL:
7. 720 - T = 680 1ST GOAL:
8. 3W + 8 - 5W = 12 1ST GOAL:
9. 7 - 3(5T - 10) = 67 1ST GOAL:
10. P + .75P = 3650 1ST GOAL:
11. 4(2N + 5) = 36 1ST GOAL:
12. 32 = 15 - 2(H-3) 1ST GOAL-
- 151 -
MODELING REAL WORLD SITUATIONS M19-PAGE 3
13-17. Solve each equation by using the suggested GOAL for each step.Be sure to CHECK your answers.
13. 28Z - 9Z = 57 15. 12K - 7K + 15 = 23
GOAL: COLLECT GOAL: COLLECT
GOAL: REDUCE GOAL: ISOLATE
GOAL: SIMPLIFY GOAL: SIMPLIFY
CHECK GOAL: REDUCE
GOAL: SIMPLIFY
CHECK
14. 17 = 12R + 5 16. 4G - 7.5 = 13.5 ,
GOAL: ISOLATE GOAL: ISOLATE
GOAL: SIMPLIFY GOAL: SIMPLIFY
GOAL: REDUCE GOAL: REDUCE
GOAL: SIMPLIFY GOAL: SIMPLIFY
GOAL: CHECK CHECK
17. 33 = 8.21X + 2.79X
GOAL: COLLECT
GOAL: REDUCE
GOAL: SIMPLIFY
CHECK
J s.
168
- 152 -
MODELING REAL WORLD SITUATIONS M19-PAGE 4
18-21. Solve the equation: For each step, give the GOAL, then do themath. Be sure to CHECK your answer.
18. 47 = 2D + 5
19. Y - 5 + 7Y = 43
20. -8H + 1 - 2H = 81
21. 9K - 16 = 20
22-25. Solve the equation. You do NOT need to give the GOAL for eachstep. CHECK your answer.
22. 6X + 3 = 25
23. 3.3 = 8.3H - 7.65
24. 1,234 = .22R - 455.6
25. 3+ 12N - 10N + 6 = 25
-153-
MODELING REAL WORLD SITUATIONS M20-PAGE 1
SOLVING PROBLEMS WITH EQUATIONS
NAMES:
DATE: TEACHER: PERIOD:
*** PLEASE DO AS MANY OF THE PROBLEMS AS YOU HAVE TIME FOR ***
1. PAY CHECK, Problem 1
What was the TARGET VARIABLE?Explain your answer in a short sentence:
2. PAY CHECK, Problem 2
What was the TARGET VARIABLE?Explain your answer in a short sentence:
3. HEAL THE BAY-II, Problem 1
What was the TARGET VARIABLE?Explain your answer in a short sentence:
4. HEAL THE BAY-II, Problem 2
What was the TARGET VARIABLE?Explain your answer in a short sentence:
5. T-SHIRTS, Problem 1
What was the TARGET VARIABLE?Explain your answer in a short sentence:
6. T-SHIRTS, Problem 2
What was the TARGET VARIABLE?Explain your answer in a short sentence:
7. FISHING TRIP, Problem 1
What was the TARGET VARIABLE?Explain your answer in a short sentence:
8. FISHING TRIP, Problem 2
What was the TARGET VARIABLE?Explain your answer in a short sentence:
- 154 -
MODELING REAL WORLD SITUATIONS
SOLVING EQUATIONS:PRACTICE USING SIMPLIFY, REDUCE, ISOLATE, COLLECT AND DISTRIBUTE
M21-PAGE 1
Read the paragraph about buying a new car. Then solve problems 1 and 2.
Your mother likes new cars. Each year she trades in her old car for nextyear's model. Naturally, the money she can get for her old car is much lessthan the amount she paid for it the year before. The money she loses is dueto "depreciation"; every year, the worth of her car is decreased by the"depreciation rate." The word equation for this situation is:
NEW price - (NEW price * DEPRECIATION rate) = TRADE-in value
(Notice that NEW PRICE shows up in two different places in the equation.)
As a symbolic equation, you could write: N - (N*D) = T
Problem 1: Your mother now has a 1988 Honda Accord which she wants totrade in for next year's model. If she originally paid $12,540 to buy itnew, and the depreciation rate is .40 (40%), how much money will she.geton the trade-in?
A. What is the TARGET VARIABLE in problem 1?
B. Substitute the numbers for new price and depreciation rate, and writethe equation you must solve. Write depreciation rate as a decimal.
C. Solve the equation.
D. Write a sentence explaining your answer.
Problem 2: In 1982, your mother traded in her '81 Civic and boughtan '82 Accord. If the depreciation rate was .40, and she got $2,400 for thetrade-in, how much did she pay for the Civic when she bought it new in1981?
A. What is the TARGET VARIABLE in problem 2?
B. Substitute the numbers for depreciation rate and trade-in value, andwrite the equation you must solve. Write depreciation rate as a decimal.
C. What is your first GOAL in solving the equation?
D. Carry out the first GOAL and finishing solving the problem.
E.Write a sentence explaining your answer.
- 155 -
MODELING REAL WORLD SITUATIONS M21-PAGE 2
3-12. For each equation, DISTRIBUTE in order to remove the parentheses.You don't need to solve the whole equation.
Example: 16 + 5(X-3) = 493
16 + SX - 5(3) = 493
16 + 5X - 15 =493
3. 18 = -6(4W + 1)
4. 2(3Y - 7) = 56
5. -10 = -9(6 + U) - 2U
6. -63 = 13H + 7(3H - 1)
7. 32 = 15 - (4M - 5)
8. -5P - 5(6 - 2P) = 0
9. -2(4 - K) + 9 = -13
10. 6(R-2) + 4(R-2) = -36
11. 5(4 + 2M) - 8(M + 12) = 68
12. 2(5-3X) + 9 = 28
1 74
- 156-
MODELING REAL WORLD SITUATIONS M21-PAGE 3
13-16. Solve the equation: For each step, give the GOAL, thendo the math. Be sure to CHECK your answer.
13. 3(W + 4) = 18
14. 630 = 4001 - 3) + 230
15. -3(2 + A) + 18 = -30
16. 15(F + 1) - 3F = 759
17-21. Solve the equation: You do NOT need to list the GOALS.sure to CHECK your answer.
17.
18.
19.
20.
21.
2 = 4(D + 1) - 10
3(2D + 5) - 3 = 42
20T - 49T + 3 = 975
40 = 2(4R - 6) + 5R
4(X - 3.5) + X - .2 = 9.3
173
- 157 -
Appendix B
EVALUATION MEASURES: ARITHMETIC TEXT, PRE / POST TEST, STUDENTCOURSE EVALUATION, AND UNIT EVALUATIONS
174.
- 158 -
ARITHMETIC TEST
ARITHMETIC SKILLS CHECK-UP STUDENT ID:
DATE: TEACHER:
NO NAMES PLEASE! PERIOD:
Addition
1. 35.083.210.0234
+ 9.0
Subtraction
2. 3 3
- + -8 5
3. 3621 4. 3- 1468 9 - 5 -
4
Multiplication
Division
5. 462.5 6.
x 7.2
7. .08 0.648 8.
Reduce the fractions:
1 7
3 8
2 3_ -
5 5
9. 14 10. 225
35 15
1 t)
-159-
PRE/POSTTEST
RAND ALGEBRA TUTOR PROJECT
CONGRATULATIONS! Your class has been selected to participate in aspecial project. A research team from The RAND Corporation wants you towork with them in developing computer programs for students learning math.
We'd like you to complete this survey today. The survey asks aboutyour background and your opinions concerning math and computers. Some ofthe questions also ask about algebra. (Algebra involves using equations tosolve math problems.) These questions will give us an idea of how muchmath you know already.
YOUR TEACHER WILL NOT SEE ANY OF YOUR ANSWERS IN THISSURVEY, AND YOUR ANSWERS WILL NOT AFFECT YOUR COURSE GRADE.
THANK YOU FOR YOUR HELP!
EST COPY MIME
176
DATE:
STUDENT I.D.:
TIME STARTED:
-160-
PART 1: BACKGROUND QUESTIONS
DIRECTIONS: Please fill in the parentheses next to each question with thenumber that matches your answer. Please select only ONEanswer to each question.
4. What grade do you think you'll get in this course? ( )
(1) A(2) B
(3) C(4) D(5) F
DIRECTIONS: We would like to know about your experience with computers.Please circle 1 for "NO" or 2 for "YES" on the followingquestions.
Have you ever
5. taken a course about computers orcomputer programming?
6. used computers outside of school,other than for playing video games?
7. used computers in other classes(for example, in English or math class)?
8. used a computer to do your homework?
9. written a computer program?
NO YES
1 2
1 2
1 2
1 2
1 2
-161-
PART OPINION QUESTIONS
DIRECTIONS: We want to know what you think about math and computers.Please fill in the parentheses next to each question with thenumber that matches your answer. There are no right answers,so please tell us what you really think.
10. How do you feel about algebra? ( )
(1) I dislike it(2) I mildly dislike it(3) I mildly like it(4) I like it
11. How difficult is algebra for you? ( )
(1) easy(2) medium(3) hard(4) I have not studied algebra before.
DIRECTIONS: For these questions, circle the number under the answer thatbest describes what you think or feel. Circle 1 if you"strongly disagree" with the statement, 2 if you disagree, etc.
StronglyDisagree Disagree Agree
StronglyAgree
12. I am good at mathematics. 1 2 3 4
13. Many algebra courses could beimproved by the use of computers.
1 2 3 4
14. In math, to know if you have the rightanswer, you must check with the teacher,a computer, or the book.
1 -2 3 4
15. I can get along well in everydaylife without using mathematics.
1 2 3 4
178
- 162 -
DIRECTIONS: Circle the number under the answer that best describes whatyou think or feel. Circle 1 if you "strongly disagree" withthe statement, 2 if you disagree, etc.
16. A problem is easy to figure outeven if I've forgotten exactlyhow to do it.
17. In mathematics you.can becreative and discover thingsfor yourself.
18. There is one right way to solve mostalgebra problems.
19. Using computers to teach algebrais a bad idea.
20. Trial and error can often be used tosolve an algebra problem.
21. It's important to learn algebrabecause algebra knowledge isuseful in everyday life.
22. Learning mathematics is mostlymemorizing.
23. Mathematics is made up of unrelatedtopics.
StronglyDisagree Disagree Agree
StronglyAgree
1 2 3 4
1 2 3 4
1 2 3 4
1 2 3 4
1 2 3
1 2 3 4
1 2 3 4
1 2 3 4
- 163 -
PART 3: MATH QUESTIONS
DIRECTIONS: The purpose of these questions is to find out how much math
you already know. Some of the problems are very difficult,so if you can't solve a problem don't be discouraged, justgo on to the next question. Use a calculator if you need one,but please show all your work.
1. Your sister is driving to San Diego with her friends. They know that
the distance they can drive on one tank of gas depends on the number ofgallons in their gas tank and how many miles their car can get per gallon:
Gallons in tank * Miles per gallon Distance
If they take your sister's car, which has a nine-gallon tank and gets 27miles to the gallon, how far can they drive before they run out of gas?
Solve the equations:
2. 4H + 1 5 3. 39W + 21W 240
I -
7.
1.80
-164-
DIRECTIONS: For problems 4 and 5, you don't need to do the work. Justdecide what the first step in solving the equation should be.Circle the letter that gives the best answer.
4. To solve this equation, what should your first step be?
Equation: 4X + 1 2
First step (circle one):
A. remove the number added to the 4X (isolate)
B. do the arithmetic or reduce fractions (simplify)
C. remove the number multiplied by the X (reduce)
D. remove the parentheses (distribute)
E. collect the X's (collect)
5. To solve this equation, what should your first step be?
Equation: 3(H - 2) 10
First step (circle one):
A. remove the number subtracted from the H (isolate)
B. do the arithmetic or reduce fractions (simplify)
C. remove the number multiplied by the H (reduce)
D. remove the parentheses (distribute)
E. collect the H's (collect)
181
-165-
6. Some Santa Monica High School students are putting on a benefitconcert for hunger relief in Ethiopia. They want to raise as much moneyas they can, so they look carefully at all the things their benefit moneydepends on: the number of people who will come to the concert, the pricefor each ticket, and the cost of renting a hall. (They don't worry aboutthe cost of the band, because the band will give its time free.)
A. In this situation, which things (variables) are the students thinkingabout as they organize the concert?
B. Please write an equation based on this situation, which will show howmuch money the group can raise.
Solve the equations:
7. 3(Y - 2) 12 8. 5.2T - 10.3 10.5
18 c'
-166-
9. Another group of Samohi students want to put out a new school sportsmagazine. They know that the money they can take in for each issue of themagazine is given by this equation:
(Magazines sold * Price of magazine) + Advertising Money earned
For the first issue, the students get $67.50 in advertising from sportequipment and clothing stores at Santa Monica Place. If they set theprice of the magazine at $1.25, and they want to take in $250 altogether,how many magazines must they sell? Use the equation (and a calculator, ifyou need one) to get your answer.
Solve the equations:
10. 1.3X + 3.2X 9.0 11. .5(P - 2) 6.05
TIME !INURED: THANK YOU WRY MUCH!
183
-167-
STUDENTCOURSEEVALUATION
QUESTIONNAIRE ON "MODELLING REAL WORLD SITUATIONS" UNIT
DIRECTIONS: Your answers to these questions will help improve the unitfor students in next year's Math A class. Fill in the parentheses nextto each question with the number that matches your answer. Please pickonly ONE answer to each question.
1. How did you enjoy the unit on modeling real world situations? ( )
(1) a great deal(2) a good bit(3) a little(4) not at all
2. When math problems were part of situations like "Car Wash" or "BSU-Mecha dance", how interesting did you find them?
(1) not at all interesting(2) somewhat interesting(3) interesting(4) very interesting
3. How realistic did you think the situations were?
(1) very realistic(2) realistic(3) somewhat realistic(4) not at all realistic
4. How did you enjoy using the computers?
(1) a great deal(2) a good bit(3) a little(4) not at all
5. How helpful were the computer's hints when you clicked the mouse on"Help Next Step"?
(1) Very helpful(2) Helpful(3) Somewhat helpful(4) No help(5) Didn't use "Help Next Step"
6. If you could use a computer again for learning things, would you wantto use one?
(1) no(2) uncertain(3) yes
4BEST COPY MAILABLE
-168-
7. How easy was it to learn to use the computers?
(1) very difficult(2) somewhat difficult(3) fairly easy(4) very easy
8. What helped you learn to use the computer? (Circle all that helped you.)
(1) instructions in class(2) computer introduction worksheet(3) help from my partner(4) help from the teacher(5) help from the RAND researcher(6) trying it out by myself(7) other:
9. What did you think were the worst features of the unit on modelingreal world situations? (For example, things you thought were confusingor uninteresting.)
10. What did you think were the best features of the unit?
11. You've spent a lot of time working on situations like the car wash,changing money, going to concerts and so on. Please suggest someideas for realistic situations that could be given to next year'sstudents.
185
-169-
DIRECTIONS: For these questions, circle the number under the answer thatbest describes what you thigk. Circle 1 for "No help," 2 for "Somewhathelpful," and so on.
12. How helpful were each of the following in doing the work for this unit?
No HelpSomewhatHelpful Helpful
VeryHelpful
Working with a partner 1 2 3 4
Computer assignments 1 2 3 4
Seatwork assignments 1 2 3 4
13. How helpful were each of the following in learning to understand asituation mathematically?
No HelpSomewhatHelpful Helpful
VeryHelpful
Making a word graph 1 2 3 4
Making a table 1 2 3 4
Using a graph 1 2 3 4
Writing a word equation 1 2 3 4
Writing a symbolicequation
1 2 3 4
14. How helpful were each of the following in learning to solve anequation?
No HelpSomewhatHelpful Helpful
VeryHelpful
Picking a target variable 1 2 3 4
Naming the goal 1 2 3 4
Naming the operation 1 . 2 3 4
Doing the math 1 2 3 4
186
- 170 -
UNIT EVALUATIONS
MODELING REAL WORLD SITUATIONS EVALUATION 1 - PAGE 1
Name Period
1. Read the situation. Then choose the variables from the menu andfill in the word graph.
Lakers owner Jerry Buss is making plans for this year's basketball season,
and trying to decide what his profit might be. He knows he has to think
about attendance at the games, the price of tickets, the salaries to the
players, and all his other overhead expenses -- renting the forum, coaches,
doctor, and training gym rent.
. . ......
Word Graph v
Number of AWAY GAMES
Players' SALARIES
OVERHEAD Expenses
PROFIT
TICKET PRICE
Crowd ENTHUSIASM
Game ATTENDANCE
EST COPY AVAiLARI,F.
1 87
- 171 -
MODELING REAL WORLD SITUATIONS
Read the Situation:
EVALUATION 1 - PAGE 2
Your family is having a garage sale. You have a lot of junk tosell, but you also have to pay for markers and cardboard to makesigns. You're lucky because a neighbor has donated a couch tothe sale and doesn't want any money for it. Everybody else whohelps will get some of the profit.
Word graph:
Junk sold. Supplies Couch donation ===> Profit
2. Look at the table:
JUNK SOLD SUPPLIES + COUCH DONATION = PROFIT
$500 $10 $40 $530
500 10 60 550
500 10 75 560
In this table, only COUCH DONATION changes. What effect doesincreasing the couch donation have on profit? (Circle one.)
Profit increases
3. Look at the table:
Profit decreases No effect
JUNK SOLD - SUPPLIES + COUCH DONATION = PROFIT
500 5 60 555
500 10 60 545
500 15 60 540
In this table, the amount spent on SUPPLIES changes. What effectdoes increasing the supplies have on profit? (Circle one.)
Profit increases Profit decreases No effect
188
- 172 -
MODELING REAL WORLD SITUATIONS EVALUATION I - PAGE 3
4. Look at the table. How much junk would you have to sell tomake a profit of $550.00?
Answer:
Junk sold - Supplies + Couch price = Profit
$300 $15 + $65 = $350
400 15 + 65 = 450
500 15 + 65 = 550
600 - 15 + 65 = 650
5. Use the graph to estimate: How much junk do you need tosell to make a profit of $300.00?
Answer:
PROFIT($)
6.00
Sou
goo
3oo
2.00
100
T 1
i
I
1.
I
I
I,
i .
i 1a,
t
1i
r
; I
I,
1it 40 t30 20o 500 4,1 00 500
1E9
600 100 So-rot4K(4)
- 173 -
MODELING REAL WORLD SITUATIONS EVALUATION 1 - PAGE 4
6. If supplies cost $15, the couch donation is $65, and you wantedto make a profit of $400.00, how much junk would you have to sell?Try different amounts in the table below until your profit is $400.You can use a calculator to figure out the profit.
Answer:
Profit shouldcome out to $400
Junk sold - Supplies + Couch price = Profit
Example: 100 - 15 + 65
15 + 65
15 + 65
15 + 65
15 + 65
15 + 65
- 15 + 65
150
..A.,
190
- 174 -
MODELING REAL WORLD SITUATIONS
DATE :
STuDeJT ID :EVALUATION 2 - PAGE 1
Name Period
1-A. Read the situation. Then fill in the OPERATORS to make a wordequation.
Lakers owner Jerry Buss is making plans for this year's basketball season,
and trying to decide what his profit might be. He knows he has to think
about attendance at the games, the price of tickets, the salaries to the
players; and all his other overhead expenses -- renting the forum, coaches,
doctor, and training gym rent.
attendance tick-price salaries overhead profit>how many dollars dollars dollars dollars
attendance tick-price salaries overhead profit
how many dollars dollars dollars dollars
.-3-
1-B. Make a symbolic equation for the situation with LETTERS andOPERATORS.
BEST COPY PARABLE
- 175 -
MODELING REAL WORLD SITUATIONS
2. Read the problem.
EVALUATION 2 - PAGE 2
BSU and Mecha are planning a Valentine's Day dance. They wanteveryone to have a lot of fun, and they also want to raise money fora new popcorn machine for the school. The number of people comingis 200, the ticket price is 3 dollars, and the D.J. costs 75dollars. What profit will the club make?
Word equation:
(Number of people * Ticket price) - D.J. cost = Profit
Symbolic equation (with given numbers):
(200 * 3) - 75 = P
A. What is the target variable?
B. What is your goal for the first step?
G. Solve the problem.
D. Describe the answer you get in a short sentence.
A.
192
- 176 -
MODELING REAL WORLD SITUATIONS
3. Read the problem.
EVALUATION 2 - PAGE 3
You're going out for ice cream with a group of friends. 6people want cones and the bill is 9 dollars. What was thecost of a cone?
Word equation:
(Number of people * Cone cost) = Total bill
Symbolic equation (with given numbers):
(6 * c) =9
A. What is your goal for the first step?
1.9
B. What operation do you need to do?(Be sure to include the NUMBER you would use in the operation.)
C. Solve the probleM and check your answer.
D. Describe the answer you get in a short sentence.
43
- 177 -
MODELING REAL WORLD SITUATIONS
4. Read the problem.
EVALUATION 2 - PAGE 4
On this trip to the ice cream store, 11 people want ice cream,you have a discount coupon for 3 dollars, and the bill is $19.How much did a cone cost at this store?
Word equation:
(Number of people * Cone cost) - Discount = Total bill
Symbolic equation (with given numbers):
11c - 3 = 19
A. What is your goal for the first step?
B. What operation do you need to do?(Be sure to include the NUMBER you would use in the operation.)
C. Solve the problem and check your answer.
D. Describe the answer you get in a short sentence.
194
-178 -
MODELING REAL WORLD SITUATIONS
5. Read the problem.
EVALUATION 2 - PAGE 5
You're buying food for a pre-dance party. Drinks are 2dollars a person, and sandwiches are 4 dollars a person. If thetotal cost of the party must be no more than 90 dollars, howmany people can you feed at the party?
D. Describe the answer you get in a short sentence.
- 179 -
MODELING REAL WORLD SITUATIONS
6. Read the problem.
EVALUATION 2 - PAGE 6
Your family has won $2,500 to take a dream vacation to Hawaii. Thereare 4 people in the family, and airplane tickets cost 365 dollars foreach person. How much can be spent on each person for other expenseslike hotel and food?
Word equation:
People in family * (Ticket cost + Expenses) = Total trip cost
Symbolic equation (with given numbers):
4 (365 + e) = 2500
A. What is your goal for the first step?
B. Solve the problem and check your answer.
C. Describe the answer you get in a short sentence.
196
- 180 -
MODELING REAL WORLD SITUATIONS EVALUATION 2 - PAGE 7
Solve the equation and check your answer. You do NOT need to give goalsfor each step.
7. 3Y + 9 = 21 8. 36 - 11T = -8
9. 124 = -9X + 40X 10. 5(P - 2) 4. 45 = 60
197
- 181 -
BIBLIOGRAPHY
Brown, J. S., A. Collins, and P. Duguid (1988). Cognitive Apprenticeship, Situated Cognition,and Social Interaction, Institute for Research on Learning, IRL888-0008, Bolt Beranekand Newman, Cambridge, Massachusetts.
California State Department of Education (1985). California Mathematics Framework,Sacramento, California.
Campbell, D. T., and J. C. Stanley (1966). Experimental and Quasi-Experimental Designs forResearch, Rand McNally, Chicago, Illinois
Carnegie Forum on Education and the Economy, Task Force on Teaching as a Profession(1986). A Nation Prepared, New York.
Carpenter, T. P., M. K. Corbitt, H. S. Kepner, M. M. Lindquist, and R. E. Reys (1980)."Students' Affective Responses to Mathematics: Secondary School Results fromNational Assessment," Mathematics Teacher, October, pp. 531-539.
Cook, T. D., and D. T. Campbell (1979). Quasi-Experimentation: Design and Analysis Issuesfor Field Settings, Rand McNally Publishing, Chicago, Illinois.
Clement, J. (1982). "Algebra Word Problem Solutions: Thought Processes Underlying aCommon Misconception," Journal of Research in Mathematics Education, Vol. 13, pp.16-30.
Collins, A., J. S. Brown, and S. E. Newman (1989). "Cognitive Apprenticeship: Teaching theCraft of Reading, Writing, and Mathematics," in L. B. Resnick (ed.), Cognition andInstruction: Issues and Agendas, Lawrence Erlbaum Associates, Hillsdale, NewJersey.
Dossey, J. A., I. Mullis, M. M. Lindquist, and D. L. Chambers (1988). The MathematicsReport Card, Are We Measuring Up? Trends and Achievement Based on the 1986National Assessment, Educational Testing Service, Report N. 17-M-01, Princeton, NewJersey.
Fey, J. T., et al. (eds.) (1984). Computing and Mathematics: The Impact on SecondarySchool Curricula, Report of the National Council of Teachers of MathematicsConference, National Council of Teachers of Mathematics, Inc., Reston, Virginia.
Fey, J. T. (1986). Algebra with Computers, University of Maryland, College Park, Maryland.
Flagg, B. N. (1990). Formative Evaluation for Educational Technologies, Lawrence ErlbaumAssociates, Hillsdale, New Jersey.
Kaput, J. J. (1989). "Linking Representations in the Symbol of Algebra," in S. Wagner andC. Kieran (eds.), Research Issues in the Learning and Teaching of Algebra, LawrenceErlbaum Associates, Hillsdale, New Jersey.
1. 9 8
- 182 -
Leinhardt, G. (1989). "Graphing and Functions: Cases of Learning to Teach, and Teaching,"paper presented at the annual meeting of the American Educational ResearchAssociation, San Francisco, California.
McArthur, D. (1987). "Developing Computer Tools to Support Learning and PerformingComplex Cognitive Tasks," in D. Berger and C. Pedzek (eds.), Applications of CognitivePsychology: Computing and Education, Lawrence Erlbaum Associates, New Jersey.(Also published as RAND, N-2980-NSF.)
McArthur, D., C. Stasz, and J. Hotta (1987). Learning Problem-Solving Skills in Algebra.RAND, N-2595-NSF.
McArthur, D., C. Stasz, J. Hotta, 0. Peter, and C. Burdorf (1988). "Skill-Oriented TaskSequencing in an Intelligent Tutor for Basic Algebra," Instructional Science, Vol. 17,pp. 281-307. (Also published as RAND, N-2966-NSF.)
McArthur, D., and C. Stasz (1990). An Intelligent Tutor for Basic Algebra, RAND, R -3811-NSF.
National Commission on Excellence in Education (1983). A Nation at Risk, Washington,D.C., U.S. Government Printing Office.
Newman, D. (1989). "Formative Experiments on Technologies That Change theOrganization of Instruction," paper presented at the annual meeting of the AmericanEducational Research Association, Chicago, Illinois.
Office of Technology Assessment (1988). Power On! New Tools for Teaching and Learning,Washington, D.C., U.S. Government Printing Office.
Resnick L (1987). Education and Learning to Think, National Academy Press, Washington,D.C.
Robyn, A., C. Stasz, T. Ormseth, and D. McArthur (1989). "Implementing Computer-Assisted Instruction in First-Year Algebra Classes," paper presented at the annualmeeting of the American Educational Research Association, San Francisco, California.
Romberg, T. (1987). Curriculum and Evaluation Standards for School Mathematics,Working Draft, National Council of Teachers of Mathematics, Reston, Virginia.
Salomen, G. (1985). "Information Technologies: What You See Is Not (Always) What YouGet,"' Educational Psychologist, Vol. 20, No. 4, pp. 207-216.
Schoenfeld, A. H. (1985). "Students' Beliefs About Mathematics and Their Effects onMathematical Performance: A Questionnaire Analysis," paper presented at theannual meeting of the American Educational Research Association, Chicago, Illinois.
Schofield, J. W., and D. Verban (1988). "Computer Usage in the Teaching of Mathematics:Issues Which Need Answers," in D. Grouws and T. Cooney (eds.), Perspectives onResearch on Effective Mathematics Teaching, Vol. 1, National Council of Teachers ofMathematics, Inc., Reston, Virginia.
199
- 183 -
Shavelson, R. J., C. Stasz, S. Schlossman, N. Webb, J. Y. Hotta, and S. Goldstein (1986).Evaluating Student Outcomes from Telecourse Instruction: A Feasibility Study,RAND, R-3422-CPB.
Slavin, R. E. (1986). Using Student Team Learning, Center for Research on Elementary andMiddle Schools, The Johns Hopkins University, Baltimore, Maryland.
Stanley, R (1989). Math A, A Brief Description, California State Department of Education,Sacramento, California.
Stasz, C., T. Ormseth, D. McArthur, and A. Robyn (1989). "An Intelligent Tutor for BasicAlgebra: Perspectives on Evaluation," paper presented at the annual meeting of theAmerican Educational Research Association, San Francisco, California.
Strudler, N., and M. Gall, (1988). "Successful Change Agent Strategies for OvercomingImpediments to Microcomputer Implementation in the Classroom," paper presented atthe annual meeting of the American Educational Research Association, New Orleans,Louisiana.
Thompson, C. S., and E. C. Rathmell, (1988). "NCTM's standard for school mathematics,K-12," Mathematics Teacher, Vol. 81, No. 5, pp. 348-351.
Tobin, K. (1987). "Forces Which Shape the Implemented Curriculum in High School Scienceand Mathematics," Teaching and Teacher Education, Vol. 3, No. 4.
Usiskin, Z. (1985). "We Need Another Revolution in Secondary School Mathematics," in TheSecondary School Mathematics Curriculum, National Council of Teachers ofMathematics.
2
RAND /N -3326- NSF /RC
201
zi
(9/92)
U.S. DEPARTMENT OF EDUCATIONOffice of Educational Research and Improvement (OERI)
Educational Resources Information Center (ERIC)
NOTICE
REPRODUCTION BASIS
1 ERIC I
This document is covered by a signed "Reproduction Release(Blanket)" form (on file within the ERIC system), encompassing allor classes of documents from its source organization and, therefore,does not require a "Specific Document" Release form.
This document is Federally-funded, or carries its own permission toreproduce, or is otherwise in the public domain and, therefore, maybe reproduced by ERIC without a signed Reproduction Releaseform (either "Specific Document" or "Blanket").