DOCUMENT RESUME ED 201' 637 CE 029 651 AUTHOR Peng, Samuel S.: And Others _TI?' School and Beyond: A National Longitulinal Stddy for the 1980s. A Capsule Description of High cool Students. INSTITUTION National Center for Educational Statistics' (ED), Washington, D.C. PUB DATE Apr 81 NOTE 66p. "ED RS PRICE MF01/PC03 Plus Postage. DESCRIPTORS *Academic Achievement: Basic.Skills; Career- Choice: College Choicet Fatily Planning: Federal Programs; Grade 10: Grade 12: Group Activities: High .School Seniors: *High School Students; Leisure Time: Longitudinal Studies: Mathematics Curriculum; Minimum Competency Testing; National Surveys: Occupational ; Aspiration: Remedial Instruction; Science Curriculum: *Student Behavior: *Student Characteristics; *Student Educational Objectives: Student Employment; Student Experience: Student Financial Aidt.*Student Needs: Student Participation: Vocational Education TDPNTFIEPS;/' *High School and Beyond (NCES): Life Goals ABSTRACT This report of the High School and Beyond (HMI Study (a national longitudinal study of over 30,000 sophomores and 28,000 seniors enrolled in 1,015 public and private schools) contains nine graphs and 28 tables summarizing data on students' high school experiences, activities outside school, values and attitudes, plans for college, and plans of high school seniors. Specific areas covered include curriculum placement, mathematics and science courses taken, grades and homework, participation in federally funded progiams, basic remedial skills instruction, vocational training, proper school behavior, minimum competency tests, working for pay, organized group activities, leisure activities,,life goals, factors in occupational choice, national service, short- anUloagrrange plans, criteria for choosing a college, plans to use financial aid, type of college chosen, and expected field of study. (Survey data sources and data files, student classification :wariables, and a discuSsion of limitations on the use of data ate appended.) (MN) *********************************.*************************************i * Reproductions supplied by EDRS,are the best that can be made * from the original document. **********************49**********************************************3
Transcript
DOCUMENT RESUME
ED 201' 637 CE 029 651
AUTHOR Peng, Samuel S.: And Others_TI?' School and Beyond: A National Longitulinal Stddy
for the 1980s. A Capsule Description of High coolStudents.
INSTITUTION National Center for Educational Statistics' (ED),Washington, D.C.
College Choicet Fatily Planning: Federal Programs;Grade 10: Grade 12: Group Activities: High .SchoolSeniors: *High School Students; Leisure Time:Longitudinal Studies: Mathematics Curriculum; MinimumCompetency Testing; National Surveys: Occupational ;
TDPNTFIEPS;/' *High School and Beyond (NCES): Life Goals
ABSTRACTThis report of the High School and Beyond (HMI
Study (a national longitudinal study of over 30,000 sophomores and28,000 seniors enrolled in 1,015 public and private schools) containsnine graphs and 28 tables summarizing data on students' high schoolexperiences, activities outside school, values and attitudes, plansfor college, and plans of high school seniors. Specific areas coveredinclude curriculum placement, mathematics and science courses taken,grades and homework, participation in federally funded progiams,basic remedial skills instruction, vocational training, proper schoolbehavior, minimum competency tests, working for pay, organized groupactivities, leisure activities,,life goals, factors in occupationalchoice, national service, short- anUloagrrange plans, criteria forchoosing a college, plans to use financial aid, type of collegechosen, and expected field of study. (Survey data sources and datafiles, student classification :wariables, and a discuSsion oflimitations on the use of data ate appended.) (MN)
*********************************.*************************************i* Reproductions supplied by EDRS,are the best that can be made* from the original document.**********************49**********************************************3
O
High School and Beyonda national longitudinal study for the 1980's
A Capsule Descriptionof High School Students
Samuel S. PengWilliam B. FettersAndrew J. Kolstad
U.S. DEPARTMENT OF HEALTH,EDUCATION & WELFARENATIONAL INSTITUTE OF
EDUCATION
THIS DOCUMENT HAS BEEN REPRO-DUCED EXACTLY AS RECEIVED FROMTHE PERSON OR ORGANIZATION ORIGIN-ATING IT. POINTS OF VIEW OR OPINIONSSTATED DO NOT NECESSARILY REPRE-SENT OFFICIAL NATIONAL INSTITUTE OFEDUCATION POSITION OR POLICY
(4
U.S. Department of EducationT. H. BellSecretary
Office of Educational Research and ImprovementDick W. HaysActing Assistant Secretary
National Center for Education StatisticsMarie D. EldridgeAdministrator
National Center for Education Statistics
"The purpose of the Center shall be to collect anddisseminate statistics and other data related toeducation in the United States and in other nations.The Center shall . . . collect; collate, and, frprn timeto time, report full and complete statistics on theconditions of education in the United States; conductand publish reports on specialized analyses of themeaning and significance of sach statistics; . . . andreview and report on education activities in foreigncountries."--Section 406(b) of the General EducationProvisions Act, as amended (20 U.S.C. 1221e-1).
J
r
. *a'
Ergata Sheet
High School and Beyond
A Capsule Description of High School Students
Page 2
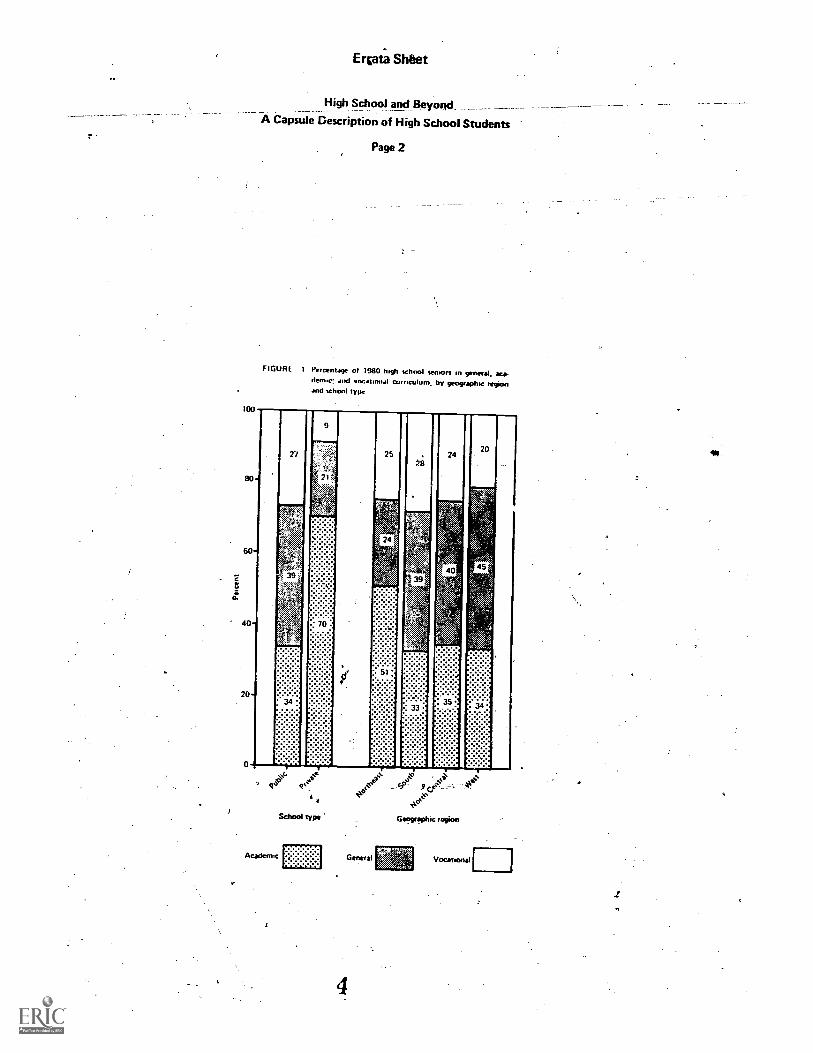
FIGURE I Percentage of 1980 high school seniors in general, acadome: and VOCJIIMIJI currrculum, by geographic momand school type
Academic
School type
General
a.c' -
cp`s--:Geographic
Vocational
FOREWORD
The High School and Beyond (HSdcB)study was designed to provide a data basecontaining longitudinal statistics on a nation-al sample of high school sophomores andseniors as they move out of the Americanschool system into the-critical years ofearly adulthood. The study began with agroup-administered survey in.the springof 1980 prior to the students leaving highschool and will continue with plarnled follow-up surveys of the same samplein_1982,and1984. Results from the study are beingpresented in a series of reports designedto highlight selected findings in educationaland occupational development.
This general report, the first HS&Bpublication, is a summary of descriptiveinformaiion about the students' high schoolexperiences, activities outside of school,attitudes, and plans for after high school.Many details are not included in this reportbecause its purpose is to highlight the breadthof the HS&B data. Basic student data filesare available to researchers who wish topursue these or othei topics in depth.
David Sweet, Assistant AdministratorDivision of Multilevel Statistics
Dennis C. Carroll, ChiefLongitudinal Studies Branch
April 1981
5
ACKNOWLEDGMENTS.-
A host of individuals and organizationscontributed to High School and Beyond.Chief among them were the 58,000 second-ary school students who participated .nthe base -year- survey, their school principalsand other school personnel, district super-intendents, Chief State School Officers,and coordinators in each state's departmentof education.
The overall research design of HS&Bwas developed primarily by William B.Fetters of the National Center for Educa-tion Statistics. Special thanks are due tomembers of the National Planning Commit-tee, who have been active in advising NCESon the design, implementation, and usesof the study: Ellis B. Page, Chairman (DukeUniversity), Robert F. Boruch (NorthwesternUniversity), Bruce K. Eckland (Universityof North Carolina, Chapel Hill), BarbaraHeyns (New York University), David S.Mundel (En ployment and Economic PolicyAdministration, City of Boston), RobertC. Nichols (State University of New York,Buffalo), Sally B. Pancrazio (Illinois Officeof Education), and David E. Wiley (North-western University).
Thanks are also due to John W. Meyer(Stanford. University) for helping-crystallizestudy objectives and for developing firstdrafts of the student questionnaires, toThomas. L. Hilton and other staff membersat Educational Testing Service (ETS) fordeveloping cognitive tests for the project,and to members of a special panel on testdevelopment: Anne Anastasi (FordhamUniversity), William H. Angoff (ETS), JohnB. Carroll and Bruce K. Eckland (both ofthe University of North Carolina, Chapel
t Hill), and Eric F. Gardner (Syracuse Uni--versity).
A
iv
The National Opinion Research Center(NORC), under the _direction of NCES, tookresponsibility for the remainder of thedesign and conducted, the base- year survey;NORC's preliminary analysis of the base-year data contributed to the developmentof this publication. James S. Colemanserved as Principal Investigator at NORC,with Carol B. Stocking as Project Director.Other contributing NORC staff memberswere Fansayde CalloVay, who directedfield work for the project, and AntoinetteDelk, Larry Dornacker, Martin Frankel,and Natalie Suter.
This capsule report was prepared bymembers of the Division of Multilevel Edu-cation Statistics, NCES. The principalauthors were William. B. Fetters, AndrewJ. Kolstad, and Samuel S. Peng; they wereassisted by Marjorie 0. Chandler, EdithM. Huddleston, Jeffrey A. Owings, andRicky Takai. Early drafts were typed byRoberta Bernstein, Martha Hollins, andCrystal Hutchinson; Denise Wbod was re-sponsible for thefinal typing of the tables ,
and manuscript.
HOW- TO OBTAIN MORE INFORMATION
Information about the Center's sta-tistical program. and a catalog of NCESpublications mays be obtained from theStatistical Information Office, NationalCenter for Education'Statistics, 1001 Presi-dential Building, 400 Maryland Avenue,SW, Washington, D.C. 20202, telephone(301) 436-7900.
inquiries for related computer tapesshould also be directed to the StatisticalInformation Office.
6
' CONTENTS.
PageFOYZEWORD iii
ACKNOWLEDGMENTS iv
HOW TO OBTAIN MORE INFORMATION iv
INTRODUCTION ix
CHAPTER 1. HIGH SCHOOL EXPERIENCES 1
A. Curriculum Placement 1
B. Mathematics and Science Courses Taken 1
C. Grades and Homeworls 4D. PartiCipation in Federally-funded Programs 4E. Basic Skills Remedial Instruclidn 8F. Yocktional Training 8G. Proper School Behaviot 8H. Minimum Competency Test. 11I. Student Opinions of their School, 11
CHAPTER II. ACTIVITIES OUTSIDE OF SCHOOL 17
A. forking for Pay 17B. Organized Group Activities 17C. Other Leisure Activities 20
CHAPTER III. VALUES AND ATTITUDES 23
A. Life Goals 23B. Factors in Occupational Choice 23C. National Service 23
CHAPTER IV. PLANS OF HIGH SCHOOL SENIORS 29
A. Short-Range Plans 29B. Long-Range Plans 29
1. Postsecondary Education 292. Occupational Goals 293. Family Formation 33
CHAPTER V. PLANS FOR COLLEGE 37
A. Criteria for Choosing a College 37B. Plani to Use Financial Aid 37C. Type of College Chosen 37D. Expected Field of Study 40
AFTERWORD 43
APPENDIXES
A--HIGH SCHOOL AND BEYOND DATA SOURCES /AND DATA FILES 47 .
B--STUDENT CLASSIFICATION VARIABLES 51
C-- LIMITATIONS ON USE OF DATA 55
Figure 1
FIGURES
Percentage of 1980 high school seniors in academic,general and Vocational curriculum, by geographicregion and school type . . ..... . . . . .
Page
Figure 2 Percentage of 1980 high school seniors taking 3 or moreyears of coursework in mathematics and science,kby racial/ethnic group 2
Figure 3 Percentage of 1980 high school seniors reporting varyingamounts of time spent on homework per week,for 1972 and 1980
Figure 4 Percentage of 1980 high school seniors taking remedialcoursework in English and mathematics, by racial/ethnicgroup
7
10
Figure 5 Percentage of schools requiring minimum competency testsfor high school graduation in 1980, by geographic region . . 14
Figure 6 Percentage of 1980 seniors expressing various preferencesabout national service, by sex . 27
Figure 7 Percentage of 1980 high school seniors reporting variousactivities planned for the first year after graduation 32
Figure 8 Percentage of 1980 high school seniors expecting bachelors,Masters, and df.grees beyond masters, by achievement deciles 32
Figure 9 Median ages at which 1980 seniors planned to finish full-timeeducation, get married,'and have first child, by sex and levelof educational expectations 36
TABLES
Table 1 Percentage of 1980 high school seniors in academic,general, and vocational curricula and change since1972, by sex
Table 2 Cumulative percentage of 1980 high school seniorstaking varying amounts of mathematics and sciencecoursework, by sex
Table 3 Percentage of 1980 high school seniors takingmathematics and science courses, by course title,sex, and racial/ethnic group 5
Table 4 Cumulative percentage of 1980 high school seniorstaking varying amounts of mathematics and sciencecoursework, by curriculum
Page
Table 5 Cumulative percehtage.of 1980 high school seniors takingvarying amounts_of mathematics and science-coursework,by geographic region 6
Table 6 Percentage of seniors reporting varying high school..gradesfor 1980 and 1972, and change since 1972 6
Table 7 Percentage of seniors participating in various Federaleducation prograMs, for 1980 by SES and for 1972 9
Table 8 Percentage of 1980 high school seniors taking 2 yearsor more of voc t al coursework, by sex andcurriculum 9.
Table 9 Percentage of 1980 high school seniors reportingvarious discipline problems, by sex, SES, andschool type
Table 10 Percentage of 1980 high school, seniors reportingabsenteeism and tardiness, by geographic region
Table 11 Percentage of 1980 high school seniors reportingaspects of discipline as "good" or "excellent," bycurriculum and school type
Table 12
:Table 13
Percentage of 1980 high school seniors rating various schoolcharacteristics as "good" or "excellent," by curriculum andschool type
Percentage of 1980 seniors agreeing with variousstatements about high school education or practice, bycurriculum and school type
12
12
13
13
16
Table 14 Work experience of 1980 high school seniors, bycurriculum and racial/ethnic group 18
Table 15 Average work hours and earnings of 1980 high school seniors,by sex and racial/ethnic group 18
Table 16 Percentages of 1972 and 1980 seniors who participatedactively or as a leader in various orgahized groupactivities, by sex 19
Table 17 Percentages of 1980 sophomores and seniors whoparticipated in various leisure activities, by sex 21
Table 18 Percentage of 1980 high school seniors rating variouslife goals as "very important," by sex and changesince 1972 24
Table 19 Percentage of .1980 high school seniors rating variousfactors as "important" in choosing an occupation,by Sex . 25
vii.
PageTable 20 Percentage of 1972 and 1980 seniors reporting various
Activities as "the one thing that wili take the largestshare of time in the year after high school," by sex 30
Table 21 Percentage of 1980 high school seniors expecting various .
amounts and types of postsecondary education, by SES 30 *,
Table 22 Percentage of 1980 high school seniors expecting a4-year degree or more, by racial/ethnic group and sex 31
Table 23 Percentage of 1980 high school seniors expectingvarious jobs or occupations when 30 years old,/by sex 34
Table 24 Percentage of 1980 high school senior,,expecting eventuallyto have 0, 1, 2, 3, or 4 children or more, by sex andeducational expectation 35
Table 25 Percentage of 1980 cc:lege-bound high school seniors whoconsider various criteria as "very important" in choosing acollege, by racial/ethnic group 38
Table 26 Percentage of 1980 college-bound high school seniorsplanning to use various types of financial aid, bySES 38
Table 27 Percentage of 1980 college-bound seniors planning touse major Federal financial aid programs, by SES 39
Table 28 Percentage of 1980 college-bound high school seniorsplanning to enroll in various fields of study incollege 41
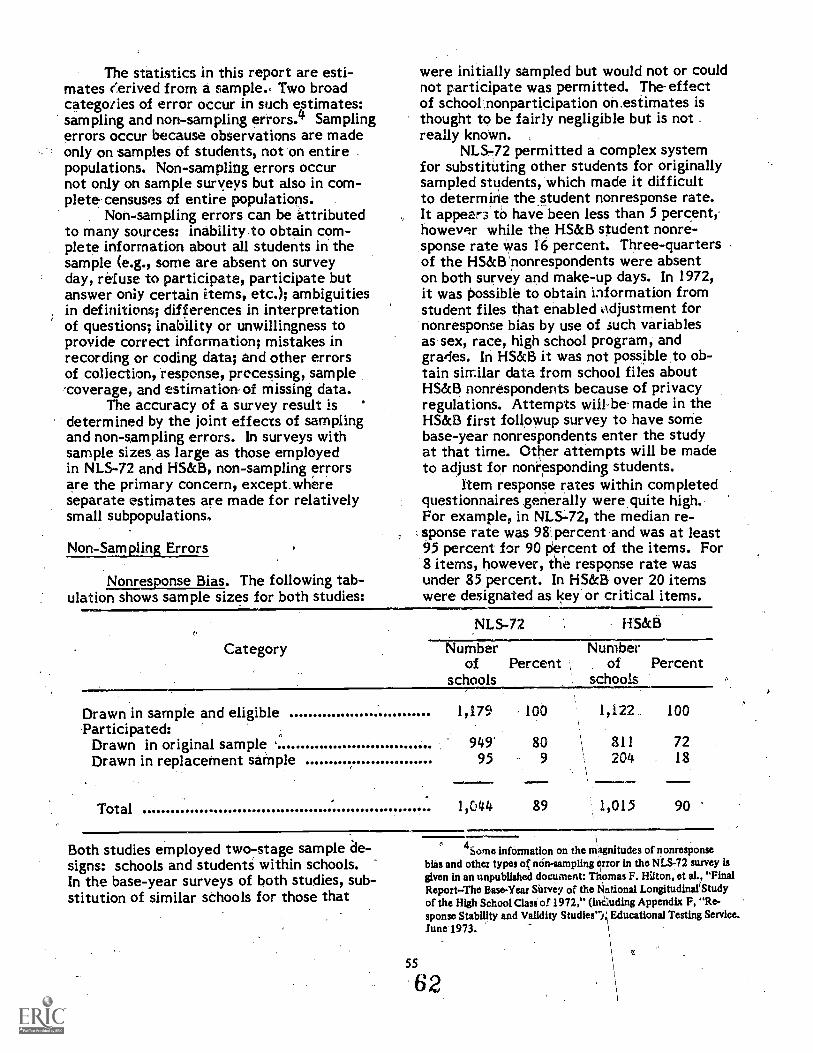
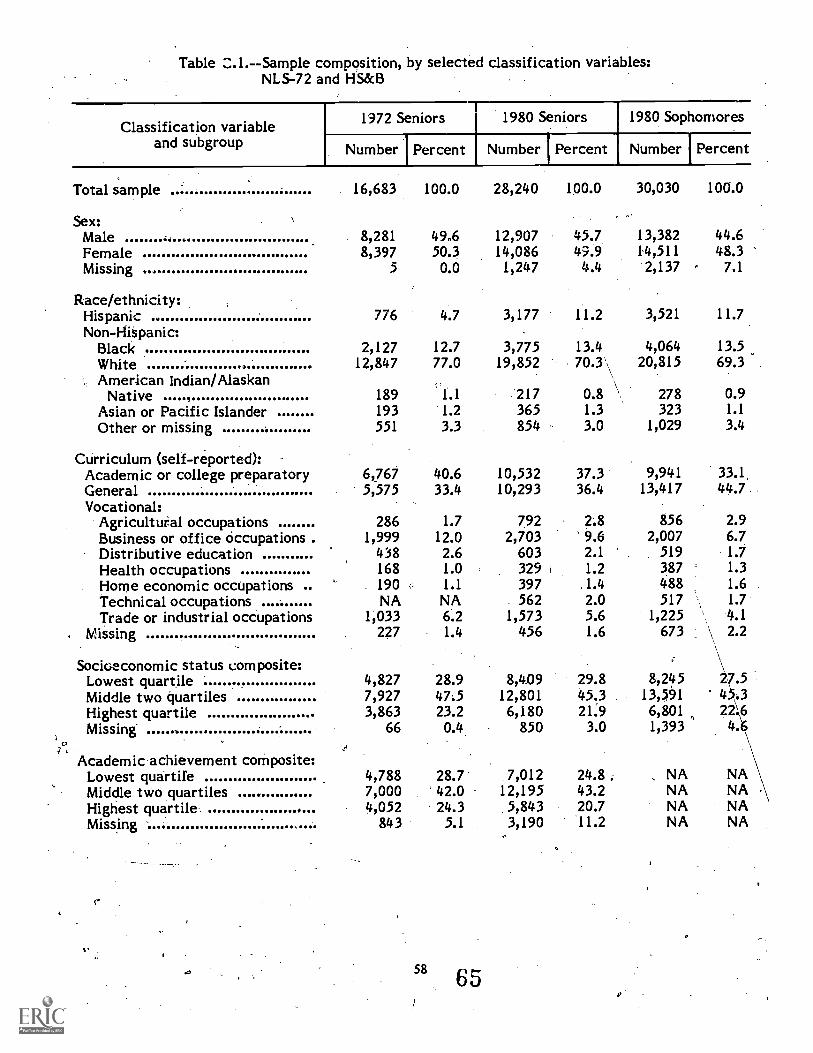
Table C.1. Sample composition, by selecteci classificationvariables: NLS-72 and 1-IS&B 58
r.6
viii
10
INTRODUCTION
The High School and Beyond (HS&B)study is a nationally representative samplesurvey of 1980 high school sophomores andseniors in the United States. As a large-scale, longitudinal survey, the study's primarypurpose is to observe the educational andoccupational plans and activities of youngpeople as they pass through the Americaneducational system and take on their adultroles. The study should ultimately contributeto an understanding of. student developmentand of the factors that determine individualeducation and career outcorries. Such infor-matiwi-is useful as a basis for review andreformulation of Federal, State, and localpolicies affecting the transition of youthfrom school to adult life.
The availability of this longitudinaldata base encourages in-depth researchfor' meeting the educational policy needsbf the 1980's at local, State, and Federallevels. HS&B data should contribute toevaluating: the strength of secondary schoolcurricula; the demand for postsecondaryeducation; problems of financing postsec-ondary education; the adequacy of post-.secondary., alternatives open to high schoolstudents; the need for new types of educa-tional programs and facilities to developthe talents of our youth; and the relation-ships among the educational, vocational,and personal development of young peopleand the institutional, familial; social, andcultural factors that affect that develop-ment.
HS&B is the second in a program of lon-gitudinal studies sponsored by the NationalCenter for Education Statistics (NCES). Thisstudy is similar to NCES's first, the NationalLongitudinal Study of the High School Classof 1972 (NLS-72); which began in 1972 andhas-completed its fourth followup survey.NCES's longitudinal studies program is basedon the assumption that Federal, State, and 'local policies affecting the transition from _
school to work ought to be grounded on fac-tual analyses of the intervening processes ofthe American educational system, not simplyon the inputs and degrees and diplomasawarded. The longitudinal studies programprovides statistics on the education, work,and family experiences of young adults for
A
the pivotal years during and immediatelyfollowing high school. The Fourth Followupof the NLS-72 provides current informationon the outcomes of schooling seven yearsafter high school, while the base-year HS&Bstudy - provides current information on highschool experiences near the beginning ofthe transition to adult life.
The HS&B study design seeks to gatherthe same type of data collected by NCES's,first longitudinal study. The study of theHS&B senior cohort replicates many aspectsof the NLS-72, both in the questionnairesand in the cognitive tests. This allows inter-study comparisons to be made)of the eco-nomic and social`' changes that occurredin the eight years since 1972. However,the second study differilrom the first intwo significant way, it addresseselementsqn the eddcational process thatwere ignored .i/n/the first study. HS&B isthe first longitudinal study of students tosurvey parents concerning their aspirationsfor their children and their ability and de-sire to pay for the fulfillment of theseaspirations. fiS&P., is also the first studyto survey teachers concerning their assess-ment of their students' futures. Second,it extends the scope of the population tothe sophomores of 1980 as well.as the seniors,and thus makes possible a fuller understand-
, ing of the dimensions of secondary schoolexperience, their long-term impact on stu-dents, and the factors that influence theprocess of dropping out of school early.
The base-year survey was conductedin spring 1980. The study design included /a highly stratified national probability sartfpleof over 1,100 high schools with 36 seniorsand 36 sophomores per school. (In tho'seschools with fewer than .36 seniors .or sopho-mores, all eligible students wereincludedin the sample) Cooperation froP-i bothschools and students was excellent. Over30,000 sophomores and 28,000 seniors en-rolled in 1,015 public and private high schoolsacross the nation participated in,the base-year survey. The samples represent thenation's 10th and 12th grade populations;totaling about 3,800,000 sophomores and3,000,000 seniors in more than 21,000 schoolsin spring 1980.
'The overall resppnse rate for schools was 91 percent andfor students was 84 percent.
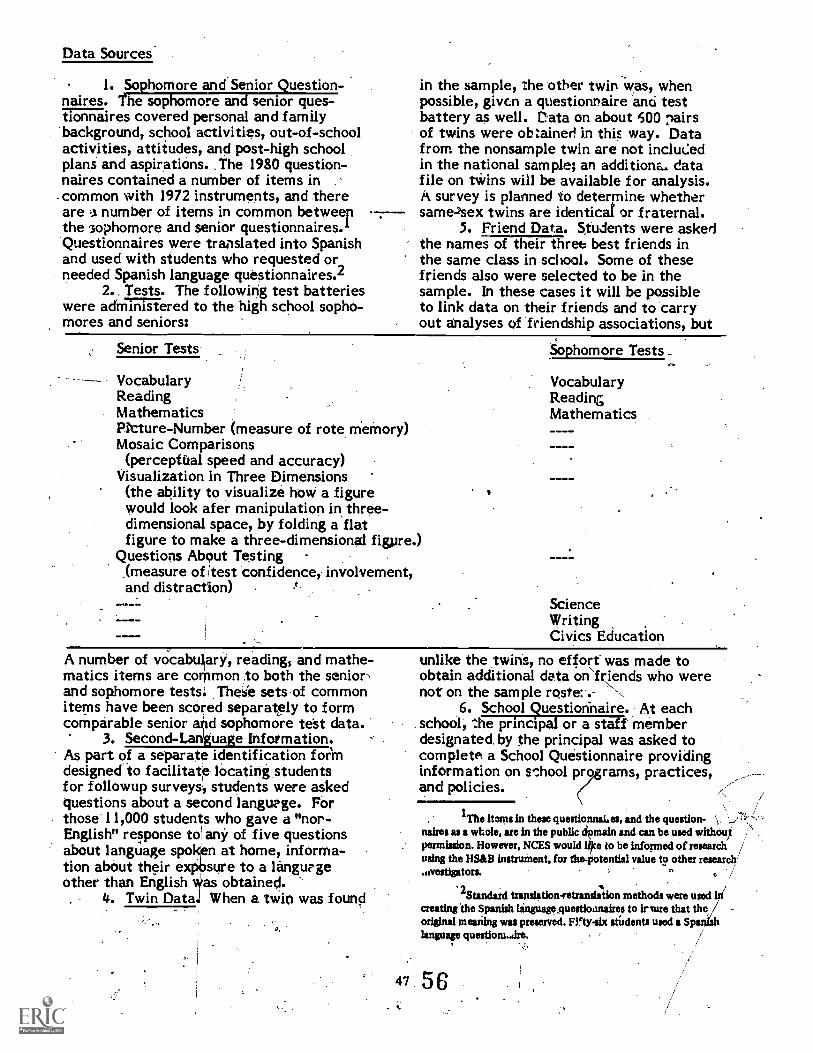
Questionnaires-and cognitive testswere administered to each student in theI-IS&B sample. The student questionnairecovered school experiences, activities, atti-tudes, plans, selected background charac-teristics, and language proficiency. Othergroups of respondents provided other typesof information. The admingtrator in eachselected school filled out a questionnaireabout the school; teachers in each schoolwere asked to make comments on studentsin the sample; twins in the sample wereidentified'and their counterpart twins werealso surveyed; and a sample of parents ofsophomores and seniors (about 3,600 foreach cohort) was surveyed primarily forinformation on financing of higher educa-tion. The total survey effort thus provideda comprehensive data base for analysesin education and other areas of social sci-ences.
This report is organized in five sec-tions. The first describes experiences inhigh/school (coursework, grades, vocationaltraining, behavior, school practices, andstudent opinions on high school); the second
/outlines activities outside of school; thethird discusses the students' life goals; thefourth section describes short-range andlong-range plans after high school; and thelast examines college plans'in somewhatmore detail.
Appendix A presents a detailed de-scription of data sources avai. able fromthe survey. Appendix 'B describes proce-dures for dividing the total populationinto subgroups for analytic purposes.Appendix C discusses limitations on theuse and interpretation of the data at thistime, and indicates how theiprecision ofthe statistics presented in.the report maybe.approximated.
CHAPTER I. HIGH SCHOOL EXPERIENCES
School is the major activity in thelives of nearly all young people. High schoolexperiences are designed to prepare youngpeople for further education or for an occu-pation after high school, in accordance withthe plans of the students,,their parents,and their communities.
This section presents some basisfind-ings about student educational experiencesin high school, including curriculum place-,ment, mathematics and science, coursework,participation) in Federally-funded educationprograms, requirements of State and loCalminimum competency testing programs,training in basic and vocational skills, andstudent behavior. It describes these experi-ences, based on student reports, for selectedsubgroups defined by sex, race and ethnicity,socioeconomic status, general academicachievement of students," and by the typeand location of their high schools. Appen-dix B provides a full explanation of howthese subgroups were defined.
A. Curriculum Placement
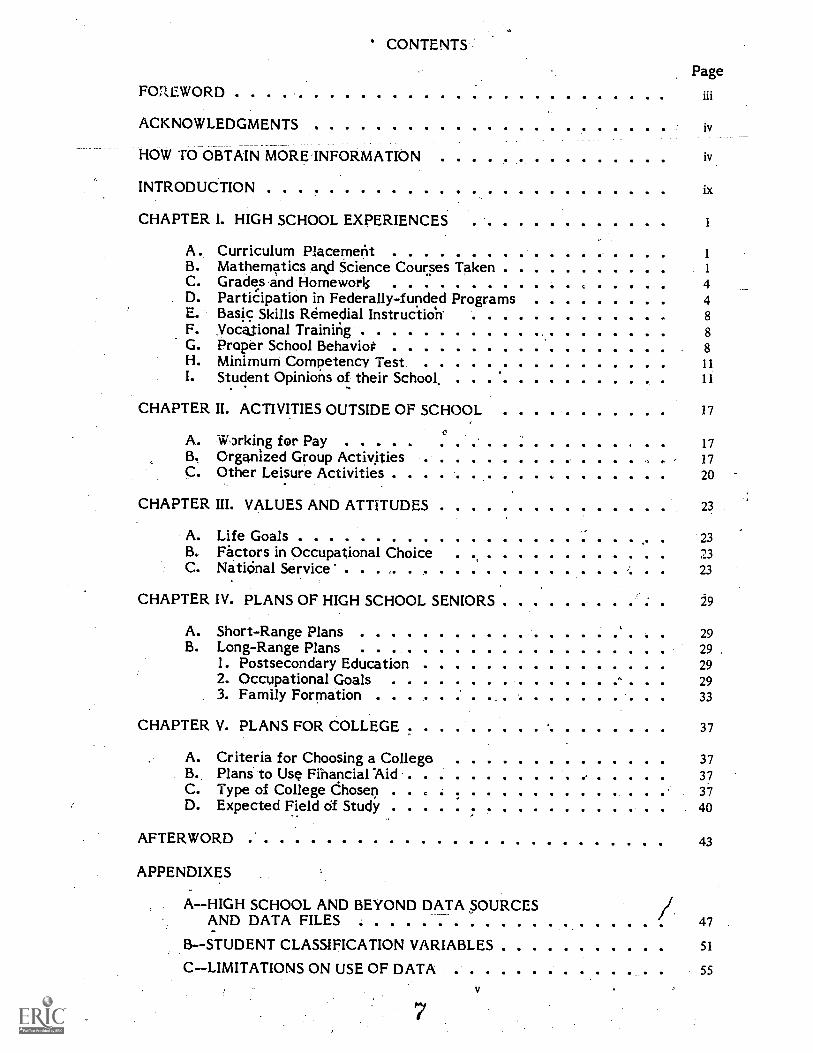
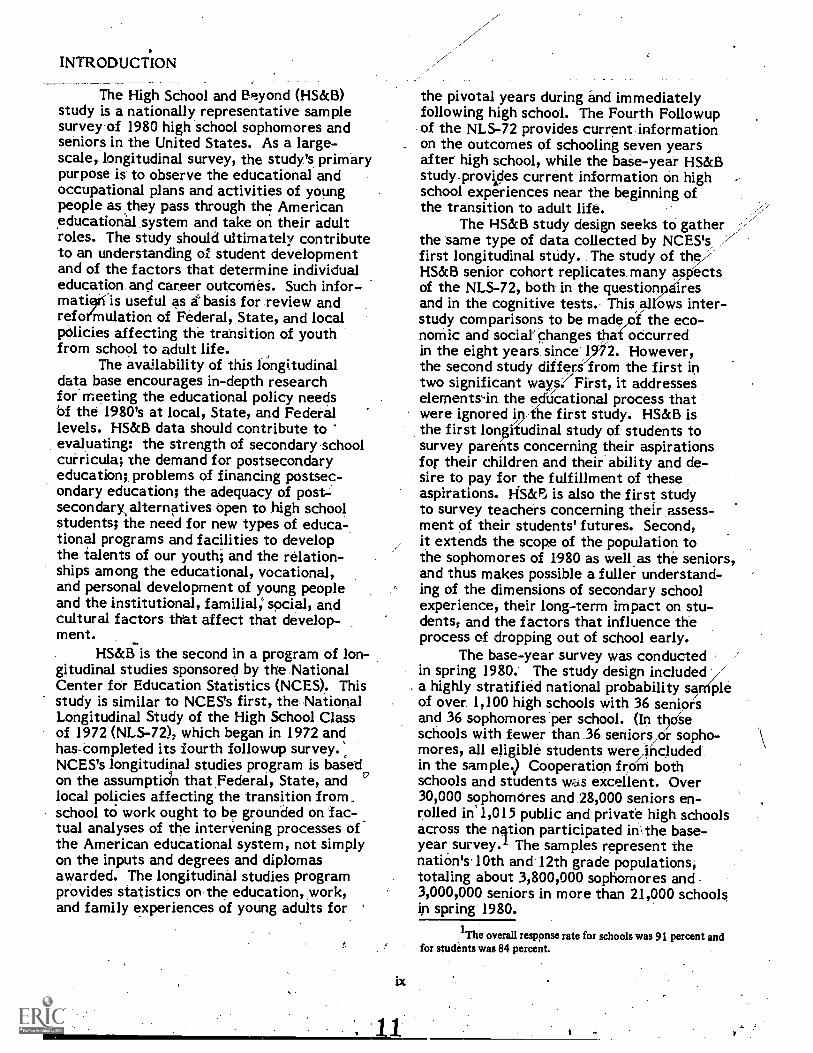
Curriculum placement largely deter-mines the kinds of courses taken and isassociated with fdture educational andcareer choices. Of the 1980 seniors, 39percent repdi-ted they were enrolled-inacademic programs, 37 percent in generalprograms, and 24 percent in vocational pro-grams: This distribution, however, variedby geographic region and by iiipe of school(figure 1). While students in the. IsiOrtheastwere most likely to enroll in academicprograms (51 percent), students in otherregions were more likely to.enroll in gen-eral programs. In particular, 45 percentof students in the West were enrolled ingeneral programs, compared with 34 per-cent in academic programs.
About, one-third of the 1980 seniorsin public high schools (34 percent) took anacademic program to prepare for college,and 27 percent took a vocational program)to prepare for an occupation after highschool. In private high schoolsohis dis-tribution was markedly different. Overtwo-thirds (70 percent) took ar :ademicprogram, and 9 percent took a vocational
program. These distributions reflect a basicdifference in orientation of the two typesof schools. Yetthe experiences and con-cerns of students in the same type of pro-gram are often more similar to one another,even though they are in different typesof schools, than they are to those in a differ-ent program in the same type)of school.
Curriculum,placements for 1980seniors changed somewhat from those of1972 seniors. From 1972 to 1980, the over-all propoction of students in academic pro-grams deolined by about 4 percentage pointswhile the proportion of studerits in generalprograms increased by 4 percentage points(table 1). The\proportion of males in vocetional programs increased, but the proportionof females in these programs decreased.In, 1980, the proportion of women in aca-demic progrVns was almost identical tothe proportion of men in these programs.In 1972, however, the difference amountedto 5 percentage points in favor of men.
B. Mathematics and Science CoursesTaken
A strong background in mathematicsand sciences is usually required for accessto postsecondary opportunities in science,'engineering, and other quantitative fields.Of. all seniors in 1980, an estimated 67percent took at least two years of mathe-matics, including advanced mathematicscoursework and remedial mathematicscoursework (to 'be discussed in section E).
Sei differences in total mathematics .and science coursework were sizable. About71 percent of male seniors took two yearsor more of mathematics since the-beginningof the tenth grade, compared to 63 percentof female students who did so (table 2).Similarly, males more often had two yearsor more of coursework in science (57 per-cent) compared with 50 percent of femalestudents.
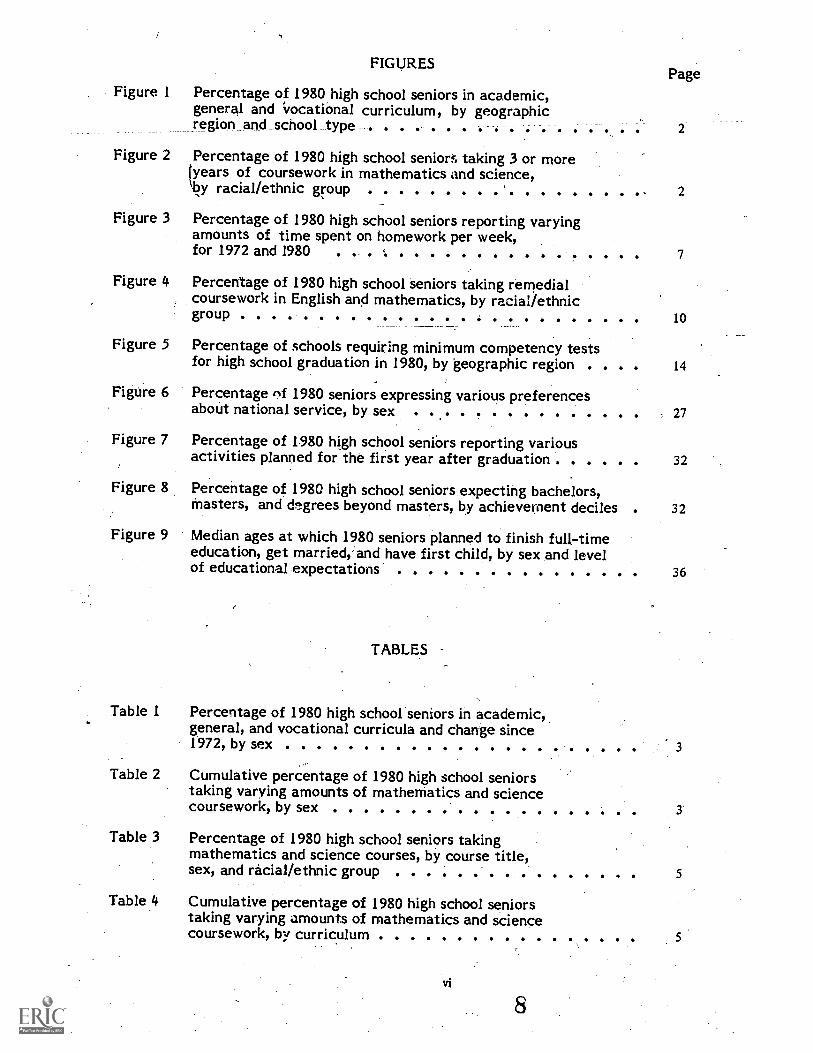
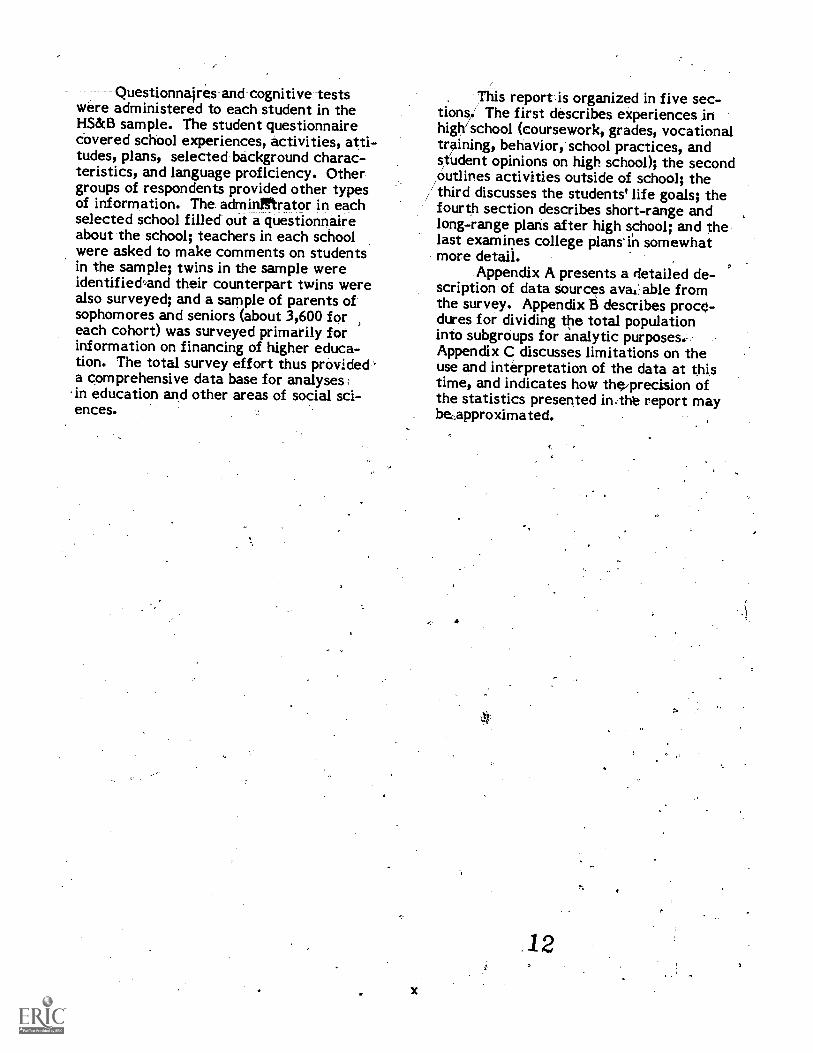
Race differences in mathematics andscience coursework were also substantial(figure 2). Asian Americans2 were highestbf,the five racial/ethnic groups in bothmathematics and science. Whites werethe second highest in science, while blacks
2see appendix B for exact wording used to describe racial/ethnic groups.
100
80
60
40
20
0
FIGURE 1... Percentage of 1980 high school seniors in general,academic, and vocational curriculum, by geographic region and school type
d ' ;t1'<r)
School type
.1*Nx°
Geographic region
Academic 11111 General 111111 Vocational
ti
S
FIGURE 2. Percentage of 1980 high school seniors takingthree years or more of coursework in mathemat-ics and science, by racial/ethnic group
Black 36
Hispa
Asian 48 32
Amertesea Indian/Alaskan Native
0 20 40 60 0 t 20 40Percent Percent
MatheMatics Science
Percent in curriculum1980 seniors
Change since 1972
Al! Male Female All I Male I Female
Table 1.--Percentage of-1980 high school seniors in academic, general;and vocational curricula and change since 1972, by sex
Curriculumplacement
Total 100 100 100 0 0 0
Academic 39 39 38 -4 -6 -2
General 37 38 36 +4 +3 +5
Vocational 24 23 26 0 +3 -3
Table 2.--Cumulative percentage of 1980 high school seniorstaking varying amounts of mathematics and sciencecoursework, by sex
Amount ofcoursework
Mathematics Sciences
Total, including thosewith no coursework 100 100 100 100 100 100
One year or more 93 94 92 90 91 89
2 years or more ... 67 71 63 53 57 50
3 years or more 34 40 28 23 27 19
were the second highest in mathematics.Sex and race differences also exist
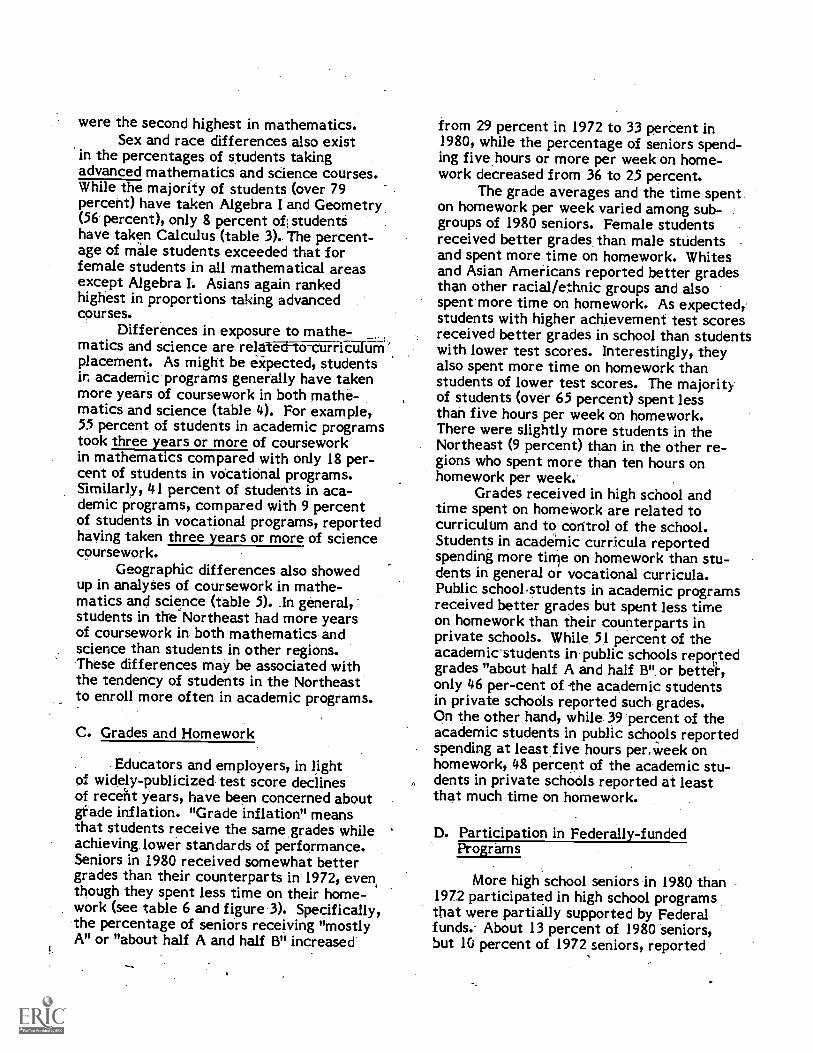
in the percentages of students takingadvanced mathematics and science courses.While the majority of students (over 79percent) have taken Algebra I and Geometry(56 percent), only 8 percent of studentShave taken Calculus (table 3).. The percent-age of male students exceeded that forfemale students in all mathematical areasexcept Algebra I. Asians again rankedhighest in proportions taking advancedcourses.
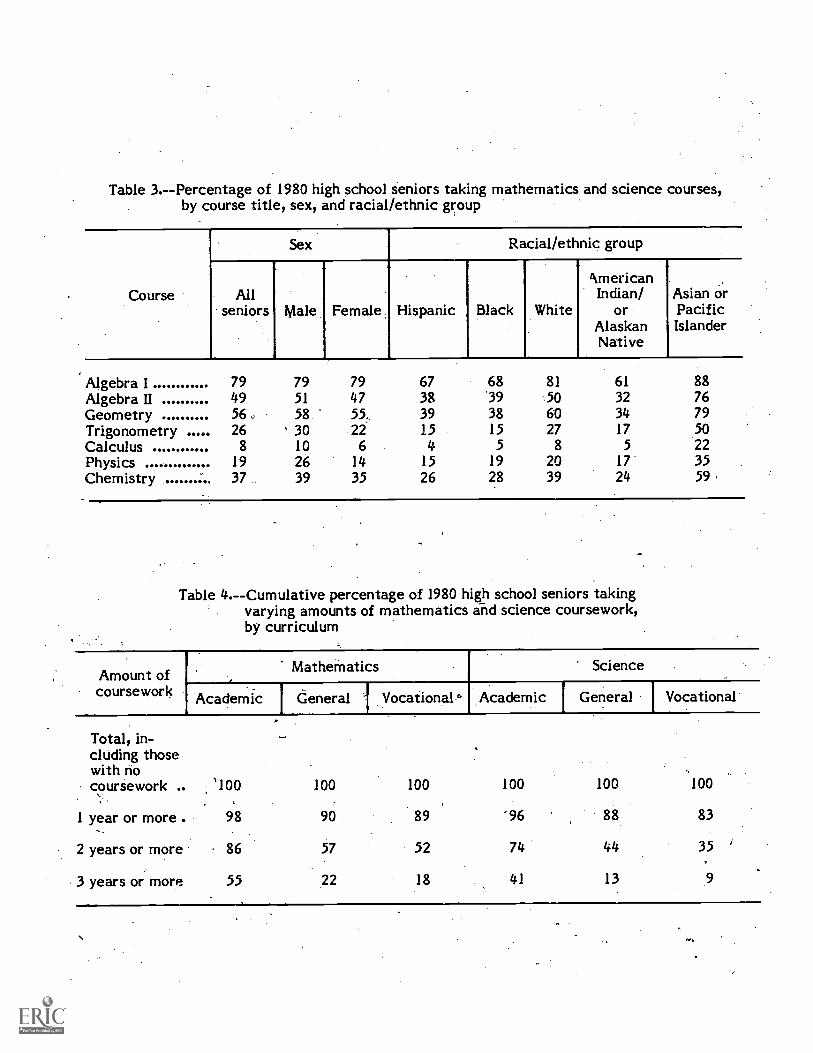
Differences in exposure to mathe-matics and science are relayed -to- Curriculum'placement. As might, be expected, students
academic programs generally have takenmore years of coursework in both mathe-matics and science (table 4). For example,55 percent of students in academic programstook three years or more of courseworkin mathematics compared with only 18 per-cent of students in vocational programs.Similarly, 41 percent of students in aca-demic programs, compared with 9 percentof students in vocational programs, reportedhaving taken three years or more of sciencecoursework.
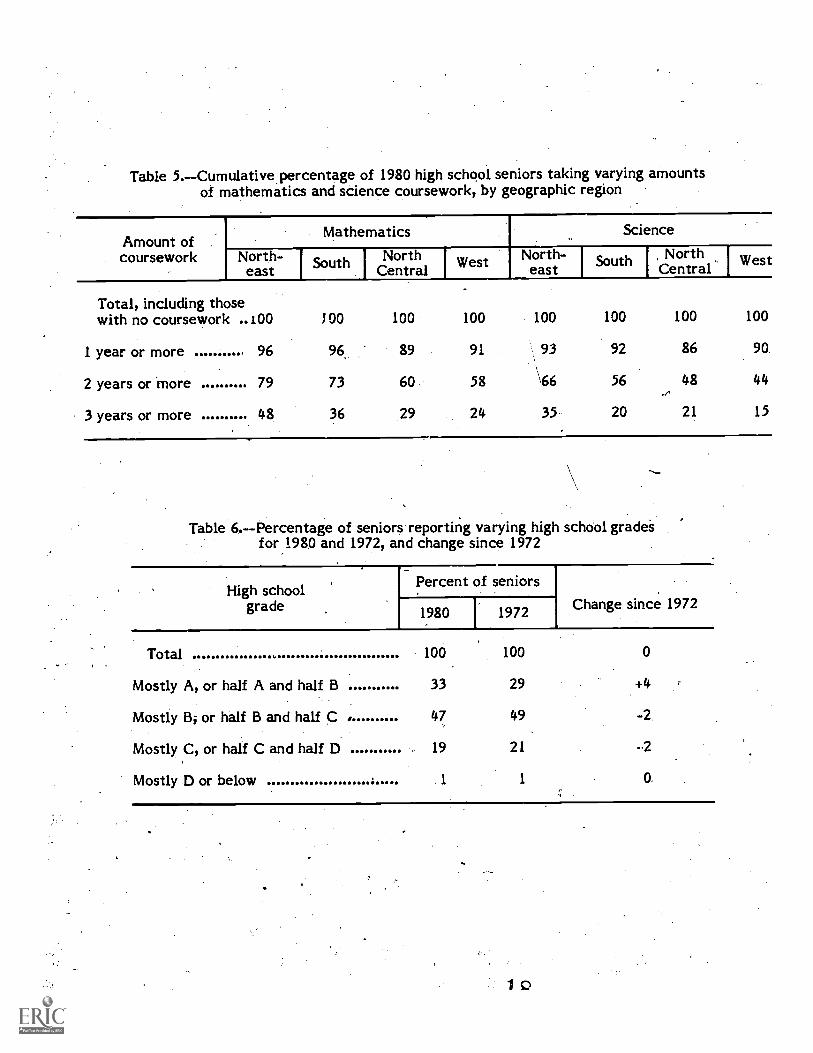
Geographic differences also showedup in analytes of coursework in mathe-matics and science (table 5). in general,students in the Northeast had more yearsof coursework in both mathematics andscience than students in other regions.These differences may be associated withthe tendency of students in the Northeastto enroll more often in academic programs.
C. Grades and Homework
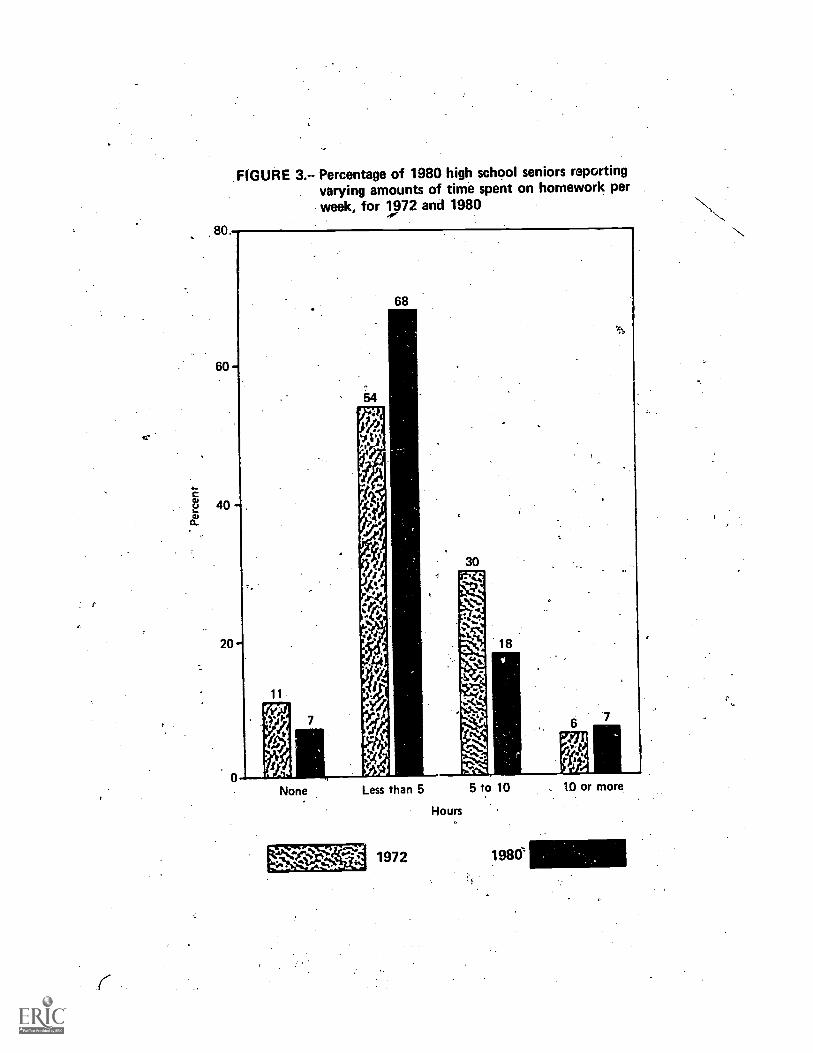
Educators and employers, in lightof widely-publicized test score declinesof recent years, have been concerned aboutgiade inflation. "Grade inflation" meansthat students receive the same,grades whileachieving lower standards of performance.Seniors in 1980 received somewhat bettergrades than their counterparts in 1972, eventhough they spent less time on their home-work (see table 6 and figure 3). Specifically,the percentage of seniors receiving "mostlyA" or "about half A and half B" increased
from 29 percent in 1972 to 33 percent in1980, while the percentage of seniors spend-ing five hours or more per week on home-work decreased from 36 to 25 percent.
The grade averages and the time spenton homework per week varied among sub-groups of 1980 seniors. Female studentsreceived better grades than male studentsand spent more time on homework. Whitesand Asian Americans reported better gradesthan other racial/ethnic groups and alsospent more time on homework. As expected,students with higher achievement test scoresreceived better grades in school than studentswith lower test scores. Interestingly, theyalso spent more time on homework thanstudents of lower test scores. The majorityof students (over 65 percent) spent lessthan five hours per week on homework.There were slightly more students in theNortheast (9 percent) than in the other re-gions who spent more than ten hours onhomework per week.
Grades received in high school andtime spent on homework are related tocurriculum and to control of the school.Students in academic curricula reportedspending more time on homework than stu-dents in general or vocational curricula.Public schoolstudents in academic programsreceived better grades but spent less timeon homework than their counterparts inprivate schools. While, 51 percent of theacademic`students in public schools reportedgrades "about half A and half B" or better,only 46 per-cent of the academic studentsin private schools reported such grades.On the other hand, while 39 percent of theacademic students in public schools reportedspending at least five hours per,week onhomework, 48 percent of the academic stu-dents in private schools reported at leastthat much time on homework.
D. Participation in Federally-fundedPrograms
More high school seniors in 1980 than1972 participated in high school programsthat were partially supported by Federalfunds. About 13 percent of 1980 seniors,but 10 percent of 1972 seniors, reported
Table 3.--Percentage of 1980 high school seniors taking mathematics and science courses,by course title, sex, and racial/ethnic group
Table 4.--Cumulative percentage of 1980 high school seniors takingvarying amounts of mathematics and science coursework,by curriculum
Amount ofcoursework
Mathematics Science
VocationalAcademic I General Vocational ° Academic I General I
Total, in-chiding thosewith no ,
coursework .. '100 100 100 100 100 100
1 year or more . 98 90 89 "96 88 83
2 years or more 86 57 52 74 44 35
3 years or more 55 22 18 41 13 9
Table 5.Cumulative percentage of 1980 high school seniors taking varying amountsof mathematics and science coursework, by geographic region
Amount ofcoursework North-
east
Mathematics
NorthCentralSouth West North-
east
Science
NorthCentralSouth West
Total, including thosewith no coursework -100 l 00 100 100 100 100 100 100
1 year or more 96 96 89 91 93 92 86 90
2 years or more 79 73 60 58 \66 56 48 44.,,
3 years or more 48 36 29 24 35 20 21 15
Table 6.--Percentage of seniors reporting varying high school grade'sfor 1980 and 1972, and change since 1972
High schoolgrade
Percent of seniorsChange since 1972
1980 1972
Total 100 100 0
Mostly A, or half A and half B 33 29 +4
Mostly Bi or half B and half C , 47 49 -2.
Mostly C, or half C and half D 19 21 -.2
Mostly D or below 1 1 0.
FIGURE 3.-- Percentage of 1980 high school seniors reportingvarying amounts of time spent on homework perweek, for 1972 and 1980
None Less than 5 5 to 10
Hours
1972 1980'
10 or more
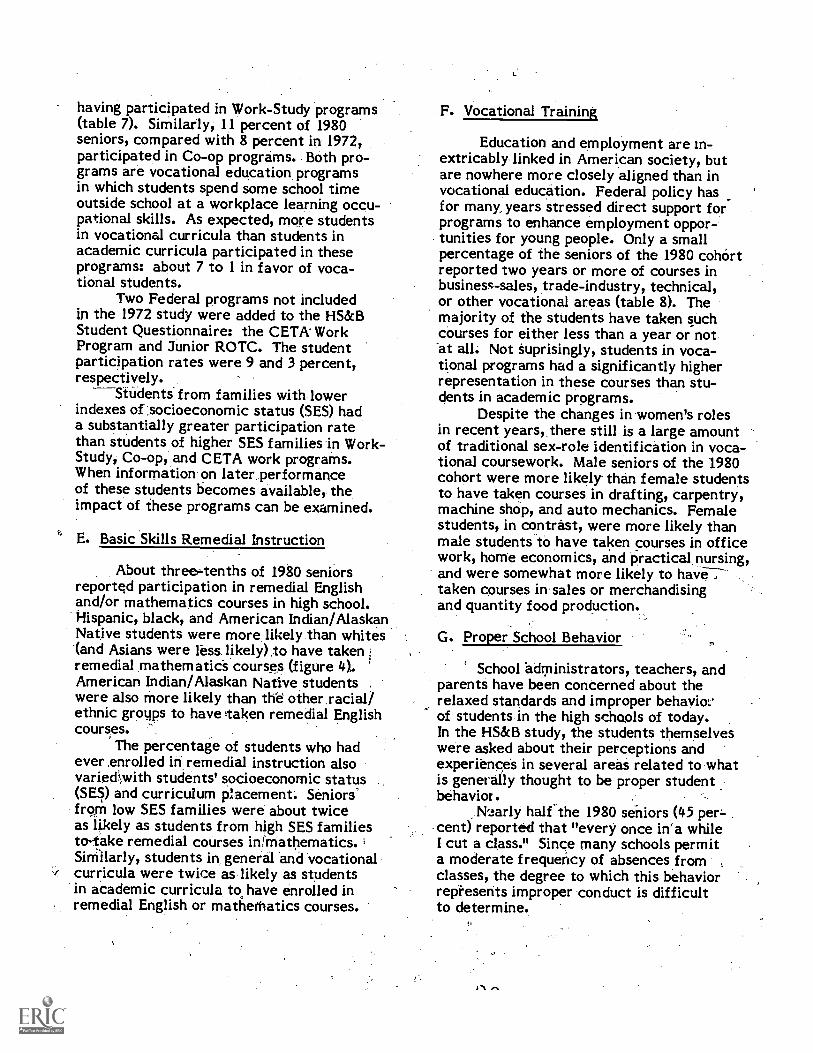
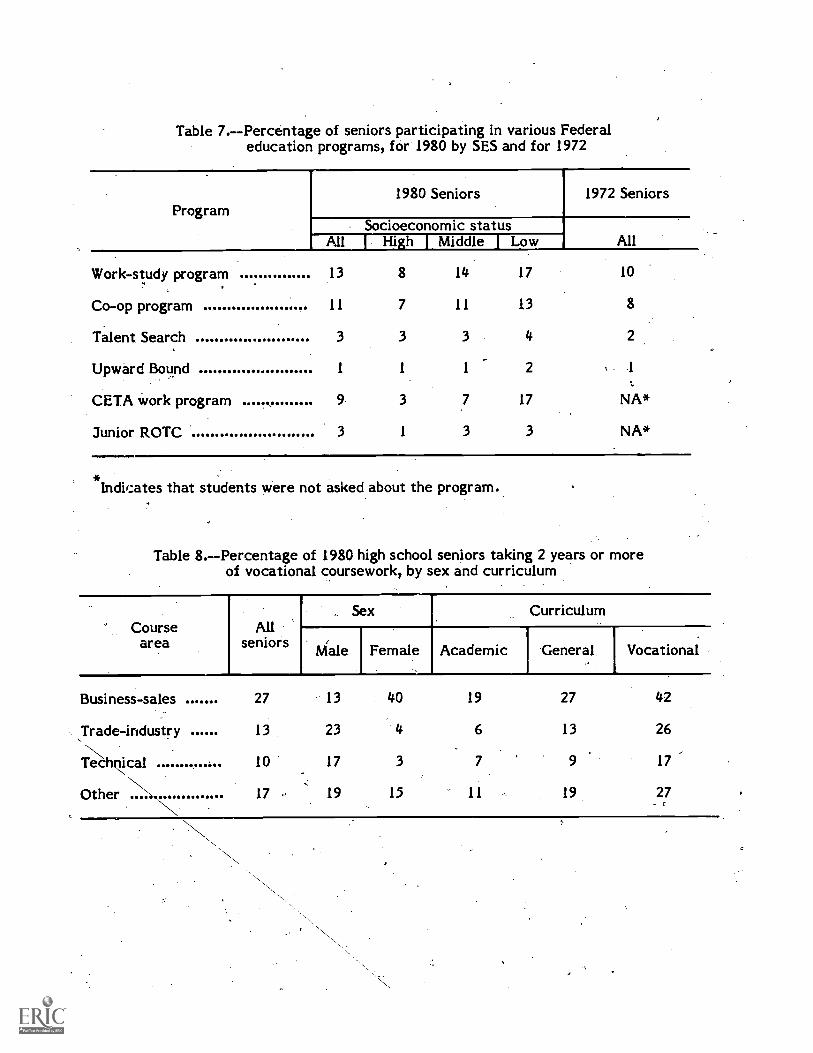
having participated in Work-Study programs(table 7). Similarly, 11 percent of 1980seniors, compared with 8 percent in 1972,participated in Co-op programs. Both pro-grams are vocational education programsin which students spend some school timeoutside school at a workplace learning occu-pational skills. As expected, more studentsin vocational curricula than students inacademic curricula participated in theseprograms: about 7 to 1 in favor of voca-tional students.
Two Federal programs not includedin the 1972 study were added to the HS&BStudent Questionnaire: the CETA WorkProgram and Junior ROTC. The studentparticipation rates were 9 and 3 percent,respectively.
StUdenti from families with lowerindexes of .socioeconomic status (SES) hada substantially greater participation ratethan students of higher SES families in Work-Study, Co-op, and CETA work prograins.When information on later performanceof these students becomes available, theimpact of these programs can be examined.
E. Basic Skills Remedial Instruction
About three tenths of 1980 seniorsreported participation in remedial Englishand/or mathematics courses in high school.Hispanic, black, and American Indian/AlaskanNative students were more likely than whites'(and Asians were less likely), to have takenremedial mathematicS courses (figure 4).American Indian/Alaskan Native students .
were also more likely than th'e other racial/ethnic groups to have oaken remedial Englishcourses.
The percentage of students who hadever. enrolled in remedial instruction alsovaried\with students' socioeconomic status(SES) and curriculum placement. Seniors'from low SES families were about twiceas likely as students from high SES familiesto-take remedial courses in `mathematics.Sinillarly, students in general and vocationalcurricula were twice as likely as studentsin academic curricula to have enrolled inremedial English or mathematics courses.
F. Vocational Training
Education and employment are in-extricably linked in American society, butare nowhere more closely aligned than invocational education. Federal policy hasfor many, years stressed direct support forprograms to enhance employment oppor-tunities for young people. Only a smallpercentage of the seniors of the 1980 cohortreported two years or more of courses inbusiness-sales, trade-industry, technical,or other vocational areas (table 8). Themajority of the students have taken suchcourses for either less than a year or notat all. Not suprisingly, students in voca-tional programs had a significantly higherrepresentation in these courses than stu-dents in academic programs.
Despite the changes in women's rolesin recent years, there still is a large amountof traditional sex-role identification in voca-tional coursework. Male seniors of the 1980cohort were more likely than female studentsto have taken courses in drafting, carpentry,machine shop, and auto mechanics. Femalestudents, in contrast, were more likely thanmale students to have taken courses in officework, home economics, and practical nursing,and were somewhat more likely to havetaken courses in sales or merchandisingand quantity food production.
G. Proper School Behavior
School administrators, teachers, andparents have been concerned about therelaxed standards and improper behavior.of students in the high schools of today.In the HS&B study, the students themselveswere asked about their perceptions andexperiences in several areas related to whatis generally thought to be proper studentbehavior.
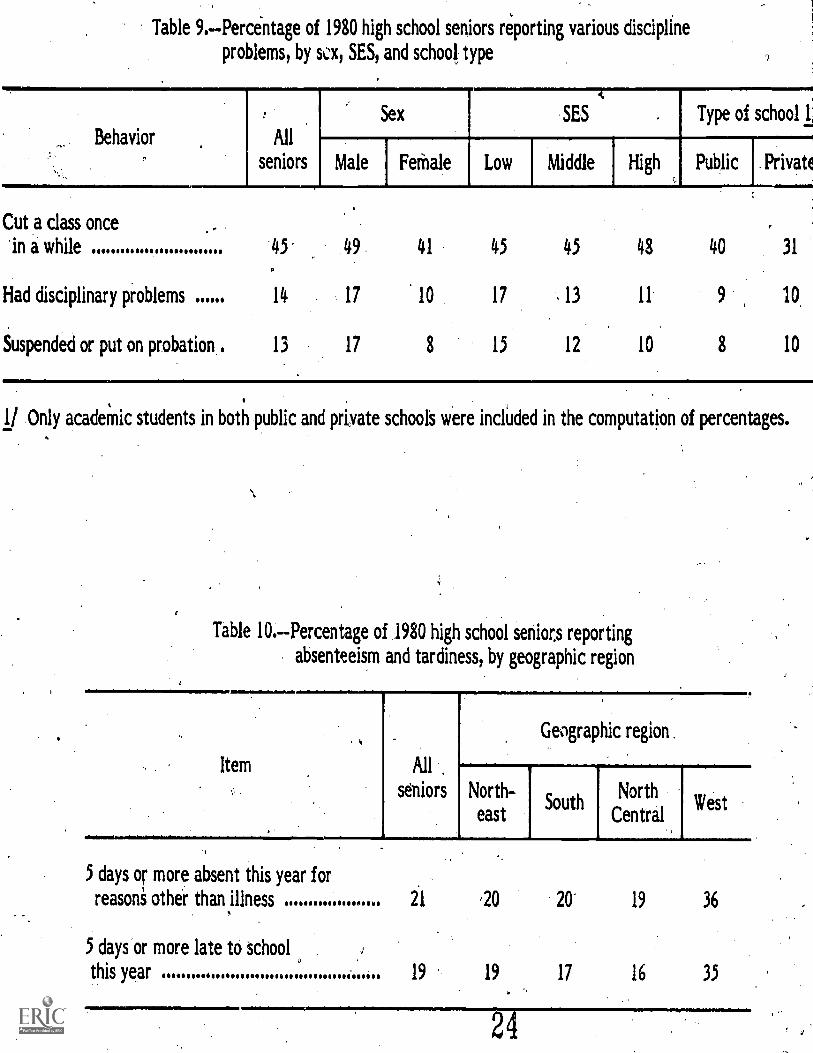
Nearly half.the 1980 seniors (45 per--cent) reported that "every once in'a whileI cut a class." Since many schools permita moderate frequency of absences fromclasses, the degree to which this behaviorrepresents improper conduct is difficultto determine.
Table 7.--Percentage of seniors participating in various Federaleducation programs, for 1980 by SES and for 1972
Program1980 Seniors 1972 Seniors
Socioeconomic statusAllAll 1 High 1 Middle 1 Low
Work-study program 13 8 14 17 10
Co-op program 11 7 11 13 8
Talent Search 3 3 3 4 2
Upward Bound 1 1 1 2 1
CETA work program 9 3 7 17 NA*
Junior ROTC 3 1 3 3 NA*
*Indicates that students were not asked about the program.
Table 8.--Percentage of 1980 high school seniors taking 2 years or moreof vocational coursework, by sex and curriculum
Coursearea
Allseniors
Curriculum
Male Female Academic General Vocational
Business-sales 27 13 40 19 27 42
Trade-industry 13 23 4 6 13 26
Techecal 10 17 3 7 9 17
Other 17 19 15 11 19 27
White
Black
Hispanic
Asian
FIGURE 4.-- Percentage of 1980 high school seniors takingremedial coursework in mathematics and english,
I by racia!;,Ahnic group
American Indian/Alaskan Native
20 40
Percent
Mathematics
60
40
20 40 60
Percent
English
more serious delviations from properschool behaviordisciplinary problems,probations, and suspensions- -were reportedby one out of seven seniors (table 9). Malestudents were more likely than female stu-
'-dents to report cutting classes once in awhile and more serious problems. Morestudents from high SES families than stu-dents from !ow SES families reportedcutting a class once in a while. Studentsof lower SES; however, tended to reportproblems in other disciplinary areas moreoften than students of higher SES back-grounds.
Academic students in both. public andprivate schools reported loWer levels bothof cutting classes and of the more seriousviolations of school standards. Those inprivate schools reported the lowest levelof cutting classes, but the more seriousviolations were about equally frequent inboth types of schools.
Students Are generally, expected bothto attend school and to appear on time unlessthey have a. permitted excuse. .Table 10shows that about a fifth of all seniors werelate to school five days or more this year,and a fifth were absent for reasons otherthan illness five times or more. However,striking differences among the regions of:the U.S. were reported with respect to fre-quent absences dnd tardiness. Studentsfrom the Westfor reasons not yet known--
_are almost twice as likely to report very-frequent absence or tardiness. than are stu-dents from other regions.
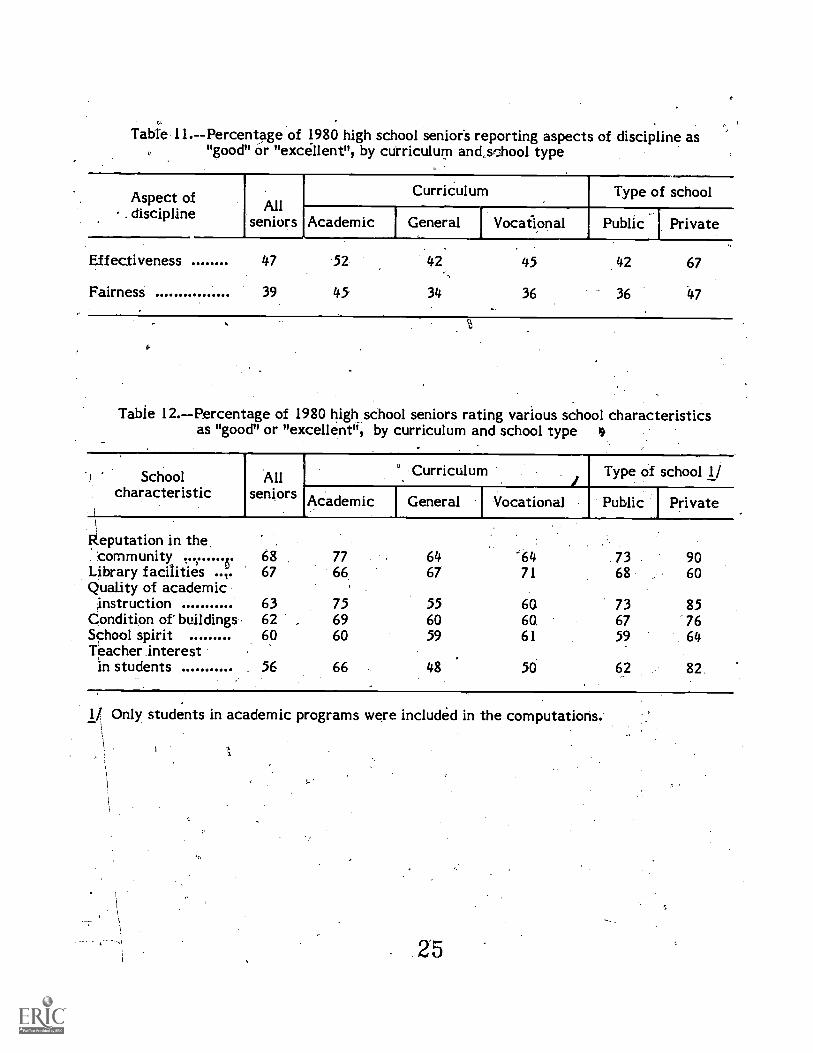
Students apparently shared some ofthe concerns of parents, teachers, and schooladministrator's about proper school behavior.Less than half of all seniors rated theirschools as "good" or "excellent'} in termsof the effectiveness and fairness of disci-pline (table 11). Academic students ratedthe discipline In their schools more favorablthan did students Sin general or vocationalcurricula.
Seniors rated private school disciplinemore favorably than public school discipline;about-four-tenths of the seniors in publichigh schools rated highly the "effectivediscipline" at their schools, while in privatehigh schools, nearly seven-tenths rated the
discipline in their school highly on effective- .
ness. The 1980 seniors in both public andprivate high schools were less positive aboutthe "fairness" of their school's discipline: 36percent of public school seniors and 47 per-cent of,private school seniors rated thediscipline at their school as "good"'or "excel-lent" in fairness.
H. Minimum Competency Test
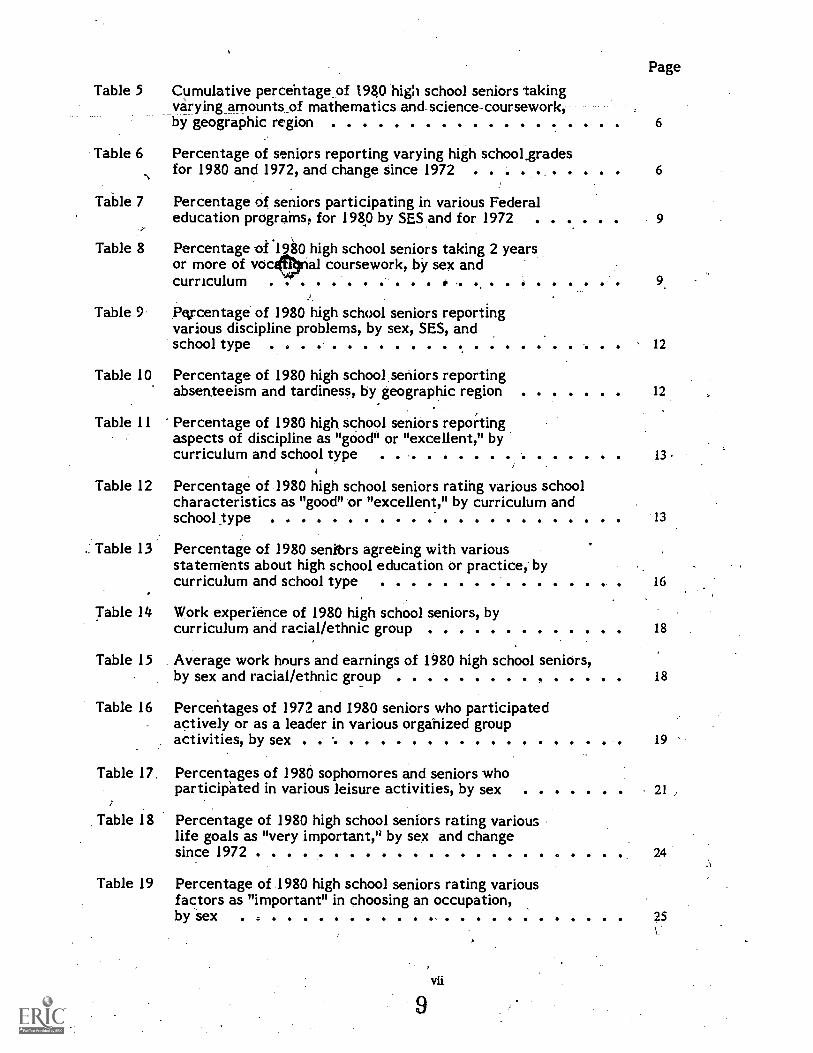
The decline of student test scoresand other indicators of student performancein recent years has led some educators andpolicymakers to favor minimum competencyrequirements for high school graduation.According to HS &B school administrators'reports, about one out of five high schoolsin the nation required their seniors to passa minimum competency test for gr aduation.This requirement, however, varied' signifi-cantly by geographic region. While 37 per-cent of schools in the Northeast and 29percent of schools in the West reportedsuch a requirement, only f5 percent ofschools in the South and 3 percent of schoolsin the North Central had the requirement(figure 5).
Among those schools with minimumcompetency requirements for graduation,two out of three schools had a specific reme-dial.program for students who failed the:test. The availability of such remedialinstructions also depended on the locationof schools. The percentages that had reme-dial programs were 70, 52, 39, and 92respectively, for schools in .the Northeast,South, North Central, and West.
I. Student Opinions of their School
Students develop opinions of theirhigh school based on their experiencesand preconceptions. The HS&B surveyasked 1980 seniors to rate their school(as poor, fair, gopd, or excellent) on itslibrary facilities, quality of instruction,condition of buildings, teacher interestin students, reputation in the community,and school spirit. A majority of the seniors(from 56 to 68 percent) rated each of theseschool characteristics as good or excel-lent (table 12).
Table 9.--Percentage of 1980 high school seniors reporting various discipline
problems, by scx, SES, and school type
Behavior All
seniors
Sex SES Type of school 1;
Male Female Low Middle High
Cut a class oncein a while 45 49 41 45 45 48 40 31
Had disciplinary problems 14 17 10 17 13 11 9 10
Suspended or put on probation 13 17 8 15 12 10 8 10
Public Private
1/ Only academ' ic students in both public and private school's were included in the computation of percentages.
Table 10.--Percentage of 1980 high school seniors reporting
absenteeism and tardiness, by geographic region
1/4
Item All
seniors
Geographic region .
North-east
SouthNorth
WestCentral
5 days or more absent this year forreasons other than illness 21 '20 20' 19 36
5 days or more late to 'school
this year 19 19 17 16 35
AN=
Table 11.--Percentage of 1980 high school senior's reporting aspects of discipline as"good" or "excellent", by curriculum and school type
Aspect of. discipline All
seniors Academic
Curriculum
General J Vocational
Type of school
Public Private
Effectiveness 47 52 42
Fairness 39 45 34
45 42 67
36 36 47
Table I2.--Percentage of 1980 high school seniors rating various school characteristicsas "good" or "excellent", by curriculum and school type 0)
Schoolcharacteristic
Allseniors
Curriculum Type of school 1/
Academic General Vocational Public Private
\Rteputation in the,
community 4 68 77 64 64 73 90Library facilities .4 67 66 67 71 68 60Quality of academic
1/ Only students in academic programs were included in the computations.
ti
25
I
0
FIGURE 5.-Percentage of schools requiring minimum competency tests for high schoolgraduation in 1980, by geographic region
- 40
30-
10-
1
a7
. Northeast
6
.29
15
South North Central
26
West
Students in academic programsgenerally gave higher ratings than studentsin other programs. For example, 77 percentof academic program students, comparedwith 64; percent of students in generalor vocational programs, gave a rating of
'good or excellent on school reputationthe community. Similarly, 75 percent
of academic program students, but only55 percent of general program students
. and 60 percent of vocational students;rated the quality of academic instructionas good or excellent Library facilities,which may be more intportant to the schoolwork of academic students, were lesshighly rated by academic than vocationalstudents. Among academic students thosein private schools gave substantially higherratings of all school characterisitids exceptlibrary facilities. Differences over 10percentage points appeared for "reputationin the community;" "quality of academicinstruction;' and "teacher interest, in
_student's."Student opinions of school character-
istics have changed slightly since 1972.Ratings on "library facilities" and "teacherinterest in students" rose slightly whileratings declined for "condition of buildingsand claisro9ms." "quality of academic _
instructicer and "reputation in the com-;munity."
The HS&B survey also asked 1980seniors their opinions about the allocationof school resources toward meeting theirneeds as students in several areas: voca-tional programs, academic coursework,employment counseling, college counseling,and work experience. A sizable majorityof the seniors agreed that schools shouldhave pLaced more emphasis both ontvoca-tonal programs (70 percent),and on basicacademic subjects (67 percent) (table 13).
/
47
A majority also agreed that their schoolhad provided them with counseling thatwould help them continue their ,schooling(64 percent).
The seniors were less satisfi6d withemployment-related school, programs. Amajority felt that the school did not offerenough practical experience (59 pe5Ont)while a minority felt that the school pro-vided them with counseling that would helpthem find employment (44 percent).- Student opinions varied, however, by
the type of curriculum in which they wereenrolled. For examples more students invocational programs than academic programsagreed that schools should have placed moreemphasis on vocational and technical pro-grams (81 vs. 57 percent) and that schoolsprovided counseling that would help themfind employment (57 vs. 35 percent). Studentopinions.also varied by type of school. Aca-demic program students in public schoolsmore often thought &greater emphasis shouldhave been placed on basic academic subjectsthan did their counterparts in private schools.Academic students in private schools, onthe other hand, more often believed greateremphasii should have been Placed on voca-tional programs than did academic studentsin public schools.
Studerits' perceptions hal .; changedsince 1972, particularly concerning theemphasis they believe high schools shouldplace on academic subjects. While 67 per-cent of 1980 seniors agreed that schoolsshould have placed more emphasis on aca-demic subjects, only about 50 percent of1972 seniors agreed. Whether this differ-ence is attributable to public concern overtest scores, to the "back to basics" move-ment, to actual changes in curriculum be-tween 1972 and 1980, or other factors isnot clear from analyses to date.
tk
Table 13.--Percentage of 1980 seniors agreeing with various statements about highschool education or practice, by curriculum and school type
Statements AllCurriculum Type of school 1/
Academic General Vocational Public I Private
School should haveplaced more emphasison vocational andtechnical programs
School should haveplaced more ei-nphasison basic academicsubjects
School provided mewith counseling thatwill help me continuemy education
School did not offerenough practicalwork experience
School provided mewith counseling thatwill help me findemployment
70 57 75 81 55 63
67 67, 67 65 72 48
64 67 58 61 66 , 69
59 52 63 60 50 65
44. 35 43 57 36 , 30
1/ Only academic students were included in the computations.
CHAPTER II. ACTIVITIES OUTSIDE OF SCHOOL
This section presents some basic find-ings about student activities outside ofschool, including working for nay, partici-pating in organized group activities (suchas athletics and church groups), and otherinformal, leisure-time pursuits.
A. Working'for Pay
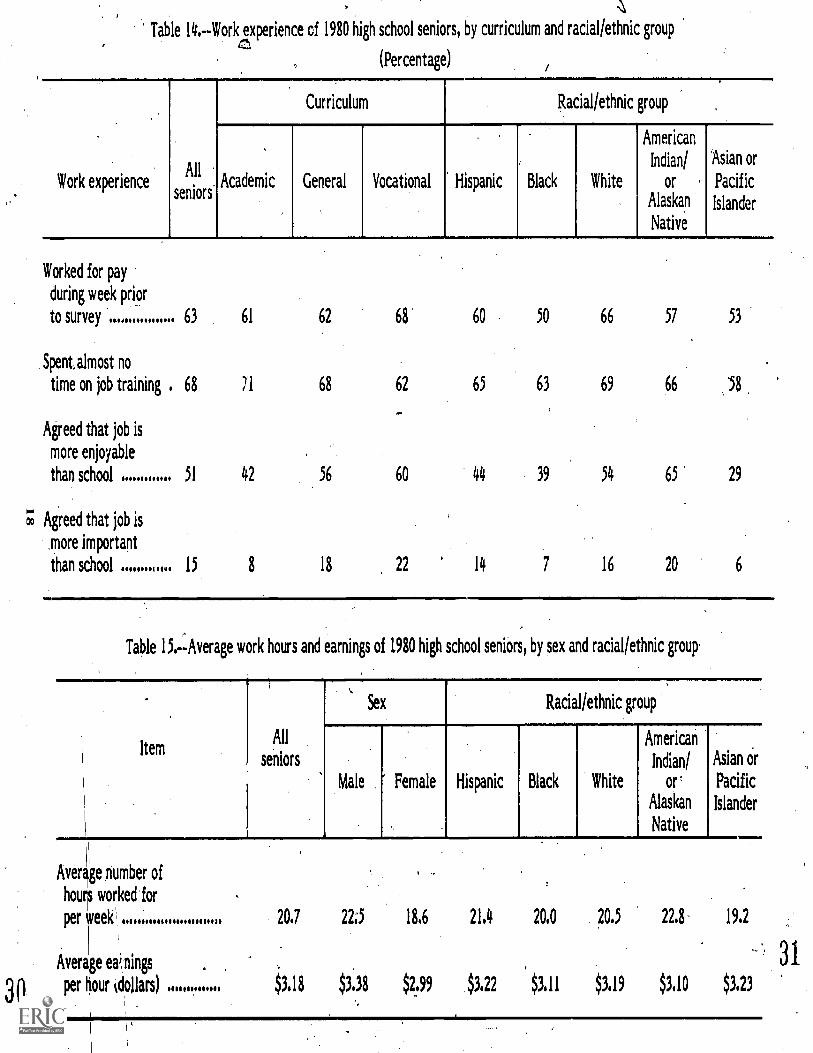
Over two- fifths of the sophomores(42 percent) worked in the week beforethe survey, while over three - fifths (63 per-cent) of the 1980 seniors worked (table 14).Students in a vocational curriculum weremore likely.to work than students in generaland academic curricula (68 percent comparedto 62 and 61 percent, respectively). Amongracial/ethnic groups, whites were most likelyto be working (66 percent) and blacks leastlikely to be working (50 percent). Maleseniors were somewhat more likely thantheir female classmates to be working (6percentage points); this difference wassmaller for whites (4 percentage points)than for other racial/ethnic groups.,
The jobs that high school seniors heldvaried a good deal in the amount of time.spent on training, but about two-thirds ofthe seniors held jobs in which they reportedspending almost'no time in training. Studentsin a vocational curriculum were somewhatmore successful than others in receivingsome job training (38 percent compared with29 and 32 percent in academic and generalcurricula). Differences between males andfemales and among racial/ethnic groupswere also small.
Students were asked to compare howthey felt about their jobs with how theyfelt about school. About half of the seniorsagreed that their jobs were more enjoyablethan school. This attitude varied by highschool program: two-fifths of the seniorsin the academic curriculum found theirjob more enjoyable than school, while aboutthree-fifths of those in a vocational programenjoyed their job more than school. Hispanicsand blacks were less likely, and Asians muchless likely, than whites to enjoy their jobmore than school.
Jobs were considered more impc.tantthan school by a small minority of the seniors
17
29
(15 percent). For vocational students, whoare less likely to continue their schoolingafter high school, this attitude was muchmore prevalent than for academic students(22 percent compared with 8 percent, re-spectively). Blacks and Asians were theleast likely of the racial/ethnic groups toplace more importance on their jobs thanschool (7 and 6 percent, compared to 16percent for whites).
Some have argued that the Federalminimum wage exacerbates the problemof youth unemployment. While space does'not, permit this report to address the com-plex issues involved in this argument, thisreport can describe the distribution of *agesaround the Federal minimum wage ($3.10at the time of the survey). The seniorsworked, on the average, 20.7 hours andearned $3.18 per hour, only 8 cents an hourabove the minimum wage (table 15). Aboutfours tenths of the seniors and seven-tenthsof the sophomores earned less than $3.10per hour.' Larger proportions (69 percentof the seniors and 82 percent of the sopho-mores) reported that they would be willingto work for less than minimum wage whilestill in high school. The difference in earn-ings between young men and, young womenwas fairly large. Young women earned awage rate that was 88 percent of that earnedby young men and 11 cents below the mini-mum wage.
The differences in hours worked andpay rates airiong racial/ethnic groups werenot as large as the differences betweenmales and females. Hispanics, whites, andAsians received the highest pay rates ($3.22,$3.19, and $3.23 compared to $3.11 and$3.10 for blacks and American Indians);Hispanics and American Indians, workedslightly longer hours than the other racial/ethnic groups.
B. Organized Group Activities
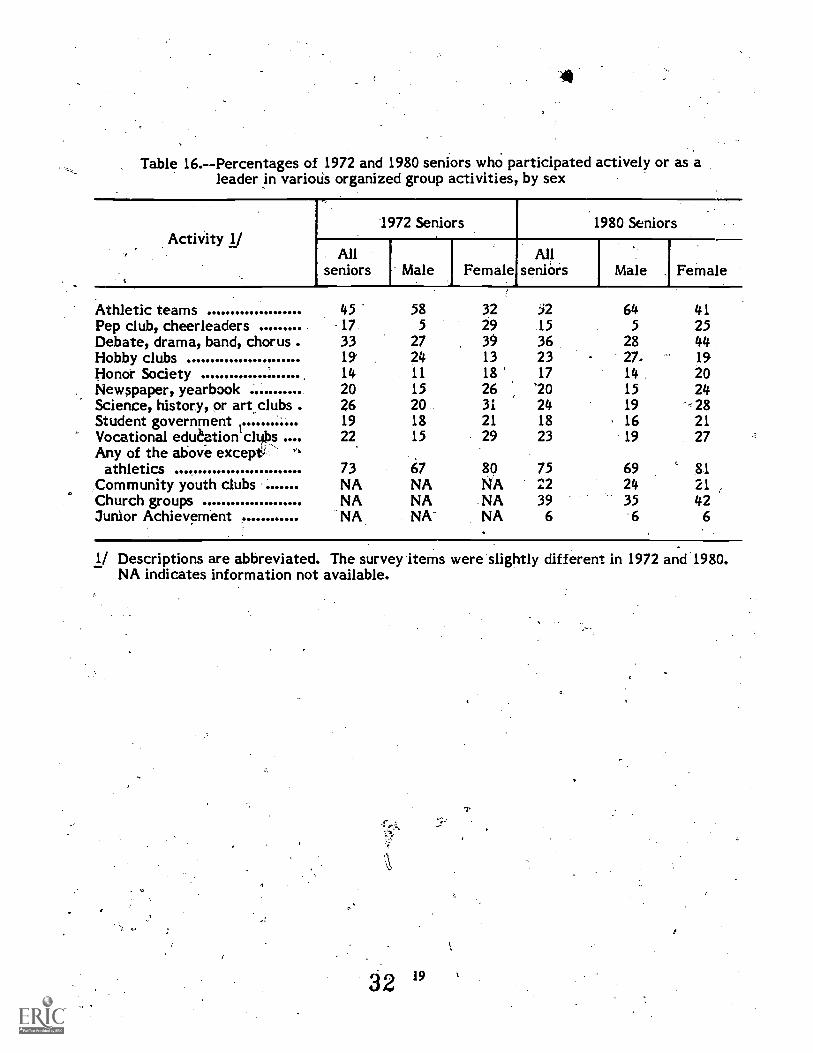
When high school seniors are not busywith school or work, they use their time ina variety of leisure activities. Table 16reports on participation in organized groupactivities that appeal to the many differentinterests and pursuits of young people.
3These pay rates may not necessarily violate Federallaws since Federal requirements are not universal; they applyto the more regular, structured kinds of employment in whichthe majority of seniors worked.
Table 14.--Work experience cf 1980 high school seniors, by curriculum and racial/ethnic group
(Percentage)
Work experienceAll
seniors"
Curriculum Racial/ethnic group
Academic General Vocational Hispanic Black White
American
Indian/
or
Alaskan
Native
Asian or
Pacific
Islander
Worked for pay
during week prior
to survey .. 63 61 62 68 60 50 66 57 53
Spent, almost no
time on job training 68 71 68 62 65 63 69 66 58
Agreed that job is
more enjoyable
than school 51 42 56 60 44 39 54 65 29
; AD Agreed that job is
more important
than school ........ , 15 8 18 22 14 7 16 20 6
30
111.1Y1.1I lillbl.0171111111.
Table 15.--Average work hours and earnings of 1980 high school seniors, by sex and racial/ethnic group.
Item
Raciallethnic group
All
seniors
Male Female Hispanic Black White
American
Indian/
or
Alaskan
Native
Asian or
Pacific
Islander
Aver* number of
hou worked for
per eekl'l 20.7 22.5 18.6 21.4 20.0 20.5 22.8 19.2
Community youth clubs NA NA NA 22 24 21Church groups NA NA NA 39 35 42Junior Achievement NA NA- NA 6 6 6
1/ Descriptions are abbreviated. The survey items were slightly different in 1972 and 1980.NA indicates information not available.
r
19
Athletic activities are the most popular,with about half of all seniors in 1980 par-ticipating (52 percent).: Since the wordingof ti` e athletic participation items changedslightly from 1972 to 1980, the apparent7 percentage pointincrease shown in thetable (from 45 to 52 percent) may not re-flect the true extent of change. In both1972 and 1980, a larger proportion of malesthan of females participated in sports (64percent compared with 41 percent in 1980).Despite increased attention on female par-ticipation by the media, the courts, and the
- legislatures, the large gap between the sexeshas decreased only slightly, from 26 percent-age points to 23 percentage points. Theproportion of females who .are Organizedspectatorsthe cheerleaders, 'pep clubmembers, and majoretteshas decreasedslightly from 29 to 25 percent; while thesmall proportion of males in this categoryhas remained stable at 5 percent.
Every other school-organized groupactivity except hobby clubs ("such as photog-raphy, model building, hot rod, electronics,[and] crafts") shows the reverse pattern:young women participate.more frequentlythan young men. While three-quarters ofall seniors in both 1972 and 1980 participatedin at least 'one of the non-athletic school-organized activities listed in table 16, youngwomen were more likely to participate insomething than young men (by 12 percentage
_ points in 1980, about the same as 1972).Actiiiities organized outside the school
_.20r
also attract substantial numbers of seniors.After athletics, church activities were thesecond most trpopular organized activity,with nearly two-fifths of the 1980 seniorsparticipating. Community youth groups,such as the YMCA, the Scouts, and Boy'sClubs, recruited about a fifth of the 1980seniors as active participants.
C. Other Leisure Activities
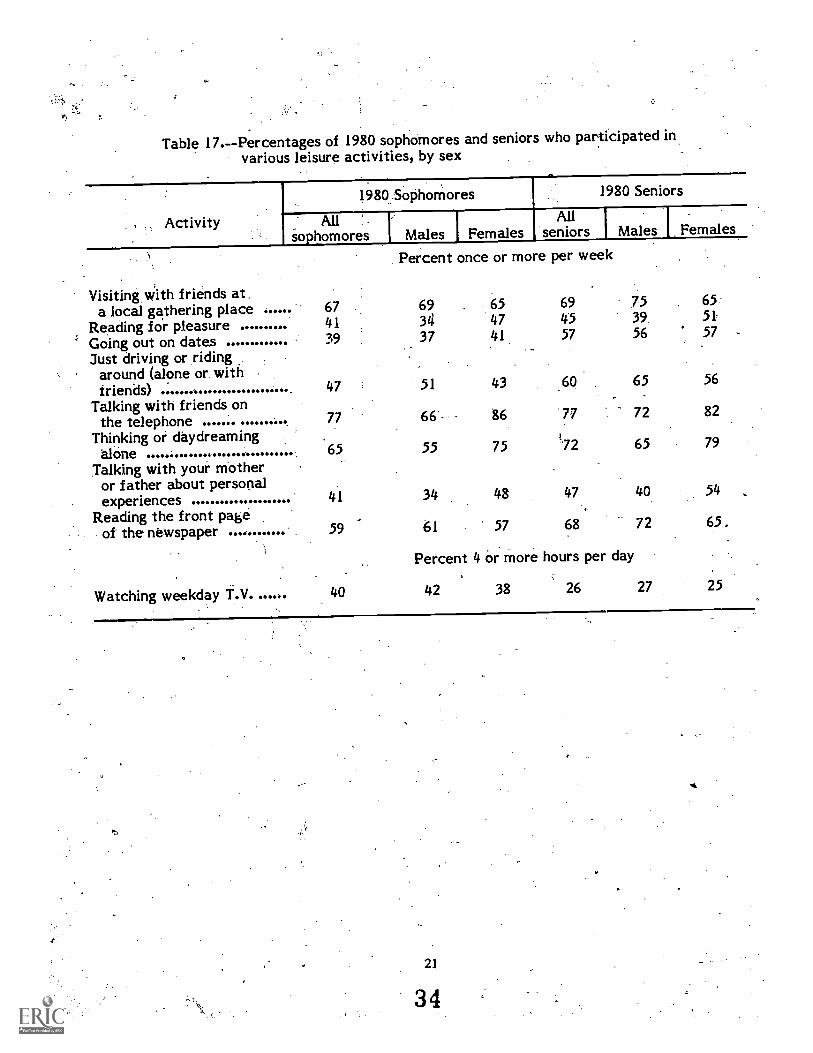
Besides schoolovork, and organizedgroup activities, high school students spendtheir time in a-variety of informal, leisure-time pursuits. As the students grow older,some pursuits become more popular: thefraction who go out on dates once a weekor more increased from two-fifths for sopho-mores to three-fifths for seniors, and thosewho drive around in cars once a week ormore increased from about frve-tenths tosix - tenths of the students (table 17). Onthe other hand, one major, time-consuming-pursuit became less popular: the percent-age watching four hours or more per dayof weekday teleVision decreased from 40
\-percent to 26 percent.Some activities, like reading for plea-
sure, talking with friends on the telephone,and talking with parents about personal ."
experiences, were engaged in more frequent-ly by females than males. Visiting withfriends and reading the front page of thenewspaper were found to be more frequentamong males than females.
33
Table 17.--Percentages of 1980 sophomores and seniors who participated in
various leisure activities, by sex
Activity
1980 Sophomores 1980 Seniors
All :-Sophomores Males I Females
Allseniors I Males Females
Visiting with friends at.
Percent once or more per week
a local gathering place 67 69 65 69 75 65
Reading for pleasure 41 34 47 45 39 51
Going out on dates 39 37 41 57 56 57
Just driving or ridingaround (alone or withfriends) 47 51 43 60 65 56
Talking with your motheror father about personalexperiences 41 34 48 47 40 54
Reading the front pageof the newspaper 59 61 57 68 72 65.
Percent 4 or more hours per day
Watching weekday T.V. 40 42 38 26 27 25
21
34
CHAPTER III. VALUES AND ATTITUDES
As young people make the transition.trom school to adult life, they make a num-ber of decisions with important consequencesfor their future. Their life goals, personalvalues, and attitudes are important elementsin their choice. This section details thethings that 'are important to 1980 seniorsin planning their lives, the factors that areimportant to them in choosing an occupa-tion, and their preferences with regard toa hypothetical national service program.
A. Life Goals
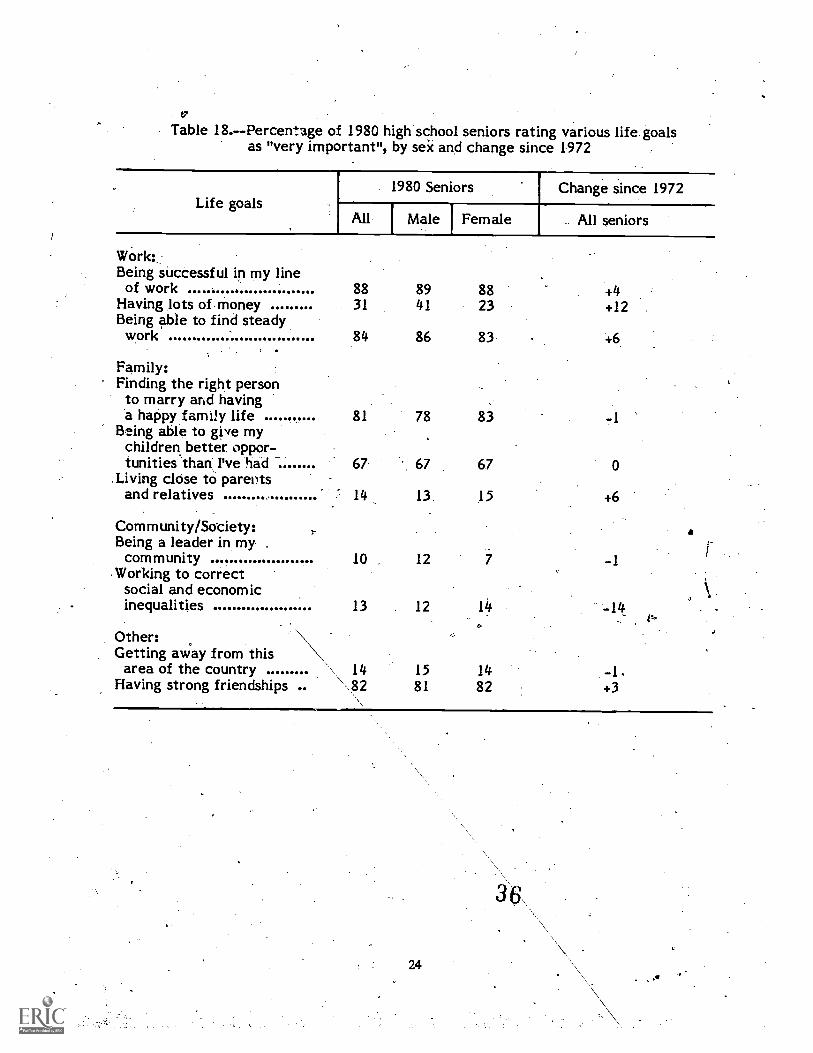
Some goals are more important thanothers to high school seniors in planningtheir careers and family lives. The HS&Bstudy presented a list of goals to the 1980seniors. Four items on the list were clearlymore important than the rest; they wererated "very important" by more than f our-fifths of the seniors. "Being successful inmy line of work" and "being able to find
-steady-work" were very important to thelives of 88 and 84 percent of the 1980seniors respectively (table 18). "Havingstrong friendships" and "finding the rightperson to marry and having a happy familylife" were also very importapt to mostseniors (82 and 8-1 percent, respectively).The ratings of these four items were quitesimilar for male and female seniors, al-though slightly more females than malesvalued-a happy family life and strong friend-ships, while .the reverse was true of thework-related items.
Items that were very important to asmall proportion of the 1980 seniors included"living close to parents and relatives," "beinga leader in my community," "working tocorrect social and economic inequalities,"and "getting away from this area of thecountry." Sex differences were generallysmall, though young women were less eagerfor a leadership role (5 percentage pointsless than males), and a good deal less worriedabout having lots of money (18 percentagepoints, less than males). The importanceof the items on the list followed about thesame order for, the 1972 seniors as for the1980 seniors. However, the 1980 seniorsplaced relatively greater importance on
0'
"having lots of money" (31 vs. 19 percent)and "living close to parents and relatives"(14 vs. 8 percent). Interestingly, "workingto correct social and economic inequalities"was less -often viewed as, important by 1980seniors than by 1972 seniors (13 vs. 27 per-cent).
B. Factors in Occupational Choice
At this stage of their lives, Most`highschool seniors make general decisions aboutgroups of possible careers, rather than spe-cific choices among job offers. Their careerdecisions are based in part on the importancethey ascribe to a number of factors. TheHS&B study presented to the 1980 seniorsa list of six factors that could be importantin determining the kind of work they planto do for most of their lives. One factorstood out for four-fifths of the seniors;86 percent reported that "work that seemsimportant and interesting to me" was avery important factor (table 19). Aboutthree-fifths of the seniors rated each ofthe next three.items as very important:"meeting and working with sociable friendlypeople" (66 percent), "freedom to makemy own decisions" (62 percent), and "jobsecurity and permanence" (58 percent).
. Several sex differenCes appear in theimportance assigned to factors in occupa-tional choice, though-these differences arenot large enough to affect seriously therank ordering among the factors. Female .
students more frequently gave "very impor-tant" ratings than male students to twofactors: "meeting and working with sociablefriendly people" (73 percent vs. 58 percent),and "work that seems important and inter-esting" (89 percent vs. 81 percent). In con-trast, more male students than femalestudents considered "good income to startor-within a few yeart" very important.
C: National Service
Today, public policy discussions con-_ cern recruitment into military service andthe possible resumption of the draft.. Theattitudes of those young people who aredirectly affected-by such efforts are of
23 35
Table 18.Percentage of 1980 high school seniors rating various life goalsas "very important", by sex and change since 1972
Life goals
Work:Being successful in my line
of workHaving lots of moneyBeing able to find steady
work
Family:Finding the right personto marry and havinga happy family life
Being able to give mychildren better oppor-tunities.than I've had
Living clOse to parentsand relatives
Community /Society:Being a leader in my
communityWorking to correct
social and economicinequalities
Other:Getting away from this
area of the countryFlaying strong friendships
1980 Seniors Change since 1972
All Male Female All seniors
88 89 88 +431 41 23 +12
84 86 83
81 78 83
67 67 67 0
14 13. 15 +6
10 . 12 7 -1
13 12 14 -14
14 15 14 -1.\\82 81 82 +3
24
Table -19.--Percentage of 1980 high school seniors rating various factors as"important" in choosing an occupation, by sex
Factor J All seniors J Male Female
Work that seems important andinteresting to me 86 81 89
Meeting and workihg withsociable friendly people . 66 58 73
Freedom to make my own decisions .. 062 61 63
Job security and permanence 58 17. 58 58
Good income to start or withina few years 46 . 48 43
Previous work experience in the area . 31 30' 43
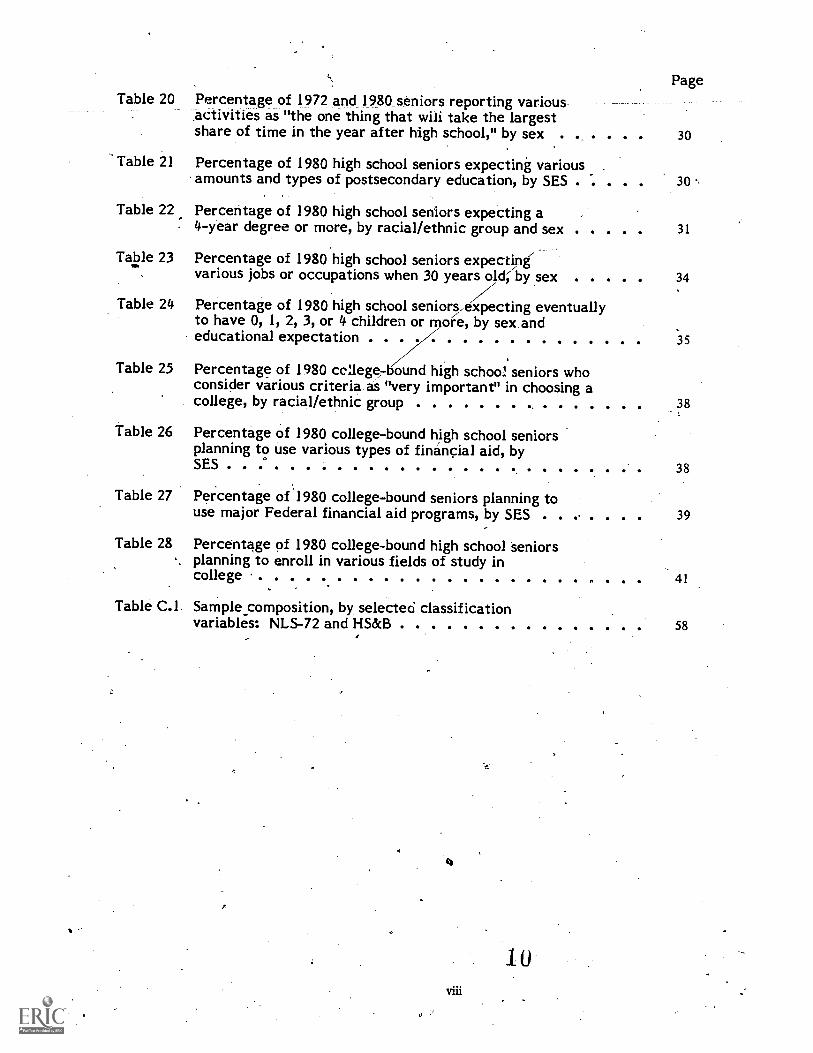
special interest. The HS&B survey askedhigh school students, "If there_ were a pro-gram of compulsory two-year service afterhigh school, with options of military serviceor community service as listed below, whatwould you most likely 'do?" For both sopho-mores and seniors, the most frequent re-sponse was "undecided between the optionsproposed" (30 percent seniors and 39 percentsophomores). Twenty-four percent of thesophomores and 30 percent of the seniorsreported that they would attempt to avoidboth options. Sophomores were somewhatmore likely than seniors to choose militaryservice.
Approximately the same percentageof both males and females were undecidedor would attempt to avoid either option(figure 6). Among those who expresseda preference, however, males were morelikely to choose military service (26 percentcompared with 11 percent) and femaleswere more likely to choose a non-military,public service option. The preferencesregarding national service did not differsubstantially among subgroups defined bysocioeconomic status, curriculum place-ment, or racial/ethnic group.
FIGURE 6.-- Percentage of 1980 high school seniors expressingvarious preferences about national service, by sex
Public service
0 10
Male
27
20
Percent
Female
30
I
CHAPTER IV. PLANSIOF HIGH SCHOOL'SENIORS \ 1
,
\High school )7raduation. Is a key tran-,
sition event in-the-lives 'of young adults.For many; it represents the transition fromadolescence to adulthood. Although themajority of seniors had job experienceswhile still in high schoOl and may have longknown whether they would. attend college,many decisions and choice are made at
/1this time as they embark,u n various courses,leading to additional education and training,occupational careers, and \the formationof their own families. '.'\
This section describes what seniorsplan to do the first year after 'leaving highscht 1, what their long-range Occupationalgoals .are, when they expect to marry andhave their first child, how rnany\childrenthey expect to have, how much stsecond---:ary education they plan to obt in and atwhat age they expect tocomplete theireducation. I
,A. Short-Range Plans
I
Seniors in' both 1972 and 1980 vAereasked, "What is the one big thing that\mostlikely will take the largest share of .yoUrtime in the year after you leave high school?"The pattern of responses for 1972 d 180are quite similar (table 20). About thehe Samepercentage from each class, planne to pUrsue.academic coursework; however, the, 1980\group shifted slightly away from 2-year ',
to4-year colleges. More planned to we k',full!-time than was the case in 1972; and,api.?arently reflecting the increasing ratof women entering the labor force. the per.cent te of females planning to t..d; full-time,hoMf.nakers dropped from 6.to 2 percent.
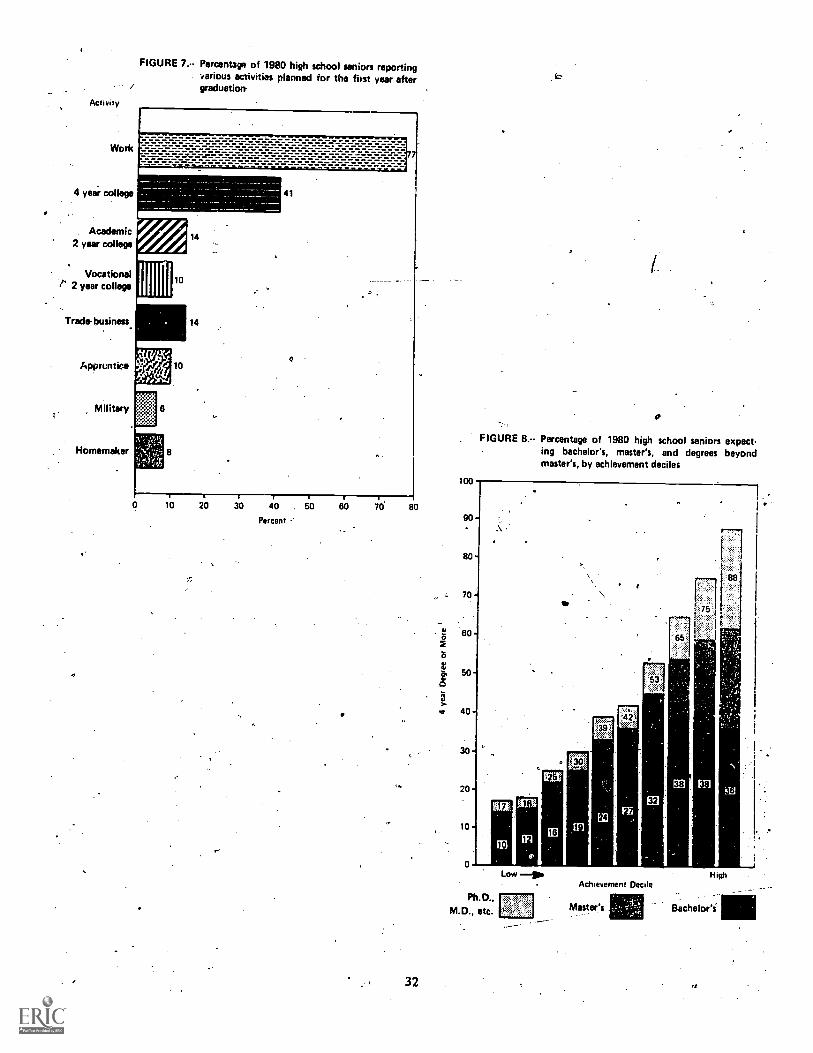
Most persons planned to engage inr .u, , than one activity. For example, many' .college students also planned.to work. The.1980 seniors were asked, "What other things',do you now plan to do after you leave.col-lege?" By combining the.information fromthis question with other responses aboutthe primary activity, it was found that 77percent planned to work as either theirpriwary or secondary activity .(figure 7).In delition, many more persons planned'to °obtain various kinds of postsecondaryschr,:ling and job training than.,v;uld appear
to be the case from table 20
B. Long-Range Plans
In this section, the long-range plansof 1980 seniors are examined in three areas:plans for postseCondary education, occt.apa-,tional goals, and family formation.
1. Postsecondary Education. About 80percent of all seniors planned to get somekind- of postsecondary education :. 19 percent,schooling_at i'vocational,.trade, or Businessschool; 15 percent, some college.educationshort of a 4-year degree; 26 percent, a. 4- or5-year degree; and 20 percent, an advanceddegree. Educational, plans are highly asso-dated with students' socioeconomic back-grounds (table'21Y. lmost three times as
"many seniors from the, high SESsroup asfrom the low SES group planned to finishfour years or more of postsecondary edu-dation (76 vs. 26,percent.) -
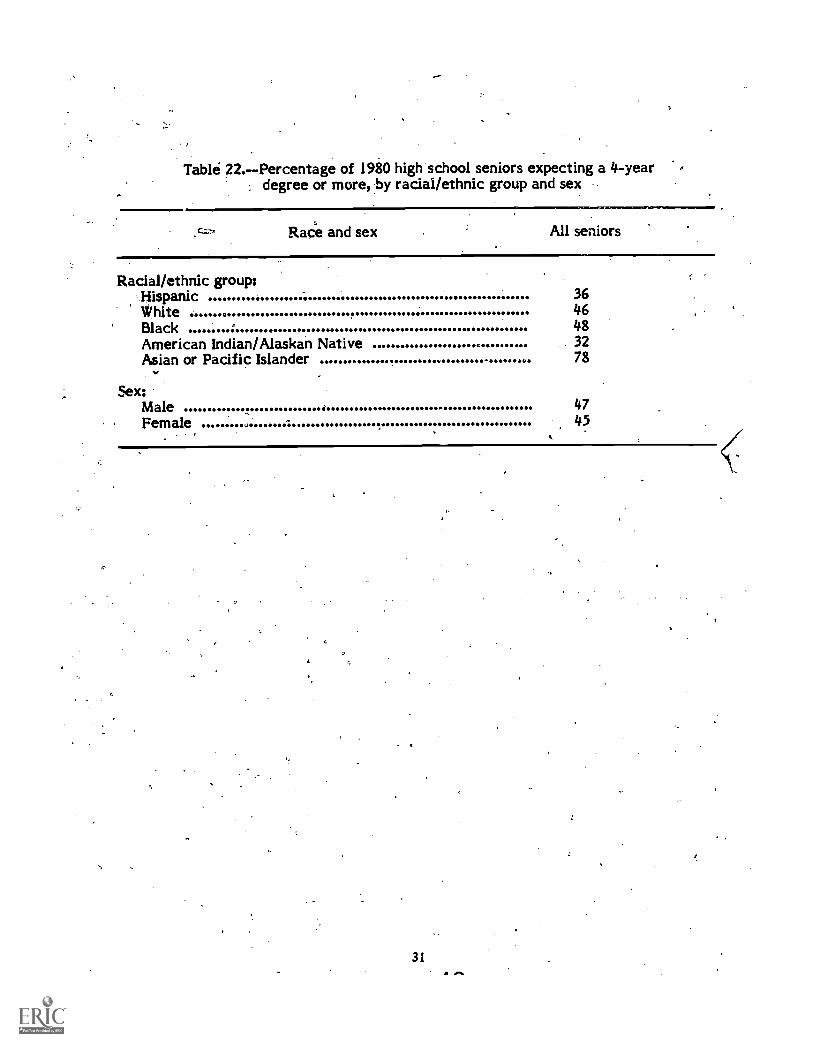
College plans varied little betweenthe sexes. The perceritages of rnaleS andfemales planning to obtain a 4-year degreeor more were about same (47 vs. 45percent). The` percentages of Whites and .
blacks planning to'achieVe this level of edu-cation did, not differ bymuch"(46 vs. 48percent).' But there were large differPncesamong the other minority groups, rangingfrom only 32 percent for American Indianst )o.78per cent for Asians (table, 22 .
College degree expectations varyconsiderably by academic achieveMe0level, as measured by the HS&B test battery. (figure 8).. Fully 88'pexcent of the1980 seniors in the highest achievementdecile, compared to only 17 percent ofthose in the lowest decile, expected tocomplete a 4-year bachelor's degree or amore advanced degree._ Over half (52 per-cent) of, those in the highest achievementdecile expected to complete an advanceddegree beyond the bachelor's level.,
2. Occupational Goals -Seniors wereasked to indicate which of 17 categoriescomes closest to describing the job or occu-pation they expect to have when they. are30 years old. About 13 percent planned tobe dentists, physicians, lawyers, scientists,
29
40
Table 20.Percentage of 1972 aigi 1980 seniors reporting various activities as"the one thing that will take the largest share of time in the yearafter high school", by sex
FIGURE 7.- Percentage of 1980 high school seniors reportingvarious activities planned for the first year aftergraduation
Academic2 year college
VocationalP 2 year college
Tradebusiness
Apprentice
Military
Homemaker
0 10 20 30 40 50 80
Percent
80
100
90
O
FIGURE 8. Percentage of 1980 high school seniors expecting bachelor's, master's, and degrees beyondmaster's, by achievement deciles
0ter
75
56' 8026
a50
I40
30
20
10
32
53
,42"
38
32
4
18
Low -p.
Ph.D.. F.77.71M.D., etc. V
Achievement Decile
Master's
High
Bachelor'i
and members of other professional occupa-tions that generally require an advanceddegree (table 23).
In 1980 there were still very pro-nounced sex differences in planned occuix',-tons. About 39 percent of-the males (versusonly 7 percent of the females) planned tobe in one of the following seven categories:craftsman, proprietor or owner, farmeror farm-manager, laborer, military, oper-ative, or protective service. On the otherhand, only 3 percent of the males (versus29 percent of the females) planned to bea school teacher or in &clerical or. serviceoccupation. Future surveys will assess theextent to which occupational plans are ful-filled, whether aspirations tend to rise orfall in response to later experiences, andthe extent to which the sex differencesindicated in'table 23 persist.
3. Familx Formation. The traditionalsequence of major life events for youngadults is generally: completing full-timeeducation, then getting married, and finallyhaving children. While unforeseen eventsmay result in changes from this typicalsequence, most 1980 seniors conformedwith it in reporting their plans for thefuture.4
The ages at which seniors planned tofinish their full-time education, get married,and have their, first child varied considerably,depending on their educational plans. Malesexpected to get married and have children
11,
33
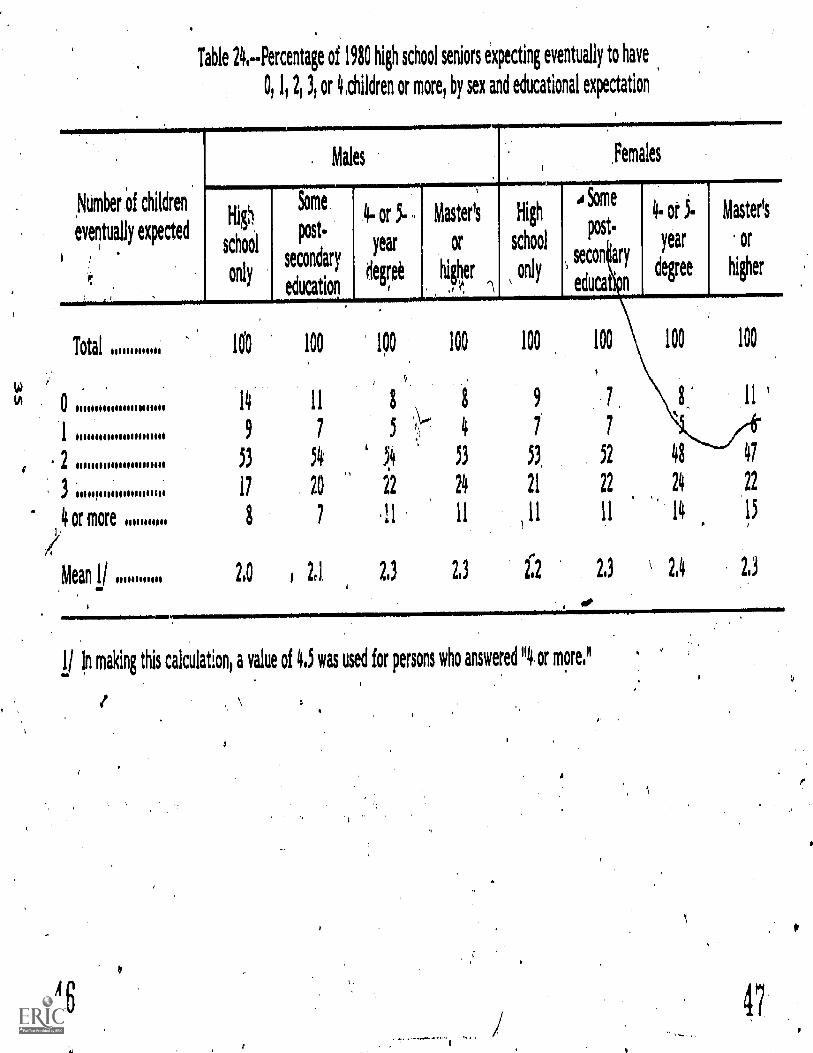
later than females, whatever the level ofeducation planned (figure 9). But the moreeducation planned, the later in life bothmales and females planned to get marriedand start having children. This tendencyis stronger for females than for males:females who planned to get an advanceddegree expected to get married four yearslater than those who planned to stop witha high school diploma; for males this dif-ference was only two years. The moreeducation planned, however, the shorterthe lag between completion of full-timeeducation and marriage and parenthood. '-For example, on the average, males whoplanned to get an advanced degree intendedto marry only 1.3 years after receiving theirdegree. By comparison, males not planningany postsecondary education expected adelay of 4.9 years from school completionto mariiage. While postsecondary educationdelays the planned ages of marriage andhaving a first child, males and femalesplanning to finish college intended eventu-ally to have at least as many children asthose who did not plan to finish college(table 24).
. Followup HS&B surveys over the nextdecade will gatherYdata on the actual timingof the major life events of this group of1980 seniors. This information will enableanalysts to determine how many young adultsdepart from their plans and to investigatethe effects of family formation and educa-tional attainments on one another.
4More males than fimalis did not expect to marry at all(15 percdnt compared with 6 percent) and did not expect to haveany children (18 percent compared with 11 perCent). These seniorsWere excluded from the median age computations reporte in.figure9..
Table 23.--Percentage of 1980 high school seniors expecting variousjobs or, occupations when 30 years old, by sex
Job or occupation category Allseniors Male' Female
Total
Professional (except school teacher):Advanced degree normally required 1/Advanced degree not normally required 2/ ....
Predominance of females:Clerical 10 1 17School teacher (elementary or secondary) 4 1 6Service 3 1 6Homeinaker or housewife only 3 0 5Sales or not working 3 _ 3 4
1/ Examples given in questionnaire were "clergyman, dentist. ohysician, lawyer,, scientist, college teacher."
2/ Examples given in questionnaire were "accountant, artist, registered nurse, engi-neer, librarian, writer, social worker, actor, actress, athlete, politician, but notincluding school teacher."
eventually
Of children
everitually expected
Table 24.Percentage of 1980 high school seniors expecting eventually to have
0, 1, 2, 3, or 4 thildren or more, by sex and educational expectation
Males
High
school
only
Some
post-
secondary
education
or 5- Master's
year or
degree higher
High
school
only
Females
A Some
post-
, secon ary
education
4- or 5-
year
degree
Master's
or
higher
Total ............. 10'0 100 100 100 100 100 100 100
0 11111111111111110111111 14 11 8 8 9 7 8 11 '
1 9 7 5 4 7' 7
. 2 53 54 53 53, 52 48 47
3 111114111111111101IIIM 17 20 22 211 21 22 24 22
4 or snore ofilmspii 8 7 11 11 11 1 11 15
Mean 1/ 2,0 11 13 13 2:2 2.3 ' 2.4 13
In making this calculation, a value of 4.5 was used for persons who answered "4 or more."
A
46
FIGURE 9.-- Median ages at which 1980 high school seniorsplanned to finish full-time education, get married,and have first child, by sex and level of educa-tional expectation
Males
22.5
23.9 .
23.1
23.7
24.6'
25.2
25.0
25.5
26.2
27.0
Finishfull-timeeducation
18 20 22 24 28 28Age
High schooleducation only
So.mepostsecondaryeducation
Sa
Females
18.1
22.2
Getmarried
Have
firstchild
20.5
22.1
23.5
23.6
24.6
1 23.2
18 20 22, 24 26 28
Educational Expectation
4-or 5-yeardegree
36
Age
Master's orhigher degree
48
CHAPTER V. PLANS FOR COLLEGE
After leaving high school, over halfof the 1980 seniors intend to make anothermajor life transition by entering college.As seniors, the college-going group beganto make their plans more specific by evalu-ating colleges they might want to attend,by deciding to apply to selected colleges;by informing themselves about financialaid programs that could help pay for theircollege expekses, and,by choosing a fieldof study. This section describes the morespecific plans of those 1980 seniors whoplanned to-attend a 2-year or 4-year collegeeither full-time or part-time in the yearimmediately after high school.
A. Criteria for Choosing a College
The 1980 seniors who intended to goto college in the year after high school wereasked to rate the importance of seven cri-teria that could be used in choosing a college.The criterion considered very important bythe largest group of people was the "avail-ability of specific courses or curriculum,"cited by 70 percent-of the respondents(table 25). The next most frequently re-ported criteria were "reputation of thecollege in academic aveas" (55 percent)and two items describing the net cost ofcollege to the students: availability of finan-cial aid (38 percent) and college expenses(36.percent).
The relative importance of these cri-teria varied quite a bit by racial and ethnicgroup. For blacks, Hispanics, and AmericanIndians /Alaskan Natives, the items describ-ing the net cost of college were more oftencited as "very important" in choosing a col-lege to attend than they were for whitesand Asian- Americans/Pacific Islanders.
B. Plans to Use Financial Aid
Programs for financing college attend-ance have been a major focus of educationpolicy during the past decade. Their signi-ficance to students is underscored by thefact that over seven-tenths of the 1980college-botind seniors (73 percent) expectedto use some type of financial aid, and nearlysix-tenths of the college-bound seniors (59
percent) specifically expected a scholar Chipor grant (table 26). Reflecting the factthat much of this aid is need-based, moreof the low SES students expected to receiveaid than was the case with high SES stu-dents. More than half of the high SES stu-Gents (62 percent), however, expected touse financial aid, although the proportionof this group who expected Federal aid wassmaller than those who expected non-Fedeialaid.
Many specific aid programs are avail-able to today's students. The HS&B ques-tionnaire sought information on 20 of these:6 types of loans; 11 types of scholarships,fellowships, and grants; and 3 work programs.
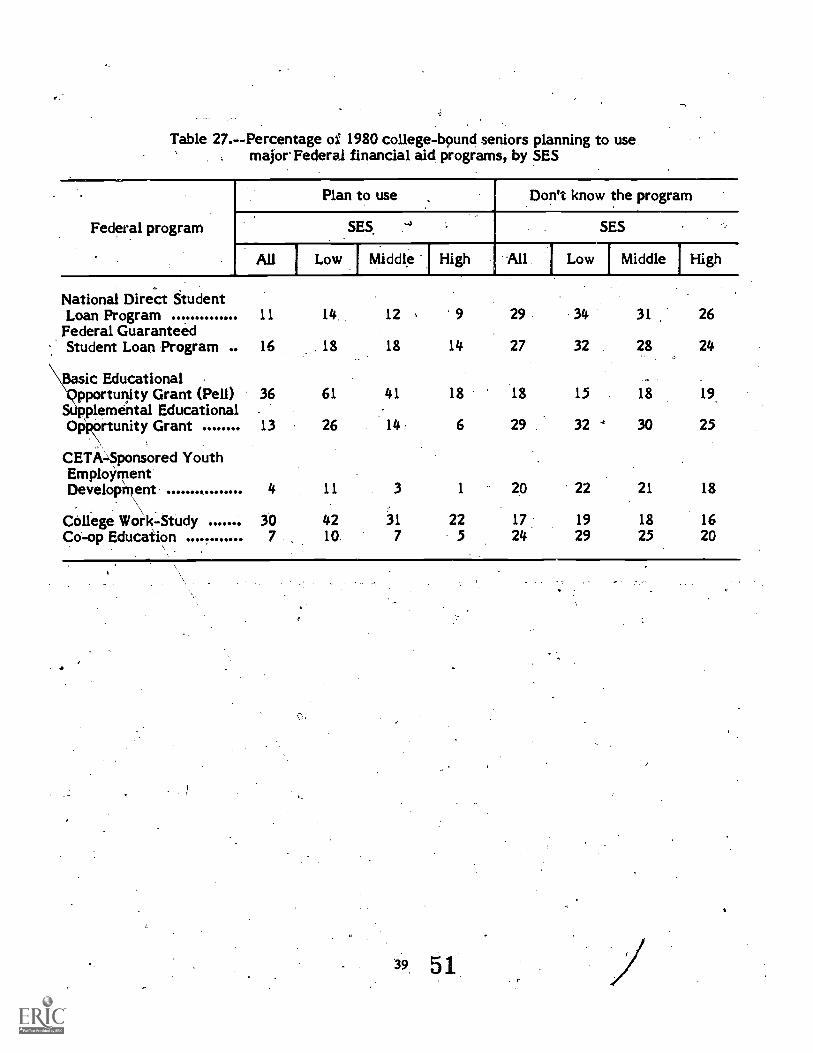
Substantial numbers of students expectto use Federal aid programs (table 27). Forexample, 36 percent of college-goers plannedto use a Basic Education Opportunity Grant(Pell Grant); 11 percent planned to use aNational Direct Student Loan; 16. percent,a Federal Guaranteed Student Loan; and30 percent, a College Work-Study job. Themajority of low SES students (61 percent)planned to use a Pell Grant and 42 percentplanned to hold, a work-study job.
A surprisingly large percentage ofstudents across all SES levels indicatedthat they did not know enough.about theprograrrfs to answer the question. For ex-ample, 18 percent indicated that they didnot know about Pell grants,- and 29 percentdid not know about Supplemental Educa-tional Opportunity. Grants (SEOG). Finan-cially disadvantaged students particularly-lacked knowledge about financial aid pro-grams and might not go to college becauseof this lack.
C. Type of College Chosen
After college-bound seniors knowwhat to look for in a college and have madeplans to finance their continued schooling,they take the next step by choosing a college.Among 2-year and 4-year public and privatecolleges are different combinations of pro-grams of study and net costs.
Overall, 21 percent of college-boundseniors planned to attend 2-year publicjunior or community colleges, 52 percent
374 9
Table 25.--Percentage of 1980 college-bound high school seniorswho consider various criteria as "very important"in choosing a college, by racial/ethnic group
CriteriaAll
college-goers
Racial /ethnic group
Hispanic . White Black
AmericanIndian/
orAlaskan -Native
Asian orPacificIslander
Availability of specificcourses or curriculum . 70 .64 70 72 80 70
Reputation of the collegein academic areas 55 51 55 54 63 57
planned to attend 4-year public collegesor universities, and most of the remainder(25 percent) planned to attend 4-year privatecolleges or universities.. Combining publicand private school students, 76 percentof the college-bound seniors planned to -
attend 4-year colleges:The choice of 4-year colleges or uni-
versities varied by high school programand socioeconomic status. Eighty-sevenpercent of the college-bound seniors in aca-demic programs planned to attend 4-yearcolleges, compared with 49 percent-of thosein vocational programs. Similarly, 87 per-cent of the high SES college-bound seniorsplanned to attend 4-year colleges, comparedwith 68 percent of the low SES seniors.The choice of 4-year over 2-year collegeis also more frequent among those withhigh achievement test scores than amongthose with low scores (89 percent vs. 57percent); among males than among females(80 percent vs. 74 percent); among whites,blacks, and Asian American/Pacific Islandersthan among. Hispanics and American Indian/Alaskan Natives (77, 80, and 80 percentvs. 66 and. 69 percent).
Similar patterns of group differenceswere observed in the choice between publicand private colleges. In general, college-bound seniors with_ higher achievement testscores, from academic programs, or froma higher SES background were more likelythan other students to plan to attend privatecolleges or universities.
D. Expected Fled of Study
By a wide margin, business was the
most popular choice of expected major. fields, chosen by 22 percent of 1980 college-
bound seniors (table 28). Fewer than halfas many (10 percent) chose the next mostpopular field, engineering. The other topchoices were health services (8 percent),preprofessional fields (8 percent), and socialscience (including psychology) (8 percent).
The ranking of major fields was differ-ent in 1972. Business was then second mostpopular (chosen by 13 percent) and engineer-ing then ranked shah (chosen by 5 percent).In 1972, social science wasthe most popularchoice of expected. Major fields, chosenby 17 percent of 1972 college-bound seniors(compared with 8 percent in 1980). Educa-tion was ranked third at 12 percent.
From 1972 to 1980 young womenshowed an increase in the proportion expec-ting to study in traditionally male fieldssuch as agriculture, architecture, and engi-neering. For example, in engineering,-thepercentage of females increased from 2percent in 1972 to 15 percent in 1980.
Other group differences in field ofstudy deserve, comment. Students withmore mathematics and science courseworkin high school were more likely to choosescience and other quantitative fields incollege. Academic program students moreoften expected to chcose engineering andpreprof6Sianal fields, while vocationalprogram students were more likely to choosebusiness and other vocational fields. HighSES students'were also more likely to chooseengineering and preprofessional fields andless likely to choose vocational fields thanstudents from low SES backgrounds.
52
Table 28.Percentage of 1980 college-bound high schoolseniors planning to enroll in various fieldsof study in college
/
Field1
Percent
Total .100
Business 22Engineering 10Health services 8Preprofessional fields 8Education 6Computer and information science 5.
Other social sciences (e.g., anthropology, economics,history, and sociology) 5
Art 4Other fields (e.g.,..architecture, ethnic studies, and
inter-diSciplinary studies) 4Communications 4Vocational or technical 3Biological sciences 3Psychology 3Agriculture 2Architecture. 2English 2Home economics, 2Music 2Physical science 2Foreign language 1
Mathematics 1
Philosophy ot-religion 1
-()
5341
AFTERWORD
This Capsule Description providesa general overview of the activities andexperiences of high school seniors'in 1980,using information from High School andBeyond's base-year survey. NCES plansto conduct or to sponsor a number of, ana-lytical reports that will address a varietyof topics in greater detail than that pro-vided here. In addition, NCES already hasmade computer tapes available to thosewishing to carry out their own analysesof special questions and issues. Among. -
the NCES-sponsored HS&B reports to appearin the near future are reports on the fol-lowing topics: public and private schools,Hispanic students in high school, disciplinein high school, and youth employment inhigh school.
Later reports on the base-year surveywill make use of HS&B information that wasnot yet available when this report was beingprepared: second-language background andusage; achievement test scores that are .
comparable for 1972 and 1980 seniors and
for 1980 sophomores and seniors; teacher'sassessments of the HS&B students; studenttwin pairs; parents' plans for financing highereducation of the students; and high schoolcharacteristics.
The HS&B study is a long-ter:7i pro-gram designed to reveal what young peopledo after they leave high school. The findingsof the base-year survey, while importantin themselves, will take on additional signi-ficance when subsequent followup surveysreveal the influence of high school educa-tional experiences on the later careers ofthese yOung adults: Reports making useof the followup`survey data and the Ion-gitudinal design of the HS&B study willappear in the later. years M this program.Information on the status of future reportsmay be obtained from the LongitudinalStudies Branch, National Center for Edu-cation Statistics, 205 Presideatial Building,400 Maryland Ave. SW, Washington,.D.C.20202.
5443
APPENDIX AHIGH SCHOOLAND BEYOND .
DATA SOURCESAND DATA FILES
Data Sources
1. Sophomore and Senior Question-naires. e sop more an senior ques-tionnaires covered personal and familybackground, school activities, out-of-schoolactivities, attitudes, and post-high schoolplani and aspirations. .The 1980 question-naires contained a number of items in
-common with 1972 instruments, and thereare a number of items in common betweepthe sophomore and senior questionnaires.'Questionnaires were translated into Spanishand used with students who requested orneeded Spanish language questionnaires.2
2. _ Tests. The following test batterieswere administered to the high school sopho-mores and seniors:
in the sample, the other twin was, whenpossible, given a questionnaire and testbattery as well. Data on about 500 pairsof twins were obtained in this way. Datafrom the nonsample twin are not inducedin the national sample; an additiona, datafile on twins will be available for analysis.A survey is planned to determine whethersame2sex twins are identical or fraternal.
5. Friend Data. Students were askedthe names of their three best friends inthe same class in school. Some of thesefriends also were selected to be in thesample. In these cases it will be possibleto link data on their friends and to carryout analyses of friendship associations, but
Senior Tests
--- VocabularyReadingMathematicsPicture- Number (measure of rote memory)Mosaic Comparisons(perceptual speed and accuracy)
Visualization in Three Dimensions(the ability to visualize how a figurewould look afer manipulation in three-dimensional space, by folding a flatfigure to make a three-dimensional fivre.)
Questions About Testing.(measure of test confidence; involvement,and distraction)
Sophomore Tests _
VocabularyReadingMathematics
0011. Science-
WritingCivics Education
A number of vocabulary, reading, and mathe-matics items are common to both the seniorand sophomore testsl Thes'e sets of commonitems have been scored separately to formcomparable senior and sophomore test data.
3. Second-Language Information.As part of a separate identification for'mdesigned to facilitate locating studentsfor followup surveys, students were askedquestions about a second language. Forthose 11,000 students who gave a "nor-English" response to; any of five questionsabout language spoken at home, informa-tion about their expbsure to a langurgeother than English viss obtained.
4. Twin Data When a twin was found
unlike the twins, no effort was made toobtain additional data brifqends who werenot on the sample rose: .- N
6. School questionnaire.: At eachschool, 'the principal or a staff memberdesignated, by the principal was asked tocomplete a School Questionnaire providinginformation on school pro rams, practices,and policies.
.. 1The items in these questionnaLes, and the question- \.
nacres u a whole, are in the public domain and can be used withoutpermission. However, NCES would e to be informed of research' /wing the HS&B instrument, for tential value to other research/ilivestigators.
2Standard trandationletransaion methods were usedcreating 'the Spanish fnitguage.questioanaires to here that theoriginal meaning was preserved. Firty-six students used a Splanguage questiom.dre.
47.56
7. Teacher's Comment Form. Teacherir1 the sampled schools were asked to responto 14 cpliestions In a special form to be re-
irned l)/ mail. Most of the questions con-cerned their evaluations of students in theHS&B sample. In addition, several questionsdealt with the background characteristicsof the teachers and with the classes theytaught. For analysis purposes, this informa-tion will be merged with the questionnaireand test data concerning the student.
8. Parental Information. A sampleof parents of sophomores and seniors (about3,600 for each cohort) was selected, anddata were collected through a questionnaire(mail, telephone, or personal interview).These data concentrate on financing highereducation.
Data Files
Most of the data described above willbe processed and made available from NCESon computer files. The files are describedbelow. Only files one and two are currently
available; others will be available soon.
File 1: Student File. This file contains ques-tionnaire and test data (see 1 and 2 above)for 30,030 sophomores and 28,240 seniors.
File 2: School File. School questionnairedata (see 6 above) are contained in thisfile for 988 schcols. Merging with datafrom the Student File is possible throughcommon identification codes.
rile 3: Language File. File 1 contains anindicator for 5,917 sophomores and 5,415seniors who reported some non-Englishlanguage background (see section 3). File 3contains this language usage information,with records for these students only.
File 4: Teacher Comment File. This infor-mation (see section 7) will be usefulprimarily when merged with data fromthe Student File. Matching with studentdata will be possible through the studentidentification codes.
File 5: Twin File. This file will be of thesame format as File 1, and will containstudent questionnaire and test data forboth members of each pair of twins.
V.
48
57
APPENDIX B
STUDENTCL SSIFICATIONVAR & BLES
58
Seven major classification variableswere used in this report to define subgroupsfor analysis:, sex, race/ethnicity, high schoolcurricular program, socioeconomic status,general achievement composite, geogra-phical region, and school type. Except forgeographical region and school type, theclassifications were developed, from infor-mation reported by the students. For the1972 cohort and for the HS&B cohorts, theamount of missing data was as follows:
The category "Hispanic" included thosewho answered Mexican-American or Chi-cano, Puerto Rican, or other Latin Amer-ican. The HS&B survey, however, hadseparate questions to determine Hispanicor Spanish ethnicity and race, and somewhatdifferent terminology was employed: Mex-ican, Mexican4kmerican, Chicano; Cuban,Cubano; Puerto Rican, Puertorriqueno, or.Boricua; and Other Latin American, Latino,Hispanic, or Spanish descent to identify
Classificationvariable
Missing data (percent)
1980 Seniors 1980 Sophomores 1972 Seniors \
Sex 4 7 0
Race/ethnicity (missing or other) 3 3 3
High school program 2 2 1
Socioeconomic status 3 5 0
Achievement composite. 11 9 5
Geographical region 0 0 0
School type 0 0 0
The amount of data missing from thepresent HS&B data-tapes will be reducedfor most variables by obtaining it fromfollowup surveys currently being plannedfor 1982 and 1984.
With two major exceptions (race/ethnicity and achievement composite), theclassification variables were computed ina similar manner for both the 1972 and the1980 surveys.
Race/Ethnicity
In NLS-72, race/ethnicity was deter-mined by student answers to the singlequestion: "How do you describe yourself'?"The response options were American Indian,Black or Afro-American or Negro, Mexican-American or Chicano, Puerto Rican, OtherLatin American origin, Oriental or Asian-American, White or Caucasian, or Other.
Hispanics, and Black, White,-AmericanIndian or Alaskan Native, Asian, or PacificIslander, and Other to separately identifyracial groups. In HS&B, racial classifica-tions were assigned only to those studentsnot classified as Hispanic.. Thus, unlikethe earlier study, HS&B utilized the term"Hispanic" to mean students of Hispanicorigin regardless of race. Unfortunately16 percent of the 1980 seniors and 14 per-cent of ,the 1980 sophomores did not Provideanswers Oat permitted classification byethnicityr,
Achievement Composite
In NLS-72, the "achievement" com-posite was based on four standardized testscores: vocabulary, reading, mathematics,and letter-groups.3 HS&B employed threeof these fourrtests--a letter-groups test
3Thb composite is commonly referred to as an index ofgeneral "academic ability" in NLS-72 reports.
51 59
was not givento develop a similar com-posite. In some instances, the 1972 and1980 tests were identical (e.g., the seniorvocabulary and reading tests); in othersonly subsets of items were identical. (Analy-sis of NLS-72 data shows that dropping theletter-groups test from, the set of testshas virtually'no effect on the compositescore.) The weighted distributions of com-posite scores were used to group studentsby achievement composite (or decile).
Socioeconomic Status (SES)
For both studies, the SES index isa composite of five equally-weighted stan-dardized components: father's education,mother's education, family income, father'soccupation, and household items. The termshigh, medium, and low SES refer to theupper, middle two, and lower quartilei ofthe weighted SES composite index distri-bution.
Curriculum
High school curricular program wasidentified from the answers of studentsto the question, "Which of the followingbest describes your present high schoolprogram?" In both studies the terminology"General" and "Academic or college prepa-ratory" were two of the response options.
In NLS-72, the third option was "Vocationalor technical" with six listed subject areas.In HS&B this option was worded "Vocational(occupational preparation)" and a 'seventh,subject area ("Technical occupations") wasadded.
Region
HS&B was designed to provide esti-mates for each of nine Census Bureau re-gions. For this report, however, these ,'regions were collapsed into the four majorregions employed in the design of NLS-72.These regions are:
Northeast (Maine, New Hampshire,Vermont, Massachusetts, Rhode Island,Connecticut, New York, New Jersey,and Pennsylvania).
North Central (Ohio, Indiana,lllinois, Michigan, Wisconsin, Minnesota,Iowa, Missouri, North Dakota, SouthDakota, Nebraska, and Kansas).
South (Delaware, Maryland,District of Columbia, Virginia, WestVirginia, North Carolina, South Carolina,Georgia, Florida, Ic!ntucky, Tennessee,and Alabama). .
West (Montana, Idaho, Wyoming,ColoriNcNew Mexico, Arizona, Utah,Nevada, Washington, Oregon, California,Alaska, and Hawaii).
52
APPENDIX CLIMITATIONSON USEOF DATA
The statistics in this report are esti-mates c:erived from a sample. Two broadcategories of error occur in such estimates:sampling and non-sampling errors.4 Samplingerrors occur because observations are madeonly on samples of students, not on entirepopulations. Non-sampling errors occurnot only on sample surveys but also in com-plete censuses of entire populations.
Non-sampling errors can be attributedto many sources: inability to obtain com-plete information about all students in thesample (e.g., some are absent on surveyday, refuse to participate, participate butanswer onjy certain items, etc.); ambiguitiesin definitions; differences in interpretationof questions; inability or unwillingness toprovide correct information; mistakes inrecording or coding data; and other errorsof collection, response, processing, sample'coverage, and estimationof missing data.
The accuracy of a survey result isdetermined by the joint effects of samplingand non-sampling errors. In surveys withsample sizes, as large as those employedin NLS-72 and HS&B, non-sampling errorsare the primary concern, except. whereseparate estimates are made for relativelysmall subpopulations.
Non - Sampling Err ors
Nonresponse Bias. The following tab-ulation shows sample sizes for both studies:
were initially sampled but would not or couldnot participate was permitted. The-effectof school nonparticipation on.estimates isthought to be fairly negligible but is not .really known.
NLS-72 permitted a complex systemfor substituting other students for originallysampled students, which made it difficultto determine the student nonresponse rate.It appears to have been less than 5 percent,however while the HS&B student nonre-sponse rate was 16 percent. Three-quartersof the HS&B nonrespondents were absenton both survey and make-up days. In 1972,it was possible to obtain information fromstudent files that enabled ,adjustment fornonresponse bias by use of such variablesas sex, race, high school program, andgrades. In HS&B it was not possible to ob-tain similar data from school files aboutHS&B nonrespondents because of privacyregulations. Attempts will ,be made in theHS&B first foliowup survey to have somebase-year nonrespondents enter the studyat that time. Other attempts will be madeto adjust for noniesponding students.
Item response rates within completedquestionnaires generally were quite high.For example, in NLS-72, the median re-
, sponse rate was 98'. and was at least95 percent for 90 Percent of the items. For8 items, however, the. response rate wasunder 85 percent. In HS&B over 20 itemswere designated as key or critical items.
NLS-72 HS&B
Category Numberof
schoolsPercent ,
Numberof
schoolsPercent
Drawn in sample and eligible 1,179 100 1,122. 100Participated:Drawn in original sample 949' 80 811 72Drawn in replacement sample 95 9 204 18
Total 1,044 89 1,015 90
Both studies employed two-stage sample de-signs: schools and students within schools.In the base-year surveys of both studies, sub-stitution of similar schools for those that
4some information on the magnitudes of nonresponsebias and other types of non - sampling rror in the NLS -72 survey isgiven in an unpublished document: Thomas F. Hilton, et al., "FinalReportThe Base:Year Survey of the National LongitudinaliStudyof the High School Class of 1972," (including Appendix F, "Re-sponse Stability and Validity Studies") Educational Testing Service.June 1973.
55
62
The response rates for these items generallywere 98 percent or more, although for someof the most difficult or sensitive questions(e.g., parental income), the response ratefell as low as 85 percent. Unlike NLS-72,HS&B showed a decline in item responserates from the beginning to the end of thequestionnaires. These rates reached limitsof about 93 and 87 percent toward the endof the senior and sophomore questionnaires,respectively. Users of both studies arecautioned to be careful about interpretingthe results for items that have high non-response rates. This applies particularlyto H5&B items from the latter parts ofthe questionnaire that may not have, beenreached by slow readers or poorly motivatedstudents.
Item nonresponse rates for classifica-tion variables are of special concern. Thetable in appendix B indicates that the non=response rates are satisfactorily low exceptfor the academic achievement compositeand sex (HS&B only).
Accuracy of Reported Data
Some information on the reliability ofthe tests and on the reliability and validity,of certain classifications and other variables'may be found in two plaCes. One is the'ETS report referenced in footnote 4 in thisappendix. The other is the U.S. Departmentof Health, Education, and Welfare, EducationDivision report "Student Questionnaire andTest Results by Sex, High School Program, .Ethnic Category, and Father's Education,"NCES 75-208 (1975). Extensive data on thereliability of student responses are availablebut not yet analyzed. These data comefrom: (1) a re-survey in which a sub-sampleof students responded to .a sub-set of itemsa short time after .answering-th-eltems-initially; and (A comparison of answersgiven by twins and other siblings regardingfamily backgrotind. The Parent. Survey ques-'tionnaire was designed to obtain validationinformation on a large number of studentquestionnaire items as well as family finan-cial planning data; these data have not yetbeen analyzed.
56
Comparison of 1972 and 1980 SeniorCohort Data
Particular caution has to be exercisedin comparing data for the two senior cohorts.A number of the problems may be inferredfrom the previous discussion in this appendixand appendix Be School and student responserates differ in the two surveys; furthermore,the characteristics of the nonrespondentsmay also differ in the two studies. Item re-,sponse rates for questions that appear in bothsurveys differ. Not all tests were identical;a test equating analysis, not yet undertaken,may illuminate this issue. Furthermore,as indicated in appendix B, the measures ofsome other classification variables--andsome nonclassification variables--havechanged in ways that may affect the com-parisons of changes between 1972 and 1980for subgroups of seniors. Other differencesbetween the two studies also may have someimpact on theaccuracy of comparisons ofthe two senior cohorts, although probablynot as serious as the foregoing factors (e.g.,change in order of administration of testsand questionnaires, administration of HS&Ba month or so earlier in-the school yearthan NLS-72, changes in administrativeprocedures, doubling of within-school samplesize of HS&B, etc.)
Provisional Nature of Estimates
From the preceding discussion in thisappendix, the reader should understand that'the estirnlates contained in this report mustbe considered preliminary. They are, there-fore, subject to revision when certain missingdata have been captured,.adjustments have -1 'been made on the basis of characteristiciof nonrespondents, and studies of test scoreequating and response accuracy have beencompleted.
Sampling Errors
The particular sample used in a surveysuch as 'HS &B is only one of a large numberof possible samples of the same size thatcould have been selected using the same
0
63
survey design. Estimates derived from thedifferent samples would differ from eachother. The standard error of a survey esti-mate is a measure of the variation amongthe estimates, from the possible samples.Thus, it is a measure of the precision withwhich an estimate from a particular sampleapproximates the average result of all pos-sible samples. The sample estimate, togetherwith an estimate of its standard error, permitus to construct interval estimates with pre-scribed confidence that the interval includesthe average result of all possible samples.
To illustrate: if all possible sampleswere seleCted, each was surveyed underthe same conditions, and an estimate andits standard error were calculated fromeach sample, then--o About 95 percent of the intervals from 2
standard errors below the estimate to 2standard ei-rors above the estimate would,include the average value of all possiblesamples. An interval of this size is calleda 95 percent confidence interval;
o Almost all (over 99. percent) of the inter-' vals from 3 standard errors below to 3standard errors above the sample estimatewould include the average of all possiblesamples.
The closeness of these approximationsdepends on how closely the actual distributionof the statistic corresponds to the normaldistribution. In case of sample percentages,the normal approximation is satisfactory,except for small samples and extreme per -centage values. The normal approximation'is sufficiently good for determining confi-dence intervals for all estimates presentedin this report. _
The standard error (s.e.) of apercentage(p) estimated from a simple random. sample(SRS) of size n froth a population that ismuch bigger than the sample size-is approxi-mately
s.e. (p) = [p(1-p)/n] 1/2
Since both NLS-72 and HS&B arecomplex stratified two-stage samples withlifferential sampling rates for various strata--rather than simple random sarniSles, it is
necessary to adjust for design effect bymultiplying the SRS estimate of the stan-dard error of a proportion by 1.2 for NLS-72estimated percentages §nd 1.6 for HS&Bestimated percentages.3
Sample size values (n) for various sub-groups are shown in table C.1. The valuesin this table, along with the above formulaand the design effect multipliers, may beused to find standard errors of the percent-ages presented in the report. For example,if,an estimate of 20 percent appears in tit.report for HS&B Hispanic sophomores, thenthe standard error of this estimate is
1.020)(80)/3521)1/2=1.1 percentage points \s
The sampling error (95 chances in \01 0) is2.2 percentage points; therefore, the \25percent confidence interval is 17.8 percentto 22.2 percent.
In comparing the differences in twosubpopulation percentages (d = p-p'), thestandard error of .the difference may beconservatively approximated by takIng thesquare root of the sum of squares of thetwo standard errors. For example, if theestimated percentage for HS&B Hispanic'sis 20 percent, and the estimated percentagesfor HS&B non-Hispanic whites is 25 percentthen the standard error for Hispanics, aswe have just calculated, is 1.1 percentagepoints, and the standard error fornon-Hispanic whites is
1.6[(25)(75)/(20,815)31/2= ,
0.5 percentage pointsThus the standard error of the
difference is[ (1.02 (0.5)231/2=
. 1.2percentage pointsThe sampling error (95 chances in 100) ofthe difference is 2.4 percentage points,and the 95 percent confidence interval forthe difference (5 percentage points in favorof non-Hispanic whites)is 2.6 to 7.4 per-centage points.
SThese design effect multipliers generally will produceconservative estimates, except where HS&B private school studentsare concerned.
Table C.1.--Sample composition, by selected classification variables:NLS-72 and HS&B
Classification variableand subgroup
1972 Seniors 1980 Seniors 1980 Sophomores
Number I Percent Number] Percent Number !Percent
Total sample 16,683 100.0 28,240 100.0 30,030 100.0