DOCUMENT RESUME Palmer, D. G. Bank of Items for H.S.C. Biology Level 211 and Division 1 with Computerised Self-Moderation and Error Analysis Rzocedures Using the Items from the Bank. INSTITUTION Tasmanian Education Dept., Hobart (Australia). PUB DATE 75 NOTE 145p.; Contains occasional light type EDRS PRICE MF-$0.83 HC-$7.35 Plus Postage. DESCRIPTORS *Biology; *Evaluation; *Item Banks; Measurement; Multiple Choice Tests; Norm Referenced Tests; *Science Education; *Secondary Grades; Test Construction; *Tests IDENTIFIERS Australia (Tasmania) ABSTRACT This publication presents an organized collection of biology questions, designed for use in evaluation at the secondary level in Tasmania. Each item has been tried for quality and is accompanied by its difficulty percentage as well as by its content area and the mental processes required to answer it. The content areas include: Diversity, Interrelationships, Change, Living World, Organs and Systems, Interaction and Maintenance, Cellular Level, Continuity, and Evolution. The mental processes include: knowledge, comprehension, application and analysis. A Self-Moderation Scheme, designed to compare a school's or class' perfornance.on an entire test with that of other schools, is discussed. An Error Analysis Procedure, designed to provide for a conparison of a school's or class' performance on items within each content area of the test yith the performance of other schools, is detailed. (BT) SE 020 -505 *********************************************************************** * Documents acquired by ERIC include many informal unpublished * * materials not available froa other sources. ERIC makes every effort * * to obtain the best copy available. Nevertheless, items of margiyal * * reproducibility are often encountered and this affects the quality * * of the microfiche and hardcopy reproductions ERIC makes available * * via the ERIC Document Reproduction Service (EDES). EDRS is not * * responsible for the quality of the original document. Reproductions * * supplied by EDRS are the best that can be made from the original. * ***********************************************************************
Transcript
DOCUMENT RESUME
Palmer, D. G.Bank of Items for H.S.C. Biology Level 211 andDivision 1 with Computerised Self-Moderation andError Analysis Rzocedures Using the Items from theBank.
INSTITUTION Tasmanian Education Dept., Hobart (Australia).PUB DATE 75NOTE 145p.; Contains occasional light type
ABSTRACTThis publication presents an organized collection of
biology questions, designed for use in evaluation at the secondarylevel in Tasmania. Each item has been tried for quality and isaccompanied by its difficulty percentage as well as by its contentarea and the mental processes required to answer it. The contentareas include: Diversity, Interrelationships, Change, Living World,Organs and Systems, Interaction and Maintenance, Cellular Level,Continuity, and Evolution. The mental processes include: knowledge,comprehension, application and analysis. A Self-Moderation Scheme,designed to compare a school's or class' perfornance.on an entiretest with that of other schools, is discussed. An Error AnalysisProcedure, designed to provide for a conparison of a school's orclass' performance on items within each content area of the test yiththe performance of other schools, is detailed. (BT)
SE 020 -505
************************************************************************ Documents acquired by ERIC include many informal unpublished ** materials not available froa other sources. ERIC makes every effort ** to obtain the best copy available. Nevertheless, items of margiyal ** reproducibility are often encountered and this affects the quality ** of the microfiche and hardcopy reproductions ERIC makes available ** via the ERIC Document Reproduction Service (EDES). EDRS is not ** responsible for the quality of the original document. Reproductions ** supplied by EDRS are the best that can be made from the original. ************************************************************************
U.S. DEPARTMENT OF HEALTH.EDUCATION WELFARENATIONAL INSTITUTE OF
THIS DOCUMENT HAS BEEN REPROOUCEO EXACTLY AS RECEIVEO FROMTHE PERSON OR ORGANIZATIONORIGINATING IT. POINTS OF VIEW OR OPINIONS*STATEO DO NO1` NECESSARILY REPRESENT OFFICIAL NATIONAL INSTITUTE OFEOUCATION POSITION OR POLICY-
BANK OF ITEMS FOR
H S.C. BIOLOGYLEVEL III AND DIVISION 1
WITH
SELF-MODERATION AND
ERROR ANALYSIS PROCEDURES
BASED ON THE BANK
2
CURRICULUM CENTREEDUCATION DEPARTMENT OF TASMANIA
ITEM BANKREFERENCE NAME
SELF-MODERATION SERVICE
_COVER SHEET
o ILIOIGIYI .1 [ 3 1
SCHOOL
CLASS
NUMBER OF ANSWERSHEETS FORWARDED
AWARDS DESIRED
AwardNumberDesired
C
P
L
N
TOTAL
Note: This TOTAL must be equalto the number of Answer Sheetsforwarded. (i.e., do notinclude absentees.)
DATE SENT
DATE NISULTS REQUIRED
RETURN RESULTS TO:
NAME
SCHOOL
PHONE
HOLIDAY ADDRESS
PHONE
Send this sheet, completed,with all Answer Sheets to:
Self-Moderation Service,Curriculum Centre,181 Elizabeth Street,HOBART. 7000.
ITEMS USED
TestNumber
Bank Access Number
1
I
1
I 1
i
1
!
1
2i
I1
lA
i
3 i 11
4.
t
1
i
,
5___ __
1
I
I
I
I
o
14o
I
I
,
I
I
1
I
1
I
8I
i
1
o
1
9;
I
I
I 1
I
10 I I
JI
1
11 1
I
1
1 I
12
13
i
-1o
f
1
1
1
t
I
--/1
14I
I
1
II
15 I
;----1
1
I
iI
16 I .1-- 46i
17 I
1
1
1
18 ii
1
19t- t
I
I
i
1
20 I
i
I
1
1.
21,
1
-7 1I
i
1
1
i
1
1-----1
L22
23I
I
I
I
I v
I
24 Ii I
I
25 1 I
i
1
I
26i
I
I
1
1
27 I
I
1
28 i
I
1
I
1
;
29 I
I
II
, 30I
i
1
1
1 .
;
SELF-MODERATION:SERVICE-
BIOLOGYLEVEL-S;11:S;C:--
ANSWER SHEET
COLLEGE/SCHOOL
Question Number Answer
1
2
3
4
S
6
7
8
9
10
11
12
13
14
15 ,
16
17
18
19
2P
21
22
23
24
25
26
27
28
29
30
ITEM BANKREFERENCE NAME
SELF-MODERATION SERVICE
,COVER SHEET .
SCHOOL
CLASS
NUMBER OF ANSWERSHEETS FORWARDED
'AWARDS DESIRED
AwardNumberDesired
C
P
L
N
TOTAL
Note: This TOTAL must be equalto the number of Answer Sheetsforwarded. (i.e., do notinclude absentees.)
,DATE SENT
DATE RESULTS REQUIRED
RETURN RESULTS TO:
NAME
SCHOOL
PHONE
HOLIDAY ADDRESS
PHONE
Send this sheet, completed,with all Answer Sheets to:
Self-Moderation Service,Curriculum Centre,181 Elizabeth Street,HOBART. 7000.
,
ITEMS USED
TestNumber
Bank Access Number
1
;
1
1
I i
;
1 r1
2
3 I
41
qI
1
4-1
/I
I
t
1
1.._
I
I.
.L1-
t
1
4
5
1
1
1
I1
t
o
11
6t
i1
r------4
1
1
I
1
1
1
1
t
I
7
8I
1
1
I
:__
1
4
1
9.,. .
1
t- . i
1 1
1 I
.r I.-
1 1
_r_._._...1._.....1
I
,
1
1
,
1
1
1
71
1
I
1
1
10 1
1
1
_..,
I
i
I .
1
I
1--
1
-I--
I
1
;
I.
. _i
11
12
13
14 i
1
1
1
;
1-1
I
15
16
1
1
-F--1
1
t _
I
17
13 1
-4----T-1
t
i
1
t..
A
4
T
r1
1
1
-.
i
-4-
1
t_
1
t
L
19r)111
20r
I
1
t
1
1
I
i
r
21
4-
22 I
1 -4
24I
1
I
I1
1
I--
I
1
i
1
1
I
1
1
1
11
25 I
1
26 1
1
271
;
1
I
TI
7i1
1
V
281
t
1
--41
I
1
--1--1
I-
1
1
4-29
30 I
1
,
I
I1
5
SELF-MODERATION-SERVICE:.
'BIOLOGY':
'ANSWER SHEET
STUDENT NAME
....... . . .... . . .. ....... COLLEGE/SCHOOL
'
LINE/CLASS'.
Quest'ion Number Ansier
3
5.
4
6
7
8
9
10
11-
12
13
14
15
16
17
18
19
20
21
22
23
24
25
26
27
28
29
.i_30
BANK OF ITEMS
FOR
H.S.C. BIOLOGY LEVEL HI and OMSION I
WITH
COMPUTERISED SELF-MODERATION AND ERROR ANALYSIS PROCEDURES
USING THE ITEMS FROM THE BANK
D.G. PaZmer, B.Sc., B.Ed.
CURRICULUM CENTRE:
EDUCATION DEPARTMENT oF TASMANIA
1975
PUblished by
The CurricuZum Centre of the Education PepartmenY47*maniai'
181 Elizabeth Streeti Hobart, Tasmania MOP,' in4uly, 1975.
The itemc in this Bank ar not copyright, but users arerequestea to observc i.he security measures outlined on
page xxvii.
Preface
Introduction
Part I - The Project
1. What is an Item Bank? ix
2. Possible Uses of This Bank ix
3. How the Bank was Constructed
4. Characteristics of Each Item xi
S. How to Read the Access Number xiii
Part II - The Self-Moderation Scheme
1. Background xv
2. The General Idea xv
3. Reas.ons for the Use of a Group Method xvi
4. How the Group Method Works xvii
S. Why Teachers Choose Their Own Tests xviii
6. The Reason for Computer Processing xviii
7. How to Use This Bank for Self-Moderation xix
8. The Up-Dating Mechanism xxii
9. A Sample Answer Sheet ..
10 A Sample Cover Sheet
Part III - The Error Analysis Procedure
1. The General Idea
2. How the Procedure Works
Part IV - The Construction of Tests and a Noteon the Security of Items .. xxvii
Diversity . .
Interrelationships .
Change .
Living World .
Organs, Systems . 53 -
Interaction, Maintenanc& . .
Cellular-LeVel' . .
Continuity
Evolution
Other: Scientific Method, etc.
APPENDICES
A. (1) Blueprint of Items in the Bank -
(2) BlUeprint of Items in the Bank - Division 1 ..
B. Taxonomy of Educational Objectives
C. Statistical Notes
102
D. Bases of The Error Analysis Procedure
E. A Typical Completed Item Card
F. References
f:JTEMT:,,, 'WRITERS
and their schools/colleges in 1974
Myrna Bedding
Ivy Blake
Michael Cassidy
Anne Dean
Colin Drake
Wayne Griggs
Trudy Ann Ham
Carl James
Tom Johnston
Sr. Rose Mary Kinne
Bruce McIntosh
Pamela Nicholls
Don Palmer
Barry Parker
Colin Parker
Gwen Pickup
Penny Roberts
Ann Ryan
Philip Sowter
Mike Sugden
Penny Tyson
Philip Welch
Edmund Wilkinson
Nancy Hardy-Wilson
Bob Woolhouse
Katie Young
-
,F,ahan
Devonpoii Matriculation College.
launceston MatriculatiOn College
Marist Regional 'College
Elizabeth Matriculation-College
Rosny College.
Launceston Matriculation College
Rosny College
Burnie High School
Dominic College
Hobart MatricUIation College
I Launteston:MhtriCulationCollege
'CurriculuMCentre
Elizabeth Matriculation College
Rosny College
Launceston Matriculation College
Devonport Matriculation College
St. Virgil's College
Hobart Mhtriculation ,College
Hobart Matriculation College
Launceston Matriculation College
Launceston Matriculation College
Elizabeth Matriculation College
ACKNOWLEDGEMENTS
the:pupilS and -teachersof 19'State and .Independent
Mrs. Jean Woodward ofihe.Curriculum Centre:for her
time, care and skill in reproducingnot:only the items:
themselves, but also the tables, diagrams and graphs'
on which many of the items are based;
Mrs. Sabita Roy of Taroona High-School for her,
assistance in preparing the book for publication;
Mr. Philip Sowter and members of his Biology staff at
Hobart Matriculation College for their assistance in
deriving the sub-categories of the error analysis
procedure;
Mr. Don Bewsher and Sr. Valerie Burns of the
Curriculum Centre for their assistance.in proof-reading,
and advice on the preparation of this book;
Mr. Bob Cooper of the Research Branch for his ingenuity
in devising computer programmes for many aspects of the
moderation and error analysis procedures.
12
This is the second bank we have produced for an H.S.C.subject, and the first for a science subject at that level.The de, ision to undertake the project was made by Biologyteachers, throughout the state, in the hope that the Self-Moderation Procedure which is incorporated in this bankwould prove useful in the new conditions for assessmentintroduced by the Schools Board for this year. Theseconditions include full school responsibility for awardsat Division 1 and the possibility of using a schoolassessment mark in addition to the examination resultat Level III.
It must be stressed that the Self-Moderation Procedure,which is available at both Division 1 and Level III, isoffered purely as a service to teachers. Results obtainedusing the procedure are advisory only; they are notcommunicated to the Schools Board and are regarded asconfidential information. Teachers may act on advicereceived or ignore it, as they please.
The production of this bank has involved many people.I would like to thank all of them for their hard work, andto congratulate them on the success of their efforts.Nevertheless, no project is ever completely satisfactory.I would welcome suggestions for improvement and, in themeantime, must remain responsible for whatever errors andomissions there are in this book. One obvious deficiencyis simply that thero are not enough items and, at the timeof writing, plans are already being made to preparesupplementary material to be issued at intervals over thenext few years.
I hope that this bank will prove useful to teachers,not only for information about standards but also forthose other purposes which are described in the introductorypages.
D.G. Palmer14.5.'75
13
:INTRODUCT
Part'I -
Item Bank?'
Put simply, an Item Bank is an (Tganised collection or: questions(hereafter called items) which have been tried for quality. In thisBank each item is accompanied by its difficulty percentage as well asby its content area and the mental process required to answer it.
Possible Uses of This Bank
You should discover that the uSes of this Bank are many andvaried. For example, you might consider using it for at least thefollowing purpcses, and add to them any others which you think areappropriate:
presenting your students a different approachto the learning of familiar subject material;
identifying new subject material which couldbroaden the scope of your teaching ofparticular topics;
constructing learning exercises designed for thespecific purpose of getting your students toexamine wlmthey answered some items incorrectly;
providing yourself with examples for your ownitem-writing.
(b) as a basis for determining the level of achievement ofyour class compared to that of other classes throughoutthe state (Refer.to Part II - The Self-Moderation Scheme,on pages xv to xxiv.)
(c) ,,asalfourclass(Refer to Part III - The Error Analysis Procedure,on pages xxv to xxvi.)
When using the Bank for the testing purposes mentioned in (b)and (c) above, make certain that you reproduce each item exactly asit is in the Bank, without altering either its wording or its layout.Any alteration of an item may also alter its expected difficulty andits ability to discriminate. For other purposes; however, feel freeto alter the items in any way which you think would make them moreusable.
Your school has received a loose-page version of the Bank, aswell as this bound one. The loose-page 'version should make it possiblefor yall to reproduce the items easily and quickly, with the result thatyou will be able to use the Bank as often as you wish for a wide'
using the loose-page version has mu
- photocopy whatever items you wish to use (thii will allow the
loose-page version to be retained intact, as a-"master" copy
for future use);
- trim off the access numbers and difficulty percentages;
- attach the items, in the order you prefer, to blank sheets of
paper, and number each item;
- give the sheets of items to a secretary, who will cut either
"scanned" or "thermofax" stencils ("scanned" ones are
preferable), and print as many copies as you need.
Following this procedure will not only make unnecessary the time-
consuming chore of typing, it will also allow you to make full use of
those items based on tables, maps, graphs and diagrans which in many
cases are too complicated or too detailed for schools to reproduce
easily and accurately.
3. How the Bank Was Constructed
(a) Writing the Items
In May and June, 1974, different groups of Higher School
Certificate Biology teachers (in Hobart, on the North West
Coast and in Launceston) attended item-writing sessions
lasting three days each. A total of about 20 teachers
wrote items during these sessions. At each sosion,teachers worked at two alternating activities:
(i) individual work, in which each teacher thought
up and ',note out test items, followed by
(ii) group work, in which each person answered
everyone else's items and critically discussed
them after they had all been read.
In addition to participating in these formal sessions,
a number of teachers spent many after-school hours,
in the evenings and at the weekeyl, in validating items
which they had previously written. The result was that
by the end of Term II, 1974, 469 acceptable items iftm
trialling had been written by 26 teachers.
(b) Trialling the Items
The 469 items were sorted and typed into 14 tests, which
were sent to all State and Independent schools with H.S.C.
classes for trialling. After the answer sheets had been
returned and analysed, the figures obtained from the
analysis were used as a guide to determine whether each
item was acceptable for publication in the Bank, or not.
(c) Publishing the Items
The validity of each item was tested twice - first, by the
item writers, when they answered one another's items to
determine whether they, as experts in their field, could
agree on the right answers; and second, by the H.S.C.
students on whom the items were trialled. The 'tems whichproved to be valid and acceptable were finally re-ordered,re-typed, and printed in the form of this Bank.
4. Characteristics of Each Item
The three figures printed in the margin at the left-of each item -
one, an access number, and the other two, percentages - contain usefulinformation about certain characteristics of the item. Thesecharacteristics include (a) the content area of the item, (b) themental process required to answer the item (both of which are coded inthe item's access number) and (c) the difficulty of the item for bothLevel III students and Division l's (expressed as percentages).
Immediately following the descriptions below, is an explanationof how to read the access number of each item.
(a) Content Areas
Item writers decided that the H.S.C. Biology course, forboth Level III and Division 1, should be divided into thefollowing content areas, for the purposes of the Item Bank:
0. Diversity1. Interrelationships2. Change3. Living World4. Organs, Systens5. Interaction, Maintenance6. Cellular Level/. Continuity8. Evolution9. Other: Scientific Method, etc.
(b) Mental Processes
To answer each item a student must use one or another offour mental processes, similar to those described andnumbered by Bloom in his Taxonomy1 (which includes sixprocesses in all). They are process 1, knowledge;process 2, comprehension; process 3, application; andprocess 4, analysis. These four processes are describedbelow in their specific relation to the items in this Bank.(Refer to Appendix B for a general description of all sixprocesses.)
Process 1: Knowledge
This process involves a persJn's knowledge of specificfacts, of ways of dealing with specific facts, of drilledoperations and of abstractions and generalisations.
Items in this Bank which require knowledge for theiranswering fall mainly in the content area of Diversity,and most deal with aspects of classification.
16
Process 2: CoinErehension
This process involves any of three mental activities:
translation. Items which require translationtest a student's ability to recognise arephrasing of a group of words, or to translatesuch symbolic forms as diagrams, tables andgraphs into words or other forms.
interpretation. Items which requireinterpretation test a student's ability tograsp the meaning of a piece of writing, agraph or a table - as a whole - and to understandthe interrelationships of its major iaeas. It
may also require that he abstract generalisationsfrom the particulars in the information given.
(iii ) extrapolation. Ii:ems which require extrapolationtest a student's ability to draw conclusions from
what he has read or to predict trends orconsequences based on a piece of writing, a table,
a diagram or a graph.
The process of comprehension can be tested effectively by
items based on paragraphs, tables, graphs, diagrams, etc.
previously unseen by your students. Many items in the Bank
are of this type.
Process 3: Application
Items which require application test a student's ability to
solve a genuine problem. The solution depends on,a student's
ability to sift through principles, abstractions or generalisa-
tions which he already knows, and to select exactly the right
one to apply. Neither the stimulus material nor the items"prompts" him in making his selection and, in general, the
material is unseen. If it is familiar, the item will make
the student think about it in a previously unconsidered way.
Many items in the Bank which are based on hypothetical
situations require the process of application.
Process 4: Analysis
This process, like the previoUs two, can be tested mosteffectively by items based on material previously unseen,but analysis requires more sophisticated thinking than do
the processes of comprehension and application.
Items which require analysis test a student's ability to
recognise the bias, the underlying assumptions and
organisational principles, or the errors in logic of
any given communication.
(Note: As this is a "taxonomy", and not a straight
classification, items which require a more advanced mental
process may require earlier processes as well. For example,
a student may need first to "comprehend" a graph before he
is able to "analyse" it.)
Difficulty
This characteristic of each item is expressed as a percentage,printed just beneath the access number. , It is the-percentage-
,
of all those students who got the item wrong whedit wastrialled. Thus a high percentage (greater than 70%) indicatesa hard item, and a loa percentage (less than 30%) an easy one.(Note that separate percentages are printed for Level III andfor Division 1.)
If you refer to item 00842Q on page 15, you will observe thatthe item's difficulty is 48% for Level III and 67% for Division1. This means that, of all Level III students on whom theitem was trialled, 48% got it wrong and of all Division l's onwhom it was trialled, 67% got it wrong.
All items in this Bank have a fourth highly importantcharacteristic in addition to the three described above.It is -
(d) Discrimination
Items which discriminate have the faculty of picking out themore capable pupils in your class. If an item discriminateswell, then the more capable students will tend to get it right,while the less capable students will tend to get it wrong - nomatter how hard they try to guess the right answer.
The measure used to indicate each item's faculty to'discriminateamong students of different abilities is the point-biserialcorrelation, or PBC. This two-figure decimal, although notprinted in the Bank, is entered in the computer data store foreach item, along with the item's difficulty percentage, itsaccess number and its correct answer.
The PBC is based on a comparison of students' scores on oneparticular item with their scores on the remainder of the trialtest in which that item occurred.
All items in this Bank have a sufficiently high PBC, derivedfrom the results of trialling, to warrant their publicationand use.
5. How to Read the Access Number of Each Item
You will find two of the item characteristics described above -(a) content areas and (b) mental processes - coded in the access numberof each item. The following information should assist you in under-standing that number:
(i) The first digit of the access number describes thecontent area of the item. It will be any digit from0 to 9. (Refer to 4(a) Content Areas, above.)
The next three digits indicate the number of the itemamong all those items within a particular content area.
(iii) The fifth digit describes the mental process requiredto answer the item. That digit will be either a1,2,3 or 4 - and indicates whether, the process requiredis knowledge, comprehension, application or analysis.(Refer to 4(b) Mental Processes,,above.)
The letter at the end of the access number is the checkletter. Since the only identifications of the itemswhich you might select for moderation are the access
:numbers, these letters have been included so-thattranscription errors will nearly all be detected.(For the mathematically inclined, they are the residues,mod 23, coded to letters but omitting I, 0 and S.)
Example: On page 15 of the Bank, you will find an itemwith the access number 00842Q.
(i) The first digit, 0, shows that this item isin the content area of Diversity.
(ii) The next three digits, 084, show that this is
the 84th item in that area.
(iii) The last digit, 2, shows that this item requiresthe second mental process, comprehension.
(iv) If 00842 is divided by 23, the remainder is 14.When coded to the alphabet, omitting I and 0,Q is obtained.
Fart II - The Self-Moderation Scheme
Before 1974 nearly all Higher School Certificate subjects, atboth Level III and Division 1, were assessed wholly by an externalexamination. In 1974, this situation changed dramatically:W.mision 1 assessment became wholly internal for nearly all subjects;and for six subjects an internal component within the rango of 20-50%became part of Level III assessment. By the beginning of this year,1975, the number of subjects with an internal component at Level IIIhad nearly doubled.
Many H.S.C. teachers have welcomed this change because of thegreater scope and flexibility which it has inevitably given to theirteaching. But this change has also tmought teachers of.nearly allsubjects face-to-face with an unfamiliar problem. The problem isthat most of them still consider it necessary, for many purposes, tocompare the abilities of each student in the state with those of otherstudents taking the same course rf study, and teachers of Division 1classes can no longer resort to an external examination as a means ofachieving this comparability; also teachers of Level III classes havefound themselves suddenly responsible, in some subjects, for up, to 50%of each student's final assessment.
High school teachers faced this same problem several years ago,when external examinations were abolished for School Certificatesubjects. In the late 1960's the Department's Testing Divisionbegan developing an alternative scheme which could moderate standards,as the external examinations had previously done, but which could also,unlike the externals, leave teachers ultimately responsible for theassigning of awards to their own students.
This Self-Moderation Scheme, described in the following pages,received its first use in 1971. Since then it has been widely usedfor moderation in those subjects for which Item Banks have beenconstructed. This Bank, the second to be published for a HigherSchool Certificate subject, is the eighth Item Bank to include theScheme. (Refer to Appendix F for titles of the others.)
The General Idea
The Self-Moderation Scheme is based on the following assumptions:
- that students do not all study exactly the same content areasof a subject or learn exactly the same skills - nor do theynecessarily study in the same manner and with the same emphases;
- that teachert'; find it desirable to give individual studentsawards which are based on a variety of abilities rather thanon any one particular ability;
yet- that a group of students who receive a particular award (e.g.,
a Credit) in a particular school should have abilities whichare comparable with those of a group of students who receivethe same award in any other school.
Thw Scheme has therefore been designed to allow subject departments
and teachers substantial autonomy with regard to what abilities they
test and how they test them; yet it has also been designed to ensure
that-students throughout the state who receive.the same award in a
subject are those whose abilities in'that subject are comparable
(though not necessarily identical).
The main characteristics of the Scheme are the following:
- it provides information about a group of students, not
about individuals;
it is based on tests chosen either by a subject department
or by individual teachers within a school, not by State
or Regional Committees;
- it is computer operated;
its use, and any action following that use,
voluntary.
These characteristics are discussed below, und the actual
procedure to be followed is described in detail on pages xix to xxiv.
3. Reasons for the Use of a GroüD Method
It matters little whether a student!s responses to the questions
are intended to be brief or lengthy - any test which requires written
responses is restricted'in'what it can,measure. Fbr example - a
student's attitudes, interests, appreciationiand'enthusiasms, on the
one hand, or his speaking ability and manual skills, on the other, 'Art
most difficult, if not impossible, to test in this way. No test
which requires written responses is capable of measuring all of a
student's abilities in any subject. Awards based exclusively on the
results of such tests can often be misleading. .
Objective tests composed of items like the ones in this Bank,
although capable of measuring a fairly wide range of abilities, are
even more restricted in scope ihan are other types of written-tests.
For not-only are they incapable of testing attitudes.and-skills in the
affective and psychomotor areas mentioned above; they are also
incapable of testing a student's ability to create, and to make
reasoned judgements.
An objective test, however, is capable of testing a student's
knowledge of a subject, and - perhaps more importantly - his ability
to use the relatively higher mental processes of comprehension,
application and analysis. What is more, objective tests can be
constructed sO that they have both validity and reliability -
characteristics which are not easy to achieve with tests requiring
written responses.
If a test item has validity, then it measures that particular
ability which it is intended to. measure. (For example, if, a Biolcgy
test item - which is intended to measure only a student's understanding
of,a table he has just read - contains words too difficult fbr most
student's to Understand, it would not be a valid item.) One measure of
an item'S validity is its faculty to discriminate between students of
different abilities. If an item discriminates well, then the mcc'e
capable students in a subject will :tend to'get it right, while,the 1less
capable students will tend to get it 'wrong - no matter how hard they
try to guesS the right. ansWer. ''
If an item has reliability, then the result of.students' attemptsat that :1,tem will be repeatable regardless of when or where or howmany timel-s they answer it. (For-example, those who know-how to_answer.it_will get it'right.on,a.Monaay.morning-in.Hobart-and,onaFriday afternoon in Devonport - in 'this year Ot-anY Year.) Anobjective item can be more reliable than most other types of itemsbecause it is not Subject to the,whims and moods of the person whomarks its answer. The answer is invariably either "right" or "wrong",no matter who marks it - even a computer.
All items in this Bank have acceptable validity and reliability;and, additionally, they are capable of testing the mental processesof knowledge, comprehension, application and analysis.
An objective test composed of items with these characteristicscan be used with great effectiveness for the purpose of self-moderation.When used for this purpose, however, the resulLs of such a test -
because of its restricted sCope - should not be used to place studentsin order of merit. Instead, the results should be used only toindicate the numbers of students in a school,'or even in one class,who should receive C's, P's, L's and N's. These suggested numbersfor each award would have been obtained by comparing the school's orclass's performance on those items selected for the test with.theperformance, on the same items, of other classes throughout-the state.An objective test composed of ftems fram this Bank, then, would beeffective in producing information about the abilities of a class as.awhole, although it would not be particularly useful for placingindividual students in order of merit.
This use of an objective test for measuring the abilities of aclass, and not of individuals, should prove liberating for a.teacher.WO7lesires independence and responsibility. For once a-teacher knowshow many of each award-he can justifiably give, he is then able to use,with confidence, all the information which'he has obtained.about thevaried abilities of his students as his basis for deciding which--students will receive which awards - with the result that his awardswill reflect his own subject emphases and style-of teaching.
How the Group Method Works
(a) An objective test consisting of items selected from thisBank is given to a class. The test, because it isobj ctive, will have all the disadvantages-mentionedearlier - if the results are used to3 place individualstudents in'order of merit. However, the purpoSe.ofthe test is not to measure the abilities of individualstudents, but to measure the abilities of the class asa whole. It is assumed that a measure of the class'saverage_ performance on an objectiVe test will ilgET;7afair measure of the class's average performance in areaswhich' lie outside the scope of objective testing - suchas creative work and evaluation, or the.affective,andpsychomotor areas. Therefore the test will give a-fair'result for the class as a whole.
22
The result obtained from the test is simply_theumber ofstudents who should receive each award. For_example, the
test may reveal that, of 30 students in a class, 5 'should^receive-a-C,-16 a P. 5 an L and 4 an N. The test,result- _
does not indicate whi;11 students should receive which awards.
(c) The teacher then considers all the information he has about
the abilities of his students. Only after taking all such
information into account as the basis of his individualawards, he will then give his best 5 students C's, the next
16 P's, and so on. Thus he is using far more informationthan the test .score as the basis of his individual awards -
with the result that the order of merit of his studentswhich he finally,decides on could be quite different fram.
the order of merit of his students on the test, even though
the numbers of students who receive each award will closely
approximate what the test scores indicate.
5. Why Teachers Choose Their Own Tests
Teachers do not all involve their students in exactly the same
content areas of a subject - nor do they all teach in the same style
and with the same emphases. So why should all teachers have to give
their students the same test? The problem in the past has been that,
if different teachers chose different tests, then the results which
teachers obtained would not have been comparable. Testing
developments of the last five years have largely overcome this
problem: the Self-Moderation procedure is able to compensate for
differences in item difficulty and discrimination so that, regardless
of which items a teacher selects from this Bank, the result for his
class will still be comparable with what it would have been if he had
chosen some other set of items instead.
. The Reason for Computer Processing
The calculations required by the Scheme involve a comparison of
students' answers throughout the State to items of, virYing difficulty
and discrimination value. (Refer to Appendix C for a description of
the required calculations.) Such calculations are excessively lengthy
for a person to make quickly, especially when they must he made for
hundreds of answers. BY using a computer, tests and answers can be
marked more accurately and returned to teachers more quickly than they
could be otherwise.
Howrtol.fae, etatiOn
7.cute.4
,iner4.4';
hp- of44:::t ,;=Iyx71,44
.If'a-teacher'Sathe, above; .thenAiinâlidand
r-4 tx''WHATEVER4bit Se,'d
%.orm,4=',
' 'r r
A PROFESSIO PRO'. .
..
. .
Some'ImpOriant,Prelidina
A:s.-.*t.i'PO4;.,.m40:t4044tIO#?*.
ridtposesg-ei,. tlershould b(g4ej ie nçi17.thetouise or shOnidAies:,tki.or:g..92,,
topics whidl hava_beenyS0,tcSting.
k - r(i i) Any test fet...sett;;mo'cletation.'' Oae.s.;;;;$reasonablikiixed with regard tp,areai and niental prgcesses A. ts wi.cbcers : .
onlij: one ; Or tWO.;',,are4".,:ior:misieading resiii:Es'.!4;;:.;:..'*: -,
"
The: saMei.test,Can lie,-44eitz". .:'-5
, .
or Dl.visxon: 1-..classeS ot -a:rseparate ,test--c an-4be---.'seleCted .. bY.-eaCh-,- teacher . :_'....131bit-hiiiiiii.;.4-Ciiili0-=',i-achoseri-;,,:'ilL,.the(itotioiiing-'!!atepse,''-:mils ;., a err'.:for each test;: whether.one, at tevere.1:-.---;
(b) Steps to be Taken! for Eath Test .
(i) If the:group. to,be.tested consists of IS or AOteStudents,' seiect 20.136, ,suitable nc.dueregard of 'the pointi; in, (a)abeire. If feWerc,than
Admdnister the test : tell the students te answer,every question, even'if theyhave to guess;
: give iceilifY stUdents timeto finish comfortably;
: do not help them at all,even with instructions.
(v) Collect both the test copies and the Answer Sheets.
(vi) Number the Answer Sheets serially, starting at 1,and keep a copy of these numbers for later reference.You need not mark the answers.
Fill in completely a copy of the Cover Sheet.(Refer to the example on page xxiv.)
Note that you have received one Cover Sheet forLevel III and a separate one for Division 1.Make certain that you use the appropriate one.You should make a photocopy of the appropriateCover Sheet, and record your information-sm thephotocopy. Retain the original as a "master++copy for future use.
NOTES: (a) Make certain that yoU recOrd theBank Access Number-accurately....______
(b) The Numbers Of DeSired Awardsshould represent yoUr opinionof your class. Include hereonly those.students for whomyou have Answer Sheets - i.e.,omit absentees. ....
Send the Cover Sheet, with all Answer Sheets,to the address given on the Cover Sheet.
You will receive back a computer. printout withina few weeks.
Interpretation of the Printout
Checks you may wish to make:
Have the correct Bank Access Numbers been used?If the Number ef Items in Test is different fromthe number you wanted, a note will,appear,on thelines of the omitted items. Has this affectedthe validity of your test?
- Is the Number of Answer Sheets Received correct?
- Is the Number of Desired Awards correct?(Column D of Section III.)
What the printout sections contain:
- Section I repeats the item numbers you chose, intwo orders - yours, and the order in which theyappear in the Bank.
- Section II gives each student's score, accordingto the numbers you wrote on the Answer Sheets.
- Section. III shows how your result "was ,obiaille
- Section IV' is your 'result - particulaily notethe Class Retult part.
. - 'Section V itthe 'erroi analyisis result.
(iii) What the Result means:
.- if .you are "within" the range; your .Numbert:..ok.:
'Des4red Awards (COlUmn D) agree .with:,the general ..
'state:standard. You tan:,nowgo:ahead'and; asinditatedin 4 (c) above , give these awards tothe. studentt Yr.ou thini mast'. desrVe-:- . - . - .
- If you have-been liaT47-orilopeiquAthe prOpout:, will tell ibu-how *,*C44Agey4Or -DO#204.:Ayar4444:recalculate to conie.:,Within..
you want. to. Notethat ,ih0Aiialf00414..4:R '= T ± ind. that- the. vaiiiiifICUi6A'at ihe top' Of' COlUniti -G. -1.
-,.711.e.Individual Student Result t :*i.o..nert:ver41*fulbeCause the' ranges:in
.
Column C overlap.
so much.
i reflection' of the untertainties :dittutse-in 3 above: '
IVhat the Error Analysis means: .
This section looks at your students' results on 'varioUssub-sets of your test items. Por each sub-set, twocomparisons are made:
- with,the average state data - i.e., your students',results are compared with the 'average state resultt;'
- with your expectations - i.e., your students' resultsare compared with what they should achieve if their '
ability is as in your Desired Awards.
In both cases the number of errors actually made iscompared with the number of errors to be expected,
. foreach sub-set of items. You should.note the following:
- A comment is made only if either (or both) of thecomparisons shows a difference from the calculated
.
result.
- A "High" comment would mean your students have mademore errors than expected.
_ A "Low". commeni would mean your students have madefewer errors thanexpected.
. ..... _ 1.
- The possible sub-sets are listed in Appendix D.
A more detailed discussion of the whole procedure 4sin Part III, following.
The Self-Moderation Scheme is designed to compare a school'sor class's performance on an entire.test,with that of other schoolsin the state. However, a test used for the purpose of self-moderation contains several content areas and requires several
mental Processes. The Error Analysis PrOcedure is designed tocarry,the comparison one stage further:, it provides for,a comparisonof a. school's or class's performance-on iteis within:each,contentarea of the test, and that area's sub-divisions, with'the performance,on similar items, of other Tasmanian schools: Therefore its purposeis primarily diagnostic.
. -particular areas of the 'syllabus for remedialHteachingfor'_their.class as a whole:. thiS Use.,ofthe.Bankiiiht.be'iOit'effectiire.,:earlY:".
. . _ ,
in ihe year, when moderation of standards'is not .sogreat'd.cOncermasis the selection of teaching emPhasei.'
-
2. How the Procedure Works
The analysis of students' errors in answering test items, will-beincluded on the same computer printout which contaAns the results oself-moderation. If a teacher decides to Use a test for diagnosticpurposes in Term I, he can largely ignore the moderation advice, andmainly weigh the error analysis section of the printout. In thissection, error analyses will be printed only for those areas of thetest in which the class's performance is either above or below thederived standard. The analyses themselves will-simply be lists ofphrases which describe the stimulus material on which the items werebased and the mental processes required to answer them.
The phrases on which the error analysis is based may be found inAppendix D, which contains lists of mental processes, of itemdifficulties, of possible errors and of sub-divisions within eachcontent area. These lists of sub-divisions within each content areawere drawn up as an attempt to answer the question: What are theproperties of each item which might cause students difficulty inanswering it correctly?
The lists, obviously, are not exhaustive. They may.need to beadded to and revised later. Comments on them will determine futuremodifications. The lists intentionally do not include suchsubjective considerations as the stimulus material's interestingness,relevance to students' lives, etc., because these would varyenormously from student to student. Nevertheless, the lists wereconceivc as an effort to "get at" whatever it is that makes studentsunable to answer certain items correctly.
30
An Example
Suppose that a teacher receives the following error analysis
result for a test:
Basis of Analysis 'Numberof
errorsMade
Number of errorsexpected if your
group is:
Comment re numberof errors made if
group is:
averageas
desiredaverage
: desired
. Content Area
Diversity 153 140-127 125-104 High High
Classification, levels of 32 35-24 30-21 Average High
Classification, animals 47 25-17 21-14 High High
Organs, systems 63 63-49 5548 Average High
Animal systems 55 32-25 27-18 High High
Evolution 41 57-48 54-43 Low Low
2. Mental Processes.
Comprehension 239 240-212 227198 Average: 'High
Translation 77 53-39 48-35 High High
Distinguishing Assumptions 26 32-27, 3044 Low Average
3. Difficulty
Easy items ((30%) 83 74-61 68752 Hi
4. Other Types
Classifying Organisms 54 33-22 30-19 Hi High
The teacher might draw the %following conclusions:
(a) His class is below average;.and also below expectation,
in several content areas. These areas are to do with
classification, particularly of animals. This weakness
is most probably in the comprehension type e mental
process, and especially where translation is involved.
(b) On the other hand, his class has done well in questions
about evolution and, probably in this-connection, is
above average in distinguiihing assumptions made.
(c) They have not done well with the easy items.
He may decide, on this evidence, that some intensive work on animal
classification should be done, perhaps at the expense of time planned-to
be spent on aspects of evolution.
* * * * * *
31.
Part IV - The Construction of Tests
The following suggestions may assist you in Constructing a,testconsisting of items from this Bank, regardless of the test's purpose:
1. Decide on the types of items you are looking for.The best way to do this may be to,draw up your ownblueprint (similar to the ones in Appendix A) forthe,sections of the course which you Wish to test.You will then be able to fill the, cells of theblueprint with the numbers Of items which yaurequire for each content'area and mental process.
2. Consult the table of contents fot the page numbersof each content area.
Select your items, remembering that the fifth digitof the.access number indicates the mental processrequired for answering them. Also, take into-account the difficulty percentage of the itemswhich you select. Note that two difficultypercentages are printed-beneath the access.numberof each item -the first for Level III and.thesecond for Division 1. When "NS" is printedinstead%of a percentage, it means that the itemis "not suitable" for inclusion in an achievementtest at the level indicated.
4. Photocopy the items you select, and get a secrets:ryto cut "scanned" stencils of them and print them(as described on page x); or
Make a list of the serial numbers ef the items youselect, in the order in which you want them typed,and hand this book to a typist. She should-typeonly what is to the right of the margin, with yourown numbering system.
* * * * * *
NOTE ON TEE SECURITY OF ITEMS
If this Bank is to be used successfully from year to year,it is obvious that students must not be allowed to retain copiesof the items indefinitely. Therefore, in the interest of allteachers, it is suggested that you do the following:
1. Collect all test papers containing items fromthis Bank immediately after use.
2. Collect all pap6rs containing Bank items usedfor other purposes within a reasonable lengthof time, but make it clear to students thatyou want all papers returned.
Keep the Bank itself secure.
33
,
r, '24%
D1 - 30%
The difference between organisms
A. likeness.B. characteristic.C. structure.D. -diversity.
is: referred -to iS :their.
00021Y Classification of plants is based mainly on observations .oL.III - 47% the differences .in theirD1 - NS
A. geographical distribution.B: reproductive struOtures.C. root, 'stem and leaf structure.
00031J -Whith one of the following stateients about viruses is true?L.III - 25%1)1 23% A.. They reproduce only
B. They behave as if they were piants.C. They always occur Assodiated With bacteria.
They are completely inactiVe Outside thehost ' s living. cells
00041VL.III -. NS
D1 - 46%
aerobic condition is a condition in which-
A. nothing can survive.B. bacteriophage attack bacteria.C. bacteriophage die from lack of '.oxygen.
. oxygen is available.
00051F The best .eVidence, that tWo ropulaticnig. belong io...the sameL.III - 19% .species is-that they have .
.. . ...,,. _
. D1 - 29%A. similar :characteristics.. .
. -B. infertile Offspring produced from interbreeding-- -.. . . . .
in Captivity::. .. . -- -. :"...
C. the same niche:requirements...-. fertile 'offspring _produced from- interbreeding
.
under natural conditions. ...
A liverwort does not have
A . rhizoids.chloroplasts.
. conducting vessels.
. spores.
= NS'
As we consider the organisms from speciesincrease in
A. unity.,
B. diversity.C. structural similarity.D. colour similarity.
Before a scientist can- cla.s.sify.a newly discovered specimen of
plant; he must make",a careful study of its
A., relationships in the plant and animal community.
In which one of the following respects do viruses differ from
cellular organisms?
A. They multiply in the tissues of animals and plants.
B. They contain genetic material.
C. They can be crystallised.D. They can be studied under the electron microscope.
Photosynthesis would never be carried on by any organisms
belonging to the
A. bacteria.B. fungi.
C. flagellates.D. bryophytes.
There are many more kinds of bacteria than there are shapes of
bacieria. Therefore bacterial taxonomists
A. use characteristics other than structure in their
classification schemes.B. base their classification only on nutrient requirements.
C. classify bacteria primarily according to colour.
D. use the electron microscope to determine the shape of
bacteria.
'00141D
L:III - NS- 62$
Which of the following properties is NOT shared by bothviruses and bacteria?
A- They are killed by high,temperatures.B. They can survive'outside living organisms.C. They contain nucleic acid and protein.D. They can multiply only in living cells.
00151P The fact that best supports the idea that viruses are livingL.III - 28% is that theyD1 - 43%
A. are made of common chemicals.B. duplicate themselves.C. cause disease.I): penetrate cell membranes.
00161A A major disadvantage of the spores of certain tracheophytesL.III - 77% as opposed to the majority of seeds of angiosperms is thatD1 - 79%
A. the spores contain little food.reserves.B. the spores are not easily dispersed.C. the spores require special conditions fbr germination.D. relatively few spores are produced.
00171LL.III - 19%D1 - 21%
A. MOPT4ifference between lernsand_IYmnoapermS_is.that
A. fernsAo not:have avascUlar:system.B. alternatiOn:bf,,generations is more conspicuous,.
in gymnospermS-..
gyMnosperMs ,arp'-dispersed:br.seedS, fernS, by spOreS.,:ferns;donOthaVe:roots,..:.onlunderground stems.
00181X Which of the following distinguishes angiosperms from allL.III - 26% other plants?D1 - 27%
A. large, woody stemsB. flowersC. seedsD. stem, root and leaves
0019111
39%.D1 48%
gumL,III - 73%Dl NS
Plants which belong toAhe same Order also'belong to the same
famiiY-4ass..genus,
species.
It is common to all flowers that they
A. have petals.B. have stamens.C. are borne by angiosperms.D. are brightly coloured.
7
-:.
0211E:LIII - 26%.
-D1 -:24%'
00221QL.III - 28%D1 - 28%
00231BL.III - 30%D1 - 32%
'Wind-pollinated. flowers typically have,
A. iTistifs with enlarged or:branched tips.B. .1rrightly .COI(*red petals. ,
. ,
. : O. enlarged. sepals._
D. glands .at the 'base 'ol..the petals which secrete nectar.
Which plant does not belong-to the same phylum as the other
three?
A.. penioilliUmB. layihrOom
C. .biid'S nest, fi:ingus
Which of the following are the most closely related?
A. two genera of the same- family
B. two orders of the same class
C. two classes of the same 'phylum
D. two 'species of the same genus
Two species whichlbelong,to the:same genus 'mist..
.be,,indistinguishablefrom:One. another, Without oloSe,study:
. -. .
. .
. a. live in similar environMent s ., , .
C, belong- to-the sailie-,family:, . , .
00241M Usually the members of a family of organisms are less alilce than
L.III - 36% the members of a/an
D1 40% A. order.B. genus.C. class.D. phylum.
00251Y Which of the following statements about a biological key is not
L.III - NS true?
D1 - 53%A. It may be used to distinguish between species.B. It may be used to distinguish between genera.
C. It may be based on the colour of ,an. organism.It may be used to give an idea of the number of
organisms in a species.D.
00261J On a group of islands there are isOlated populations of two types
L.III - 22% of birds. Which of the following obiervations would ba most
D1 - 35% important in classifying' these birds at.the species level?
A. The birds five in similar liabitatS:.
B. The birds have a different' cOloured plumage.
C. The birds have a common fossil ,ancestor.-
D. The birdi will interbreed and 'produce fertile offspring.
J
00271V ,
44%, ,
, D1 46%
00281FL.III - 33%-D1 - NS
A02911- NS
:D1 7 64% -
Which of the following is not a common characteristic of boththe flatworms and the jellyfishes?
A. one opening to the gutB. need for a watery environmentC. possession of reproductive cells
xsdial symmetry
Which of the following objects isradially symmetrical?
A. saucerB. jam jarC. hen's eggD. coffee pot
least likely to be termed
The most distinctive features of coelenterates are
A. bilateral symmetries.B. jointed legs.C. dorsal and ventral nerves.
'stinging cells.
00301C'L-III L.:61%.._
.Dl NS.
L,III,-.56%:Dl 7 : 54% .
00321ZL.III - 16%Dl 12%
The best way to distinguish between the members of the PhyltmdPlatyhelminthes (flatworms) and the Phylum Nematoda (roundwoxms) .
is to note that
A. nematodes are segMented and'plityhelminths are not.B. platyhelminths are not Usually parasitic while
nematodes are. -. . .
. platyhelminths are-Uguilly large and nematodes small.. nomnatodes have two openings to their digestive tract
and plityhelminths one or none.
Ticks, crabs, spiders, and grasihoppers all have in common
A. the same number of segmented legs.B. a notochord.-C. an exoskeleton of chitin.D. a closed pump circulatory system.
.
Millipedes and cockroaches are classified.in the same phylum.Which one of the following similarities would be of least use:in deciding on this classification?
'-A.::BothateSegmented:and have_legs attached to soie
. Both haVe totigheXternal:skeletons. Both lrve under stones.or in woodheaps.,
D. Both have a tubular:digestive syStem.:
00331KL.III -- 31%Dl, - 28%
,
A horseshoe crab can be distinguished from a seahorse by its
A. jointed legs.B. bilateral symmetry.C. radial symmetry.
cilia.
O034114
D1
Which of the _following listS of animals all belong to thesame phylum?
Which of the following pairs of characteristics best describesall species of mammals?
A. They have hair and a placenta deve/ops in thepregnant females.
B. They have hair and the females never, lay eggs.C. They have hair and the females suckle the young.D. The female suckles the young from manunary glands and
when pregnant develops a placenta.
00421HL.III - 49%D1 - 47%
00431UL.III - NSD1 - 3S%
00442FL.III - 14%D1 - 16%
00452RL.III - 17%D1 - 28%
Ifan astronaut claimed to haVe'ditcovered life.On anotherplanet, the,substance hejoUnd:Would'haVe to
A. be Mnde ofcarboncontaining molecules.B. respond to environmental stimuli:C. be able.to move freelyD. contain water.
(N.B. The Student's Manual should be used in answeringthis question.)
A green covering was observed on the surface of a lake.When viewed beneath the microscope, it was found that thegreen colour was composed of small threads, each containinga number of cells. Using the information on pages 2 and 3of Ex. 2-4 of the Student's Manual, Part I, which of thefollowing plants could cause this green colouring?
A. bacteriaB. water mouldsC. red algaeD. blue-green algae
The seaweed Acetabularia mediterranea would be expected toresemble most closely
A. Mediterranea crassa.B. Mediterranea crenulata.C. Acetabularia crenulata.D. -Crenulata acetabularia.
Which two plants in the following list are considered tohave the most characteristics in common?
Common Name Scientific Name
King Billy pine Athrotaxis selsginoidesnative pear. Pomaderis ellipticatwining pea Glycine clandestinagolden pea Aotus villosadogwood Pomaderis apetalaHuon pine Dacrydium
A. twining pea and golden peaB. dogwood and native pearC. Huon pine and King Billy pineD. native pear and twining pea
Of the following, the pair of organisms which would be most
similar to each other would be in the
A. same class but different orders.
B. same phylum but different classes.
C. same family but different genera.
D. same kingdom but different phyla.
The following five questions are based on possible w
classifying the animals pictured below.
IV. CrustaceaA .
III. Planarian
00472N- 17%
D1 - 24%
A1104822-LIU.- 31%
00492KL.III - 12%D1 - 26%
00502WNS'
54%
V. Hydra
If IV is placed in one group and I,II,III,V and VI inanother,
the basis of this classification would be
A. bilateral symmetry versus radial'symmetry.
B. exoskeleton versus endoskeleton or no skeleton.
C. seRmentation versus no segmentation.
D. tubular gut versus sac.
If IV and VI are placed in one group and 1,11,111 and V in
another, the basis of this classification would be
A. backbone versus no backbone.
B. segmentation versus no segrentation.
C. special respiratory organs versus diffusion
of gases through body wall.
D. tubular gut versus sac.
If I and IV are placed in one group and 11,111 and V rtre placed
in another, the basis of this classification is most likely
A. segmentation versus no segmentation.
B. backbone versus no backbone.
C. lungs versus no lungs.
D. bilateral symmetry versus radial symmetry.
Which of the following could not be used to
into two groups?
A. terrestrial habitatB. producer versus consumer
C. blood versus no blood
D. appendages versus lack of appendages
divide the animals
-.00512G28%,
D1 ,- 44%, ,
00522TL.III - 23%D1 - 31%
00532DL.III - 22%D1 - 29%
00542PL.III - 27%D1 - 38%
00552AL.III - 49%D1 - 64%
00562LL.III - 59%D1 - 60%
00642YL.III - NSD1 - 59%
-Which of ihe animalshas an endoskeleton?
A. I.
B.
C. IV.
D. VI.
The following questions are based on the table set out below.
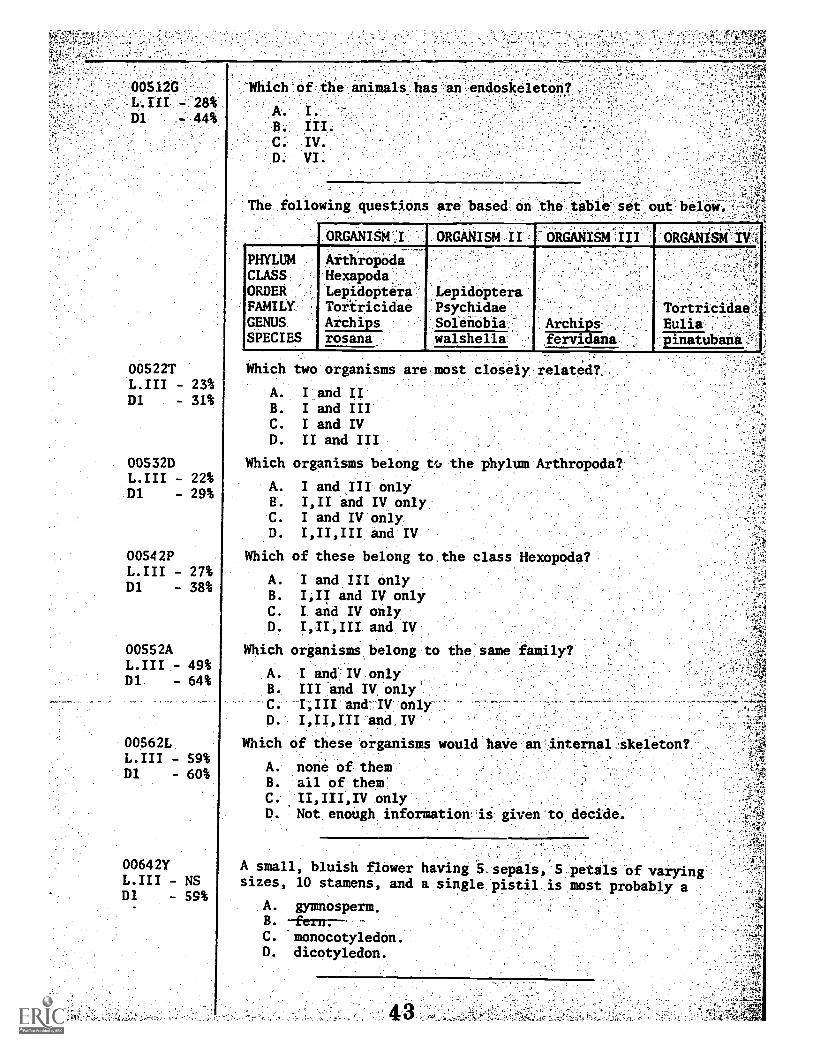
ORGANISM:I ORGANISM II 'ORGANISM III_ _.
ORGANISM IV
PHYLUMCLASSORDERFAMILYGENUSSPECIES
,
ArthropodaHexapodaLepidopteraTortricidaeArchips
LepidopteraPsychidaeSolenobia Archips
Tortricidae-Eulia .
7iiiifubanarosana walshella fervidana
Which two organisms are most closely related?
A. I and IIB. I and IIIC. I and IVD. II and III
Which organisms belong tea the phylum Arthropoda?
A. I and III onlyB. I,II and IV onlyC. I and IV only.D. 1,11,111 and IV
Which of these belong to the class Hexopoda?
A. I and III onlyB. 1,11 and IV onlyC. I and IV onlyD. I,II,III and IV
Which organisms belong to
A. I and IV onlyB. III and IV onlyC. LIU and IV onlyD. I,II,III and IV
Which of these organisms would have an internal skeleton?
A. none of themB. ail of themC. II,III,IV onlyD. Not enough information ii given to decide.
A small, bluish flower having 5 sepals, 5 petals of varyingsizes, 10 stamens, and a single pistil is most probably a
A. gymnosperm.B. -fern.C. 'monocotyledon.D. dicotyledon.
e questions following are based,on the animals Plotore4 below.
Centipede
IV. StarfishVI. Spider
00572X III and VI can be clasified differently from the others on the- NS basis of
, D1 - 28%A. possession of blood.B. number of body layers.C. presence of a nervous system.D. presence of jointed appendages.
00582H I, II and IV can be clasified differently from the others onL.III - 17% the basis of having1 - 24%
A. no segmentation.B. radial symmetry.C. an exoskeleton.D. jointed appendages.
00592U II and IV can be clasified differently from the others on the
L.III - NS basis of havingD1
A. segmentation.B. an exoskeleton.C. radial symmetry.D. stinging cells.
00602E Which of the following represents organisms that belong to the
L.III - 66% same phylum?-D1 - S5%
00612QL:III - NSD1 - 31%
00622BL.III - 25%Ul - 31%
A. I-and II-
B. II and VC. III and VD. III and VI
Which of the pictured organisms belongs to a phylum thatincludes mostly parasitic forms?
A. I
B. II
C. IVD. VI
Which of the pictured organisms have digestive systems withonly one opening?
A. I and II onlyB. I and V onlyC. II and III onlyD. II and V only 44
Plants may be described and consequently claisified into their,
main groups (phyla arid classes) using charictiristics other'than their reproductive structures. A. fungus COulci bedescribed as a plant which
A. is composed of-filaments and does not possess roots,leaves or,chlorophyll.
B. is composed of filamentsjn close contact with algalcells^but does not pissess chlorophyll.
C. is non-vascular, possesses both chlorophyll and leaves,but has no true roots .
contains chlorophyll, but does not possess stems,roots, or leaves.
00652JL.III - SS%D1 - 67%
A small, flat, green plant. without stem or.root is foundgrowing along the banks of a stream. It is attached loriselyto the soil by rhtzoids and is most probably
A. an alga.B. a club moss.C. a liverwort.D. a lichen.
The questions below are based on the following illustrations.
II.'Chlorella.,(Chlorophyta)
IV. Moss(Bryophyta)
V.
--00.11u$ca)--
00662VL.III - 17%D1 - 38%
00672FL.III - 12%D1 - 20%
If I and II are classified differently from all the others,it is probably because they both are
A. green.B. nucleated.C. unicellular.D. multicellular.
If II, IV, and VI are classified differently from all theothers, it is probably because they
A. reproduce sexually.B. are multicellular.C. have plastids containing chlorophyll.D. lack conducting tissue.
A. two different speciek,':9 , s' enut;-;. . , .. _. ,B.. two faiiilies eif,the' sale t specie
. C. two . different -species :' or diffeterit . generaD. , two iaCes,--# .. the, same :species' -
Without knowing the common names :of Poa pritensiSPoa annua- L. , and Poa auttonaiii ,Muhr:7-xou. know immediatelythat they are closely ieiWeTrild in the, same-;-
A certain species of bacteria.is found to be growing on theinside of concretelgater pipes,, carrying drinking water.Howdo these bacteria acquire energy?
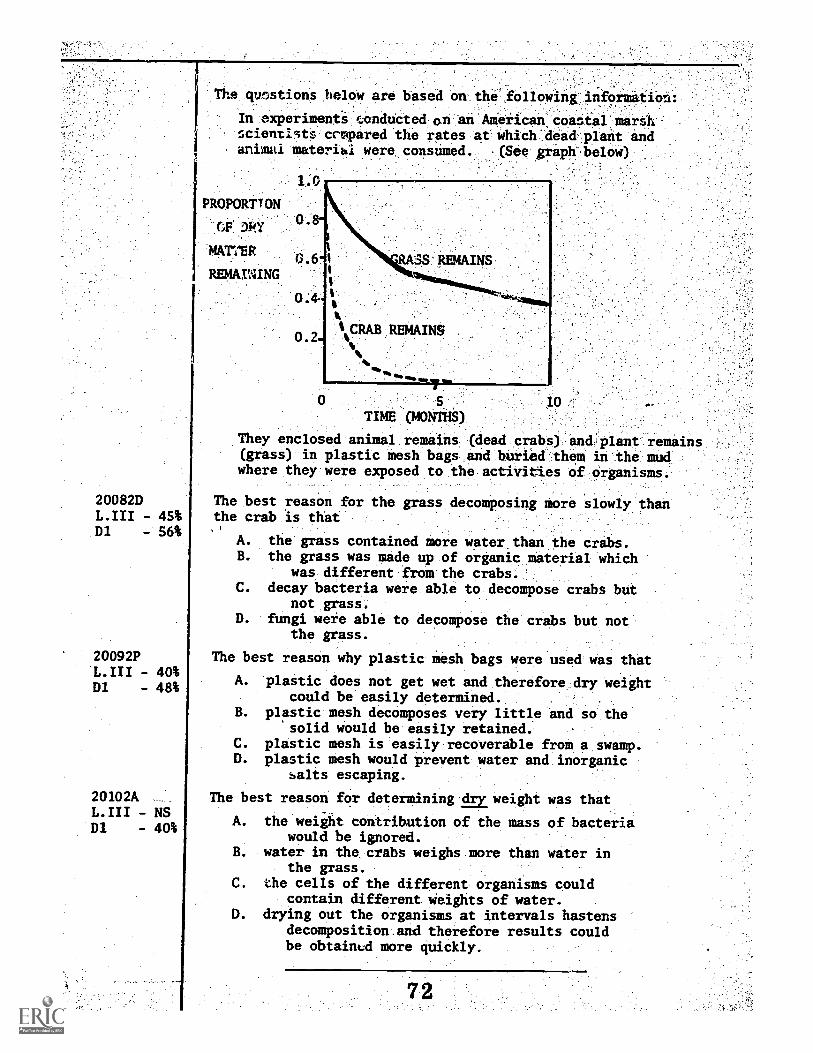
A. The bacteria feed on passing viruses.B. The bacteria feed anaerobically on the water.C. The bacteria digest the' concrete.
The-bacteria ingest each other.
A particular species of bacteria is.normally found in-bottledmilk. An agar medium was used to measure growth curves:andthe following results were obtained:
2- 3 4-Days
00792L It would be reasonable to conclude from the graph that
L.III - 29%A. growth reaches a maximum at 5 days. 2.D1 - 52%B. these colonies have a maximum size of 4 mm area.
C. the area of a colony does not depend on temperature.D. milk infected by this bacterium is best kept in the
refrigerator.
00802X In recent studies of food poisoning from rice meals, a
L.III - 82% bacterium (Bacillus cereus), common to raw cereal grains,-
D1 - 86% has been shown to be responsible. However, TopleY andWilson's Principles of Bacteriology and Immunology - thebacteriologist's bible - bluntly states that Bacilluscereus is "... non pathogenic to man ...". The oRtimum
,growth temperature,0f Bacillus cereus .00°0:C_a°4it is probable that food poisoniiii-Fgsnits from rice baingboiled, stored in bulk at room temperature, and fried upas required. A definite conclusion from this informationwould be that
A. boiled rice should be stored in a refrigerator.
B. Bacillus cereus is a non-pathogenic organism.
C. care should be taken when eating rice meals.D. the bacteriologist's bible needs revision.
00812HL.III - NSD1 - 40%
Bacteria from the blood of a mammal were spread onto several
agar plates and then incubated at 37°C. No bacterial
colonies grew. The most likely explanation for this is
that the
A. temperature was unfavourable for the growth of bacteria.
B. agar lacked some essential food factor or factors
present in the blood.
C. bacteria grew but did not reproduce.
D. bacteria were killed-by being moved.
,:00822U,
- 33%- 34%
An individual can suffer from many colds in hislifetime because
A. .the cold-viruSdi extremely virulefit.antibodies against the cold virus cannot be .produced.
antibodies produced against one cold virus will not.give immunity against other cold viruses.
. immunity to the viruses that produce colds.is.probably not lifelong.
B.
C.
00832EL.III - 49%D1 - 62%
00842QL.III - 48%D1 - 67%
00852B69%
-DI 72%
When first studying Hydra, Trembly thought that it was a plant.One of the facts that might have caused him to change his mind
.
was that he found that Hydra
A. could reproduce sexually..B. produced motile gametes.
C. Produced buds.D. took in organic material for food.
Two populations of lemmings are separated hY a mile-wide river.One can be characterized by brown fur, while the other ischaracterized by brown and white spotted fur. When membersof these two populations were placed together they were foundto interbreed and produce sterile offspring. The best inter-pretation of this data is that the two populations are
A. the same species.B. sub-species of the same species.C. the same species, but have become distinct in
appearance because of the physical barrier(river) separating them.
the same genus but different species.
These are stylized diagrans of living organisms. At thefirst level of classification, the organisms that shouldbe grouped together are ..
A. 2, 4:
B. 1, 3,
C. 2, 3,
D. 4, 5.
4.
6.
-04211- 63%
-.D17 -.62%
These are stylized.diagrans of living organisms. . At .th .
first level of-classification:the organisms that- shoad715e groulied:together ate
A. 1, 2,
B. 5, 3.C. 3, 6.
D. 2, 5.E 2, 5, 6.
00872Y The robin redbreast was called Erithaceus rubecula and
L.III - 57% considered to be-in the family of warblers (Sylviidae).D1 - 71% Since that time this genus has bc7n placed in the ftmily
of thrushes (Turdidae). The name of this bird should
now be
A. Turdus rubecula.B. Erithacus rubecula.C. Turdus exsylviida.D. Sylviidus erithaca.
The following pairs of organisms provide the answers for thequestions .below. . _
A. hawk - owlB. great dane - terrierC. lizard - grasshopper.D. kangaroo - rabbit
00882JL.III - NSD1 - 57%
00892VL.III - 40%D1 - 42%
00902FL.II - 17%D1 - 23%
00912RL.III - 40%
'- 52%
Which pair shows the closest taxonomic relationship betweenindividuals?
Which pair shows the least taxonomic relationship betweenindividuals?
Which pair shows a predator-prey relationship betweenindividuals?
In which pair would the individuals be likely to show themost competition for food?
The diagrams represent the,legs, antennae and body.divisionsof types of animals.- Mouthparts are NOT shown. Use thediagrams to answer the questions following.
Choose the appropriate letter of the diagram whprobably belongs to each of the following ciasses:
00922CL.III - 29% CrustaceaD1 - 38%
00932NL.III - NS InsectaD1 - 51%
00942ZL.III - 19% ReptiliaD1 - 25%
-
The following questions are based on the animals listed below.
domesticusSpecies cynocephalus ttOglodYtes maaulitus tigris r
Commonliami '
Tasmaniantiger
wren (bird) tiger-cat tiger.- .
i)latypuS. .
. .
cat-
00982TL.III - 10%D1 I - 15%
00992DL-.III 7 34%
DI - 26%.
01002PL.III - 21%D1 - 40%
01012ALIII. 7 22%..
D1 - 32%
01022LL.III - 12%
Which two organisms below are most closely related?
A. 1 and 4B. 1 and 3C. 2 and 5D. 4 and 6
IVhich two organisms below are most distantly related?
A. 2 and 5B. 5 and 6C. 1 and 5D. 5 and 3
Which of the organisms belong to phylum Chordata?
A. all of themB. all except 2C. all except 5D. all except 2 and 5
Which of the organisms belong to class Mlammalia?
A. all of themB. all except 2C. all except 2 and 5D. 2, 4 and 6 only
Which of these experimental procedures would serve best to
determine the effectiveness of inoculating sheep against
anthrax disease?
A. Expose 50 sheep to anthrax and then,-:inoculate all of them.
B. Inoculate..25:-OUtTqf SOjAeep and then expoSe
ail- 50' tO anthrax.-InOcOlate SO sheep and tnen extiose alI of
them, to anthrax.Inoculate:,25 out of,S0 sheep and thin %eXpOse
only the 25 inoculated sheep to anthiaX.-. _ .
Which of the following compariions betWeen.insect and windpollinated flowers is not true? .
Wind p011inated flowers
A. flowers often colourlessB. pollenlight and smallC. flowers odourlessD. stigma small and simple
01042H38%.
DI - 40%.
PcillenAea3tierenksticky-floWers:Scenied 2
stig4 large and-feathery.
In theChristmas h011y, some trees,produce flowers which haveonly pistils and other-trees produce flowers which.have only'stamens:. Which would be planted to obtain branChes that bearred berries?
A.. "female" treesB. "male" treesC. both. "female" and "male" trees
sterile trees
01052U Most mammals have a constant body temperiture of approximatelyL.III - 13% 37°C. However the tip of the nose of a husky dog in theD1 - 30% Arctic is approximately S°C when the surrounding temperature
is -30°C. Which of the following is the best explanationfor this?
A. Huskies are exceptional mammals in that their bodytemperature is constant at approximately 5°C.,
B. Chemoreception is improved by low temperatures.C. In huskies, as in other dogs, a cold nose is a
sign of good health.D. The huskie's inner temperature is approximately
37°C but heat is lost rapidly from the bodysurface.
B. C. D.
Study the diagram, which shows density of bacteria, representedby dark dots, growing in deep agar tubes. The medium is the .
same in each tube, but the bacteria,are different species.The colonies are each at their optimum development stage.
-01063F:46%
H 7 605
.01073R
L:III 58%
DI,*/4: NS
01083C-L.III - NSD1 - 72%
WhiCh tubetontainS ark.brganism whoie,survival is mostprobably'indePendent of OXYgen concentration?
Which tube contains an organism which is most probably anobligate aerobe?
In which tube do:3s the organism show the most limitedtolerance for oxygen concentration?
3
4N1093N:zL.III 59%
1 - 5S%
20
A-microbiologist Wished to discover whether species A obacteria Produced-an antibiotic which.killed:species 's
The 2, species require similar nutrients. Of thO.following
hii best experimental procedure would be.to
A. grow speOies A in nutrient broth and add some ofthis broth to tore broth in which, 8, is to be
grownB. grow species B on agav:plates on .which -A hid.
.previouslY been growing.C. grow species B and species A on .the same,plate
and observe the distribution of colonies on
grow species A in nutrient broth and then growspecies B in the same medium.
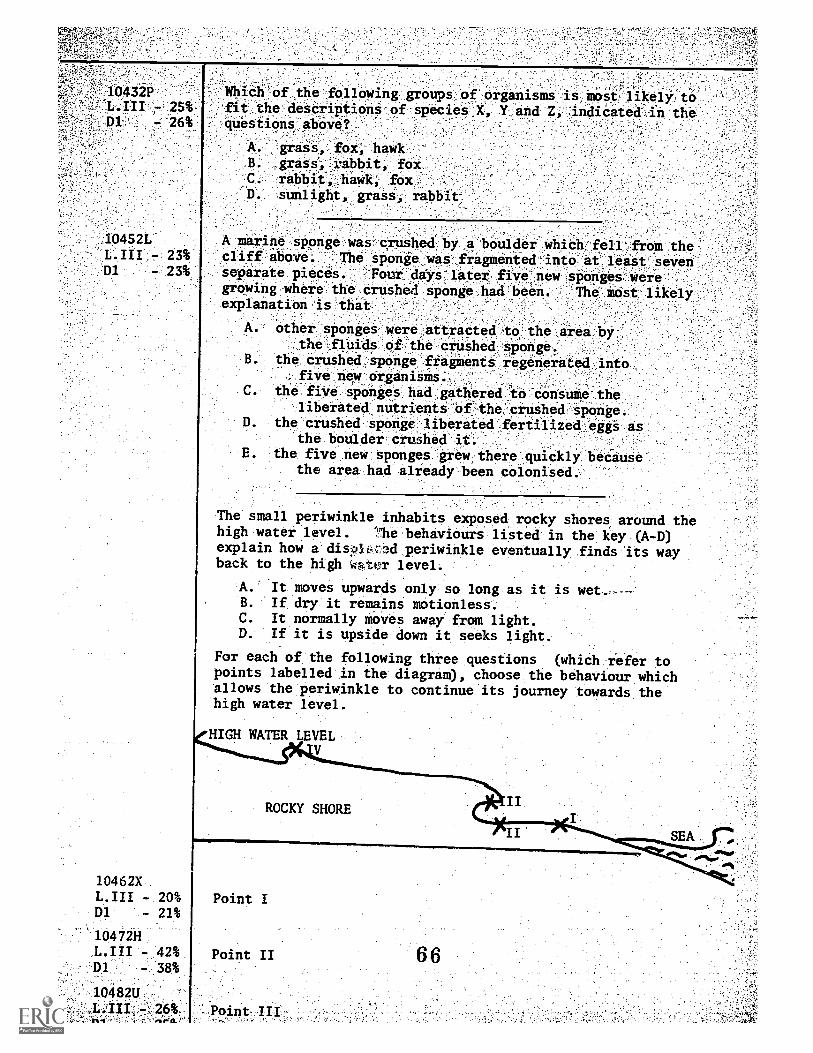
The following experimental results, 1,2,3,4, apply tothe questions below.
1. Pasteur and his contemporaries found various micro-organisms in animals and plants suffering from diseases.
. When the myxoma 'virus was introduced into a' pOpulation
of rabbits most of them developed the diseasemyxomatosis.
3. A certain disease was cured by injecting intoindividuals suffering from it a substance which wasknown to kill microorganisms.'
4. In a laboratory experiment all individuals injectedwith a certain virus developed symptoms of disease.
IVhich combination of results from the list above providesthe best support for the following stated hypotheses?
The hypothesis "Diseases are caused by microorganisms" is
supported by
A. 2 and 4 only.B. 1, 3 and 4 only.C. 1, 2, 3 and 4.D. 1 and 2 only.
The hypothesis "Symptoms of disease appear if tne pathogendamages enough of the hosts' tissue to interfere with theirnormal functioning" is supported by
A. 1, 2 and 3 only.
B. 2 and 4 only.
C. 1, 3 and 4 only.D. none of 1, 2, 3 or 4.
The hypothesis "Healthy organisms may containcausing pathogens" is supported by
A. 1, 2 and 4 only.B. 2 only.C. 3 and 4 only.D. 1, 2, 3 and 4.
01104AL.III - 51%D1 - 53%
01114LL.III - NSD1 - 61%
01124)L- 48%
:D1 -NS
5 4
. If an amoeba were producing by splitting in half every ihirtyminutei, the maximum number, of organisms that would result atthe end of a two-hour. period 'would be
A. 3:B. 8.
C. 16.'
D. 32.
Animals which belong to the same order also belong to thesame
A. ftmily.
B- genus-class.
. species.
55
P'
I nterre ationships
10011OL.III - 43%D1 - NS
Which of the following is the best definition of a predator?
A. an animal which kills and eats other'animals.
.
B. an animal which lives at the "expenseof another organism-
C. an organism which causes the death 0f.an animal. ,
D. an organism which consumes other organisms
10021T Relatively few "warm blooded animals are found living inL.III - 13% water. Warm bloodedness is probably a greater advantageD1 - 22% to a land-living animal than to an aquatic-animal because
A. air temperatures fluctuate more widely thanwater temperatures.
B. air temperatures are generally higher thanwater temperatures.
C. land-living animals can grow to a greater sizethan water-living animals.
D. few water-living animals require blood.
10031D Which of the following living-Vertebrates -is- found -in-theL III - 26% greatest variety of habitats?D1 - 22%
A. amphibiansB. reptilesC. bony fishD. mammals
10041P Kwashiorkor is a protein deficiency disease. You wouldL.III - 52% expect to find as characteristic of the diseaseD1 - NS
A. stunted growth of children.B. changes in the colour and texture of hair.C. fluid accumulation in the abdomen and ankles.D. all of the above.
10051A Of the following things, for photosynthesis, a living greenL.III - 21% plant does not requireD1 - 45%
A. water.B. light.C. oxygen.D. carbon dioxide.
56
7N,
62%72%
10071XL.Iir , 11%,D1 - 26%
,
idlAxE the following features'is most likely to be pieienfin an angiosperm which lives submerged .in Watek?
A. -a thickstemthin-leaves .
. an extensive root-system
. conspicuous flowers
Plants showing features likely to reduce excessive water loss(as in the dry parts of Australia) are likely to
A. be trees or shrubs.B. have flowers of the same form.C. have thick bark.D. have rolled leaves and sunken stomata.
40081.1 All of the follOWing ma* be foUnd7inTthe-ZOoplankton82% Topulatioe'of a fresh water pond except
D1 76% .
A. Cyclops.B. Daphnia.C. Spirogyra.D. Paramecium.
10091U In any community the greatest amount of energy absorption
L.III - and,storage is found in theD1 - 48%
A. producer organisms.B. first order consumers.C. highest order consumers.D. largest carnivores.
10101E Which one of the following characteristics is revealed byL.III - 52% careful studies of communities in nature?
D1 - NSA. Changes occur within the community according
to a definite pattern.B. 'Changes within the community occur at a
fairly fixed rate.C. Communities remain unchanged indefinitely.D. The changes within a community are quite
independent of the organisms within thecommunity.
10111Q Aquatic mammals are able to develop to a much greater size
L.III - 26% than land mammals. The reason for this is most likely to
DI - 23% be that
A. the buoyancy of the water helps to supportthe animal's weight.
B. the temperature of the water fluctuates lessthan that of the air.
C. there is a more plentiful supplyD. there are fewer predators.
-10121B.
18$Dl: - 21%'
-10132NL.III - 45%D1 - 46%
10142ZL.III - NSD1 - 14%
10152K
L.III - 15%D1 - 28%
10162WL.III - 31%D1 - 32%
From an evolvtionary point of view, the best adapted parasiteis one which
AL. causes rapid death of the host.B. produces a nild disease in the host.C. produces a long illness in the host before killing i .
D. has little effect an the host.
Of the following, the least important advantage that fish gainfrom being streamlined in shape is that
A. this gives them a larger surface area for respiration.B. they are able to move with little effort.C. they can more easily escape their predators.
When organisms live densely packed in a small area they aremore likely to compete if they belong to one species than ifthey belong to many different species, because individualsof one species
A. have similar requirementsB. have similar mortality, rates.C. can produce fertile offspring.D. are less likely to emigrate.
Data for questions below
The relationships of certain organisms of Arctic regionsare shown below:
Deadanimals(all types)
lgae
Bacteria---. Protozoa Spiders
GreenWorms
plants
Ptarmigans
Arctic foxes
Aquaticlarvae& worns
Fish-eatink--- Fish
Seals
Polarbears
The series - green plants, insects, ptarmigans, arctic foxesrepresents
A. a succession.B. a dynamic equilibrium.C. an energy cycle.D. a food web.E. a food chain.
The diagram is an example of
A. an energy cycle.B. a food web.C. an environmental interaction chart.D. an ecosystem.
10172G15%
1 - NS
Of the following, the ptarmigan would most likely-be
A. an insect.B. a snail.C. a green plan .D. a bird.
10182TL,III - 55%D1 - 56%
10192DL.III - 13%D1 - 18%
10202PL.III - 16%D1 - 22%
10212AL.III - NSD1 - 40%
10222LL.III - 56%D1 - NS
Of the following, the organism foundwould most probably be the
A. spiders.B. ptarmigans.C. insects.D. worms.E. green plants.
If hunters killed many of the seals in the area, it would beexpected that, as a consequence, there would be an increasein the numbers of
A. polar bears.B. arctic foxes.C. fish-eating birds.D. algae.
Which of the following statements does not apply to both afood chain and a food web?
A. It involves organisms living in a community.B. Each organism depends for its survival on only
one other organism.C. It involves the transfer of energy from one
organism to another.D. The energy being transferred came originally
from the sun.
Which of the following pairs of organisms is most likely tobe found in a land environment that is moist, cool, 'shady,and contains humus soil?
A. liverworts and echinodermsB. mosses and amphibiansC. algae and spongesD. sheoak and reptiles
Oats and lucerne were grown under similar conditions innitrogen deficient soil. The lucerne produced a healthy
crop but the oats produced very straggly plants. The most
probable explanation is that
A. lucerne does not need nitrogen for growth.B. lucerne can use other minerals in place of nitrogen.
C. lucerne seeds store enough nitrogen for prolongedgrowth.
D. lucerne can obtain nitrogen other than from the soil.
5 9
-
10232C- 18%
D1 - 20%
10242HL.III - 55%D1 - 62%
The following questions are concerned with the paragraphbelow.
It is thought that when the hydatid worm first infectedthe dog, the dog had little chance of survival. Thiswas bad for the chances of survival of the worm.Hence over a period of time, the worm was able to livein the dog without killing it. The dog lived to spreadthe infection further.
This is an example of
A. collaboration.B. adaptation.C. lack of resistance of the dog to iniection.D. diversity.
The process described in the paragraph can only occur if
A. the fittest or best adapted will survive.B. the dog eats more food.C. the worm uses food not used by the dog.D. the life cycle of the worm changes.
102521J The breakdown of sewage by bacteria in a river produces aL.III - 21% high concentration of natrients - a process calledD1 - 45% eutrophication - and this frequently leads to increased
growth by producer organisms. However;the subsequentlyincreased mass of consumers generally die. The bestreason for the dying is that, for the consumers,
A. there is too much food.B. there are too many nutrients.C. there is too much carbon dioxide.D. there is too little oxygen.
10 62EL.III - 73%DI - 83%
The graph show; measurements made of the average amount ofbasal energy used by children as they grow.
5
erergyusedperdayCAJ)
4
3
2
1
010 20 30
weight of child (kg)
From this data, the energy needed per kilogram of body weightfor a 15 kilogram child is mast likely to be
A. 15 megajoules.B. 3 megajoules.C. 2 me -Coules. 60
The ecological relationship between the members of one of thefollowing pairs of organisms is different-from that of theother three pairs. Which is the pair with the differentrelationship?
10282B Rabbits in the laboratory are able to'breed throughout the
L.III - 31% year and are capable of producing up to seven litters a year,
D1 - 35% but studies of the wild rabbit of South Australia showthat no more than five litters a year are produced, mostly inthe winter and summer months. The most likely reason for
this is that
A. the climate of South Australia is totally unlikethe climate to Ouch they were originally adapted.
B. rabbits need not produce more than 5 litters in orderto maintain their numbers.
C. rabbits breed only when food is plentiful.D. in the wild the number produced tends to be
approximately equal to the number killedby predators.
The following table shows the amount of water produced as aresult of the breakdown of 1 gram of each of the food classeslisted:
food class water produced (g)
carbohydrate 0.6
fat 1.1
protein 0.3
20292M The kangaroo rat is an animal which survives on a diet of dry
L.III - 31% food. It does not normally drink. It is least likely to
D1 - 33% be able to exist without drinking if it lived on a diet whichis
10442AL.III -D1 - 42%
A. high in carbohydrates.B. high in fats.C. high in protein.D. composed of succulent leaves.
Plants with light coloured leaves (e.g. bluish and waxy orshiny silver) would be expected to be found growing in
A. high wind velocities.B. high humidities.C. high light intensities.D. low temperatures.
6 1
Studiei have shown that some cows can bite up to 36 000 timesa day while grazing. But if these cows take less 'than 0.3 g.of organic matter with each bite, they sdo not get:enough foodto satisfy their needs. It was suspected that the,actualshape of some tropical grasses might limit feed intake:An experiment designed to test this gave the following result:
10302YL.III - 36%D1 - 60%
Amount of orffanicAppearance of tropical grass Y
matter per late (mg)
sparse - about 5 cm highthick - about 30 cm highmature - about 60 cm high
100 - 200300 - 60050 - 150
Cows weie also grazed on 2,4,6 and 8.week old regrowth -
four week old regrowth allowed the biggest bite slips, but"bite sizes fell off rapidly for 6 or 8 week regrowth, and on8 week regrowth cows averaged only 0.15 g of brianic matterper bite. Studies of the structures of tropioal,.grassesshow that compared with temperate grasses they,are usuallywell endowed with leaf, but generally open and theirleavesnot packed together. The bottom 30 cm of the tropicalpastures_contain more bulk and more leaf, but the cowscould not easily reach these nutritious leaves.
.Which of the following best sums up the experiment?
A. The tallest grasses provide the best feed for thecattle.
B. Tropical grasses are not as nutritional as temperategrasses.
C. Young grasses have a higher organic content thanolder grasses.
D. Tropical grasses have a definite optimum height,above which cattle cannot use them efficiently.
10312J From the given data it appears that temperate grasses areL.III - 46% better feed for cattle than tropical grasses becauseD1 - 43%
A. tropical grasses contain a lower amount oforganic matter.
B. cattle can graze temperate grasses more efficientlythan tropical grasses.
C. temperate grasses contain more leaf matter.D. temperate grasses are more open enabling cattle to
reach their leaves.
10322V What would be the probable result of grazing cattle onL.III - 29% pastures from which their intake of organic material perDI - NS bite was less than 300 mg?
A. The cattle would increase the number of biteiper day above 36 000.
B. The grass would be very closely grazed.C. The cattle would be unable to maintain a
constant body weight.D. The cattle would take larger mouthfuls.
62
170332F"
LIIIT-, 14%- 21%
If a cow had its food needs satisfied while taking less than20 000 bites per day it could be concluded that
A. it was feeding on temperate grasses.B. it was feeding on mature tropical grasses.C. the amount of organic material per bite must be
greater than 300 mg.D. the amount of organic material per bite must be
less than 300 mg.
In a number of surveys of seedling survival in a forestcommunity,-the_data in thelfolloWing tables:Wat obtained:
Table 1: Ages of Seedlings Damaged by Browsing Animalt.
DATE
Age of Seedlings
Less than 2 years 2-4 years ,4-10 years
April, 1963 5 9
June, 1963 1 2
September, 1963 - 3
December, 1963 4 4
March, 1964 12 20
June, 1964 1 3
September, 1964 2 1
TOTAL 25 42
Table : Ages of Seedlings Dying from Lack of Water
DATE
Age of Seedlings
Less than 2 years 2-4 years 4-10 years
April, 1963June, 1963September, 1963December, 1963March, 1964June, 1964
TOTAL 13 17
Data was also colledted on the effect of leaf litter onseedlings as shorin in the following table:
Table 3: Fates of Seedlings Covered by Leaf Litter
CONDITION
DeadAlive, but paleand spindly
Alive, but nonew shootsHealthy, withnew shoots
Age of Seedlings
Less than 2 years
17
2
2
2-4 years
5
1
1
3
years'
(too tallto be
covered)
TOTAL 21 10
Using the information in the above tables answer thefollowing questions: 63
2R . In which age classIII 12% water?
- 21%less than 2
. 2-4 years. 4-10 Years
10382C.LAIL 12%
'18%
I0362N- NS
D1 - 10%
10372Z::L.III --- 14%
.D1 -9%
In which age classwatez-?
A. less than 2B. 2-4 yearsIC. 4-10 years
In which age classof lLght?
A. less than 2B. 2-4 YearsC. 4-10 years
In which age classlack of light?
A. less than 2B. 2-4 yearsC. 4-10 years
are plants most susceptible to lack of
years
plants least susceptible .tO laCk Ofr.
years
ate plints probablY-most affected:by lack
years
are plants probably leiist.affeCted by
years
10382K From the tables it appears that older plants have a betterL.III - NS chance of surviving than younger ones becauseD1 - 10%
A. they are less affected by lack of water.B. they are not affected by covering by leaf litter.C. they are less affected by damage by browsing animals.D. all of the above are true.
10392W From the tables it appears that the presence of adult treesL.III - 15% around seedlings may influence their chances of survival byD1 - 10%
A.
B.
C.
D.
covering them with leaf litter.utilizing their water supply.limiting the amount of light they receive.all of the above factors.
The graph below shows the change in population of two species,over a period of two years.
Numbers
Species X
Species Y
00 ..... I.
0 1
Time (Years) --->
Use this graph to answer the following questions.
10592NL.III - 42%D1 - NS
10422DL.III - 60%D1 - 59%
What is the lost" likely relationship-between.21.Laiin order?
.A. producer - consumerB. carnivore - herbivore
C. predator - prey. D._ mutualism
If a third species (species 'Z') was introduce6, and it wasfound that this species preyed upon species 'Y', what wouldbe the most likely immediate effects on the community?
A. Species 'X' would increase and species 'Y' and 'Z'would decrease.
Species and 'Z'. would increase and species- 'X'
would decrease.. Species 'Y' would increase and species 'X' allif-z3Z'
would decrease.D. Species 'X' and 'Z' would indrease and species 'Y'
would decrease.
Assume species 'X' is an autotroph and species feeds on
it exclusively; .then species 'X' would be.
A. an omnivore.B. a carnivore.C. a herbivore.D. a plant.
Assuming there were only these-three. species mentioned living
in the community, which, graph would best predict what wouldhappen to the community, over the next two years?
Assume species X is an autotroph.Assume species Y is a first order heterotroph.Assume species Z is a carnivore.
Number
dia ma , a', If a
i .4K -
a'%1 II '- ali
, Number
1 2
Time
Number. NUmber
Species X
Species Y
Species Z
Oa AO ab alb ia al ee
.104524._ ,
23$D1 23%
10462XL.III - 20%D1 - 21%
10472HL.III - 42%D1 - 38%
10482UL.III - 26%
Which of the following groups of organisms is most likely to.fit the descriptions of species X, Y and Z, indiCated in thequestions above?
A marine sponge was crushed by a boulder which fell from thecliff above. .,The sponge was fragmented into at least sevenseparate pieces. Four days later five- new sponges weregrowing where the crushed sponge had been. The most. likely.explanation is that
A. other sponges were attracted to the area bythe _fluids of the crushed sponge .
the crushed sponge fragments regenerated into. five new Organisms:
the five sponges had gathered to consume theliberated nutrients Of the crushed sponge.
D. the crushed sponge liberated fertilized eggs .asthe boulder crushed it.
E. the five new sponges grew there quickly becausethe area had already been colonised.
C.
The small periwinkle inhabits exposed rocky shores around thehigh water level. "'lie behaviours listed in the key (A-D)explain how a dispLed periwinkle eventually finds Its wayback to the high wster level.
A. It moves upwards only so long as it is wet.B. If dry it remains motionless.C. It normally moves away from light.D. If it is upside down it seeks light.
For each of the following three questions (which refer topoints labelled in the diagram), choose the behaviour whichallows the periwinkle to continue its journey towards thehigh water level.
HIGH WATER LEVEL
ROCKY SHORE
Point I
Point II
Point III
i0502QL.III - 69%D1 - 85%
If.point IV was subject to a hot, land wind, Whichbehaviour would be followed by the periwinkle?
Suppose the periwinkle finds itself in.the situation atpoint V below. All points marked are "wet".
Higheater 'lever.
10512BL.III - 22%D1 - 34%
10522M79%
D1 - 67%
10532Y70$
D1 - 66%
Assuming the only behaviours are those listed in the key,
what is the periwinkle most likely to do?
A. Continue to point VII and then stop.
B. Continue right to the high water level.
C. Go back to point VI and then stop.D. Stay at point V.E. Move between points V and VI several times.
F. Move between points V and VII several'times,
If a live salt-water crayfish is put into a tub of fresh
water it will die because
A. there is less oxygen in fresh water than in salt water.
B. salt-water animals cannot live in fresh water.
C. the pressure of water in its body cells increases.
Cellulose tubing used in the following experiment was permeable
to monosaccharides but not to polysaccharides. Into a tube
made of this material a student poured a concentrated solution
of starch and placed it in a beaker of water (Beaker A) to
which he added a drop of iodine. Be then took another tube
into which he poured a glucose solution and this tube was
placed in a beaker of water (Beaker B) to which he also added
a drop of iodine. These were then left overnight.
Where would it be expected that a blue-black colour would be
found?
A. in the beaker A but not in the tube of starch solution
B. in the tube of starch solution and in beaker A
C. in the tube of starch solution but not in beaker A
D. in the tubes of both starch and glucose
E. in both beaker A and beaker BF. in the tube of glucose and beaker B
The level of water in beaker A would
A. fluctuate in some unpredictable way.B. remain the same.
C. become higher.D. become lower.
6 7
1-Z-t
542J
A)1 51%
10552VL.III - 57%D1' - 49%
10562FL.III - NSD1 -62%
10573TL.III - 74%D1 - 79%
If at the, end c4' the experiment.the studenvtesied the.:'solutions in the tube of giUdose. and'in,.thebeaker ,B fersugar-by using testape he_would expedi.to find
A. a positive reSult in the tube but not: in 'the- benker.B. a positive resiilt.in both the'tube'and'the.beikfT-
C. a poOtive result in:the beaker but not the:tUbn:D. no positive result.
The experiment would demonstrate
A. osmosis only.'B. diffusion onlY.C. both osmosis and diffusion.D. neither.osmosis nor diffusion.
BASAL'METABOLICRATE.(MJ/day)
0.2
0 . 1
0,
-----H-Y.WEIGHT (kg) ,
The graph shows the relationship between basal metabolic rateand the body weight of an organism - in this case man. Thepoint X represents the basal metabolic rate of an averageadult male. If you were to transfer the data for a child tothe same graph, you would expect the position to be at
A. point I on the graph.B. point II on the graph.C. the same position as X.D. point III on the graph.
_
Which of the following comparisons between aand a marine fish is not correct?
Freshwater fish
A. produces little urineB. water tends to enter,
its bodyC. drinks little water drinks copiouslyD. does not excrete salt excretes salt
freshwater fish
Mhrine fish
produces large amounts of uAinewater tends to leave its body
68
Eucalypt seedlings proliferate after a bush fire followingthe fall of seed from burnt trees, but only a few surviveto maturity. Isolated eucalypt seedlings have also beenfound in fern gulleys but never survive to maturity.
The most likely reason for-the above findings is that
A. browsing animals consume eucalypts at an early stage.
B. animals eat most af the seeds.C. fern gulleys are too wet for eucalypt growth.D. eucalypt seedlings require a minimum level of
light to survive.
...,
6 9
Change
Use the graph below to answer the following question.
Rate
per
thousand
40-
tco . .
.
. . . .' .
. :b. . *CEYLON . '. ..-- ... .. : *. .,
30- . .... ...r..4.
-.L 1.. Ile . .. .. *.j. t;at" let % ; .' S' '.. .
Birth rate (solid line) and death rate (broken line)for Sweden and Ceylon. The shaded area representsthe growth of the populations, ignoring emigrationand immigration.
20012C In which of the following years were the growth rates of theL.I1I - 41% two countries approximately equal?D1 - NS
A. 1840B. 1900C. 1940D. 1960
20022N If the birth-rate is represented by the letter 'B', the death-L.III - 48% rate by the letter 'D', immigration rate by the letter 'I' andD1 - 54% emigration rate by the letter 'E', which of the following
formulae would give the rate of change of a population in aparticular community?
A. (B - E) + (I - D)B. (B + I) - (D - E)C. D+E+B- ID. (B + I) - (E - D)
Although Madagascar is separated from Africa only by &straitsome 80 miles wide, many plants and animals common on the
mainland are unknown on the island. This fact illustrates
the principle of
A. great environmental differences betweenAfrica and Madagascar.
B. evolutionary equilibrium.C. evolution in isolated populations.D. succession.
20042KL.III - 28%D1 - 49%
20052WL.JII - 35%D1 7 60%
20062GL.III - NSD1 - 63%
20072TL.III - 49%D1 - 63%
The following information applies to the questions F,low:
Two species of aerobic bacteria with the same nutritionalrequirements we:re cultured together in a flask in a well
aerated medium. The population curves for the two species
are shown on the graph.
0 e
Ixit eZ
0 I.14ZAo.....Lo;ita0,000I
No. of
Organisms
0
ft...Species ISpecies II
kislogMa
Time
At which po4nts in each of the population curves is there an
approximate balancing af the reproductive rate by death rate?
A. W, wB. X, xC. Y, yD. Z, z
Near which points does maximum rate of growth occur for the
two srecies?
A. W, wB. X, xC. Y, yD. 2, z
Which zt?tezzet provides the best explana:ion ror the slowing
do"em nf the bacterial growth rate ofspeoies I. after X?
A. an increase in available oxygen
B. a decrease in waste materials presentC. a decrease in nutrient supplyD. an increase in toxic waste
Species I shows a Yarge decline at z in the number oe viable
bacteria. The most likely explanation for this declIne is
that the
A. food supply became exhausted.B. secretion:: Ziom species II were toxic to species I.
C. supply of oxygen decreased and CO2 increased.
D. species I dehydrated the contents of the flask5uring its metabolic processes.
20082DL.III - 45%D1 - 56%
20092PL.III - 40%D1 - 48%
20102AL.III - NSD1 - 40%
The qucistions below are based on the' following infbrmation:
In experiments (..onducted on an American coastal marshscientists compared the rates at which'dead plant andanimui materiui were consumed. (See graph below)
PROPORTTDN
MArER
REMAINING
TIME (MONTHS)
They enclosed animal remains (dead crabs) and plant remains(grass) in plastic mesh bags and buried them in the mudwhere they were exposed to the activities of organisms.
The best reasim for the grassthe crab is that
A. the grass contained more water, than the crabs.B. the grass was made up of organic material which
was different from the crabs.C. decay bacteria were able to decompose crabs but
not grass.D. fungi were able to decompose the crabs but not
the grass.
The best reason why plastic mesh bags were used was that
A. plastic does not get wet and therefore dry weightcould be easily determined. .
B. plastic mesh decomposes very little and so thesolid would be easily retained.
C. plastic mesh is easily recoverable from a swamp.D. plastic mesh would prevent water and inorganic
salts escaping.
The best reason for determining da. weight was that
A. the weight contribution of the mass of bacteriawould be ignored.
B. water in the crabs weighs more than water inthe grass.
C. the cells of the different organisms couldcontain different weights of water.
D. drying out the organisms at intervals hastensdecomposition.and therefore results couldbe obtainud more quickly.
This paragraph from Scientific American, August 1973, Shouldbe used to answer the following questions:
Severe reduction in the population of large baleenwhales following the introduction of factory ships andfleets of catchers to Antarctic waters after World WarII has affected ft..he ocean ecosystem of the region.An oceanographei calculates that before intensivewhaling began the-large whales annually consumed 150million tohs of krill, the shrimp-like animals that aretheir principal/food. As the biomass represented bythe large whales dwindled from 33 million tons to5 nillion, the biomass of "surplus" krill increasedcorrespondingly. The beneficiaries of the increaseare krill-eating birds, fishes and squid of the region.
The factory ships and fleets of catchers are well characterizedby one of the following biological niches. Which one is it?
A. preyB. scavengerC. secondary consumerD. primary consumer
Which of the following is a definite regult of the decrease inthg biomass of the whales?
A. The krill biomass increased.B. The overall biomass decreased.C. The biomass of ihe krill decreased.D. The biomass of the fleet decreased.
20112LL.III - 42%ID1 - 48%
20122XL.III - 13%D1 - 18%
Use tb.t following diagrams in addition to the above paragraphto anlswel,.: the questions below:
20132HL.111 - 51%D1 - 61%
20142UL.III - SS%Dl - 61%
SFB = squid, fish and birdsW = whalesK = krill
Which diagram best describes the situation in the oceanecosystem before World Wzr II?
Which diagram best describes the ocean ecosystem now?
7 3
20152EL.III - NSD1 - 61%
20162QL.III - 22%D1 - 24%
20172BL.III - 28%D1 - NS
The o.erall rate of change of a population r may be expressedas follows:
r = (b + i) (d + e).
where b = birth rate
d = death rate
e = emigration rate
i = immigration rate
In 1938 with a population of 6 936 000 Australia had a birthrate of 17.38 per thousand individuals, a death rate of 9.59,an immigration rate of 2.82 and an emigration rate of 1.65.
Approximately how many individuals should there have been inAustralia by 1939?
A. 8 000 000B. 7 000 000C. 5 840 112
D. 58 401 120
The corresponding figures for 1958 per thousand individualswere b = 22.36, d = 8.41, e = 4.52, i = 11.04.
The rate of population growth in 1958 compared with 1938
A. increased.B. decreased.C. remained the same.D. cannot be worked out with the data given.
The most likely reason for the increase in 'e' in 1958 ascompared with 1938 is that
A. Australia was becoming spoiled and overpopulatedand therefore people left.
B. economic conditions facilitated the movement ofAustralians to other countries.
C. Australians got better salarios wotking abroad.D. the government's immigration poiliy caused
people to leave.
7 4
20182M- NS
D1 - 15%
20192YL.III - NSD1 - 21%
:The questions below .are based on- the
A single aerobic bacterium was added to a. ask ,
Containing food, moisture and oxygen. The flaskwas sealed and maintained in the dark at a temperatureof 34°C. Optimal conditions for the growth of,bacteria existed in_the flask when it was sealed.The curve below represents the growth of the bacteriain the flask. The stages are marked by letters.
NumberofLivingBacteria
0 6 12 Hours
Which of the following could account for the slowing downof the rate of growth at the beginning of period C?
A. an increase in the amount of food availableB. an increase in the amount of, oxygen presentC. a decrease in the amount of waste materials presentD. a decrease in the amount of oxygen available
In which stage is the production of new bacteria balancedby the death of the old bacteria?
20202J If the conditions existing during period C .could be maintainedL.III - NS for a considerable period of time, the number of livingD1 - 37% bacteria
A. would increase again.B. would remain about the same.C. would decrease.D. could.not be predicted.
20212V- 71%
D1 - NS
Which of the following would most likely be responsible forthe colonization of a fairly isolated island by lizards?
A. lizard eggs carried on the legs of birdsB. lizards on debris floating in the seaC. lizards swimming to the islandD. lizard eggs blown by the wind
7 5
20222F Fossil evidence shows that populations of the Tasmanian devil,L.III - 42% a carnivorous marsupial, once lived on the Australian continent.Dl - 35% They became extinct on the mainland about 2000 years ago and
now live only in Tasmania, where they flourish tO the extentof being a pest in some farming areas. Which of thefollowing is the most likely reason for the devil dying out inmainland Australia?
A. They were not adapted to the hotter climate onthe mainland but were successful in thecooler Tasmanian climate.
B. They died from lack of suitable food.C. They could not compete successfully with more
efficient carnivores such as dingoes.D. They were exterminated by hunting AboriginLs.
20234U Adult flounders live on sandy sea-beds; they have two eyes,L.III - 76% but both are on the same side of the body. Which of theDl - 79% following best describes the probable origin of this
adaptation?.
A. The animals live on the sand, and eyes on bothsidc.s of the head are not needed.
B. Over a long period of time, some mutant floundershad eye positions which were not symmetrical,and ones with both eyes on top survived ingreater numbers than the others.
C. The eye on the sandy side was not needed, anddisuse in the dark caused the eye to rotatetowards the light in the embryonic forms.
D. Evolution caused the positim of the eye tochange so that the flour..4er was best suitedto its environment.
76
Living Wor
30011WL.III - 61%D1 - 60%
A.
Which of the following organisms would respireper gram of body weight?
A. an earthwormB. a flowering plantC. a sparrowD. a mould
post food
The graphs below represent changes in the size of differentpopulations over a period of time. The scales on all thegraphs are linear.
No. Iin
Popin.
No.
in
Popin.
7 7
30022HL.III - 23%D1 - 34%
30032U
L.III - 37%D1 - 48%
30042EL.III - 83%D1 - NS
30052QL.III - 50%D1 - 63%
30062BL.III - 15%D1 - 28%
30072ML.III - 35%DI - 49%
30082UL.III - 36%D1 - 34%
30092JL.III - 19%D1 - 36%
30102VL.III - 33%D1 - 45%
30112FL.III - 40%D1 - 49%
30122RL.III - 27%D1 - 37%
30132CL.III - 25%D1 - 44%
30142NL. III_ 7 36%
D1 - 47%
Which graph best represents each of the following?
a rising rate of increase in a growing population
a falling rate of increase in a growing population
a falling rate of decrease in a growing population
an accelerating rate of decline in a declining population
a steady rate of icrease in a growing population
a decelerating rate of growth in a growing population
a steady rate of decrease in a declining population
the general trend of the human population over the lastthousand years
a population in which there is an equal birth rate and death
rate, no emigration and there is a constant immigration rate
a population in which there are no births, no deaths, no
immigration rate and constant emigration rate
spontaneous generation
The following information applies to the questions below:
A stand of eucalypts on a sheltered hillside has livingwithin it various species of mosses and lichens,severalspecies of invertebrates, and is the nesting place fora flock of birds all of the same species.
This group of organisms constitutes
A. a habitat.B. a community.
C. a population.D. an ecosystem.
The flock of birds represents
A. a population.B. a community.C. a family.D. none of these. 7 8
301522, 40%
pl; 47%
30162KL.III - 27%Dl - 32%
30172WL.III - 30%D1 - 49%
30182GL.III - 8%D1 - 24%
30192TL.III - 58%D1 - 56%
if .a food chain were:to be*instrUctedof:the Organia#s'mentioned, whicbof the followintwould,bethe highestorder consumer?:'
A. a bird which eats sapsucking insects from the treeB. an aphid which feeds on the sap of the treeC. a louse which feeds on the birdD. the fungal componlnt of the lichen
The following data relates to the questions below:
The figure below represents a sealed aquarium which isexposed-to light and kept at a fairly constanttemperature. In the figure, C represents enclosed airabove the water,-B the water, D the animal life in thewater, A the plant life, and E the soil at the bot'!:)1.At the tine it was sealed, the aquarium contained abalance of plant and animal life. Answer the questionson the basis of the information given above.
How long will it be most likely for life to continue in theaquarium?
A. until the original oxygen supply in the air abovethe water is used, but not longer
B. until the original supply of 02 dissolvedwater has been used up, but not longer
C. at most, not more than two monthsD. until the original supply of niirogen in the
at the bottom is used up, but no longerE. indefinitely, as long as light shines, regularly on
the aquarium and the temperature stays abovefreezing
Where within the aquarium does energy enter the energy cycle?
Where within the aquarium is the oxygen supply replenished?
Where is carbon dioxide produced as
A. A onlyB. A and DC. B and DD. A and BE. D only
a waste product?
Where is carbon dioxide utilized as a raw material?'
A. A and BB. B and DC. A onlyD. D onlyE. A and D
30212P65%
Dl. 70%
The pupal stage of the life cycle of the house flea lives in
floor dust. Fleas tend to stay in this'form until the-r respond
to vibrations, whereupon they leap out of their cocoo- feed
on blood. With no blood to feed en, the flea soon die .
A real estate salesman hoping for a sale, of,a long-va_ ,d house
did not want his client to be bothered"by fleas. The simplest
solution for the salesman would be to
A. thoroughly clean the dust from the floor of the house
B. have the house fumigated with insecticide.
C. run with heavy boots throughout the house a few days
before bringing in the client .search the house fOr fleas just before he brings in
the client.
Number ofOrganismsper unitarea
Study the information given below, taken from "Environmental
Pollution", edited W.A. Andrews, 1972.
Effluent
Unpollute Site
River
Fresh Wat auna
Algae
=lb MO. el
*OP",00014. /.0 4,
10.t: e
A+lc
"%
%am Se
%Midge Larvae
gjudgeworffig....ambs am. AI*
Concentrationof
SuspendedSolids
er
DissolvesLibmgan...oncentratial Dissolved
OxygenConcentration
Concentration ofolids409
30222A77';36%
i?J 7 52%
Distance downstream
The Organisms which perform bestpollution; i.e, cloUdyWater and
A. sludge worms.B. midge larvae.C. fresh.water fauna.D. algae.
under moderate conditions oflow oxygen, are
30232LL.III - NSD1 - 79%
Low levels of pollution would be indicated best by highnumbers and proportion of
A. sludge worms.B. midge larvae.C. freshwater fauna.D. algae.
30242XL.III - 21%D1 - 42%
30252HL.III - 70%D1 - NS
30262UL.III - 53%D1 - 64%
30272EL.III - 14%D1 - 33%
30282Q- NS
D1 - 60%
Thirty years ago, fish could be caught by anglers in theRhine River, which_flows through Western Europe., Todayfish are non-existent in the Rhine, which haSoften beenreferred to as the "Sewer of Europe". Mich of the followingis the direct cause of this lack of fish in the Rhine?
A. lack of oxygenB. raw sewerage pouring into the riverC. poisonous gases being given off due to
chemical reactions taking place in the river
If measurements were taken of the carbon dioxide concentrationin a lake over a 24 hour period, when would it probably belowest?
A. early in the morningB. in the middle of the dayC. in the late afternoonD. in the middle of the night
Since 1860 the percentage of carbon dioxide in the atmospherehas risen 10% (0.029% to 0.032%). Which of the followinghas not contributed to the increase?
A. Man has removed much of the earth's vegetationwhich uses carbon dioxide in photosynthesis.
B. The number of consumers has increased greatlyduring this time.
C. Much fossil fuel has been burnt during this time.D. Man's use of previously unused parts of the earth's
surface for food production has increased.
Crop pests can be controlled in several ways. The mosteffective, practical and least damaging to the environmentis to
A. spray the crop with a pesticide like D.D.T.B. introduce an animal which wil: prey on the pest.C. introduce a predator of the pest that will not
itself become a pest.D. sterilize the pest insects in the conmunity.
In which of the following situations is there least chanceof seeing a succession of biological communities?
A. an area of eucalypt scrub burned in a. burhfireB. a small island following a volcanic eruptionC. a freshwater pond which has filled after a dry summerD. a tropical forest, community'in,equilibriuu' St1
If all green plants disappeared, which of the followingsubstancei normally found in the atmosphere would be .
depleted quickest?
A. nitrogenB. oxygen
C. carbon dioxideD. water vapour
Many species of bacteria are mobile when supplied with
adequate amounts of oxygen. When oxygen iS withheldaltogether or the supply is very low, the bactelia arestationary or move very slowly.
A student set up an experiment using 4 test tubes, a culture
of actively hoving bacteria, and sprigs of actively growing
Myriophyllum (a green aquatic plant) as follows:
DARK
30302ML.III 7 23%pl - 31%
ml deoxygenated water 5 ml deoxygenated water
(boiled) and 1 ml bacteria (boiled) and 1 ml bacteria
culture culture
C.
LIGHT
D.
DARK
e
ml deoxygenated water S ml deoxygenated water
(boiled) and 1 ml bacteria (boiled) and 1 ml bacteria
culture and sprig of culture and sprig of
Myriophyllum Myriophyllum
Tubes A and C were placed in sunlight.Tubes B and D were placed in a darkened (lightproof) box.
If the student examined a sample of water from all 4 tubes after
6 hours, in which tube would he find the most active bacteria?
8 2
30313ZL.III - 54%D1 - 64%
30323KL.III - 41%D1 - NS
30333WL.III - NSD1 - 72%
A number of semi-transparent nbloodlessn fishes have beenknown to whalers working in the Antarctic Ocean,since thelate nineteenth century. A biologist on examining thesefish found that they were not really bloodless.
The reason for their bloodless appearance (white muscle andwhite gills) was that their blood was transparent - containedno red blood cells and no respiratory pigment. Furtherinvestigation showed that oxygen was transported by the bloodin solution in the water of the blood plasma..
These fish would most likely carry out
A. anaerobic respiration.B. aerobic respiration.C. autotrophic nutrit,m.D. saprophytic nutrition.
One particular species ,cif this group of fish grows up to 70 cmlong, lives close -L:f) the bottom and feeds on small Shrimps andfish. With this relatively active way of life, the adaptationmost likely to be to the best advantage of the fish would be
A. a more efficient excretory system.B. extra length to th'e-digestive tract.C. development of the skin as a secondary respiratory organ.D. development of an enzyme to aid secondary treakdown of
proteins.
The reason why L he fish can survive with this relativelyprimitive blood system is that
A. it lives in an environmeri in which the temperatureranges from -2°C to +2 C.
B. its excretory system compensates for the blood system.C. it lives in an environment which has a rich food supply.D. its more efficient respiratory system increases the
ability of the blood system to carry oxygen,
83
1116.1.1111111r
40011QL.III - 71%D1 - 75%
40021BL.III - 43%D1 - 67%
40031ML.III - 11%D1 - 43%
40041YL.III - 54%D1 - 57%
e of the following statements about blood circulation.rue?
,VenauSblbOd'pressure is much lOwer than arteriaLblobd.,:pressure.:
B. There isAiormally TL) direCt_connection:.beweenthe;right andjeft yentrielesOf mamaialianheartS.::after birth., ,
r '
C. ValVes atjnterValS.:aIong.thelength Of-arteriesheWto.prelient blood fro*floWirig backwardS.
D. Whem an animal :dies;-blood*tendsrather #an'ilvarteries, beCauseveinsate:.soft.,walled and:expand Möre-.
At the onset of a virus infection it is very common for thelymph nodes beneath the ears to swell. An explamcion forthis swelling is an
A. accumulation of viruses in those areas.B. accumulation of diseased cells in thos4 areas.C. increased production of red blood corpuscles.D. increased production of white blood corpuscles.
The stomach contains a strong acid and a proteolytic enzyme;the reason why the stomach wall is not digested is that
A. the enzyme is not active in the stomach.B. the enzymes in the stomach are rapidly
destroyed by the acid.C. the cell membranes in the stomacl, do not
contain protein.D. the cells lining the stomach are covered by
a protective material.
All of the following are a nLcessary part of the explanationof the Cohesion-Tension theory, except one - which one is not?
A. the ability of the plant to take up water evenwhen its roots are removed
B. the strong forces of attraction between watermolecules
C. the negative pressure found in the xylem vesselsD. the presence of a continuous column of water found
in the xylem vessels
8 4
40062WL.III - 22%Dl - 37%
40072GL.III - 28%Dl - 56%
40082TL.III - 28%Dl - 60%
The four drawings are to the same scale and are respectively:
(I) Lower epidernis - leaf of plant A(II) Upper epidermis - leaf of plant A
(III) Lower epidermis - leaf of plant B(IV) Upper epidermis - leaf of plant B
The name stoma (plural - stomata) refers to a hole in the leafsurface and to both guard cells which surround it. Guardcells are specialised cells (often sausage shaped) containingchloroplasts as shown in the drawings. There are nochloroplasts in the other cells of the leaf surface.
Distribution of Stomata on Leaves
In dicotyledonous plants Aomata normally occur in greatestnumbers on the lower surface. Some species have comparativelyfew and some have none at all on the upper surface. Plantswith leaves which stand in a nearly vertical position may havest:wata about equally distributed on both surfaces. Many ofthe monocotyledons have leaves of this type
In the majority of leaves, stomata are arranged without regularpattern or orientation. However, in most mnsiocotyledonsstomata are all orientated in the same d: on. Many grassesghow this directional orientation oi Stu ad, in addition,the stomata are arrange0 in regular TOWS 1, Jim a definitepattern.
From the above information a reason for supposing- plont A to bea dicotyledon is that,the
A. stomata are smaller than those of J.ant B.B. leaves of plant A stand in a horzontal po3i_tion.C. stomata have no rewlar orientati:m.D. stomata are about equally distriOute;- on both surfaces.
Which of the following facts supports an hypchesis thatplant B hasleaves which stand in a nearly vertical p*sition?
A. The stomata show re.ilar orienatich.B. There are nearly as 7any stoma- on the uppersurface
as there are or. the lower svface nf the leaf.C. The epidermal cel1 are very long comanred with
their width.D. The stomata are lirzger than those of plant A.E. All of the above support the hypothesis.
Select from the following the statement whic is NOT true.
A. In plant B the cells of the upper nurface are, onthe average, wider than those wf the loversurface of the leaf.
B. In plant B the cells of the upper,surface are, Onthe average, longor than thos: of the lowersui'ece of the leaf.
C The ch,:rroplasts in the guaId cells of both plantsare approximately the same size.
D. The guard celis of plant A appear to containapproximately the samenumber of,chloroplasts asthose of plant B.
E. On tho evidence of the data given plant B appearsto be a m locotyledon.
40052KL.III - 40%
D1 - 52%
The most likely-function of the specialised guard cells
wculd be to
A. control the/Size of the holes in'the leaf surface.
B. allow free/exchange of gases between the leaf cells
and the environment.
C. prevent'Water entering the inside of tilt_ leaf when
ie. rains.
D. prevent the lee.F from being attacked by insect
predators.
E. prepare food on whie) the plant can live.
Learning is pc,ssible in all of the organisms below, except
A. Volvox.
B. grasshopper.C. Hydra.D. alTEWorms.
The graph below 3hows the rate of uptake of oxygen and carbon
dioxide for respiration-and photosynthesis respectively, over
a 24-hour period.
ltIRate ofptake .
(litres/min)
6 AM
40102P JAt point X on the g
L.III - 16%DI - 27%
6 PM 6 AMTime
- -- Oxygen uptake due
torespiration
Carbon dioxideuptake due to
photosynthesis
A. the respiration rate is greater thum the
photosynthetic rate.
B. the carbon dioxide uptake is greater than the
oxygen uptake.
C. both respiration and photosynthesis are increasing.
D. ox:7gen uptake and carbon dioxide uptake are in
equilibrium.
Some barley seeds were germinated. Samples were taken at
regular intervals and their average dry weight calculated,
as shown on the graph.
1Average
dryweight
87
10 _--io.days
40112A43%
.Dl 46%
4' 122L
LIEF 41%D1 - 59%
40132XL.III - 36%D1 - 47%
For section. X on.the graPh:OneHtan aSsume thati.
A.' photosyntttesis,tas not yet started'.B. the seedlings. ate,not.growing;C. weight gain from photosynthesia.is equal ta
Weight:loSs Wrespiration-._D. the weight losS'is.due 'to exces'sive:lOss of
water, by,seeds'they,gerMinate.
A
In 1882, T.W. Engelmann carried out thollowing experiment.He projected a whole spectrum ow:to a filament of a green aigain the presence of motile bacteria which tended to swim towardsregions of high oxygen concentration. 'The experiment wascarried out on a microscope stage and observed under high power.
In another experiment.a Spectrum was shone on to chlorophyll ain methyl alcohol. The results of these experiments are sholWnbelow:
Relative amountsof lightabsorption bychlorophyll ain methylalcohol.
Engelmann'sexperiment.Bacteriaconcentrationin areas ofgreatest 02
concentration.,
Spectral colour of cimlight
violet blue green yellow orange red.
°W.-7,...%. ,
...
; - .'".
;1
...- ;*yri:.44:' I e,
e.S. 6. :'..
Filament oi- -1- ..C.,:-...,: ..... :
1 - :'...;:..
1
,..... ;;. :......, . ./ '.- . .. .. : "..
%,:,.....;.A,,:::-
The main purpose of Engelmann's experiment was to discover
A. which wavelengths of light are being used for pilGto-'. ,
synthesis.B. which part of the filament of algae is responsivle
for photosynthesis.C. which wavelength of light baeeria prefer to live under.
D. why chlorophyll a absorbs only some wave3elgths of light.
The results of the two experiments showed that
A. these bacteria will congregate at the violet and red
ends of the spectrum.B. oxygen is being given off mainly at the violet and red
ends of the spectrum..
C. chlorophyll a absorbs more violet and red wavelengthsthan any &her wavelength of light.
D. all of the above are true.
.40142H
23%D1- - 29%
401520L.III - 33%D1 - 43%
40162EL.III - 54%D1 - NS
40172QL.III - 56%D1 - 64%
40182BL.III - NSD1 - 48%
The main conclusion which would be drawn from the aboveexperiments is that
A. photosynthesis utilizes mainly violet and red light.
B. only parts of a filamentous alga are used forphotosynthesis.
C. if a spectrum is shone on to bacteria they will movetowards the red and violet parts.
Carbohydrates are stored as glycogen in the liver ratherthan as glucose. Which of the following properties ofglycogen is not of benefit to the system?
A. Glycogen is easily converted to glucose fortransport by the blood.
B. Glycogen is a large molecule which exerts anosmotic pressure on the cells of the liver.
C. Glycogen, being a larger molecule than glucose,has a higher potential energy.
D. Glycogen, being a molecul formed by condensationof gilcose, takes up less room for storage.
The Loop of Henlg forns part of the nephron, the excretorystructures found in the kidney. Part of the-job of theLoop of_Henlg is to extract certain useful ions from thefluid Passing through the loop. If the concentration ofthe solution of these ions inside,the loop is less than that
on the outside of the loop, by what process would ions pass
uut of the Loop of Henlg?
A. active transportB. diffusion of solventC. osmosisD. random movement of ions
ihe nephron is surrounded by, and intertwined with, bloodvessels which are connected to the renal artery on one side
and the renal vein on the other. Of the following, whichbest describes the function of these blood yessels?
A. to supply oxygen to the cells of the kidney
B. to supply blood so all waste products can be removed
C. to allow supply of oxygen and allow some wasteproducts to be removed from the blood
D. to allow the removal of all waste products and allowthe reabsorption of oxygelinto the blood
During the evolution of the vertebrates, the heart, like otherorgans, underwent several changes. Fish have a two-chamberedheart whereas mamnals have a much more efficient one with four
chambers. The most likely selection pressure to produce this
change would be adaptation to
A. life on land.B. homoiothermy.C. a more complex form of reproduction involving
viviparity rather than egglaying.
8 9
:The questions:below are'based On'the following infOrMatien(Ref. Sc. Am., July 1962,Vol. 207;No. 1); frOmieSearCh intothe effects of smoking.
25
20
RELATIVE,
DEATHRATE 15
10
0
NeverSmoked
Surverby Hammond::and Horn onv
) Lung Calker
(2) Coronary ArpmDisease
1-9 10-20 More than 20(1-14 gm) (15-24 gm) (More than 24 gm)
CIGARETTES §moicr) PER DAY
"Relative death rate" is death rate among smokersdivided by death rate among non-smokers.
40192M Of thu following, which is the best corclusion from the graph?L.III - 40%D1 - 51%
A. A person who consumes 10-20 cigarettes a day is11 times more likely to die from lung cancerthan a person who does not smoke cigarettes.
B. If SO people died from lung cancer you would expect40 of them to have smoked between 10 and 20cigarettes a day.
C. People who smoke more than 10 cigarettes a day havetwice the chance of dying from lung cancer comparedwith people who do not smoke.
D. People who smoke Imre than one cigarette a day are10 times more likely to develop lung cancer thanthose who do not smoke.
40202YL.III - 52%D1 - NS
Of the following, which is the best conclusion from the graph?
A. A person who smokes 10-20 cigarettes a day it, lesslikely to die from coronary artery disease thanone who smokes from 1-9 cigarettes a day,
s. If 100 people die from coronary artery disease wewould emect 90 of C.em to have smoked more than20 cif.,areztes a day.
C. A person who smokes more than 20 cigarettes a day is21/2 times more likely to die from coronary arterydisease than a 1,2son who does not smoke.
D. A person who smokes 40 cigarettes a day iG twice aslikely to die from coronary artery disease as aperson who does not smoke.
40212JL.III - 43%D1 - 71%
40222V34%
D1 - NS
40232KL.III - 29%DI - NS
40242RL.III - 45%D1 - NS
A student was asked to participate in the following experiment.
He fasted for 12 hours and then ilad a meai of sugary milk.
This was followed by a further fasting period of 12 hours.During this latter period of time his blood sugar concentrationwas measured at hourly intervals. The graph below representswhat was expected and the actua:l amounts obtained.
% of .2
blood .15,sUgar
.10
.05
0
4i-expected
., actualAt
1 2 3 4 5 6 7 8 9 10 11 12
Time in hours
Assuming there was no mistake in measurements, the difference
between the expected curve and that actually obtained is bestexplained by one of the following. Which one is it?
A. There was a removal of sugar from the-blood anda storage in the body.
B. There was too much sugar antl the excess was excreted.
C. The body used more sugar than was expected.
D. The body did not digest and absorb all the sugar.
The mechanism of the movement of the contents of the sieve
tubes in Plants cannot be defined as diffusion since
A. the phloem contains a 10% solution of sucrose.
B. the rate of flow is many times faster than therate of diffusion.
C. the mature sieve tube cells do not contain a nucleus.
For each of the ''ollowing conditions, chooseguard cells of a leaf would probably be
A. fully open.B. partially open.C. completely closed.
whether the
atmosphere very moist, a large amount of.water in the soil,
sunlight plentiful
atmosphere moist, plentiful supply of soil water, cloudy
9 1
The questions below depend upon the following information:
A green waterplant was sealed In a tube of pondWatercoloured with phenol-red.. At- the-end of the-day thered colour had not changed, but tbe next morning themedium was yellow, showing it was thenracidic.- Nochange of colour was observed An" a' similar set-upcontaining no plant.
These results indicate that
1 ight causes a change in th .: colour, of phenol -red ._ .
. darkness-causes, a change in thecolour, of Thenol-red.
an acidic substance is.produced -1,1 101_, plant in-..
the light. ...,
an acidic substance i7 producdthe dark.
40262NL.III - 35%Dl - 65%
40272ZL.III - 32%Dl - 34%
The experiment was probably testing whether
A. green plants. respire.B. phenol-red is an indicator.C. light is necessary for photosynthesis.D. phenol-red is yellow in acid.
If a few drops of concentrated manganere sulphate solution anda few drops of sodium hydroxide solution are Tadded to a solutioncontaining oxygen, a brown precipitate will result. The greaterthe oxygen content of the test solution, the deeper the browncolour that is produced.
Three tubes marked X, v and Z respectively were filled with water.An actively growing sprig of Elodea (a green aquatic plant) wasplaced in tubes X and Y. Tun-F-3r and Z were placed in sunlight,tube Y in the dark.
Cork 7171/1/111///////1
Tube X Tube Z
DARK
Tube Y
Water
After 3 hoUrs the Eloaea was removed, and a few drops each ofmanganese sulphate and sodium hydroxide were added to each tube.
The precipitate of darkest colour was most likely found in
A. tubes X and Y equally.B. tube X.C. tube Y.D. tube Z. 92
40292WL.III - NSD1 - 17%
40302GL.III - 29%D1 - 28%
Cellulose-digesting microorganisms are found in the alimentarycanals of cows and horses. In cows they live in the rumen (achamber of the "stomach") but in horses they live in the caecum(an extension of the large intestine). The products ofcellulose digestion are fatty acids which pass on through thealimentary canal.
The cow can get more nutrition from the relationship because,in the cow's system,
fatty acids have a greater chance of being absorbed.fatty acids can be broken down more easily in the "stomach".cellulose would be broken down by the time it reached the
caecum and therefore would be less suitable for micro-organisms.
D. fatty acids are less likely to influence absorption inthe large intestine.
A.
B.
C.
Measurements were made of the rate of growth of phytop1auktonat different depths in a freshwater lake:
700.
Productivity
mg/day
0
0 5
.
10 depth (metres)
The decrease in productivity with depth would most likely berelated to
A. the decreased solubility of oxygen and carbondioxide with increase in pressure.
B. the decrease in the amount of light availablefor photosynthesis.
C. an increase in pressure causing damage to plant cells.D. an increase in the number of consumers.
At one time men thoughtthat all the matter in a plant camefrom the water supplied to the plant. If this were true,which of the following would equal the gain in weight of agrowing plant?
A. the weight of water poured on thaTlantB. the difference between the Weight of water
entering the plant and water leaving the plantC. the difference between the weightof,atmospheric
gases entering the plant and atmospheric gasesleaving the plant
D. the sum of the weight of water and atmosphericgases entering the plant
40312T58%
D1 - NS
Plants living in dry regions have a relatively slow rate ofgrowth compared with plants in other regions. The probablereason for this is
A. the presence of a thick cuticle on the 1,:aves whichslows down diffusion of gases into the leaf.
B. poor root development which slOws down the uptakeof minerals from the soil .
C. the slow rate of respiration due to lack of water.D. the closure of the stomata to prevent loss of water.
40322D For several centuries man believed that a plant grew becauseL.III - 46% its roots were consuming soil. Which of the followingD1 - 60% procedures would be most useful in testing the truth of this
idea?
A. Find if the same chemicals are present inplants and soil.
B. See if the weight of soil in a pail decreasesas a plant grows in the pail.
C. Note the weight 6f plants grown in several differenttypes of soil.
D. Find out what effect the addition of water has onthe growth rate of several different plants.
E. Make comparisons between the rate of growth of plantsand the density of the soil the plants aregrowing in.
40332P Of the following, the anlmal whose chemical reactions wouldL.III - 15% be most affected by a 10 C fall in external temperatureD1 - 28% would be a
40342AL.III - NSD1 - 69%
A. man.B. dog.
C. snake.D. budgerigar.
Many warm blooded animals will become dormant or hibernatewhen the environmental temperature is low or the food scarce.A consequence of this Is that, usually,
A. food reserves will be used up and theanimal will die.
B. the animals will soon become dehydrated asthey can no longer take in water.
C. their body temperature will fall below thenormal set point.
D. their body temperature will remain qt thenormal set point as they are h000iothermic.
9 4
403S2LL.III - 31%D1 - NS
40363YL.III - NSD1 - 48%
e graph- below represents the relationship of metabolic rate
and body size in mammals. (Metabolic 'rate is given in cubic
millimetres of 02 per gram of body weight per hour.)
Metabo 1 ic
Rate
900
450
1 000 OCO 2 000 000 3 000 000 4 000 000
Body weight in grams
From the above graph it can be predicted that
A. elephants should have a high metabolic rate.B. mice should have a low metabolic rate.C. mammals weighing less than 100 000 grams should
be extremely active.D. mammals with a large_surfacv area-to-volume ratio
should have a low metabolic rate.
It hae, been found experimentally that:Iilice:gnd' dogS ,call.breathe:water instead of 'air provided ceitairl-:Copatiop,s .
are met.' Which 'Combination of.. two. of: t* folOWing-
conditions should proVe tO'be' most. Practical tO.,-achieVe. .
the above result?
I Put the lungs on the outside of the:body.II -Greatly increase the' amount 'of oxygen in the. water.
III Have the water at the saMe osmotic pressure.'as.the blood.
IV Change the shapelike gills.
A. I and IVB. II and IVC. II -and III
D. III and IV
of the lnngs
7".
so -that they are
40373J Experiments with pregnant rats show that the foetus can
L.III - 37% survive decelerations of up to 10 000 g (g = force of gravity),
D1 - 45% although the mother rats themselves die. A deep sea diverrisks death, if he surfaces too quickly, due to release ofgas bubbles in his blood. The sudden decompressionsexperienced by the diver are akin to the decelerationsexperienced by the foetus.
The experiments with rats suggest that the diver couldsurvive sudden decompression provided he
A. could breathe oxygen from a liquid.
B. was surrounded by soft materials.
C. held his breath during the decompression period.
was verY Yowl&_9_5
.4%
Interaction, Maintenance
50011K Homeostasis is the biological phenomenon involved in all but one-L.III - 64% of the following. Which one does not involve'this?D1 - 72%
A. the maintenance of body temperaturepoikilothermic animals
B. feedback mechanismsC. sugar concentration in blood plasmaD. composition of urine in mammals
S0021WL.III - 33%D1 - 32%
50032HL.III - 36%D1 - 62%
50042UL.III - 59%D1 - NS
Which of the following is not recycled in a biological sense?
A. organic mattersB. c,:-..rbon dioxide
C. oxygenD. energy
The presence of sugar in ne urine of a diabetic does notnecessarily indicate that the kidneys are-functioningimproperly. It generally means that the blood-sugarconcentration is higher than normal and that the kidneysare removing part of the excess. The liver plays a criticalrole in regulating blood-sugar levels. The muscles arealso important elements in this regulatory system.
Which of the following would not be caused by insulin actingto reduce the concentration of glucose in the blood?
A. stimulation of the muscles to remove moreglucose from the blood
B. stimulation of both the muscles and the liver toconvert more glucose into glycogen for storage
C. stimulation of the liver to produce glucose fromglycogen or other stored materials
D. stimulation of the muscles and the liver tooxidize carbohydrates at a more rapid rate
Oestrogen and progesterone are two hormones which are producedby the ovary. One of their important functions is to ensurepreparation of the uterus for receiving the fertilized ovum.In an experiment on mature female rats the pituitary wasremoved and it was found that the rats ceased to produce young.
Which of the following inferences can be drawn from theresults of this experiment?
A. The pituitary influences the ovaries.B. The pituitary is necessary for reproduction.C. The pituitary influences both the ovaries and the
uterus.D. There is a complex interaction between the pituitary
and the reproductive organs. 96.
- 66 -
50052ELiii - 37%Dl. - 46%
50162ZL.III - 57%D1 - NS
50154QL.III - 69%D1 - NS
The following questions relate to the paragraph and graphbelow:
A scientist had some plant material and he wished to findthe approximate salt concentration in the cells of thisplant. To do this he placed some material in solutionsof different salt concentration, and measured the volumeof one cell (measurements of volume enclosed by membrane).The following results were obtained:
VOLUME
10 9 8 7 6 5 4 3 2
SALT CONCENTRATION (g/litre)
1
Which point corresponds to the approximate salt concentrationof the cell?
The best explanation for what has occurred at D is that the
A. cell has died.B. membrane has become permeable to salt.C. membrane has become permeable to water.D. cell has burst.
Change seems to be an almost universal characteristic ofnatural communities. Such communities tend towards a climaxgoverned by a particular climate. This climatic climax isusually not reached because of soil factors or, more generallyin Tasmania, fire. Eucalypt forests regenerate when fireclears the vegetation and seed falls from adult trees. Buttongrass plains are thought to be the result of frequent firing ofeucalypt forest by the Tasmanian Aborigine.
Which of the following statements is most relevant to Tasmania?
A. :le climatic climax community is eucalypt fore,,t.B. If eucalypt forests are burnt down their replacement
is button grass plains.C. Soil type is more important than climate in
ietermining vegetation.D. Eucalypt forests can be eliminated by frequent fires.
9 7
-67'-
50063RL.III - 32%D1 - 38%
50073CL.III - 18%D1 - 15%
50083NL.III - 34%D1 - 47%
50093ZL.III - 48%D1 - 54%
Motor Flower Pot_ .
The apparatus shown is called a klinostat. The motor causesthe flower-pot to rotate about the horizontal axis at a speedwhich can be selected by the user. Balsam plants, which werealready well established in identical pots, were placed insome of these apparatuses for 30 days. When the plants wereremoved the following results had been obtained.(DIAGRAMMATIC SECTIONS SHOWN)
A. B. C. D.-
Shortly after the experiment commenced the motor of oneklinostat fused and could not be repaired. The plant remainedin the apparatus for the entire experiment. Which of theabove plants was it most likely to be?
One weekend the cleaner inadvertently switched off one klinostat.The klinostat was switched on again after 2 days and the plantkept in the apparatus for the entire experiment. Which of theabove plants was it most likely to be?
Which of the following explanations would be most likely toaccount for the result shown in diagram E?
A. The plant became infected with a virus disease.B. The klinostat was set to revolve at only one
revolution per day.C. The klinostat was set to revolve at only one
revolution per week.D. The pot was less porous than the others and
thus received too little water.E. he plant was larger than the others at the
start and became pot-bound.
From the explanations in the previous question, which one wouldbe most likely to account for the result shown in diagram D?
-46
4
42
40
- 68-
the graphs below and then answer the questionson the next page.
I I
I I
I
)1...1
I
a a ......
1-Bedy weight, water oonsumPtimo-(solid line) and urine output
1
(broken line) of a sheepoffered 5 litres of waterdaily after 186 days ofrestricted watar intake.
-11
1
L 1---1-1 1
I
1 1
180 190 200
41.111NED .1111 .111Mall ANN. MIMI MINIM WON. OINIO IMOD
11111011111111011
210 220
DAYS OF EXPERIMENT
A9
50103KL.III - 38%D1 - 33%
None klinostat was set to revolve at 4 revolutions per-minute -----
when the recommended speed is 2-4 -revolutions per hour.Of the above plants which one most probably-came from thisapparatus?
50114X The increase in body weight from Z to Y on the graphs oppositeL.III - 36% can be directly associated withD1 - 52%
A. increase in the amount of food consumed.B. decrease in the production of dilute urine.C. decrease in metabolism because the sheep do not
have to search for water.D. increase in water consumption.
50124J From the graphs it can be seen that, during the time the sheepL.III - 31% had a restricted water intake, they were allowed to drinkD1 - 52%
A. no water at all.B. about 80 ml of water dilly.C. about one litre of water a day.D. about five litres of water a day.
501341.1 From the graphs and from a knowledge of biology it can beL.III - 65% seen that during the period of restricted water intake theD1 - 60% production of urine was about
A. the same as the amount of water drunk.B. the same as the amount of water lost from-the lungs,
skin and bowel.C. half the increase in body weight each day.D. twice the amount of water retained by the body.
GENERALISATION:
When many species of mammal are dehydrated by beingtotally deprived of water for several days and arethen given unlimited access to water, rehydration isprompt and usually complete, with over-compensationrare and insignificant so that it is uncommon forwater to be ingested in excess sufficient to giverise to water diuresis.
The purpose of the experiment was to test the validity ofthis generalisation. After obtaining the results shown onthe graph the scientist (Warner, 1971) concluded that
... when sheep are subjected to a chronicdehydration by prolonged reduction in water intake,and then given access to ample water. readjustmentoccupies several wee.ts and includes periods ofgross over-compensation and a marked waterdiuresis."
50144Ej
The part of the graphs that directly demonstrates theL.III - NS I occurrence of "marked water diuresis" isD1 - 59%
Each protein is made up of many amino acids. Differentproteins differ in
A. the total number of amino acids.B. the proportions of different amino acids.C. the order in which amino acids are arranged.D. all of the above features.
60021Q Aerobic respiration releases more energy for use,by anL.III - 43% organism than anaerobic respiration becauseD1 - NS
60031BL.III - 51%Dl - 71%
A. oxygen is a requirement for aerobic respirationbut not for anaerobic respiration.
B. aerobic respiration results in a more conpletebreakdown of sucrose than anaerobic respiration.
C. the process of aerobic respiration requires moreenergy for its completion.
D. a by-product of aerobic respiration is carbondioxide while that of anaerobic respirationis alcohol.
At least some cells of all plants do not contain
A. a.nucleus.B. nitochondria.C. ribosomes.D. chloroplasts.
60041M The burning of wood is a process involving the release ofL.III - 24% energy by oxidation. A comparable process in the cell isD1 - 46%
A. photosynthesis.B. excretion.C. digestion.D. respiraticn.
60051Y Which element is not found in carbohydrates but is found inL.III - 14% proteins?D1 - 28%
A. carbonB. nitrogenC. hydrogenD. oxygen
101
60061j- 33%
D1 - 29%
60071VL.III - NSD1 - 75%
60081FL.III - 68%D1 - 88%
60091RL.III - 50%D1 - 60%
60222JL.III - 44%D1 - 43%
A type of toadstool, !tuna sp., which grows in Japan hasbeen found to be luminous.
The total amount of energy emitted as light from the toad-stools would be
A. less than the total amount taken in from theenvironment.
B. equal to the total amount taken in from theenvironment.
C. more than the total amount taken in from theenvironment.
The nutrition of these toadstools would certainly bedescribed as
A. photosynthetic.B. autotrophic.C. heterotrophic.D. saprophytic.
Of the following statements about enzymes, one is notalways correct. Which is it?
A. They break down large molecules into smaller ones.B. The substance upon which they work is called the
substrate.C. They are catalysts.D. The name is derived froth the Greek word; iymos,
meaning yeast.
Which one of the following statements on the two kinds ofnucleic acids is incorrect?
A. They are composed of base plus sugar plusphosphate molecules.
B. They are found in the nucleus.C. They can both pass through the nuclear membrane.D. They differ from one another in the bases
they contain.
_
Excessive amounts of fertiliser added to soil, withoutadequate knowledge of the nutrient content of the soil, canproduce poor plant growth. Of the following the best reasonfor this is that
A. plant roots dehydrate by osmosis.B. too much of one ion can restrict the uptake of
another.C. too many ions may decrease the action of decomposer
organisms.D. too many ions reduce the supply of oxygen which is
essential for plant root growth.
102_
The following questions relate to the diagram below:
(D) Vacuoles
1g) Cell Membrane
ommpoc;4""4e"
*f,01.1.5
60102DL.III - 52% In which area does active protein synthesis occur?DI - 75%
60112PIn which area are there enzymes which are capable of
D1L.III
- 6- 51%
breaking down glucose?1%
60122A If this was a unicellular fresh water organism, AlichL.III - NS structures would be very active in maintaining waterD1 - 42% concentration?
60I32L"x"
L.III - 48% In which organelle does the process ADP + P _22i0ATP occur?D1 - 58% enzyme
60142X "x" in the above equation is most likely to beL.III - 38%
A. energy.D1 - NS
B. protein.C. sugar.D. water.
"x"
60152H The equation ADP + P ATP describes what happens whenL.III - 67%
Ienzyme
D1 - 70%
60162UL.III - 19%D1 - 36%
A. carbohydrate is metabolised.B. starch is synthesised.C. protein is formed.D. diffusion occurs.
In which organelle is DNA found?
103
60172EL.III - NSD1 - 11%
60182QL.III - 86%D1 - NS
60192BL.III - 48%D1 - 81%
60202ML.III - 57%DI - NS
60212YL.III - 78%DI - NS
The diagram above represents a cell from an unknown pieceof tissue. Answer the following questions with referenceto the above infornation.
If organelles 'Y' are coloured green they are most---probably
A. oil droplets.B. vacuolesC. nuclei.D. chloroplasts.
If organelles 'Y' were absent or colourless, th.m the cellcould be identified as
A.---plant.
B. animal.C. plant or animal.
If organelles W and Z were absent,the cell would mostprobably be
A. dead.B. of animal origin.C. of plant origin.D. lacking in essential mineral ions.
If organelle 'V' was absent,the cell would most probably be
A. dead.B. of animal origin.C. of plant origin.D. lacking in essential mineral ions.
What is the best explanation of how 'W' is formed?
A. The organelle increases in size to allow the cell tocontrol all of its biochemical activities efficiently.
B. The organelle takes a major role in metabolism inexchange of gases and fluids.
C. The cell cannot cope with metabolism as it growsunless 'W' is present.,
D. The cell increases in size but the amount of cytoplasmremains virtually unchanged.
101
-60.232V
DI 57%
.60242FL.III - 67%Dl - 74%
60252RL.III - 32%-pl, - 45%
60262CL.III - 55%D1 - 55%
60272NL.III - 55%D1 - 55%
The following information relates to the questiona below:
Assume that 75 g of a faigar Abiose undergoes partialhydrolysis to produce 50 g of )(lost and 25 g:of Dioseor SO 'g of Yiose and-25 g of-Fiose, ell of which aremore simple sugars than Abiose. The Xiose will undergofurther hydrolySis to produce 25 g each of the sugarsCiose and Fioge, which in turn will-not undergo furtherhydrolysit. Diose does not hydrolyse.
Abiose is a
A. monosaccharide.B. disaccharide.C. trisaccharide.D. polysaccharide.
Yiose is composed of
A. FIose and Ciose.B. Ciose and Diese.C. Xiose and Fiose.D. Diose and Fiose.
Fiose is a
A. monosaccharide.B. disaccharide.C.- trisaccharide.D. polysaccharide.
If Fiose and Diose were dehydrated under the r ght chemicalconditions they would form
A. Xiose.B. Yiose.C. Abiose.D. some other sugar.
A greater number of enzymes are involved in the completion ofaerobic respiration than in anaerobic respiration because
A. aerobic respiration involves a greater numberof chemical reactions.
B. aerobic respiration produces more energy.C. anaerobic respiration involves a greater number
of chemical reactions.D. aerobic respiration is carried out by more complex
organisms.
105
60282ZL.III - 23%D1 - 37%
60292KL.III - 40%D1 - 52%
The questions below are.based,on.the following:information:
A biologist investigating a pure culture of microorganismsfound that they hydrolyse maltose to glucose which theythen-use as a source of energy. The microorganisms cansurvive in a medium in which maltose is the only source of..carbon. A substance S which specifically prevents theenzyme maltase from acting is added to the culture.
After the introduction of substance S the biologist wouldexpect the mieroorganisms to
A. rapidly decline in number.B. reproduce more rapidly.C. reproduce but more slowly than before.D. live but lose the power to reproduce.
Which of the following would have to be introduced if thebiological processes of the microorganisms were to continueas they were before substance S was introduced?
A. maltoseB. maltaseC. sucroseD. glucose
For the questions below, refer to this diagram and to the
following data:
20% glucose1% copper
sulphawater
Side BSide A
'10%.glucose2% copper,
Sulphatewater
Membrane permeable to water and coppersulphate but impermeable to glucose.
At the beginning of the experiment, the solutions inthe two arms of the tube are as pictured. They are
separated at the bottom of the tube by a differentiallypermeable membrane. The volumes on either side of thetube are the same, and thus the level of liquid in botharms is also the same. The apparatus is allowed to
stand for several days.
106
.60302WL.III - 51%D1 - 68%
60312GL.III - 33%D1 - 41%
60322TL.III - 61%D1 - 68%
The glucose solution of side A will
A. become more concentrated and that on side B willbecome less concentrated, since water movesfrom A to B.
B. become more concentrated and that on side B willbecome less concentrated since water passesfrom B to A.
C. become less concentrated and that on side B wt11become more concentrated since water passesfrom A to B.
D. become less concentrated and that on side B willbecome more concentrated since water passesfrom B to A.
Of the following, which one best describes what will happento the copper sulphate a the experiment proceeds?
A. There will be no passage of copper sulphate becausesolutes do not go through semi-permeable membranes.
B. There will be a slight passage of this substance butthe passage will be restricted by the size of theporesin the membrane.
C. There will be a slow movement, since theconcentrations are nearly equal.
D. There will be no passage as the copper sulphate isinsoluble.
Osmotic pressure will be greatest on
A. side B at the beginning of the experiment.B. side B at the end of the experiment.C. side A at the beginning of the experiment.D. side A at .the end of the experiment.
107
70011ZL.III - 41%D1 - 61%
Conti nu ity
A mutation is best defined as
A. the sudden appearance of a new character thatis subsequently inherited.
B. the modification of a structure by use or disuse.C. a small change in an organism induced by a sudden
environmental change.D. a change that is not seen in succeeding generations.
70021K New gene combinations are found after meiosis as a directL.III - 41% result ofD1 - 74%
A. spindle formation.B. pairing of homologous chromosomes.C. separation of homologous chromosomes.D. separation of chromatids.E. crossing over between chromatids.
70031W Which of the following is always true of a species thatL.III 41% reproduces sexually?D1 - NS
A. Some _individuals of the species are male andothers female.
B. Copulation always takes place.between two. individuals.C. The species must have evolved recently in evolutionary
history.. .
D. Meiosis takes place at some stage in its. life..
70041G The offspring of sexually reproducing organisms show greaterL.III - 30% diversity than the offspring of organisms that reproduceD1 - 59% asexually. The chief reason for this is that
A. sexually reproducing organisms have a highermutation 14ate.
B. sexually reproducing organisms have greaterpowers of dispersal, so their offspringencounter more varied environments.
C. gene3 are reshuffled during meiosis andfertilization.
D. asexually reproducing organisms show lessstructural variation than sexually re-producing organisms.
108
70054T-35%
1:11L - 49,$
70061DL.III - 63%D1 - NS
70071PL.III - 35%D1 - 73%
70082BL.III - 24%D1 - NS
70092ML.III - 16%D1 - 47%
70132FL.III - 29%D1 - 33%
Cell-division imall woody vascular, plants occurs in
A. root meristem only.B. shoot meristem only.
C. cambium only.D. apical meristem and cambium only.
E. apical meristem, root tip and cambium.
The advantage of asexual reproduction from an evolutionary
point of view is that
A. all the offspring will be well suited to the
same environment as the parents.
B. dispersal into new environments is morereadily accomplished.
C. there is less chance of the offspring showing
a new recessive character.
D. it allows plant breeders to produce genetically4uniform crops.
The number of chromosomes in the gametes of an animal is
A. double the number in the body cells.
B. half the number in the body cells.
C. the same as the number in the body cells.
D. always 23.
When two alternative genes (alleles) occur in a particular
individual,
A. one is always dominant over the other.
B. one is always incozipletely dominant over the other.
C. an intermediate condition will always result.
D. none of the above is necessarily true.
Some chartcteristics (e.g., red hair in man) 'skip a
generation". This can occur when they are
A. dominant.B. incompletely dominant.
C. recessive.D. homozygous.
Which group of organisms represents the most probable order
of succession of plants in a barren, rocky area?
A. mosses, gra,ses, shrubs, trees
B. lichen:, mosses, grasses, shrubs
C. lichens, grasses, shrubs, mosses
D. mosses, lichens, grasses, shrubs
70102YL.III - 59%D1 - NS
70112JLH! 7 60%DI NS
70122VL.III - 35%D1 - NS
Nondisjunction can result in the following type of celldivision.
gamete 1 gamete 2
If this occurred, as shown, in an individual that washeterozygous for two charact rs, as shown, and gamete 1 wasfertilized by a gamete carrying the recessive genes p and q,the resulting individual would !save
A. trait P and trait Q.B. trait P and either tret Q or q.C. trait p and trait q.D. trait p and either trait Q or q.
One of Mendel's experiments involved crossing pure-breedingpeas having yellow seeds witN pure-breeding peas having greenseeds. All of the seeds frcm this CTOSS were yellow. Onplanting these yellow seeds and allowing the plants'to self-fertilin., 6022 yellow seeds and 1001 green seeds wereobtained.
Mendel planted some of the 6022 yellow seeds and allowed theresulting plants to self flrtilize.
What results should have been expected from this experimentif a large number of seeds wore produced by each plant?
A. 1/3 of the plants produced only yellow seediand 2/3 of-the plants produced both yellow andgreen seeds.
B. 1/4 of the plants produced only yellow "seedsand 3/4 of the plants produced both yellow andgreen seeds.
C. All plants produced yellow seeds.D. All plants produced greon seeds.
Mendel planted some of the 2001 green seeds and allowed theresulting plants to self-fertilize. What results shouldhave been expected from this experiment?
A. 1/3 of the plants produced yellow seed5, 2/3 ofthe plants produced both yellow-and green seeds.
B. 1/4 of the plants produced yellow seeds, 3/4 of theplants produced both yellow and green seids.
C. All plants produced ye/low seeds.D. All plmts produced green seeds.
70143TL.III - 43%D1 - 48%
In a carefully controlled experiment with the fungus
Neurospora the majority of spores were found to germinate
and grow on a medium of sucrose, biotin and inorganic nutrients
only. A few of the spores, however, required additional
organic nutrients before growth proceeded. Which of the
following is the most probable explanation ok this difference?
A. Some of the spores were mutants lacking certain enzymes.
B. Spores from another fungus had entered the medium.
C. Some of the spores were sterile.
D. Neurospora is evolving and producing a new species with
different nutritional requirements.
Study the following diagram, showing hormone secretion in
placental mammals.
PLACENTAL OXYTOCIN
GONADOTROPHINS
For the following questions, choose your answer from A to H
on the diagram.
70153D If the basic diagram were used to compare a pregnant kangaroo
L.III - 61% with a pregnant rat, one arrow would be absent altogether from
D1 - NS the kangaroo diagram. Which isr it?
70163P Breeding cycles in some animals are seasonal and are initiatti
L.III - 36% by a change in daylength acting on control centres influencing
D1 - 60% the pituitary. Which hormone would be the first one to be
released at the beginning of the breeding cycle?
70173A In a pregnant animal at full term and at the initiation of
L.III - NS uterine !Arth contractions, secretion of all hormones will be
Dl. - 35% high, except for two. One of these is FSH. What is the
other one?
111
Use this data to answer the following questions.
cr---ci
6, D-6 6-o or-(2# 1 o--c!]
1°3 0 4 a as.6
70183LL.III - SO%DI - 57%
70193XL.III - SO%D1 - 57%
702031!
L.III - 77%DI - 74%
The chart illustrates a family tree for a family which has ahigh incidence of the genetic trait called deaf-mutism, whichresults in deafness at birth.
KEY
deaf-mute male physiologically normal male
deaf-mute female ()physiologically normal female
The following aT.:, statements about individual number 6.From your knowledge of genetics and an examination of thechart, which one COULD be INCORRECT?
A. Both her grandmothers carried the deaf-mutism gene.B. Both her aunts carried the deaf-mutism gene.C. Her father was a deaf-mute.D. She is a deaf-mute.E. Her parents were cousins.
Why do female deaf-mutes occur only very rarely?
A. The gene is rare and must be possessed by both parents.B. The gene is nearly always lethal to females at puberty.C. Males who are deaf and dumb are not usually selected
to become fathers.D. Females who are deaf and dumb are often not
intelligent enough to make good mothers.
Answer the following two questions by selecting one of thepossibilities from the alternatives below:
A. ir0 (impossible or very nearly)B. 0.0625 = 1/16C. 0.125 = 1/8D. 0.25 = 1/4E. 0.5 = I/2F. 0.75 = 3/4G. 31 (certain or very nearly)
What is the probability that individual 1 carries the genefor deaf-mutism?
112
70213UL.III - 75%D1 - NS
70223EL.III - 26%D1 - 38%
70232PL.III - 69%D1 - NS
70242AL.III - 48%D1 - 75%
70252LL.III - 17%D1 - NS
What is the probability that individual 2 carries the gene
for deaf-mutism?
Suppose a father with a gene pair QQ and a mother Ifith a gene
pair qq have a son. Since the dominant Q should mask the
recessive q, the son should display the trait Q. However,
it is observed that he displays q instead. Which one of the
following chromosome pairs in the son could lead to this
situation?
Q Q
Study tha following information and the chart before answering
the questions below.
The probabilities ofobtaining offspring ofvarious genotypes fromtwo parents heterozygousfor two characteristicsR and T is illustratedin the chart (sometimescalled a punnet square).
Rt
rT
rt
Ce
RT Rt rT rt
146 16 1/16 1/16
1,/16
1,46
1,46
1 ,/16
1/ 1/ 1./ 1/'16 '16 16 16
1, 1/ 1/'16 '16 '161
The numberdihybrid
of different genotypes obtained from such across is
A. 16.
B. 9.
C. 8.
D. 6.
E. 4.
The probability of obtaining the genotype RrTt from such a
cross is
A.1/16.
B. 1/B.
C. 3/16.
D.1/4.
E. 5/16.
The genotype rrtt is said to be
A. angora or persian.B. lacking in dominance.
C. double recessive.D. completely heterózygous. 1 1_3
70264ZLITT - 56%D1 - NS
70272HL.III - 48%D1 - 72%
70282UL.III - 49%D1 - 65%
Suppose that, from all the differeLt genotypes in thetable, only six phenotypes could be distinguished. Thiswould imply that
A. both pairs of alleles exhibited completedominance of one gene over the other.
B. both pairs of alleles showed complete lack ofdominance.
C. there was dominance in one pair of alleles andlack of dominance in the other.
D. gene dominance did not control the phenotypein this particular example.
For each of the questions following, select from the answersbelow, the alternative which would best account for theprobabilities shown in the punnet square:
A. a lethal gene combination rrB. a lethal gene combination ttC. a more complex lethal gene combination than
either A or B aboveD. linkage between Rt and rT genesE. linkage between RT and rt genes
R
rtrT
RT
Rt
rT
rt
RT Rt rT rt
1/12
I.
/12
1/12
1/12
1, 1, 1, 1,
112 '12 '12 '12
1/12 1/12o
1/121 1/12 0 ° 1
RT Rt rT rt
1/9
1/9
1,/9 o
1,/9 0
1/9 1/9 0
1,/9 0 0 0
-
114
Evolution
80011U Natural selection is sometimes described as the "survival ofL.III - 52% the fittest". The fittest, in this context, means thoseD1 - NS organisms which
A. live longest.B. can obtain most food.C. are most resistant to disease.D. produce the largest number of healthy offspring.
80021E What has the greatest influence in allowing natural selectionL.III - 51% to take place?D1 - 65%
A. variationB. ecological changeC. isolation
80031Q Many types of bacteria which were previously sensitive toL.III - 23% antibiotics like penicillin are now resistant. This isD1 - NS probably because
A. inferior quality penicillin is used today.B. bacteria have become accustomed to penicillin
because of frequent exposure to it.C. resistant strains of bacteria have been selected
out from the original population.D. atomic fallout has changed the bacteria, making
them resistant to
Use the following information to answer the questions below:
In England two forms of the peppered moth exist, a lightcoloured form and a much darker form. In addition, inindustrial areas the tree trunks un which these mothsrest during the day are much darker than in non-industrial areas, because of pollution.
In the 1950's a group of biologists released a largenumber of moths in two localities and later tried torecapture them. Their results are shown below.
,AreaMoths Released Moths Recaptured
Darki Light Dark Light
Non-polluted
Polluted
488
493
496
137
34
73
62
10
80043D
D1 - NS
80054QL.III - 27%D1 - 41%
8006413_
L.III-- 40%D1 - 54%
80074ML.III - 20%D1 - 28%
80084YL.III - NSD1 - 65%
From this table it seems likely that, of the following factors,
the one with the greatest-survival value for all the moths was.
the
A. degree of pollution of the environment.
B. number of moths released.C. camouflage possibilities of the resting plgces.
D. darkness of the moths' colourings.
A weakness of the experimental design, to do with moths in the
polluted area, was the
A. large number of dark ones released.
B. small number of light ones released.
C. large number of dark ones recaptured.D. small nutber of light ones recaptured.
An overall weakness of the experimental design was that
A. moths were released only in two localities.
B. moths were released only in tne U.K.
C. moths were released only in the 1950's.
D. only two kinds of moths were released.
If the results in the table are taken as truly representative,
it is likely that before industrial pollution became wide-
spread one of the following would have been true. Which
situation is most likely?
A. There would have been a greater proportion of
dark moths.B. There would have been about the same proportion
of dark moths.C. There would have been a smaller proportiOn of
dark moths.
The alpine Ranunculi (buttercups) in Tasmania are interesting
to classify. Two 1"cognized species R.decurvus and R.concinnus
differ in a very minor but obvioui detaiirZiEher the hairs on
the leaves and stens are appressed (R.decurvus) or stick out
(R.concinnus). R.decurvus is found in habitats at a lower
altitude than R concinnus The two species maintain theirdifferent charia7iiiiGwhen cultured together at the same
xatitude. Their breeding relationships are not known.Which of the following statements best fits the above data?
A. The two species evolved differently at different
altitudes.B. R.concinnus evolved the "hairy" condition to
withstand the cold.
C. R.concinnus and R.decurvus are identical specieswhich grow differently at different altitudes.
D. Nothing can be hypothesized until breedingexperiments are carried out.
116
80094J Some recognised eucalypt species in Tasmania, e.g. E.risdoniL.III - 63%- and E.. amygdalina, which occur-on dry mudstone soils,-.are knownD1 - 67% to interbreed and produce a hybrid type which has characteristics--
intermediate to the parent species. These intermediate typesare fertile. Which of the following statements about thespeciss concept would the above information best fit?
A. Eucalypts are very indistinguishable and cannotbe put into species.
B. E. risdoni and E. amygdalina are examples of Tasmanianeucalypts which do not obey the rules.
C. Mudstone soils are conducive to the production of hybrids.D. E. risdoni and E. sy_gsla cannot be different species
because of tile strict rules which are applied bybiologists.
80104VL.III - 28%D1 - 42%
Foliage from trees is the major source of food for the Africanelephant, who obtains this food by using its trunk to stripthe tree of its leaves.
Over many thousands of years the trunk of the elephantincreased in length to enable it to reach higher into treesto obtain more food.
A prominent scientist once explained the development of thetrunk as follows:
"During an elephant's lifetime he had to stretch histrunk to enable him to reach the food resources higherin the trees. This meant that the offspring of thiselephant also had a longer trunk."
The theory outlined was most probably proposed by
A. Darwin.
B. Wallace.C. Lamark.D. Malthus.
80114F The proposed theory of evolution of the elephant's trunk isL.III - 49% based onD1 - NS
A. environmental change.B. genetical variation.C. chance mutation.D. geographical isolation.
117
80124RL.III - 37%D1 - 43%
80134CL.III - NSD1 - 59%
80144NL.III - 51%
64%
80154ZL.IIT - 30%D1 - 36%
80164KL.III - 35%D1 - 44%
80174WL.III - 81%D1 - NS
80184GL.III - 61% "Tall parents, on the whole have tall children."D1 - NS
Each of the questions below is a person's comment. Thesecomments are not all bas,1 on fact, but you are required toconsider the comment itself rather than whether it is true.For each comment choose, from the following key, the mostappropriate description:
A.
B.
C.
It would provide better evidence for Darwin'sevolutionary theory than for Lamark's.
It would provide better evidence for Lamark'sevolutionary theory than for Darwin's.
It would provide about equal evidenceof both theories.
D. It would not really provide evidence in supportof either theory.
"I've been a chicken farmer for years and have noticed that,if I clip their wings for several generations, theneventually I doOt have to do this any more because latergenerations can no longer fly."
in support
"Good teaching of one generation is one way to raise theinnate intelligence of disadvantaged people over a periodof several generations."'
"I trained hard for athletics for many years before and aftermy marriage but my son seems to be no fitter than any of hisclass-mates."
"Women generally live longer than men, but are not so strongphysically."
"Over a number of years, I've noticed that it's the mareswith the best performers among their ancestors who producethe best colts, rather than the mares who have been well-trained themselves."
"The best way to get good strawberry plants is to plant outrunners from successful older plants."
80194TL.III - 61%D1 - 70%
"I'm an only child and my mother died in child-birth, but I'msure she was badly frightened by a snake when she was youngbecause I'm terrified of them."
Other : Scientific Method, etc.
90011NL.III - NSD1 - 28%
90022AL.III - NSD1 - 40%
A scientist believes that the release of zinc ions into ariver could be causing the death of the fish that normallylive there. This idea, before it is tested experimentally,is called
A. a theory.B. a deduction.C. an hypothesis.
CO2
UPTAKE
(UNITS)
a= OM 010. ..110 40 .11 AMID .11111
2
0
This graph shows the way in which the ratevaries with the strength of light to whichprovided that there is an unlimited supplyA valid deduction from the graph is that
A. as light intensity increases, so photosynthesisincreases until it stops altogether.
B. the rate of photosynthesis increases until thelight intensity reaches 4 units and then thevery strong light causes a decrease inphotosynthesis.
C. the rate of photosynthesis is constant befor ry. thelight intensity exceeds four units.
D. the rate of photosynthesis is constant after thelight intensity exceeds 4 units.
LIGHTINTENSITY(UNITS)
of photosynthesisa plant is exposed,of carbon dioxide.
Look at these graphs about whaling:
90032LL.III - 40%D1 - 46%
No. ofwhale shipsinvolved inhunting
90042XL.III - NSD1 - 44%
,90052H14.111 - 45%D1 - 59%
Tons ofwhalescaught
Time
Tonscaughtper ship
Graph 3 was derived from graphs 1 and 2. At which point intime were the whales closest to extinction? Choose youranswer from the points on graph 3.
A biologist injects some blood from a sheep with a diseaseinto ten healthy sheep. If eight of the healthy sheepdevelop a disease with the same symptoms, which of thefollowing conclusions is justified?
A. The disease is caused by a microorganism.B. The disease is causee, by a toxin.C. Something present in the blood causes the disease.D. There is insufficient evidence to reach any of
these conclusions.
No lightRedRed then far-redRed then far-red then redRed then far-red then red then far-red
TREATMENT .- RESULT_ .
'no . gerlAinn:49n .
gerntination::ino gernunatloPgerminationnoT.
The data above is from an experiment=where. seeds weregerminated under different wavelengths. From the data, itc 1 be concluded that the properties of the control'systemui the plant
can be switched "on" andcan be switched "on" andcan be switched "on" andNone of the above can be
by different wavelengths."off" by red light."off" by ..ar-red light.concluded.
The following information relates to the questions below:
A biologist working for a wine company observed that somewines went sour after fermentation. He set up a seriesof tests as shown below, and examined them after 24 and48 hours.
Test Medium Inoculum(material introduced
into broth)
Appearance after
24 hours 48 hours
1 100 ml sterile broth 1 ml sour wine cloudy cloudy2 100 ml sterile broth 1 na tap water clear cloudy3 100 ml sterile broth 1 ml boiled sour wine clear clear4 100 ml sterile broth 1 ml boiled tap water clear clear5 100 ml unheated broth no inoculum cloudy cloudy
90062U The results obtained in tests 1, 2 and 5 after 48 hours areL.III - 29% probably a consequence of theD1 - 28%
A. chemical reaction between inoculum and the nutrientmedium.
B. growth of microorganismsC. temperature changes to which the broth was subjected.D. death of microorganisms inhabiting the nutrient
medium.
90072E The aim of the experiment was to investigate the effect ofL.III - 26% varying theD1 . - 38%
A. inoculum.B. temperature of the broth.C. time interval between setting up the experiment
and making the observations.D. extent of cloudiness which develops in the tube.
The questions below are based on the following:
Beetlewax (BW) is believed to prevent colds. To test thisbelief 20 000 volunteers were divided into groups and eachindividual took a pill every morning for one year.
GROUP NUMBER IN GROUP CONTENTS OF PILL
4750 '5 grams of sugarII 4750 5 grams of sugar & 1 gram of BW
III 4750 5 grams of sugar & 3 grams of BWIV 5750 5 grams of sugar & 9 grams of BW
90122JL.IIID1
90132VL.IIID1
- 10%- NS
- 17%- 28%
Which group served as the control for this test?
A. I
B. II
C. IIID. IV
20% of the individuals in Group I developed colds during theyear as did 19% of Group II, 21% of Group III and 10% ofGroup IV. From this we can conclude that
A. sugar reduced the number of colds.B. sugar increased the number of colds.C. sugar and 3 g or less of BW proved ineffective
in the prevention of colds.9 g of BW preVented colds. 121
The drawings on the previous page are to be used to answer thequestions below. Each drawing is the whole field of view asseen with a monocular. microscope. The-iens combination,X 15 eye ocular) and X 10 objective, was used to make drawingsand 2, whilst 3 and 4 were made using a higher magnification.
Drawing 1 shows a 1 mm scale superimposed on the field of view.Drawings 2, 3 and 4 are of the same filament of an alga -Spirogyra sp.; 3 is in its normal state whilst 2 and 4 havebeen placed in a 0.5 M salt solutif;11.
90082Q The diameter of the field of view in 3 and 4 would most closely- 54% approximate to
D1 - NSA. 200)um.B. 350ium.C. 0.5 mm.D. 3.5 mm.
. 90092B The most-likely nutber of.cell$ per,metre of d'filament of thisL.III - 47% species of Spirogyra would-beD1 - 54%
A. 10.
B. 100.C. 1000.D. 10 000.
90102M Of the following the nearest approximation to the length of theL.III - 59% motile microorganism shown in 3-would beD1 - 69%
A. 10)um.B. 20)um.C. 40)um.D. 80)um or more.
90112Y The motile microorganism shown in 3 was seen to pass from oneL.III - 64% side of the field of view to the other in exactly 2 seconds.D1 - 72% From the alternatives below, its most probable speed in
mm min-1 (millimetres per minute) would be
A. 6.
B. 12.C. 30.D. 300.
90224V A biology student is invited to act as an assistant to hisL.III - 12% doctor, a general practitioner. He makes the followingD1 - 24% four observations:
1. A patient with a high fever sweats profusely.2. A patient with an eye infection constantly wipes
the watery discharge from his eye.3. A patient with a cold has a "runny" nose.4. The infected sore on a patient's arm discharges
a watery pus.
Which of the following hypotheses best accounts for all ofthese observations?
A. Sick people always have fevers which cause them to sweat.B. The body tissues produce fluids when foreign invaders
enter them.C. All infections produce the same reaction in all patients.D. Infections always cause fever and fever always causes
'sweatin
Bacteria consist of two main groups, autotrophs and
heterotrophs. The only certain way that heterotrophicsoil bacteria can be classified is by their behaviour ondifferent nutrient media. Lockhead isolated soil bacteria
on a non-selective medium and then tested the bacteria on
media of decreasing simplicity. He found seven groups
which grew on the following nedia.
Group A - Medium A consisting of glucose - mitrate medium.
B - Medium A plus mineral salts and 10 amino acids.
C - Medium A plus cysteine and seven growth factors.
D - Medium B plus growth factors.E - Medium C plus the addition of a yeast extract.
F - Medium D plus the addition of a yeast extract.G - Medium D plus the addition of a yeast and a soil
extract.
90143G Several hypotheses could be made. Which of the following is
L.III - 62% least likely to be true?
D1 - 66%A. Fertile soils will contain a greater proportion of
bacteria with complex requirements.B. A soil extract from an infertile soil will have a
smaller growth promoting power than that from
a fertile soi/.C. Bacteria in the immediate vicinity of plant roots
fall more into groups B, C, D than more complexgroups and would decrease in proportion away from
plant roots.D. Fertilizing the sail would decrease the proportion of
bacteria .With complex growth requirements at theexpense of those with simple growth requirements.
.90153T Which of the following is an unfair criticism of the experiment?
72%A. The experiment provided no means of estimating or
D1 - grouping autotrophs in the procedure and results.
B. Various growth factors, e.g. Vitamin BI2 are present
in yeast and soil extracts which could haveaffected (if added) groups C and D.
C. It measures the properties of the soil only and does
not allow for inherent properties of bacterialpopulations which could result in nutritionalrequirement changes.
D. It is possible that, as some groups of bacteria canexist in several forms, classification intogroups could mean the same type of bacteria being
in two groups.
124
Kosinski grew a fungus; Aspergillus niger,'in a sterilizedsituation on a nutrient medium containing glucose. Therespiration rate was determined by Carbon dioxide output.By means of a siphon arrangement the glucose medium wasdrawn off at will and replaced by water. The curve,obtainedis shown below:
90164EL.III - NSD1 - 56%
90174QL.III - NSDl - 60%
A. BTime (hours)
Which of the following best explains the curve obtained?
A. When glucose is removed and replr,red by water, thereis a rapid fall in the crate of respiration.
B. The lower the respiratory rate of the fungus atwhich glucose is added the more rapid is theincrease in respiratory rate.
C. Changes in the respiratory rate of Aspergillus nigerare dependent on the amount of glucose .substratepresent.
D. Glucose is replaced by other substances which canserve as respiratory substrates to a limitedextent only.
When conducting the experiment, which was the factor thatleast concerned Kosinski?
A. The temperature of the fungal environment remainedstable.
B. The concentration of oxygen in the fungal environmentremained constant.
C. The acidity of the medium on which the fungus grewremained constant.
D. The intensity of light to which the fungus wassubjected remained constant.
125
90184BL.III - 30%DI - 49%
90194ML.III - 18%D1 - 17%
90204YL.III - 60%DI - NS
90214JL.III - 26%DI - 41%
DishNo,
Dish Content Reactionto testfor Sugar
Reactionto testfor Starch
Halved maize grains soaked inwater placed on starch agar
except inareas whereseeds were
Halved maize grains soaked inF.A.A. placed on starch agar
3 Starch Agar + in allparts ofdish
Plain agar
Halved maize grains soaked inwater placed on plain agar
The above data are results from an experiment on maize grains.
The positive reaction to sugar in dish 1 is probably due to a
compound which has been
A. secreted by the seed.
B. given off by the starch agar.
C. contained in the water.
The negative reaction to sugar in dish 2 is probably due to the
fact that the maize grains were killed
A. when cut into halves.B. when soaked in F.A.A.
C. by the starch agar.D. by saturation with water.
The purpose of dish 4 is a direct control for dishes
A. 3 and 5.
B. 2 and 5.
C. 1 and 3.
D. 1 and 2.
The purpose of dish 5 is a direct control far dish
A. 1.
2.
C. 3.
D. 4.
126
APPENDICES
APPENDIX A(1)
BLUEPRINT OF ITEMS .IN THE '<BANK
LEVEL III
(0) Diversity
(1) Inter-relationships
(2) Change
(3) Living World
(4) Organs, Systems
(5) Interaction,Maintenance
(6) Cellular Level
(7) Continuity
(8) Evolution
(9) Other
Total
I (1)
_Knowledge_
41
11
0
1
4
2
8
7
3
77
23.1
Mental Processes
(2)
Com Prehension
52
39
17
27
28
4
20
0
10
208
62.3
.(3) (4)
Application- Analisis
0
8
1
1
22:
6.6
Total
15.
Of the 469 items on which data from trialling was obtained,334 proved acceptable for Level III. This represents 71%of all items trialled.
In all, 381 are published in the Bank, or 81% of those trialled.
APPENDIX A(2)
BLUEPRINT -OF ITEMS IN THE BANK
DIVISION
Content Areas
(0) Diversity
(1) Inter-relationships
(2) Change
00 Living World
(4) Organs, Systems
(5) Interaction,Maintenance
(6) Cellular Level
(7) Continuity
(8) Evolution
(9) Other
Mental Processe
(1)
Knowledge
4
7
5
1
1
(2)
Comprehension
57
40
20
27
23
2
19
5
0
10
Total 66 203
20.8 64.0
(3)
Application
6
0
2
I 21
12
6.6
Of the 469 items on which data from trialling
was obtained, 317 proved acceptable for
Division 1. This represents 68% of all items
trialled.
129
8.5
317
APPENDIX_
,l'AJCONOMY OF EDUCATIONAL OBJECTIVES
SUMMARY OF BLOOM'S CLASSIFICATION
1.00 Knowledge - answered by recognition or recall, i.e., memOonly.
1.10 Knowledge of Specifics - to do with specific and isolablebits of information, e.g., When did Cook first arrive tnAustralia? What does "Taxonomy" mean?
to dowith
categories, criteria, methodology (N.B. merely knowing,not using these), e.g., Under what conditions is a commaUsed?
1.30 Knowledge of Universals and Abstractions - to do withprinciples, generalisations, theories, structures (N.B.again, merely knowing, not using these), plus drilledcalculations. E.g., State Newton's Laws of Motion.
2.00 Comprehension - answered by understanding, without making muchuse of the understanding gained.
2.10 Translation - channg from one form to another, e.g.,rephrase a sentencL; "read" a graph, music, plans, ortable of figures; translate into/from Frehch; draw agraph from data; sketch a geometrical figure from data,etc.
1211_InauMlig221 - understanding the mAjor ideas in acommunication, including recognising the limits ofinterpretations which may be drawn, e.g., preparing acoherent summary; distinguishing warranted fromunwarranted conclusions; putting things into order(based on understanding, NOT on memory).
2.30 Extrapolation - extending trends beyond or between theinformation given w.r.t. time, topic or number, e.g:,drawing conclusions which sum amrise a trend; predictingconsequences of courses of action; predicting relativeprobability of conclusions; distinguishing valuejudgements from predictions of trends; filling in gapsin a table; estimating values which are "off" a graphpage; going from a sample to a universe and vice versa.
3.00 Application - answered by recognising some unpromptedgeneralisation, and then using it.
4.00 Analysis - answered by recognising relationships, organisationalprinciples, bias, etc.
5.00 Synthesis - answered by putting things together to make acoherent whole, e.g., writing a letter or essay Eor a purpose;drawing up plans; composing music or a poem Or, & plan ofaction; making discoveries; making hypotheses; preparing alecture; making an impromptu speech; setting exams; planninga teaching unit. N.B. Merely stringing facts together is NOTsynthesis, even if it is asked for in essay form.
130 ^
0 Evaluation - answered by logically supporting judgements withreasons, e.g., judging sheep; comparing possible courses of
action; preparing a critical review of a book; marking an
essay; writing a school reference.N.B. Evaluation is NOT involved if the decision is obtained
from memory.
131
(a) Sampling
.The problem was to trial 469 items on the 1507 Tasmanian studentstaking H.S.C. Biology at Level III and also on the 811 students takingit at Division 1, in 1974. These items-were- trialled in Octoiter and'early November of that year. . Factors complicating the Sampling, Werethat a high return of answer sheets could not be guaranteed, that's:4eitems tended to be in rather lengthy units and that we wanted to.keepthe trial tests reasonably short for convenience of administration io-the schools.
Basically, a form of random test sampling was decided on, eachtest to take about one hour and hence be restricted to 33or. 34 iteMs.Thus 14 tests' were to be used and about 3000 student answer- sheetsneeded to give around 100 responses per test (and.so,,per 'item). Itwas estimated that if each school was asked to give ,one 'test to eachLevel III student and 2 to each Division 1 student, then,- allowing fornon-returns, the numbers should have been achieved.
ApPENDIX
. STATISTICAL NOTES
In constructing the tests substantial thought was put info' .
randomising as much as possible the content areas, mental, processes .
mquired and types ,of -items. As a result .the' tests we*e.reasonablysimilar irk structure, and we assumed that they were sufficiently So '-to allow each to be regarded .as a random sample of therinfinite test -i.e. , the bank. Thus an item' s PBC, 'obtained from the! iiem 'analysis,was assumed to be an approximation to the item's correlation with thebank as a whole, and hence that these correldfilins were 'Comparable testto test.
As a result of trialling, the average number Of Level III studentsanhad
hoped for. The average number of, Division l's answering-each item
swering each item was 82, which fell within the range of numbers-we.
was 73 again about what we had expected. No test, at either levelhad fewer than 61 pupil answers.
(b) Item Analysis
The Department's Item Analysis computer programme was used, andthis gave a 'considerable amount of information about each item. (SeeAppendix E for an example of this.) The two figures used`for furthercalculations on accepted items were:
(i) Right PBC : the point-biserial correlation betweenthe score on the item and on the rest of the test;
Wrong RF : the proportion attempting thefl item andgetting it wrong.
(c) Initial Calibration of Items
TWo steps were necessary. .. -The first was ;to make an arbitrarydecision about the bank characteristics as a whole;_ the second wasto derive a series of measures for each item,- based on the 'hank
es.
Blink Characteristics. The eventual purpose .of the.Serf-Moderation.yrcicedure is to give schools infoimation"aboutthe4Umbers- of Cr" s , L' s and. N' s they:,should,the 'subject for both''Level III and Division.1,: ..-It seemedreasonable .to use the-consolidated awards fOr'the-state.in _1974 its the basis of these:
z
where, f, F have ,their.'usual meanings, was u-113formula . gave z -scoresaeof-1. 7 ,LeVel -and z. scores- offor Divisifin 1- -...-
(ii) Item-Charicteristics. If- the regression of y on x islinear, -the,predicted value of xfy9- froia-A:given valueof x is
ra-. (x - 5E)y = Y
where the symbols have their usual meanings. Thisequation can be used to link item characteristics withthe Bank' characteristics.
Suppose the overall facility of an item (F) is definedto be the proportion, not getting it wrong. - ThenF = 1 - (Wrong RF). Also, F is equal to the meanscore on a one-mark item, and the standard deviationof the item is ifTr=f5. Hence if-y = a student'sscoie on the item,
y = F and 0 =
Further, if x = a core on -the test as a whole;
= the mean score of all candidate's on the test;
and c- = the standard deviation of these scores,
then 2' is a z score on the test, Which prOvidescr-
the, link yi.th
The predicted facility for a candidate on the item (F'),then, is given by substituting these values into theregression equation, as the Right PBC is a correlationcoefficient:
F' = zr F - F2 + F
Thus a Level III C candidate should scoreF'
, wherec
F' = 1.76 r F - F2 + F ,
and similar expressions can be written for F'and F'
n
An example:
If item 00842Q has a Wrong RF = 0.48, Right PBC = 0.22for Level III,
F = - 0.48 = 0.52
So F': = 1.76 x 0.22 x,i6.52 - (0.52)2 + 0.52 = 0.71
i.e., C candidates should average 0.71 on the item.
F' = 0.46 x 0.22 xu/6.52 (0.52)2 + 0.52 = 0.57
i.e., P candidates should average 0.57 on the item, etc.
The card from which this data was taken is shown inAppendix E.
(iii) Item Calibration
As the F' , etc., above are derived using all the data,
it is assumed that the total number of Level III studentsinvolved in trialling each item are in turn C's, P's, L'sand N's. Suppose there were 100 students, then for C's(0.71 x 100) = 71 out of 100 students would have got theitem correct; for P's 10.57 x 100) = 57 out of 100 wouldhave got it correct, etc.
Thus the initial data stored for this item would be
credits 71, 100passes 57, 100
etc.
The correct alternative will also be stored, as will theAccess Number.
134
)*:The::Updating.Procedute
Suppose a school uses a test containing item 00842Q, and therking reveals the following:
The school wants 18 C's, 83 P's, 38 L's and 11 N s.
- Of the 18 highest scorers on the test, 14 get 00842Q right,and of the 83 next highest scorers, 50 get 00842Q right.
The C data for 00842Q will change to (71 + 14), (100 + 18) -. to 85, 118; and the P data will-change -tcr7(57-+-50),
100 + 83) - i.e., to 107, 183. This updating will occur whether.or not the school's expectations are within the range obtained in
. the moderation procedure - see below.
The Moderation Procedure
This is based on'Wood -And Skurnik's interpretation of Lawley ,
as has been done in previous §cience, Mathematics, Social Science,
English and Geography Banks 1 . Thie
interpretation suggested below
is rather different from that given n the earlier publications,
but the same as in the Geography Bank.
Data Supplied by the School - Unmarked Answer Sheets,e.g., 150 of these.
- Desired distribution ofawards, e.g., 18C, 83P,38L, 11N.
- Access numbers of theitems used.
Steps in the Calculation of the Desired Range
1. The numbers stored for each item are converted backto proportions - e.g., from the 71, 100,
71
100= 0.71 = F'
cfor that item.
2.cand 2(F' )2 are calculated for all items in the
test and so lE[rc - (Pc)2] obtained.
3. These suns are then multiplied by the Desired Number
of C's, Nc
to give:
- expected total of C students = = T , say,
sum of variances of C students = N 2ii, - (F"cc c
4. Operations 1-3 are carried out for the other categories,and overall sums obtained, thus:
T =IT. and V =AV. , for1
. 1
The sum T is the total score forecast by the teacher,on the basis of his pattern of Desired Awards andafter varying item difficulties have been considered.It thus represents the number of correct answers heexpects his students to obtain, and so can be comparedwith the number, S, which his students actually achieve.
The sum V can be looked at as representing the errorvariance of the test, by the following,reasoning:
The amount by which V under-estimates the total.test variance is the sum of the'covariances
.
between the iteMs multiplied by the appropriateN.'s. These products represent the true variance
components of the total test variance, and hencethe remaining variance, V, must be the errorvariance.
This was Wood and Skurnik' s- interpretation of the work ofLawley, and the basis of the Self-Moderation procedureused in previous banks in this series.
5. Taking V as the error variance the S.E.M. for T must beIf, and the 95% confidence interval for T is given by
T
The width of this interval is a measure- of theuncertainties involved in the teacher's estimation ofhis students' score on the test chosen.
6. Further uncertainties must be considered when makingtransitions from interpreting T as an estimate ofperformance on the test to interpreting it as an estimateof performance on the whole Bank and, "finally, on thecouise studied. This last interpretation is, of course,the point of the whole Self-Moderation -procedure. iThetransitions can be justified by advice given to teachersin two places in this Bank:
- First, .they are advised to make tests for,moderation purposes similar to the Bank itselfin regard to spread of content and mentalabilities (see page xix). This is the basisof the first transition.
- Second, they are cautioned about a professionalapproach, in that they should not restrict- theirteaching to the type of work which Can'be testedusing items from the Bank ..(see page xix).'This makes the second transition feasible.
To allow for under-estimation of the S.E.M._ due' to thesefactors (which must operate to increase uncertaintiesabout T), the range is actually expressed as
R = T
-where the value of' K Oen be Varied;. At' ,the:.time ofwriting .(Mar; .1975), a valuelof'2.5 seemS tO be givingacceptable.. resUlt. typically, :a range .whieh is atiCiiit::
,T''
!
The--valne io be -uied";in- ',the futUre 'is'still.subjec .
-to research It is ,:doubtful whether, any, theoretical:method', of: dete7minine`the:!,!dbriectialUe,:wilt. befoinidi:'and,'the":vilne:;at,
the current value. will be :giVen .:at the toPlof Column: G., .;
iii) Calaulation of the. ACtUal'Store Obtained:bt.the Class
The 'tetel numbei Of coiiect'answeis alais:Totel
(iv) The Moderation ::
Scoro,S 'is tomPared 'With (T
. T - .$T + lyvIn thiS case, the schOO1 wciuld be within the .desirrange.
S < T 7
Here the school has been too genei-Ous in.itsAwards.
Three casaS.cin7s#Se:;
3. S)T + KflHere the school has been too-hard.
The school will be informed which category it falls into,and provided with data to amend its Desired Awards if thisis necessary AND if the school wishes to do so.
f) The Error Analysis
Such an analysis will be included with the moderation advice.
he basis of the analysis will be as follows:
(i) --Each item in- the bank -will have a -number of "labele_These labels will refer to such things as content areas(a finer classification than the 10 broad areas'represented by the first digit of the access number),skills, mental processes, difficulty, certain specificerrors, etc.
(ii) A selected test will contain items having some of theselabels. It is expected that, in any one test mostlabels will occur more than once.
e.g. Item 00842Q, the example in Appendix E, has Fvalues 0.71, 0.57, 0.47, 0.37 and one of itslabels is CO. The probability of a Level IIIcredit student getting.this item Wrong is'(1 - 0.71) s 0.29 and similarly the-probabilitiesof the other categories ;of students getting, itwrong are 0.43,. 0.55, 0.63. ,.. We can regard theseprobabilities as 'exisected-sceres for the errortypeeresented by CO.. ,
- 4/2
.
..
i) Wherever label CO appears in the test Similar expeeted. scores for this type.of error can be,calculated.- ,ifen6e;,
by a procedure-identical with" that:describe& insection (e) (ii) above, we can sum the expecte& scores andvariances over'ihe- itema labelled di.'and find.the expected;cores and sums Of variaades, of each of the .award groups'on this error type.
.
,
From this point, the analysis wilVtake Vtwo differentcouries, each of which will eventtially lead to a95%confidence interval as in (e) and each%of-whichis based on data supplied by the .school choOsing thetest. For both intervals, K will.be used ifistead of1 :96.
Suppose with 150 students the school wants 18C 83P,V
38Land 11N.
1. The group taking the test will first be regarded asaverage, and hence to have the same proportionseach category as the state 'overall. . Thua' the, itimberof credits for Level III in the group = 10.01$* .
150 = 15, and the numbers. in other'categories Will ba70, 30 and 34 respectively. These,numbers, with:theexpected scores and sums of varianees_'fromwill allow the calculation of the range ,of nuibers 'ofCO type errors to be expected if the group average.Call this R
- A'
2. An exactly similar calculation, but Wing the desiredawards of the school, will give the number Of CO typeerrors to be expected if the. group-is distributed asthe school 'thinks it is - i.e.; 18, 83, 38,. 11.Call this range RD.
(v) During the marking of ,the answer sheets, the CO type errorsactually made will be counted - Sco say.
(vi) Finally S will be compared with both R and R6, in a very
similar way to that in the Self-Moderation,ProCedureand a- comment will -be-made -if-S 'falls-OUtaidireithee or
both R and RD. This comment should 'form-a.basis for both
diagnostic and remedial action by the teachers.
(vii) Similar'calculations will-be made for all labels representedin theV test chosen, a comment being made only when' an errorcount falls outside a range.
(g) Computer Programmes
For this Bank, these will carry out stages (b), (c)(ii), (c)(iii),(d), (e) and (f). Also an access programme to inspeet,item data willbe used frequently, to decide whether items should remain in the'Bankor be withdrawn.
ese percentages will be continuallr updated as the Bank is used, byg desired awards to the originat'state:distribution.
iknYl-MAPY.,w,ill be thPi.' kult*Ftoili4i1-
APPENDIX
BASES OF THE ERROR ANALYSIS PROCEDURE
Mental Processes
1knowledge
P11
knowledge of specific facts, definitions
P12
knowledge of ways of dealing with facts, categories
P13
knowledge'of abstractions and generalisations
P14lcnowledge of routine calculations
2comprehension
P21
translation
P22
interpretation
P23
extrapolation
P3
application
P4
analysis
P41
detection of mistakes
P42
recognition of bias, style, etc.
P43
distinguishing assumptions, etc.
synthesis
P6
evaluation
Item Difficulties
D1
easy items (difficulty less than 30%)
02 items of medium difficulty
03 hard items (difficulty greater than 70%)
139
Content Areas
CO Diversity
C01 classification
C011 classification
C012 classification
C013 classification
C014 classification
COM classification
- bases of
- levels of
- living v. non-living
plants v. animals v. micro-organisms
plants
animals
C016 classification - micro-organisms
CO2 species definition
CO3 structure and symmetry
C04 types of nutrition
Cl Interrelationships
Cll food and energy
C12 communities
C13 succession
C14 food web and food chain
C15 diffusion
C151 diffusion and osmosis
C152 diffusion and heat transfer
C153 diffusion, rates-
C154 diffusion and active transport
C16 factors of survival
C17 parasitism, commensalism, mutualism and
C18 adaptations
C181 adaptations - plants
C182 adaptations-- animals
C19 activity and behaviour
C2
'C21
C22
C23
C24
C2S
C2S1
C252
C26
Change
population changes
variations
natural selection
mutation
fossils
fossil record
fossils and evolution
distribution and isolation
....Living World
1. :biOtthOe
311 ',..biosphere - balanced systems.
C312... :biosphere ,Man'S effect on :
.C318' IpieSt Control
input/output
input/output re: Matter
znput/OutPut.ie: , energy
.C4 Organs, Systems'
C41 Plant - photosynthetic system
C412 plant transport system
C413 rlant - responses
C414 paant - reproductive.system
C42 animal systems
C421 animal,circulatory systems
C422 animal endocrine syitem
C423 animal nervous system
C424 animal digestive system-.
C425 animal gas exchange
C426 animal reproductive system
C427 animal excretory system
C6 Cellular Level
C61 cells - structure and components
C62 cell chemistry
C63 enzymes
C64- cellular respiration as a process
C65 photosynthesis as a process
C66 transpiration as a process
C7 Continuity
C71 cell division and growth
C72 cell differentiation
C73 asexual reproduction
C74 sexual reproduction
C75 reproduction andvariability
C76 physiology of reproduction
C77 patterns of heredity
C78 chromosomes and genes
end action
C8 Evolution
C81 theories of 'evolution
C82. primate-evolution
C83 cultural. evolution
CS Interaction MaintenanCe
'C51 homeostasis feedback
C52: ahemical co-ordination, hormones
C53 -physiology of, learning
CS4 tropisms
CSS iMmunology
C9 Other Content
C91 scientific approach
C92 hypothesis making
C93 , hypothesis testing
C94 designing expts.
C95 history of science, and
C96 laboratory techniques
C97 laboratory equipment
C98 microsccipes
C99 experimental controls
Wier iases for Errors
El graph interpretation - linear scales
E2 graph interpretation - non linear scales
E3 diagram.,interpr.etation..,
E4 diagram interpretation - relationships
ES map interpretation
E6 table interpretation
E7 photograph interpretation
E8 interpretation of articles
E9 quantitative approaches
E10 hypothetical situations
Ell classifying organisms
E12 using taxonomic names
E13 basic chemical ideas
chemical reaCtions
philosophical prohlems
erigthy atimulus material
structure - function relationships
interpretation. of ,experilents
143
4%.
APPENDIX
A TYPICAL COMPLETED ITEM CARD-
to)it PL
0LI It 61 oz tz z CZ
Item No . .7_ ITEM DESCRIPTION,,
Subject BIOLOGY Topic. ,B I VE RS I TY. Clusitication 2 20
Dittaib Use- of genus, species -concepts. Author .. Trudy Ann Hai'
0 0 0 0 0 0 0 UT 0 0 0 L 0 0 0It objective correct answer is ..... H. no. )bjective give detailed mark scheme.
Two populations of lemmings are separated by a mile-wide river.O One can be characterized by I:Town fur, while the other is
Ocharacterized by brown and White spotted fur. When members_of these_two_ populations.,were placed,together they_were_found , - _
to interbreed and produee sterile offspring. The best -0 interpretation of this data is that the two populations are
0 A. the same species.B. sub-species of the same species.0 C. the sane species, but have become distinct in
0 appearance because of the physical barrier(river) separating them.
O D. the same genus but different species.
0
144
APPENRIx
REFERENCES
. Bloom, B.S. (Ed.). Tar.conotny of Educational Objectites,Handbook 1 : Cognitive Domain. Longmans, Green & Co.
1956.
Wood, R., and Skurnik, . L.S. item &raking. NFER.
pp. 126-127. 1969.
a
Lawley, D.N. "On problems connected with item selection
and test construction." Proceedings of the Royal Society
of Edinburgh, 61. pp. 273-287. 1943.
Bank,of Science Items Level II Fourth Year, including
a Proposal for a Self-Moderation Scheme. Curriculum
Branch. Education Department of Tasmania. June, 1971.
. Bank of Items for Mathematics A, Level III, Fourth Year,
with a Self-Moderation Procedure. Curriculum Brarich.
Education Department of Tasmania. May, 1972.
Bank of Items for Mathematics, Grade 10, Level II;with Self-Moderation and Error Analysis Procedures.
Curriculum Branch. Education Department of Tasmania.
May, 1974.
7. Bank of Items for Primary Social Sciences, Grade 5,
with a Self-Moderation Procedure. Curriculum Branch.
Education Department of Tasmania. March, 1974.
Bankof Iteme.pr-Frimary Social SciencesGradq_6,_with a Self-Moderation Procedure. Curriculum Branch.
Education Department of Tasmania. Ottober, 1973.
9. Bank of Items for Grade 10, English, Level 11Y, with
Self-Moderation and Error. Analysis Procedures.Curriculum Branch. Education Department of Tasmania.
April, 1974.
10. Bank of Items for H.S.C. Geography, .Level III-andDivision 1, with Self-Moderation and Error AnalysisProcedure.. Curriculum Centre. Education Department