DOCUMENT RESUME ED 298 660 EA 020 349 TITLE Context, Outcomes and Resources of Elementary and Secondary Education in Oregon. INSTITUTION Oregon State Dept. of Education, Salem. PUB DATE Mar 88 NOTE 64p.; Prepared by the Assessment and Evaluation Section, Division of Curriculum and School Improvement. PUB TYPE Reports - Research/Technical (143) EDRS PRICE MFOI/PC03 Plus Postage. DESCRIPTORS Academic Achievement; *Educational Planning; *Educational Policy; * Educational Quality; Educational Resources; Elementary Secondary Education; High Risk Students; Institutional Characteristics; *Public Education; SchOol Demography; Sociocultural Patterns IDENTIFIERS *Oregon ABSTRACT The purpose of this document is to provide an overview of major trends and forces likely to affect public education in Oregon. This report is intended to serve as one source of data that could be used by state policymakers in establishing educational priorities for Oregon. The report is organized into three major categories: (1) the context of education (education and the changing nature of the work force and demographic and social trends); (2) outcomes of education (academic performance and school completion); and (3) school characteristics and resources (teacher characteristics and educational resources). (SI) ******300000000000(**3000000000(3000000000000(*3000000000000000000000000EM * Reproductions supplied by EDRS are the best that can be made m * from the original document. m MMEMMXXXXXXX*30(*)000000W00000000M)00000000E30000090000000000000(3000000(
Transcript
DOCUMENT RESUME
ED 298 660 EA 020 349
TITLE Context, Outcomes and Resources of Elementary andSecondary Education in Oregon.
INSTITUTION Oregon State Dept. of Education, Salem.PUB DATE Mar 88NOTE 64p.; Prepared by the Assessment and Evaluation
Section, Division of Curriculum and SchoolImprovement.
PUB TYPE Reports - Research/Technical (143)
EDRS PRICE MFOI/PC03 Plus Postage.DESCRIPTORS Academic Achievement; *Educational Planning;
ABSTRACTThe purpose of this document is to provide an
overview of major trends and forces likely to affect public educationin Oregon. This report is intended to serve as one source of datathat could be used by state policymakers in establishing educationalpriorities for Oregon. The report is organized into three majorcategories: (1) the context of education (education and the changingnature of the work force and demographic and social trends); (2)outcomes of education (academic performance and school completion);and (3) school characteristics and resources (teacher characteristicsand educational resources). (SI)
* Reproductions supplied by EDRS are the best that can be made m
* from the original document. mMMEMMXXXXXXX*30(*)000000W00000000M)00000000E30000090000000000000(3000000(
Contents
Page
Foreword 1
Introduction 3
Part I: The Context of Education
Education and the Changing Nature of the Work Force
W.iat skills will be needed for success in the future 9 7Excerpts from nationai studies and reports onchanging skill demands and demographic factorsaffectl'ig the work force.
How is Oregon's occupational structure changing? 12Employment trends by industryAge of entry level work forceUnemployment by educational attainment
Demographic and Social Trends
How many students are at risk of educational failure 9 16Excerpt from Reconnecting Youth: The Next Stageof ReformPercentage of children under poverty levelPercentage of births to unwed mothersPercentage of youth using drugsPercentage of children living with two parents
Is the potential support base for public education changing? 25PTA membershipEducation expenditures as a percent of per capitaincomePercent of families with childrenPercent of population under 20
Part II: Outcomes of Education
Academic Performance
How well are students performing on the skills they willneed in the future?
Eighth grade achievement on Essential Learning SkillsFindings from national literacy studiesFindings from Second International Mathematics Study
0I)
29
Page
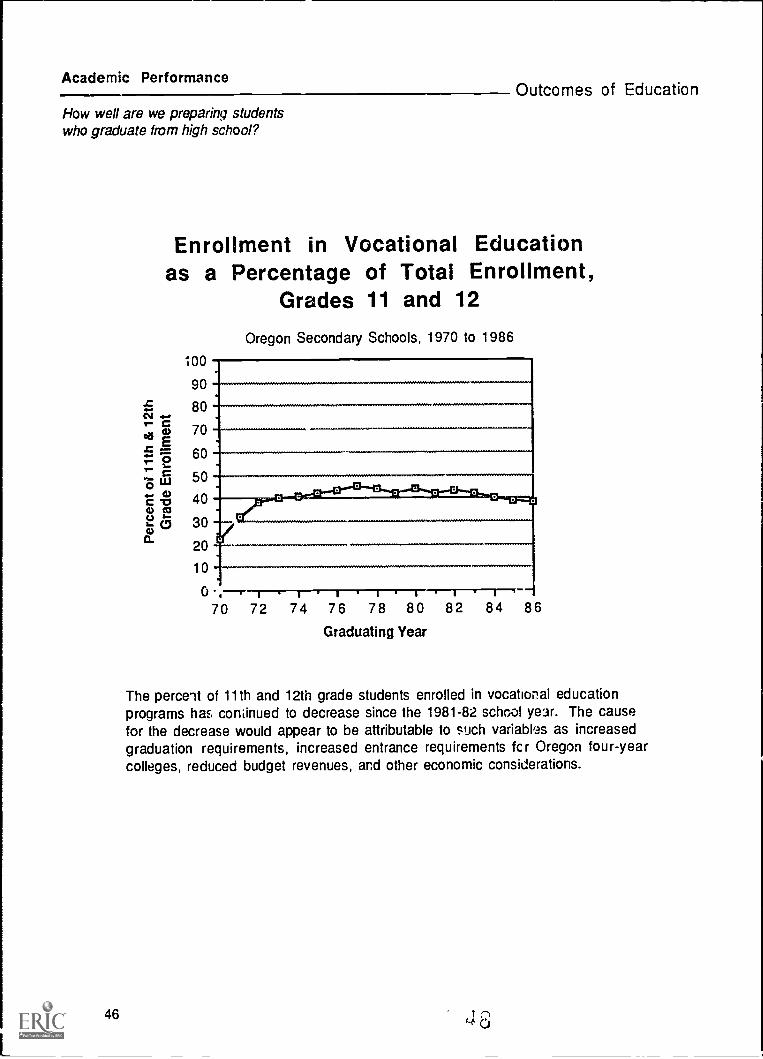
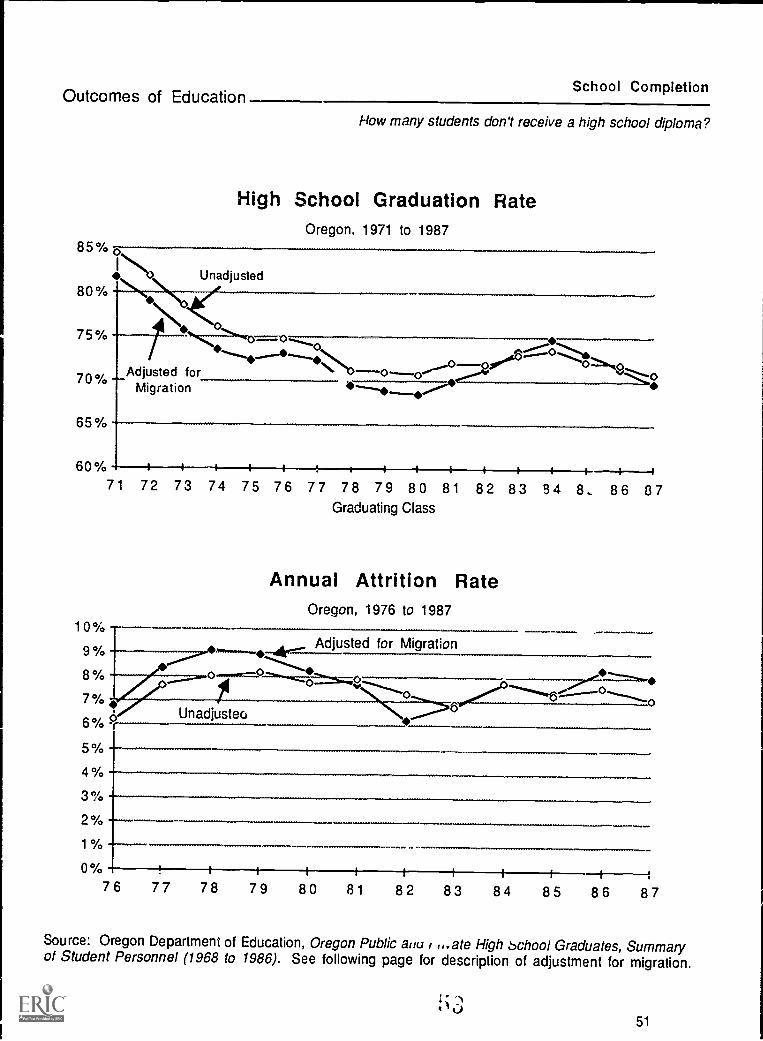
How well are we preparing students who graduate from 40high school?
Performance on the Scholastic Aptitude TestYears of coursework in selected areas of studyEnrollment in vocational educationPursuits of vocational program cempletersPercentage of college freshmen enrolling inEnglish Composition or Intermediate AlgebraIntended areas of college study
School Completion
How many students don't receive a high school diploma 9 51High school graduation rateAnnual attrition rate
Part III. School Characteristics and Resources
Teacher Characteristics
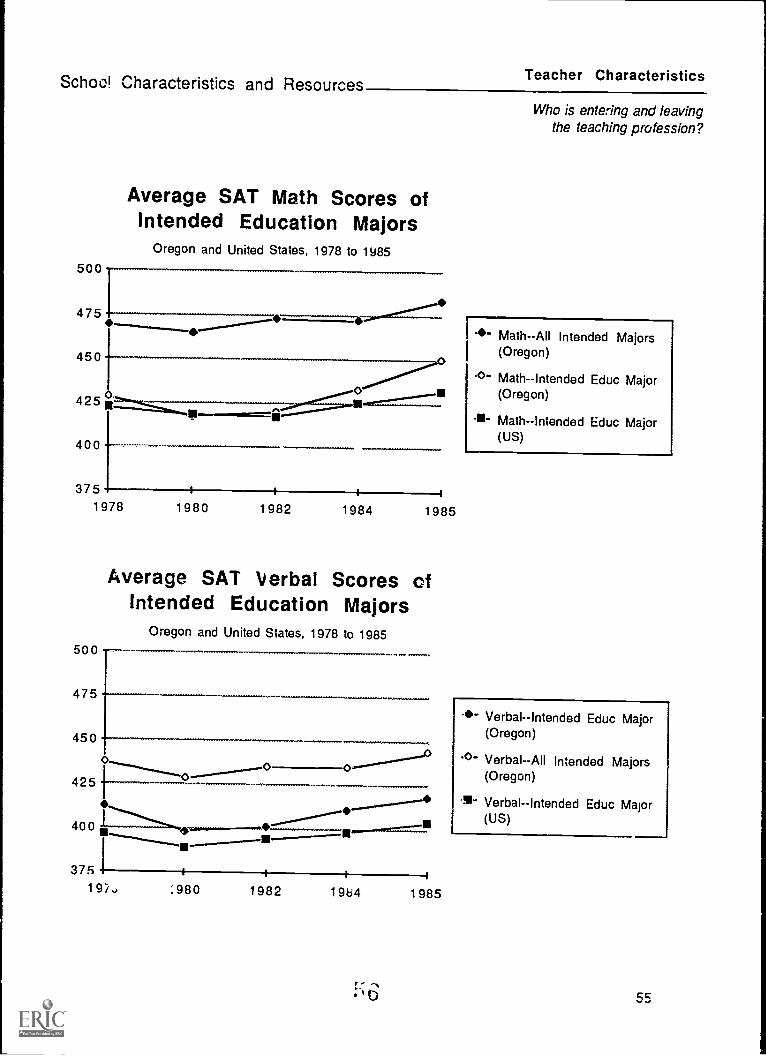
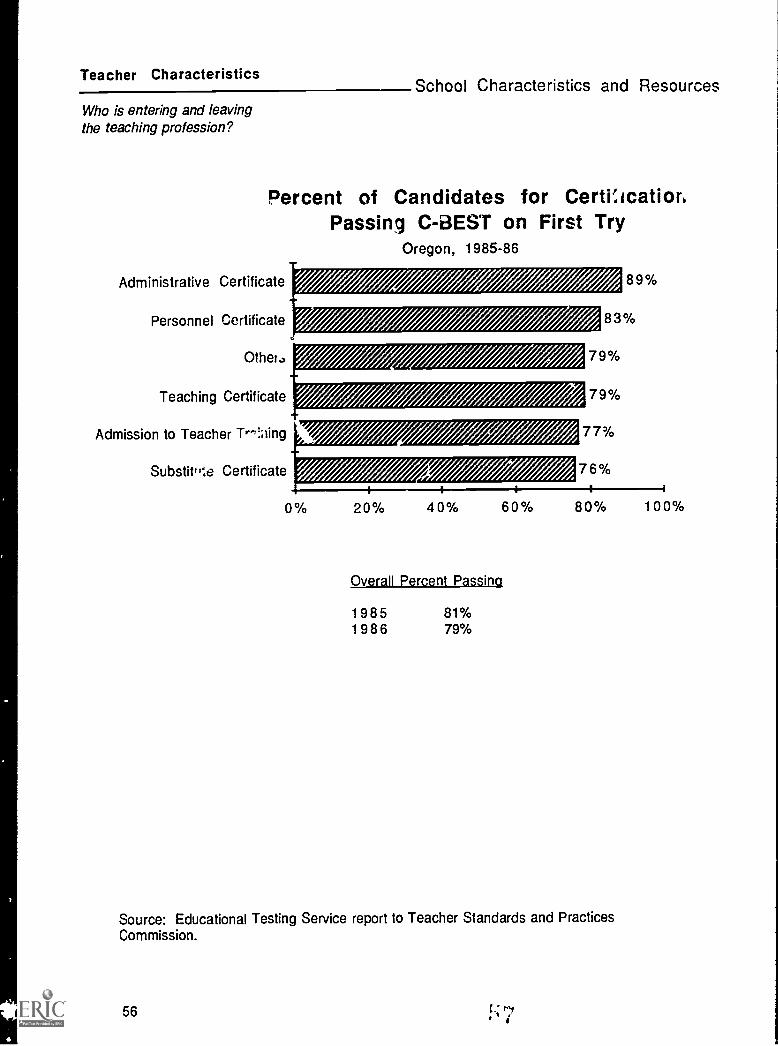
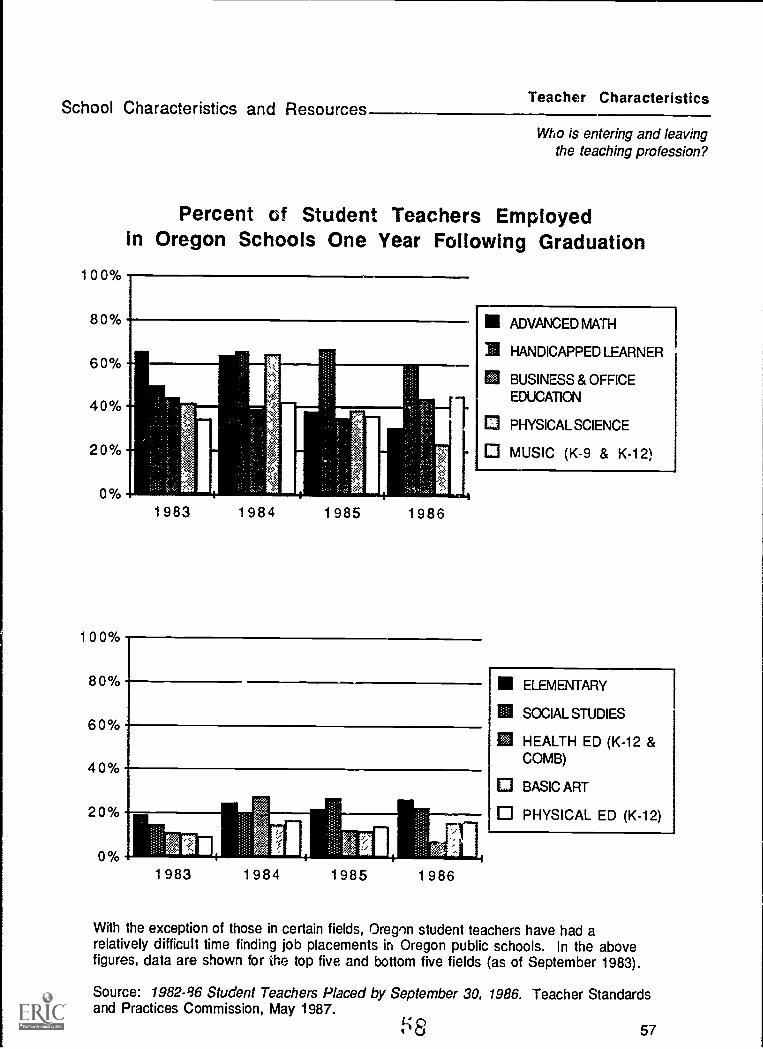
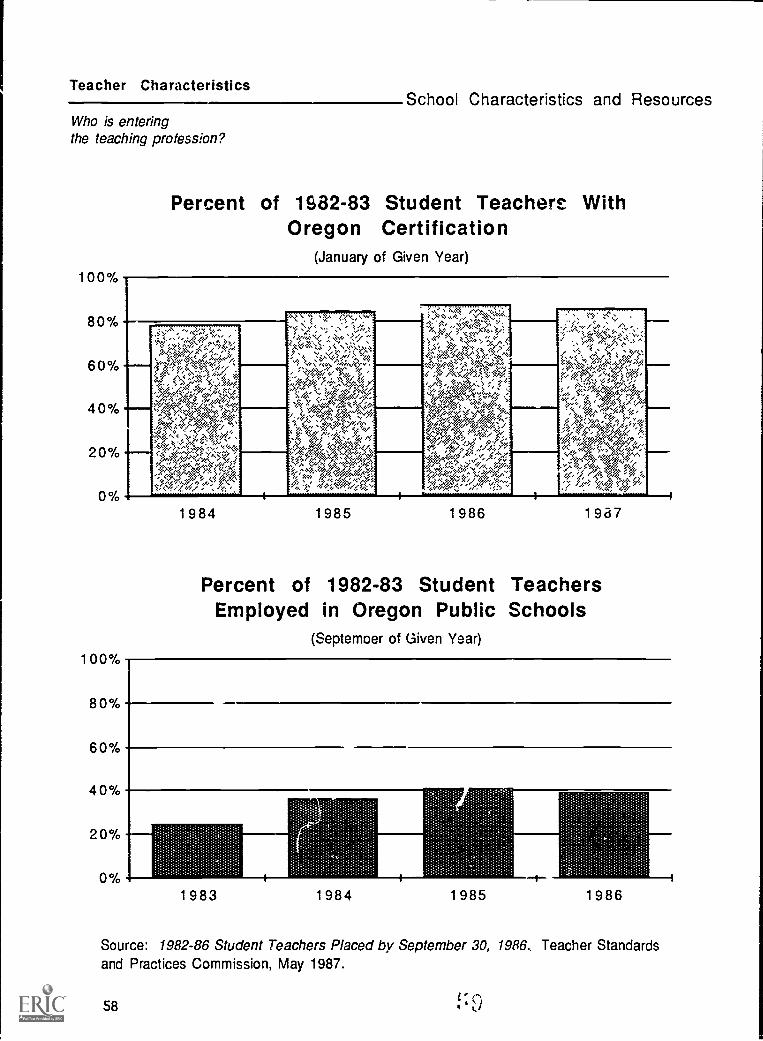
Who is entering the teaching profession9 55SAT scores of intended education majorsPercent passing C-BEST on first tryPercent of student teachers employed in Oregonschools one yearfollowing graduation, by field of studyPercent of student teachers certified/employed inOregon schools
Educational Resources
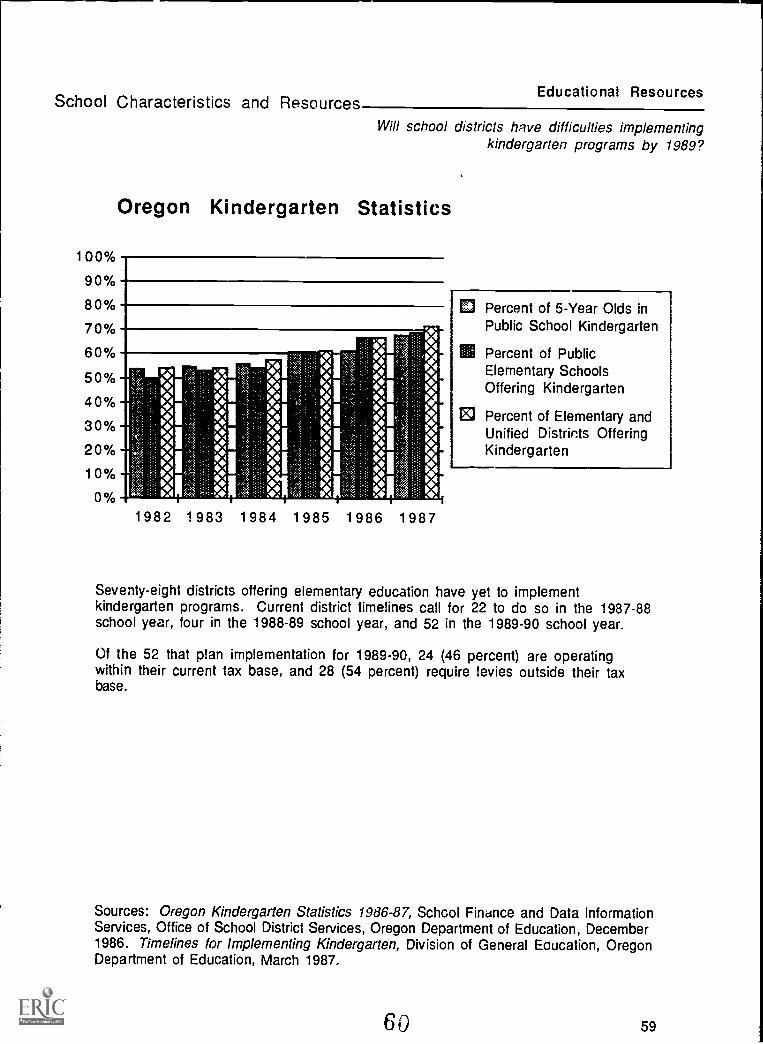
Will school districts have difficulties implementingkindergarten programs by 1989?
Oregon kindergarten statistics
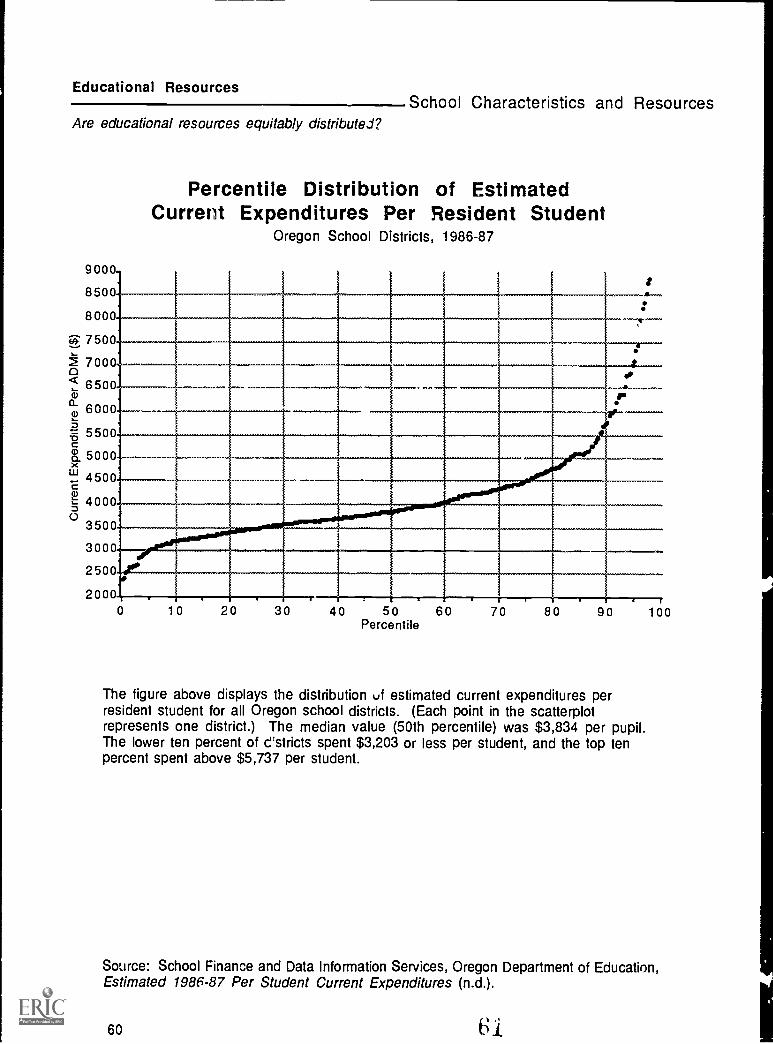
Are educational resources equitably distributed?Percentile distribution of estimated currentexpenditures per resident studentCorrelation between expenditures per student andassessed value per studentCorrelation between property tax rate and assessedvalue per student
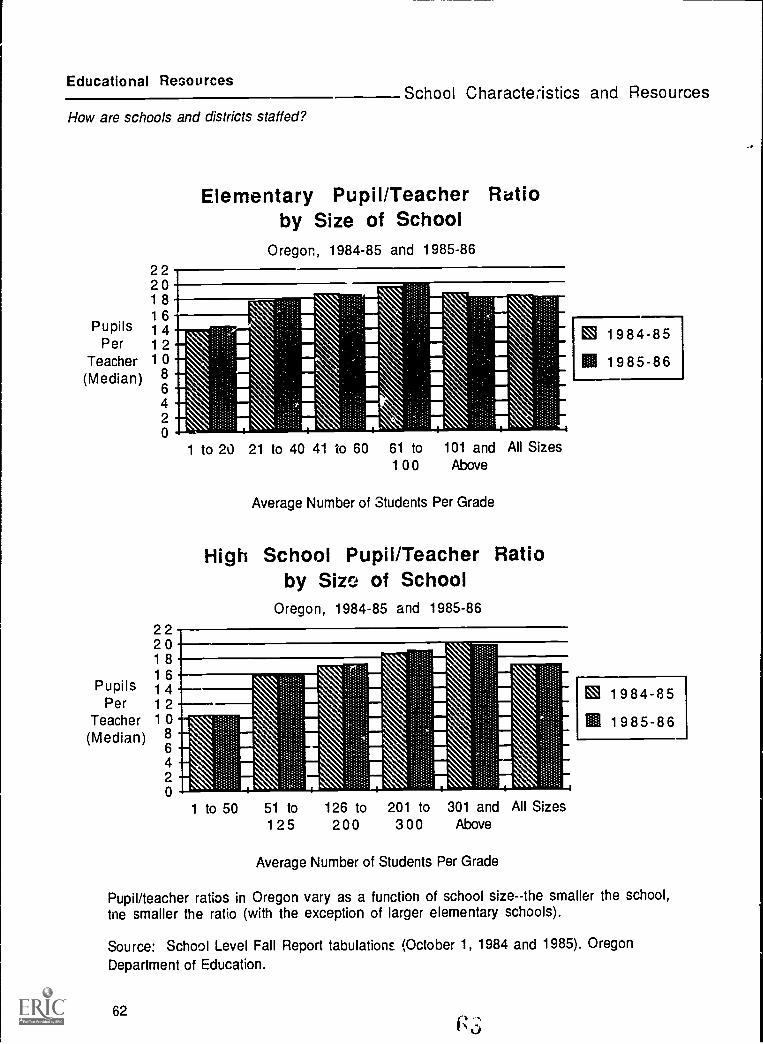
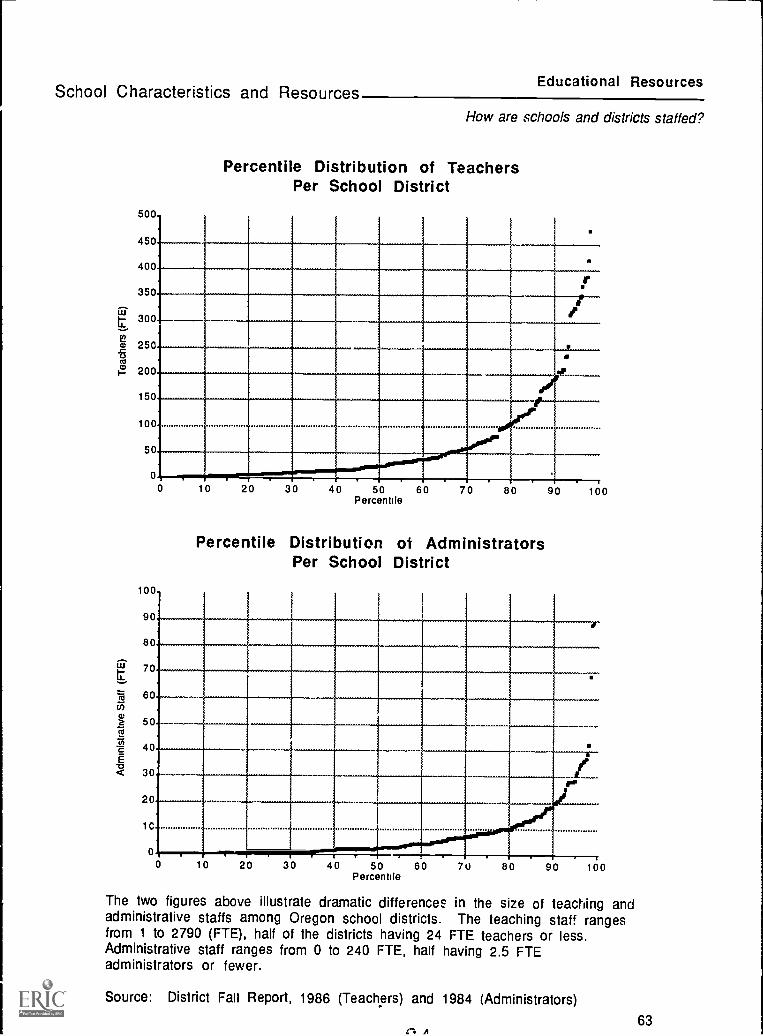
How are schools and districts staffed?Elementary pupil/teacher ratio by size of schoolHigh school pupil/teacher ratio by size of schoolPercentile distribution of teachers per school districtPercentile distribution of administrators perschool district
59
60
62
Foreword
The purpose of this document is to provide an overview of major trends and forces likelyto affect public education in Oregon. As such, it is intended to help establish a context forstate education policy development and priority-setting.
David Pearce Snyder argues that:
The principal imperative for public education during the nearterm future will be to help society adapt to the inevitable forcesfor change. There can be little doubt that, in order to do this,public education will have to adapt to these same changes.Specifically, if the purpose of education is to provide students--ofwhatever age--with the knowledge and competencies they willneed to lead effective, rewarding lives in the future, educatorswill first have to gain a working understanding of that future, inorder to be able to design the curriculum content and learningprocesses that will be most appropriate for the needs of society.
Overarching Themes
In a compendium of statistics such as this, it may be difficult to "discern the forest fromthe trees," or see the connections among apparently unrelated data. Here we try to pointout some of the major themes that run through the information that follows,acknowledging that this is not the only interpretation possible.
Certain critical labor market trends will have a profound impact on oursociety over the next 15 years. In its recent publication, Work Force 2000,the U.S. Department of Labor points out that "As the world economy becomesmore competitive and integrated, and increasingly focused on services andinformation tasks, economic success will depend to a greater degree on ourhuman capital. By the year 2000, there will be few high-wage, unskilledjobs; industries that require only unskilled labor and jobs that require onlybasic human skills will 'increasingly be done abroad. High American wageswill be paid primarily to those whose knowledge or skills give them an edgein national and world labor markets. As a matter of equity within Americansociety and competitiveness around the globe, more attention must be paid toimproving the skills of all segments of the U.S. labor force."
In Oregon, this shift in the labor market is reflected in the loss ofmanufacturing and construction jobs and increased employment in retailtrade, business services, health care and government. Entry and advancementin this job market will depend to an increasing extent on an individual's levelof education and ability to continue learning throughout life.
The outcomes of public schooling, while adequate in terms of yesterday'srequirements, may not be sufficient to maintain our competitive edge in theglobal economy of tomorrow. The authors of The Subtle Danger, interpretingthe results of the NAEP literacy assessment of young adults, argue that, "Themain literacy problem, over the long run, has not been that people's literacyskills ha. J been slipping, but that literacy demands keep rising." The
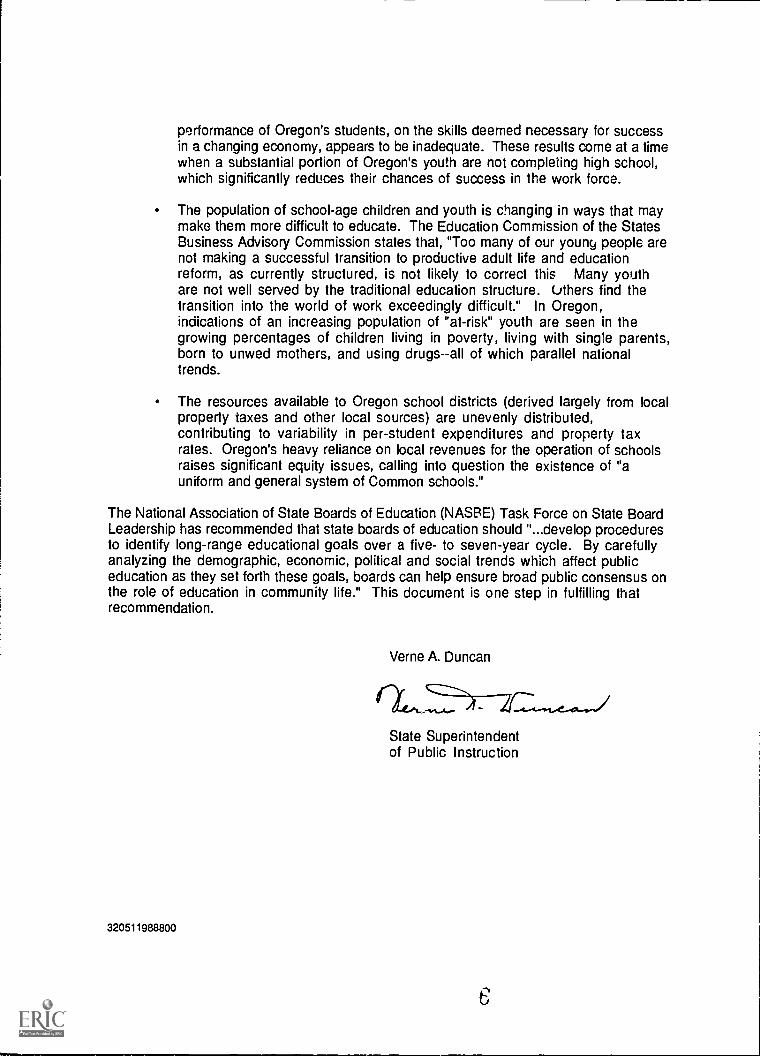
performance of Oregon's students, on the skills deemed necessary for successin a changing economy, appears to be inadequate. These results come at a timewhen a substantial portion of Oregon's youth are not completing high school,which significantly reduces their chances of success in the work force.
The population of school-age children and youth is changing in ways that maymake them more difficult to educate. The Education Commission of the StatesBusiness Advisory Commission states that, "Too many of our young people arenot making a successful transition to productive adult life and educationreform, as currently structured, is not likely to correct this Many youthare not well served by the traditional education structure. Uthers find thetransition into the world of work exceedingly difficult." In Oregon,indications of an increasing population of "at-risk" youth are seen in thegrowing percentages of children living in poverty, living with single parents,born to unwed mothers, and using drugs--all of which parallel nationaltrends.
The resources available to Oregon school districts (derived largely from localproperty taxes and other local sources) are unevenly distributed,contributing to variability in per-student expenditures and property taxrates. Oregon's heavy reliance on local revenues for the operation of schoolsraises significant equity issues, calling into question the existence of "auniform and general system of Common schools."
The National Association of State Boards of Education (NASBE) Task Force on State BoardLeadership has recommended that state boards of education should "...develop proceduresto identify long-range educational goals over a five- to seven-year cycle. By carefullyanalyzing the demographic, economic, political and social trends which affect publiceducation as they set forth these goals, boards can help ensure broad public consensus onthe role of education in community life." This document is one step in fulfilling thatrecommendation.
Verne A. Duncan
State Superintendentof Public Instruction
320511988800
Introduction
Educational reform in the United States tends to run in cycles, often following somemajor event that focuses attention on possible shortcomings of the educational system.In the late 1950's Sputnik shocked the United States into a frenzy of activity to reformeducational programs, especially in science and mathematics. In the early 1980's, thereport "A Nation at Risk" again focused major national attention on education. Theactivity following Sputnik tended to have a national flavor, with large amounts of federaldollars being contributed to curriculum development projects, whereas the more recentefforts mainly have been spearheaded by state policymakers.
The far-reaching implications of recently proposed or adopted reforms has placedparticular stress on states' ability to find appropriate solutions to perceived problems.Often, well defined and articulated problems open the way to appropriately focusedsolutions. Unfortunately, state eductional policymakers often lack sufficient well-conceived information to clearly expose the nature of the problems facing educationtoday. This is particularly true of information that fits the educational context of theirstate.
In a recent report on state board leadership, published by the National Association ofState Boards of Education, one of the primary functions of state boards of education wasto identify long-range educational goals over a five- to seven-year cycle. As afoundation for their strategic planning, state board members are encouraged to "identifyeducation priorities by analyzing demographic, economic, social and political trends andconsider the capabilities and limitations of the education system." Being able to followthis recommendation requires access to a rich source of information related to local,national and international trends.
This report is intended to serve as one source of data that could be used by statepolicymakers in establishing educational priorities for Oregon. It may not be ascomplete as many people would prefer, but represents the most complete set of data thatcurrently exists in the state. As policy questions become clearer, future data gatheringcan be focused on information that will help to focus attention on the major educationalconcerns in the state.
The data provided in this report has been organized around a set of questions that pertainto education in Oregon. These questions are intended to serve as a starting point hiestablishing a data base of information to inform policymakers regarding issues affectingeducation. As new questions arise they will be added to the list and where possible datawill be added to heap clarify the issue.
The questions being addressed are organized into three major categories:
1. The Context of Education
Education and the Changing Nature of the Workforce
Demographic and Social Trends
3
Introduction
2. Outcomes of Education
Academic Performance
School Completion
3. School Characteristics and Resources
Teacher Characteristics
Educational Resources
The following pages provide information, both opinion and factual, concerning theseareas. It is important not to rely too heavily upon one piece of information in trying toestablish a direction for reform, but rather put together an impression based on theaccumulation of the data.
4S
PART I: THE CONTEXT OF EDUCATION
Education and the Changing Nature of the Work Force
What skills will be needed for success in the future?Excerpts from national studies and reports on changing skilldemands and demographic factors affecting the work force.
How is Oregon's occupational structure changing?Employment trends by industryAge of entry level work forceUnemployment by educational attainment
Demographic and Social Trends
How many students are at risk of educational failure?Excerpt from Reconnecting Youth: The Next Stage of ReformPercentage of children under poverty levelPercentage of births to unwed mothersPercentage of youth using drugsPercentage of children living with two parents
Is the potential support base for public education changing?PTA membershipEducation expenditures as a percent of per capita incomePercent of families with childrenPercent of population under 20
S
Education and the Changing Nature of the Work ForceThe Context of Education
What skills will be needed for success in the future?
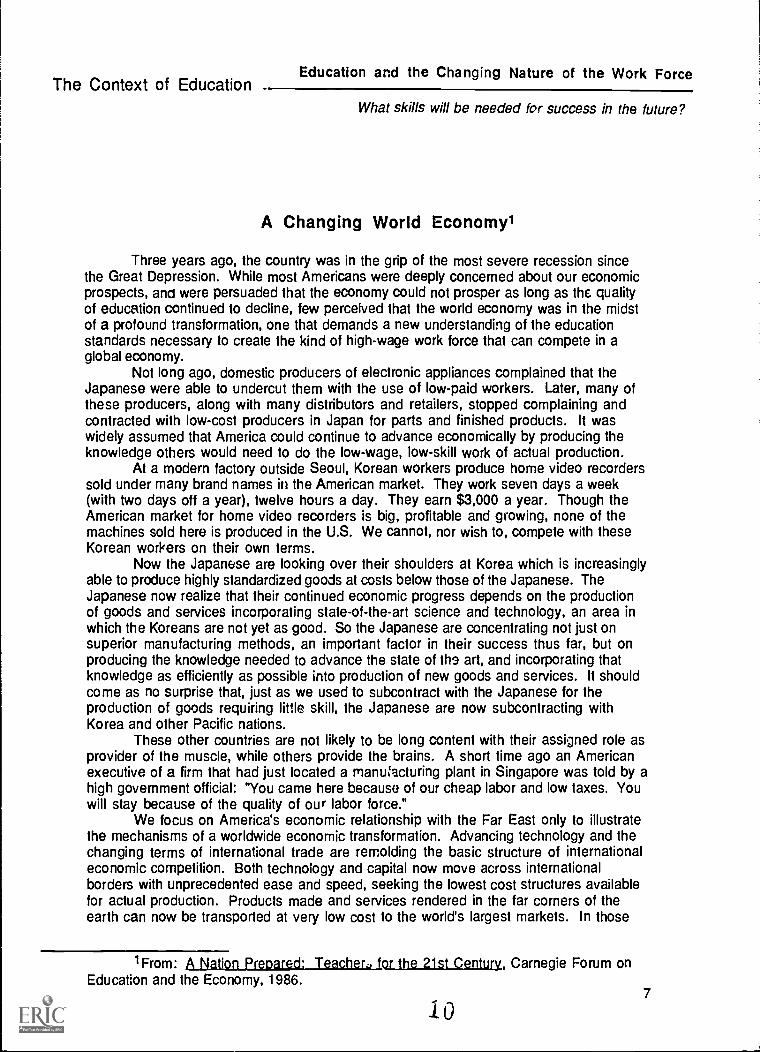
A Changing World Economy1
Three years ago, the country was in the grip of the most severe recession sincethe Great Depression. While most Americans were deeply concerned about our economicprospects, and were persuaded that the economy could not prosper as long as the qualityof education continued to decline, few perceived that the world economy was in the midstof a profound transformation, one that demands a new understanding of the educationstandards necessary to create the kind of high-wage work force that can compete in aglobal economy.
Not long ago, domestic producers of electronic appliances complained that theJapanese were able to undercut them with the use of low-paid workers. Later, many ofthese producers, along with many distributors and retailers, stopped complaining andcontracted with low-cost producers in Japan for parts and finished products. It waswidely assumed that America could continue to advance economically by producing theknowledge others would need to do the low-wage, low-skill work of actual production.
At a modern factory outside Seoul, Korean workers produce home video recorderssold under many brand names in the American market. They work seven days a week(with two days off a year), twelve hours a day. They earn $3,000 a year. Though theAmerican market for home video recorders is big, profitable and growing, none of themachines sold here is produced in the U.S. We cannot, nor wish to, compete with theseKorean workers on their own terms.
Now the Japanese are looking over their shoulders at Korea which is increasinglyable to produce highly standardized goods at costs below those of the Japanese. TheJapanese now realize that their continued economic progress depends on the productionof goods and services incorporating state-of-the-art science and technology, an area inwhich the Koreans are not yet as good. So the Japanese are concentrating not just onsuperior manufacturing methods, an important factor in their success thus far, but onproducing the knowledge needed to advance the state of the art, and incorporating thatknowledge as efficiently as possible into production of new goods and services. It shouldcome as no surprise that, just as we used to subcontract with the Japanese for theproduction of goods requiring little skill, the Japanese are now subcontracting withKorea and other Pacific nations.
These other countries are not likely to be long content with their assigned role asprovider of the muscle, while others provide the brains. A short time ago an Americanexecutive of a firm that had just located a manufacturing plant in Singapore was told by ahigh government official: "You came here because of our cheap labor and low taxes. Youwill stay because of the quality of our labor force."
We focus on America's economic relationship with the Far East only to illustratethe mechanisms of a worldwide economic transformation. Advancing technology and thechanging terms of international trade are remolding the basic structure of internationaleconomic competition. Both technology and capital now move across internationalborders with unprecedented ease and speed, seeking the lowest cost structures availablefor actual production. Products made and services rendered in the far corners of theearth can now be transported at very low cost to the world's largest markets. In those
1From: A Nation Prepared: Teacher,, for the 21st Century., Carnegie Forum onEducation and the Economy, 1986.
7
10
Education and the Changing Nature of the Work Force
What skills will be needed for success in the future?The Context of Education
cases in which products and services can be produced by people with low skills who arewilling to work hard for relatively low wages, the technology and capital will move totheir doorstep. By low skills, we mean here the "basic skills" of minimum competencewith written words and numbers, skills now possessed by many peoples of the world.
These developments challenge the most basic premises of the American economicsystem. This country developed the world's most productive economy in part by massproduction techniques that made it possible to employ workers with modest skills to turnout high quality, inexpensive products in great volume. The economic benefits werepassed on to workers in the form of rising wages, which they used to create a steadilyexpanding market for the goods and services they produced.
The key was the machinery. Very expensive machines were design,- so as toreduce to a minimum the skills needed to operate them. Many skilled crattworkers wererequired, of course, but most jobs could be performed by unskilled and semi-skilledworkers. The cost of the machines could be justified on the basis of the enormous marketfor the goods they produced, so the cost for each finished unit was very low. This isprecisely the area in which we are today being beaten, because the same machinery isnow available to others who are willing to work much longer hours than we are, at muchlower wages, and markets are no longer national but worldwide. These new basicindustry and mass production workers, like the turn-of-the century Americanimmigrant, are willing to work very hard because they see an opportunity to betterthemselves and the lives of their children.
If America wants to compete on the same terms as it did in the past--making themost of the workers with low skill levels--then it must accept prevailing wage levelsfor low-skilled and semi-skilled labor. That is, we must be papered for a massivedecline in our standard of living. The alternative is to revise our view of the role of theworker in the economy. In the future, high-wage level societies will be those whoseeconomies are based on the use on a wide scaie of very highly skilled workers, backed upby the most advanced technologies weilable.
Some of America's premier firms operate on precisely such principles. Therewill always be enough highly educated people to meet their needs. But a handful of firmscannot sustain the American standard of living. If it is to be sustained, most of Americanbusiness will have to emulate them, and their ability to do so will depend in part on avast upgrading of the American work force.
While it is easy to move capital and technology, it is exceedingly difficult tocreate and sustain the conditions under which vary large numbers of people become andremaih well educated. When they are well educated, they more than pay for their highsalaries by adding more to the value of the products they create and the services theyoffer than less skilled workers can possibly match. Investment in people requires fargreater lead time than investment in machinery. Countries that fail to invest enough, orin time, will find the costs--sluggish productivity growth, joblessness, and decliningreal income--very high.
Concern over the quality of education in this country has been expressed inrepeated warnings from the Education Commission of the States' Task Force on Educationand Economic Growth, the President's Commission on Industrial Competitiveness, theNational Alliance of Business and others. Yet we believe most Americans still do notfully understand the gravity of the situation just described. Much of the rhetoric of therecent education reform movement has been couched in the language of decline,suggesting that standards have slipped, that the education system has grown lax and needsto return to some earlier performance standard to succeed. Our view is very different.We do not believe the educational system needs repairing; we believe it must be rebuiltto match the drastic change needed in our economy if we are to prepare our children for
8 11
Education and the Changing Nature of the Work ForceThe Context of Education
What skills will be needed for success in the future?
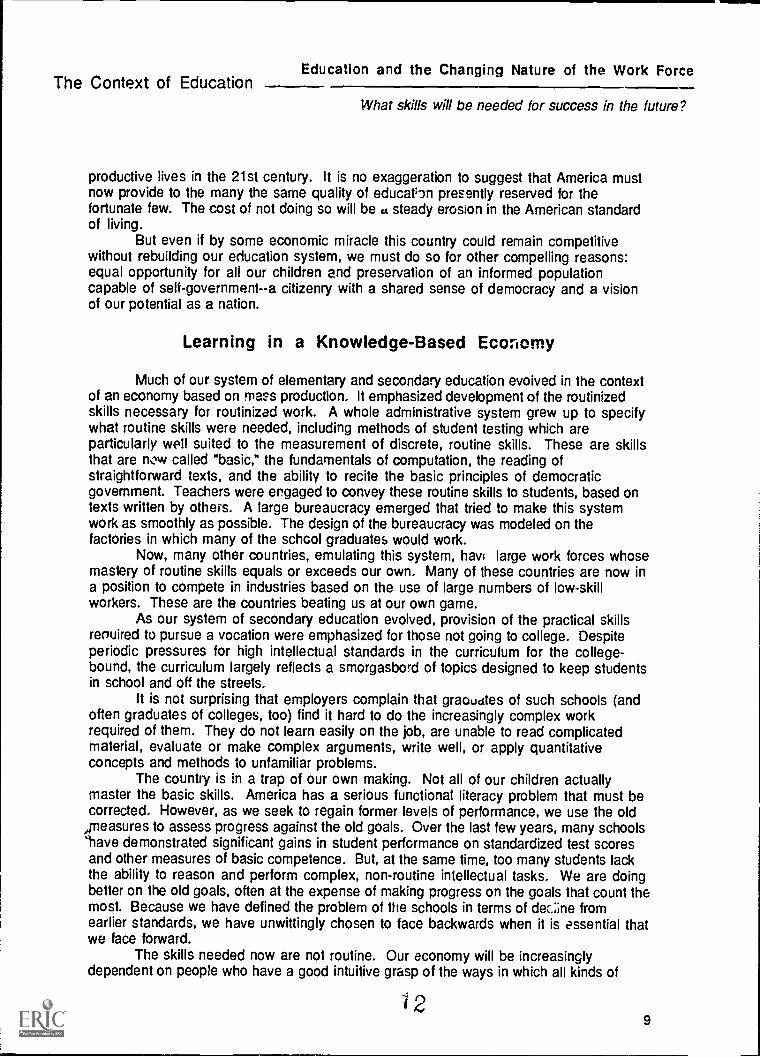
productive lives in the 21st century. It is no exaggeration to suggest that America mustnow provide to the many the same quality of education presently reserved for thefortunate few. The cost of not doing so will be u steady erosion in the American standardof living.
But even if by some economic miracle this country could remain competitivewithout rebuilding our education system, we must do so for other compelling reasons:equal opportunity for all our children and preservation of an informed populationcapable of self - government - -a citizenry with a shared sense of democracy and a visionof our potential as a nation.
Learning in a Knowledge-Based Economy
Much of our system of elementary and secondary education evoived in the contextof an economy based on mass production. It emphasized development of the routinizedskills necessary for routinized work. A whole administrative system grew up to specifywhat routine skills were needed, including methods of student testing which areparticularly well suited to the measurement of discrete, routine skills. These are skillsthat are rww called "basic," the fundamentals of computation, the reading ofstraightforward texts, and the ability to recite the basic principles of democraticgovernment. Teachers were engaged to convey these routine skills to students, based ontexts written by others. A large bureaucracy emerged that tried to make this systemwork as smoothly as possible. The design of the bureaucracy was modeled on thefactories in which many of the school graduates would work.
Now, many other countries, emulating this system, have large work forces whosemastery of routine skills equals or exceeds our own. Many of these countries are now ina position to compete in industries based on the use of large numbers of low-skillworkers. These are the countries beating us at our own game.
As our system of secondary education evolved, provision of the practical skillsreouired to pursue a vocation were emphasized for those not going to college. Despiteperiodic pressures for high intellectual standards in the curriculum for the college-bound, the curriculum largely reflects a smorgasbord of topics designed to keep studentsin school and off the streets.
It is not surprising that employers complain that graoudtes of such schools (andoften graduates of colleges, too) find it hard to do the increasingly complex workrequired of them. They do not learn easily on the job, are unable to read complicatedmaterial, evaluate or make complex arguments, write well, or apply quantitativeconcepts and methods to unfamiliar problems.
The country is in a trap of our own making. Not all of our children actuallymaster the basic skills. America has a serious functional literacy problem that must becorrected. However, as we seek to regain former levels of performance, we use the old
?measures to assess progress against the old goals. Over the last few years, many schools`have demonstrated significant gains in student performance on standardized test scoresand other measures of basic competence. But, at the same time, too many students lackthe ability to reason and perform complex, non-routine intellectual tasks. We are doingbetter on the old goals, often at the expense of making progress on the goals that count themost. Because we have defined the problem of the schools in terms of dec;ine fromearlier standards, we have unwittingly chosen to face backwards when it is essential thatwe face forward.
The skills needed now are not routine. Our economy will be increasinglydependent on people who have a good intuitive grasp of the ways in which all kinds of
129
Education and the Changing Nature of the Work Force
What skills will be needed for success in the future?
The Context of Education
physical and social systems work. They must possess a feeling for mathematicalconcepts and the ways in which they can be applied to difficult problems, an ability tosee patterns of meaning where others see only confusion; a cultivated creativity thatleads them to new problems, new products and new services before their competitors getto them; and, in many cases, the ability to work with other people in complexorganizational environments where work groups must decide for themselves how to getthe job done.
Such people will have I le need and the ability to learn all the time, as theknowledge required to do their work twists and turns with new challenges and theprogress of science and technology. They will not come to the workplace knowing all theyhave to know, but knowing how to figure out what they need to know, where to get it, andhow to make meaning out of it. Even more important, if this country is to remain true toitself, our children should grow up to be humane and caring people, imbued with a set ofvalues that enables them to use their skills in the service of the highest goals of thelarger society.
They will, of course, have to have a basic stock of facts and know how to carry outbasic procedures, but it will be essential for them to understand how those facts werederived and why those procedures work. They will spend a lifetime deciding which factsare relevant and which procedures will work for a constantly changing array ofproblems.
It is important to be clear on one point. A knowledge-based economy in whichlearning and real intellectual effort are not highly valued is a contradiction in terms.Visitors to Japan and other newly successful countries on the racific rim report anomnivorous desire for knowledge, a regard for learning, and a belief that effort devotedto education will be rewarded. Some observers of the economic scene believe that thesequalities account for Japan's economic success as much or more than others that aremuch more widely offered. The same qualities can be observed in many recent Asianimmigrants to this country whose disproportionate success in our schools is a matter ofrecord. The European tradition of intellectual rigor in the schools also persists. In ourcountry, by contrast, real intellectual effort in schools is not often demanded by parentsand is generally frowned upon by students' peers.
Success, then depends on the whole society coming to place a much higher valuenot just on schooling but on learning. This demands a redefinition of the purposes ofschooling, one that goes way beyond the inculcation of routine skills and the acquisitionof a stock of facts. An economy based on people who think for a living requires schoolsdedicated to the creation of environments in which students become very adept atthinking for themselves, places where they master the art of learning and acquire astrong taste for it.
Our argument, then, is simple. If our standard of living is to be maintained, ifthe growth of a permanent underclass is to be averted, if democracy is to functioneffectively into the next century, our schools must graduate the vast majority of theirstudents with achievement levels long thought possible for only the privileged few. TheAmerican mass education system, designed in the early part of the century for a mass-production economy, will not succeed unless it not only raises but redefines the essentialstandards of excellence and strives to make quality and equality of opportunitycompatible with each other.
10 13
Education and the Changing Nature of the Work ForceThe Context of Education
What skills will be needed for success in the future?
Employability: Student Needs, Business Needs2
Our public education system has two vital functions to perform. First, it shouldprepare youngsters to become responsible citizens who can make informed decisions onessential personal and public issues. Second, it should impart to students those skillsand attributes that will enable them to succeed in productive employment or in thepursuit of higher education.
In these goals, the interests of business and E lucation converge dramatically.Students need to be able to qualify for good jobs when the are ready to seek them;business needs broadly educated employees who have learned how to learn and who canadapt to the changing conditions of the workplace.
What Students Need to be Employable. At one time, employers were fairlyconfident that a high school diploma meant a potential employee had acquired skills,knowledge, and behavior that would be useful in the workplace. Because of the decline ineducational performance and discipline in recent decades, business can no longer assumethat young people graduate from school adequately prepared to read, write, reason,calculate, communicate, or accept responsibility. Many large corporations have found itnecessary to inculcate skills and behavior patterns not already developed in school.
Mastery of the old basics of reading, writing, and arithmetic may be sufficientfor entry-level jobs, but because of the constantly changing nature of work, minimumskills are not sufficient preparation for career advancement. Schools must make agreater effort to develop higher-level skills, such as problem solving, reasoning, andlearning ability. These are also the same attributes that are critical to success in highereducation.
In 1983 and 1984, this Committee conducted an in-depth assessment of theemployment needs of industry in order to gauge the gap between expectation and realityon the part of personnel officers and managers of both large and small firms. Theresults of this survey confirm what has long been suspected by the business community:Specific occupational skills are less crucial for entry-level employment than agenerally high level of literacy, responsible attitudes toward work, 'he ability tocommunicate well, and the ability to continue to learn.
The survey's findings convey three strong messages:First, for entry-level positions, employers are looking for young people whodemonstrate a set of attitudes, abilities, and behaviors associated with a sense ofresponsibility, self-discipline, pride, teamwork, and enthusiasm.Second, employers put a strong value on learning ability and problem-solvingskills. [Learning how to learn was rankea by both large and small companies asthe most important attribute for getting ahead.]Third, employers do not think that the schools are doing a good job of developingthese much-needed abilities.
2From: Investing in Our Children, Committee for Economic Development, 1985.
1 411
Education and the Changing Nature of the Work Force
How is Oregon's occupational structure changing?
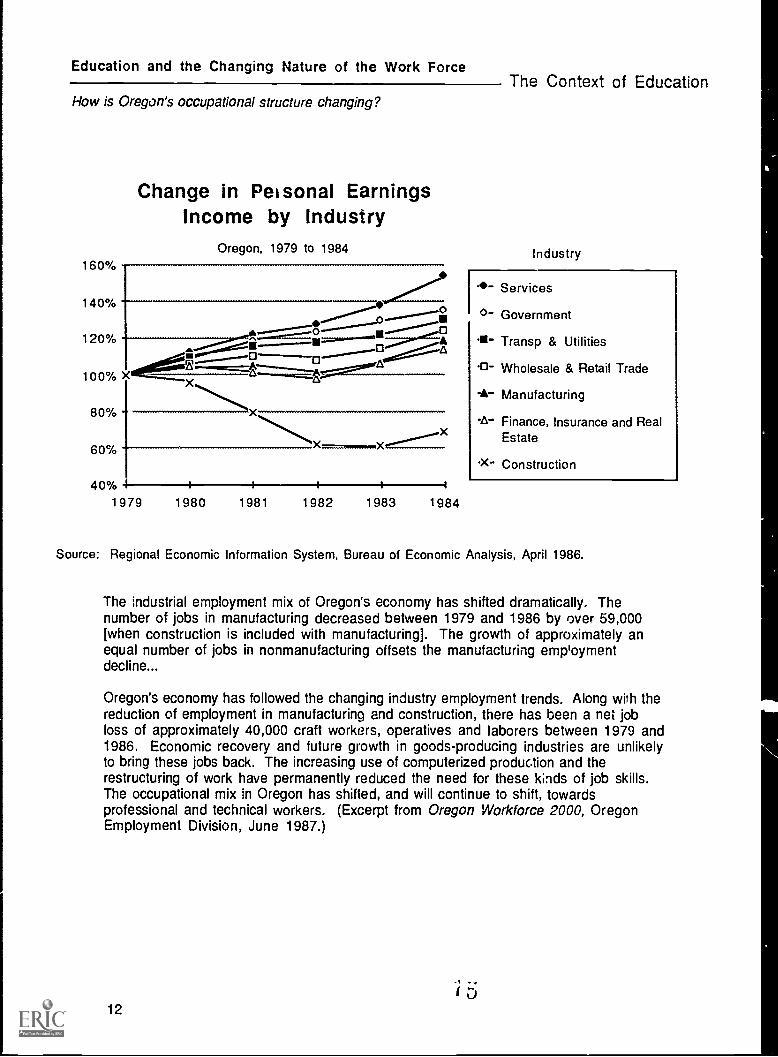
Change in Pei sonal EarningsIncome by Industry
Oregon, 1979 to 1984160%
140%
120%
100% X101111-1A
---
80% I
60%
40%1979 1980 1981 1982 1983 1984
The Context of Education
Industry
0-
Services
Government
1- Transp & Utilities
- Wholesale & Retail Trade
-A- Manufacturing
-a- Finance, Insurance and RealEstate
Construction
Source: Regional Economic Information System, Bureau of Economic Analysis, April 1986.
The industrial employment mix of Oregon's economy has shifted dramatically. Thenumber of jobs in manufacturing decreased between 1979 and 1986 by over 59,000[when construction is included with manufacturing]. The growth of approximately anequal number of jobs in nonmanufacturing offsets the manufacturing emp'oymentdecline...
Oregon's economy has followed the changing industry employment trends. Along with thereduction of employment in manufacturing and construction, there has been a net jobloss of approximately 40,000 craft workers, operatives and laborers between 1979 and1986. Economic recovery and future growth in goods-producing industries are unlikelyto bring these jobs back. The increasing use of computerized production and therestructuring of work have permanently reduced the need for these kinds of job skills.The occupational mix in Oregon has shifted, and will continue to shift, towardsprofessional and technical workers. (Excerpt from Oregon Workforce 2000, OregonEmployment Division, June 1987.)
12
The Context of EducationEducation and the Changing Nature of the Work )rce
How is Oregon's occupational structure changing'
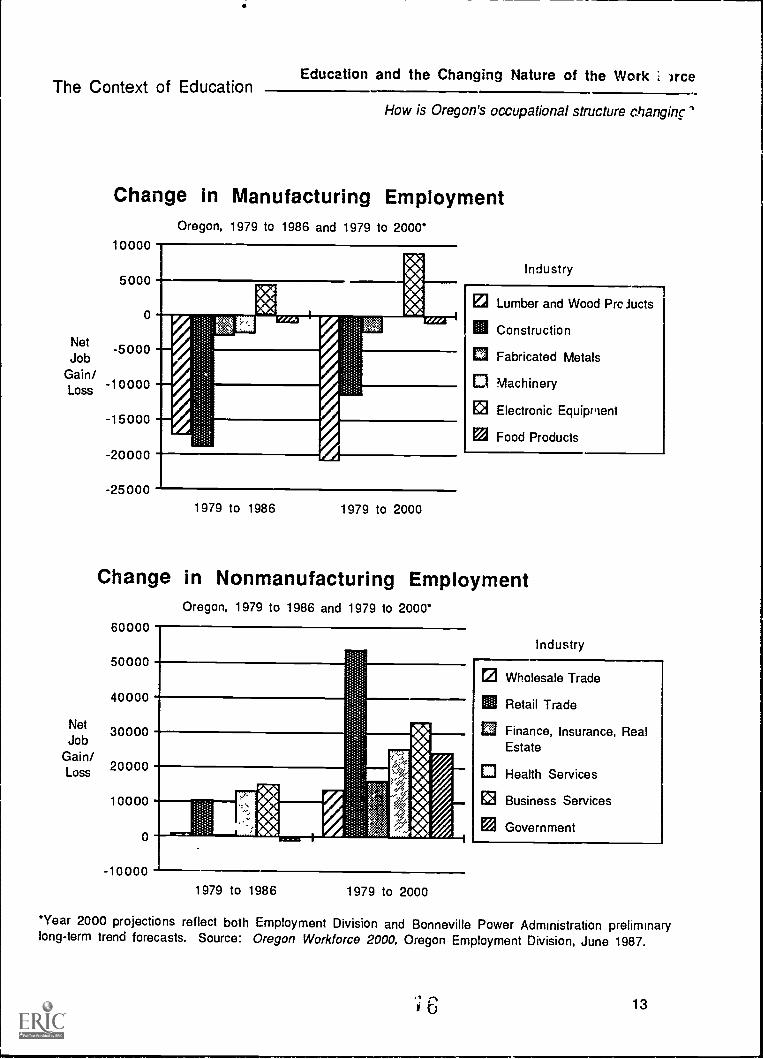
Change in Manufacturing EmploymentOregon, 1979 to 1986 and 1979 to 2000*
10000
5000
0
Net -5000Job
Gain/Loss -10000
NetJob
Gain/Loss
-15000
-20000
-25000
E2 Lumber and Wood Prciucts
M Construction
Fabricated Metals
0 Machinery
Electronic Equipment
El Food Products
1979 to 1986 1979 to 2000
Change in Nonmanufacturing EmploymentOregon, 1979 to 1986 and 1979 to 2000*
60000
50000
40000
30000
20000
10000
0
-100001979 to 1986 1979 to 2000
Industry
l2 Wholesale Trade
M Retail Trade
O Finance, Insurance, RealEstate
Health Services
Business Services
El Government
*year 2000 projections reflect both Employment Division and Bonneville Power Administration preliminarylong-term trend forecasts. Source: Oregon Workforce 2000, Oregon Employment Division, June 1987.
13
Education and the Changing Nature of the Work Force
How is Oregon's occupational structure changing?
17%
16%
15%
14%
13%
12%
110/0
1 0%
9%
8%
1960
The Context of Education
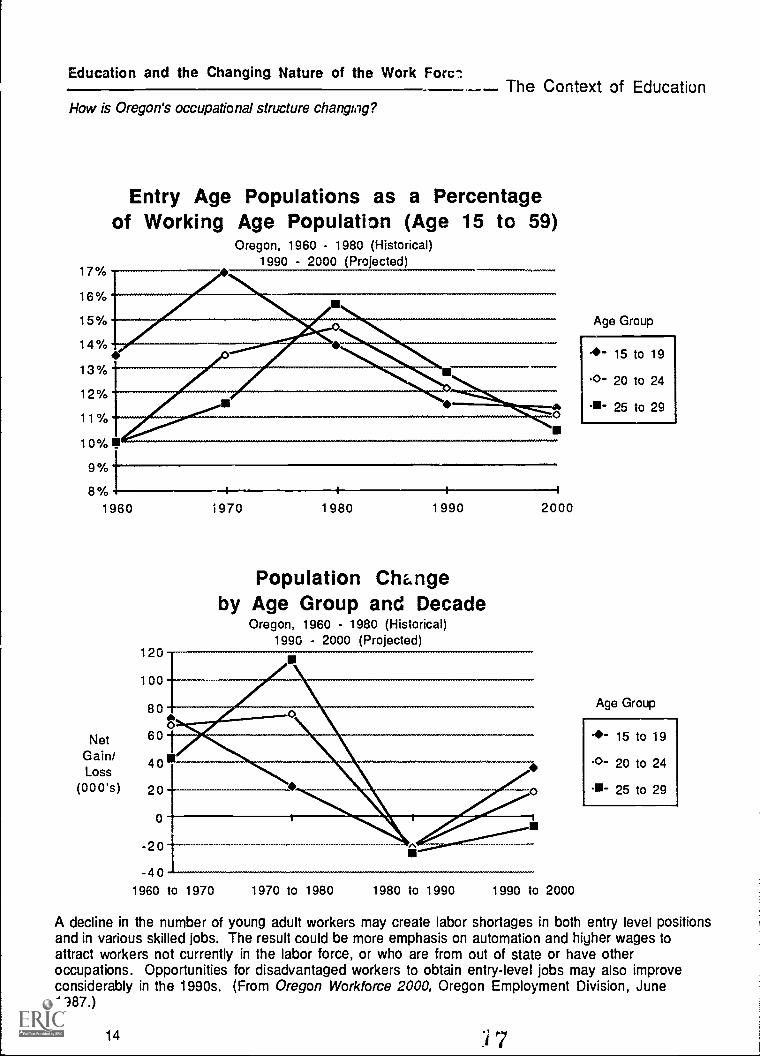
Entry Age Populations as a Percentageof Working Age Population (Age 15 to 59)
A decline in the number of young adult workers may create labor shortages in both entry level positionsand in various skilled jobs. The result could be more emphasis on automation and higher wages toattract workers not currently in the labor force, or who are from out of state or have otheroccupations. Opportunities for disadvantaged workers to obtain entry-level jobs may also improveconsiderably in the 1990s. (From Oregon Workforce 2000, Oregon Employment Division, June1987.)
14 :17
The Context of Education
PercentUnemployed
25%
20%
Education and the Changing Nature of the Work Force
How is Oregon's occupational structure changing?
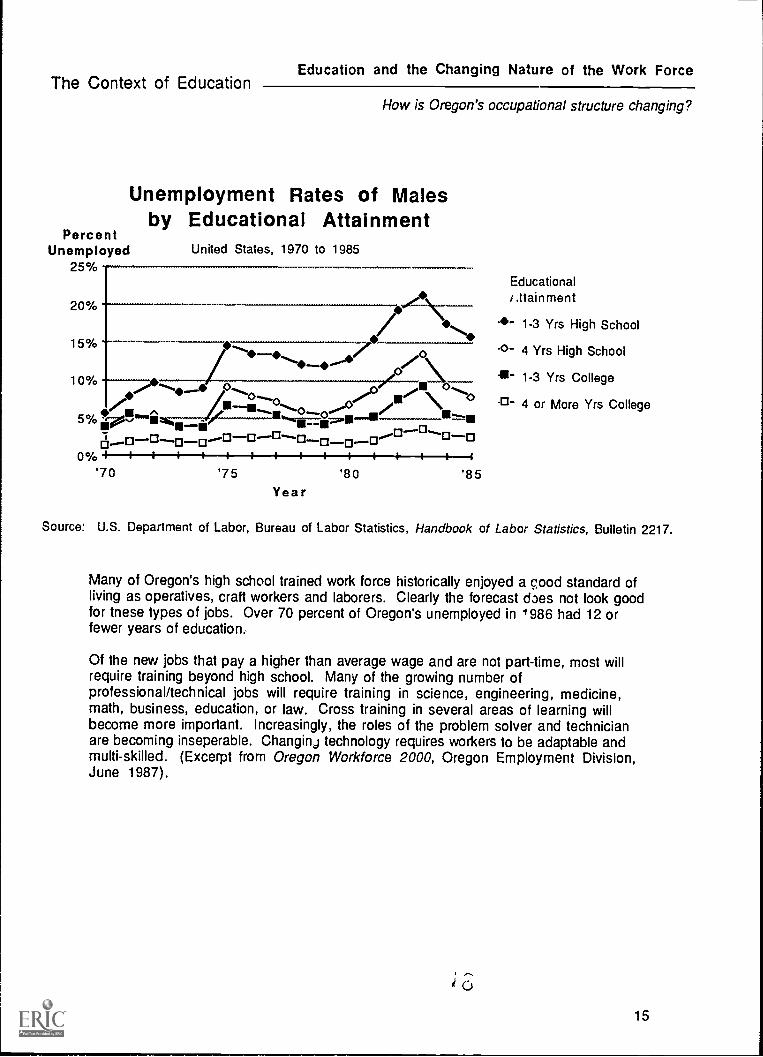
Unemployment Rates of Malesby Educational Attainment
Source: U.S. Department of Labor, Bureau of Labor Statistics, Handbook of Labor Statistics, Bulletin 2217.
Many of Oregon's high school trained work force historically enjoyed a good standard ofliving as operatives, craft workers and laborers. Clearly the forecast does not look goodfor tnese types of jobs. Over 70 percent of Oregon's unemployed in 1986 had 12 orfewer years of education.
Of the new jobs that pay a higher than average wage and are not part-time, most willrequire training beyond high school. Many of the growing number ofprofessional/technical jobs will require training in science, engineering, medicine,math, business, education, or law. Cross training in several areas of learning willbecome more important. Increasingly, the roles of the problem solver and technicianare becoming inseperable. Changinj technology requires workers to be adaptable andmulti-skilled. (Excerpt from Oregon Workforce 2000, Oregon Employment Division,June 1987).
0
15
Demographic and Social Trends
How many students are at risk of educational failure?
Reconnecting Youth
The Problem1
The Context of Education
The problem, simply stated, is this: a growing proportion of our young peopleare not making successful transitions to productive adult lives. They are paying a heavyprice. We, as a society, are paying a heavy price. In the years ahead, the costs are goingto get higher.
In 1978, young adults constituted 23 percent of the U.S. population. By 1995,they will constitute 16 percent, shrinking by one-quarter the size of the entry-levellabor pool. Within that shrinking labor pool is a growing pool of "at-risk" young menand women: people in their teens and early twenties who could become productivecitizens but most likely will not unless something out of the ordinary happens. Theyhave the intelligence to succeed, but they lack important skills, family support,discipline and the motivation to make it. An unconscionably disproportionate number ofthem are poor, Black and Hispanic youth.
A decade ago, many businesses could affort to ignore these young people. They canno longer do so. Business and industry already spend $40 billion annually to trainemployees. The employees of the late eighties will be even more expensive to train.Increasingly, the private sector will find itself teaching them remedial reading, writingand mathematics. By 1990, education and training in the .blic and private sectors mayconstitute the largest industry in America.
Our choices are clear. We can do nothing to reduce the numbers of youthdisconnecting from school, work and the values and benefits they confer. We can hopethe problem will go away with an improved economy or some kind of technologicalrevolution. We can believe that this problem is peculiar to certain cities and does notaffect the health of the nation. We can say it is "the schools"' responsibility or "thegovernments" responsibility or someone else's cause. We can say that the problems ofyouth who are truly at risk defy solution.
It would be wiser, and far less costly, to act now. A number of factors suggestthat the time is ripe:
Successful public, private and collaborative programs for turning thoseyoung people around exist. Some unmotivated youth are being motivated.Some unskilled youth are being trained. Some disconnected adolescents arebeing reconnected to the va'ues and vehicles most likely to guarantee aproductive life. We know it can be done.Educational reform is well under way in every state. This momentum forchange can be used to move reform into a more comprehensive phase in whichthe problems of at-risk youth can be more directly addressed.Business and industry are restructuring in response to a profoundtransformation in the world economy. We have learned much about how to get"extraordinary performance out of ordinary people" and how to revitalize
1Excerpt from: Reconnecting Youth: The Next Stage of Reform, Business AdvisoryCommission, Education Commission of the States, October 1985.
16 i9
The Context of EducationDemographic and Social Trends
How many students are at risk of educational failure?
faltering institutions. That "how-to" can be shared with the schools andbrought to bear on youth problems.Interest in public service for youth is high and growing. State, local andnational service opportunities hold great potential for harnessing theenergies of young people, developing their confidence and skills, and buildingbridges to their further education and steady employment.New institutional forms, combining public and private interests, are beingdeveloped. The current collaborative environment is ideal for addressingcomplex, multi-sector problems.
Who Is At Risk?
At-risk youth are young people who face uncertain futures as workers andcitizens. At stake is whether they will move into productive adult lives or fall intopatterns of chronic failure that deepen their alienation and dependency upon the welfaresystem.
Three categories of youth are of major concern:The alienated. These young people are uninterested or dissatisfied with thevalues represented by school and work. They lack motivation to succeed inexpected ways, they have poor school and work attendance records, and do notperform near their potential. Some are passive, others are defiant.Economic resources are not at issue. most alienated students come from themiddle classes. Nor is alienation an urban problem; alienated students areeverywhere.The disadvantaged and alienated. These young people exhibit all thesymptoms of alienation but have, in addition, problems associated with beingeconomically disadvantaged. A disproportionate share of these young peopleare minorities, a fact that complicates their problems and community effortsto help them in school or the workplace. Most of them lack basic social andacademic skills. Most lack family support, useful networks and self-esteem.All could make strong contributions to their communities and lead productiveadult lives if they got the right help at the right time.The disadvantaged. These young people have family support andmotivation to succeed, but they suffer from various effects of economicdeprivation and racial discrimination. Although they are not yet alienated,they are at risk of becoming so and at risk of never moving into satisfying,long-term employment.
Many alienated and disadvantaged/alienated students run away from home or dropout of school or fail to keep jobs or commit various minor crimes. However, theirnumbers are not the same as numbers of runaways, dropouts, unemployed or teenageoffenders. No official statistics exist for them. It is not unreasonable, however, tobelieve that all three of the groups above constitute 10 to 15 percent of the 16- to 19-year -old age group, nationally. In major cities, it is not unreasonable to extimate thathalf the high school population is at risk. We are talking about, by conservativeestimate, 1,250,000 White, 750,000 Black and 375,000 Hispanic 16- to 19-year-olds at risk. Addressing this issue, then, is not a matter of social responsibility alone.It is an urgent task central to the country's further economic and social developmeni.
20 17
Demographic and Social Trends
How many students are at risk of educational failure?
Disconnecting From School
The Context of Education
About 700,000 students dropped out of school last year and another 300,000were chronic truants. In cities such as New York, Philadelphia and Chicago, the dropoutrate is over 40 percent.
Rates are much higher for minorities and the poor. Students in the bottom thirdof the socioeconomic ladder have three to four times the dropout rate of those fromaffluent families. Black and Hispanic rates are one and one-half to two times higher thanWhite students.
The problem is not just a minority problem or an urban problem; it iswidespread. Since 1970 the dropout rate for Blacks has actually decreased nationally,while the rate for White students has edged up. In rural and suburban schools, dropoutrates have either risen or stubbornly resisted efforts to lower them since 1965. Evenif the rates for all groups were to stabilize, the situation would be worse than it used tobe our standards for schools and students are getting higher. The bottom rung of the"ladder of success" may be moving out of some students' reach.
Not all dropouts and "occasional" students are at-risk young people. Within twoyears of leaving school, about a quarter of them enter various training programs. About14 percent of the males and 9 percent of the females enter the GED program leading to ahigh school equivalency certificate. Others will "find themselves" in various ways.Most, however, will drift along in a limbo that involves neither school nor promisingwork.
Two-thirds of the students we are concerned about drop out because they havegiven up on the school as a vehicle for their success. They do not believe it will work forthem because it hasn't worked for them all their lives. They do not have the desire, hopeand motivation that schools ter.d to reward. Schools are for someone else. Indisconnecting from school, these teens disconnect from the values and ideals the schoolsembody and promote. To use a phrase that became the title of the Carnegie Council onChildren's final report, these young men and women see "small futures" for themselves.
Experienced teach 3 and administrators can predict which students will mostlikely drop out even when the students are in the primary grades. They can identifyalienated students, whether they drop out or continue to attend school fitfully andprofitlessly. Disconnection is not a tragedy because it happens; it is a tragedy becausemany people saw it coming for years and did nothing about it.
Ironically, some of the recent reco..imendations for improving schools will nottouch the at-risk students or will affect them adversely. As emphasis on individualacademic achievement rises, low achievers are likely to throw in the towel. As standardsfor athletic participation go up, other low achievers, who have stayed in for the self-esteem and recognition they get from sports, will drop by the wayside. We favor higherstandards. We think at-risk students can meet them with the right kind of help. But,unless schools can take special measures to keep "on-the-edge" students from goingover the edge, we can expect dropout rates to rise.
18
The Context of EducationDemographic and Social Trends
How many students are at risk of educational failure?
Broader Disconnections
Dropping out and unemployment present real and urgent problems in themselves.But they are also symptoms of underlying problems with the nation's integrativesysterds. Other symptoms also suggest that traditional American ways of integratinggenerations and ethnic groups into the mainstream are under stress:
Teenage pregnancy and childbirth rates have grown for all teens, regardlessof ethnicity and socioeconomic status. More than one million teens becomepregnant each year. Most of these teenagers do not marry.Arrests of people under 18 for drug abuse increased 60-fold between 960and 1980. Arrestc for drunkenness among high school seniors rose by 300percent between 1960 and 1980.Young people under age 21 account for more than half of all arrests for.mious crimes. In 1960, 18- to 24-year-olds accounted for only 18percent of all arrests; by 1980, they accounted for 34 percent.
homicide rate for ran -White teens increased 16 percent between 1950acid 1978, while the rate for Whites increased an astounding 232 percent.Death by suicide among teenagers increased for all groups. The suicide ratefor Whites rose 177 percent between 1950 and 1978, while the rate amongnen-Whites rona 162 percent. A teenager commits suicide every 90minute s.
Increases in youth suicide, crime, drug use and pregnancy are independentphenomena with their own origins. No one would suggest that a single causal mechanismunderlies them, but these are all signs of alienation and disconnection. All suggest thatfamily, community, school and other agencies of socialization and integration are notworking as thoy once were
Ceital.ily, there is idence that the American family is changing. In 1970, 85percent of children under 18 years of age lived with two parents; today, the proportionis just under 77, Percent. The proportion of single-parent families has just aboutdoubled sine. 1970, rising from 13 percent to 26 percent. Most Black children do notlive in two-parent homes: 49 percent live with one parent and 8 percent live withneither parent. A third of Hispanic children live with one parent.
We do not know all of the consequences of growing up in single-parent families.However, research does confirm that various indicators of disconnection, such asdropping out, truancy, delinquency and poor academic performance, are linked to familyeducation support variables. We know that the number of parents in the home and thework status of the mother have significant effects on student achievement?Encouragement by parents to spend more time reading and doing homework, theiravailability to attend in-suitool programs, extracurricular activities and parent-
2Ann Milne, David Myers, Alvin Rosenthal and Alan Ginsburg, "Single Parents, WorkingMothers and the Educational Achievement of School Children," Revised version of twopapers presented at the Annual Meeting of the American Educational ResearchAssociation, April 1985.
19
Demographic and Social Trends
How many students are at risk of educational failure?
The Context of Education
teacher conferences are critical. We know that single parents have less time to spendwith their children than is the case in families where both parents are present.3
Recent trends in adolesc "nt pregnancy and parenthood are of particular concern.The birth rate of unmarried teenagers increased by 29 percent between 1970 and 1982.When coupled with the increasing tendency for teenagers to raise their own children, theresult is an increasing number of single teenage parents. Last year, unwed teens gavebirth to 650,000 babies. Many of these young mothers do not return to school. Teenparents who drop out place their children at risk.
Reconnecting Our Youth
We have examined a serious problem. Too many of our young people are notmaking a successful transition to productive adult life and education reform, ascurrently structured, is not likely to correct this. Many youth are not well served bythe traditional education structure. Others find the transition into the world of workexceedingly difficult. We are concerned because youth are the key to this country'seconomic prosperity and social development. Students who drop out and lack skills foremployment are more often unemployed that others. They have higher crime anddelinquency rates. They pay little in taxes and appear more often on welfare rolls. Forcorporate America, and for state and local governments, they represent a $20 billion-a-year loss.
3Frank Howell and William Frase, "Early Transition into Adult Roles: Some Antecedentsand Outcomes," American Educational Research Journal, Vol. 19, 1982. For a review ofthe literature, see E. M. Hetherington, et al., "Cognitive Performance, School Behaviorand Achievement of Children From One-Parent Households," Report prepared for theFamilies as Educators Team (National Institute of Education, 1981).
20
The Context of Education Demographic and Social Trends
How many students are at risk of educational failure?
Percentage of Children I lnder Poverty LevelOregon, 1969 and 1979
United States, 1969, 1979 and 198522
20
18
16
14
12
10
8
6
4
2
0
mbd-m mom.raw, MEN=1 =MS
III IIA1969 1979 1985
la Under 18 (OR)Under 6 (OR)
-61- Under 18 (US)
F -m 1969 to 1979, the percentage of Oregon children under 6 years old,....)verty increased from 12.5 to 15.2 percent, a relative growth of
22 percent.
For children under age 18, Oregon's percentage in poverty increased from10.9 to 12.0 percent, paralleling the growth of the U.S. percentage duringthe 1970s. The increasing national percentage of children under the povertylevel suggests that Oregon's rate has continued to increase during the 1980s.
The official poverty measure judges members of a family to be poor if thefamily has a cash income (counted before taxes are subtracted) that is lessthan three times the cost of a nutritionally adequate but minimum diet, andindexed to reflect price increases. In 1983, the official poverty thresholdfor a family of four was roughly $10,000.
Source: U.S. Department of Commerce, Bureau of the Census.
Demographic and Social TrendsThe Context of Education
How many students are at risk of educational failure?
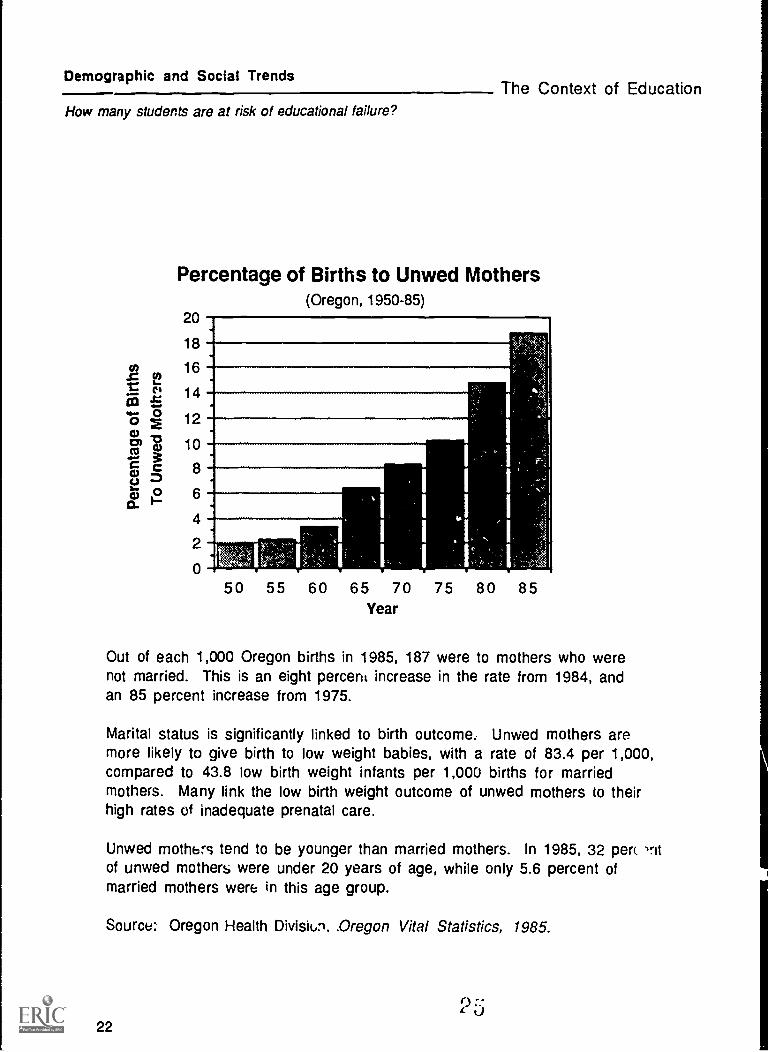
Percentage of Births to Unwed Mothers(Oregon, 1950-85)
Out of each 1,000 Oregon births in 1985, 187 were to mothers who werenot married. This is an eight percent increase in the rate from 1984, andan 85 percent increase from 1975.
Marital status is significantly linked to birth outcome. Unwed mothers aremore likely to give birth to low weight babies, with a rate of 83.4 per 1,000,compared to 43.8 low birth weight infants per 1,000 births for marriedmothers. Many link the low birth weight outcome of unwed mothers to theirhigh rates of inadequate prenatal care.
Unwed mothers tend to be younger than married mothers. In 1985, 32 per antof unwed mothers were under 20 years of age, while only 5.6 percent ofmarried mothers were in this age group.
Source: Oregon Health Division, .Oregon Vital Statistics, 1985.
22
The Context of Education
Drug
Inhalants
Pep Pills
Diet Pills
Amphetamines
Cocaine
Marijuana
Alcohol
Demographic and Social Trends
How many students are at risk of educational failure?
Percentage of Youth Using DrugsWithin the Preceding 30 Days
(Oregon, Fall 1985)
//1
10 20 30 40 50 60 70
Percentage of StudentsIn a 1985 survey of drug use by Oregon public school students(grades 8 and 11), alcohol was the most widely used drug on amonthly basis--38 percent of 8th graders and 60 percent of 11thgraders reported using alcol...' within the preceding 30 days.
Grade Level
[21 11th GradersEl 8th Graders
Marijuana was used within the preceding 30 days by 12 percent ofthe 8th graders and 29 percent of the 11th graders.
Cocaine was used within the preceding 30 days by 3 percent of the8th graders and 9 percent of the 11th graders.
Comparisons with national data on drug use by high school seniorsindicate that Oregon 11th graders have higher rates of monthly usefor marijuana (29% OR vs. 26% US), cocaine (9% OR vs. 7% US),and inhalants (4.7% OR vs. 3% US). The monthly use of alcohol islower in Oregon than nationwide (60% OR vs. 66% US).
Sourc3: Oregv' Office of Alcohol and Drug Abuse Programs, Drug Useby Oregon Public School Students, 1985 (Preliminary Report).
PG23
Demographic and Social Trends
How many students are at risk of educational failure?
24
100
80
60
40
20
0
The Context of Education
Percentage of Children Under 18Living With Two Parents
(Oregon and United States, 1960 to 1985)
1960 1970 1980 1985
0 OregonIMI U. S.
*(Oregon data notavailable for 1985)
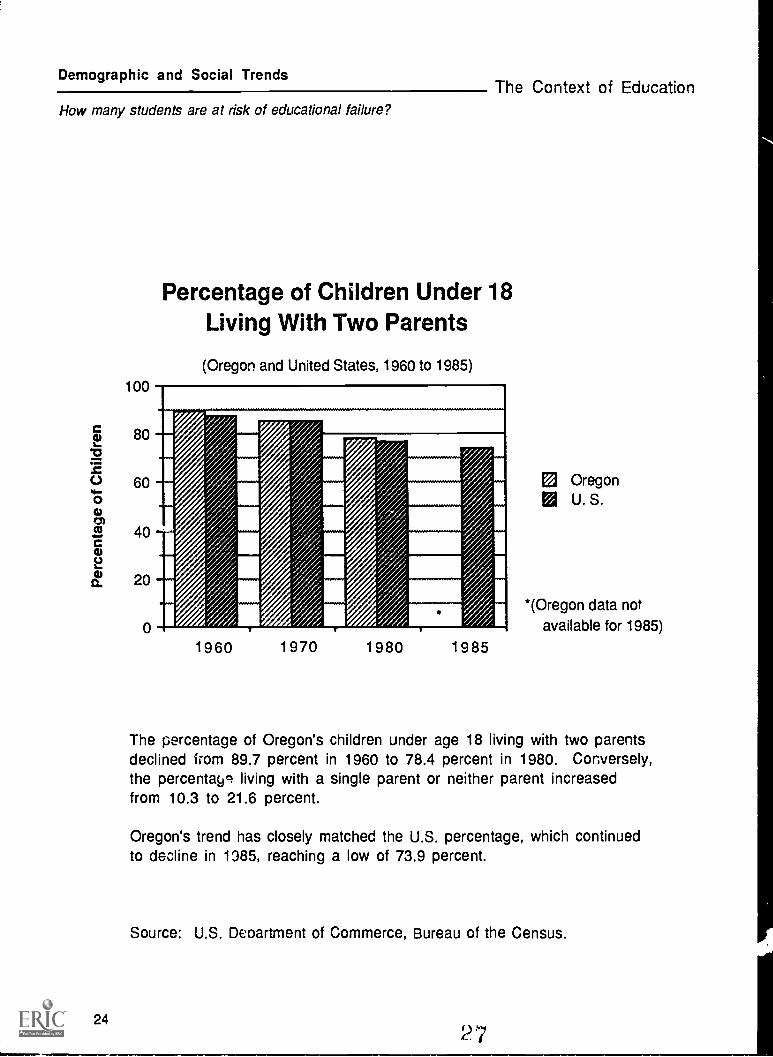
The percentage of Oregon's children under age 18 living with two parentsdeclined from 89.7 percent in 1960 to 78.4 percent in 1980. Conversely,the percentagf living with a single parent or neither parent increasedfrom 10.3 to 21.6 percent.
Oregon's trend has closely matched the U.S. percentage, which continuedto decline in 1385, reaching a low of 73.9 percent.
Source: U.S. Department of Commerce, Bureau of the Census.
2 7
The Context of Education
12%
10%
8%
6%
4%
Demographic and Social Trends
Is the potential support base for public education changing?
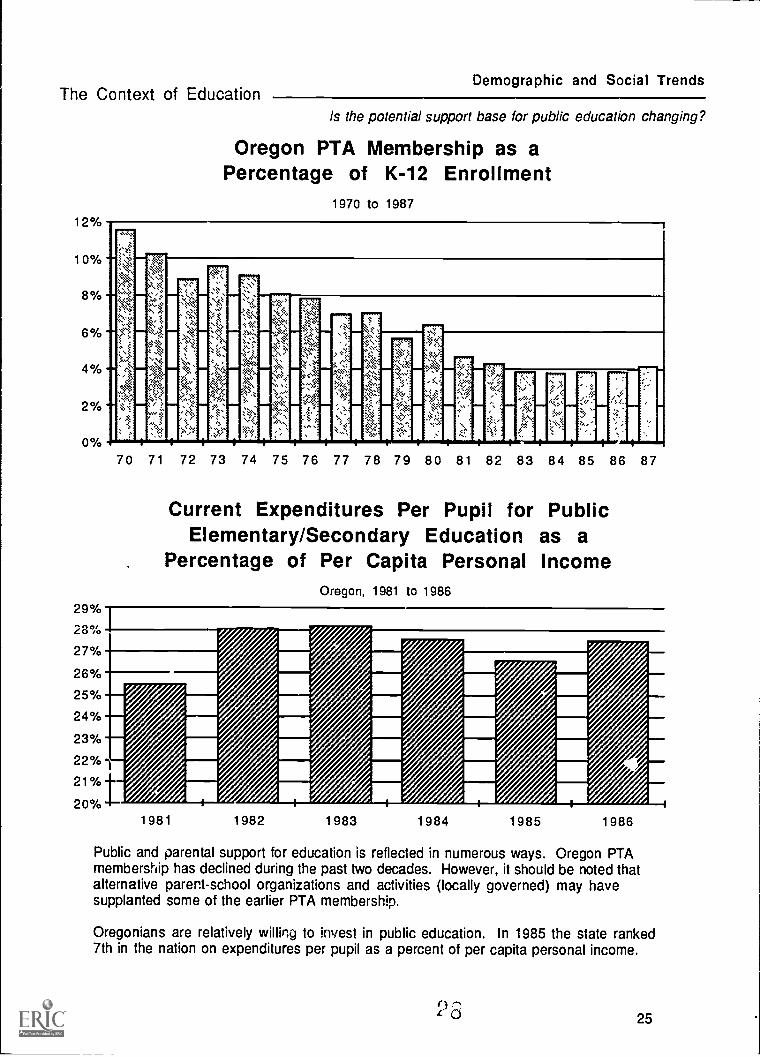
Oregon PTA Membership as aPercentage of K-12 Enrollment
Current Expenditures Per Pupil for PublicElementary/Secondary Education as a
Percentage of Per Capita Personal IncomeOregon, 1981 to 1986
1981 1982 1983 1984 1985 1986
Public and parental support for education is reflected in numerous ways. Oregon PTAmembership has declined during the past two decades. However, it should be noted thatalternative parent-school organizations and activities (locally governed) may havesupplanted some of the earlier PTA membership.
Oregonians are relatively willing to invest in public education. In 1985 the state ranked7th in the nation on expenditures per pupil as a percent of per capita personal income.
Tk
25
Demographic and Social Trends
Is the potential support base for public education changing?
The Context of Education
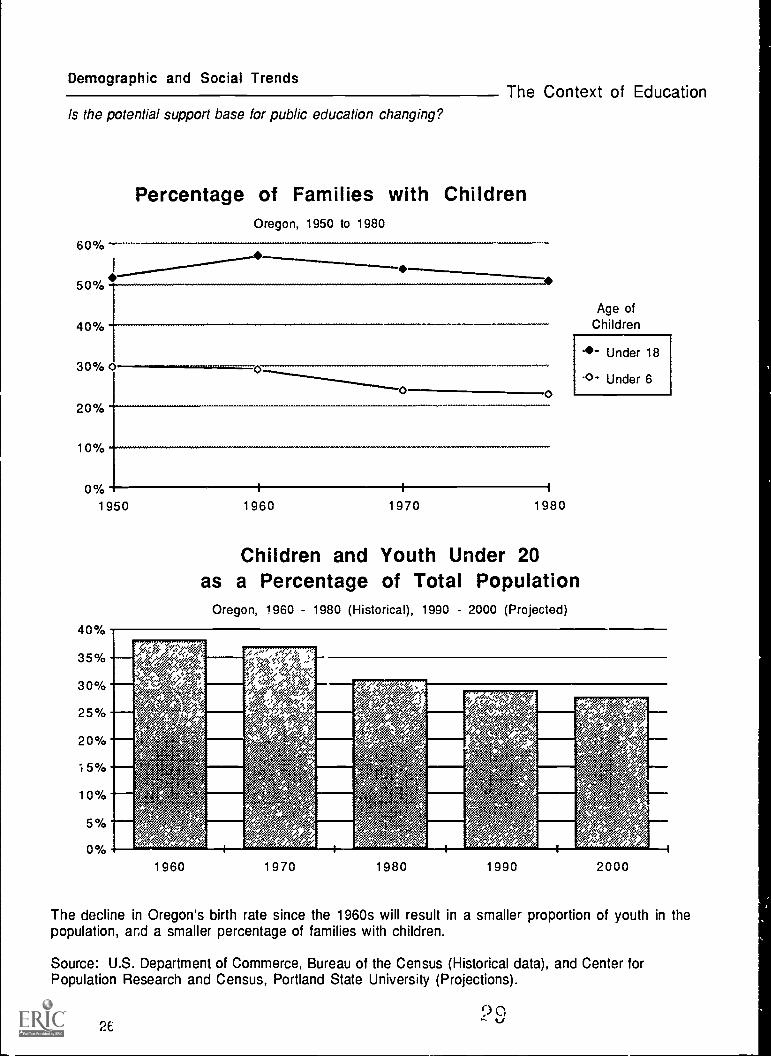
Percentage of Families with ChildrenOregon, 1950 to 1980
60%
I
Age of
50%
Children40%
Under 1830% 0--------00- Under 6
0 020%
10%
0%1950 1960 1970 1980
40%
35%
30%
25%
20%
15%
10%
5%
0%
Children and Youth Under 20as a Percentage of Total Population
The decline in Oregon's birth rate since the 1960s will result in a smaller proportion of youth in thepopulation, and a smaller percentage of families with children.
Source: U.S. Department of Commerce, Bureau of the Census (Historical data), and Center forPopulation Research and Census, Portland State University (Projections).
269 0tJ
PART II: OUTCOMES OF EDUCATION
Academic Performance
How well are students performing on the skills they will need inthe future?
Eighth grade achievement on Essential Learning SkillsFindings from national literacy studiesFindings from Second !nternaticaal Mathematics Study
How well are we preparing students who graduate from high school?Performance on the Scholastic Aptitude TestYears of coursework in selected areas of studyEnrollment in vocational educationPursuits of vocational program completersPercentage of college freshmen enrolling in English Compositionor Intermediate AlgebraIntended areas of college study
School Completion
How many students don't receive a high school diploma?High school graduation rateAnnual attrition rate
Outcomes of EducationAcademic Performance
How well are students performing onthe skills they will need in the future?
Oregon Reading Achievement
Projected National Norms for Eighth GradersCalifornia Achievement Test Norms
(Form E) Used for Projection50
40
"6
cr)a) u) 30co
cc "0CD 7
20a.14 U)a)0.
10
1 -24 25 -49 50-74
National Percentile
75-99
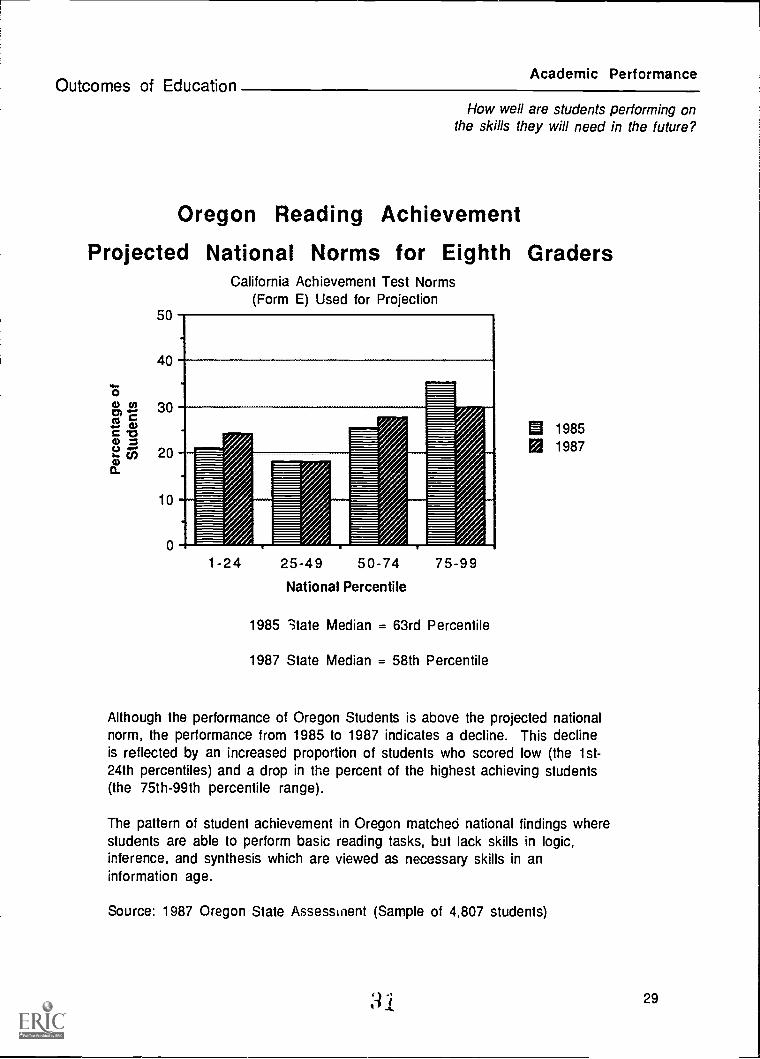
1985 State Median = 63rd Percentile
1987 State Median = 58th Percentile
a 1985El 1987
Although the performance of Oregon Students is above the projected nationalnorm, the performance from 1985 to 1987 indicates a decline. This declineis reflected by an increased proportion of students who scored low (the 1st-24th percentiles) and a drop in the percent of the highest achieving students(the 75th-99th percentile range).
The pattern of student achievement in Oregon matched national findings wherestudents are able to perform basic reading tasks, but lack skills in logic,inference, and synthesis which are viewed as necessary skills in aninformation age.
Source: 1987 Oregon State Assessinent (Sample of 4,807 students)
31 29
Academic Performance
How well are students performing onthe skills they will need in the future?
Outcomes of Education
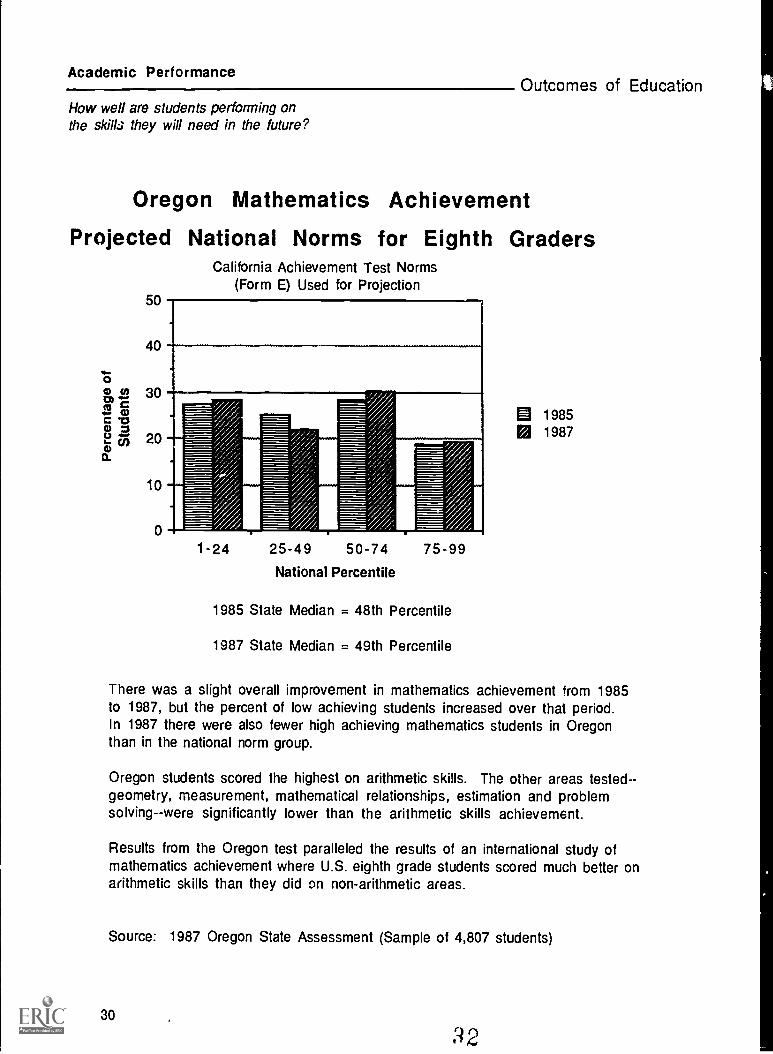
Oregon Mathematics Achievement
Projected National Norms for Eighth GradersCalifornia Achievement Test Norms
(Form E) Used for Projection50
40
30
20
10
1 -24 25-49 50-74
National Percentile
75-99
1985 State Median = 48th Percentile
1987 State Median = 49th Percentile
M 1985131 1987
There was a slight overall improvement in mathematics achievement from 1985to 1987, but the percent of low achieving students increased over that period.In 1987 there were also fewer high achieving mathematics students in Oregonthan in the national norm group.
Oregon students scored the highest on arithmetic skills. The other areas tested- -geometry, measurement, mathematical relationships, estimation and problemsolving--were significantly lower than the arithmetic skills achievement.
Results from the Oregon test paralleled the results of an international study ofmathematics achievement where U.S. eighth grade students scored much better onarithmetic skills than they did on non-arithmetic areas.
Source: 1987 Oregon State Assessment (Sample of 4,807 students)
30
-42
Outcomes of EducationAcademic Performance
How well are students performing onthe skills they will need in the future?
Oregon Writing Achievement
1987 Statewide Assessment
Writing skills of Oregon eighth grade students were tested in1985 and 1987. Essays written for these two years wereanalyzed on the traits of content development, organization,voice, word choice, sentence structure and conventions. Resultsfrom both years indicate that many students can write papersthat are grammatically correct and contain correctly spelledwords, but have trouble organizing and developing their ideas, andusing words that enrich their writing.
Results from 1987 indicated some improvement in writing,especially in the areas of grammar and spelling, and inorganization of ideas.
Most papers written for these assessments were not classifiedas outstanding nor extremely deficient. They were characterizedas having both strengths and weaknesses.
Students' ability to produce well developed papers appear to belimited by a lack of diversity in their language, which limitstheir concept development.
Many Oregon teachers of eighth graders need training in teachingstudents how to write and in analyzing student writing.
:4 331
Academic PerformanceOutcomes of Education
How well are students performing onthe skills they will need in the future?
LITERACY: Profiles of America's Young Adults
National Assessment of Educational Progress1985
National Assessment of Educational Progress (NAEP) assessed theliteracy skills of America's young adults (aged 21-25).
NAEP characterized the literacy skills of America's young adults interms of three "literacy scales" representing distinct and importantaspects of literacy:
Prose Literacy--the knowledge and skills needed to understandand use information from texts that include editorials, newsstories, poems, and the like;
Document Literacy--the knowledge and skills required to locateand use information contained in job applications or payrollforms, bus schedules, maps, tables, indexes, and so forth; and,
Quantitative Literacy--the knowledge and skills needed to applyarithmetic operations, either alone or sequentially, that areembedded in printed materials, such as in balancing a checkbook,figuring out a tip, completing an order form, or determining theamount of interest from a loan advertisement.
Major Findings
The literacy problem identified for the nation's young adults canbe characterized in two ways: While the overwhelming majorityof young adults adequately perform tasks at the lower levels oneach of the three scales, sizable numbers appear unable to dowell on tasks of moderate complexity. Only a relatively smallpercentage of this group is estimated to perform at levelstypified by the more complex and challenging tasks.
32
Outcomes of EducationAcademic Performance
How well are students performing onthe skills they will need in the future?
Inevitably, smaller percentages of young adults are found toperform at increasing levels of proficiency on each of the scales.ihe fact that fewer and fewer individuals attain these moderateand high levels of proficiency is most pronounced for young adultswho terminate their education early and for minority groupmembers.
Home-support variables (such as parents' education and access toliteracy materials) were found to be significantly related to thetype and amount of education and to the literacy practicesreported by young adults. These in turn, help to explaindifferences in literacy-skill levels.
Only about two percent of this young-adult population wereestimated to have such limited literacy sklills that it was judgedthat the simulation tasks would unduly frustrate or embarassthem. Roughly one percent (or about half) of this group reportedbeing unable to speak English.
33
Academic Performance
How well are students performing onthe skills they will need in the future?
Outcomes of Education
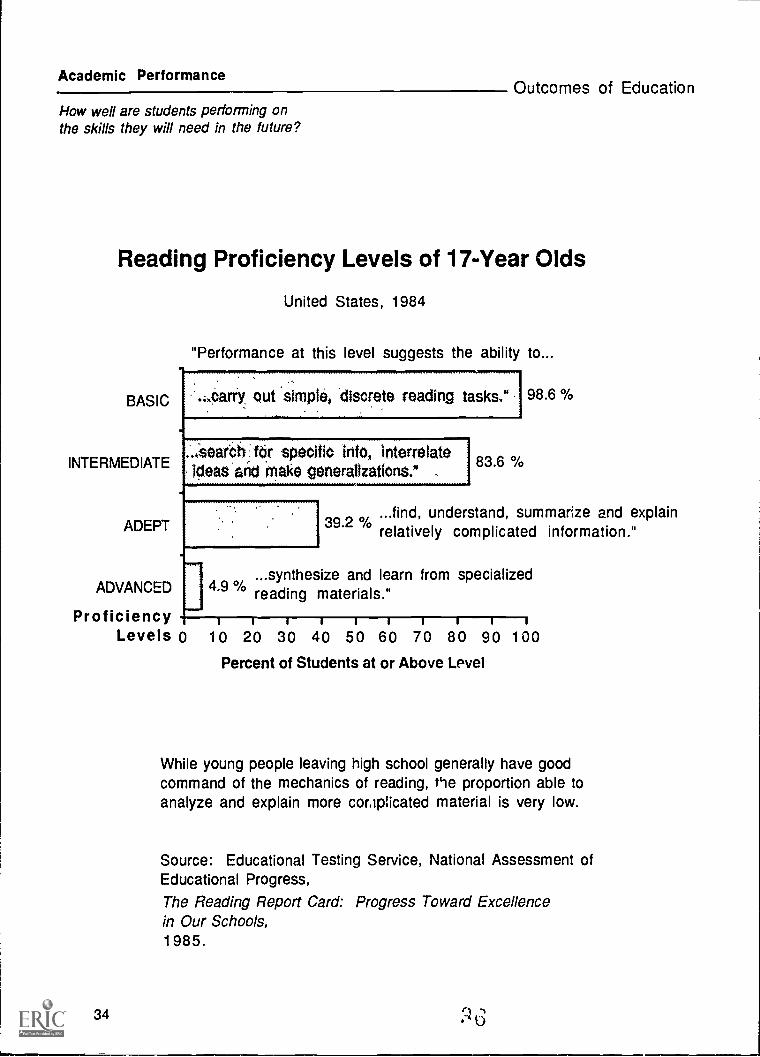
Reading Proficiency Levels of 17-Year Olds
BASIC
INTERMEDIATE
ADEPT
ADVANCED
United States, 1984
"Performance at this level suggests the ability to...
.:,carry out simple, *discrete reading tasks,"
-*Sear Ott:.tor speollio info, interrelateideas .and make generalizations."
ProficiencyLevels 0
34
N11.11111
83.6 °A)
98.6 `)/0
...find, understand, summarize and explain39.2 0/0 relatively complicated information."
...synthesize and learn from specialized4.9 0/0 reading materials."111111111110 20 30 40 50 60 70 80 90 100
Percent of Students at or Above Level
While young people leaving high school generally have goodcommand of the mechanics of reading, the proportion able toanalyze and explain more complicated material is very low.
Source: Educational Testing Service, National Assessment ofEducational Progress,
The Reading Report Card: Progress Toward Excellencein Our Schools,1985.
Outcomes of EducationAcademic Performance
How well are students performing onthe skills they will need in the future?
International Comparison ofUnited States Mathematics Achievement
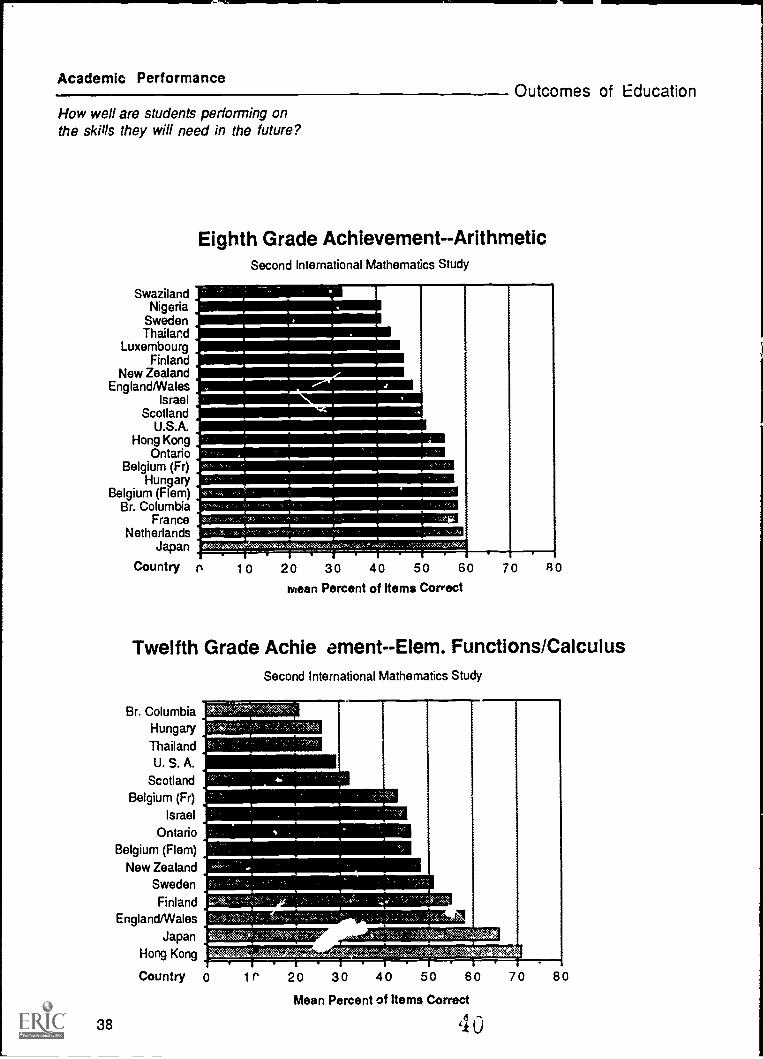
This 1981-82 study assessed students in 17 countries at two agelevels. The first population was at the eighth grade in the U.S. andmost other countries, except Japan and Hong Kong which was theseventh. The second population was twelfth grade college-preparatorymathematics. The graphs on the following pages and the followingcomments illustrate the major results of this study.
U.S. students were slightly above the international average incomputational arithmetic (calculation) and well below theinternational average in non-computational arithmetic (e.g.,problem-solving).
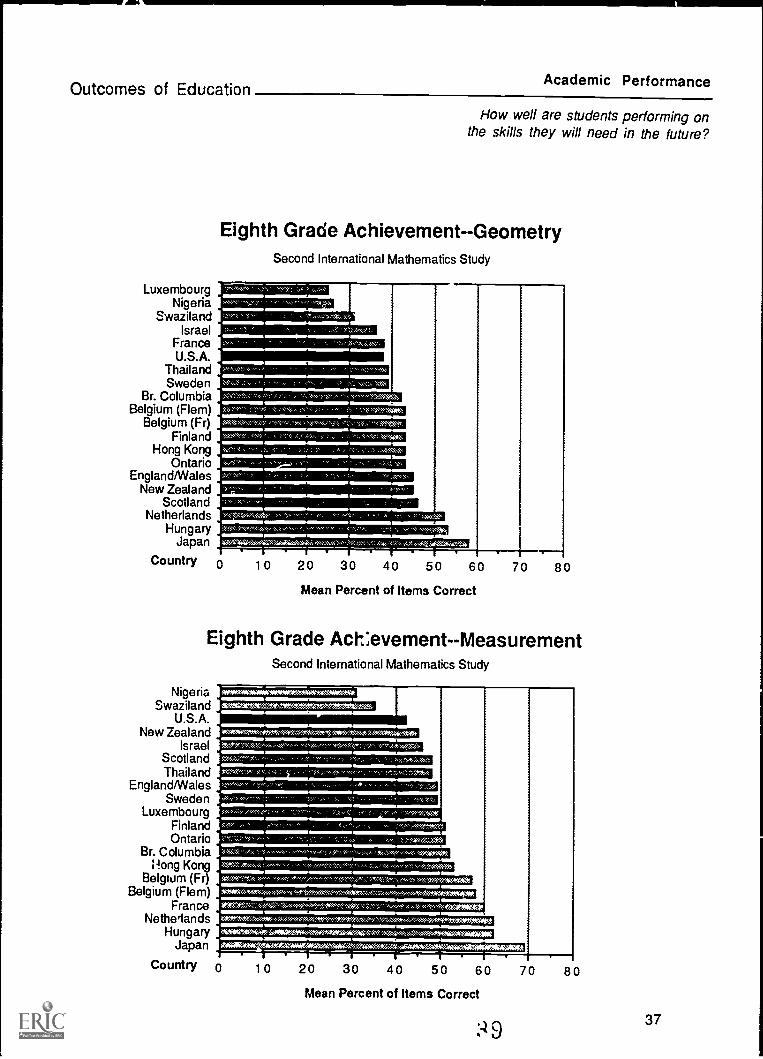
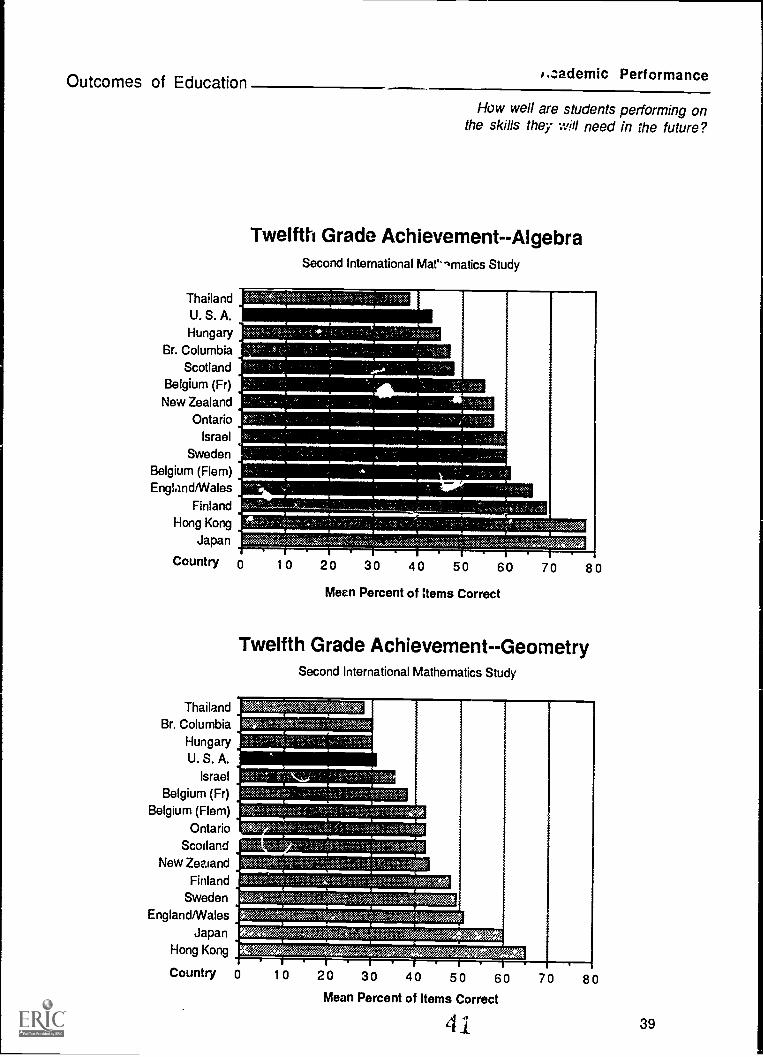
Achievement in geometry for the U.S. was among the bottom 25percent of all countries, reflecting to a large extent low teachercoverage of this subject matter.
In the U.S. calculus classes, the achievement of the nation's bestmathematics students, was at or near the average achievement ofthe advanced secondary school mathematics students in othercountries. (In most countries, all advanced mathematics studentstake calculus. In the U.S. only about one-fifth do.)
The achievement of the U.S. precalculus students (the majority oftwelfth grade college-preparatory mathematics students) wassubstantially below the international average. In some cases, theU.S. ranked with the lower one-fourth of a:I countries in theStudy, and was the lowest of the advanced industrializedcountries.
The extent of coverage by U.S. mathematics teachers of topics onthe international test was typically at or below the internationalaverage for most content areas, at both grade levels. Within theUnited States, coverage varied a great deal among classes. Thatis, marked differences in opportunites to learn mathematics werefound between students.
35
Academic Performance
How well are students performing onthe skills they will need in the future?
Outcomes of Education
In contrast to many other countries (most notably, Japan), theUnited States curriculum is dramatically differentiated at theeighth grade school level. Four mathematics programs wereidentified, each with vastly different mathematical content,ranging from algebra for the most able students to grade schoolarithmetic for the least able students.
The U. S. mathematics curriculum is characterized by a great dealof repetition and review, with the result that topics are coveredwith little intensity. By contrast, at this level, France plaCes agreat deal of emphasis on geometry and Japan provides an intensetreatment of algebra.
The eighth grade mathematics curriculum in the U.S. tends to be"arithmetic-driven," resembling much more the end of elementaryschool than the beginning of high school.
The teaching load of U.S. mathematics teachers, from aninternational point of view, is high. By contrast, Japaneseteachers have rather light teaching loads, especially at theadvanced level.
The textbook defined "boundaries" for mathematics taught by U. S.
teachers at both grade levels. Limited use was made of resourcesbeyond the textbook for either content or teaching methods.
More calculator use at the lower secondary school level wasgenerally found in Europe than in the United States.
Calculator use in advanced (college preparatory) mathematicsclasses was common, not only in the U.S., but in most countries.About one-third of the U.S. advanced classes used calculators inclass two or more times a week.
36
1
I.
.
. .: :
0 .
_.
.. .
: . ..
I .
:
e , 11
111r1M
e
,40e,
Y...Nerial.iV.m.,4....`"`.3.01 , s ., ...0,1.0kre,§AAtz;
-
:
: AWAVaiiVilIVAPI70VAMIeNt. . :IrMtf.0515.
40£42,140}.0 I XD'43 OOP, v,`"0".
..
.
7
5
s" .
.:
", " V4034::+t
. '" 9'MIR.450.0.
"e 0%41 ` ;.'., 10. e ".";7.lt0;n00,00*t rgSI. , `. s, e, ..",W$11ktilt
I1
-
- -
L
1
Academic Performance
How well are students performing onthe skills they will need in the future?
SwazilandNigeria
SwedenThailand
LuxembourgFinland
New ZealandEngland/Wales
IsraelScotland
U.S.A.Hong Kong
OntarioBelgium (Fr)
HungaryBelgium (Flom)
Br. ColumbiaFrance
NetherlandsJapan
Country
38
Outcomes of Education
Eighth Grade Achievement--ArithmeticSecond International Mathematics Study
rt 10 20 30 40 50 60
snean Percent of Items Correct
70 8 0
Twelfth Grade Achie ament--Elem. Functions/CalculusSecond International Mathematics Study
Br. ColumbiaHungaryThailandU. S. A.
Scotland
Belgium (Fr)
Israel
OntarioBelgium (Flem)
New ZealandSweden
FinlandEngland/Wales
Japan
Hong Kong
Country 0 r 20 30 40 50 60
Mean Percent of Items Correct
40
70 80
Outcomes of Education
Thailand
U. S. A.
HungaryBr. Columbia
ScotlandBelgium (Fr)
New ZealandOntario
Israel
Sweden
Belgium (Flem)England/Wales
FinlandHong Kong
Japan
Country
ThailandBr. Columbia
HungaryU. S. A.
IsraelBelgium (Fr)
Belgium (Flem)
OntarioScotland
New Zealand
FinlandSweden
England/Wales
JapanHong Kong
Country
i.cademic Performance
How well are students performing onthe skills they will need in the future?
Twelfth Grade Achievement-- AlgebraSecond International Math,matics Study
0 10 20 30 40 50 60 70 80
Mean Percent of Items Correct
Twelfth Grade Achievement--GeometrySecond International Mathematics Study
4,5e,W s
'::":"<;.4
OA.* ,
MNA20),:f;Rnta="4:00:gaLVYWArEffaUtA
10 20 30 40 50 60
Mean Percent of Items Correct
41
70 80
39
Academic Performance
How well are we preparing studentswho graduate from high scloo/?
Outcomes of Education
Percentage of High School Graduates ScoringAbove 600 on the SAT
Oregon and United States(Public and Private High Schools)
9% -.8%7 0/0
% ,-"-°'-e50k o -so
4% -I--
3% s -.a . . . . 0
2%1
0% I i 4 1 I
1976 1978 1980 1982 1 984 1986 1987
I- Math--OR
0- Math--US
II- Verbal--OR
-0- Verbal--US
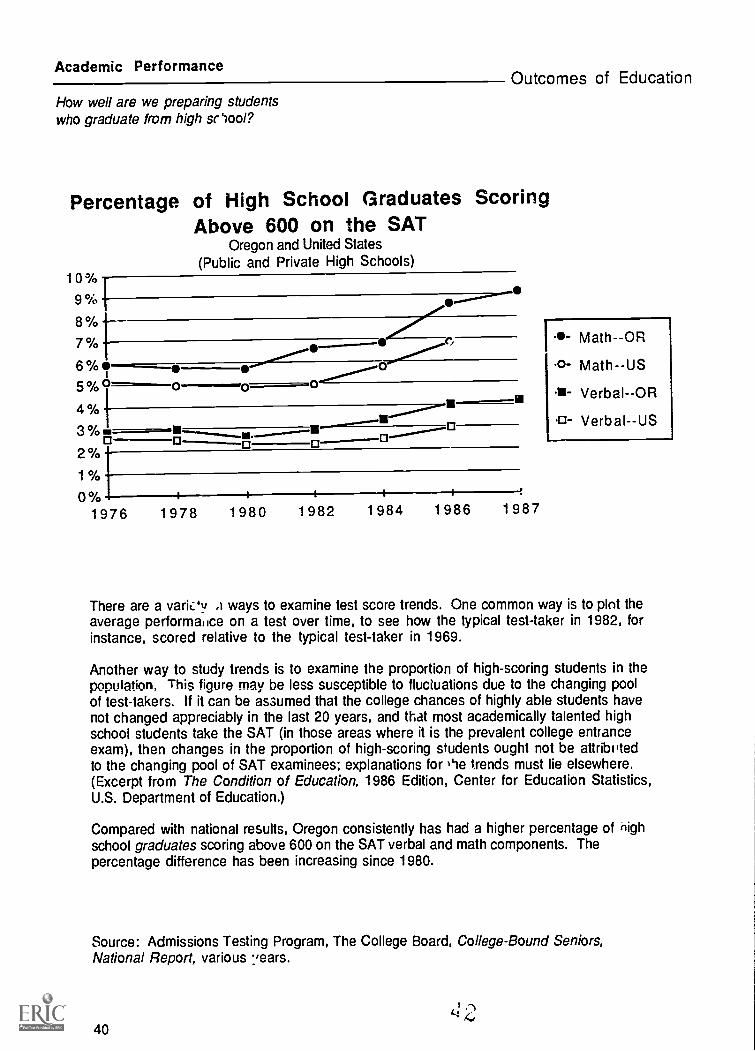
There are a variciy ways to examine test score trends. One common way is to plot theaverage performance on a test over time, to see how the typical test-taker in 1982, forinstance, scored relative to the typical test-taker in 1969.
Another way to study trends is to examine the proportion of high-scoring students in thepopulation. This figure may be less susceptible to fluctuations due to the changing poolof test-takers. If it can be assumed that the college chances of highly able students havenot changed appreciably in the last 20 years, and that most academically talented highschool students take the SAT (in those areas where it is the prevalent college entranceexam), then changes in the proportion of high-scoring students ought not be attributedto the changing pool of SAT examinees; explanations for ,Lie trends must lie elsewhere.(Excerpt from The Condition of Education, 1986 Edition, Center for Education Statistics,U.S. Department of Education.)
Compared with national results, Oregon consistently has had a higher percentage of nighschool graduates scoring above 600 on the SAT verbal and math components. Thepercentage difference has been increasing since 1980.
Source: Admissions Testing Program, The College Board, College-Bound Seniors,National Report, various .:ears.
(11 ti
40
Outcomes of EducationAcademic Perforn.ance
How well are we preparing studentswho graduate from high school?
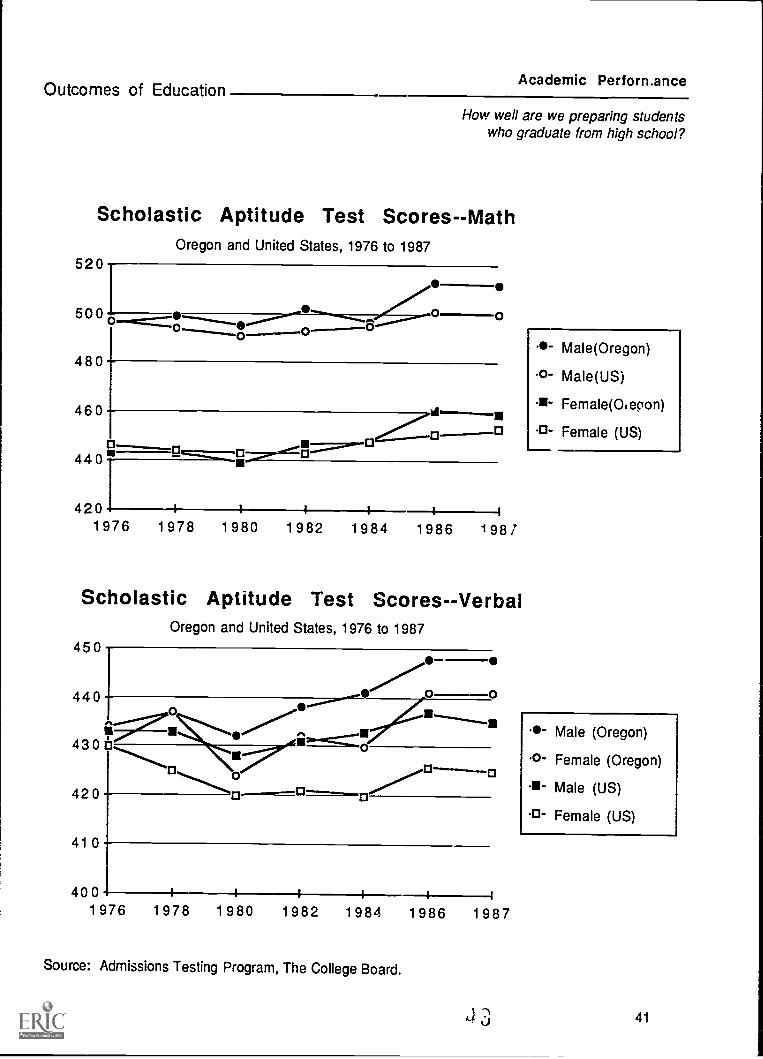
Scholastic Aptitude Test Scores--MathOregon and United States, 1976 to 1987
520
5001o 0 .......---0o
480
460
ri-1:10 la
ii......-----13440
420
0
13
1976 1978 1980 1982 1984 1986 1987
Scholastic Aptitude Test Scores--VerbalOregon and United States, 1976 to 1987
450
440
430
420
410
4001976 1978 1980 1982 1984 1986 1987
Source: Admissions Testing Program, The College Board.
- Male(Oregon)
0- Male(US)
1- Female(0, epon)
0- Female (US)
- Male (Oregon)
0- Female (Oregon)
0- Male (US)
1:1- Female (US)
4 3 41
Academic Performance
How we' ,re we preparing studentswho graouate from high school?
Outcomes of Education
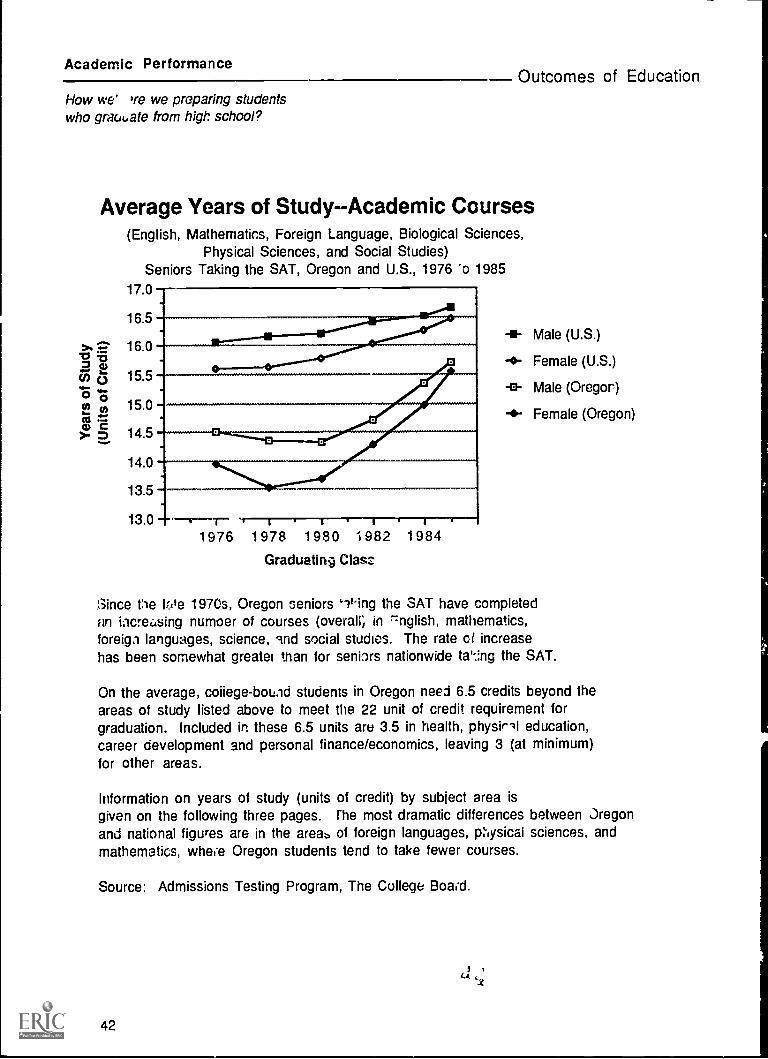
Average Years of Study--Academic Courses(English, Mathematics, Foreign Language, Biological Sciences,
Physical Sciences, and Social Studies)Taking the SAT, Oregon and U.S., 1976 `o 1985Seniors
17.0
16.5
16.0
15.5
15.0.,
14.5
14.0
13.5
13.0 ---1---r- - 1 , 1 i
1976 1 97 8 1980 1 98 2 1984
Graduating Clas:
-U- Male (U.S.)
-o- Female (U.S.)
-a- Male (Oregor)
-- Female (Oregon)
Since fie kite 1970s, Oregon seniors 41ting the SAT have completedan increasing numoer of courses (overall; in 7:nglish, mathematics,foreign languages, science, lnd social studies. The rate of increasehas been somewhat greater than for seniors nationwide ta'-.:ng the SAT.
On the average, coiiege-bou.id students in Oregon neei 6.5 credits beyond theareas of study listed above to meet the 22 unit of credit requirement forgraduation. Included in these 6.5 units are 3.5 in health, physiril education,career development and personal finance/economics, leaving 3 (at minimum)for other areas.
Information on years of study (units of credit) by subject area isgiven on the following three pages. the most dramatic differences between Oregonand national figures are in the areab of foreign languages, plvsicai sciences, andmathematics, whel'e Oregon students tend to take fewer courses.
Source: Admissions Testing Program, The College Board.
41
42
Outcomes of EducationAcademic Performance
How well are we preparing studentswho graduate from high school?
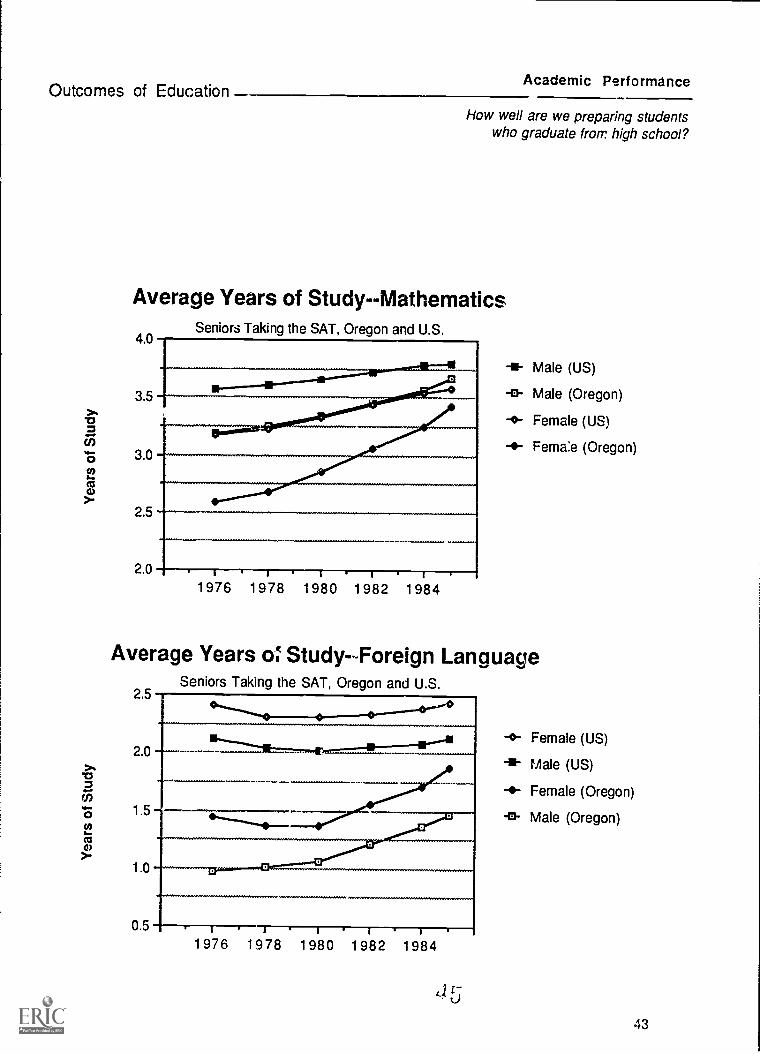
Average Years of Study--MathematicsSeniors Taking the SAT, Oregon and U.S.
4.0
3.5
3.0
2.5
2.0 . i . i .. . . 1
1976 1978 1980 1982 1984
-IF Male (US)
-a- Male (Oregon)
-4- Female (US)
.4- Female (Oregon)
Average Years ol Study--Foreign LanguageSeniors Taking the SAT, Oregon and U.S.
2.5
2.0
1.5
1.0
0.5
1976 1978 1980 1982 1984
4 f;
-o- Female (US)
-IF Male (US)
-4- Female (Oregon)
-0- Male (Oregon)
43
o
Academic Performance
How well are we preparing studentswho graduate from high school?
44
4.25
4.00
3.75
3.50
3.25
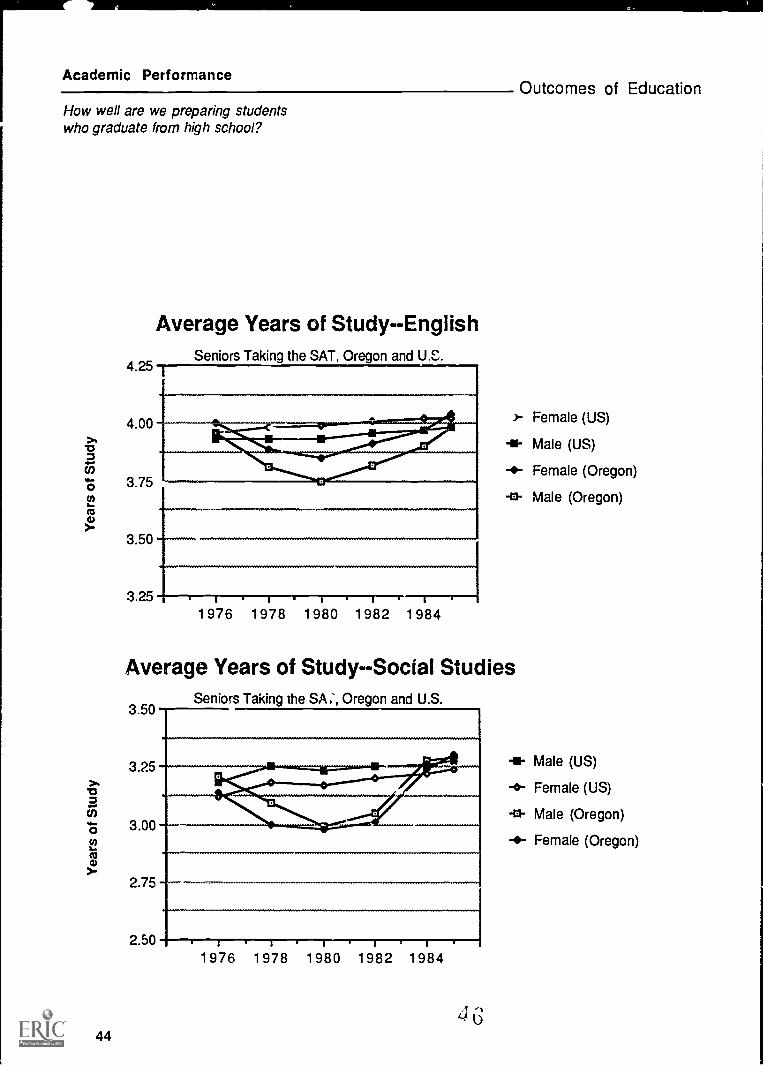
Average Years of Study--EnglishSeniors Taking the SAT, Oregon and
I
1976 1978 1980 1982 1984
Outcomes of Education
Female (US)
-IF Male (US)
Female (Oregon)
-o- Male (Oregon)
Average Years of Study--Social StudiesSeniors Taking the SA:, Oregon and U.S.
3.50
3.25
3.00 .1112.75
2.501976 1978 1980 1982 1984
-IF Male (US)
-0- Female (US)
-o- Male (Oregon)
Female (Oregon)
Outcomes of Education Academic Performance
How well are we preparing studentswho graduate from high school?
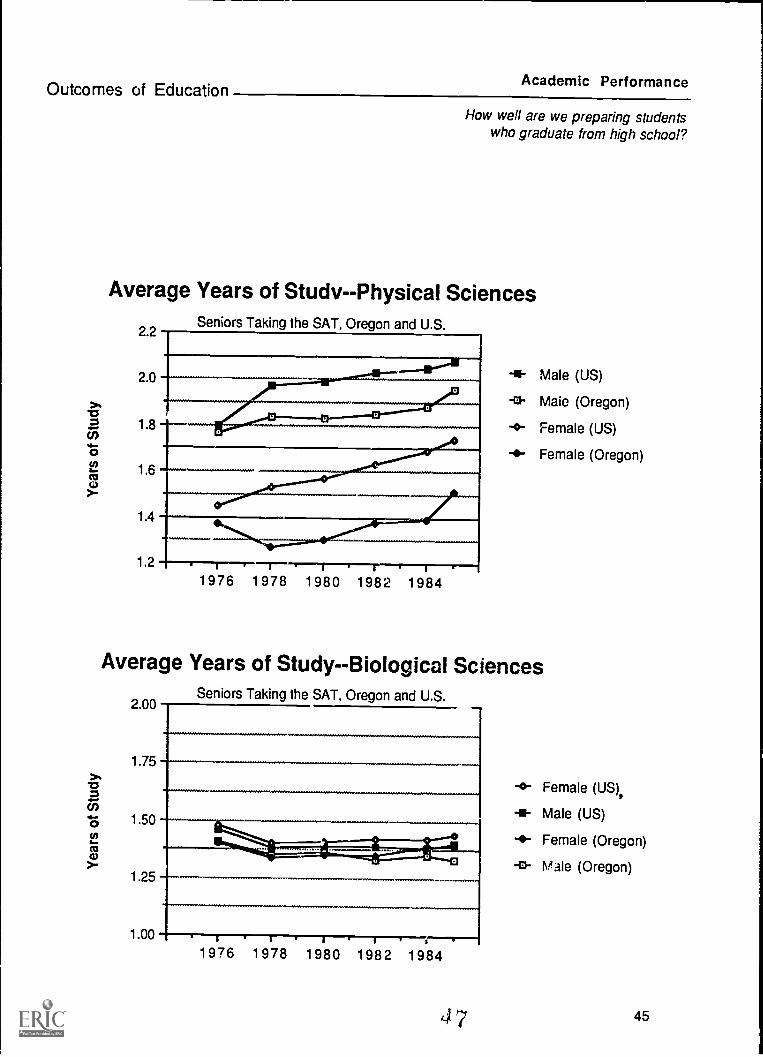
Average Years of Studv--Physical SciencesSeniors Taking the SAT, Oregon and U.S.
-1.- Male (US)
-El- Maio (Oregon)
-4).- Female (US)
-o- Female (Oregon)
2 .2
-.---ir'Ar-Airpso2.0
1.8 eVIMIWWW.V.00WONWIWMOVe,
1.6 ..1.10.4... *1*1.4
1.2 -7"-- 1
1976 1978 1980 1982 1984
Average Years of Study--Biological SciencesSeniors Taking the SAT, Oregon and U.S.
2.00
1.75
1.50
1.25
1.00
1976 1978 1980 1982 1984
47
-4)- Female (US),
-a- Male (US)
-o- Female (Oregon)
-o- Male (Oregon)
45
Academic Performance
How well are we preparing studentswho graduate from high school?
46
Outcomes of Education
Enrollment in Vocational Educationas a Percentage of Total Enrollment,
Grades 11 and 12
100
90
80
70
60
50
40
30
20--10
cr
70 72
Oregon Secondary Schools, 1970 to 1986
WWWIIIV.V.InIIVW
**" *neeI = I I
74 76 78 80 82 84 86
Graduating Year
The percent of 11th and 12th grade students enrolled in vocational educationprograms has continued to decrease since the 1981-82 school year. The causefor the decrease would appear to be attributable to such variables as increasedgraduation requirements, increased entrance requirements fc r Oregon four-yearcolleges, reduced budget revenues, and other economic considerations.
Outcomes of Education Academic Performance
How well are we preparing studentswho graduate from high school?
Vocational Education Studentsin Secondary Schools
DBila 1982-83 1983-84 1984-85
All students, grades 9-12 144,855 146,302 148,211Vocational students, grades 9-12 (unduplicated) 39,173 37,974 38,427Vocational students, grades 9-10 (unduplicated) 10,608 11,129 12,437Vocational students, grades 11-12 (. 'duplicated) 28,565 26,845 25,990Vocational students, grades 9-12 es a , if all stidi its 27.0% 26.0% 25.9%
Federal vocational funds (used in grades 11-12) $1,225,559 $1,437,703 $1,533,492State and local vocational lunds $2-t,360,212 $26,229,059 $28,327,257Total federal, state and local vocational furas $26,085,771 $27,666,762 $29,e90,749
Services provided
The federal vocational funds for 1985 were awarded to school districts with high schools that hadstate-approved vocational programs. The high schools used the federal funds for programs inagriculture, marketing, health, food service, accounting, clerical, secretarial, mechanics,construction, electricity/electronics, metals, child care, clothing, drafting, graphics, service,forestry, diversified occupations, and miscellaneous special programs. Federal funds were not usedfor home and institutional management. The programs used the federal vocational funds primarily forsupplies and equipment, although minor sums were used for instructor salaries.
Unmet Needs
Local high schools continue to have major needs for additional supplies a 'd equipment for ex,stingprograms. Changing technology will increase the need for these items. Additional funds will bb neededfor new vocational programs, expanding programs, and programs that are extended from thetraditional two year offerings to three or four years. All vocational programs will require otheradditional funds for developing and/or revising appropriate curriculum, along with funds for 'Stich othersupport services as counseling and guidance and staff inservice activities. Other funds are needed forincentives to attract the best possible people from business and industry to serve as vocationalinstructors.
4 o. 47
Academic Performance
How well are we preparing studentswho graduate from high school?
Percentage of Former Vocational ProgramComp !eters Employed or Pursuing FurtherEducation in Areas Related / Unrelated to
Their Vocational PreparationOregon Secondary School Program Comp leters, 1983-85
70
60
5G
40
30
201983 1984
Graduating Class
1985
Outcomes of Education
-D. Related Employmentor Education
-0- Unrelated Employmentor Education
For the past decade, follow-up studies have been conducted to determine theactivities and perceptions of persons who had completed high school vocationalprograms. The former high school students surveyed had completed at leastone and one-half years of an ap high school vocational program, accordingto the SERVE management information system.
Out of all respondents, 33 percent of the 1985 graduates reported that they wereengaged in work or further education in areas related to their vocational preparation.Forty-six percent indicated they were pursuing work or further education in areasunrelated to their vocational pngram. The remainder (16 percent) were unemployed(or not in the labor force) and not in school.
Source: Follow-Up Study of 1984-85 Students of Oregon High School VocationalEducation Programs, Oregon Department of Education. (Also reports for 1983-84and 1982-83 students.)
'5048
Outcomes of EducationAcademic Performance
How well are we preparing studentswho graduate from high school?
Percentage of College FreshmenEnro!iing in English Composition
or Intermediate AlgebraOregon High School Graduates
Enrolled in State Colleges and Universities1 0 0%
80%
60%
40%
J
2 0% 0
0%1982
O ........=.0
1984High School Class
1985
4- English Composition
0.- Intermediate Algebra
The Oregon State System of Higher Education reports annually on the performance offreshmen in state colleges and universities. Approximately 70 percent of each year'scollege freshmen are from the immediately preceeding Oregun high schoo! graduatingclass.
The above figures give the percentage of such freshmen who enrolled in IntermediateAlgebra (a high school-level math course) and English Composition (a college-levelwriting course). Placement tests are used by state colleges and universities to guidestudents into appropriate courses in math and English. Thus, the decrease in thepercentage enrolled in Intermediate Algebra and growth in English Compositionenrollment indicates that freshmen from Oregon high schools are increasingly betterprepared for %.:ollege studies.
Source: Academic Perfo, ,,ance Report, New Freshmen Class of 1985-86, Oregon HSClass of '85 Only, Office of School Relations, Oregon State System of Higher Education.Also: Reports for Freshman classes of 1982-83 and 1984-85.
of 49
Academic Performance
How well are we preparing studentswho graduate from high school?
40%
35%
30%
25%
20%
15%
10%
5%
0%1976
Intended Areas of Studyof SAT Examinees
Oregon, 1976 to 1985
il-iiii.........._. o o
"----------.4,____.,--13
13
CIC
13u
I I I i i i
40%
35%
30%
25%
20%
15%
10%
5%
0%
1978 1980 1982 1984 1985
.aa ,514 -....X.------7-.1-..rti,-./1:1". C
'II
4 - 6-------;".--.7-1*__=_,......_.___
1976 1978 1980 1982 1984 1985
Outcomes of Education
4- Biological Sciences--Male
0- Biological Sciences--Female
11- Physical Sciences--Male
1:1- Physical Sciences--Female
- Arts & Humanities- -Male
.0- Arts & Humanities--Female
13- Business & Communications- -Male
1:1- Business & Communications- -Female
4- Social Sciences--Male
-6- Social Sciences--Female
Over the last ten years an increasing number of students entering ccll9ge have beenprojecting their areas of study in business aod communications and the physicalsciences. The most dramatic increase for females has been in business; for males, inphysical sciences.
During that same period, there has been a declining interest in the biological and socialsciences, and arts and humanities.
50
"
Outcomes of Education
85% .0
80%
75%
70%
65%
60%71 72 73 74 75 76 77 78 79 80 81 82 83 54 8,
Graduating Class
School Completion
How many students don't receive a high school diploma?
High School Graduation RateOregon, 1971 to 1987
Unadjusted
Adjusted forMigration
10%
Annual Attrition RateOregon, 1976 to 1987
9% Adjusted for Migration
7 %
8%
Unadjusteo6 %°
-4-186 87
5%
4%
3%
2%-1
0%76 77 78 79 80 81 82 83 84 85 86 87
Source: Oregon Department of Education, Oregon Public aria r ,,.ate High school Graduates, Summaryof Student Personnel (1968 to 1986). See following page for description of adjustment for migration.
5.351
School Completion
How many students don't receive a high school diplome?
Outcomes of Education
The chart on the previous page shows the percentage of students who receive a highschool diploma in Oregon, compared to the size of the original freshman class. The highschool graduation rate (unadjusted) is defined as the number of public school graduatesreceiving a regular diploma as a percentage of the October 1 ninth grade membership fora given graduating class. For example, the 27,165 graduates in 1987 is 70.8 percent ofthe 38,388 ninth graders on October 1983.
Adjustment for migration takes into account the movement of students into and out of thestate. For a given school year, the enrollment in grades 3 through 9 is compared withthe enrollment in grades 2 through 8 for the previous school year. The percentageincrease (or decrease) is used to project changes in membership at the high schoolgrades for the corresponding year. When the state gains population the number ofpotential high school graduates grows as well. In the example above, this adjustmentresulted in a graduation rate of 69.8 percent (27,165 divided by 38,889).
The annual attrition rate shows the percentage of shy. ,ts who leave high school in agiven year before receiving a high school diploma. T nis rate peaked in the 1977-78school year at 9.1 percent (adjusted for migration). Since the 1981-82 school year,the annual attrition rate has increased, with a slight drop in 1986-87.
The high school graduation rate has been declining since 1985, after a four-yearincrease. Over the last ten years, Oregon's graduation rate has averaged 71.3 percent.In comparison, the U.S. average was 71.5 percent in 1986 and 69.5 percent in 1982.
A total of 1,087 students reneived an alternate document (e.g., certificate of completion)rather than a regular diploma in 1987. Adding them to the number receiving a regulardiploma results in graduation rates of 73.6 percent (unadjusted) and 72.6 percent( adjusted for migration).
The percentage c' 'dents in a given graduating class who earn a GED certificate beforeage 19 may be aadeu to the graduation rate, yielding the percenhae who romplete a higlschool education "on time." The percentages of GED recipients under 19 years old, bygraduating class, are as follows:
Class GED Rate
1982 5.77%1983 5.231 9 8 e 4.751985 5.84
Data from the decennial census for Oregon shows that the percentage of 18 to 24-yearolds who had graduated from high school was 72.6 percent in 1970 and 76.8 percent in1980.
Source: Oregon Department of Education, Oregon Public and Private High SchoolGraduates, Summary of Student Personnel (1968 to 1986); GED Program :.-ords.
52
PART III: SCHOOL CHARACTERISTICS AND RESOURCES
Teacher Characteristics
Who is entering the teaching profession?SAT scores of intended education majorsPercent passing C-BEST on first tryPercent of student teachers employed in Oregon schools one yearfollowing graduation, by field of studyPercent of student teachers certified/em,loyea in Oregon schools
Educational Resources
Will school districts have difficulties implementing kindergartenprograms by 1989?
Oregon kindergarten statistics
Are educational resources equitably distributed?Percentile distribution of estimated current expendituresper resident studentCorrelation between expenditures per student andassessed value per studentCorrelation between property tax rate and assessed value per student
How are schools and districts staffed?Elementary pupil/teacher ratio by size of schoolHigh school pupil/teacher ratio by size of schoolPercentile distribution of teachers per school districtPercentile distribution of administrators per school district
School Characteristics and Resources Teacher Characteristics
Average SAT Math Scores ofIntended Education Majors
Oregon and United States, 1978 to 1985
400
3751978 1980 1982 1984 1985
500
475
450
425
400
375
Average SAT Verbal Scores ofIntended Education Majors
Oregon and United States, 1978 to 1985
o
------- 0
.,,...._ ____.-
i 4 I I
197,, :980 1982 1984
r- ....,:. 0
I
1985
Who is entering and leavingthe teaching profession?
- Math--All Intended Majors(Oregon)
0- Math--Intended Educ Major(Oregon)
111- Math--Intended Educ Major(US)
Verbal--Intended Educ Major(Oregon)
'0- Verbal--All Intended Majors(Oregon)
1- Verbal--Intended Educ Major(US)
55
Teacher Characteristics
Who is entering and leavingthe teaching profession?
School Characteristics and Resources
Percent of Candidates for Certif.icatiorPassing C-BEST on First Try
Oregon, 1985-86
Administrative Certificate
Personnel Certificate
Other
Teaching Certificate
Admission to Teacher T --,: ;ling
Substitute Certificate y A0%
I
20% 40% 6 0 %
Overall Percent Passing
1985 81%1986 79%
89%
83%
79%
79%
77%
76%
80% 100%
Source: Educational Testing Service report to Teacher Standards and PracticesCommission.
56 !-; 7
Teacher CharacteristicsSchool Characteristics and Resources
who is entering and leavingthe teaching profession?
Percent of Student Teachers Employedin Oregon Schools One Year Following Graduation
100%
80%
60% IIIL
40°
20:
0%
100%
80%
60%
40%
20%
0%
1983 1984 1985 1986
ADVANCED MATH
la HANDICAPPED LEARNER
BUSINESS & OFFICEEDUCATION
10 PHYSICAL SCIENCE
MUSIC (K-9 & K-12)
1 983 1984 1985 1986
ELEMENTARY
MI SOCIAL STUDIES
HEALTH ED (K-12 &COMB)
BASIC ART
PHYSICAL ED (K-12)
With the exception of those in certain fields, Oregon student teachers have had arelatively difficult time finding job placements in Oregon public schools. In the abovefigures, data are shown for the top five and bottom five fields (as of September 1983).
Source: 1982-66 Student Teachers Placed by September 30, 1986. Teacher Standardsand Practices Commission, May 1987.
57
Teacher Characteristics
Who is enteringthe teaching profession?
100%
80%
60%
40%
20%
0%
School Characteristics and Resources
Percent of 1982-83 Student Teachers WithOregon Certification
(January of Given Year)
100%
80%
60%
40%
20%
0%
1984 1985 1987
Percent of 1982-83 Student TeachersEmployed in Oregon Public Schools
(Septemoer of Given Year)
1983 1984 1985 1986
Source: 1982-86 Student Teachers Placed by September 30, 1986. Teacher Standardsand Practices Commission, May 1987.
58
School Characteristics and Resources
1 0 0%
90%
80%
70%
6 0 %
50%
4 0 %
3 0 %
20%
1 0%
0%
Educational Resources
Will school districts have difficulties implementingkindergarten programs by 1989?
Oregon Kindergarten Statistics
1982 1 9 8 3 1984 1 9 8 5 1986 1 9 8 7
O Percent of 5-Year Olds inPublic School Kindergarten
in Percent of PublicElementary SchoolsOffering Kindergarten
03 Percent of Elementary andUnified Distrints OfferingKindergarten
Seventy-eight districts offering elementary education have yet to implementkindergarten programs. Current district timelines call for 22 to do so in the 1987-88school year, four in the 1988-89 school year, and 52 in the 1989-90 school year.
Of the 52 that plan implementation for 1989-90, 24 (46 percent) are operatingwithin their current tax base, and 28 (54 percent) require levies outside their taxbase.
Sources: Oregon Kindergarten Statistics 1986-87, School Finance and Data InformationServices, Office of School District Services, Oregon Department of Education, December1986. Timelines for Implementing Kindergarten, Division of General Education, OregonDepartment of Education, March 1987.
60 59
Educational Resources
Are educational resources equitably distributed?
900
850
800
is 750
700
`c 650tr)
600z.5 550
500
450ti2 400z0
350
300
250
200
School Characteristics and Resources
Percentile Distribution of EstimatedCurrent Expenditures Per Resident Student
Oregon School Districts, 1986-87
UV
D
10
:0
0I IN 4'
I:
r0'.
D.
0
..........
'...i.
,...,,, ,.,,...,,
'0
0
I
0
0 t
0
0
0 e111 1fi
0
0 10 20 30 40 50 60Percentile
70 80 90
The figure above displays the distribution uf estimated current expenditures perresident student for all Oregon school districts. (Each point in the scatterplotrepresents one district.) The median value (50th percentile) was $3,834 per pupil.The lower ten percent of districts spent $3,203 or less per student, and the top tenpercent spent above $5,737 per student.
100
Source: School Finance and Data Information Services, Oregon Department of Education,Estimated 1986-87 Per Student Current Expenditures (n.d.).
60
School Characteristics and ResourcesAre educational resources equitably distributed?
Educational Resources
9000
8000
b9
7000
o_ 6000
cicD 5000
L-. 4000()
300
200
Correlation Between Expenditures Per St identand Assessed Value Per Student
Unified School Districts, 198Z-E7
--*-
.
. .
.
1111111111
e.........A
e.8.P ,g;
,,a IP S.
IIII.%
.
a
.0.
.
.
s
6
. ,
.50000 100000 1500CJ 200000 250000 300000
Assessed Value per ADMr ($)
3
2
2
350000
Correlation Between Property Tax Rateand Assessed Value Per Student
Unified School Districts, 1986-87
400000
1
5
0
'0-----1.-&.
4....%
.. .. ..
...._.
0. . 1
50000 100000 150000 200000 250000 300000Assessed Value Per ADMr ($)
350000 400000
Oregon school districts vary in their assessed value per resident student, whichin turn, influences the level of resources available from property tax levies andthe local levy tax rate. For unified districts, the correlation between currentexpenditures per pupil and assessed value per pupil is 0.446. The correlationbetween tax rate and assessed value per pupil is -0.361.
Source: School Finance and Data Infomntion Services, Oregon Departmentof Education, 1986-87 Summary of Valuations and Taxes Levied (March 1987),and Estimated 1986-87 Per Student Current Expenditures (n.d.).
611:Z9
Educational Resources
How are schools and districts staffed?
22201816
Pupils 14Per 12
Teacher 10(Median) 8
6420
22201816
Pupils 14Per 12
Teacher 10(Median) 8
6420
School Characteristics and Resources
Elementary Pupil/Teacher Ratioby Size of School
Oregon, 1984-85 and 1985-86
IE 1 9 8 4-8 5
MI 1 9 8 5-8 6
1 to 20 21 to 40 41 to 60 61 to 101 and All Sizes1 0 0 Above
Average Number of Students Per Grade
High School Pupil/Teacher Ratioby Size of School
Oregon, 1984-85 and 1985-86
]El 1 9 8 4-8 5
IS 1 9 8 5-8 6
1 to 50 51 to 126 to 201 to 301 and All Sizes1 2 5 2 0 0 3 00 Above
Average Number of Students Per Grade
Pupil/teacher ratios in Oregon vary as a function of school size--the smaller the school,tne smaller the ratio (with the exception of larger elementary schools).
Source: School Level Fall Report tabulations (October 1, 1984 and 1985). OregonDepartment of Education.
62Cc,
School Characteristics and Resources
50
45
40
35
w30
25
20
15
10
5
Educational Resources
How are schools and districts staffed?
Percentile Distribution of TeachersPer School District
Percentile Distribution of AdministratorsPer School District
90 100
0 10 20 30 40 50 60Percentile
70 80 90 100
The two figures above illustrate dramatic differences in the size of teaching andadministrative staffs among Oregon school districts. The teaching staff rangesfrom 1 to 2790 (FTE), half of the districts having 24 FTE teachers or less.Administrative staff ranges from 0 to 240 FTE, half having 2.5 FTEadministrators or fewer.
Source: District Fall Report, 1986 (Teachers) and 1984 (Administrators)