DOCUMENT RESUME ED 061 882 HE 002 942 AUTHOR DuVall Charles R.; And Others TITLE Follow-Up study of 1967-1971 Graduates of Indiana University at South Bend. INSTITUTION Indiana Univ., South Bend. School of Education. PUB DATE Mar 72 NOTE 49p. EDRS PRICE MF-$0165 HC-$3.29 DESCRIPTORS *College Graduates; *Curriculum Evaluation; *Evaluation Methods; Graduates; *Graduate Surveys; *Higher Education ABSIRACT The adequacy and effectiveness of an institution of higher education depends on a complex of factors, such as physical facilities, teaching faculty, offered curricula, nature of the student population, and the nature of the community. One often overlooked source of opinion are the graduates themselves, that is perhaps one of the most significant determinants of the adequacy of programs and measures of effectiveness. This study was initiated to determine general background information about all gradaates from Indiana University at South Bend who graduated from 1967 through 1971. Information concerning the graduates, present geographic location, occupation, and general comments and suggestions about the university were sought. Only 44.3% return_was realized; therefore, only tenuous generalizations to the population as a whole or no generalizations at all should be made. (kuthor/HS)
Transcript
DOCUMENT RESUME
ED 061 882 HE 002 942
AUTHOR DuVall Charles R.; And OthersTITLE Follow-Up study of 1967-1971 Graduates of Indiana
University at South Bend.INSTITUTION Indiana Univ., South Bend. School of Education.PUB DATE Mar 72NOTE 49p.
ABSIRACTThe adequacy and effectiveness of an institution of
higher education depends on a complex of factors, such as physicalfacilities, teaching faculty, offered curricula, nature of thestudent population, and the nature of the community. One oftenoverlooked source of opinion are the graduates themselves, that is
perhaps one of the most significant determinants of the adequacy of
programs and measures of effectiveness. This study was initiated todetermine general background information about all gradaates from
Indiana University at South Bend who graduated from 1967 through1971. Information concerning the graduates, present geographiclocation, occupation, and general comments and suggestions about the
university were sought. Only 44.3% return_was realized; therefore,only tenuous generalizations to the population as a whole or nogeneralizations at all should be made. (kuthor/HS)
FOLLOW-UP STUDY OF 1967.1971 GRADUATES
OF INDIANA UNIVERSITY AT SOUTH BEND
by
Charles R. DuVall, Ph.D.Associate Professor of Education
in cooperation with
Albert J. Beutier, Ph.D.Dean of Student Services
and
Ann ChamblinJoi Doi
Linda JorgensonNancy MillsMary Perry
Judy Siefer
AC NOWLEDGMENT
The completIon of a study of this kind
depends upon the assistance and cooperation of
many persons. The investigators wish to thank
the Indiana University Alumni Association and
the former director of alumni activities for
Northern Indiana Mr, Thomas White. Without
the financial assi.ztance provided by the Alumni
Association this study would not have been
possible.
TABLE OF CONTENTS
ChapterPage
I. THE PROBLEM ND DEFINITIONS OF TERMS USED . . 1
Statement of the Problem . OOOOOOO 1
Importance of the Study .. ........ 2
Definitions of Terms Used .. .... 2
Limitations of the Study 1100 0 11* . 3
II. DESIGN AND RATIONALE a . . . . a 5
Instrumentation a p a a *a 90.000 9
III. PRESENTATION OF DATA BOO a ell 0 a a 14
BIBLIOGRAPHY . . . sr a 36
APPENDIX O a tea a tea a a a a . 41
42Appendix A: Cover Letter and Questio a re .
LIST OF TABLES
Table Page
1 Number and Per Cent of Graduates and Respondentsin I.U.S.B. Follow-Up Study, 1967-1971 . . . 15
Number and Per Cent of Respondents, by Sex F omI.U.S,B. Graduating Classes, 1967-1971 . 16
Number and Per Cent of Respondents, by Age RangeFrom I.U.S.B. Graduating Classes 1967-1971 . . 17
Number and Per Cent of Respondents, Classif ed byMarital Status, I.0 S.B. Graduating Classes1967-1971 . 18
Number and Per Cent of Respondents, Classified byPresent Geographic Location, From I.U.S.B. Grad.uating Classes, 1967-1971 . * . 20
Employment Status Repon;ed by Number and Per Centof Respondents, I.U.S.B Graduating Classes,1967-1971 ... 22
Approximate Annual Income, Classified by Numberand Per Cent of Respondents, I.U.S.B. Graduates,1967-1971 . ea ....sees esNumber and Per Cent of Respondents Who IndivatedEmployment in Areas Related to UndergraduatePreparation, I.U.S.B. Graduates, 1967-1971 .
Number and Per Cent of Respondents IndicatingRange of Credit Hours Completed at I.U.S.B.,Graduating ClasPes 1967-1971 . . . 28
10. Number and Per Cent of Respondents Indicating TheyAre Pursuing Graduate Work, I.U.S.B. GraduatingClasses, 1967-1971
Number and Per Cent of Respondeks Their Rating
Table Page
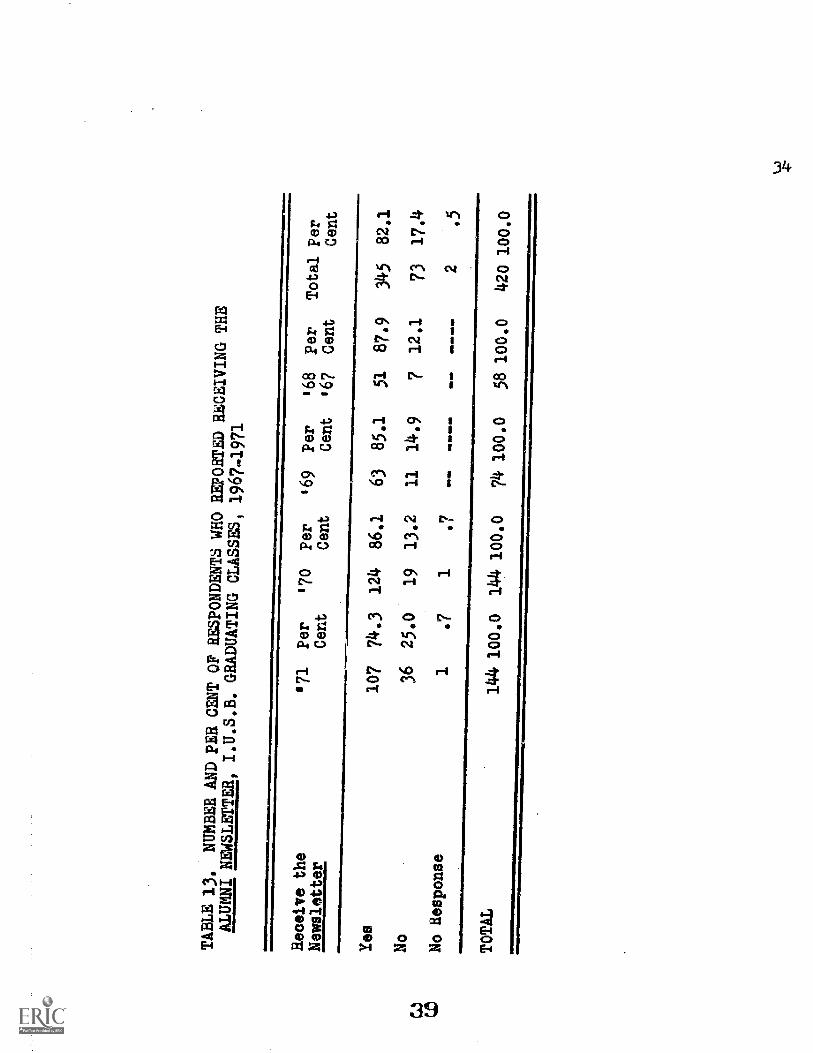
13 Number and Per Cent of Responden s Who Reported
Receiving the Alumni Newsletter I U.S.B. Grad.
uating C1asses7157.1971 e a14 Number and Per Cent of Respondents Who Reported
Reading the Alumni Newsletter I.U.S.B. Grad.
uating Class7477677171-77,. 0.00001 35
1
CHAPTER I
THE PROBLEt AND DEFINITIONS OFIERMS USED
The adequacy and effectiveness of an institution of
higher education depends upon a complexil of factors
nature of the student population, and the nature of the
community, One often overlooked factor is the "final
product" . the graduate. This group is perhaps one of the
most significant determinants of the adequacy of programs
and measures of effectiveness. Colleges should be aware of
the status, adequacy, and success of their product. M
ins itutians periodically survey their graduates on a regular
basIs and use follow-up studies. Such surveys provide a
means for close contact between alumni and the institution
to improve programs of higher learning to aid alumni fund.
raising, and to maintain strong alumni communication with
the institution involved. (57 202-04)*
Statement of the Problem
This study was initiated to determine general back-
Information such as geographic location, occupation, and
general comments and suggestions about the university was
sought. This survey was conducted under the supervision of
the Division of Education, I.U.S.B. , and the Indiana
University Alumni Association.
Importance of the Study
The "newness" of the complete program (i.e degree
grantIng status) at I.U.S.B. makes this study a prototype.
This study was intended, therefore, to be a beginning in
the collection and dissemination of knowledge concerning
the unique character of I.U.S.B.'s graduates. Further, it
is believed that this study will have importance to persons
throughout the Indiana University system
DefInItIons of Terms Used
several terms employed in the description of this
study were defined as follows:
Catharsis. the process of bringing repressedideas into consciousness and thereby deallng with them,more broadly, and expressive reaction (usually emotionalor accompanied by emotion) believed to have some psycho.therapeutic effect. (21:77
glona F rm iuggtlang g arg 111 gdg to § get
bllatia, A plan by which the experiences or statusof people who have left school are investigated or surveyed,either for the purpose of assisting them in further adjust-ment or for securing facts to improve the plan of guidancefor those still in school. (21:233)
Non-respondent. Any recipient of a questionnaire whodoes not reply.
psol Fotm imakeions. Used for intensive s udies orexploration of novel problems. Each answer is a writtendescription_and. much room is usually available for freeresponse. (4:144-45)
uestiqnnaire. A list of planned, written questionsrelated to a particular topic, with space provided forindicating the response to each question, intended forsubmission to a number of persons for reply, commonlyused in survey studies and in the measurement af attitudesand opinions. (21:435)
Emodent, Any recipient of a questionnaire whoactually replies to the questionnaire. (21:466)
Valikta, The extent to which a test or othermeasuring instrument fulfills the purpose for which itis used. . (21'593)
LimItations of the Study
Qne _imi-ing factor which must be considered in any
questionnaire study which utilized the mailed form, is that
of nonresponse or failure to obtain Information from the
respondents, According to Kish, this nonresponse may fall
into a number of categories, any one of which might describe
4
of motivating factors, the nature of the questions.
Most refusals are considered permanent and fit under
the category of "unobtainable."
3. °Incapacity or inability." This preven_s a
response due to physical or mental illness during the
entire study period,
4, "Not found," This may be a large category for
mailed questionnaires, and these respondents are usually
not followed or identified because of the expense
involved.
5. "Lost schedules This would include questionnaires
lost in the mail or des royed, or those in such poor
condition that they cannot be used. (32:533-34)
Another limitation was the nature of the population,
i.e. all I. U. S. S. graduates. Because of the nature of
the institution, its "newness" and the small number of
graduates, the resul s could be skewed.
A follow-up letter should have been utilized to
increase the per cent of responses. Only 44 per cent
return was realized. For this reason only tenuous
generalizations to the population as a whole or no
generalizations at all should be made.
5
CHAPTER II
DESIGN AND RATIONALE
To obtain the desired information a questionnaire was
developed, as was an accompanying cover letter which included
an explanation of the study. According to established pat-
terns found in research, cer ain information, details and
form were included in the design of the cover letter. Such
included items were as follows: the purpose of the study, the
importance of the study to the respondent, the value of the
respondent's reply, and the signatures and titles of the
supervising I.U.S B. educators involved in this particular
study.(6:214-15 ). The cover letter did not mention any
confidential tre tment of the returned information due to
the anonymity of the respondent. A summary of the findings
was promised in a future issue of the I.U.S.B. gag
Newalettgp.(571205) General attractiveness was stressed.
Bold elite type printing was used on good quality white paper
bearing the official letterhead of I.U.S.B. (57:203)
According to Good and Scates, questionnaires constitute
a major, reliable survey instrument for data-gathering in
various survey studies.(23:606) The mailed questionnaire
was used because personal conta t was impossible in many
6
mobility (52:127) end the possIbIlity of some replies being
intomplete or not returned, this technique was still employed
in gathering the data for this study due to its proven general
effectiveness and its relative low cost (13:256)
Concerning the beginning statements about degree area
and major field of study, this Information was requested for
possible correlations drawn between the students' under
graduate major areas of study and their present occupational
field. The year of graduation was included in order to find
the number of years the graduate had been away from the
university, as well as to establish the relationship (per
cent) of returns by graduating class. This was deemed to
be highly essential for an ins itution such as I.U.S.B. which
is growing rapidly.
No identification of respondent was asked as anony .
mity encourages frank and truthful answers (22:193). It was
hoped that a confidential and anonymous qu stionnaire would
result in a higher return of survey forms
In the ordering of questions, items were placed in
a funnel structure, a psychologically and logically sound
sequence with simple interesting, and neutral questions
preceeding more diffi ult, crucial, and personal ones
(55:257) wThis is su cintly presented by Levine and
7
to keep the first few quest±ens imple and easy toanswer, though not trivial pondents tend to bediscouraged when they have to answer difficult orrelatively personal questions in the initial part ofthe questionnaire. Important questions should not beplaced et the very end, especially in long question.naires since fatigue factors lead to omissions anderrors (35:5721
Questions were kept short because brevity was
stressed in research. The question leng h did not exce d
ore than 20 words, w h every word being familiar and
concise, (41 56) thus involving a minimum of the r spondents
time,
Both el sed and open form questions were employed
in the questionnaire The closed form type question,
requiring checked responses, was used to secure categorized
data. These exercised a directive influence in obtaining
responses and facilitated the processing tabblating and
summarizing of the data. Open form questions were used in
order to provide a more concise picture of how the respondent
reacts to various topics. (55:256) The open type question
form was employed in some questions even though it presented
greater difficulty in terms of time and work involved in
tabulating and summarizing. Open form questions may also
produc,. answers that are impossible to tabulate. Despite
its limitations and difficulties in analyzing replies this
Dichotomous questions either "yes-non or true .
falsen) more or less force respondents into taking a
definite stand when they would not do so otherwise. These
were used only where deemed appropriate, with full recoitIon
of their limitations. (23:615, 617)
When wording questions the following ideas, frorn
?extent were taken into account:
Using simple words
Making the questions concIse
Formulating questions to yield exact informatIondesired
Avoiding ambiguous questions
Avoiding leading questions
Deciding as to the use of prestige names
Avoiding "danger" words connoting emotionalism,stereotyping etc
Making allowance for all possible responses
200.01)(42:Designing realistic mult ple.choice alternatIves
Some questions were asked, not only for InformatIon
but also to prepare the respondent for the subject area
because of their general nature, and because these types
questions are expected in any questionnaire. Other questi ns
were included for the purpose of catharsis, or release of
ika 5===t
9
Oppenheim observed that:
The classification questions are a special type offactual question that ask about sex, age, marital status,income, education, occupation, family, the size of family,and so on. These are of special importance in stratifyingthe sample and tend to recur from survey to survey; forboth of these reasons they are worth special attention.(41:57)
Instrumentation
Heading the list of numbered questions were the areas
of gender and marital status. These were necessarily included
for classification of the respondent The answers elicited
from these questions served as tools for interpretation of
answers to the questions which followed. For example, the
fact nat a respondent checked "male" and "married, have
children" had more bearing on the analysis of his responses
to the questions about employment status and educationai back.
ground than if he had checked "male" and "single." Sax
listed as further justification for the inclusion of question
1 that whether a respondent is male or female "may correlate
with student preferences" in the open.ended questions. (48:
218) It was deeided that for this study Sax's justifi ation
could be extended to include the questions about marital
status, as well as p esent age range, and present geographic
location.
10
is a particular age. This question can be clarified by
asking age to nearest birthday, date of birth, or age
ange. (4.150) Since there was no need to know the
respondents exact aEe, the question was st uctured to
determine only age ranges
Questions 5, 6 7, and 11 all pertained to one of the
main concerne of the study-- present occupations of the I. U
B., graduatessif employed. Studying careers can be use .
ul in noting particular aspects such as recruitment patterns
amount of vertical mobility, degree of job security, and
adjustment problems at different stages of careers. (17:
284.85) Such information was thought to be useful to the
I.U.S B. administrators when revIewing data about the school
graduates in relation to their past training and future
prospects. The questions on this subject (i.e. work area)
were grouped accordingly and purposely to give the question .
nalre a semblance of order. (38 245.46) The more general
questions of the set came first followed by the more detailed
and specific ones, thus allowing for a more precise delin.
eation. The categorizing of vocations in question 7 was
an adaptation of a classification system used in the survey
entitled nA Survey Report of Indiana School Dropouts for the
Year 1964.65 This system used as its format the prestige
ii
The division of the categories was exhaustive,
There were no overlappings across major divisionsbetween categories.
The cate oriee provided were mutually exclusive,(28-45.4 )
Hence to avoid the possibility of numerous responses, a
section for further description was provided to the far right
of each multiple choice item of the job classificat on system.
Question 11 was interjected to correlate the graduates'
present occupations to their previous training and education
at the university.
In some instances items dealing with salary may
produce significant positive distortion in a respondent's
answers However, if the conditions of personal threat can
be minimized, then somewhat less distortion may be expected.
(44 5) This question concerning annual salary was considered
necessary and helpful for counseling purposee. It was hoped
that the personal threat would be alleviated, or at least
greatly minimized, by including a salary range and by
guaranteeing the anonymity of the respondent.
Questions 9 aad 10, which requested information about
involvement in an experimental program, provided the oppor .
tunity for the respondent to expound upon his innovations.
It was indicated in studies conducted by other educational
12
Questions 12 through 15 were designed to elicit
specific information concerning school training of the
respondent at I.U.S.B., the amounv and kind of this training,
and the number and per cent of those returning to institutions
of higher education for post-bachelor training. Questions
14 and 15 specifically asked for information from the
graduates which could be used to determine their view of
the effectiveness of their training at I.U.S.B. These
questions would hopefully provide information useful in
improving the institution's programs. A point of reference
is necessary when asking for ratings on questionnaiTes, as
in question 14, thus five different elicitors were provided
from which the respondent was to choose. (44:5) Although
it is possible to use fewer than five elic_tors, generally
speaking a more reliable response is obtained by using more
elicitors. (4:148)
Questions 16. 17, and 18 were recognized to be parts
of a "loaded question" series (48:219) but wer- included
verbatim in the questionnaire at the request of the Alumni
Association, which fundx,i. this study. According to Payne,
in The Azi Askthg uestions, a loaded question is one
which, because of its wording often causes some respondents
to give answers which are different from those they would
16 through 18 were, in the opinion of those who develaped
the instrument, the most leading or "loaded" of any included
in the questionnaire. The question "Do you read the Alumni
Newsletter?" seemed to beg for an admission. Wouldn't those
persons receiving the Newsletter, think they were obligated to
answer "yes?"
Questions 19 and 20 were included in the instrument
for the purpose of catharsis as suggested by Good and
cates. ( 3:618) By providing the respondent with the
opportunity to comment generally about institutional pro-
cedure and courses, he will then feel more important. This
quality of personal importance is to maximize the question-
naire returns, This information may be instrumental in
initiating some changes in he I.U.S.B. programs which might
have otherwise been overlooked. In addition, these open form
questions may d.so elicit information not anticipated when
the instrument was prepared. (35:572)
The responses to these questions were not codi ied and
analyzed in this study. The raw data were provided to the
appropriate officials within the university for their
information, and hopefully for implementation of changes
where necessary and/or possible.
CHAPTER III
ENTATION OF DATA
ata are presented in tabular form for ile
graduating classes of 1967, 1968, 1969, 1970, and 1971.
These tables should be self.explanatory to the reader.
Due to the few number of responses (44.3 per cent) care
must be taken to avoid reaching conclusions that may over.
extend these data. Data are presented "for their own worth"
and the reader may draw his own conclusionsr hopefully with
a great deal of care and even trepidation. However, because
of the nature of the study it is believed that the Aata
are of great interest and should be of some limited sig .
nifioance and value.
Percentages are presented, in most tables as a per
cent of the total responses and not within discipline or
division area, That is, percentages (in most cases) are
addative.
NUMBER AND PER CENT OFGRADUATES AND RESPONDENTS
IN I.UCS,B. FOLLOW-UP
1967-1971
a Area of
ates
671
Per
70
Per
169
Per
'68
Per
Total Per
Cent
Cent
'67
Cent
Cent
Cent
Graduates
151
49.7
124
55.6
61
42.6
51
47.1
387
50.1
Responden
7569
26
24
194
Graduates
132
36.4
104
51.0
8140
.745
66.7
362
45.3
Respondents
4853
33
30
164
Graduates
88
23.9
72
30.6
27
55.6
13
30.8
200
31.0
Respondents
21
22
15
462
Graduates
371
38.8
300
48.0
169
43.6
109
594
944
.3Respolidents
14..
144
7458
420
mot included in study but
presented for informationpurposes
Graduate
33
A ch.
32
A cat ion
102
60
aMAS
1
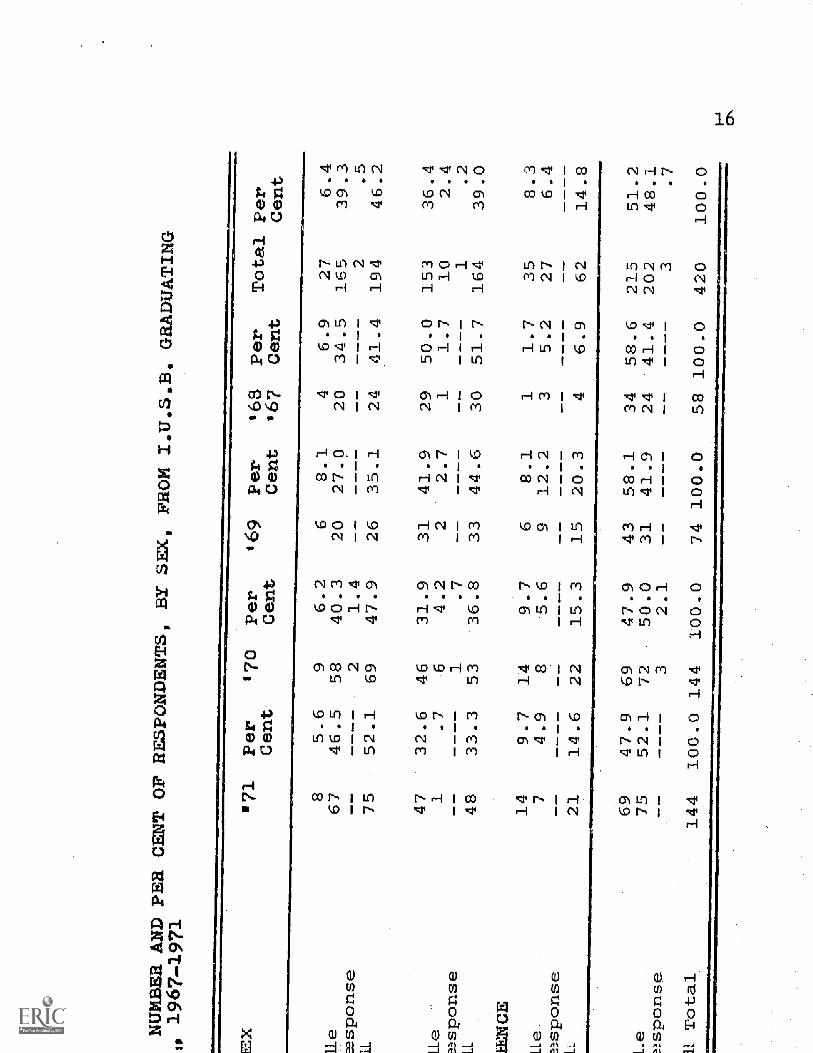
NUMBER AND PER. CENT OPRESPONDENTS, BY SEX, FRON 1.0
1.B. GRADUATING
1967-1971
EX
'71
Per
Cent
70
Per
Cent
'69
Pnt
'68
'67
Per
Cent
Total Per
Cent
85.
69
6.2
68.
1.4
6.9
276.
4Li
e67
46.5
5840
.320
27.9
2034
.516
539
.3ae
spon
se1.
42
.575
52.1
69.
47.9
2635
.124
41.4
194
46.2
4732
.646
31.9
3141
.929
50.0
153
36.4
Lie
1.7
.
64.
22
2.7
11.
710
2.4
spon
se1.
.7__
,__
__1
.2LL
48-
33.3
53-3
6.8
3344
.630
51.7
164
39.0
HE
NC
E1.
49.
714
97
68.
11
1.7
358.
3Le
.7
4.9
85.
69
12.2
35.
227
6.4
nspo
nse
--L
2114
.622
15.3
1520
.34
6.9
62,
14.8
6947
.969
47.9
4358
.134
58.6
215
51.2
Le.
75.5
2.1
7250
.031
41.9
24'4
1.4
202
48.1
nspo
nse
----
32.
13
.7II
Tot
al14
410
0.0
144
100.
074
100.
058
100.
042
010
0 .0
TABLE 34
NUMBER. AND. PER, CENT OF RESP N ENTS,
BY AGE
RA
NG
ES,
FROM I.U.S4B. GRADUATING
CLASSES
107-1971
AGE RANGE
DISCIPLINE
71
Per
Cent
170
Per
Cent
169
Per
Cent
'68
'67
Per
Cent
Total Per
Cent
20-29
Education
48
33.3
45
31-7
1-16
-21-
76-1
=75
-77
121
2 8
8Business
38
26.4
39
27.1
25
33.8
16
27.6
118
28.1
Art
s &
Science
17
11.8
16
11.1
912.2
23.4
44
10.5
30- 9
Education
12
8.3
96.2
22.7
712.1
30
7.1
Business
10
6.9
10
6.9
68.1
11
19.0
37
8.8
Arts & Science
21.4
34.1
51.2
40-49
Education
10
6.9
14
9.7
56.8
46.9
33
7.9
Business
---
32,1
22.7
11.7
61.4
Arts & Science
32.1
42.8
34.1
23.4
12
2.9
50-59
Education
3.5
1.7
4-1
11.7
10
2.4
Business
23.4
2.5
Arts & Science
17
1.2
Totals
Education.
75
52.1
69
47.9
26
35.1
24
41.4
194
46.2
Business
48
33.3
52
36.1
33
44.6
30
51.7
163
38.8
Arts & Science
21
14.6
22
15.3
15
20.3
46.9
62
14.8
No Response
.7"
2
Grand. Total
144
100,0
144
100.0
74
100.0
58
100.0'
420
100.0
TABLE 44
NUMBER. AND ?BR CENT OFRESPONDENTS, CLASSIFIED BY MARITAL STATUS,
GRADUATING CLASSES, 1967.1971
MARITAL STATUS
171
Per
Cent
170
Per
Cent
'69
Per
Cent
'68
'67
Per
Cent
Total Per
Cent
EDUCATION
Single
12
8.3
24
16.7
56.8
11.7
42
10.0
Married - No Children
20
13.9
12
8.3
912.2
46.9
45
10.7
Married - With Children
38
26.4
29
20.1
12
16.2
18
31.0
97
23.1
Separated/Divorced
21.4
1.7
3.7
Widow(er)
32.1
21.4
11.7
61.4
No Response
----
1.7
--
----
1.2
Total
75
52.1
69
47.9
26
35.1
24
41.4
194
46.2
BUSINESS
Single
12
8.3
11
7.6
56.8
712.1
35
8.3
Married - No Children
11
7.6
16
11.1
11
14.9
813.8
46
10.9
Married - With Children
25
17.4
26
18.0
17
23.0
15
25.9
83
19.8
Separated/Ddvorced
le4a(er)
- -No Response
Total
48
33.3
53
36.8
33
44.6
30
51.7
164
39.0
Table 4 ( ontinued)
MARITAL STATUS - Continued
"71
Per
Cent
170
Per
Cent
'69
Per
Cent
'68
'67
Per
Cent
Total Per
Cent
ARTS & SCIENCE
Single
64
25
3.5
34.1
23.4
16
3.8
Married - No Children
96.2
74.9
45.4
20
4.8
Married - With Children
53.5
10
6.9
79.5
23.4
24
5.7
Separated/Divorced
1.7
----
1.2
Widow(er)
---
No Response
11.4
1Total
21
14.6
22
15.3
15
20.3
46.9
62
14.8
TOTAL
Single
30
20.8
40
27.8
13
17.6
10
17.2
93
22.1
Married - No Children
40
27.8
35
24.3
24
32.4
12
20.7
111
26.4
Married - With Children
68
47.2
65
45.1
36
48.6
35
60.3
204
48.6
Separated/Divorced
32.1
1.7
----
41.0
ilidow(er)
32.1
21.4
11.7
61.4
No Response
----
1.7
11.4
2.5
144
100.0
144
100.0
74
100.0
58
100.0
420
100.0
TA
BL
E 5
.N
UM
BE
R A
ND
PE
RC
EN
T O
FR
ESP
ON
DE
NT
S, C
LA
SSIF
IED
BY
PR
ESE
NT
GE
OG
RA
PHIC
LO
CA
TIO
N,
FRO
M I
U.B
GR
AD
UA
TIN
G C
LA
SSE
S,
1967
-197
1
GEOGRAPHIC LOCATION
671
Per
'70
Per
'69
Per
'68
Per
Tot
al P
erC
ent
Cen
tC
ent
167
Cen
tC
ent
ED
UC
AT
ION
St. Joseph County
33
22.9
40
27.8
16
21.6
12
20.7
101
24.0
Surrounding Counties
3423
.621
14.6
68.
16
10.3
6715
.9Other Areas
85.
67
4.9
45.
44
6.9
23
5.5
NO, Response
--
1.7
23.4
3.7
Total
75
52.1
69
47.9
26
35.1
24
41.4
194
4602
BUSINESS.
t. joseph
County
2618
.01.
812
.514
18.9
1424
.172
17.1
Surrounding Counties
139.
018
12.5
912
.23
5.2
4310
.2Other Areas
74.
914
9.7
1013
.512
20.7
4310.2
NO Response
2.1.
4:3
2.1.
.....
11.
76
1.4.
Total
4833
.353
36.8
3344
.630
51.7
164:
39.0
AR
TS
& S
CIE
NC
ESt. Joseph. County
13
9.0
16
11.9
810.8
37
8.8
'Surrounding Counties
42.8
32.1
22.7
23.4
11
2.6
Other Areas
42.8
32.1
56.8
11.7
13
3.1
No Response
__
----
--
----
11.7
1.2
Total.
21
14.6
22
15.3
15
20.3
46.9
62
14.8
Table 5 (continued
GE
OG
RA
PHIC
. LO
CA
TIO
N(C
ontin
ued)
'71
Per
'70
Per
'69
Per
'68
Per
Total Per
Cent
Cent
Cent
'67
Cent
Cent
TOTALS
St. J
osep
h C
ount
y72
50.0
7451
.438
51.3
2644
.821
050
.0Su
rrou
ndin
g C
ount
ies
5135
.442
29.1
1723
.011
19.0
121
28.8
Oth
er A
reas
1913
.224
16.7
1925
.717
29.3
7918
.8N
o R
espo
nse
21.
44
2.8
46.
910
2.4:
Gra
nd T
otal
144
100.
014
410
0.0
7410
0.0
5810
0.0
420
100.
0
TA
BL
E 6.,
EM
PLO
YM
EN
T ST
AT
US R
EPO
RT
ED
BY
NU
MB
ER
AN
D PE
R C
EN
T..O
FG
RA
DU
AT
ING
CL
ASSE
S, 1967.1971O
ND
EN
TS
EM
PLO
YE
DIll
PerC
ent170
PerC
ent169
PerC
ent168167
PerC
entT
otal PerC
ent
ED
UC
AT
ION
Yes
6545.1
6645.8
2432.4
1932.8
17441.4
No**
106.9
32.1
22.7
58 6
204.8
BU
SINE
SS
Yes
4430.5
4833.3
3344.6
2644.8
15135.9
No**
42.8
53.5
46.9
133.1
AR
TS &
SCIE
NC
E
Yes
128.3
1510.4
912.2
35.2
399.3
No**
96.2
74.9
68.1
11.7
235.5
'TO
TA
LS
Yes
12184.0
12989.5
6689.2
4882.8
36486.6
No**
2316.0
1510.4
810.8
1017.2
5613.3
** IncludesR
esponse" Items
TABLE 7.,
APPROXIMATE. ANNUAL INC 11'1 CLASSIFIED BY
NUMBER AND PER CENT OF R. "PONDENTS
GRADUATES
1967.1971
INCOME RANGE
.111
...01
'71
Per
Cent
"70
Per
Cent
"69
Per
Cent
"68
"67
Per
Cent
Total Per
Cent
EDUCATION
Does Not Apply
912.0
34.3
27.7
312.5
17
8.8
Under $5,000
11
14.7
22.9
--
14 2
14
7.2
$5,000 - $9,999
48
64 0
63
91.3
24
92.3
19
79.2
154
79.3
$10,000 - $14,999
45.3
14.2
52.6
$15,000 - $19,999
----
11.4
1.5
No Response
34.0
--
31.5
Total
75
100.0
69
99.9
26
100.0
24
100.1
194
99.9
Table 7 (oontinued)
INCOME RANGE
'71
Per
Cent
'70
Per
Cent
'69
Per
Cent
'68
'67
Per
Cent
Total Per
Cent
BUSINESS
Does Not Apply
510.4
59.4
13.0
516.7
16
9.8
Under $5 000
24.2
47.5
26.1
4.9
$5,000 - $9,999
28
58.3
27
50.9
10
30.3
516.7
70
42.7
$10,000 - $14,999
816.7
14
26 4
16
48.5
11
36.7
929.9
$15,000 - $19,999
48.3
23.8
39.1
620.0
59.2
$20 000 - $24,999
11.9
13.3
21.2
$25,000 and above
13.0
26.7
i3
No Response
12.1
-1
.6
Total
48
100.0
53
99 9
33
100.0
30
100.1
164
100.1
Table 7 (continued)
INCOME RANGE
411
Per
Cent
'70
Per
Cent
'69
Per
Cent
'66
'67
Per
Cent
Total Per
Cent
ARTS & SCIENCE
Does Not Apply
838.1
627.3
320.0
250.0
19
30.6
Under $5,000
523.8
836.4
213.3
125.0
16
25.8
$5,000 - $9,999
523.8
627.3
533.3
125.0
17
27.4
$10,000 - $141999
14.2
29.1
320.0
69.7
$15,000 - $19/999
14.8
--
----
-1
1.6
No Respcnse
14.8
--
13.3
34.8
Total
21
100.1
22
100.1
15
99.9
4100.0
62
99.9
Table 7 (continued
INCOME RANGE
611
P Cent
'70
Per
Cent
'69
Per
Cent
'68
'67
Per
Cent
Total Per
Cent
TOTALS
Does Not Apply
22
15.3
14
9.7
68 1
10
17.2
52
12.4
Under. $5,000
18
12.5
14
9.7
45.4
23.4
39
9.0
$5,000 - $9,999
81
56.2
96
66.6
39
52.7
25
43.1
241
57.4
$10,000 - $14,999
13
9.0
16
11.1
19
25.7
12
20.7
60
14.3
$15,000 - $19,999
53.5
32.1
34.1
610.3
17
4.0
$20,000.
$24,999
1.7
-1
1.7
2.5
$25,00 and above
11.4
23.4
3.7
'No Response
53.5
--
22.7
71.7
Totals
144
100.0
144
99.9
74
100.1
58
99.8
420
100.0
TA
BL
E 8
,N
UM
BE
R A
ND
PE
R C
EN
T O
F R
ESP
ON
DE
NT
S W
HO
IN
DIC
AT
ED
EM
PLO
YM
EN
T I
N A
RE
AS,
RE
LA
TE
D T
O U
ND
ER
GR
AD
UA
TE
PR
EPA
RA
TIO
N,
GR
AD
UA
TE
S,
1967
.197
1
EM
PLO
YM
EN
T I
N A
RE
Ag7
1Pe
rC
ent
170
Per
Cen
t,6
9Pe
rC
ent
'68
067
Per
Cen
tT
otal
Per Cen
tE
DU
CA
TIO
NY
es49
34.0
5538
.222
29.7
1831
.014
434
3N
o19
13.2
139.
02
2.7
23.
436
8.6
Doe
sN
ot A
pp1y
74.
91
.72
2.7
46.
914
3.3
BU
S IN
ESS
Yes
2718
.739
27.1
2027
.018
31.0
104
24.8
No
139.
08
5.6
1013
.59
15.5
409.
5D
oes
Not
App
ly8
5.6
64.
23
4.1
35.
220
4.8
AR
TS
- SC
IEN
CE
Yes
32.
18
5.6
34.
11
1.7
153.
6N
o9
6.2
74.
96
8.1
11.
723
5.5
Doe
sN
ot A
pply
.9
6.2
74.
96
8.1
23.
424
5.7
TO
TA
LS
Yes
7954
,810
270
.845
60.8
3763
.826
362
.6N
o41
28.5
2819
.418
24.3
1220
.799
23.6
Doe
sN
ot A
pply
2416
.714
9.7
1114
.99
15.5
5813
.8G
rand
Tot
al14
410
0.0
144
99.9
7410
0.0
5810
0.0
420
100.
0
TABLE
9.NUMBER AND PER CENT OF
RESPONDENTS INDICATING RANGEOF CREDIT H URS
COMPLSTED AT I.U.S.B.
GRADUATING CLASSES
1967-1971
RANGE OF CREDIT HOURS
671
13 Cent
'70
Per
Cent
'69
Per
Cent
168
167
Per
Cen
tTotal Per
Cent
EDUCATION
- 3G
53.
53
2.1
22
72
3.4
122.
931
- 6
06
4.2
96.
22
2.7
46.
921
5.0
61. -
90
1913
.212
8.3
68.
12
3.4
399.
391 p1us
4430
.544
30.5
1621
.615
25.9
119
28.3
No Response
1.7
1.7
----
-1
1.7
3.7
BUSINESS
32.
17
4.9
34.
14
6.9
174.
01.
3031
- 6
0.4
2.8
21.
43
4.1
11.
710
2.4
6190
128.
314
9.7
912
.24
6.9
399.
391. p1us
2819
.430
20.8
1824
.321
36.2
9723
.1No Response
1.7
--1
.2.ARTS &SCIENCE,
21.
42
2.7
1.7
51
21
- 30
31 -
60
____
_2
1.4
----
--2
.561
- 9
07
4.9
53.
54
5,4
11.7
174.
091
plu
s11
7.6
1510
.49
12.2
3.4
378.
8No Response
1.7
.2
Table 9
( on inued)
RANGE OF CREDIT HOURS
671
Per
/70
Per
'69
Per
168
Per
Total Per
Cent
Cent
Cent
'67
Cent
Cent
TOTALS
1 - 30
10
6.9
10
6.9
79.5
712.1
34
8.1
31 - 60
10
6.9
13
9.0
56.8
58.6
33
7.9
61 - 90
38
26.4
31
21.5
19
25.7
712.1
95
22.6
91 plus
83
57.6
89
61.8
43
58.1
38
65.5
253
60.2
No Response
32.1
1.7
11.7
51.2
Grand Total
144
99.9
144
99.9
74
100.1
58
100.0
420
100.0
CJ
TABLE 10,
NUMBER AND PER CENT
OF RESPONDENTS
INDICATING THEY AREPURSUING GRADUATE
WORK, I,U,S.B, GRADUATING
CLASSES, 1967.1971
GRADUATE WORK
'71
Per
Cent
'70
Per
Cent
'69
Per
Cent
'68
'67
Per
Cent
Total Per
Cent
EDUCATION
Yes,
28
19.4
28
19.4
23
31.1
22
37.9
101
24.0
No
47
32.6
41
28.5
34.1
23.4
93
22.1
No Response
BUSINESS
Yes
21.4
64.2
56.8
11
19.0
24
5.7
No
46
31.9
46
31.9
27
36.5
19
32.8
138
32.8
No Response
----
1.7
11.4
--
----
2.5
ARTS & SCIENCE
Yes
10
6.9
10
6.9
810.8
23.4
30
7.1
No
10
6.9
12
8.3
68.1
23.4
30
7.1
No Response
1.7
--
11.4
--
2.5
TO. ALS
' Yes
40
27.8
44
30.5
36
48.6
35
60.3
155
36.9
No
103
71.5
99
68.7
36
48.6
23
39.7
261
62.1
No Response
1.7
1.7
22.7
--
----
41.0
Grand Total
144
100.0
144
99.9
74
99.9
58
100.0
420
100.0
TABLE 11.
NUMBER AND PER, CENTOFRESPONDENTS0 THEIR RATING (DEGREE OFSATISFACTION)9
NUMBER AND PER CENT OF RESPONDENTSWHO REPORTED READING THE
ALUMNI NEWSLETTER, I.U.S.B.
GRADUATING CLASSES, 1967-1971
Head the
Newsletter
'71
Per
Cent
'70
Per
Cent
'69
Per
Cent
'68
167
Per
Cent
Total Per
Cent
110
76.3
116
80.5
60
81.1
43
77.6
331
78.8
No
26
18.0
21
14.6
11
14.9
11
19.0
69
16.4
No Response
85.6
74.9
34.1
23,4
20
4,8
TOTAL
144
100.0
144
100.0
74
100.0
58100,0
420
100.0
36
BIBLIOGRAPHY
1. Allen, Irving L., "Detecting Respondents who Take andConfuse Information About Question Areas on Surveys,"Journal of Applied Psychology 50:523-8, December,1966.
2. Alutto, Joseph A., "Some Dynamics of QuestionnaireCompletion and Return Among Professional andManagerial Personnel: The Relative Impacts ofReception at Work Site or Place of Residence,"Journal of APPlied Psyphology 54:430-2, October, 1970.
Benson, Frank T., "The General College Five-to-TenYearFollow-up Study," Educational Resource informationCenter (ERIC), ED 031 232.
Best, John W., Research in Educe ion, Prentice-Hall, Inc.Englewood Cliffs, New Jersey, 1959, 320 pp.
Bodnarchuk, Steve, "improve Through Follow-up," Clearino:House 43:30-2, September, 1968.
6. Borg, Walter R., Educational Research, An IntroductIon,David McKay Company, Inc., New York, 1963, 457 pp.
7. Cary, William Martin, "A Study of Mail CommunicationStrategies and Response Characteristics AssociatedWith the Obtaining of Evaluative Feedback FromSelected Secondary School Graduates," DissertationAbstracts 31:2036-A, November, 1970.
Cook, Desmond L., "Hawthorne Effect and EducationalResearch," School and Society 96:40, January 20, 1968.
9. Cope, H. G., "Nonrespense in Survey Research as aFunction of Psychological Characteristics and Time ofResponses," Journal of Experimental Education 36:32-5,Spring, 1968.
10. Cyphert Frederick R., and Gant, Walter L., "The DelphiTechLque: A Tool for Collecting Opinions in TeacherEducation," The Journal of Teacher Educaton 21:417-25Fall 1970.
11. Davison, Mildred, "Career Graduates: A Profile of JobExperience and Further Study of Students With AASDegrees," Educational Resource Information Center(ERIC), ED 028 295.
37
a2. Deming, W. E., "On Errors in Surveys," AmericanSociological Review 9:359-69, August, 1944.
13. Droege Robert C., and Crambert, Albert C., "Follow-upTechniques in a Large-Scale Test Validation Study,'Journal of Applied Psychology 49:253-6, August,1965.
14. Ebel, Robert L., editor, Enexclopedia of EducationalResearch, The MacMillan Company, New York, 1969.
15. Eckland, Bruce K., "Effects of Prodding to IncreaseMailback Returns," Journal of Applied PsychologY49:165-9, June, 1965.
16. Festinger, Leon, and Katz, Daniel, Research Methodsin the Behavioral Sciences, Holt, Rinehart, andWinston, New York, 1953, 660 pp.
17. Form, William H., and Miller, Delbert C., Occu ationalCareer LatIarna as a Sociological Instrument, Harperand Brothers, New York, 1951, 546 pp.
18. Franzen, H., "rhe Construction of a Questionnaire,"Mftrket Research pp. 17-19, May, 1936.
19. Galfo, Armand J., and Miller, Earl, Interpretingfg=BIA2na1 Research, William Brown Company, Inc.,Dubuque, Iowa, 1965, 369 pp.
20. Gerberich, J. B., and Mason, J. M., "Signed vs.Unsigned Questionnaires," Journal of EducationalResearch 42:122-6, October, 1948.
21. Good, Carter V., Dictionary of Education, SecondEdition, McGraw-Hill Book Company, Inc., New York,1959, 676 pp.
22, IgmtL2r1,21 Hase_proh, Appletc.n-C n u y-Crofts, Inc.New York, 1959, 424 pp.
0 and Scates, Douglas E., Methods of Research, Apple on-Century-Crofts, Inc., New York, 1954, 920 pp.
24. "Graduate Follow-up Study 1948-1966," Hagerstown JuniorCollege, Maryland, EducatiOn 1 Research InformationCenter (ERIC), ED 018 203.
42
38
25. Grieve, Donald E., "Follow-up of Career GraduatesCurrently Employed," Cuyahoga Community College,Cleveland, Ohio, Educational Research InformationCenter (ERIC), ED 038 965.
26. Harris, C. 4., editor, Encyclopedia of EducationalResearch, The MacMillan Company, New York, 1960.
27. Hillway, Tyrus, Handbook of Eaucational liggEax2h,Houghton Mifflin Co., Boston, 1969, 117 pp.
28. Holland, J. L., "A Psychological Classification Schemefor Vocations and Major Fields," in VocationalBehavior, pp. 43-56, edited by D. G. Zytowski, Holt,Rinehart, and Winston, Inc., New York, 1968.
29. Hunter, J. Scott, "Turnover Among Beginning Teachers-A Follow-up," School Life 44:22-4, April, 1962.
30. Isaacson, Lee E., Career information in Counseling andTeaching, Allyn and Bacon, Inc. Boston, 1966,357 PP.
31. Kerlinger, Fred N., "The Mythology of EducationalResearch: The Descriptive Approach," School andSociety 93:222-5, April 3, 1965.
32. Kish, Leslie, Surve §-Ampling, John Wiley & So s, Inc.,New York, 1965, 369 pp.
33. K ein, Stuart M., Maher, John R., and Dunnington,Richard A., "Differences Between Identified andAnonymous Subjects in Responding to an IndustrialOpinion Survey," Journal of Applied PsychologY51:152-60, April, 1967,
34. Leslie, Larry L., "Increasing Response Rate to LongQuestionnaires," Journal of Educational Research63:347-50, April, 1970.
35. Levine, Sol, and Gordon, Gerald, "Maximizing Returnson Mail Questionnaires," k21.211 Opinion QuarterlY22:568-75, 1958.
36. Lloyd, Betty Jane, "Questionnaire Portrait of theFreshman Co-ed: After College What?" NationalAssociation of Womenis Dean and Counselors Journal29:159-62, Summer, 1966.
43
McAshan, Hildreth Hake, Elements of EducationalResearch, McGraw-Hill Book Company, Inc., New York,1963, 208 pp.
38. Mouly, George J., The Science of Educational Hesea ch,American Book Company, New Yor177-1-9777476 PP.
40. Nixon, John E., The Mechanics of QuestionnaireConstruction," Journal of Educctional Research47:481-7, March, 1954.
41, Oppenheim, A. N., uestionnaire Design and AttitudeMeasurement, Basic Books, Inc., New York,298 pp.
42. Parten, Mildred, Surveys, Polls, and Samples: PracticalProcedures, Harper and_ Brothers, New York, 1950,624 pp.
43. Payne, Stanley LeBaren, The Art of Asking gaestions,Princeton University Press, Princeton, :=ew Jersey,1951. 237 pp.
44. Perrucci, Carolyn Cummings, and LeBold, William K."Employment," A Report on the Purdue Universit,Engineering and 3cience Graduate, 1957, 10 pp.
45. Pruitt, Rolla F., Shertzer, Bruce, and Clardy, Fay,Survey Re ort of Indiana School Dropouts for theYear 19_ 5, Indiana State Department ofrilblicInstruction, Bulletin No. 254, Indianapolis, Indiana,January, 1967.
46. Putnam, John F., "Toward Improved Information AboutPupils," School Life 44:23-5, January-February, 1962.
47. Robinson, John P., and Shaver, Phillip H., Measuresof Social Psychological Attitudes, Survey ResearchCenter, Institute for Social Research, University ofMichigan, Ann Arbor, Michigan, August, 1970.
48. Sax, Gilbert, Empirical Foundations of EducationalResearch, Prentice-Hall, Inc., Englewood Cliffs,New Jersey, 1968, 443 pp.
44
40
49. Scates Douglas E., "Analysis of a ProfessionalOrganization: The American Educational ResearchAssociation in 1948," Growing Points in EducationalKt22.azah: Official Aeport of the A.E.R.A pp.111-42,Oashington, 1949.
50, and Yeomans, Alice V., The Effect of QuestionagIntForm on Course Reiluest§ of Employed Adults, AmericanCouncil on Education, Washington, 1950, 398 pp.
51. Shannon, J, R., "Percentages of Returns of Questionnairesin Reputable Educational Research," Journal ofEducational Research 42:138-41, OeteRs7.7-1W7
52. Snelling, W. Redman, "Impact of a Personalized MailQuestionnaire," Journal of Edu ational Research63:126-9, November, 1969.
53. "S andards for Statistical Surveys," Exhibit A.,Circular No. A-46, Executive Office of the President,Bureau of the Budget, Washington, March 28, 1952,463 pp.
54. Travers, Robert M., An Introduction to EducationalResearch, The MacMillan Company, New York, 1964
55. VanDalen, Deobold B., Understanding EducationalResearch, McGraw-Hill Book Company, New York,1962, 492 pp.
Wells, Jean A., and Wool, Muriel B., "College WomenSeven Years After Graduation (Class of '57),"Educational Research Information ;-,enter (ERIC),ED 015 277.
57. Young, Pauline V., Scientiio SocIal Surveys _andResearch, Frentice-Hall, Inc., Englewood Cliffs,New Jersey, 1966, 576 pp.
45
41
APPENDIX
46
INDIANA UNIVERSITY at SOUTH BENDl 2 5 NORTHSIDE BOULEVARD
SOUTH HE.ND INDIANA 466151820
1970
April 19, 1971
Dear I.U.S.B. Graduate:
TEL- MIX 2 1 9-2 II 2, 21 4 1
Enclosed you will find a questionnaire designed to determine general back-ground information about all I.U.S.B. graduates. It should be mentionedfrom the outset that your participation in this research project is mostappreciated. This survey has been developed by the I.U.S.B. DI -ision ofEducation with the cooperation of the Indiana University Alumni Association.Your help is needed in determining where the graduates of I.U.S.B. are nowliving and what their present occupations are. Also, any suggestions andcomments about your reflections of the university are most welcomed.
To determine these conditions, it is requested that you fill out the en-closed questionnaire, responding to all questions that are pertinent andrelative to you.
Your participation and support in completing the survey torm and return-ing it at you earliest convenience to the Indiana University Alumni Asso-ciation at South Bend will be greatly appreciated. Results of this sur-vey will be distributed upon its completion through the I.U.S.B. AlumniNewsletter.
Cordially,
ife ,c4 azteCharles R. DuVallEducational Research
Albert J. BeutlerDean of Student Services
CRD/jed
9 23..71
Dear '71 Grad:
We used this last fall to "findout" abOut our other graduates. Wedecided that we would like to includethe data from your class In the study.
Won't you help us by completingthe enclosed questionnaire at yourearliest convenience and returning itto us?
Tha nks
43
Bachelors degree area & major Year of graduation(e.g., B. S., Education, Biology
Sex: __malefemale
3. Present age range: 20-2930-3940-49
60 & above
5. Are you presently employed? _____*fes
2. Marital Status* __singlemarried, no children
__married & have children__separated or divorced
widowed
Present geographic location(City and state):
full-time
part-time
6. Are you presently seeking employment? yes
7. Employment status (Check area(s) and further describe your position at the right);