DOCUMENT RESUME ED 073 169 TM 002 419 AUTHOR Brozovich, Richard; And Others TITLE Development of a Scale to Evaluate Cognitive Styles and Abilities. Final Report. INSTITUTION Oakland County Schools, Pontiac, Mich. SPONS AGENCY National Center for Educational Research and Development (DREW /OE), Washington, D.C. Regional Research program. BUREAU NO BR-1-E-037 PUB CATE Aug 72 GRANT OEG -5--71 -0029 (509) NOTE 37p. EDRS PRICE MF-$0.65 HC-$3.29 DESCRIPTORS Age Differences; Cognitive Ability; Cognitive Development; Cognitive Measurement; *Cognitive Tests; *Evaluation Methods; Item Analysis; *Nonverbal Tests; Norms; Preschool Children; Primary Grades; *Rating Scales; Sex Differences; Socioeconomic Status; Technical Reports ABSTRACT A study was conducted to: (1) provide normative data for the Erozovich-Hall Watson (BHW) scale, a non-verbal method of assessing cognitive style; (2) provide data for itwm revision and further refinement of the BHW; and (3) assess the effects of grade level (age), sex and socioeconomic status on cognitive style. The BHW was administered to 621 children ranging in grade level from preschoolers less than 4 1/2 years old to third graders. Socioeconomic level and sex were balanced at each grade level. Grade level proved the most consistent and powerful factor related to cognitive style. Results were generally consistent with previous research, indicating, for example, a decrease in use of color as a grouping category with increased grade level. Sex and socioeconomic level interacted significantly with grade level in their effects related to cognitive style, but neither produced consistent effects on cognitive style independent of grade level. Item analysis indicated a need to revise approximately 25% of the items. The BHW appears capable of assessing aspects of cognitive style among non-verbal populations. Plans and recommendations include: (1) revision of the BHW; (2) assessment of verbally impaired populations; (3) direct comparison of BHW scores to other cognitive style assessment procedures; (4) studying the relationship of BHW scores to intelligence, achievement and personality variables; and (5) evaluating the relationships between individual cognitive style and teaching-learning envir.:snments. (Author/KM)
Transcript
DOCUMENT RESUME
ED 073 169 TM 002 419
AUTHOR Brozovich, Richard; And OthersTITLE Development of a Scale to Evaluate Cognitive Styles
and Abilities. Final Report.INSTITUTION Oakland County Schools, Pontiac, Mich.SPONS AGENCY National Center for Educational Research and
Development (DREW /OE), Washington, D.C. RegionalResearch program.
BUREAU NO BR-1-E-037PUB CATE Aug 72GRANT OEG -5--71 -0029 (509)NOTE 37p.
EDRS PRICE MF-$0.65 HC-$3.29DESCRIPTORS Age Differences; Cognitive Ability; Cognitive
ABSTRACTA study was conducted to: (1) provide normative data
for the Erozovich-Hall Watson (BHW) scale, a non-verbal method ofassessing cognitive style; (2) provide data for itwm revision andfurther refinement of the BHW; and (3) assess the effects of gradelevel (age), sex and socioeconomic status on cognitive style. The BHWwas administered to 621 children ranging in grade level frompreschoolers less than 4 1/2 years old to third graders.Socioeconomic level and sex were balanced at each grade level. Gradelevel proved the most consistent and powerful factor related tocognitive style. Results were generally consistent with previousresearch, indicating, for example, a decrease in use of color as agrouping category with increased grade level. Sex and socioeconomiclevel interacted significantly with grade level in their effectsrelated to cognitive style, but neither produced consistent effectson cognitive style independent of grade level. Item analysisindicated a need to revise approximately 25% of the items. The BHWappears capable of assessing aspects of cognitive style amongnon-verbal populations. Plans and recommendations include: (1)revision of the BHW; (2) assessment of verbally impaired populations;(3) direct comparison of BHW scores to other cognitive styleassessment procedures; (4) studying the relationship of BHW scores tointelligence, achievement and personality variables; and (5)evaluating the relationships between individual cognitive style andteaching-learning envir.:snments. (Author/KM)
U S DEPARTMENT OF HEALTH.EDUCATION 18 WELFAREOFFICE OF EDUCATION
THIS DOCUMENT HAS BEEN REPRO-DUCED EXACTLY AS RECEIVED FROMTHE PERSON OR ORGANIZATION ORIGMATING IT POINTS OF VIEW OR OPINIONS STATED DO NOT NECESSARILYREPRESENT OFFICIAL OFFICE OF EOUCATION POSITION OR POLICY
FINAL REPORT3-0 Project No. 1-E-037
Grant No. OEG -5 -71- 0029(509)
DEVELOPMENT OF A SCALE TO EVALUATECOGNITIVE STYLES AND ABILITIES
Richard Brozovich, Leon P. Halland Richard Watson
Oakland Schools2100 Pontiac Lake RoadPontiac, Michigan
August 1972
U.S. DEPARTMENT uFHEALTH, EDUCATION, AND WELFARE
Office of EducationBureau of Research
FINAL REPORT
Project No. 1-E-037Grant No. 0EG-5-71-0029(509)
DEVELOPMENT OF A SCALE Ti) EVALUATECOGNITIVE STYLES AND ABILITIES
Richard Brozovich, Leon P. Halland Richard Watson
Oakland Schools
Pontiac, Michigan
August 1972
The research reported herein was performed pursuant to a grant(grant or contract)
with the Office of Education, U.S. Department of Health, Education, and
Welfare. Contractors undertaking such projects under Government sponsor-ship are encouraged to express freely their professional judgment in theconduct of the project. Points of view or opinions stated do not, there-fore, necessarily represent official Office of Education position orpolicy.
U.S. DEPARTMENT OFHEALTH, EDUCATION, AND WELFARE
Office of EducationBureau of Research
TABLE OF CONTENTS
PageAcknowledgements iv
Summary
Introduction 1
Methods 6
Results 8
Conclusions and Recommendations 29
References 31
TABLES
I Analysis of Variance for Scores on the Color vs.Form Subtest 8
II Mean Number of Color Choices for Various Sub-groupson the Color vs. Form Subtest 9
III Analysis of Variance for Scores on the Color vs.117C Subtest 10
IV Mean Number of Color Choices for Various Sub-groupson the Color vs. R -C Subtest 11
V Analysis of Variance for Scores on the Color vs.I-C Subtest 12
VI Mean Number of Color Choices for Various Sub-groupson the Color vs. I-C Subtest 12
VII Analysis of Variance for Scores on the Form vs.R -C Subtest 13
VIII Mean Number of Form Choices for Various Sub-groupson the Form vs. R-C Subtest 14
IX Analysis of Variance for Scores on the Form vs.I-C Pubtest 15
X Mean Number of Color Choices for Various Sub-groupson the Form vs. I-C Subtest 15
XI Analygis of Variance for Scores on the I-C vs.R-C Subtest. 17
XII Mean Number of. I-C Choices for Various Sub-groupson the I-C Subtest 17
XIII Response Percentages on Sub-parts of the BHW as aFunction of Grade Level 19
XIV Profile Patterns on twa BRW for Three First Grade,Upper Middle Class Subjer:ts 22
ii
FIGURES
Page1 Response Percentages on Sub-parts of the BHW as a
Function of Grade Level 202 Response Percentages on Sub-parts of the BHW for
Children from Three Classrooms: Educable Retarded,Perceptual Development and Regular Third Grade 21
3 Characteristics of Two Items from the Color vs.Form Subtest 24
4 Characteristics of Two Items from the Color vs.R-C Subtest 25
5 Characteristics of Two Items from the Color vs.I-C Subtest 26
6 Characteristics of Two Items from the Form vs.R-C Subtest 27
7 Characteristics of Two Items from the Form vs.I-C Subtest 28
iii
ACKNOWLEDGMENTS
The authors express their appreciation for the efforts of theresearch assistants, Mr. Kenneth Brehmer, Ms. Diane Brozovich,Ms. Paris Finner, Ms. Janet Kuhfeldt, Ms. Shirley Londeck, Mr. TimothyMartin and Ms. Rita Victor in gathering the data that made this reportpossible.
Ms. Veda Schmidt helped organize the final report and wasresponsible for typing the final manuscript.
Dr. Loyal Joos assisted in analysis of the data through theapplication of computer technology.
Dr. Barry Breidenbaugh, Dr. Lois Lewis and Mr. James Porterassisted in developing the items for the BHW.
Due to their large number, the principals, supervisors andteachers who graciously allowed us to use their students andbuildings could not be acknowledged individually. Without thesplendid cooperation of these persons this study could not havebeen completed.
iv
11.111111-
SUMMARY
The major objectives of this study were: 1) to provide normativedata for the BHW, a non-verbal method of assessing cognitive style,2) to provide data for item revision and further refinement of theBHW, 3) to assess the effects of grade level (age), sex and socio-economic status on cognitive style.
The BHW was administered to 621 children ranging in grade levelfrom young preschoolers (less than 41/2 years old) to third graders.The socioeconomic level and sex of the children at each grade levelwere balanced.
Oracle level. proved the most consistent and powerful factor relatedto cognitive style. Results from the BHW were generally consistentwith previous research, indicating for example a decrease in use ofcolor as a grouping category with increased grade level. Both sexand socioeconomic level entered into significant interactions withgrade level in their effects related to cognitive style. Neither sexnor socioeconomic level produced consistent effects on cognitive styleindependent of grade level.
Item analysis was conducted and results indicated a need to reviseapproximately 25% of the items throughout the scale.
Overall the results were encouraging. The BHW appears capableof assessing aspects of cognitive style among non-verbal populations.It yields results generally consistent with theory and results obtainedwith other measures of cognitive style. Further plans and recommendationsinclude: 1) revision of the BHW, 2) assessment of verbally impairedpopulations, 3) direct comparison of BHW scores to other cognitivestyle assessment procedures, 4) studying the relationship of BHW scoresto intelligence, achievement and personality variables, 5) evaluatingthe relationships between individual congitive style and teaching-learning environments.
INTRODUCTION
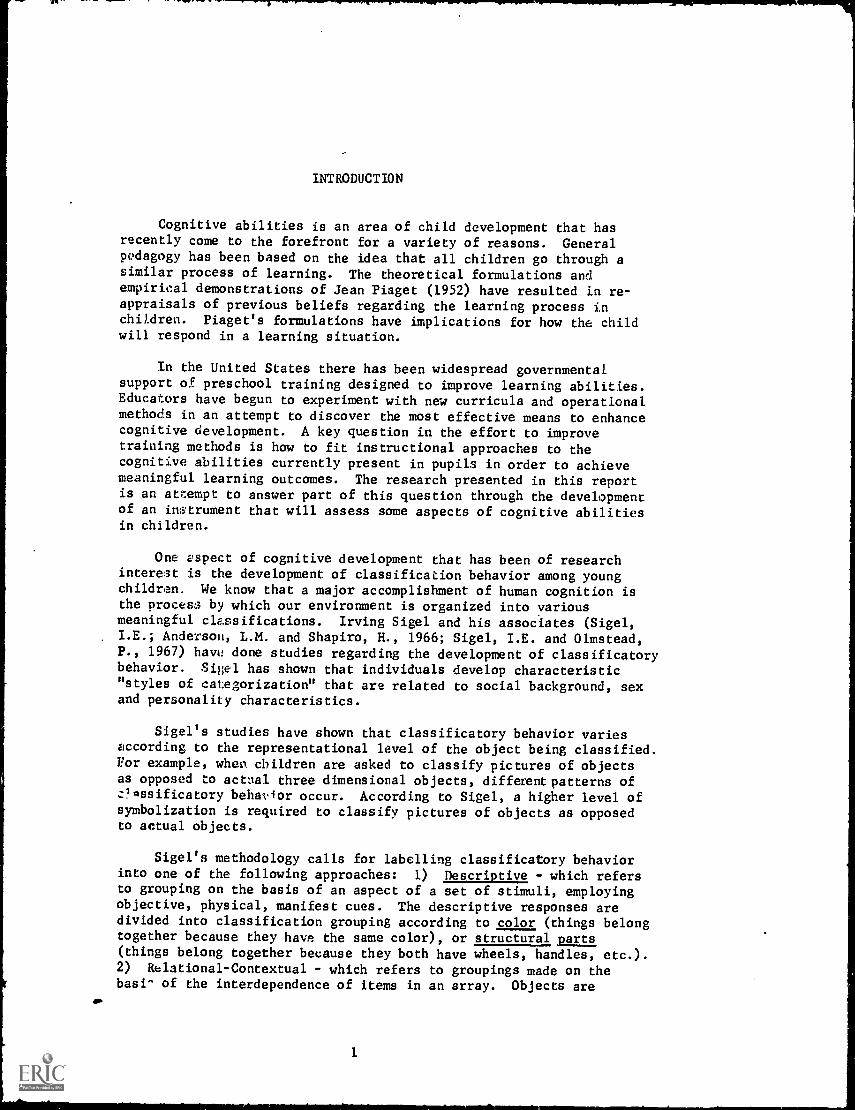
Cognitive abilities is an area of child development that hasrecently come to the forefront for a variety of reasons. Generalpedagogy has been based on the idea that all children go through asimilar process of learning. The theoretical formulations andempirical demonstrations of Jean Piaget (1952) have resulted in re-appraisals of previous beliefs regarding the learning process inchildren. Piaget's formulations have implications for how the childwill respond in a learning situation.
In the United States there has been widespread governmentalsupport of preschool training designed to improve learning abilities.Educators have begun to experiment with new curricula and operationalmethods in an attempt to discover the most effective means to enhancecognitive development. A key question in the effort to improvetraining methods is how to fit instructional approaches to thecognitive abilities currently present in pupils in order to achievemeaningful learning outcomes. The research presented in this reportis an attempt to answer part of this question through the developmentof an instrument that will assess some aspects of cognitive abilitiesin children.
One aspect of cognitive development that has been of researchinterest is the development of classification behavior among youngchildren. We know that a major accomplishment of human cognition isthe process by which our environment is organized into variousmeaningful classifications. Irving Sigel and his associates (Sigel,I.E.; Anderson, L.M. and Shapiro, H., 1966; Sigel, I.E. and Olmstead,P., 1967) have done studies regarding the development of classificatorybehavior. Sigel has shown that individuals develop characteristic"styles of categorization" that are related to social background, sexand personality characteristics.
Sigel's studies have shown that classificatory behavior variesaccording to the representational level of the object being classified.For example, when children are asked to classify pictures of objectsas opposed to actual three dimensional objects, different patterns of.7.1assificatory behavior occur. According to Sigel, a higher level ofsymbolization is required to classify pictures of objects as opposedto actual objects.
Sigel's methodology calls for labelling classificatory behaviorinto one of the following approaches: I) Descriptive - which refersto grouping on the basis of an aspect of a set of stimuli, employingobjective, physical, manifest cues. The descriptive responses aredivided into classification grouping according to color (things belongtogether because they have the same color), or structural parts(things belong together because they both have wheels, handles, etc.).2) Relational-Contextual - which refers to groupings made on thebasi- of the interdependence of items in an array. Objects are
1
related by virtue of use, for example, "you use a spoon to stircoffee." Also included in this category are objects groupedtogether on the basis of a thematic interdependence (objects arerelated on the basis of a story or theme). 3) Inferential-Categorical - which refers to the application of a class label to twoobjects. This is synonymous with the formulation of a concept; forexample, "both animals" or "both tools."
Sigel's research (Sigel, Jarman, and Hanesian, 1967) suggeststhat style of categorization, or a person's relative preference forthe use of the above classificatory approaches, follows an orderlysequence of development and is consistent across various tasks. Aperson's preferred style of categorization reflects his preferentialmode of organizing perceptual stimuli, and conceptualizing his externalenvironment. Knowledge regarding this aspect of cognitive functioninghas important implications for educational programming and curricula.Research (Sigel, Jarman and Hanesian, 1967; Sigel and Olmstead, 1967)suggests for example, that a dominant Relational-Contextual styleindicates an egocentric, impulsive orientation with a reduced capacityto objectify the environment. Reliance on this style may beincompatible with traditional forms of school instruction. Similarly,a failure to develop form as a basis for categorizing may lead todifficulty in development of reading skills.
Ability to use an Inferential-Categorical mode of categorizationis the last of the styles of categorization to occur. Use of thisstyle requires a high degree of abstraction and conceptual ability.Sigel's research (Sigel and Olmstead, 196ia, 1967b) indicates thatthis style is not used with any consistency until the "age of reason"or when children become capable of using sie3olic language. This stageoccurs at about the first or second grade among Sigel's middle classsubjects and later among lower class subjects.
This report describes the development of al irstrument andmethodology that is capable of assessing some aspects of cognitivestyle without being dependent upon language skills. This approachhas implications for assessing the level of cognitive development andthe cognitive style of children who present various types of learningdisabilities. This would include categories of children such as theretarded, acoustically handicapped, the disadvantaged and other groupsdemonstrating learning disabilities.
It is felt that much of the evidence regarding the developmentof cognitive styles is too dependent on iar.gnage skills in the childrenbeing assessed. In Sigel's work, for example, children's groupingsof objects were scored only when they could provide appropriate verbalresponses to questions such as "why are these the same or alike."
Furth (1952) has inte-Treted the theory of cognitive developmentof Jean Piaget and he stresses that conceptual abilities develop inthe absence of verbal language. Furth suggests that children'sabilities to conceptualize and reason are typically advanced beyondtheir ability to express these abilities through the use of language.
2
Sigel himself has shown an awareness that reliance upon verbalexplanation by his subjects placed a restraint upon his ability tomeasure their cognitive style. He states(Sigel, Anderson and Shapiro,1966):
"Failure to respond by not giving a scorable verbal response maynot really mean that the children do not comprehend the task.We found, for example, that some children would select theappropriate item, e.g., pick the spoon to be the cup, but whenqueried as to why, would not be able to verbalize. This happenedwith sufficient frequency to justify our concluding that for somechildren an awareness of relationship and a comprehension of thatrelationship does exist. The inability to verbalize may be areflection of their limited verbal competence and an inabilityto objectify these relations. They are perhaps functioningcognitively on what Piaget calls recognitory assimilation,reccgnizing a relationship to the point of juxtaposing relatedmaterials but not being able to explicate the connection intoformal language (Piaget, 1952)."
Another example of the effects introduced by the use of languagein the measurement methodology is illustrated by the following passagetaken from Sigel (Sigel and Olmstead, 1967):
"Lest we think that color is the most primitive, I hasten toinform you that we discovered among the lower - clays kindergartenchildren that those who did not verbalize rationales for anygroupings of items tended to use form as the more frequent basisfor grouping. In other words, for those children who were unableto verbalize, form was the more dominant mode, whereas for thosechildren who could verbalize, color was more frequently thepreferred criterion. Thus, we propose that form dominance may bein fact the most primitive, followed by color and the reintro-duction of form as a criterion when children Learn to utilizeform labels. The significance of this finding rests on itstheoretical contribution to understaneing of saliency of particularcues basic to organization of the physical and social environment."
A means to measure cognitive style without relying on languagewould contribute valuable insights regarding cognitive development inyoung children. Language fluency would no longer affect scores on thetest and cognitive development could be assessed among pre-verbalchildren as well as children having specific language defects (the deaf,the aphasic, etc.).
There is also the probability that a non-language test would freeyoung children to demonstrate their preferred modes of categorizationwhen they are not under the restraint of having to verbalize a reasonfor their groupings. It is likely that the necessity to justify theirgroupings would cause many children to use a readily explained groupingrather than a more complex one that would necessitate a difficultexplanation. Requiring verbal explanations of grouping behaviorincreases precision among scored responses and affords qualitavree
3
insights into children's thinking processes, but simultaneouslylimits our knowledge ,about potentials for cognitive functioning thatchildren .annot verbalize. If we are to enhance cognitive developmentand proviae appropriate curricula we must base oar instruction on tineway children actually respond to the environment in their dailyfunctioning. To assume that the child can think and reason only forlevels at which he is able to verbalize would result in underestimat ngthe levels of cognitive functioning present in children.
A pilot version of the current scale was developed in 1970(Brozovich, R.; Hall, L. and Watson, R., 1970). This scale, calledthe Brozovich-Hall-Wasson (BHW), has shown promise as a non-verbalapproach for evoking responses which demonstrate level of cognitivefunctioning as well, as a child's preferred mode of classifying stimula.Its development was predicated on extensive prior research (Sigel,Anderson, L.M., and Shapiro, H. 1966; Sigel, I.E., Olmstead, Patricia,1966-67; Sigel, I.E., 1967) suggesting that children do not use certaincategorical modes until a given age (age of development of symboliclanguage). An underlying rationale for the development of this scalewas the assumption that when a verbal explanation is not incorporatedinto the response pattern and when the items are presented in threedimensional, concrete form, a child will demonstrate capability forcognitive functioning of a higher level and at an earlier age thanpreviously theorized.
Since expressive language is a probable barrier in the measurementof cognitive development, it is also assumed that children withexpressive language deficits will demonstrate a higher level of per-formance in terms of cognitive style an the BHW Scale than on conventionalmeasures of cognitive development.
The BHW Scale is tot intended to be an ability test in thetraditional sense in tbat it does not yield a score or quotient whichshould be equated with an I.Q. or mental age. It is assumed thatcognitive functioning is a reflection of "style" or process ratherthan product and that this may he inferred by a determined patternof classificatory behavior in a preferential mode of grouping certainstimuli which are presented in -a systematic manner. Analysis of suchrecorded performance should yield a profile or pattern, rather thana score, which should lend itself to statistical inspection for theestablishment of normat.ve data refaced to such criteria as chronologicalage, sex, clinical diaenostic categortcs, etc.
The primary objective of the current research was to refine andfurther develop an evaluation Instrument capable of measuring preferredmode of cognitive functioning withoul dependency upon verbal language.Successful development of such an evaluation instrument would havebroad practical and theoretical implications. Following is a list ofthe most obvious immeeiate implicati/ns:
1) Collection of data regardiag cognitive functioning anddevelopment in typical children where the restraint ofverbal explanation is remcved. Previous research (Furth,
1966) indicates that cognitive functioning often proceedsin advance of verbal skills. Findings based on a non-verbalassessment may necessitate theoretical reformulations inthe area of cognitive development.
* 2) Assessment of cognitive functioning among children withverbal language Limitations. Such children would includepreschoolers, the acouscicall; handicapped, the mentallyretarded and a variety of other children unable to respondadequately to tests requiring verbal responding.
3) Investigation of the personality and behavioral :haracteristicsassociated with various cognitive styles when tll!se styles areassessed non-verbally. Further studies could seek to relatecognitive style to various behavioral patterns includingemotional disturbance and'the various types of learning dis-ability.
4) Investigation to develop teaching strategies best suited tovarious levels and modes of cognitive functioning. It ispossible, for example, that there is too heavy reliance onverbal enrichment in programs such as Head Start. We may beunderestimating the cognitive abilities of many children andbe failing J arovidc appropriate experiences to capitalizeon already existing abilitic3.
DESCRIPTION OF THE Bilw SCALE
The current BMW Scale consists of sixty items organized into six..,1] ten items each. Hence we speak of six interrelated "subtests"
of the BHW. Each item con-sts of a group of three objects attachedto bard surfaced 8" x 8" boards which are uniform in composition. Thethre! objects on the 60 boards are grouped to provide for elicitingresponses according to the following schema:
A) Color vs. Form, B) Color vs. Relational-Contextual (R-C),C) Color vs. Inferential-Categorical (I-C), D) Form vs.Relational-Contextual, E) Form vs. Inferential-Categorical, andF) Inferential-Categorical vs. Relational-Contextual.
The concepts of Forn, Color, R-C and I-C are borrowed from previouswork done by Sigel and his associa%es (Sigel, I.E.; Anderson, L.N., andShapiro, H., 1966). These classif}ing criteria were summarized earlierin the report t.see pages 1 and 2), with one exception. Form on the1311W refers to a shape classification based on figural or shapesimilarity between two or three dimensional objects. Sigel and hisassociates would include what we have desivated Form as one type ofclassification under the more inclusive category of Descriptive-,tructural parts.
Scores en the BHW provide a measure of preferential grouping styleamong the categories of Color, Form, R-C and I-C. The followingparadigm illustrates the method of presentation.
An otherwise unrelated object of An otherwise unrelated object ofdifferent shape but same color different color but same shape
(choice object) (choice object)
Specific object of certain color and shape(stimulus object)
Ss who choose the unrelated object of the same color are inferredto be organizing objects on the basis of color. Ss selecting theunrelated object of the same shape are inferred to be organizing objectson the basis of shape.
DIRECTIONS. FOR ADMINISTERING THE BHW
General testing considerations are followed regarding environment,rapport and procedures with young children. The following instructionswere used:
Since this is intended to be a non-verbal scale, verbal responsesand extraneous verbalizations are to he discouraged. The samebasic directions apply to the administration of all items. Theexaminer should be familiar with the standard record form and themethod of recording responses. (Subjects responses were recordeddirectly onto Generai Purpose NCS Answer Sheets). There are noright or wrong responses. Be sure that the child clearly indicateshis choice and record all responses.
Begin with board #1, Group I. Place board below eye level ofchild. The stimulus item should always be closest to the examiner.Say: "Look at all of these." (Direct attention%to all three itemsin a sweeping manner and then pointing to the tw6. choice items)saying: "Which one of these two goes with this?".: (Point tostimulus item.) If the examiner is not certain of the choiceindicated, he may ask: "Show me again. Put your finger on it."(Discourage verbal responses when given by saying "You don'thave to say the name. Show me.")
Administration may be accomplished in more than one session anddiscontinuation may be decided at appropriate points when satiationappears to be in evidence; however the entire scale should beadministered to each child in the experimental phase. Actualexperience indicated that administration time was approximately15 minutes per child.
METHODS
Seven examiners were trained in the administration of the BHW.Training was easily accomplished. Supervision by the test authorsindicated that the trained examiners were administering the testappropriately. No significant difficulties were noted in testadministration. Children responded well to the task. Only two subjects
6
were encountered where the procedure was considered not valid. In
one instance we obtained all position responses and in the other casethe child was resistant and refused to respond.
Six hundred and twenty one children were admintstered the revisedversion of the BHW. The major portiOn of this sample was composed ofSs controlled for three independent variables: grade level, sex andsocio-economic status. Administration took place during March, Apriland May, 1972.
Socio-economic status was controlled by selecting schools thatserved homogenous groups of children. Ss were divided into two socio-
economic groups: 1) lower middle class (L-M) and 2) upper middle
class (U-M). Ss for the L-M group came from three schools that servedneighborhoods made up primarily of families where the wage earner wasa blue collar worker. Substantial proportions of these families wereon some form of welfare or unemployment benefits. Ss for the U-M
group came from three schools that served neighborhoods made upprimarily of families where the wage earner was a white collar workeror professional person. Most family residences in the L-M schoolswere in the 12 to 28 thousand dollar range. Most residences in theU-M schools were in the 35+ thousand dollar range.
In addition to the portion of the sample controlled for gradelevel, sex and socio-economic status, two "unique" groups wereevaluated because of their availability in the schools at the timeof evaluation. These unique groups included children enrolled in aclass for educable retarded and children in a class for perceptualdevelopment.
The following chartportion of the sample.discussed separately
Grade Level
summarizesResults
from this
L-M
the
for the
sample.
groups evaluatedtwo "unique" groups
U-M
in the majorare
NumberNumber Grade LevelM F M F
Young preschool 4 6 Young preschool 32 31
(44-54 mos.) (44-54 mos.)
Old preschool 22 24 Old preschool 22 23
(55-65 mos.) (55-65 mos.)
Kindergarten 23 27 Kindergarten 27 25
First grade 22 28 First grade 29 26
Second grade 33 26 Second grade 28 24
Third grade 26 26 Third grade 27 22
The sample size for young L-M (N = 10) was too small for meaningfulcomparison with other groups. This sample size was too small because wewere dependent on a "story hour" conducted at several L-M schools to
obtain our L-M preschool youngsters. Most of the children attending the"story hour" were above the age requirement for our young preschoolsample.
7
RESULTS
The primary purpose of this research was an investigation ofthe effects of three factors on BIN scores: grade level, sex andsocio-economic level. Data were analyzed by means of three-factoranalysis of variance. Results were noted to be statisticallysignificant when they exceeded the .05 level of significance. Datafrom the young preschool group was not included 1n the analysis ofvariance due to the small sample size for the young preschool L-Mgroup.
Color versus Form: Analysis of data from the Color versusForm subtest is shown in Table 1. Color choices were recorded as'correct" to provide data for this analysis.
Table I
Analysis of Variance for Scoreson the Color vs. Form Subtest
Source of Variance DF SS MS F*Grade Level 4 14.52 3.63 11.44*Sex 1 0.03 0.03 0.10SES 1 2.78 2.78 8.75*Grade Level x Sex 4 14.92 3.73 11.76*Grade Level x SES 4 18.10 4.53 14.26*Sex x SES 1 2.96 2.96 9.32*Grade Level x Sex x SES 4 1.00 0.25 0.79Error 490 155.47 0.32
*F.05: 4,490 df = 2.37
F.05: 1,490 df = 3.84
Since all 2 x 2 interactions were significant, further analysiswas done of simple effects. Table II shows the mean number of Colorchoices among the various sub-groups used in analyzing for simpleeffects. Ten minus the number shown is the mean number of Formresponses for each group.
Analysis of simple effects was accomplished by means of asimple randomized design (for the various grade levels at any levelof sex or SES), by means of t-tests in comparing males versusfemales or U-M class versus L-M class at a specific grade level, andby means of t-tests in comparing sexes at one Level of SES orcomparing SES levels for a particular sex for subjects combined overgrade level.
8
Table III
Mean Number of Color Choices forVarious Sub-groups on the Color vs. Form Subtest
SES Levels Combined
1st 2nd 3rdPreschooliCa
Male* 4.00 3.35 2.53 2.56 2.43
Female* 4.51 3.70 2.25 2.52 2.47
Sexes Combined
U-M Class* 4.00 - 3.87 2.05 2.48 1.73
L-M Class* 4.59 3.24° 2.70 2.74 3.19°
Grade Levels Combined
Male Female+U-N Class 2.83 2.71L-M Class 3.03 3.40
'The numbers of subjects in the various groups above can bedetermined by reference to the chart on page 7. Significantdifferences are indicated as follows:
1) An asterisk (*) following the words Male, Female, U-M Classor L -M Class indicates that the one way analysis of variance(simple randomized design) yielded a significant F across thegrade levels fon the group specified. Comparisons of meansbetween pairs of grade levels were not performed when the trendof scores across grade level was evident. In cases where meansbetween pairs of grade levels were compared, these data arediscussed in thy, body of the report.
2) An @ between two means at a specific grade level indicatesa significant difference between the means at that grade levelfor the Male - Female or U-M - L-M data being displayed.
3) In the "grade levels combined" section of the table,significant differences between Male versus Female and U-Mversus L-M comparisons across all grade levels are indicat:das follows: a + sign by Male indicates a significant differencebetween U-M and.L-M males, a + sign by Female indicates asignificant difference between U-M and L-M females, a + sign byU-M Class indicates a significant difference between U-M malesand females and a + sign by L-M Class indicates a significantdifference between L-24 males and females.
9
t
Analysis of the simple effects showed that grade level was astatistically significant factor relating to subtest scores at eachlevel of both Sex and SES. Inspection of the relevant section ofTable II shows that there is a generalized progressive decline inthe proportion of Color choices among all glbugts as grade levelincreases. One dramatic exception to the generai'd422ine in Colorselection at higher grade levels occurred among third gr4de L-Msubjects. This group showed a relatively higher frequency of Colorselection that contradicted the general trend of results on thissubtest.
No statistically significant differences were found betweensexes at the various grade levels.
There were statistically significant differences between U-Mand L-M subjects at the grade levels of kindergarten, first gradeand third grade. At kindergarten, the U-M subjects selected moreColor responses than L-M subjects, while at both first and thirdgrade the L-M subjects selected more Color responses. Inspectionof the relevant data in Table II shows that the L-M subjects, aftera large decrease in frequency of Color selection from preschool tokindergarten, show little further decrease in Color selection throughthe third grade. U-M subjects show their greatest decrease in Colorselection between kindergarten and first grade and show a furtherlarge decline in Color selection at the third grade.
For data combined across all grade levels, there was onesignificant difference, with L-M females showing a greater frequencyof Color selection than U-M females.
Color versus R-C: Table III shows the overall analysis of resultsfrom the Color versus R-C subtest. Color-choices were recorded as"correct" to provide data for this analysis.
Table III
Analysis of Variance for Scoreson the Color vs. R-C Subtest
Source of Variance DF SS MS FGrade Level 44 21.51 5.38 22.30-Sex 1 0.07 0.07 0.28SES 1 0.01 0.01 0.06Grade Level x Sex 4 22.26 5.57 23.08!Grade Level x SES 4 21.63 5.40 22.43"Sex x SES 1 0.25 0.25 1.03Grade Level x Sex x SES 4 2.00 0.50 2.07Error 490 118.14 0.24
1.05: 4,490 df = 2.37F.05: 1,490 df = 3.84
10
Since the Grade Level x Sex and Grade Level X SES interacwere significant, simple effects involving these factors wereanalyzed. Table IV shows the mean number of Color choices amonthe various sub-groups used in analyzing for simple effects. Tminus the number shown is the mean number of R-C responses for egroup.
tions
gen
ach
Table IV'
Mean Number of Color Choices forVarious Sub-groups on the Color vs. R -C Subtest
SES Levels Combined
1st 2nd 3rdPreschool
Male* 4.70 4.64 3.30 3.19 2.39
Female*
5.16 4.37 2.84 3.05 2.59
Sexes Combined
U-M Class* 4.98 5.12 3.09 3.23 2.35
L-M Class* 5.02 3.98@ 3.13 3.17 2.71
1See footnote to Table II
Grade level was a statistically significant factor relating tosubtest scores it each level of both Sex and SES. The data in TableIV shows a generalized progressive decline in the proportion ofColor choices among all groups as grade level increases. There areseveral exceptions to this general trend, (ex: an increase fromfirst to second grade among females) but the powerful effect of gradelevel is clearly evident in the data.
No statistically significant differences were found betweensexes at the various grade levels. There were differences atkindergarten (more Color responses by females) and first grade (moreColor responses by males) that were very close to being statisticallysignificant.
There was a statistically significant difference betweenU-M and L-M subjects in kindergarten, with the U-M subjects selectingmore Color responses.
For data combined across all grade levels, there were nostatistically significant differences attributable to Sex or SES.
11
Color versus I-C: Table V shows the overall analysis of resultsfrom the Color versus I-C subtest. Color choices were recorded as"correct" to protide data for this analysis.
Table V
Analysis of Variance for Scoreson the Color vs. I-C Subtest
Source of Variance DF SS MS F*Grade Level 4 34.82 8.70 35.95*Sex 1 0.30 0.30 1.25SES 1 1.33 1.33 5.50*Grade Level x Sex 4 35.97 8.99 37.14*Grade Level x SES 4 36.90 9.23 38.10*Sex x SES 1 1.71 1.71 7.05*Grade Level x Sex x SES 4 1.00 0.25 1.03Error 490 118.65 0.24
*F.05: 4,490 df = 2.37
F.05: 1,490 df = 3.64
Since all 2 x 2 interactions were significant, further analysiswas done of simple effects. Table VI shows the mean number of Colorresponses among the various sub-groups used in analyzing for simpleeffects. Ten minus the number shown is the mean number of I-Cresponses for each group.
Table VI
Mean Number of Color Choices forVarious Sub-groups on the Color vs. I-C Subtest
Grade level was a statistically significant factor relating to
subtest scores at each level of both Sex and SES. With theexception of one relatively small reverse]. (a small increase fromsecond to third grade among L-M subjects) there was a strong trendfor Color responses tc decrease as grade level increased.
One statistical.y significant difference was found between sexesat various grade levels. This occurred among kindergarteners, wherefemales selected the Color choice more oftea than males.
There were statistically significant differences between U-Mand L-M subjects at both preschool and the third grade, with L-Msubjects selecting more Color choices in both instances.
For data combined across all grade levels,-there were nostatistically significant differences attributable to Sex or SES.The L-14 females had the highest number of Color responses andcomparisons of this group with both the U-M females and L-M maleswere close to being statistically significant.
Form versus R-C: Table VII shows the overall analysis of resultsfrom the Form versus R-C subtest. Form choices were recorded as"correct" to provide data for this analysis.
Table VII
Analysis of Variance for Scoreson the Form vs. R-C Subtest
Source of Variance DF SS MS F*Grade Level 4 4.31 1.08 6.03*Sex 1 0.04 0.04 0.21SES 1 0.17 0.17 0.93Grade Level x Sex 4 4.97 1.24 6.95
*
Grade Level x SES 4 5.57 1.39 7.78*Sex x SES 1 0.81 0.81 4.53
*
Grade Level x Sex x SES 4 0.00 0.00 0.00Error 490 87.67 0.18
*F.05: 4,490 df = 2.37
F.05: 1,490 df = 3.84
Since all 2 x 2 interactions were significant, further analysiswas done of simple effects. Table VIII shows the mean number ofForm responses among the various sub-groups used in analyzing forsimple effects. Ten minus the number shown is the mean number ofR-C responses for each group.
Table VIII
Mean Number of Form Choices forVarious Sub-groups on the Form vs. R-C Subtest
SES Levels Combined
1st 2nd 3rdPreschoolMale
*6.50 6.18 5.34 5.70. 4.91
Female*
5.89- 6.02 5.52 5.34@
5.37@
Sexes Combined
U-M Class* 6.58 6.63 5.15 5.65 5.35
L-M Class*
5.911@
5.64@
5.80@
5.51 5.06
Grade Levels Combined
Maid+ FemaleU-M Class 5.96 5.62L-M Class 5.41 5.64
Grade level was a statistically significant factor relating tos'ibtest scores at each level of both Sex and SES. There was ageneralized decline in the proportion of Form responses among allgroups as grade level increased. This decline in Form responses wasnot as pronounced as the drop in Color responses on the Color versusR-C subtest as grade level increased.
There are some minor exceptions to the decrease in Form responseswith increased grade level. With U-M subjects, for example, there isa large decrease in Form responses from preschool to first grade, butthen the proportion of Form responses rises slightly in second andthird 7rade. Inspection.of the data in Table VIII shows that mostof the decrease in Form responses occurs between preschool and firstgrade among all groups. For all groups combined, Form accounted forapproximately 62% of the responses in the Form versus R-C subtestat the preschool and kindergarten level and drops to about 54% ofthe responses in first through third grade.
Statistically significant differences were present between sexesat three grade levels; preschool, second grade and third grade. Forpreschool and second grade, males gave more Form responses thanfemales. At third grade, females gave more Form responses than males.
Statistically significant differences were present between U-Mand L-M subjects at three grade levels; preschool, kindergarten andfirst grade. At preschool and kindergarten the U-M subjects used
14
Form responses more often than L-M subjects. At first grade the L-Msubjects used Form more frequently.
For data combined over all grade levels, there was one statis-tically significant difference. U-M males used Form with greaterfrequency than L-M males.
Form versus I-C: Table 1X shows the overall analysis of resultsfrom the Form versus I-C subtest. Form choices were recorded as"correct" to provide data for this analysis.
Table IX
Analysis of Variance for Scoreson the Form vs. I-C Subtest
Grade Level x Sex 4 20.35 5.09 22.94^Grade Level x SES 4 20.25 5.06 22.83*Sex x SES 1 0.87 0.87 3.91
*
Grade Level x Sex x SES 4 0.00 0.00 0.00Error 490 108.66 0.22
*F.05: 4,490 df = 2.37
M.
F.05: 1,490 df = 3.84
Since all 2 x 2 interactions were significant, further analysiswas done of simple effects. Table X shows the mean number of Formresponses among the various sub-groups used in analyzing for simpleeffects. Ten minus the number shown is the mean number of I-Cresponses for each group.
Table X
Mean Number of Color Choices forVarious Sub-groups on the Form vs. 1-C Subtest
Grade level was a statistically significant factor relatingto subtest scores at each level of both Sex and SES. Form responsesshowed a gradual decline as grade level increased, dropping in asteady progression (for all groups combined) from 56% of the responsesin preschool to 34% of the responses in third grade.
Statistically significant differences were present between sexesat the grade levels of preschool, kindergarten and second grade. Ateach of these grade levels, males produced more Form responses thanfemales.
There was one statistically significant difference between U-Mand L-M subjects. At the first grade, L-M subjects used Form morefrequently than U-M subjects.
There were no statistically significant differences related toSex or SES for data combined over all grade levels. For U-M subjects,the difference between males and females was close to statisticalsignificance, with males giving more Form responses.
I-C versus R-C: Table XI shows the overall analysis of resultsfrom the I-C versus R-C subtest. I-C responses were recorded as"correct" to provide data for this analysis.
16
Table XI
Analysis of Variance for Scoreson the I-C vs. R-C Subtest
Source of Variance DF SS MS FGrade Level 4 4.64 1.16 9.71kSex 1 0.06 0.06 0.52
SES 1 2.36 2.36 19.77*
Grade Level x Sex 4 5.22 1.30 10.92*
Grade Level x SES 4 8.57 2.14 17.93Sex x SES 1 2.43 2.43 20.33*Grade Level x Sex x SES 4 0.00 0.00 0.00Error 490 58.53 0.12
*F.05: 4,490 df = 2.37
P.05: 1,490 df = 3.84
Since all 2 x 2 interactions were significant, further analysiswas done of simple effects. Table XII shows the mean number of I-Cresponses among the various sub-groups used in analyzing for simpleeffects. Ten minus the number shown is the mean number of R-Cresponses for each group.
Table XII
Mean Number of I-C Choices forVarious Sub-groups on the I-C vs. R-C Subtest
Grade level was a statistically significant factor relating tosubtest scores at each level of both Sex and SES. Data displayedin Table XII shows that the major trend was for I-C choices toincrease as grade level went up. Most of the increase in theproportion of I-C responses occurred between first and second grade.I-C responses averaged about 66% of the choices at preschool,kindergarten and first grade and jumped to about 75% of the choicesin second and third grade (these figures are for data combined overSex and SES).
Statistically significant differences occurred between sexesat first and second grade. Among first graders, ffales gavesignificantly more I-C responses, whila among second graders malesgave significantly more I-C responses.
Statistically significant differences occurred between U-Mand L-M subjects at all five grade levels. At preschool, kinder-garten, first grade and third grade levels the U-M subjects gavemore I-C responses. At second grade there was an unusual reversal,with L-M subjects using I-C more often. The higher proportion ofI-C among L-M subjects at the second grade is a contradictory findingand suggests that some strong, extraneous factor was operating toinfluence the choices of the second graders. Since the L-M secondgraders came primarily from one classroom, and all from one school,it is plausible that a teacher or school variable was operating toinfluence scores. It is feasible, for example, that a particularteacher's approach to teaching might emphasize a certain cognitiveapproach and thereby influence the cognitive styles of students.
For data combined across all grade levels, there were significantdifferences between U-M and L-M subjects across both sexes. Amongboth males and females the U-M subjects gave more I-C responses.
Since the most powerful factor affecting BHW scores was gradelevel, the basic data for Ss at various grade levels (combined acrosssocio-economic level and sex) is presented in detal., Table XIIIsummarizes the data for Ss at all grade levels. Each sub-part of theBHW is represented by ten items, so percentage frequencies for eachsub-part in Table XIII are based on the following number of totalresponses for each grade level: Young Preschool (44-54 months old)730; Old Preschool (55-65 months old) 910; Kindergarten 1,020; FirstGrade 1,110; Second Grade 1,050; and Third Grade 1,010. Note thatthis table includes data from young preschool children that was notincluded among the data used for statistical analysis by analysis ofvariance.
18
Table XIII
Response Percentages on Sub-parts of the
BHW as a Function of Grade Level
Color vs. Form
Young
Preschool
(N=73)
Old
Preschool
(N=91)
Kinder-
garten
(N=102)
First
Grade
(N=111)
Second
Grade
(N=105)
Third
Grade
(N=101)
Total
(N=583)
(% Color Recorded)
50
43
36
24
26
25
33
Color vs. R-C
Color Recorded)
61
50
46
31
32
25
39
Color vs. I-C
(% Color Recorded)
52
45
33
19
14
13
28
t-- 0
Form vs. R-C
(% Form Recorded)
66
62
61
55
56
52
58
Form vs. I-C
(% Form Recorded)
58
57
54
44
38
34
47
I-C vs. R-C
(% I-C Recorded)
70
64
66
66
76
75
70
Figure 1 depicts the data from Table XIII in graphic form..
Figure 1*
Response Percentages on Sub-parts of theBHW as a Function of Grade Level
Young Old Kinder- First Second ThirdPreschool Preschool garten Grade Grade Grade
*Key: o--o Color vs. Form, % Color recorded
0 Color vs. R-C, % Color recorded
A Color vs. I-C, % Color recordedA
--- Form vs. R-C, % Form recorded
Form vs. I-C, % Form recorded
A-----A I-C vs. R-C, % 1-C recorded
20
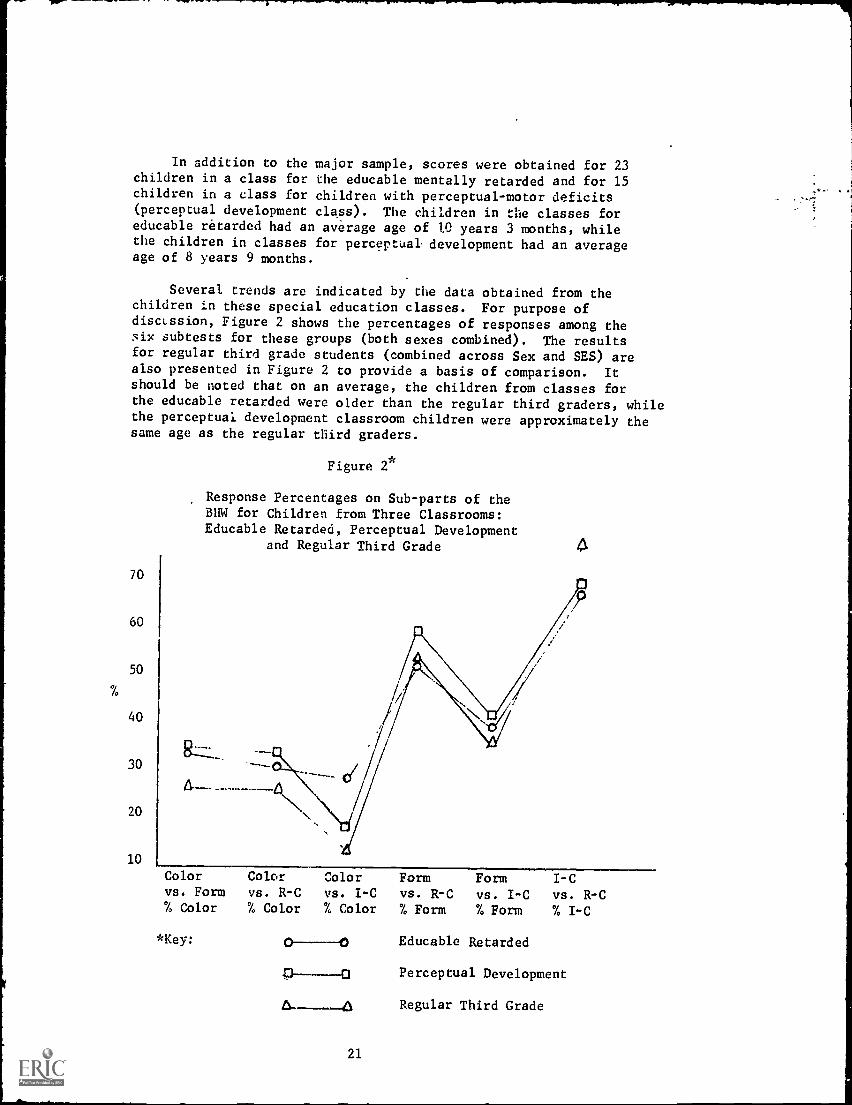
In addition to the major sample, scores were obtained for 23children in a class for the educable mentally retarded and for 15children in a class for children with perceptual-motor deficits(perceptual development class). The children in the classes foreducable retarded had an average age of 10 years 3 months, whilethe children in classes for perceptual, development had an averageage of 8 years 9 months.
Several trends are indicated by the data obtained from thechildren in these special education classes. For purpose ofdisctssion, Figure 2 shows the percentages of responses among thesix subtests for these groups (both sexes combined). The resultsfor regular third grade students (combined across Sex and SES) arealso presented in Figure 2 to provide a basis of comparison. Itshould be noted that on an average, the children from classes forthe educable retarded were older than the regular third graders, whilethe perceptual development classroom children were approximately thesame age as the regular third graders.
70
60
50
40
30
20
10
Figure 2*
Response Percentages on Sub-parts of theBHW for Children from Three Classrooms:Educable Retarded, Perceptual Development
and Regular Third Grade 4
Color Color Color Form Form I-Cvs. Form vs. R-C vs. I-C vs. R-C vs. I-C vs. R-C% Color % Color % Color % Form % Form % I-C
*Key: 0 Educable Retarded
Perceptual Development
Regular Third Grade
21
Notable in Figure 2 is the finding that both special educationgroups tend to give responses characteristic of younger children.Previots results have indicated, for example, that Color, when pairedwith any other alternative, tends to decrease with grade (age) level.Figure 2 shows that both special education groups responded withgreater Color preference than third graders on all three subtestsinvolving Color. Results on the three subtests not involving Colorare not as definitive, but again there is a tendency for thepreferences of the special education groups to be characteristic ofyounger children (slightly more Form than third graders on Form vs.I-C). These findings are tentative due to the small numbers involved,but suggest that the cognitive style of children in these types ofspecial education classes differs significantly from the cognitivestyle of randomly selected children of comparable ages.
Since the purpose of the current research was to establishtentative norms and provide data for item revision, attention wasdevoted to group differences rather than individual differences incognitive style. Inspection of the data suggests, however, thatindividual differences may be of greater significance than grouptrends. After further revision of the scale, it is anticipated thatintensive investigations of individual differences in cognitive stylewill be done. As an example of the type of individual differencesthat are found in the data, profiles for three extreme protocols aredisplayed in Table XIV.
Table XIV
Profile Patterns on the BHW forThree First Grade, Upper.Middle Class Subjects
Colorvs. Form
Colorvs. R-C
Color
vs. I-CFormvs. R-C
Formvs. I-C
I-C
vs. R-C% Color % Color % Color % Form % Form % I-C
Subject 1 0 10 10 60 40 90
Subject 2 100 100 100 50 60 90
Subject 3 10 40 10 30 20 30
The data in Table XIV indicates that these three subjects (fromthe same classroom) are f,fr.ctioning with widely disparate cognitivestyles. Subject 1 ignores Color as a basis for grouping, uses Formt moderate degree and relies heavily on R-C and I-C as a basis forgrouping. Subject 2 responds consistently to Color as a basis forgrouping and uses R-C infrequently. Subject 3 uses Color infrequentlyas a basis for grouping and also uses Form infrequently (except whenthe choice is Color vs. Form, in which case the subject used Form overColor). Subject 3 was one of few subjects who consistently chose R-Cover I-C in the I-C vs. R-C subtest.
At this stage in development of the BHW we know that there arelarge individual differences in subtest patterns, but we can onlyhypothesize possible implications of these findings. Further researchwill be necessary to establish whether these individual differencesare stable and to determine if such differences have practicalimplications for learning processes and teaching methods.
All sixty iters of the BHW were plotted on individual graphsfor the purpose of item analysis. The data obtained for each itemwill be used for future revisions in an attempt to make the totalscale more consistent, improve subtest reliability and increasevalidity of the subtests. Two basic criteria were used in evaluatingitems:
1) does the item show grade level changes in preferredselection .Zreouencies that are consistent with resultsfor the total subtests?
2) does the item produce selection frequencies nlose to 50%among the two alternatives presented?
Examples of items that will be retained or rejected are presentedto offer the reader an example of the procedure being employed. Spacelimitations precludr: a discussion of this procedure for all 60 itemsin the scale.
Color versus Form: To be retained in this subtest an item mustshow characteristic:t similar to that of the total subtest. Since theColor versus Form subtest showed a significant drop in Color selectionfrequency as grade level increased, individual items must reflectthis eharacteristic-to be retained. Preliminary analysis suggeststhat seven of the ten items in this subtest will be retained in afuture revision. Figure 3 shows the characteristics of an item tobe retained (item 55) and an item to be rejected (item 31).
60
50
% Color 40
Choices
30
20
10
Figure 3*
Characteristics of Two Items fromthe Color vs. Form Subtest
*Key:
Young Old Kinder- FirstPre-school
Pre-school
garten Grade
0-0 Item 55
0--C1 Item 31
Second ThirdGrade Grade
Note that item 55 shows a steep progressive drop in frequencyof Color selection as grade level increases. Item 31 maintains afrequency of close to 20% Color selection across all grade levels.
Color versus Relational-Contextual: Since the Color versus R-Csubtest showed a significant drop in Color selection frequency asgrade level, increased, individual items must reflect this character-istic to be retained. Preliminary analysis suggests that six of theten items in this subtest will be retained. Figure 4 shows thecharacteristics of an item to be retained (item 14) and an item tobe rejected (item 8).
24
70
60
50
°h Color 40
Choices
30
20
10
Figure 4*
Characteristics of Two Items fromthe Color vs. R-C Subtest
*Key:
Young Old Kinder- First Second ThirdPre- Pre- garten Grade Grade Gradeschool school
Item 14
Item 8
Inspection of Figure 4 shows that item 14 shows a steepprogressive drop in frequency of Color selection as grade levelincreases. Item 8 shows an initial drop in frequency of Colorselection, but a subsequent rise among second and third graders.
Color versus Inferential - Categorical: Items on this subtestmust show a significaat drop in Color selection frequency as gradelevel increases if they are to be retained. Preliminary analysissuggests that eight of the ten items in this subtest will be retained.Figure 5 shows the characteristics of an item to be retained (item15) and an item to be rejected (item 51).
70
60
50
7. Color 40Choices
30
20
10
Figure 5*
Characteristics of Two Items fromthe Color vs. I-C Subtest
*Key:
Young Old Kinder- First Second ThirdPre- Pre- garter. Grade Grade Gradeschool school
Item 15
Item 51
Figure 5 shows a steep progressive drop in frequency of Colorselection for item 15 as grade level increases. Item 51 shows onlya moderate drop in frequency of Color selection as grade levelincreases and there is a slight rise in frequency of Color selectionamong second graders. Another reason for possible replacement of item51 is the low frequency of Color selections even among preschool Ss.This finding suggests an imbalance in attra,:tiveness of the choiceitems that is resulting in a high probability of I-C selection amongyoung Ss where Color is ordinarily the dominant selection.
Form versus Relational-Contextual: On this subtest there wasa small gradual shift toward increased selection of R-C as gradelevel increased. The criterion for retention or a rejection of itemsin this subtest was a drop in Form as grade level increased andfrequencies close to 50% among the two alternatives presented. Pre-liminary analysis indicated that only five of the ten items in thissubtest will be retained. Figure 6 shows the characteristics of anitem to be retained (item 34) and an item to be rejected (item 10).
26
80
70
% Form 60
Choices
50
40
30
Figure 6*
Characteristics of Two Items fromthe Form vs. R-C Subtest
Young Old Kinder- First Second ThirdPre- Pre- garten Grade Grade Gradeschool school
*Key: Item 34
01-----43 Item 10
Figure 6 shows that item 34 produced a steady decrease in Formresponses as grade level increased. Item 10 has high percentages ofForm across all grade levels, an indication that the item probablydoes not contribute sufficient variance to warrant its inclusion ina test revision.
Form versus Inferential- Cate &orical: This subtest showed asignificant drop in Form selection frequency as grade level increased.Preliminary analysis indicates that seven of the ten items on thesubtest will be retained. Figure 7 shows the characteristics of anitem to be retained (item 29) and an item to be rejected (item 59).
27
Figure 7*
4 Characteristics of Two Items fromthe Form vs. I-C Subtest
80
70
60
% Form 50
Choices
40
30
20
Young Old Kinder- First Second ThirdPre- Pre- garten Grade Grade Gradeschool school
*Key: 0------.4 Item 29
Cl 43 Item 59
As shown in Figure 7, the percentages of Form responses dropssharply in item 29 as grade level increases. Item 59 shows a trendopposite from that of total subtest scores, with the percentage ofForm responses increasing as grade Level increases. This was theonly item in the whole test to yield results strongly opposed to themajor trend of the subtest in-which the item was included. It isevident that this item is conceptually wrong since it yields resultsinconsistent with expectations. Replacement of this item with anappropriate item should yield a markedly better relationship betweenForm versus I-C subtest scores and grade level in a future revisionof the scale.
InferentialrdliMS.1011YLELLgrr-glti"1-"Contextual: Thissubtest showed no clear pattern in shift of preferred category asgrade level increased. There was a small, gradual trend towardincreased I-C as grade level increased, but this trend was notsignificant. Retention of items for this subtest will be judged onthe basis of the degree to which items yield selection frequenciesclose to 507. among the two alternatives presented. Analysis indicatesthat the I-C category was strongly preferred over R-C in six of theten items of this subtest. All six of these items will be revised inan attempt to achieve better balance between I-C and responses.
28
CONCLUSIONS AND RECOMMENDATIONS
Previous results with the pilot version of the BHW (Brozovich,Hall and Watson, 1970) and results of the current investigationsupport the following tentative conclusions regarding cognitive styleand the BHW as a method of assessment:
1) Children at preschool ages are capable of groupings involvingColor, Form, R-C and I-C at well above chance levels(Brozovich, Hall and Watson, 1970).
2) Children respond well to the non-verbal test format of theBHW.
3) There are consistent grade (age) level changes in the relativefrequencies of children's grouping preferences. Youngerchildren select Color more frequently than older childrenwhen Color is opposed to any of the other three groupingcriteria. In groupings involving Form versus either R-C orI-C, younger children select the Form choice more frequentlythan older children. No consistent pattern has emerged torelate grade (age) level and preferences on the R-C versusI-C subtest.
4) The factors of Sex and SES do not relate to cognitive stylein a consistent manner across grade levels. Significantinteractions occurred between grade level and both Sex andSES. These findings suggest fruitful avenues to pursue infurther research. Among the more intriguing of such results,were findings on the three subtests involving Color (Colorvs. Form, Color vs. R-C and Color vs. I-C). At the preschoollevel, females chose Color more often than males on all threeof these subtests (although none of these differences werestatistically significant, all three were close to statisticalsignificance). At grade level 1, the trend was reversed andmales chose Color more often than females on all three ofthese subtestss (two of these difr-rences were close tostatistical significance). These results suggest a possibleage-sex interaction in the development of cognitive stylethat should be investigated more intensively in a futurestudy.
The three subtests involving Color also were prominent among theinteractions between grade level and SES. At the preschool level, L-Mchildren chose Color more often on all three subtests (one differencewas statistically significant and one was close to statistical signif-icance). In kindergarten, the pattern reversed, with U-M childrenchoosing Color more often on an three subtests (two of the differenceswere statistically singificant). By third grade the pattern is reversedagain, and L-M children chose Color more often on all three subtests(two of the differences were statistically significant). This puzzlingpattern suggests a need for caution in interpreting SES differenceswhere data involves only one age group of children.
29
There was one subtest on which SES had a relatively consistenteffect across grade level and sex. This occurred on the I-C versusR-C subtest, where U-14 subjects selected more I-C responses than L-Msubjects. This difference was significant among both males andfemales across all grade levels combined.
Many promising areas for future research are suggested by theresults of the current study. Recommendations for further researchinclude the following:
1) Revision of the current scale based on item analysis asdescribed in this report.
2) Study of the relationships between cognitive styles ofstudents and other characteristics such as intelligence,academic achievement and personality characteristics.
3) Study of,the influence of various teaching-learningenvironments on the development of cognitive style.
4) Longitudinal studies to determine the stability of measuresof cognitive style.
5) Investigation of the effectiveness of various teachingmethods for students with different cognitive styles.
6) Further study of the relationship of basic characteristicssuch as age, SES and sex to cognitive style.
7) Investigation of the relationships among various methodsof assessing cognitive style.
30
References
Brozovich, R., Hall, L. and Watson, R. The BHW Scale: A Method ofCognitive Assessment. Occasional Papers, Vol. III, No. 4,(Oakland Schools, Pontiac, Michigan 1970).
Furth, H. G. Thinking Without Language: Psychological Implicationsof Deafness. New York: Free Press, 1966.
Linguist, E. F. Design and Analysis of Experiments in Psychology andEducation. Boston, Houghton Mifflin, 1953.
Piaget, J. The Origin of Intelligence in Children. New York:International University Press, 1952.
Sigel, I. E., Anderson, L. M. and Shapiro, H. Categorization behaviorof lower and middle class Negro preschool children: differencesin dealing with representation of familiar objects. Journal ofNegro Education, 1966, Summer, 218-229.
Sigel, I. E. and Olmstead, P. Modification of classificatory competenceand level of representation among lower-class Negro kindergartenchildren. Research Report for O.E.O. Head Start, Subcontract 1410,Michigan State University Head Start Evaluation and Research Center,1966-67. Appendix A.
Sigel, I. E. and Olmstead, P. Styles of categorization among lower-class kindergarten children. Paper presented at AmericanEducational Research Association Annual Meeting, N. Y., N. Y.,1967 (b).
Sigel, I. E., Jarman, P. and Hanesian, H. Styles of categorizationand their intellectual and personality correlates in youngchildren. Human Development, 1967, 10, 1-17.