Master’s Thesis 2016 30 Credits Households’ Seed Security Level In The Aftermath of Earthquake: A Case Study From The Village Pawati-8 One Year After Earthquake, 25 th April 2015 Nawaraj Bhujel
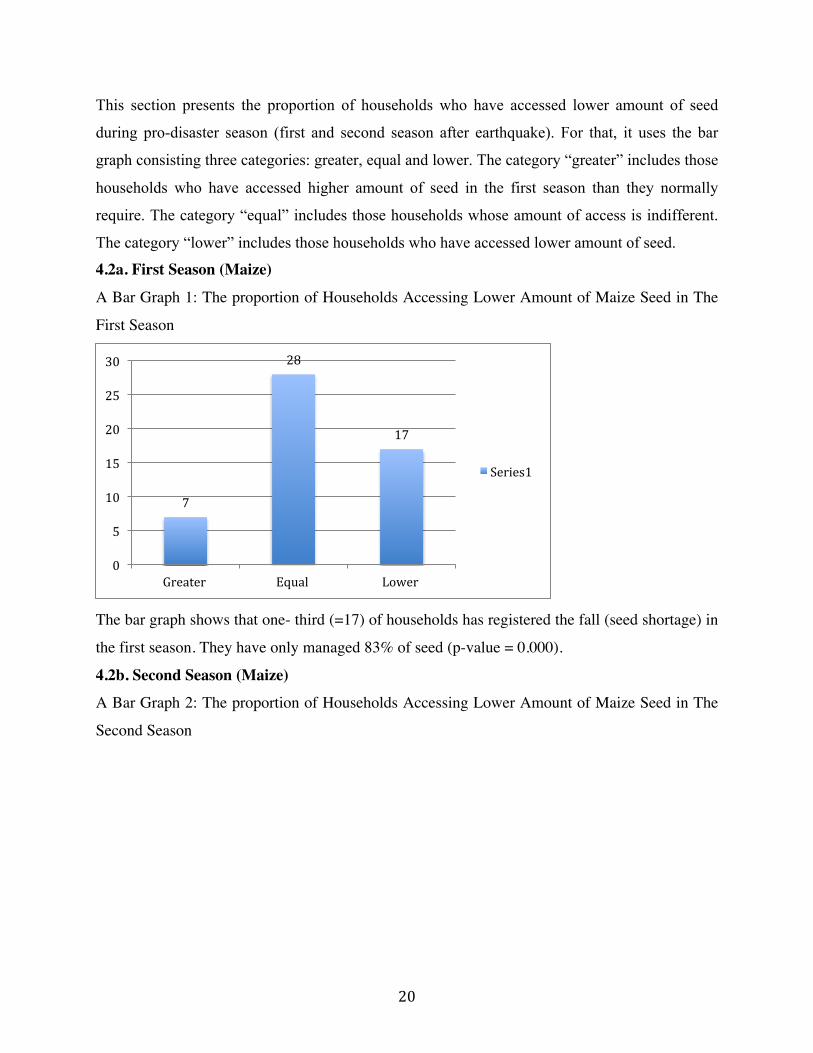
Transcript
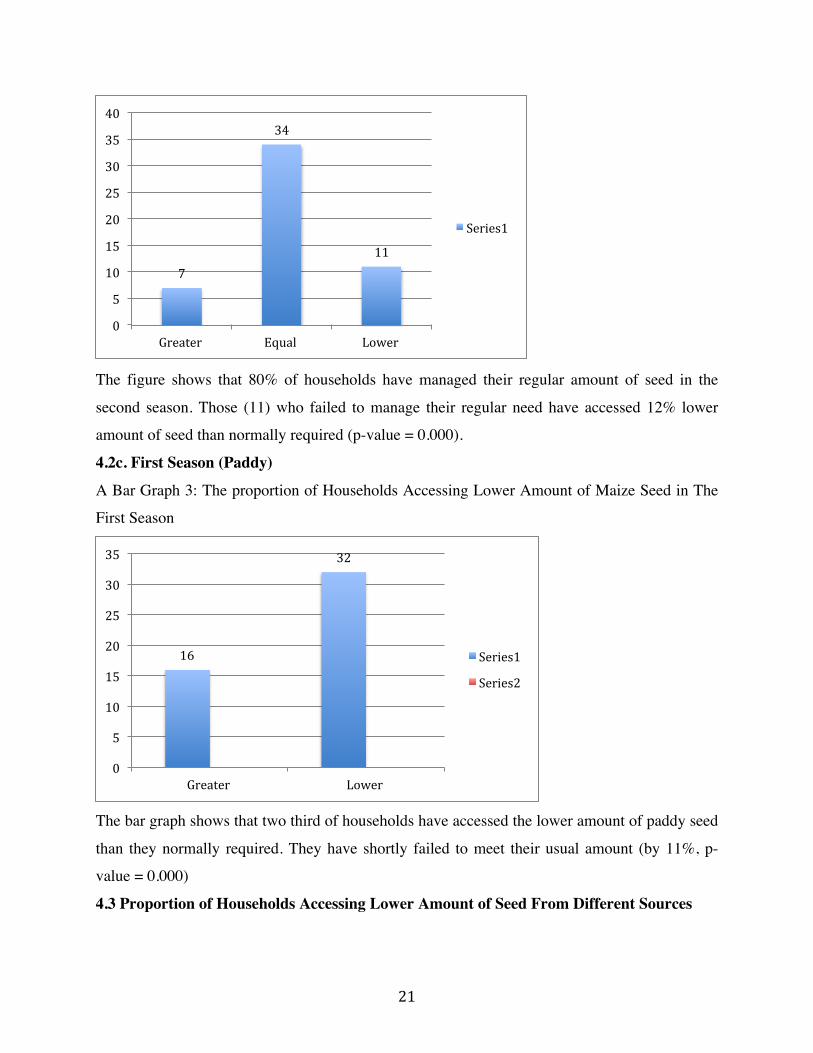
Master’s Thesis 2016 30 Credits
Households’ Seed Security Level In The Aftermath of Earthquake: A Case Study From The Village Pawati-8 One Year After Earthquake, 25th April 2015
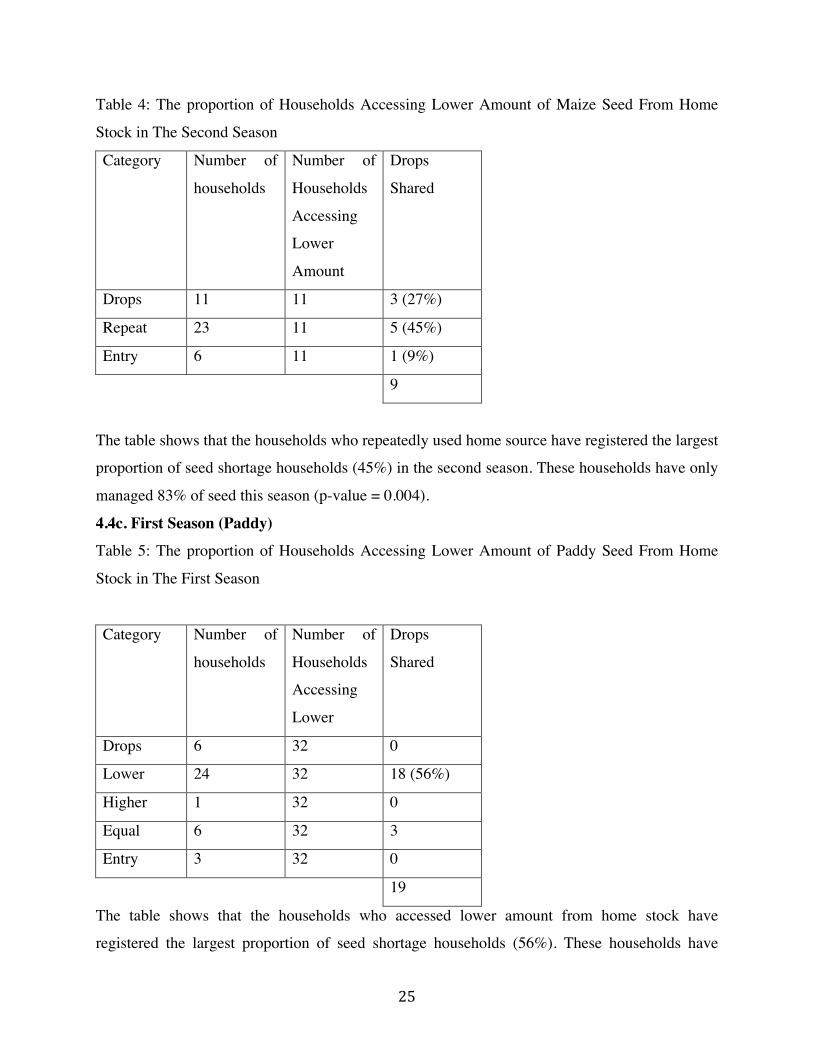
Nawaraj Bhujel
The Department of International Environment and Development Studies, Noragric, is the
international gateway for the Norwegian University of Life Sciences (NMBU). Eight
departments, associated research institutions and the Norwegian College of Veterinary
Medicine in Oslo. Established in 1986, Noragric’s contribution to international
development lies in the interface between research, education (Bachelor, Master and PhD
programmes) and assignments.
The Noragric Master theses are the final theses submitted by students in order to fulfil the
requirements under the Noragric Master programme “International Environmental
Studies”, “International Development Studies” and “International Relations”.
The findings in this thesis do not necessarily reflect the views of Noragric. Extracts from
this publication may only be reproduced after prior consultation with the author and on
condition that the source is indicated. For rights of reproduction or translation contact
Department of International Environment and Development Studies
P.O. Box 5003
N-1432 Ås
HOUSEHOLDS’ SEED SECURITY LEVEL IN THE
AFTERMATH OF EARTHQUAKE: A CASE SUDY
FROM THE VILLAGE PAWATI-8 ONE YEAR
AFTER THE EARTHQUAKE, 25th APRIL 2015
MASTER THESIS
NAWARAJ BHUJEL
I
Declaration I, (Nawaraj Bhujel), declare that this thesis is a result of my research investigations and findings.
Sources of information other than my own have been acknowledged and a reference list has been
appended. This work has not been previously submitted to any other university for award of any
type of academic degree.
Signature………………………………..
Date…………………………………………
II
Dedication Dedicated to all farmers in Nepal who were victim of the last earthquake in 25th April 2015.
III
Acknowledgement I would like to express the deepest gratitude to my supervisor Ola Westegen for his excellent
guidance, support, encouragement and care, and providing me friendly and comfortable
environment during my thesis writing. I would like to also thank Norwegian University of Life
Sciences (NMBU) for providing me opportunities to acquire diverse knowledge.
Especial thanks to my wife Yamuna Khawas Bhujel and Mr. Hem Bahadur Bhujel for their
support during fieldwork.
I would also like to thank the households living at Pawati-8 for their time, patience, cooperation
and response during interview.
Finally I would like to thank my mother Dil Maya Bhujel for her love and encouragement in
every steps of my life.
Ås August 2016
Nawaraj Bhujel
IV
Abstract Despite the report of wide spread damage of seed system by the earthquake in after 25th April
2015, the seed security studies in pro-earthquake context (aftermath of earthquake) has been
missed in several rural villages of Nepal. With aim identifying seed (maize and paddy) insecure
households of one particular village, this study has examined the seed security level of randomly
selected households living at Pawati-8 in Nepal. The match pair-mean comparison test was used
to compare seed security level in the pro-disaster seasons (2015 and 2016) with seed security
level in normal season. The findings suggest that the higher proportion of households (nearly
double) were paddy insecure than maize seed in the season 2015. However the maize insecure
households have sowed lower proportion of seed (by 6%)than the paddy insecure households in
the same season. The findings also suggest that the proportion of seed insecure households
(maize) have shrinked to 20% in the season 2016. The seed insecure households have been
recovering their seed security level.
V
Table of Contents
Declaration ---------------------------------------------------------------------------------------- I Dedication ---------------------------------------------------------------------------------------- II
Acknowledgement ---------------------------------------------------------------------------- III Abstract ------------------------------------------------------------------------------------------ IV
Table of Content -------------------------------------------------------------------------------- V
List of Tables ------------------------------------------------------------------------------------ VI List of Figures --------------------------------------------------------------------------------- VII
List of Graphs and Plots -------------------------------------------------------------------- VII List of Diagram ------------------------------------------------------------------------------ VIII
Table 3: The proportion of Households Accessing Lower Amount of Maize Seed From Home
Stock in The First Season ------------------------------------------------------------------- 24
Table 4: The proportion of Households Accessing Lower Amount of Maize Seed From
Home Stock in The Second Season ------------------------------------------------------- 25
Table 5: The proportion of Households Accessing Lower Amount of Paddy Seed From Home
Stock in The First Season ------------------------------------------------------------------ 25
Table 6: Proportion of Households Accessing Lower Amount of Paddy Seed (Purchase + Home)
in The First Season -------------------------------------------------------------------------- 30
List of Figures ---------------------------------------------------------------------------------- Figure 1: Seed Security Pentagon Before and After A Severe localize Drought ---- 7
Together with these damages, several studies and the newspaper report the wide spread damage
of seed system in the affected regions. This includes the report by Rasul et al. (2015) which
admit that the seed loss remains substantial (more than 50%) over six districts: Dolakha,
Sindupalanckowk, Rasuwa, Nuwakot, Dhading, Gorkha; includes findings of Food Security
Cluster (2015) which claims that 50% of households lost their paddy, millet, wheat and maize
seed immediate after earthquake; includes a article in Himalaya times (2015) which writes that
these households lost their seed and stored crops under the rumble of collapse house and there
were no seed in the market as well; includes the report by Government of Nepal: National
Planning Commission (2015) which admits that the most of the farmer living in the affected
region do not have seed storage facility, depite the possibility to access seed from standing crops;
includes the finding of Food Security Cluster (2015) which reports the wide spread damage of
agricultural infrastructure including chilling centers, processing plants and seed stores; and
2
includes the findings from same source which admits that the summer and spring planting (
especially for rice and maize since the window for those crops are near) would be significantly
affected with the crisis of seed.
Together with the crisis, several recovery policies and interventions have been also forwarded.
The national planning commission of Nepal has come with the list –presenting the essential
elements for reconstruction and recovery of agriculture system- including seed based recovery as
key need. Similarly Rasul et al. (2015) has presented the key elements for the sustainable
livelihood strategy, which include the supply of seed, tools and credit to the farmer and
enterprises. Likewise FAO begun its assistance within few weeks after earthquake with the aim
of supporting the long term recovery and reconstruction work in agriculture and livelihood
sectors-targeting 1.5 millions people. During the span of 13 months, FAO distributed paddy,
maize, wheat and vegetables seeds, seed bags and seed bins and facilitated the temporary
collection centers for vegetables (FAO 2016b). Likewise, Lutheran World Relief (2016) has
begun its seed intervention three months after earthquake with the aim of supporting early
recovery of agriculture livelihood and food security. The intervention begun with distribution of
soybean seed together with agriculture tool and cash to one district (Lampung, later followed to
another district, Gorkha, as well), which has been followed monthly basis then after. Similarly
Save the Children (2016) has also distributed food, seed and cash to support immediate need and
early recovery of farmer livelihood while OXFAM (2015) has distributed paddy seed and cash
voucher to replenish the destroyed supply.
Despite these reports of crisis and intervention, the study of seed security level in pro-disaster
context has been missed in several disaster-affected regions-particularly in the village level. In
Dolakha only, it has been reported “no information” of 43 villages including Pawati as well
(OSOCC 2015). Also the seed intervention in several places has been either coupled with food
intervention (which is particularly based on food security assessment) or modeled on the basis of
the advice from District Agricultural Development Office (DADO) or District Disaster Relief
Committee (DDRC). For example, in Juabari VDC located in Gorkha district, local citizen
committee has recommended the name of receptionist to FAO for aid seed distribution(FAO,
2015a). In this regard, this paper will present current seed security status of the households living
at Pawati -8 in Dolakha district.
1.3 Statement of Problem
3
Paddy and maize rank the first and second foremost stables crops in Nepal. These crops together
represent the half grain-production of Nepal and are commonly grown above 70 meter above
(from sea level) in plane and 2830 meter above in hill and mountain of Nepal (Paudel, Matsuoka,
& others, 2009; Poudel and Shaw 2016). Maize is spring crop. When Nepal hit by the first big
earthquake in April, the farmer were close to season of maize. When Nepal again received
another big after shock in May 2015, they were close to paddy season. In this regard, this study
chooses paddy seed and maize seed to access the seed security level in pro-disaster context
(emergency context).
Comparing the seed security level before disaster with the seed security level after disaster is the
fundamental process of accessing the seed security level in pro-disaster context (FAO 2016a). In
Haiti earthquake case in 2010, seed security levels of two consecutive seasons after earthquake
has been compared with the seed security level before earthquake (CRS et al. 2010).This study
will also use two consecutive seasons (2015 and 2016) for maize seed and the first season (2015)
for paddy seed to access the seed security level in pro-disaster context.
Several authors and reports link the households’ seed insecurity level with the level of their
home stock seed loss and purchasing power (Sperling, 2004; Sperling et. Al, 2008; CRS, nd;
Sperling & Cooper, 2004). In case of Haiti, the household substantially lost their purchasing
power together with the loss of assets and other properties and could not afford the seed available
in the market (CRS et al. 2010).Similar case has been also registered in case of Malawi flood
case in 2015, where the households lost their seed stock in home to flood and could not purchase
seed from the local market (Walters and Ashman 2015). In Nepal as well, seed crisis in
households level has been linked with the level of home stock loss. With this regard, this study
will examine the seed security level based on the following indicators.
1. Total Amount of Seed Accessed
2. Amount of Seed Accessed from Home and Other Sources
3. Amount of Seed Purchased
For this, the study will use quantitative method.
4
1.4 Objective of Study
Board Objectives: To identify whether the households living at Pawati-8 were seed secured or
not after the earthquake in 25th April 2015
Objective 1: To examine whether the households living at Pawati-8 have been obtaining
sufficient seed or not since last earthquake
Research Question 1.1: Did the households living at Pawati-8 source lesser maize and paddy
seed for the first season after earthquake than normally required before earthquake?
Sub-Research question 1.2: Did the households living at Pawati-8 source lesser maize seed for
the second season after earthquake than normally required before earthquake?
Objective 2: To identify whether the households have been obtaining enough seed from home
stock or not
Research Question 2.1: Did the households living at Pawati-8 source lesser maize and paddy
seed from home stock for the first season after earthquake than normally required before
earthquake?
Research Question 2.1 Did the households living at Pawati-8 source lesser maize seed from
home stock for the second season after earthquake than normally required before earthquake?
Objective 3: To identify whether they have been accessing higher amount of seed from cash
purchase or not
Sub-Research Question 3.1: Did the households living at Pawati-8 purchase lesser maize and
paddy seed for the first season after earthquake than normally required before earthquake?
Sub-Research Question 3.2: Did the households living at Pawati-8 purchase lesser maize seed
for the second season after earthquake than normally required before earthquake?
1.5 Significance of Study The finding of this study would offer the information that can be used to guide the potential seed
intervention at Pawat-8. NGOs, INGOs and Governmental Bodies, currently involving in the
recovery activities of agriculture system in rural sectors of Nepal (in post-disaster context), could
also benefit from the finding as it provides the viable information of seed system in pro-disaster
context. The study would also provide large set of data across three seasons, which can be reused
for further studies and research in seed and agriculture sectors.
1.6 Delimitation of Study
5
The delimitation of study is process of defining the boundary of study which delimitates the
choice of objective, research questions, variables of interest, theoretical prospective and the
population under investigation (Simon 2011). In regard to this research, this study was confined
to the households living at Pawati-8 in Dolakha District of Nepal. It belongs to the district, which
was devastated by the earthquake in 25 April 2015 and is dominated by the households whose
livelihood is based on the farming activities. Apart from this, there exist five fundamental
elements: availability, access, varietal suitably, resilience and quality to access seed security
level in emergency context or pro disaster context. This study particularly focuses on availability
(in home) and accessibility (from home, other and purchase) of seed regardless of variety.
1.7 Limitations of Study
The households of Pawati-8 have been sourcing their seed from home stock, social network,
local market and government. This study does not use each of these sources separately. However
these sources are divided into home stock and other (social network + local market +
government) to represent them in this study.
Few variables used in this study have registered very few entries to perform statistical test. Those
variables are not used for inferential purpose but used for specific context.
1.8 Definition of Term Used Disaster: refers to the earthquake in 25th April 2015 and hundred of after shocks extended to end
of May 2015
Normal Season: refers one season just before the earthquake. This implies to seasons of maize
and paddy only where maize is basically grown from April to August while paddy is grown from
July to September
Pro-Disaster Season: refers to two consecutive seasons (2015 and 2016) after earthquake in
2015. This only implies to season of maize and paddy
Home Stock Seed: refers to the seed saved in home for up coming season.
Social Network: refers to the network among the neighbor, relatives and friends living at Pawati
Local Market: refers the local grain market at Pawati
Government: refers to the district agriculture office at Dolakha district in Nepal
Other: represents local market, government and social network.
Purchased seed: refers to seed purchased by paying money
Income: refers to the income generated by selling the harvest.
6
House: refers to the condition of house after May 2015. It is categorized into three levels: fully
damage, partially damage and no damage. Fully damage refers to collapse of house into rumble;
partial damage ranges from crack in wall to collapse of top floor; and no damage indicates that
the house is in same condition as it was before earthquake.
CHAPTER TWO: LITERATURE REVIEW
2.1 Concept Review
Seed Security: The most of definitions on whether a farmer living in a region is seed secured or
not grounds on whether seed has available or not; whether the farmer has ability to access it or
not; and whether seed possesses desired quality and variety or not. Among them, the definition
presented by FAO (2016a) associates the farmers’ seed security level with their ability to access
adequate seed of desired variety and planting material of adopted crops during both good and
bad season. Likewise, Scowcroft and Polak Scowcroft (as cited in Sperling and Cooper,
2004) �corresponds it with the farmers’ ability to access adequate amount of desired variety at
right time. While (Louwaars and Tripp 1999) believe on sustained access of desired variety
rather than only access. Similarly, Van Der Burg (1998) and (Sperling and Cooper 2004) admit
that the farmers need to access year after year rather than for imminent season of planting in
order to remain seed secured. Likewise Remington et al. (2002) believe that the adequate
availability of seed of adopted variety within the reasonable proximities at time of critical sowing
period defines the part of households’ seed security.
Conceptualization of Seed Security Level In Disaster Context Despite these several works in seed security concepts, how to measure seed security is still
remaining fundamental issue in seed security assessment, as there are no universally recognized
which presents the way of conceptualizing and visualizing seed security level at households
level.
7
Each pentagon consists five elements: Access, Availability, Seed Quality, Varietal Suitability,
and Resilience for measuring seed security level before and after disaster. The larger area (dark
blue) of each seed pentagon represents the theoretical maximum of seed security; the smaller
area (light blue) represents the actual seed security level; and length of each side of light blue
pentagon (corresponded to each above elements) represents the level of seed security based on
those elements. The change in the area of pentagon (light blue) indicates the change in seed
security level while change in the length of side indicates the change in the seed security based
on the elements. The above figure shows the smaller pentagon (light blue) in the right side than
the pentagon (light blue) in the left side with one equal side (availability). This change indicates
that the households are seed secured from seed availability element but not from other.
Seed Availability: The concept of seed availability is basically grounded on physical quantity,
time and space. Sperling and Cooper (2004) define that availability is geographical based
parameter and exists independent of socio-economical factors. They further extend that the
presence of target crop in a region defines the corresponding availability of seed in the region.
Remington et al. (2002) also agree on the spatial availability of seed, but extends that the
available seed should be the seed of adopted crops and should be available at time for critical
sowing period as well.
Apart from these definitions, FAO (2015b) presents the indicators of seed availability in
households’ level, which includes the following.
• Quantity of seed stock in home
8
• Quantity of seed stock known to exist in social network, local market and formal seed
sectors
• Quantity of seed available through seed aid organization at time of planting
• Proximities of seed source like distance to local market
Seed Accessibility: The concept of seed access is basically associated with the financial and
social ability of individual. Sperling & Cooper (2004) argues that the level of financial and social
captial of indiviudal detemines their corresponding seed access. They futher extends that income,
land, house and other physical properties repreesnt their financail capital while social relation,
power and status represents their social captial. Likewise Sperling, Cooper, and Remington
(2008) present different methods of access with respects to finanical captial and social captial.
These includes access from one saved seed, barter, exchnage, cash purchse, loan, and gift. They
furhther appriopriates these method of access with the seed sources. For example, the farmer
often accesses seed by purchase from local market but also from social network. Likewise social
network often facilaites exchnage, barter, gift or loan while the formal seed sectors can offer all
modes of access.
In addition, FAO (2015b) presents the indicators of accessibiliy which includes the following.
• Amount of seed accessible by hosueholds though social network ( social access)
• Level of households’ income obtained by different sources
• Level of physical assest
• Purchasing power of hosueholds
Acute and Chronic Seed Insecurity: The idea of acute and chronic seed insecurity is basically
gorunded on the duration of insecutiy and factors triggering that insecurity. Sperling( 2003)
belives that the short live events (disaster like flood and draught) trigger the seed shortage (acute
seed insecurity) for short while poverty or resource deprivation can sustain seed insecurity
(chronic seed insecurity) year after year. Sperling(2004) extends that crop failure in the single
season, or one time loss of seed stocks often pose the households to acute seed insecurity while
in the noraml scenarios, they are either seed secured or semi- seed secured or not seed secured (
chronic seed insecurity). She further adds that those hosueholds who recover their seed security
shortly immedaite after acute events (flood, earthquake or civil disturbance) falls into the
households suffering acute seed problem while rest falls into the category of chronic seed stress.
9
She also admits that the popualtion marginazed economically (poverty, land, labor) ,
ecologically(repeated draught, degraded land) and politically (war zone) often pose to higher risk
of chronic seed security.
Seed Availabiltiy and Accessiblity ( Assumptions, Findings and Cases) The cases of seed avaialiblity includes the assumptions, findings, and cases –arguring on the
wether seed remains avaialble or not during the stress or at least during the first season after
disaster. These include assumption (often by seed relief agency to guide their seed intervention
in emergency context) which states “seed remains unavailable locally during acute stress”; and
include the case of southern Somalia (1992-93) where widespread displacement of community
detached them from the farming activities and posed them to risk of absolute unavailability of
seed Sperling (2004). In contrary to these, these include findings from Sperling & Cooper (2004)
which states that the absolute unavaialbiltiy of seed is very rare case since at least one source of
seed keeps potentail to serve in the crisis (either in local market or agro dealer); and include the
findings of Haiti Earthquake (2010) and Southern Malawi Flood Case (2015), where seed
remains avaialble in the local seed system despite significant loss in home stock.
The cases of seed availaiblity and accessiblity include studies comapring the relative strenght of
each sources during the stress. These includes the study of Sperling & Cooper (2004) which
believes that the local seed system meets higher proportion of seed damand than the formal seed
system during crisis, includes the findings (based on the several case studies in Africa) by
Sperling, Cooper, and Remington (2008) which admit the role of local grain mareket always
remains influentreital during the crisis; incldue the case of Haiti, where more than 75% need of
seed came from the local market; and include the case of Malawi where the local agro dealer and
local market have enough seed to meet the seed crisis generated by flood.
The issue of avaialbility also incldues the cases –reporting general misconception on defining the
problem of availability and problem of utilization (variety and quality). This incldues the
clarification by CRS (nd) in the context of seed intervention, which states that if seed is available
and not of desired quality and variety, then it is problem of seed utilization, not the problem of
seed availability.
The issue of availaiblity and accessibltiy also include a case -explaing the complxities on
defining the scale of avaiability. This include a study from Sperling (2004) which indicates that
the avaialbility can be relatively defined depending upon the social and financial abaility of
10
indiviudal. For example, for the individual posseses enough money and transport, the seed
existed outside his/her community/region is also available (Sperling, 2004).
The issue of availability also incldues the cases –comapring the availability based on the seed
multiplicaltion rate. This includes the study from Sperling, Cooper, and Remington (2008) which
agrues that it is more likely to have problem of seed availability to those crops which has lower
seed multiplication rate. For example, small grain crops like millet retains higher multiplication
rate ( only 1% of harvest is enough for next planting). In this sitaution, only total harvest failure
can deplete home stock seed.
Simillary the issue of accessiblity incldues the literatures explaing the reasons of reduced access.
These incldue the remark of Sperling & Cooper (2004) which, in general, states that the reduced
access in crisis period is often triggered with the financial constraint; include the case of Haiti
where the reduced access came significantly from hike in seed price, the lower purchasing
power, poor land tenure, repeated health issue and destrcution of infrastrure; include the case of
Malawi, where it was associated with the harvest loss and reduced income; and include the list of
(CRS n.d.) which enlists the collapse of local market and poor social network for the reduced
access; and includes the findings from Poudel et al. (as cited in Coomes et al., 2015) which
admits that the community with weak social connection have always constrainted access to
locally adopted crops –posing them risk during the advesrse condition.
The issue of accessbility includes studies - reporting condition of secure access. These include
the study by Sperling, Cooper, and Remington (2008) which presents that the households owing
secure land and labor can find way to access the seeds of key crops during the stress, incldue the
study from (Sperling 2004) which admits that the access to variety can be only problem when
pest and diseases leads total vareital breakdown.
Seed Security Assessment (SSA): The seed security assessment basically offers four
fundamental tools: availability, access, varietal suitability and quality to access the seed secuity
level during three board sitautions: postracted situation, non-emergency and post-
disaster/emergency. In postracted crisis, the seed secuity may rise or fall toghether with periodic
worsening and improvements of situation. When there appears “sudden change” in seed seucity
level within the overal context, then it may be viable to use the assessment based on before and
after technique with respect to “suddent change”. In non- emergency context, it uses current seed
security sitaution without comparing it with any other situation. In contrary to this, the seed
11
security assessment in pro-disaster context uses at least two situations: situation before disaster
and situation after disaster for comparion. The situation after disaster often includes two seasons
FAO (2016a).
2.2 Conceptual Framework Concetual framewrok refers to the constuct or structure of interliked concepts that provides the
comprehensive understanding of phenomena. It includes the layout of variables and presumes the
relation among them(Teoh and Pan 2004). With regard to this study as well, the layout of
varaibles has been presented to provide visual description of phenomena.


![Easy Slide Card - txstampin2019.s3-us-west-2.amazonaws.comSlide+Card.pdf · • Bermuda Bay 3/8" Mini Chevron Ribbon [144198] $7.00 . ng:gtampinup.net . Title: Microsoft Word - Document12](https://static.documents.pub/doc/80x56/5d4e1cae88c993b4648b6718/easy-slide-card-txstampin2019s3-us-west-2-slidecardpdf-bermuda-bay.jpg)


