1 Documentation for Vintage 2014 Bridged-Race Postcensal Population Estimates for Calculating Vital Rates The Vintage 2014 bridged-race postcensal population estimates files contain estimates of the resident population of the United States as of April 1, 2010 - July 1, 2014 (based on the 2010 census). The following series of postcensal estimates are being released by the National Center for Health Statistics (NCHS): 1) Ages 0 to 85 years and over: County postcensal estimates of the resident population of the United States (April 1, 2010 and July 1, 2010-July 1, 2014) by year, county, single-year of age (0, 1, 2, ..., 85 years and over), bridged-race category (White, Black or African American, American Indian or Alaska Native, Asian or Pacific Islander), Hispanic origin (not Hispanic or Latino, Hispanic or Latino), and sex (1). These estimates are available for download; 2) Ages 85 to 100 years and over: National postcensal estimates of the U.S. resident population 85 years and over (April 1, 2010 and July 1, 2010, July 1, 2010 - July 1, 2014) by year, single-year of age (85, 86, ..., 100 years and over) bridged-race category (White, Black or African American, American Indian or Alaska Native, Asian or Pacific Islander), Hispanic origin (not Hispanic or Latino, Hispanic or Latino), and sex (2). These estimates are available by special request. The estimates on these files are based on Census 2010 and result from bridging the Vintage 2014 postcensal estimates with 31 race groups (the 31 race groups used in Census 2010 in accordance with the 1997 Office of Management and Budget (OMB) standards for the collection of data on race and ethnicity) to the four race categories specified under the 1977 OMB standards (3, 4). Source of the Estimates The Vintage 2014 bridged-race postcensal estimates were produced by the Population Estimates Program of the U.S. Census Bureau in collaboration with NCHS. NOTE: The U.S. Census Bureau annually releases unbridged population estimates for five-year age groups and race at the county level (http://www.census.gov/popest/) The Census Bureau does not release bridged-race or unbridged estimates by single year of age at the county level due to concerns about the reliability of these estimates. However, these estimates are provided to the National Center for Health Statistics to meet programmatic needs such as the creation of age groupings that differ from the standard groupings used by the Census Bureau.
Transcript
1
Documentation for Vintage 2014 Bridged-Race Postcensal Population Estimates for Calculating Vital Rates
The Vintage 2014 bridged-race postcensal population estimates files contain estimates of the resident population of the United States as of April 1, 2010 - July 1, 2014 (based on the 2010 census). The following series of postcensal estimates are being released by the National Center for Health Statistics (NCHS):
1) Ages 0 to 85 years and over: County postcensal estimates of the residentpopulation of the United States (April 1, 2010 and July 1, 2010-July 1, 2014) byyear, county, single-year of age (0, 1, 2, ..., 85 years and over), bridged-racecategory (White, Black or African American, American Indian or Alaska Native,Asian or Pacific Islander), Hispanic origin (not Hispanic or Latino, Hispanic orLatino), and sex (1). These estimates are available for download;
2) Ages 85 to 100 years and over: National postcensal estimates of the U.S.resident population 85 years and over (April 1, 2010 and July 1, 2010, July 1,2010 - July 1, 2014) by year, single-year of age (85, 86, ..., 100 years and over)bridged-race category (White, Black or African American, American Indian orAlaska Native, Asian or Pacific Islander), Hispanic origin (not Hispanic or Latino,Hispanic or Latino), and sex (2). These estimates are available by specialrequest.
The estimates on these files are based on Census 2010 and result from bridging the Vintage 2014 postcensal estimates with 31 race groups (the 31 race groups used in Census 2010 in accordance with the 1997 Office of Management and Budget (OMB) standards for the collection of data on race and ethnicity) to the four race categories specified under the 1977 OMB standards (3, 4).
Source of the Estimates
The Vintage 2014 bridged-race postcensal estimates were produced by the Population Estimates Program of the U.S. Census Bureau in collaboration with NCHS.
NOTE: The U.S. Census Bureau annually releases unbridged population estimates for five-year age groups and race at the county level (http://www.census.gov/popest/) The Census Bureau does not release bridged-race or unbridged estimates by single year of age at the county level due to concerns about the reliability of these estimates. However, these estimates are provided to the National Center for Health Statistics to meet programmatic needs such as the creation of age groupings that differ from the standard groupings used by the Census Bureau.Users of the single-year-of-age county-level bridged racepopulation estimates should carefully consider the limitedreliability of these estimates.
The Census Bureau released the unbridged Vintage 2014 postcensal series of estimates (five single-race groups and one group for two or more races) by 5-year age group on June 25, 2015. NCHS released the bridged-race Vintage 2014 postcensal estimates by single-year of age on June 30, 2015 (1, 2). Population Estimates Background
What are April 1, census counts? The census of population (decennial census)
enumerates the resident population of the United States as of April 1 of the census year. Data on sex, race, age, and Hispanic origin are collected from 100% of the enumerated population and are referred to as census counts. The Census Bureau adjusts the 100% April 1 count data for: 1) errors in the census data discovered, 2)
nonspecified race and Hispanic origin. Note: the April 1 estimates used as the base population for the 2010-based postcensal estimates series differ from the April 1 census counts (see below).
What is the base population? The base population is the set of population counts or estimates used as the starting point in the estimates process. For the postcensal and intercensal estimates series it is the most recent updated April 1 estimate. For the 2010-based postcensal estimates series, the enumerated census population is modified in two ways to produce the April 1, 2010 estimates base population:
1) “Some Other Race” responses in the 2010 Census are modified so the race categories in the census data match those that appear in the administrative data bases (9). When a “Some other race” response appears in combination with one or more of the five 1997 OMB race categories, the “Some other race” response is dropped. “Some Other Race alone” responses are allocated to one or more of the five OMB categories. This modification is done one time, at the beginning of the decade.
2) Changes to the 2010 Census population due to the Count Question Resolution program, legal boundary updates reported by January 1, of the year of the estimates series, and other geographic program revisions are incorporated (9). This modification may be done throughout the decade.
What are postcensal population estimates? - Postcensal population estimates
are estimates made for the years following a census, before the next census has been taken. They are derived by updating the base population (the modified resident population enumerated in the decennial census) using various measures of population change including: births to U.S. resident women, deaths to U.S. residents, net international immigration, net movement of U.S. Armed Forces and civilian citizens of the U.S., and migration within the U.S. The Census Bureau annually produces a series of postcensal estimates that includes estimates for the current data year and revised estimates for earlier years. Estimates for earlier years in a given series are revised to reflect: 1) changes in the components of population change data sets (for example, a preliminary natality file is replaced with a final natality file), 2) changes to the population
3
estimates, and 3) changes in the estimation methodology. The base population may also be updated annually. A series of estimates is referred to as a Vintage and the last year in the series is used to name it. For example, the Vintage 2012 postcensal series has estimates for July 1, 2010 July 1, 2011, and July 1, 2012. Because of the revisions made to the estimates in each series, pulling estimates from several vintages rather than from a single vintage may introduce discontinuities.
What are intercensal population estimates? - Intercensal population estimates are estimates made for the years between two completed censuses which take into account the census at both the beginning and end of the decade. Intercensal estimates are derived by adjusting the final postcensal estimates for the decade to account for differences between the April 1, base population (from the census at the end of the decade) and the postcensal estimates for April 1 of that census year. For example, after completion of the 2010 census, the postcensal estimates for the period between April 1, 2000 and April 1, 2010 were modified to account for differences between the April 1, 2010 census counts and the April 1, 2010 postcensal estimates (based on the 2000 census). Replacement of postcensal estimates with intercensal estimates is desirable because as the end of the decade approaches, the postcensal estimates become increasingly less accurate.
Methodology changes for 2010-based postcensal population estimates – The Census Bureau frequently implements changes to the methodology used to derive the base population data base and the postcensal population estimates. Major methodology changes may affect comparison of population estimates across vintages.
Methodology changes effective with Vintage 2014: No substantivemethodology changes were implemented for Vintage 2014 (5).
Methodology changes effective with Vintage 2013: The Vintage 2013
estimates reflect the following changes in the estimation methodology: 1) improvements in the methodology and data inputs used to derive state and county total population estimates; 2) changes in the methodology and data inputs used to assign race to military personnel and to estimate international migration of military personnel, and 3) modification of the data inputs used for computation of deaths (6, 7).
Methodology changes effective with Vintage 2012: The Vintage 2012population estimates reflect improvements in the estimates methodology and data inputs (8, 9). Major improvements include changes in: 1) estimation of net international migration, 2) estimation of deaths to people 70 years and over by age, sex, race, and Hispanic origin, 3) assignment of race and Hispanic origin characteristic detail to domestic migrants with 2010 Census data, 4) incorporation of 2010 Census Count Question Resolution Program corrections in the estimates base population, and 5) incorporation of Post-2010 Census Group Quarters updates in the estimates base population.
4
Race Bridging Background
What is race bridging? - Race bridging refers to making data collected using one set of race categories consistent with data collected using a different set of race categories, to permit estimation and comparison of race-specific population-based statistics at a point in time or over time. More specifically, race bridging is a method used to make multiple-race and single-race data collection systems sufficiently comparable to permit estimation and analysis of race-specific statistics.
OMB’s 1977 and 1997 standards on race and ethnicity - In 1997, OMB issued “Revisions to the Standards for the Classification of Federal Data on Race and Ethnicity,” which supersedes the 1977 Statistical Policy Directive 15, “Race and Ethnic Standards for Federal Statistics and Administrative Reporting” (3, 4). Both documents specify rules for the collection, tabulation, and presentation of race and ethnicity data within the Federal statistical system. The race categories specified in both standards represent a social-political construct and are not anthropologically or biologically based. The revised standards increased the minimum number of race categories to be used by Federal agencies from four (White, Black, American Indian or Alaska Native, and Asian or Pacific Islander) to five (White, Black or African American, American Indian or Alaska Native, Asian, and Native Hawaiian or Other Pacific Islander). In addition, the revised standards require Federal data collection programs to allow respondents to select more than one race category when responding to a query on their racial identity. This provision means that under the revised standards there are potentially 31 race groups (5 single-race and 26 multiple-race), depending on whether an individual selects one, two, three, four, or all five of the single-race categories.
Why race bridge? - During the transition to full implementation of the 1997 OMB standards on race and ethnicity (see paragraph above), two different standards for the collection of race and ethnicity data are being used, creating incomparability across data systems. For example, the 2000 and 2010 censuses collected race data in accordance with the 1997 OMB standards – resulting in population estimates for five single-race categories and up to 26 multiple-race categories. Because implementation of the 1997 standards within the Vital Statistics Cooperative System did not begin until 2003 and is not yet complete, Census data and vital statistics data have incomparable race categories. Race bridging also may be needed within a given data system because the change in the race standards results in incomparability across time, thus making it difficult to perform trend analyses. The OMB recognized that race-bridging approaches would be needed to make race data collected under the 1997 standards comparable to race data collected under the 1977 standards. Therefore, the OMB issued “Provisional Guidance on the Implementation of the 1997 Standards for Federal Data on Race and Ethnicity” (10). The guidance document contains a detailed discussion of various bridging methods.
What is the NCHS regression bridging method? – The bridging methodology developed by NCHS bridges the multiple-race group population counts to the four
5
single-race categories specified in the 1977 OMB standards (11, 12). Information from the pooled 1997-2000 National Health Interview Survey (NHIS) was used to develop the bridging methodology. Regression models with person-level and county-level covariates were used to generate the probability of selecting each single-race category possible for a multiple-race group. The probabilities generated from the fitted regression models are referred to as the NHIS bridging proportions. The Census Bureau has applied the NHIS bridging proportions generated by NCHS to the Census 2000 and Census 2010 counts, to the annual postcensal series of estimates for 2000-2013, and to the 2000-2009 intercensal estimates (the same set of bridging proportions was applied for all estimates series). These applications have resulted in bridged population estimates for each of the four single-race categories (White, Black or African American, American Indian or Alaska Native, and Asian or Pacific Islander) by county, age, Hispanic origin group, and sex. The bridging methodology is described in detail in the report, “United States Census 2000 Population with Bridged Race Categories” (which is available for download from this site) (11).
Why does NCHS use bridged-race population estimates? - Vital statistics rates are based on information obtained from vital records collected through the state-based Vital Statistics Cooperative Program (numerators) and population estimates derived from the U.S. Census Bureau (denominators). Implementation of the 1997 OMB standards within the Vital Statistics Cooperative System did not begin until 2003, and is proceeding on an individual state basis. Birth data for ten states in 2011, nine states in 2012, six states in 2013, two states in 2014, and are based on the 1989 revision of the U.S. Standard Certificate of Live Birth that follows the 1977 OMB standard, allowing only a single race to be reported. Twelve states in 2011, ten in 2012, eight in 2013, and 4 in 2014 continued to report the minimum set of four single-races stipulated under the 1977 OMB standards on their death certificates. For this reason and because of the need for birth and death trend data, NCHS continues to compute rates using the 1977 OMB race categories. With implementation by the states of the revised birth and death certificates nearing completion, NCHS will soon be able to present rates using population estimates that comply with the 1997 standards.
Production of the Vintage 2014 Bridged-Race Postcensal Series
Using the race bridging methodology described in “Race Bridging Background”, the Census Bureau, in collaboration with NCHS, derived the Vintage 2014 series of bridged-race postcensal estimates from the Vintage 2014 postcensal series with 31 race groups (the 31 race groups used in Census 2010). Modified population counts from the 2010 census serve as the base data for this 2010-based postcensal series (5).
6
Variance of Bridged-Race Population Estimates
Population estimates generally are assumed to be fixed and do not contribute to the variance of rates. However, this is not true for bridged-race population estimates. Although efforts were made to use the best available data and methods to produce the bridged-race estimates, the modeling process introduces error into the estimates. The potential for error will be greatest for the smallest population groups, particularly the smaller race groups and county level estimates. Methodology to compute variances for bridged-race population estimates has been developed (13).
Geographic Codes in the Bridged-Race Population Files
County geography changes over time – new counties are created and old counties are deleted or their boundaries are modified (14). Changes that have occurred in the county FIPS codes on the bridged-race population files (as a result of county geography changes that affected population estimates for 1990-2014) are detailed in Appendix I.
NCHS Use of Bridged-Race Population Estimates
NCHS publishes national (and some state) birth and death rates on an annual basis. Beginning with 2001, NCHS used bridged-race postcensal population estimates to calculate race-specific birth and death rates for the annual preliminary and final birth and death reports. The 2001-2009 and 2011 and later vital rates in these reports were calculated using population estimates from the bridged-race postcensal estimates series corresponding with each data year (i.e., vital rates for 2001 were calculated using population estimates from the Vintage 2001 bridged-race postcensal series, vital rates for 2002 were calculated using estimates from the Vintage 2002 bridged-race postcensal series, and so forth).
Some vital rates for 2001-2009 have been recalculated using the bridged-race intercensal population estimates and published (15, 16).
Vital rates for 2010 were calculated using April 1, 2010 bridged-race census counts. NCHS did not use the Vintage 2010 postcensal population estimates to calculate vital rates.
Release of Bridged-Race Population Estimates
In response to the need for bridged estimates by a wide range of users, NCHS makes the bridged-race population estimates available for download from the web site “U.S. Populations with Bridged Race Categories” (http://www.cdc.gov/nchs/nvss/bridged_race.htm). The report detailing the bridging methodology, “United States Census 2000 Population with Bridged Race Categories”, also is available for download from this site (11).
NCHS would appreciate receiving feedback on the usefulness of the bridged-race estimates as well as notification of any problems that have been identified. Comments or questions about the estimates may be sent via e-mail to:
Ages 0 to 85 years and over National Center for Health Statistics. Vintage 2014 postcensal estimates of the resident population of the United States (April 1, 2010, July 1, 2010-July 1, 2014), by year, county, single-year of age (0, 1, 2, .., 85 years and over), bridged race, Hispanic origin, and sex. Prepared under a collaborative arrangement with the U.S. Census Bureau. Available from: http://www.cdc.gov/nchs/nvss/bridged_race.htm as of June 30, 2015, following release by the U.S. Census Bureau of the unbridged Vintage 2014 postcensal estimates by 5-year age group on June 25, 2015.
Ages 85 to 100 years and over National Center for Health Statistics. Vintage 2014 postcensal estimates of the resident population of the United States (April 1, 2010, July 1, 2010-July 1, 2014), by single-year of age (85, ...., 100 years and over), bridged race, Hispanic origin, and sex. Prepared under a collaborative arrangement with the U.S. Census Bureau. Available from NCHS on request as of June 30, 2015, following release by the U.S. Census Bureau of the unbridged Vintage 2014 postcensal estimates by 5-year age group on June 25, 2015.
1. National Center for Health Statistics. Vintage 2014 postcensal estimates of theresident population of the United States (April 1, 2010, July 1, 2010-July 1, 2014), by year, county, single-year of age (0, 1, 2, .., 85 years and over), bridged race, Hispanic origin, and sex. Prepared under a collaborative arrangement with the U.S. Census Bureau. Available from: http://www.cdc.gov/nchs/nvss/bridged_race.htm as of June 30, 2015, following release by the U.S. Census Bureau of the unbridged Vintage 2014 postcensal estimates by 5-year age group on June 25, 2015.
2. National Center for Health Statistics. Vintage 2014 postcensal estimates of theresident population of the United States (April 1, 2010, July 1, 2010-July 1, 2014), by single-year of age (85, ...., 100 years and over), bridged race, Hispanic origin, and sex. Prepared under a collaborative arrangement with the U.S. Census Bureau. Available from NCHS on request as of June 30, 2015, following release by the U.S. Census Bureau of the unbridged Vintage 2014 postcensal estimates by 5-year age group on June 25, 2015.
3. Office of Management and Budget. Revisions to the standards for the classification ofFederal data on race and ethnicity. Federal Register 62FR58781-58790, October 30, 1997. Available from: http://www.whitehouse.gov/omb/fedreg/1997standards.html.
4. Office of Management and Budget. Race and ethnic standards for Federal statisticsand administrative reporting. Statistical Policy Directive 15. May 12,1977.
5. U.S. Census Bureau. Methodology for the United States population estimates:Vintage 2014 nation, states, counties, and Puerto Rico – April 1, 2010 to July 1, 2014.
6. U.S. Census Bureau. Vintage 2013 population estimates release notes. Availablefrom: http://www.census.gov/popest/methodology/2013-est-relnotes.pdf.
7. U.S. Census Bureau. Methodology for the United States population estimates by age,sex, race, and Hispanic origin (Vintage 2013): April 1, 2010 to July 1, 2013. Available from: http://www.census.gov/popest/methodology/2013-nat-st-co-meth.pdf.
8. U.S. Census Bureau. Vintage 2012 population estimates release notes. Availablefrom: http://www.census.gov/popest/methodology/2012-est-relnotes.pdf. 2013
9. U.S. Census Bureau. Methodology for the United States resident populationestimates by age, sex, race, and Hispanic origin and the state and county total resident population estimates (Vintage 2012): April 1, 2010 to July 1, 2012. Available from http://www.census.gov/popest/methodology/2012-nat-st-co-meth.pdf.
10. Office of Management and Budget. Provisional guidance on the implementation ofthe 1997 standards for the collection of Federal data on race and ethnicity. December 15, 2000. Available from:
11. Ingram DD, Parker JD, Schenker N, Weed JA, Hamilton B, Arias E, Madans JH.United States Census 2000 population with bridged race categories. Vital Health Stat 2(135). Hyattsville, Maryland: National Center for Health Statistics. 2003. Available from: http://www.cdc.gov/nchs/data/series/sr_02/sr02_135.pdf.
12. Parker JD, Schenker N, Ingram DD, Weed JA, Heck KE, Madans JH.Bridging between two standards for collecting information on race and ethnicity: an application to Census 2000 and vital rates. Public Health Reports 119(2):192-205. 2004
13. Schenker, N. Assessing variability due to race bridging: application to Censuscounts and vital rates for the Year 2000. J American Statistical Association 98:818-28. 2003.
14. U.S. Census Bureau. Substantial changes to counties and county equivalententities: 1970-present. Available from: http://www.census.gov/geo/reference/county-changes.html.
15. Hamilton BE, Martin JA, Ventura SJ. Births: Preliminary Data for 2011. National VitalStatistics Reports; vol 61, no 5. Hyattsville, MD: National Center for Health Statistics. 2012. Available from: http://www.cdc.gov/nchs/data/nvsr/nvsr61/nvsr61_05.pdf.
16. Hoyert DL, Xu JQ. Deaths: Preliminary Data for 2011. National Vital StatisticsReports; vol 61 no 6. Hyattsville, MD: National Center for Health Statistics. 2012. Available from: http://www.cdc.gov/nchs/data/nvsr/nvsr61/nvsr61_06.pdf.
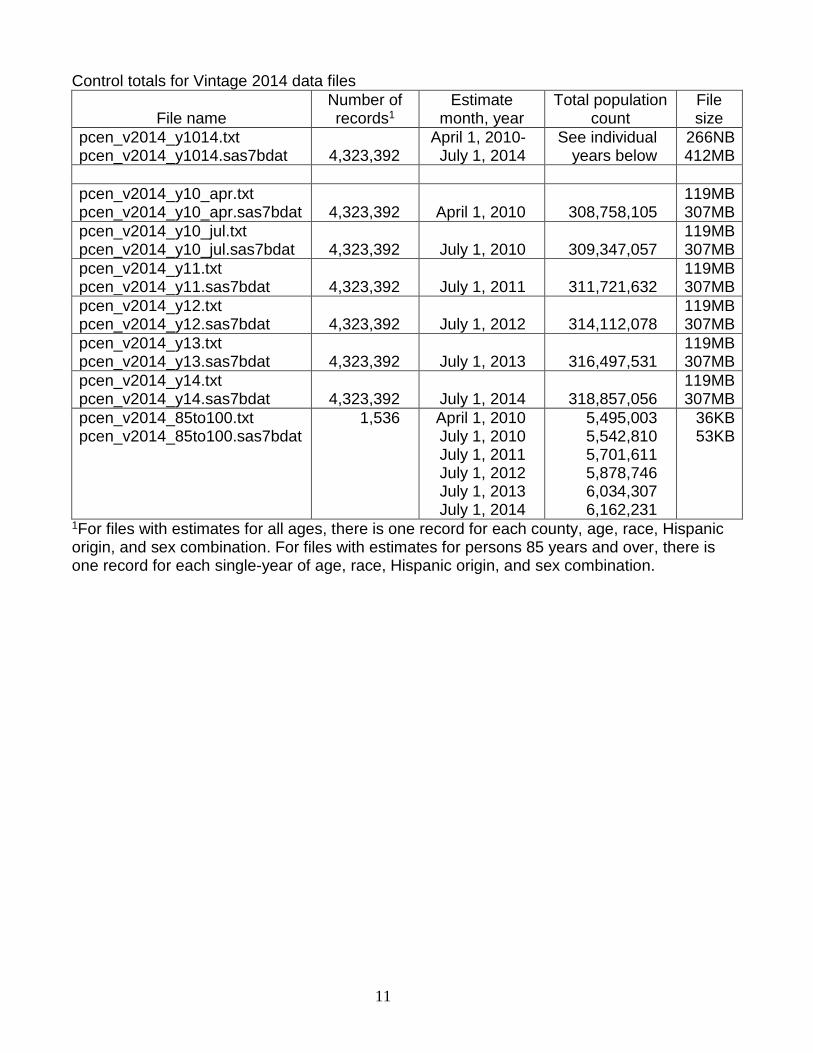
The following Vintage 2014 postcensal series with estimates for July 1, 2010-July 1, 2014 are available as text and SAS files.
Estimates for persons 0 to 85 years and over - The bridged-race Vintage 2014 postcensal estimate series (July 1, 2010-July 1, 2014) for persons 0 to 85+ years contains bridged-race postcensal estimates of the July 1 resident population of the United States by year, county, age (0, 1,…, 85 years and over), bridged-race category (White, Black or African American, American Indian or Alaska Native, Asian or Pacific Islander), Hispanic origin (not Hispanic or Latino, Hispanic or Latino), and sex. There is a record on each file for each combination of county, age, race, Hispanic origin, and sex. Text and SAS files are available for download. Age, sex, and Hispanic origin subtotals for “All races” obtained from the bridged-race files are consistent with those from the unbridged files.
Estimates for persons 85 to 100 years and over - The bridged-race Vintage2014 estimate series (April 1, 2010-July 1, 2014) for persons 85 to 100+ years contain bridged-race postcensal estimates of the resident population of the United States by year, single-year of age (85, 86, …, 100 years and over), bridged-race category (White, Black or African American, American Indian or Alaska Native, Asian or Pacific Islander), Hispanic origin (not Hispanic or Latino, Hispanic or Latino), and sex. There is a record on each file for each combination of month, year, age, race, Hispanic origin, and sex. Text and SAS files are available on request. The race, sex, and Hispanic origin subtotals for “Ages 85 and over combined” derived from these files do not match corresponding subtotals from the files with estimates for persons aged 0 to 85+ years.
The bridged-race population estimates on the files were derived by the U.S. Census Bureau using modified population counts from the 2010 census as the base file. The U.S. Census Bureau released the unbridged Vintage 2014 population estimates by 5-year age group on June 25, 2015. NCHS released the bridged-race Vintage 2014 estimates by single-year of age on June 30, 2015.
1For files with estimates for all ages, there is one record for each county, age, race, Hispanic origin, and sex combination. For files with estimates for persons 85 years and over, there is one record for each single-year of age, race, Hispanic origin, and sex combination.
12
File layout for text file with estimates for years 2010-2014 and ages 0 to 85+ years: pcen_v2014_y1014.txt
Field Location size Item and code outline Format
1-4 4 Series vintage Numeric (2014) 5-6 2 State FIPS code Numeric 7-9 3 County FIPS code Numeric 10-11 2 Age Numeric (0, 1, 2,…, 85 years and over)
12 1 Bridged-race-sex Numeric 1=White male 2=White female 3=Black or African American male 4=Black or African American female 5=American Indian or Alaska Native male 6=American Indian or Alaska Native female 7=Asian or Pacific Islander male 8=Asian or Pacific Islander female
13 1 Hispanic origin Numeric 1=not Hispanic or Latino 2=Hispanic or Latino
14-21 8 April 1, 2010 base population estimate Numeric 22-29 8 July 1, 2010 postcensal resident population estimate Numeric 30-37 8 July 1, 2011 postcensal resident population estimate Numeric 38-45 8 July 1, 2012 postcensal resident population estimate Numeric 46-53 8 July 1, 2013 postcensal resident population estimate Numeric 54-61 8 July 1, 2014 postcensal resident population estimate Numeric
13
File layout for SAS file with estimates for 2010-2014 and ages 0 to 85+ years: pcen_v2014_y1014.sas7bdat
Variable name Item and code outline Format
VINTAGE Series vintage Numeric (2014) ST_FIPS State FIPS code Numeric
CO_FIPS County FIPS code Numeric AGE Age Numeric
(0, 1, 2, …, 85 years and over) RACESEX Bridged-race-sex Numeric
1=White male 2=White female 3=Black male 4=Black female 5=American Indian or Alaska Native male 6=American Indian or Alaska Native female 7=Asian or Pacific Islander male 8=Asian or Pacific Islander female
HISP Hispanic origin Numeric
1=not Hispanic or Latino 2=Hispanic or Latino
POP2010_apr April 1, 2010 base population estimate Numeric POP2010_jul July 1, 2010 postcensal resident population estimate Numeric POP2011 July 1, 2011 postcensal resident population estimate Numeric POP2012 July 1, 2012 postcensal resident population estimate Numeric POP2013 July 1, 2013 postcensal resident population estimate Numeric POP2014 July 1, 2014 postcensal resident population estimate Numeric
14
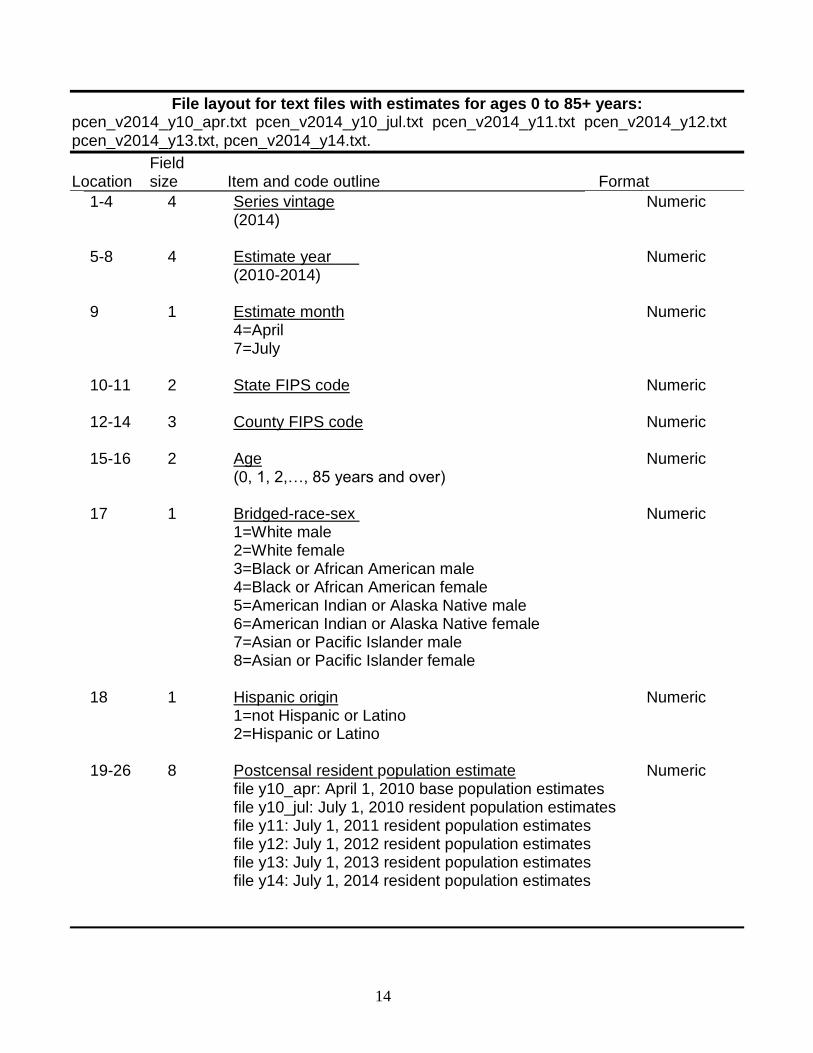
File layout for text files with estimates for ages 0 to 85+ years: pcen_v2014_y10_apr.txt pcen_v2014_y10_jul.txt pcen_v2014_y11.txt pcen_v2014_y12.txt pcen_v2014_y13.txt, pcen_v2014_y14.txt.
Field Location size Item and code outline Format
1-4 4 Series vintage Numeric (2014) 5-8 4 Estimate year Numeric (2010-2014) 9 1 Estimate month Numeric 4=April 7=July 10-11 2 State FIPS code Numeric 12-14 3 County FIPS code Numeric 15-16 2 Age Numeric (0, 1, 2,…, 85 years and over)
17 1 Bridged-race-sex Numeric 1=White male 2=White female 3=Black or African American male 4=Black or African American female 5=American Indian or Alaska Native male 6=American Indian or Alaska Native female 7=Asian or Pacific Islander male 8=Asian or Pacific Islander female
18 1 Hispanic origin Numeric 1=not Hispanic or Latino 2=Hispanic or Latino
19-26 8 Postcensal resident population estimate Numeric
file y10_apr: April 1, 2010 base population estimates file y10_jul: July 1, 2010 resident population estimates file y11: July 1, 2011 resident population estimates
file y12: July 1, 2012 resident population estimates file y13: July 1, 2013 resident population estimates file y14: July 1, 2014 resident population estimates
15
File layout for SAS files with estimates for ages 0 to 85+ years: pcen_v2014_y10_apr.sas7bdat pcen_v2014_y10_jul.sas7bdat pcen_v2014_y11.sas7bdat pcen_v2014_y12.sas7bdat v2014_y13.sas7bdat, v2014_y14.sas7bdat
Variable name Item and code outline Format
VINTAGE Series vintage Numeric (2014) YEAR Estimate year Numeric (2010-2014) MONTH Estimate month 4=April 7=July ST_FIPS State FIPS code Numeric
CO_FIPS County FIPS code Numeric AGE Age Numeric
(0, 1, 2, …, 85 years and over) RACESEX Bridged-race-sex Numeric
1=White male 2=White female 3=Black male 4=Black female 5=American Indian or Alaska Native male 6=American Indian or Alaska Native female 7=Asian or Pacific Islander male 8=Asian or Pacific Islander female
HISP Hispanic origin Numeric
1=not Hispanic or Latino 2=Hispanic or Latino
Pop Postcensal resident population estimate Numeric
file y10_apr: April 1, 2010 base population estimates file y10_jul: July 1, 2010 resident population estimates file y11: July 1, 2011 resident population estimates file y12: July 1, 2012 resident population estimates file y13: July 1, 2013 resident population estimates file y14: July 1, 2014 resident population estimates
16
File layout for text file with estimates for persons aged 85 to 100+ years: pcen_v2014_85to100.txt
Field Location size Item and code outline Format
1-4 4 Series vintage Numeric (2014) 5-8 4 Estimate year Numeric (2010-2014) 9 1 Estimate month Numeric 4=April 7=July 10-12 3 Age Numeric 85 = 85 years 86 = 86 years … 100=100 years and over
13 1 Bridged-race-sex Numeric 1=White male 2=White female 3=Black or African American male 4=Black or African American female 5=American Indian or Alaska Native male 6=American Indian or Alaska Native female 7=Asian or Pacific Islander male 8=Asian or Pacific Islander female
14 1 Hispanic origin Numeric 1=not Hispanic or Latino 2=Hispanic or Latino
15-22 8 Postcensal resident population estimate Numeric (April 1, 2010 census count, July 1, 2010-July 1, 2014 postcensal estimates)
17
File layout for SAS file with estimates for persons aged 85 to 100+ years: pcen_v2014_85to100.sas7bdat
Variable name Item and code outline Format
VINTAGE Series vintage Numeric (2014) YEAR Estimate year Numeric (2010-2014) MONTH Estimate month Numeric 4=April 7=July
AGE Age Numeric 85 =85 years
86 = 86 years … 100 = 100 years and over)
RACESEX Bridged-race-sex Numeric
1=White male 2=White female 3=Black male 4=Black female 5=American Indian or Alaska Native male 6=American Indian or Alaska Native female 7=Asian or Pacific Islander male 8=Asian or Pacific Islander female
HISP Hispanic origin Numeric
1=not Hispanic or Latino 2=Hispanic or Latino
Pop Postcensal resident population estimate Numeric (April 1, 2010 census count, July 1, 2010-July 1, 2014 postcensal
estimates)
18
APPENDIX I
County geography changes over time – new counties are created and old counties are deleted or their boundaries altered. (14). As a result, the counties/county equivalents for which estimates are available in each of the bridged-race population series varies somewhat. For example, the Vintage 2009 files have population estimates for three new Alaska county equivalents (Wrangell Borough, Petersburg Census Area, and Prince of Wales-Hyder Census Area) and do not have estimates for two former Alaska county equivalents (Wrangell-Petersburg Census Area and Prince of Wales-Outer Ketchikan Census Area). The tables below summarize differences in county geography across the various estimates series.
New counties and county equivalents on the bridged-race population files: 1990-2014
Estimates series
Number of counties
New county or county equivalent
BroomfieldCounty, CO (08014)
Hoonah-Angoon Census Area, AK (02105)
Skagway Municipality, AK (02230)
Petersburg Census Area, AK (02195)
Prince of Wales-Hyder Census Area, AK (02198)
Wrangell City and Borough, AK (02275)
2010-2014 postcensal estimates (based on 2010 census)1
Vintage 2014 3,142 X X X X X X
Vintage 2011-Vintage 2013 3,143 X X X X X X
2010 census
April 1, 2010 3,143 X X X X X X
2000-2010 intercensal estimates
July 1, 2000-July 1, 2010 3,143 X X X X X X
2000-2010 postcensal estimates (based on 2000 census)
Vintage 2001 No county estimates on file, only national estimates
2000 census
April 1, 2000 3,141 --*-- --*-- -*- --*-- -*- -*-
1990-1999 intercensal estimates
July 1, 1990-July 1, 1999
3,141 --*-- --*-- -*- --*-- -*- -*-
--*-- County or county equivalent is not on the file. X County or county equivalent is on the file. 1Vintage 2002, Vintage 2005, Vintage 2006, and Vintage 2007 have estimates for the same 3,141 counties and county equivalents. Specific details: Broomfield County, Colorado (FIPS code=08-014) was created effective November 15, 2001 from parts of four Colorado counties: Adams, Boulder, Jefferson, and Weld. There are estimates for this county on some, but not all, of the bridged-race files. Note that data for Broomfield County do not appear on NCHS birth or mortality files until data year 2003. Hoonah-Angoon Census Area, AK (FIPS code = 02-105). The Hoonah-Angoon Census Area was created from the remainder of the former Skagway-Hoonah-Angoon Census Area (FIPS code = 02-232) when Skagway Municipality (FIPS code = 02-230) was created effective June 20, 2007. Estimates for this area are on the Vintage 2008 and later bridged-race files. Note that no data for Hoonah-Angoon Census Area appear on NCHS birth and mortality files. Petersburg Census Area (FIPS code=02-195). Petersburg Census Area was created from part of the former Wrangell-Petersburg Census Area (FIPS code = 02-280) effective June 1, 2008. Estimates for this area are on the Vintage 2009 and later bridged-race files. Note that no data for this Census Area appear on NCHS birth and mortality files. Prince of Wales-Hyder Census Area (FIPS code = 02-198). Prince of Wales-Hyder Census Area was created from the remainder of the former Prince of Wales-Outer Ketchikan Census Area (FIPS code = 02-201) after part (Outer Ketchikan) was annexed by Ketchikan Gateway Borough (FIPS code = 02-130) effective May 19, 2008 and another part was
20
included in the new Wrangell Borough (effective June 1, 2008). Estimates for this area are on the Vintage 2009 and later bridged-race files. Note that no data for this Census Area appear on NCHS birth and mortality files Skagway Municipality, AK (FIPS code = 02-230). Skagway Municipality was created from part of the former Skagway-Hoonah-Angoon Census Area (FIPS code = 02-232) effective June 20, 2007; boundaries are identical to the Skagway census subarea. The remainder of the former Skagway-Hoonah-Angoon Census Area was established as the new Hoonah-Angoon Census Area (FIPS code = 02-105). Estimates for this area appear on the Vintage 2008 and later bridged-race files. Note that no data for Skagway Municipality appear on NCHS birth and mortality files. Wrangell City and Borough (FIPS code = 02-275). Effective June 1, 2008, Wrangell City and Borough was created from part of Wrangell-Petersburg Census Area (FIPS code = 02-280) and part of Prince of Wales-Outer Ketchikan Census Area (FIPS code = 02-201). Estimates for this area appear on Vintage 2009 and later bridged-race files. Note that no data for Wrangell Borough appear on NCHS birth and mortality files.
21
Deleted counties and county equivalents: bridged-race population files for 1990-2014
Estimates series
Number of counties
Deleted county or county equivalent
Bedford city, VA (51515)
Clifton Forge city, VA (51560)
Prince of Wales-Outer Ketchikan Census Area, AK (02201)
Skagway-Hoonah-Angoon Census Area, AK (02232)
Wrangell –Petersburg Census Area, AK (02280)
2010-2014 postcensal estimates (based on 2010 census)
Vintage 2014 3,142 -*- -*- -*- -*- -*-
Vintage 2011-Vintage 2013 3,143 X -*- -*- -*- -*-
2010 census
April 1, 2010 3,143 X -*- -*- -*- -*-
2000-2010 intercensal estimates
July 1, 2000-July 1, 2010 3,143 X -*- -*- -*- -*-
2000-2010 postcensal estimates (based on 2000 census)
Vintage 2009-Vintage 2010 3,143 X -*- -*- -*- -*-
Vintage 2008 3,142 X -*- X --*-- X
Vintage 2005 - Vintage 20071 3,141 X -*- X X X
Vintage 2003 - Vintage 2004 3,140 X -*- X X X
Vintage 20021 3,141 X -*- X X X
Vintage 2001 No county estimates on file, only national estimates
2000 census
April 1, 2000 3,141 X X X-- X X
1990-1999 intercensal estimates
July 1, 2000-July 1, 2009 3,141 X X X X X
--*-- County or county equivalent is not on the file. X County or county equivalent is on the file.
22
1Vintage 2002, Vintage 2005, Vintage 2006, and Vintage 2007 have estimates for the same 3,141 counties and county equivalents. Specific details: Bedford City, Virginia (FIPS code = 51515). Effective July 1, 2013, Bedford city, Virginia (51515), formerly an independent city, was added to Bedford County (51019. Beginning with the Vintage 2014 postcensal series, estimates for this county equivalent no longer appear on the bridged-race population files. Note that data for Bedford city still appear on NCHS birth and mortality files. Clifton Forge City, Virginia (FIPS code = 51-560). Effective July 1, 2001, Clifton Forge city, Virginia, formerly an independent city, merged with Alleghany county (FIPS code=51-005). Estimates for this county equivalent only appear on the 1990-1999 intercensal bridged-race files and the April 1, 2000 bridged-race files. Note that data for Clifton Forge city appear on NCHS birth and mortality files prior to data year 2003; beginning with the 2003 data year, no data for Clifton Forge city appear on the birth and death files. Prince of Wales-Outer-Ketchikan Census Area (FIPS code = 02-201). Part of this area (Outer Ketchikan) was annexed by Ketchikan Gateway Borough (FIPS code = 02-130), part was included in the new Wrangell City and borough (FIPS code = 02-275), and the remainder was renamed Prince of Wales-Hyder Census Area (FIPS code = 02-198). Estimates for Prince of Wales-Outer Ketchikan do not appear on the bridged-race files after Vintage 2008. Note that data for this area appear on NCHS birth and mortality files for 1994 – present. Skagway-Hoonah-Angoon Census Area, AK (FIPS code = 02-232). Effective June 20, 2007, Skagway-Hoonah-Angoon Census area was split to create Skagway Municipality (FIPS = 02-230) and Hoonah-Angoon Census Area (FIPS code = 02-105). Estimates for Skagway-Hoonah-Angoon do not appear on bridged-race files after Vintage 2007. Note that data for Skagway-Hoonah-Angoon Census Area appear on NCHS birth and mortality files for 1994 – present. Wrangell-Petersburg Census Area (FIPS code = 02-280). Effective June 1, 2008, Wrangell-Petersburg Census Area was split to create part of Wrangell City and Borough (FIPS code = 02-275) and all of Petersburg Census Area (FIPS code = 02-195). Estimates for Wrangell-Petersburg do not appear on bridged-race files after Vintage 2008. Note that data for Wrangell-Petersburg Census Area appear on NCHS birth and mortality files for 1994 – present.