47
Assignment 2 – Report 2 Documentation of window energy performance Kasper U. Nielsen Kathrine N. Brejnrod Theis H. Pedersen
| Date post: | 19-Jan-2017 |
| Category: |
Engineering |
| Upload: | kathrine-brejnrod |
| View: | 143 times |
| Download: | 1 times |

Assignment 2 – Report 2
Documentation of window energy performance
Kasper U. Nielsen
Kathrine N. Brejnrod
Theis H. Pedersen

Title page
Title: Assignment 2 – Report 2
Subtitle: Documentation of window energy performance
Written by: Kasper U. Nielsen [201300234]
Kathrine N. Brejnrod [20062459]
Theis H. Pedersen [201300223]
Report: Assignment 2
Study: Architectural Engineering
Course: Energy-efficient building envelope design
School: Aarhus School of Engineering
Project period: 19. Feb. – 27. Marts 2014
Mentor: Steffen Petersen
Pages: Main report: normal pages [2400 hits]
Basis for decision making: pages
Appendices: pages

Chapter 1 - Introduction
#Table of Contents
1 Introduction ...................................................................................................................... 1
2 Documentation ................................................................................................................. 3
2.1 Product development ................................................................................................ 3
2.1.1 Decreasing the complexity ............................................................................... 3
2.1.2 Engineering characteristic ................................................................................ 5
2.2 Frame profile ............................................................................................................ 7
2.2.1 EN ISO 10077-1 Annex D ............................................................................... 7
2.2.2 EN ISO 10077-2 Numerical method - Annex C + Therm................................ 7
2.2.3 Optimization ..................................................................................................... 8
2.3 Edge construction ................................................................................................... 11
2.3.1 Five different conductivities ........................................................................... 11
2.3.2 Final Spacer .................................................................................................... 12
2.4 Condensation risk ................................................................................................... 13
2.5 Window performance data ..................................................................................... 16
2.5.1 Case 1 ............................................................................................................. 16
2.5.2 Case 2.1 .......................................................................................................... 16
2.5.3 Case 2.2 .......................................................................................................... 16
2.6 Window energy performance in office room ......................................................... 16
3 Conclusion ...................................................................................................................... 19
4 Bibliography ................................................................................................................... 21
5 Appendix ........................................................................................................................ 23

Chapter 1 - Introduction
Assignment 2 – Report 2
Kasper Ubbe Nielsen; Kathrine N. Brejnrod; Theis H. Pedersen Side 1
1 Introduction
This report is the technical report that supports the Basis for decision making.
In the following report, two suggestions for improvements of the Thema TA frame profile
are presented. The suggestions is based on a product development process, based on the
House of Quality method, and multiple analysis of the construction principle, spacer
material, risk of condensation and general performance data.
The main focus of this optimization is to reach a value of Eref ≥ 0, by maintaining the original
design of the frame. The program THERM 7 is used to perform the calculations combined
with the methods presented in EN ISO 10077 part 1 and part 2, which has been integrated
into a pre-developed spreadsheet. The program iDbuild is used to perform the energy
performance assessments, calculated for a reference office room, and thermal and daylight
conditions.
Regarding material use, the material database, “Termiske egenskaber for materialer brugt i
vinduessystemer”, developed by Teknologisk Institut is used. The listed material-
conductions in the database are in accordance with the EN ISO 10077-2.


Chapter 2 - Documentation
Assignment 2 – Report 2
Kasper Ubbe Nielsen; Kathrine N. Brejnrod; Theis H. Pedersen Side 3
2 Documentation
2.1 Product development
2.1.1 Decreasing the complexity
To break down the complexity of the different aspect of the product development, a
clarifying of the different parameters, stakeholders and engineering characteristics is made
and their interdependence identified. The process helps to create an overview of the
individual factors influence on the rest of the product characteristics, and thereby creates a
basis for a simple an effective development of a product with the desired characteristic.
First the objectives of the product are clarified and the importance of the specific objective to
each of the stakeholders is estimated on a scale from 0-5 with 5 being very important. From
Figure 1 the importance of the objectives is illustrated, and in this case especially the
manufacturer’s point of view is important. Ideally the manufacture himself would evaluate
the importance of the different objectives to, but in this case the evaluation is done by the
general product development team.
Figure 1 – Clarifying objectives
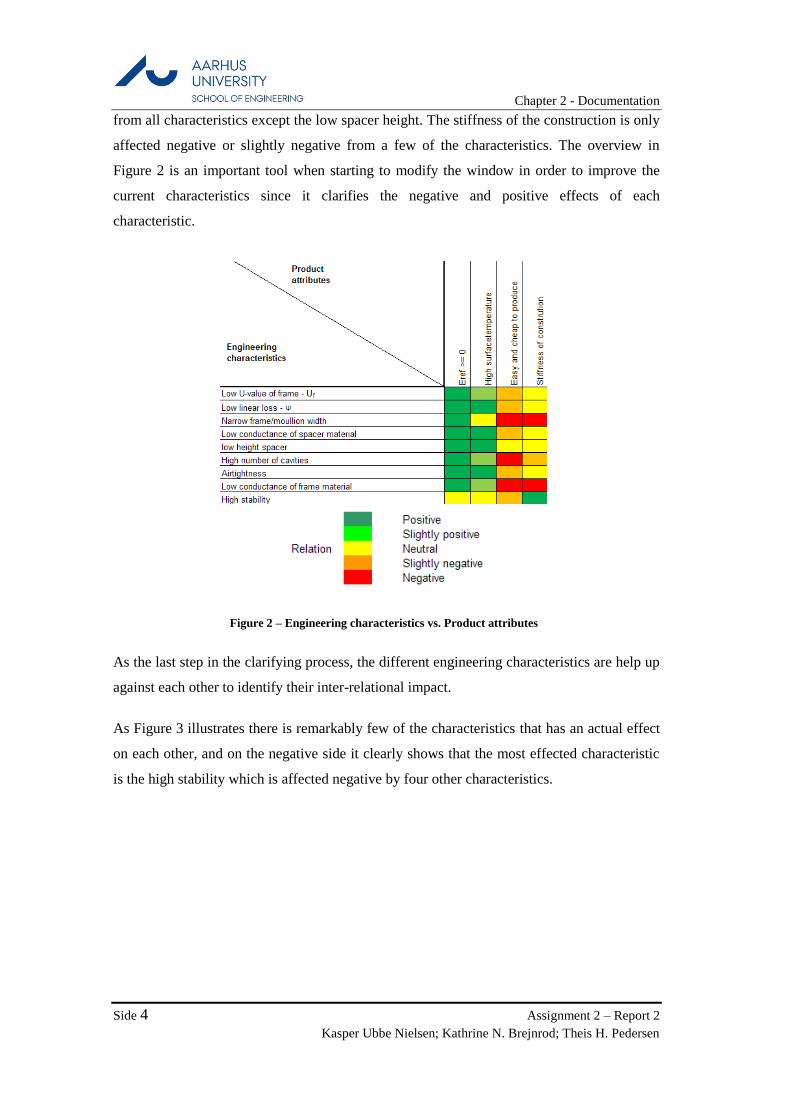
Then the important engineering characteristics are identified, and the impact on the four
objectives are estimated on a scale varying from a positive to a negative impact, which is
illustrated on Figure 2. From the figure it is identified how none of the engineering
characteristic have a negative influence on the Eref and a high surface temperature. On the
contrary the manufacturing process is affected either slightly negative or directly negative
Chapter 2 - Documentation
Side 4 Assignment 2 – Report 2
Kasper Ubbe Nielsen; Kathrine N. Brejnrod; Theis H. Pedersen
from all characteristics except the low spacer height. The stiffness of the construction is only
affected negative or slightly negative from a few of the characteristics. The overview in
Figure 2 is an important tool when starting to modify the window in order to improve the
current characteristics since it clarifies the negative and positive effects of each
characteristic.
Figure 2 – Engineering characteristics vs. Product attributes
As the last step in the clarifying process, the different engineering characteristics are help up
against each other to identify their inter-relational impact.
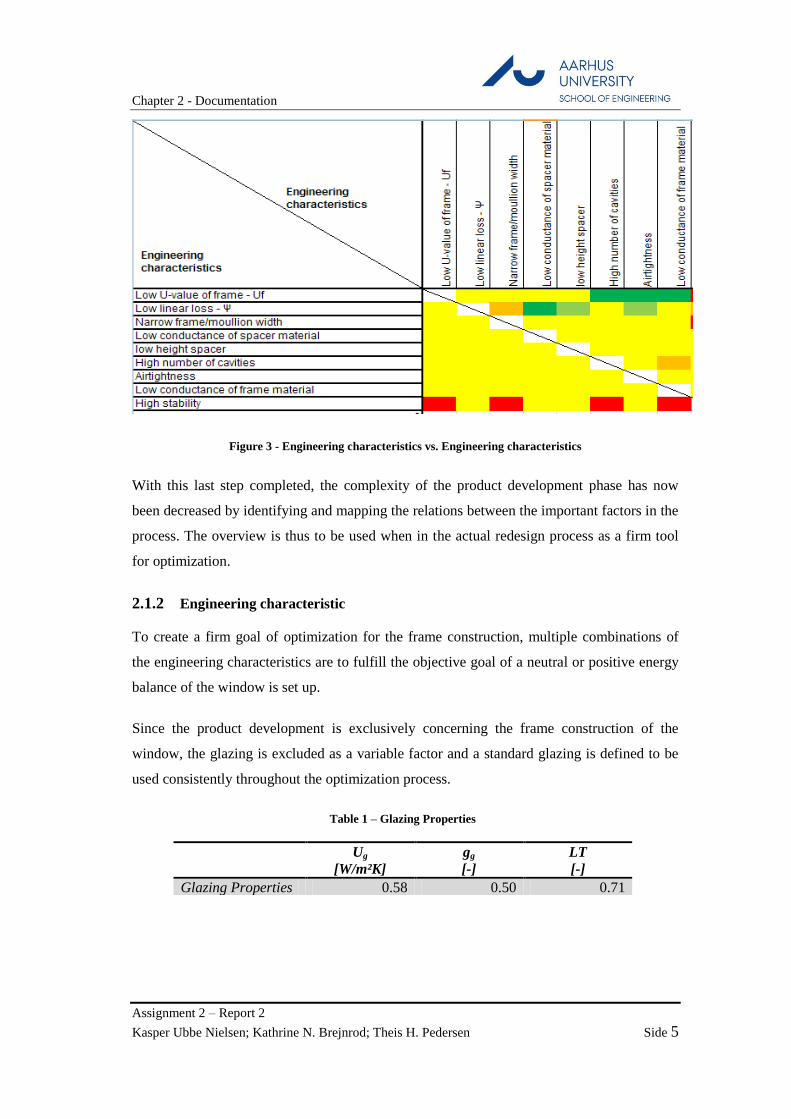
As Figure 3 illustrates there is remarkably few of the characteristics that has an actual effect
on each other, and on the negative side it clearly shows that the most effected characteristic
is the high stability which is affected negative by four other characteristics.
Chapter 2 - Documentation
Assignment 2 – Report 2
Kasper Ubbe Nielsen; Kathrine N. Brejnrod; Theis H. Pedersen Side 5
Figure 3 - Engineering characteristics vs. Engineering characteristics
With this last step completed, the complexity of the product development phase has now
been decreased by identifying and mapping the relations between the important factors in the
process. The overview is thus to be used when in the actual redesign process as a firm tool
for optimization.
2.1.2 Engineering characteristic
To create a firm goal of optimization for the frame construction, multiple combinations of
the engineering characteristics are to fulfill the objective goal of a neutral or positive energy
balance of the window is set up.
Since the product development is exclusively concerning the frame construction of the
window, the glazing is excluded as a variable factor and a standard glazing is defined to be
used consistently throughout the optimization process.
Table 1 – Glazing Properties
Ug
[W/m²K]
gg
[-]
LT
[-]
Glazing Properties 0.58 0.50 0.71

Chapter 2 - Documentation
Side 6 Assignment 2 – Report 2
Kasper Ubbe Nielsen; Kathrine N. Brejnrod; Theis H. Pedersen
Table 2 – Window size
BW
[m]
LW
[m]
Window size 1.23 1.48
On the basis of the standard glazing given above the linear-loss through the spacer, Ψ, the
width of the frame, bf, and the U-value of the frame, Uf, are modified to create three
alternatives for a window with a positive energy balance. The alternatives are with
respectively three different U-values of the frame construction, two different linear heat loss
coefficients at the spacer and two different frame widths.
Table 3 - Prpoposals for engineerings characteristics
Uf
[W/m2K]
Ψ
[W/mK]
Bf
[m]
Uw
[W/m2K]
Eref
[kWh/m2]
Alternative 1 1,1 0,02 0,1 0,78 +1
Alternative 2 0,9 0,03 0,1 0,74 +4
Alternative 3 1,3 0,03 0,08 0,82 +2

Chapter 2 - Documentation
Assignment 2 – Report 2
Kasper Ubbe Nielsen; Kathrine N. Brejnrod; Theis H. Pedersen Side 7
2.2 Frame profile
It is chosen to work with and optimize the alu/wood frame profile from Thema. Figure 4
illustrates the frame build-up for a 2-layer glazing. In the following, the frame has been
alternated to fit a 3-layer glazing, by expanding the sash width.
Figure 4 - Frame section og ThemaTA
Figure 5 - Alternated profile for 3-layer glazing
2.2.1 EN ISO 10077-1 Annex D
The thermal properties of the frame are assessed according to the simplified method,
described in EN ISO 10077-1 Annex D. Table 4 below lists the measured and calculated
values from the altered profile. For description of method see Appendix A.
Table 4 - Frame specification according to EN ISO 10077-1 Annex D
d1
[mm]
d2
[mm]
df
[mm]
Uf
[W/m²K]
Thema TA 65.66 61.02 63.34 1.84
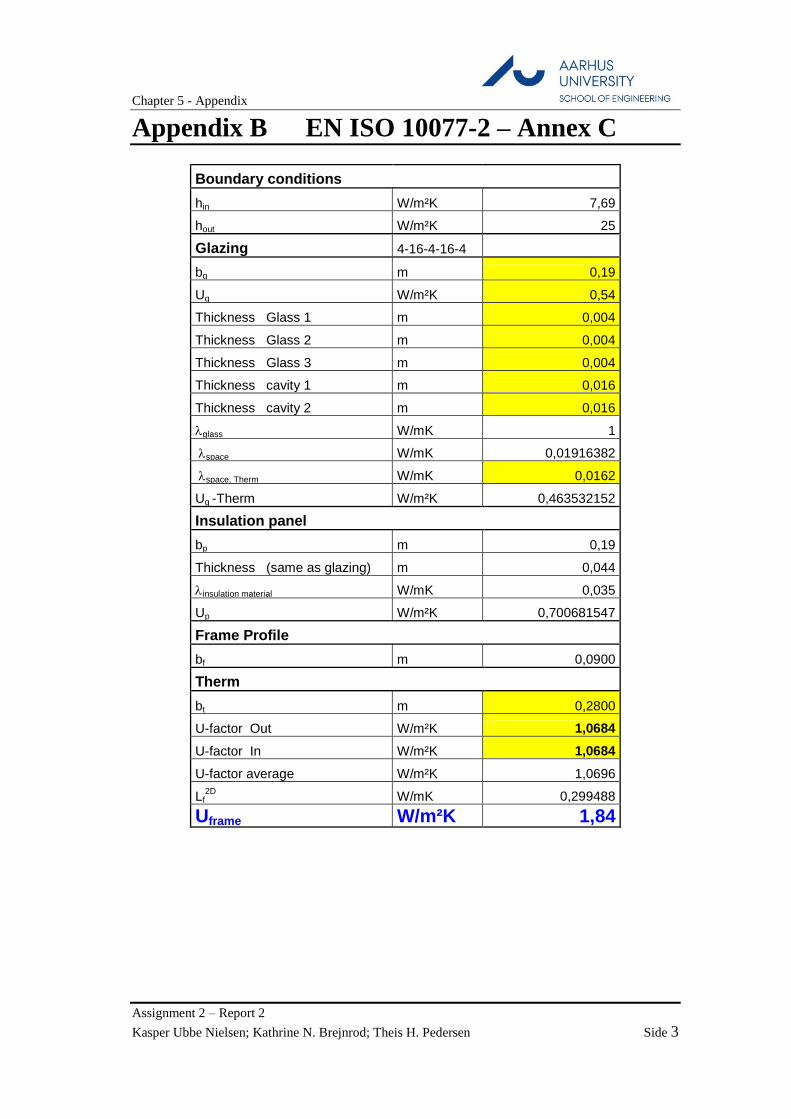
2.2.2 EN ISO 10077-2 Numerical method - Annex C + Therm
The numerical method described in EN ISO 10077-2 Annex C has been implemented in a
spreadsheet, see Appendix B. The result is seen in Table 5 below.

Chapter 2 - Documentation
Side 8 Assignment 2 – Report 2
Kasper Ubbe Nielsen; Kathrine N. Brejnrod; Theis H. Pedersen
Table 5 - Frame specification according to EN ISO 10077-2 Annex C
Uf
[W/m²K]
Thema TA 1.84
It is seen that the result of the simplified method and the numerical method are equal. From
which it can be concluded that the chosen ThemaTA profile is a simple profile compared to
others. Hence the simplified method is assessed to applicable on simple profiles only.
2.2.3 Optimization
In Section 2.2.2 the U-value of the original construction is identified to Uf = 1.84 W/m2K,
which exceeds the proposed Uf-values in section 2.1.2 where the highest U-value proposed,
is 1.3 W/m2K. On basis of this, an optimization process of the frame construction is initiated
to decrease the U-value until it corresponds to the proposals set up in section 2.1.2.
On basis of the dependences clarified in section 2.1.1, different improvements are carried out
on the original frame and the effect on the U-value of the frame is identified through
calculations carried out in THERM 7.1.
Focus is mainly on improvements that do not change the appearance of the window frame
significantly, since it is assumed that the manufacture would like to keep the basis
appearance instead of developing an entirely new window.
From Table 6 a few of the improvements tested on the construction is shown together with
the effect on the U-value, se Appendix D and Appendix E for further information on the
improvements shown together with further improvements.
Table 6 - Uf for improvements
Improvement Uf
[W/m2K]
Compared to the
original Uf
Exterior sealing strip 1.78 -3 %
Cold bridges breaker 1.48 -20%
Replacement of sealing strips with foamed sealing’s. 1.8 -2%
PUR-foam in parts of the frame 1.61 -13
The improvements influence on the production of the construction is varied, and on the basis
of the identified effect of each of the improvements two alternative proposals are set up.

Chapter 2 - Documentation
Assignment 2 – Report 2
Kasper Ubbe Nielsen; Kathrine N. Brejnrod; Theis H. Pedersen Side 9
Both alternatives fulfill the proposed characteristics set up in section 2.1.2 but the one having
a lower U-value of the frame than the other and at the same time is expected to require
greater modifications on the production process than the one with the higher U-value.
2.2.3.1 Proposal 1
In the first proposal three improvements to the frame construction is applied. First a sealing
strip is added on the exterior side of the construction, to create still air in the frame cavities.
Then the continuous aluminum in the frame construction is partly replaced with
Polypropylene with 25% glass fiber to create a thermal brake. From Table 6 - Uf for
improvements it shows that this improvement with the thermal brake alone contributes to a
decrease in U-value of 20%. Further more the material of the sealing strips is changed from
EPDM to a foamed material with a lower conductivity.
The improvements in proposal 1 contribute to a decrease in the U-value of the frame of 30%
compared to the original construction.
Uf = 1.29 W/m2K
In section 2.1.2 it shows that with a U-
value of the frame of 1.3W/m2K a positive
energy balance of the window can be
achieved through a linear heat loss
coefficient of 0.03W/m*K and a frame
width below 0.08m. Since the current
frame height is 0.092m, the construction is
modified to fit the requirement.
2.2.3.2 Proposal 2
In the second proposal the continuous aluminum in the frame construction is also partly
replaced with Polypropylene with 25% glass fiber to create a thermal brake. On the exterior
side a sealing strip is added to create still air in the frame cavities, and then finally PUR-
foam is added to both frame and sash to lower the thermal conductance through the
sash/frame. The improvements in proposal 2 contribute to a decrease in the U-value of the
frame of 40% compared to the original construction.

Chapter 2 - Documentation
Side 10 Assignment 2 – Report 2
Kasper Ubbe Nielsen; Kathrine N. Brejnrod; Theis H. Pedersen
Uf = 1.1 W/m2K
Compared to proposal 1 this proposal has a
lower U-value, but due to the PUR-foam in the
frame construction it is expected to require
further investigation of construction strength
and design and constructional possibilities.
In section 2.1.2 it shows that with a U-value of
the frame on 1.1 W/m2K a positive energy
balance can be achieved with a frame height
below 0,1m and a linear heat loss coefficient below 0.2 W/m*K. The frame width is
currently 0.92m which allows the linear heat loss coefficient to go as high as 0.035 W/m*K
and still keep a positive energy balance of the window.

Chapter 2 - Documentation
Assignment 2 – Report 2
Kasper Ubbe Nielsen; Kathrine N. Brejnrod; Theis H. Pedersen Side 11
2.3 Edge construction
In this section a suitable spacer is chosen on the basis of calculations performed in
accordance with the two-box approach. The value of the linear thermal transmittance is
calculated with different conductivities for the spacer profile and then compared for
assessments.
2.3.1 Five different conductivities
Table 7 lists the five different conductivities and their adjacent calculated overall thermal
conductance; L. L is calculated as a summation of each of the elements conductivities,
weighted with respect to the box height vs. spacer width. The thermal transmittance, Ψ, is
calculated using the supplied spreadsheet and Therm. It is done by subtracting the loss
through the frame and the pane part, from the 2D linear thermal transmittance, LΨ2D
.
Table 7 - Different conductivities effect on L and Ψ
λspacer,2.box
[W/m*K]
L
[W/m*K]
Ψ
[W/m*K]
0.1 0.1125 0.026
0.5 0.2625 0.049
1 0.45 0.067
2 0.825 0.086
5 1.95 0.108
The results of L and Ψ are plotted in Figure 6, below. Furthermore the derivative of the
function Ψ (L) is plotted, to clearly illustrate how the transmittance changes with respect to
the spacer conductivity. It is seen that for spacer conductivities below 1 W/m*K the effect on
Ψ is large compared to values above. And for values below 0.5 W/m*K the effects are more
obvious.

Chapter 2 - Documentation
Side 12 Assignment 2 – Report 2
Kasper Ubbe Nielsen; Kathrine N. Brejnrod; Theis H. Pedersen
Figure 6 - Linear thermal coefficient as a function of L and the derivative of Ψ
From this, one could argue that it doesn’t make that much of a difference whether you chose
a “bad” or a “worse” spacer conductivity compared to the effect of whether you chose a
“good” or “better” spacer conductivity.
2.3.2 Final Spacer
From the former calculations and conclusion a spacer profile has been chosen. See Appendix
C for data sheet. The values for the two-box approach are list in
Box 1 Box 2
λ [W/m*K] 0.4 0.14
Ψ(L) = 0,0292ln(L) + 0,0897
R² = 0,998
0
0,05
0,1
0,15
0,2
0,25
0,3
0 0,5 1 1,5 2 2,5
Ψ
L
Ψ (L)
Ψ
Ψ'
Log. (Ψ)

Chapter 2 - Documentation
Assignment 2 – Report 2
Kasper Ubbe Nielsen; Kathrine N. Brejnrod; Theis H. Pedersen Side 13
2.4 Condensation risk
To determine if there is a risk of condensation on the inside of the window, a factor is
calculated as: oi
osi
TT
TT
Rsif The lower a value the greater the risk of condensation is.
Table 8 - Surface temperature and condensation risk factor
λspacer,2.box
[W / mK]
Tsi
[°C]
Fsi
[-]
0.1 15.2 0.76
0.5 13.7 0.685
1 12.6 0.63
2 11.4 0.57
5 10 0.5
The results listed in Table 8 clearly states, that the spacer material clearly affects the lowest
internal surface temperature. The lower conductance of the spacer material is the lower the
risk of condensation on the inside of the window.
The existing frame construction is shown at the sketch to the left and the optimized
construction to the right. Furthermore the surface temperature, at the two worst places is
shown. The improvement of the frame has resulted in a significant temperature
enhancement, which is of great importance to prevent condensation. Another consequence of
the improvements is that the node with the lowest temperature is moved.
Figure 7 - Existing and optimized construction
15.0 °C
15.9 °C
13.0 °C
12.6 °C
14.6 °C
15.1 °C
Chapter 2 - Documentation
Side 14 Assignment 2 – Report 2
Kasper Ubbe Nielsen; Kathrine N. Brejnrod; Theis H. Pedersen
Table 9 - Comparison of spacers
λspacer,2.box
[W / mK]
Tsi
[°C]
Fsi
[-]
Existing construction (Chromatech Ultra F
spacer)
0.33 12.6 0.63
Optimized (Swiss Ultimate spacer) 0.14 15.0 0.75
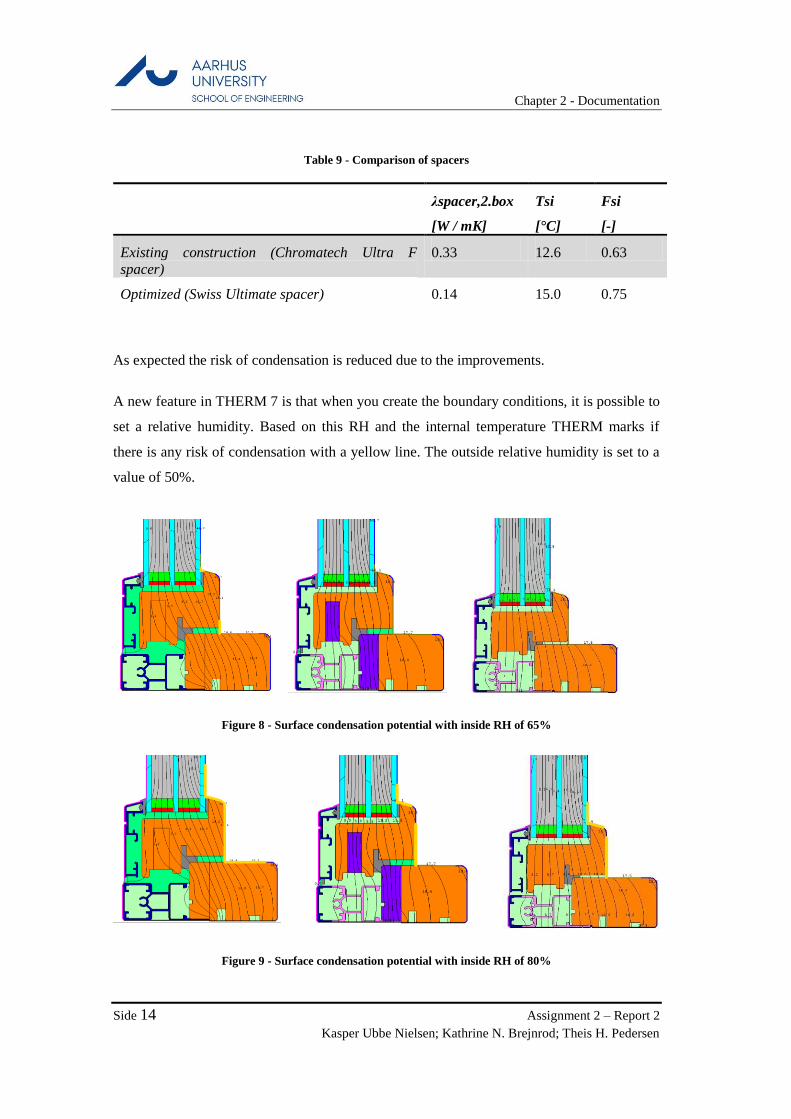
As expected the risk of condensation is reduced due to the improvements.
A new feature in THERM 7 is that when you create the boundary conditions, it is possible to
set a relative humidity. Based on this RH and the internal temperature THERM marks if
there is any risk of condensation with a yellow line. The outside relative humidity is set to a
value of 50%.
Figure 8 - Surface condensation potential with inside RH of 65%
Figure 9 - Surface condensation potential with inside RH of 80%

Chapter 2 - Documentation
Assignment 2 – Report 2
Kasper Ubbe Nielsen; Kathrine N. Brejnrod; Theis H. Pedersen Side 15
The results above are taken directly from THERM. With an inside relative humidity at 65%,
there is not a risk of surface condensation at the optimized frame construction. When the
relative humidity is set at 80%, there are a potential of condensation at the surface. However
a relative humidity at 80% is very high, and would almost only appear in bathrooms and the
like. The results of the existing frame are also shown in order to compare.
Chapter 2 - Documentation
Side 16 Assignment 2 – Report 2
Kasper Ubbe Nielsen; Kathrine N. Brejnrod; Theis H. Pedersen
2.5 Window performance data
2.5.1 Case 1
See Appendix F
2.5.2 Case 2.1
See Appendix G
2.5.3 Case 2.2
See Appendix H
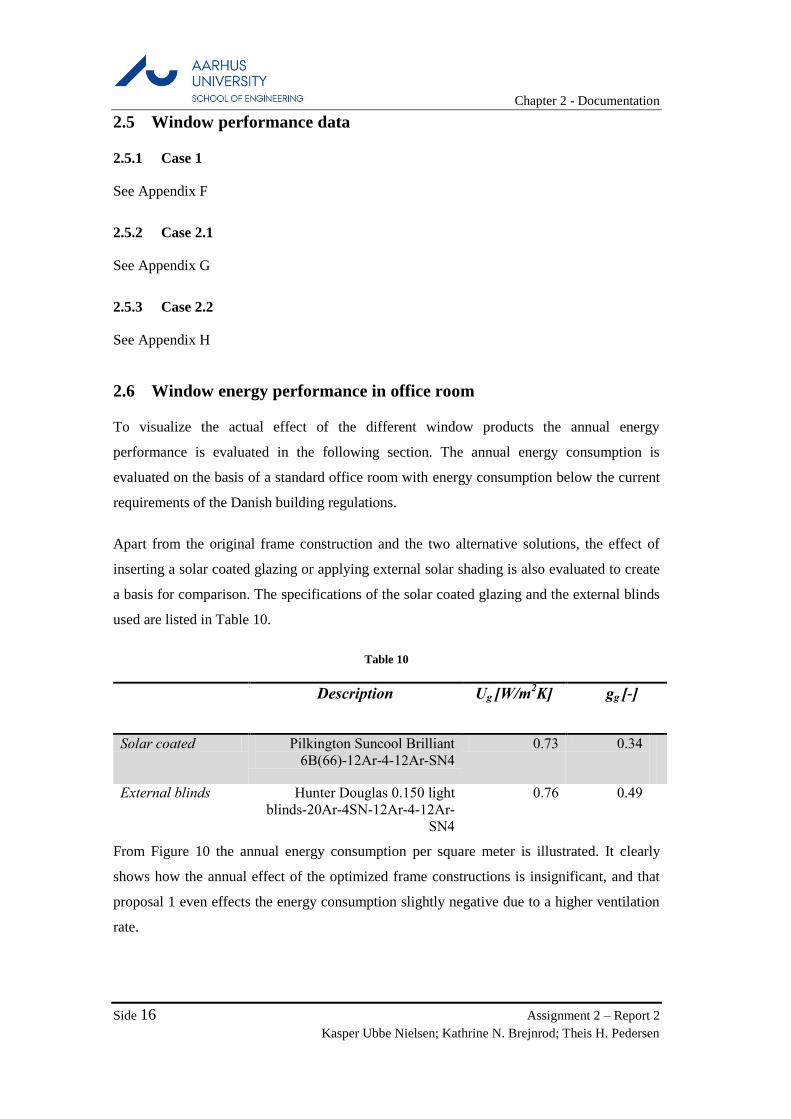
2.6 Window energy performance in office room
To visualize the actual effect of the different window products the annual energy
performance is evaluated in the following section. The annual energy consumption is
evaluated on the basis of a standard office room with energy consumption below the current
requirements of the Danish building regulations.
Apart from the original frame construction and the two alternative solutions, the effect of
inserting a solar coated glazing or applying external solar shading is also evaluated to create
a basis for comparison. The specifications of the solar coated glazing and the external blinds
used are listed in Table 10.
Table 10
Description Ug [W/m2K] gg [-]
Solar coated Pilkington Suncool Brilliant
6B(66)-12Ar-4-12Ar-SN4
0.73 0.34
External blinds Hunter Douglas 0.150 light
blinds-20Ar-4SN-12Ar-4-12Ar-
SN4
0.76 0.49
From Figure 10 the annual energy consumption per square meter is illustrated. It clearly
shows how the annual effect of the optimized frame constructions is insignificant, and that
proposal 1 even effects the energy consumption slightly negative due to a higher ventilation
rate.

Chapter 2 - Documentation
Assignment 2 – Report 2
Kasper Ubbe Nielsen; Kathrine N. Brejnrod; Theis H. Pedersen Side 17
On the contrary the effect of the solar coated glazing and the external blinds contributes to a
decrease of the energy consumption of respectively 14% and 12% compared to the original
construction.
Figure 10 – Annual energy consumption
Apart from the energy consumption the different solutions also affects the daylight
conditions in the room. From Figure 11 it shows how the first proposal has a slightly positive
effect on the daylight factor due to the decreased frame width, but also how the solar coated
glazing contributes to a remarkable decrease in daylight factor.

Chapter 2 - Documentation
Side 18 Assignment 2 – Report 2
Kasper Ubbe Nielsen; Kathrine N. Brejnrod; Theis H. Pedersen
Figure 11 - Daylight factor
Since both of the recommended solutions have a Eref = +2, a case with a window having
remarkable higher value on the positive energy balance is carried out. The window tested has
a linear heat loss coefficient of 0.01 W/m*K, a U-value of the frame of 0.8 W/m*K and a
frame width of 0.06, which contributes to Eref = +23.
Table 11
Original
construction
Proposal 1 Proposal 2 Window
Eref =
+23
Solar
coated
Uw [W/m2K] 1.02 0.79 0.82 0.64 1.13
Eref [kWh/m2] -19 +2 +2 +23 -52
Energy
consumption
[kWh/m2/year]
57 58 57 60 50
From the simulations it clearly shows, that the effect of optimizing the frame construction of
the window only affects the annual energy consumption minimal in the office room. It also
shows that the energy balance is not fit as a design objective when considering new office
buildings, since the one with the absolutely lowest Eref is the solar coated window but this is
at the same time the one with the lowest annual energy consumption.

Chapter 3 - Conclusion
Assignment 2 – Report 2
Kasper Ubbe Nielsen; Kathrine N. Brejnrod; Theis H. Pedersen Side 19
3 Conclusion
In order to structure the optimization process, the development of a House of Quality mind
map, was carried out. From this the most important engineering characteristics was listed and
used in the optimization. This really made the process quicker and organized.
The final result was two optimized proposals, which both comply with a positive Eref. The
goal was to optimize the existing window frame, without making a totally new construction.
This is managed due to some few changes in the material use and by reducing the frame
height.
The consequence of the optimization is a lower Uframe and a higher internal surface
temperature, which leads to a lower risk of condensation on the inside.
Furthermore the performance of the optimized window has been tested in iDbuild by
evaluating the energy consumption, thermal and daylight conditions. The reference room is a
single office room, which has a very low heating demand. Therefore the altering of the
window frame does not affect the energy performance by much. The heating demand
reduces a little, but the ventilations rate increases, in order to satisfy the thermal
environment, and thereby the energy to the fans also increases. It is estimated that the effect
on the energy performance would be significantly large in a room with a higher heating
demand.
The daylight conditions do not change much, since only the frame has been optimized and
not the glass. However the glass/frame ratio is greater at proposal 2.1 since the frame height
is lowered. Therefore the daylight factor increases by 0.2.


Chapter 4 - Bibliography
Assignment 2 – Report 2
Kasper Ubbe Nielsen; Kathrine N. Brejnrod; Theis H. Pedersen Side 21
4 Bibliography
European Standard, 2003. EN ISO 10077-2, s.l.: s.n.
Standard, European, 2000. EN ISO 1077-1, s.l.: s.n.
Teknologisk Institut, 2013. Teknologisk Institut. [Online]
Available at: http://matdb.teknologisk.dk/download.aspx
[Senest hentet eller vist den 03 2014].


Chapter 5 - Appendix
Assignment 2 – Report 2
Kasper Ubbe Nielsen; Kathrine N. Brejnrod; Theis H. Pedersen Side 23
5 Appendix
Appendix A EN ISO 10077-1 – Annex D ............................................................................ 1
Appendix B EN ISO 10077-2 – Annex C ............................................................................ 3
Appendix C Spacer profile ................................................................................................... 5
Appendix D Single Improvements ....................................................................................... 7
Appendix E Combined improvements ............................................................................... 11
Appendix F Datasheet Result – Case 1 .............................................................................. 15
Appendix G Datasheet Result – Case 2.1 ........................................................................... 17
Appendix H Datasheet Result – Case 2.2 ........................................................................... 19


Chapter 5 - Appendix
Assignment 2 – Report 2
Kasper Ubbe Nielsen; Kathrine N. Brejnrod; Theis H. Pedersen Side 1
Appendix A EN ISO 10077-1 – Annex D
Figur 1 - Definition af d1 og d2
Figur 2 - Graf for aflæsning af Uf

Chapter 5 - Appendix
Assignment 2 – Report 2
Kasper Ubbe Nielsen; Kathrine N. Brejnrod; Theis H. Pedersen Side 3
Appendix B EN ISO 10077-2 – Annex C
Boundary conditions
hin W/m²K 7,69
hout W/m²K 25
Glazing 4-16-4-16-4
bg m 0,19
Ug W/m²K 0,54
Thickness Glass 1 m 0,004
Thickness Glass 2 m 0,004
Thickness Glass 3 m 0,004
Thickness cavity 1 m 0,016
Thickness cavity 2 m 0,016
glass W/mK 1
space W/mK 0,01916382
space, Therm W/mK 0,0162
Ug -Therm W/m²K 0,463532152
Insulation panel
bp m 0,19
Thickness (same as glazing) m 0,044
insulation material W/mK 0,035
Up W/m²K 0,700681547
Frame Profile
bf m 0,0900
Therm
bt m 0,2800
U-factor Out W/m²K 1,0684
U-factor In W/m²K 1,0684
U-factor average W/m²K 1,0696
Lf2D
W/mK 0,299488
Uframe W/m²K 1,84


Chapter 5 - Appendix
Assignment 2 – Report 2
Kasper Ubbe Nielsen; Kathrine N. Brejnrod; Theis H. Pedersen Side 5
Appendix C Spacer profile


Chapter 5 - Appendix
Assignment 2 – Report 2
Kasper Ubbe Nielsen; Kathrine N. Brejnrod; Theis H. Pedersen Side 7
Appendix D Single Improvements
Appendix D.1 Original Construction
Description
The original construction which
create the basis for the following
optimazations.
Characteristics
Uf = 1.84
File id: Thema TA2
Appendix D.2 1. Exterior sealing strip
Description
An exterior sealing strip is added
to create still air in the cavities in
the construction.
Characteristics
Uf = 1.78
Compared to the original
construction this constributes to a
decrease in Uf of 3%.
File id: Thema TA2_1_forbedring
Appendix D.3 2. Small thermal breake
Description
The aluminium in the frame is
broken with a small piece of
polypropylene with 25%
glassfibre. The polypropylene has
a thermal conductance of 0,25
W/mK.
Characteristics
Uf = 1.64
Compared to the original
construction this constributes to a
decrease in Uf of 11%.
File id: Thema TA2_2_forbedring
Chapter 5 - Appendix
Side 8 Assignment 2 – Report 2
Kasper Ubbe Nielsen; Kathrine N. Brejnrod; Theis H. Pedersen
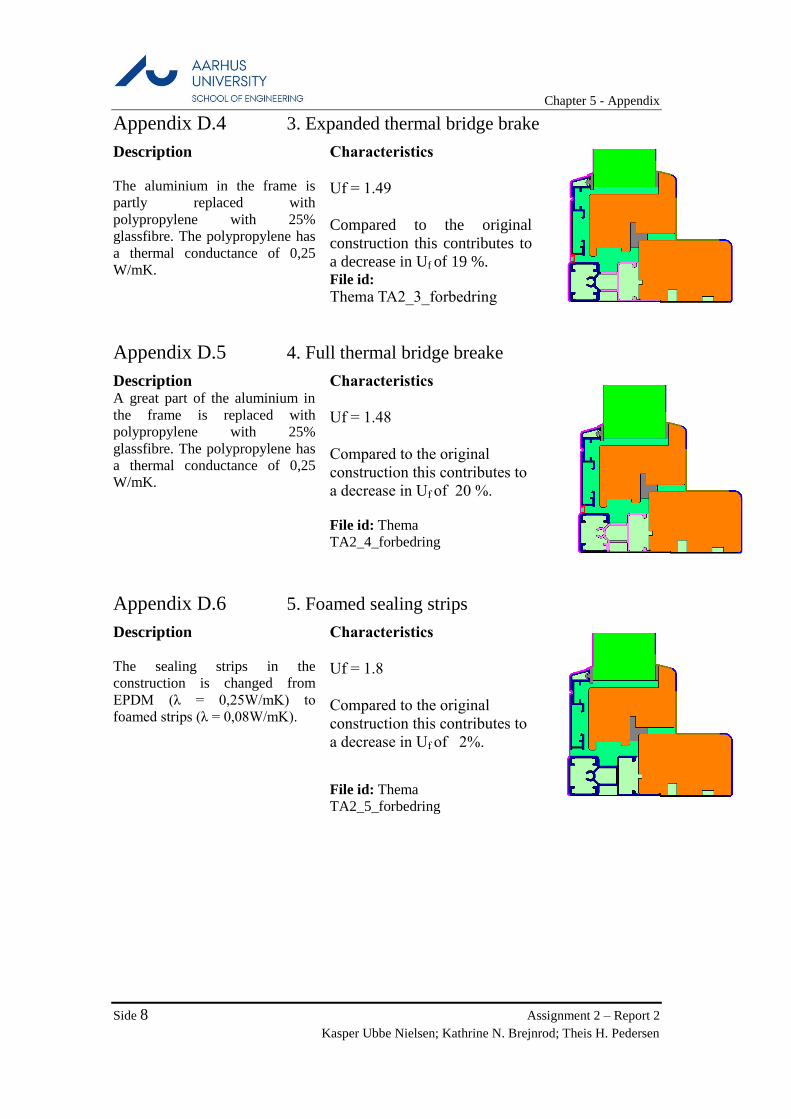
Appendix D.4 3. Expanded thermal bridge brake
Description
The aluminium in the frame is
partly replaced with
polypropylene with 25%
glassfibre. The polypropylene has
a thermal conductance of 0,25
W/mK.
Characteristics
Uf = 1.49
Compared to the original
construction this contributes to
a decrease in Uf of 19 %.
File id:
Thema TA2_3_forbedring
Appendix D.5 4. Full thermal bridge breake
Description
A great part of the aluminium in
the frame is replaced with
polypropylene with 25%
glassfibre. The polypropylene has
a thermal conductance of 0,25
W/mK.
Characteristics
Uf = 1.48
Compared to the original
construction this contributes to
a decrease in Uf of 20 %.
File id: Thema
TA2_4_forbedring
Appendix D.6 5. Foamed sealing strips
Description
The sealing strips in the
construction is changed from
EPDM (λ = 0,25W/mK) to
foamed strips (λ = 0,08W/mK).
Characteristics
Uf = 1.8
Compared to the original
construction this contributes to
a decrease in Uf of 2%.
File id: Thema
TA2_5_forbedring

Chapter 5 - Appendix
Assignment 2 – Report 2
Kasper Ubbe Nielsen; Kathrine N. Brejnrod; Theis H. Pedersen Side 9
Appendix D.7 6. PUR-foam in the frame
PUR-foam (λ = 0.030 W/mK) is
added in both frame and sash to
reduce the heat conductance.
Characteristics
Uf = 1.6
Compared to the original
construction this contributes to
a decrease in Uf of 13%.
File id: Thema
TA2_6_forbedring


Chapter 5 - Appendix
Assignment 2 – Report 2
Kasper Ubbe Nielsen; Kathrine N. Brejnrod; Theis H. Pedersen Side 11
Appendix E Combined improvements
Appendix E.1 1_2
Description
Combination of the exterior
sealing strip and the small thermal
breake.
Characteristics
Uf = 1.54
Compared to the original
construction this contributes to
a decrease in Uf of 16%.
File id: Thema
TA2_1_2_forbedring
Appendix E.2 1_3
Description
Combination of the exterior
sealing strip and the larger
thermal breake.
Characteristics
Uf = 1.39
Compared to the original
construction this contributes to
a decrease in Uf of 24%.
File id: Thema
TA2_1_3_forbedring
Appendix E.3 1_4
Description
Combination of the exterior
sealing strip and the full thermal
breake.
Characteristics
Uf = 1.38
Compared to the original
construction this contributes to
a decrease in Uf of 25%.
File id: Thema
TA2_1_4_forbedring

Chapter 5 - Appendix
Side 12 Assignment 2 – Report 2
Kasper Ubbe Nielsen; Kathrine N. Brejnrod; Theis H. Pedersen
Appendix E.4 1_4_5
Description
Combination of the exterior
sealing strip, the full thermal
breake and the replacement of the
existing sealing strips to foamed
strips.
Characteristics
Uf = 1.35
Compared to the original
construction this contributes to
a decrease in Uf of 27%.
File id: Thema
TA2_1_4_5_forbedring
Appendix E.5 1_3_6
Description
Combination of the exterior
sealing strip, the full thermal
breake and addition of PUR-foam
in both frame and sash.
Characteristics
Uf = 1.19
Compared to the original
construction this contributes to
a decrease in Uf of 35%.
File id: Thema
TA2_1_3_6_forbedring
Appendix E.6 1_3_6_7
Description
Combination of the exterior
sealing strip, the full thermal
breake and addition of PUR-foam
in both frame and sash and
between the aluminium and the
wooden frame.
Characteristics
Uf = 1.17
Compared to the original
construction this contributes to
a decrease in Uf of 36%.
File id: Thema
TA2_1_3_6_7_forbedring

Chapter 5 - Appendix
Assignment 2 – Report 2
Kasper Ubbe Nielsen; Kathrine N. Brejnrod; Theis H. Pedersen Side 13
Appendix E.7 1_11
Description
Combination of the exterior
sealing strip and the full thermal
breake.
Characteristics
Uf = 1.32
Compared to the original
construction this contributes to
a decrease in Uf of 28%.
File id: Thema
TA2_1_11_forbedring
Appendix E.8 1_11_9_12
Description
Combination of the exterior
sealing strip, the full thermal
breake and two additional PUR-
foam boxes in respectivly frame
and sash.
Characteristics
Uf = 1.1
Compared to the original
construction this contributes to
a decrease in Uf of 40%.
File id: Thema
TA2_1_11_9_12_forbedring
Appendix E.9 1_5_11
Description Combination of the exterior
sealing strip, the full thermal
breake and the foamed material
for all sealing strips.
Characteristics
Uf = 1.29
Compared to the original
construction this contributes to
a decrease in Uf of 30%.
File id: Thema
TA2_1_5_11_forbedring


Chapter 5 - Appendix
Assignment 2 – Report 2
Kasper Ubbe Nielsen; Kathrine N. Brejnrod; Theis H. Pedersen Side 15
Appendix F Datasheet Result – Case 1
See electronic file:


Chapter 5 - Appendix
Assignment 2 – Report 2
Kasper Ubbe Nielsen; Kathrine N. Brejnrod; Theis H. Pedersen Side 17
Appendix G Datasheet Result – Case 2.1
See electronic file:


Chapter 5 - Appendix
Assignment 2 – Report 2
Kasper Ubbe Nielsen; Kathrine N. Brejnrod; Theis H. Pedersen Side 19
Appendix H Datasheet Result – Case 2.2
See electronic file:


