30
AN EMPIRICAL APPROXIMATION OF THE NATURAL RATE OF INTEREST AND POTENTIAL GROWTH Documentos de Trabajo nº 0416 Marta Manrique José Manuel Marqués 2004

AN EMPIRICAL APPROXIMATIONOF THE NATURAL RATE OF INTEREST AND POTENTIALGROWTH
Documentos de Trabajo nº 0416
Marta Manrique
José Manuel Marqués
2004

AN EMPIRICAL APPROXIMATION OF THE NATURAL RATE OF INTEREST AND POTENTIAL
GROWTH
AN EMPIRICAL APPROXIMATION OF THE NATURAL RATE
OF INTEREST AND POTENTIAL GROWTH
Marta Manrique
José Manuel Marqués (*) BANCO DE ESPAÑA
(*) Monetary and Financial Studies Department. E-mail: [email protected] y [email protected] are grateful for comments received from Gabriel Pérez-Quiros, Paco Alonso, Juan Ayuso, Roberto Blanco, Juan Peñalosa, Fernando Restoy, Julio Segura and an anonymous referee, and the participants in the Seminar at the Bank of Spain. The opinions and analyses in the paper are the responsibility of the authors and, therefore, do not necessarily coincide with those ofthe Banco de España or the Eurosystem.
Documentos de Trabajo. N.º 0416 2004

The Working Paper Series seeks to disseminate original research in economics and finance. All papers have been anonymously refereed. By publishing these papers, the Banco de España aims to contribute to economic analysis and, in particular, to knowledge of the Spanish economy and its international environment. The opinions and analyses in the Working Paper Series are the responsibility of the authors and, therefore, do not necessarily coincide with those of the Banco de España or the Eurosystem. The Banco de España disseminates its main reports and most of its publications via the INTERNET at the following website: http://www.bde.es Reproduction for educational and non-commercial purposes is permitted provided that the source is acknowledged. © BANCO DE ESPAÑA, Madrid, 2004 ISSN: 0213-2710 (print) ISSN: 1579-8666 (on line) Depósito legal: M-42634-2004 Imprenta del Banco de España
“There is a certain rate of interest on loans which is neutral in respect to commodity
prices, and tends neither to raise nor to lower them”. Wicksell (1898, p102).
“So long as prices remain unaltered the [central] banks' rate of interest is to
remain unaltered. If prices rise, the rate of interest is to be raised; and if prices fall,
the rate of interest is to be lowered; and the rate of interest is henceforth to be
maintained at its new level until a further movement of prices calls for a change in
one direction or the other”. Wicksell (1898, p189).

Abstract
The aim of this paper is to isolate the long run movements on equilibrium interest rate
(or natural rate of interest) and potential growth. This estimations has been compute for US
and Germany using a methodology developed by Laubach and Williams that is based on a
Kalman Filter estimation of this two unobserved variables in a reduce structural model. The
results match properly with the generally accepted periods of recessions and points to a
reduced variation of the natural rate of interest, the potential growth and the business cycle
during the last decade. This lower variation question the effects on the policy design from
recent events like the "new economy". Moreover, we find that recently the natural rate of
interest had rose in US and exhibits a moderate deceleration on Germany, that seems
compatible with the different effect of new technologies for both economies. Moreover, the
paper reached some aspects of the current monetary policy stance in both countries.
BANCO DE ESPAÑA 11 DOCUMENTO DE TRABAJO N.º 0416
1 Introduction
The introductory quote to this paper defines the equilibrium interest rate, also known as the
natural rate of interest, as the rate consistent with an economy being in intertemporal
equilibrium or, in monetary terms, as that compatible with a constant inflation rate and with
output at its potential level. However, the natural rate of interest is not directly observable and
depends on factors, such as the potential growth of the economy and the individual
intertemporal discount factor, whose measurement is not obvious. Nevertheless, estimating
the natural rate of interest and its possible variations over time is important in the conduct of
monetary policy, since this concept can, if properly approached, provide a yardstick for
assessing the expansionary or restrictive tendency of real interest rates at any given time. In
fact, transformations in financial markets have reduced the importance of monetary
aggregates as useful intermediate targets for interpreting how the decisions of monetary
authorities are related to price stability and economic growth targets. Against this
background, direct comparison of the interest rate set by the central bank with the natural
rate of interest has taken on greater importance in assessing the monetary policy stance. A
case in point here is the success of monetary policy rules as an analytical instrument for a
posteriori interpretation of central bank decisions.
Obviously, although these measurements seem to reflect fairly well the interest rate
behaviour in various developed countries, a central bank’s decision-making process involves
more factors than those included in the measurements. However, various authors have
pointed out that the misalignment in certain periods of time of the observed interest rates with
those that would result from monetary policy rules may be related to the uncertainty faced by
the authorities in approximating certain variables included in those rules1. This debate, which
has traditionally centred on the measurement of potential output, has spread recently to the
assessment of errors that may result from not taking into account the fluctuations in the
natural rate of interest. Notable in this respect are the studies by Laubach and Williams (2003)
(hereafter “LW”) and by Orphanides and Williams (2002), which illustrate the costs of
mismeasuring equilibrium real interest rates.
Against this background, this study uses methodology developed by LW based on
the Kalman filter to estimate the natural rate and potential growth for the United States and
Germany. The behaviour of these variables in the two areas is compared and the degree of
variability shown by them is analysed. These two countries were chosen because of their
importance in the global economy. Also, the stability of their economic policies and the stable
behaviour of their main macroeconomic variables make the process of estimation less
complex than for other countries.
This paper is structured as follows: Section 2 defines, from a theoretical standpoint,
the concept of natural rate of interest that it is intended to identify; Section 3 discusses the
estimation procedure used and presents the results; and Section 4 sets forth the main
conclusions drawn from this work.
1. Notable in this respect are the papers by Orphanides (2003), Judd and Rudesbuch (1999) and Clarida et al. (2000) discussing the possible monetary policy implications of the uncertainty faced when approximating unobservable variables such as potential output.

BANCO DE ESPAÑA 12 DOCUMENTO DE TRABAJO N.º 0416
2 Natural rate of interest: definition
The equilibrium interest rate or natural rate of interest2 is a classical concept in economic
literature introduced by Wicksell more than a century ago. However, the pre-eminent role of
short-term interest rates in the implementation of monetary policy by various central banks
and the increasing dissemination of Taylor rules among analysts3 –whose implementation
required to compute an equilibrium interest rate– among analysts have contributed to the
resurgence of interest in this variable in both the theoretical and the empirical fields.
To understand the role played by the natural rate of interest in recent academic
debate, it is useful to start by establishing a general definition of what is understood by it. The
natural rate of interest is interpreted as "the interest rate consistent with output converging to
potential, where potential is the level of output consistent with stable inflation" (Bomfim 1997).
This definition is similar to that of other authors such as Woodford (2003) and Blinder (1998),
and is a concept that is somewhat analogous to the natural rate of unemployment (Friedman
1968). The natural rate of interest is equal to the return on capital that would be expected if
there was no friction in the economy, which should also be the interest rate set by monetary
policy in the absence of rigidities.
This general definition of the natural rate of interest thus coincides with the ideas
introduced by Wicksell and can be found in a wide range of recent economic models.
Specifically, the only features required for models to coincide with this neo-Wicksellian
interpretation of monetary policy are as follows:
— The behaviour of prices or of inflation can be expressed as a function of the
difference between the interest rates set by monetary policy and the natural rate of
interest.
— The natural rate of interest depends on real fundamentals (marginal productivity of
capital, intertemporal elasticity of substitution in consumption and population
growth, among others).
— The behaviour of monetary policy can be summarised through an operating rule.
While the last two conditions are explicitly included in most economic models, the
first condition, which deals with the relationship of price behaviour to the difference
between the interest rate and the natural rate, is not so obvious. However, as shown by
Woodford (2003), it is easy to verify that this relation is implicitly included in most models.
Nevertheless, when estimating the equilibrium interest rate, certain details of how this
concept is interpreted may vary depending on the formulation chosen in the model. Thus, if
the framework in which the natural rate is estimated focus on fluctuations around a constant
mean level (known as high frequency movements) we obtained the response of natural
interest rate to temporary shocks. This movement, by construction shows an important
cyclical component. If, on the contrary, the natural rate is identified under a scenario that
considers both the movements around a mean and the possible changes in this mean level,
this generates a natural rate that includes mainly low-frequency movements and will not have
an important cyclical nature.
Estimates can thus be found in the literature that remove low frequency movements
by using detrended series, such as those made by Rotemberg and Woodford (1997), Neiss
and Nelson (2001), Giammmarioli and Valla (2003) and Andrés et al. (2003), which usually
avoid low-frequency movements and use trendless series. In these studies the natural rate of
interest has a markedly cyclical profile and provides some indication of a monetary policy
2. These two terms are used indistinctly in this paper. 3. See J.B. Taylor (1993)
BANCO DE ESPAÑA 13 DOCUMENTO DE TRABAJO N.º 0416
stance statistically related with the business cycle4. This kind of approach is usually based on
structural models and therefore, as shown by Levin, Wieland and Williams (2001), yields
results that depend strongly on the assumptions used in the models.
The estimates aimed at identifying a natural rate more closely related to trend
changes, such as those proposed by LW, provide a metric for monetary policy that is less
dependent on cyclical shocks. However, the structural nature of these variables is not directly
linked to any observable phenomenon, which means that these estimates usually suffer from
accuracy and robustness problems.
The aim of this work is precisely to identify not only temporary fluctuations on natural
interest rate but also more permanent changes. To do this, the estimation procedure used
has to have certain properties. First, it has to allow the estimates of the natural rate of interest
to vary with time. This characteristic, which is obvious from the theoretical angle, can be
appreciated in any description of real interest rates for sufficiently long periods of time. For
example, Manrique and Marqués (2002) discuss how the historical averages of real rates for
different time periods have changed significantly.
Next, the results have to be robust to different specifications of the model implicit in
the estimate and take into account not only temporary fluctuations but also more permanent
changes. In fact, given the structural nature of this concept it seems natural that these low
frequency movements prevail. For this reason the approach based on general dynamic
equilibrium models such as in Rotemberg and Woodford (1997) and Neiss and Nelson (2003)
is not used, since in this framework the estimates can be highly sensitive to the parameters
calibrated in them and in general in this models is imposed a constant mean for natural
interest rate.
In addition, as noted in the preceding section, the natural rate of interest has to be
directly related to real factors and should reflect shifts in the economic production structure.
Therefore, it is unsuitable here to follow the approach of Siklos (2001), who used an ARIMA
model in which the variance of the real interest rate follows a GARCH process, or that of
Crespo-Cuaresma et al. (2003), which describes a multivariate technique for unobservable
components in which only the statistical properties of the series are used. Similarly, estimates
based on forward rates obtained in the interest rate term structure, such as those of
Bomfin (2001) and of Kozicki and Tinsley (2001), generate low-frequency estimates which,
however, are not necessarily related to structural characteristics of the economy and in which,
furthermore, it is complicated to incorporate time variation into the risk premium.
In this respect the methodology developed by LW provides a more suitable
framework to provide an estimate of the natural rate of interest useful for the monetary policy
analysis. In fact, this methodology overcome the model dependency of the dynamic general
equilibrium models and offers a natural rate of interest evolution compatible with production
structural changes. These authors developed a reduced-form structural model in which the
natural rate of interest is explained by the potential growth of the economy. Both factors are
considered to be unobserved and they are estimated, in the framework of the model
described in the following section, using Kalman filter methodology, which allows changes in
state variables. This structure allows estimates able to identify a long-term movement in
equilibrium real interest rates linked to real characteristics of the economy. Moreover, the
reduced-form specification of the model avoids the high sensitivity of results to slight changes
that is seen in more highly structured models.
4. In certain cases, such as in Neiss and Nelson (2001), the difference between this natural rate and the real interest rate extracted from the market prices of indexed bonds is used as an indicator of the degree of monetary restrictiveness and
for prediction purposes.

BANCO DE ESPAÑA 14 DOCUMENTO DE TRABAJO N.º 0416
3 Estimation of a time-varying natural rate of interest
3.1 Specification of the Model
The model is based on the system of equations of LW (2003), although in certain robustness
exercises slight changes have been made to it when measuring real interest rates. These
authors use the Kalman filter to jointly estimate the natural rate of interest, potential output
and potential output growth rate. To do this, they propose a system of equations that jointly
characterises the behaviour of inflation and of the output gap. Although this multi-equation
specification entails a larger number of parameters to be estimated, it provides a more
appropriate framework for estimating the medium-term movements of the natural rate of
interest, since it avoids the bias introduced into single-equation methods when there are
prolonged inflationary or disinflationary processes5. The reduced form of the model thus
consists of the following equations:
ỹt = Ay (L) ỹt-1 + Ar (L) (r t-1 – r*t-1) + ε 1t (1)
πt = Bπ (L) πt-1 + By (L) ỹ t-1 + Bx(L) x t + ε 2t (2)
r*t = c gt + z t (3)
z t = Dz (L) zt-1 + ε 3t (4)
y*t = y*t-1 + gt-1 + ε 4t (5)
gt = gt-1 + ε 5t (6)
Equation (1) explains the output gap, defined as the percentage deviation of real
GDP from potential GDP (ỹt = yt - y*t ), as a function of its own lags, the lags in the differential
between the short-term real interest rate (r t-1) and the natural rate of interest (r*t-1) and a
uncorrelated error term ε 1t 6. In this equation, the output gap lag structure and the error term
are intended to reflect short-term dynamics and temporary shocks, while structural shifts in
this relationship between the output gap and the real interest rate are reflected in variations in
the natural rate r*. Finally, the inclusion in this equation of the difference between the real and
natural rates of interest means that the estimate of the latter has to be compatible with the
real interest rate that would be obtained in a stationary state if the output gap were closed.
Equation (2) represents the inflation dynamic (πt). Against a background of price
rigidity, it is a function of its own lags, lagged output gap and an exogenous term (xt) that
reflects relative energy prices. In short, equations (1) and (2) are the measurement equations
of the model in state space.
Equation (3) indicates that the natural rate of interest (r*t ) depends only on real
factors, specifically the trend growth in the economy (gt) and a series of random factors
(associated, for example, with changes in financial deregulation or with changes in the rate of
intertemporal substitution of households7), which are denoted by the variable zt, which in turn
follows a stochastic process determined by equation (4).
Finally, equation (5) refers to potential output. It is assumed to follow a random walk
and time variation is permitted in its growth rate, which in turn behaves according to a
random walk model [equation (6)]. The model allows temporary shocks to both the level of
5. The simplest example of univariate approximation consists of applying the Hodrick Prescott filter to the observed real interest rate series with a suitable lambda which generates a medium-term variation. In this case it is implicitly assumed that the inflation rate is stationary, so the resulting natural rate increases in periods in which inflation shows a downward trend. 6. This specification is similar to that used by Rudesbuch and Svensson (1999), except that they assumed constant behaviour for r*. 7. A summary of the additional factors that can affect the natural rate of interest can be found in N. Bjorkstend and O. Karagedikli (2003).

BANCO DE ESPAÑA 15 DOCUMENTO DE TRABAJO N.º 0416
potential output and to its growth rate through inclusion of the error terms ε4t and ε5t. Hence
equations (3)-(6) are the transition equations of the state-space model.
In short, the system of equations (1)- (6) proposed by LW is fairly similar to that used
by other authors to decompose GDP into its trend-cycle components [see Watson (1986),
Clark (1987) and Kuttner (1994)], with the novelty that it includes the interest rate, thus
enabling the natural rate of interest to be estimated. Recently Larsen and McKeown (2003)
have used a model similar to that of LW for the UK without imposing the relationship between
the natural rate of interest and potential growth. This, given the large number of parameters to
be estimated, causes considerable difficulties in arriving at satisfactory results.
To specify the lags built into the model, in the case of the United States the
restrictions included in LW were taken as the initial reference. Thus the output gap and
inflation equations have a fairly broad lag structure that includes two lags for the output gap
polynomial –Ay(L)–, consistent with the characterisation of the output gap as an AR(2) in the
foregoing trend-cycle analyses. A structure of two lags is defined for the real interest rate
gap –Ar(L)– with the restriction that the coefficients have to be equal (this assumption is not
rejected by the data in any of the exercises carried out). In the inflation equation (2), eight
inflation lags are included and the restriction that the coefficients sum to unity is imposed.
Further, for reasons of parsimony, an additional restriction requires the coefficients of lags two
and four to be equal, and likewise for those of lags five to eight. A single lag is added for the
output gap regresor in this equation, and the same for the energy relative price regresor.
Finally, different autoregressive structures were tested with the interest rate term zt, since the
specification thereof can significantly influence the estimate of the natural interest rate.
Owing to the lack of references in the literature, the structure chosen for Germany is
similar to that imposed for the US, although a more reduced lag structure was specified in
order to reduce the number of parameters to estimate. In particular, a single inflation lag
seems sufficient in the inflation equation, whereas two lags are included in both the output
gap and the interest rate gap. This specification seems to be sufficient to characterise the
cyclical episodes in Germany on the basis of the proposed model. Finally, various
assumptions were made about the movement of the component zt.
3.2 Data
Quarterly data from various sources for a sample period running from 1962 Q2 to 2001 Q4
were used. For the variable yt, log GDP at constant prices and seasonally adjusted was
obtained from Eurostat. The nominal interest rate was proxied by the three-month interbank
rate (unlike LW, who used the intervention rate). The reason is that, although this interest rate
is closely linked to the monetary policy rate, its greater variability makes for readier estimation.
The inflation measure used was the year-on-year growth rate of GDP excluding
unprocessed food and energy, on information from OECD databases. The ex-post real
interest rate is the difference between the nominal interest rate and the rate of inflation as
measured by the general CPI8. The price of energy relative to that of other goods was
measured by means of the producer price index for oil and oil products.
3.3 Estimation methodology
As in LW, the estimate was made by the maximum likelihood method using Kalman filter
methodology. However, the variance of the potential growth and of the natural rate is
presumably a good deal less than that of the data used to make the estimate. This means
8. There is some inconsistency because the general CPI is used to calculate the ex-post real rates and a “restricted” CPI is used to proxy inflation. This specification has been maintained so that the results are comparable with those reported in the literature and for reasons of efficiency in estimation due to the higher variability of the general CPI. However, Section 4.1 poses an ex-ante specification free from this inconsistency and it is found that the effect is minimal for the main characteristics of the natural rate of interest, however in Germany the results exhibits a higher degree of volatility.
BANCO DE ESPAÑA 16 DOCUMENTO DE TRABAJO N.º 0416
that the maximum likelihood estimates of these variances are biased towards zero9. Therefore
the estimate is made in two stages. In the first, the median-unbiased estimator proposed by
Stock and Watson (1998) is used to estimate the relation between the standard deviations of
the trend growth (σ5) and of the potential output (σ4) and that between the standard
deviations of the term zt (σ3) and of of the output gap (σ1) by means of the terms denoted λg
and λz:
4
5σ
σλ ≡g (7)
21
3 raz
σ
σλ ≡ (8)
In the second stage these ratios are imposed in the estimation of the remaining
model parameters by maximum likelihood.
To estimate λg, potential output must previously be estimated. This is done by the
method of Kuttner (1994), which consists of applying the Kalman procedure to a model in
which the trend growth rate of the economy –gt– is constant and the output gap does not
depend on the interest rate gap. Based on this potential output estimation exercise, the
exponential Wald statistic of Andrews and Ploberger (1994) is calculated for a structural break
at an unknown time in the growth of potential output. Then the Stock and Watson estimator
is used to convert this statistic into an estimate of λg.
Next the term λz is estimated under the initial model, but assuming that zt is
constant. Also, to estimate λz, the value of σ5 is set to that obtained in the previous step.10
Once the value of λg and λz have been estimated, restrictions (7) and (8) are imposed in the
estimation of (1)-(6). These restrictions on variances play a fundamental role in the estimation
process, which is why in the annex 1 we include a robustness exercises that include some
sensitivity analysis for this variances exercises in this respect based on the values obtained.
The model was estimate by the Kalman filter methodology. On this respect, in annex 2 it
could be found some details of the estimation process.
3.4 Results
In the US, the result of the exponential Wald test, which tests for a structural change in the
first difference of potential output, shows little variability over time. In fact, it reaches a value
of 2.26, which is larger than the critical value of 1.55 at the 10% significance level. Moreover,
using the unbiased Stock and Watson estimator, the weak evidence of change in the
potential growth rate of the economy manifests itself in an estimate of the parameter λg
of 0.049. In the case of Germany, the exponential Wald test yields a value of 4.70 significant
at the 1% level, which results in an estimate of λg of 0.19.
The value given by the exponential Wald test for a structural change in the constant
of the natural rate is 1.27 for the US and the unbiased estimator of λz is 0.03. In the case of
Germany, the exponential Wald test yields a value of 0.71, with λz estimated at 0.02.
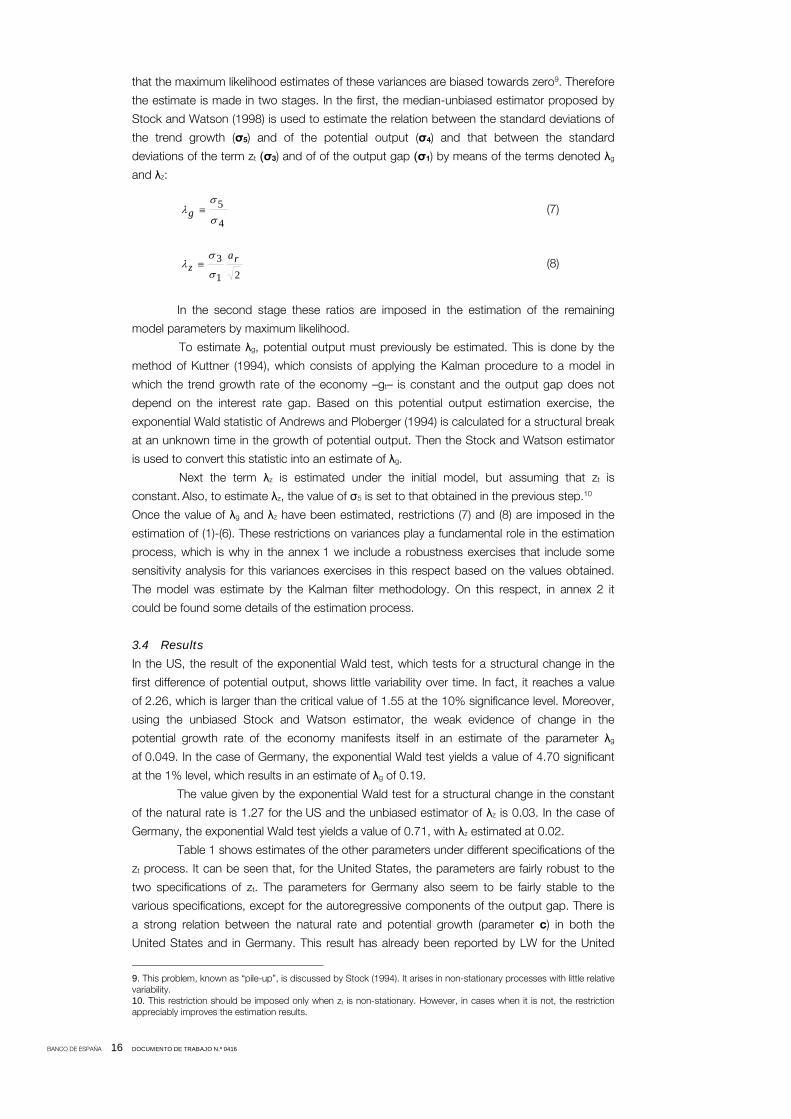
Table 1 shows estimates of the other parameters under different specifications of the
zt process. It can be seen that, for the United States, the parameters are fairly robust to the
two specifications of zt. The parameters for Germany also seem to be fairly stable to the
various specifications, except for the autoregressive components of the output gap. There is
a strong relation between the natural rate and potential growth (parameter c) in both the
United States and in Germany. This result has already been reported by LW for the United
9. This problem, known as “pile-up”, is discussed by Stock (1994). It arises in non-stationary processes with little relative variability. 10. This restriction should be imposed only when zt is non-stationary. However, in cases when it is not, the restriction appreciably improves the estimation results.
BANCO DE ESPAÑA 17 DOCUMENTO DE TRABAJO N.º 0416
Σay 0.999 0.999 0.510 0.270
ar -2.299 -2.299 -2.320 -2.320
c 0.846 0.846 0.610 0.610
Log F.V. 368.397 368.360 258.130 258.600
UNITED STATES GERMANY
Zt ~ AR(1)λg = 0.049λz = 0.03
Zt ~ AR(2)λg = 0.049λz = 0.03
Zt ~ AR(1)λg = 0.19λz = 0.02
Zt ~ AR(2)λg = 0.19λz = 0.02
ESTIMATION RESULTS TABLE 1
States and, potential growth and the natural rate of interest.given the low level of component
zt, points to a clear relation between average.
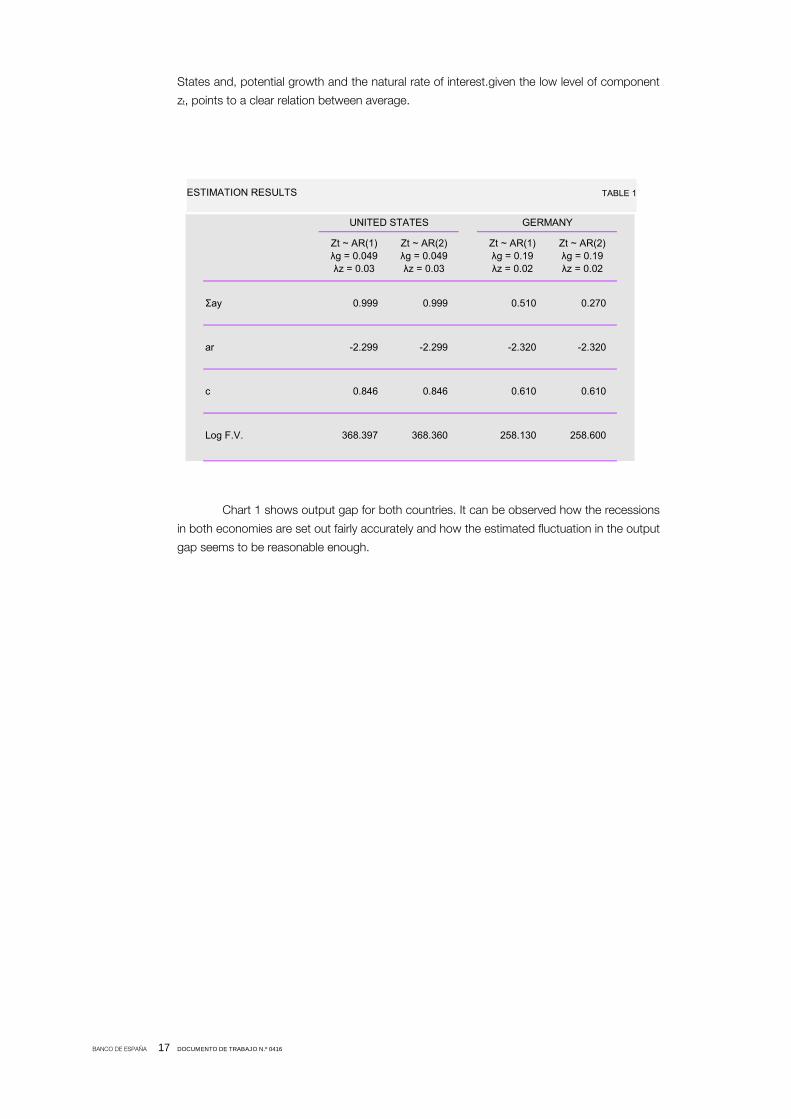
Chart 1 shows output gap for both countries. It can be observed how the recessions
in both economies are set out fairly accurately and how the estimated fluctuation in the output
gap seems to be reasonable enough.
BANCO DE ESPAÑA 18 DOCUMENTO DE TRABAJO N.º 0416
ESTIMATES OF OUTPUT GAP USING KALMAN FILTER METHODOLOGY CHART 1
SOURCE: Author's calculations.
a. US recessions estimated by the National Bureau of Economic Research (NBER) and german recessions estimated by the Economic Cycle Research Institute (ECRI) are shaded.
-4
-2
0
2
4
6
8
1964 1966 1968 1970 1972 1974 1976 1978 1980 1982 1984 1986 1988 1990 1992 1994 1996 1998 2000 2002
UNITED STATES (a)
%
-2
-1
0
1
2
3
4
1964 1966 1968 1970 1972 1974 1976 1978 1980 1982 1984 1986 1988 1990 1992 1994 1996 1998 2000 2002
GERMANY (a)
%
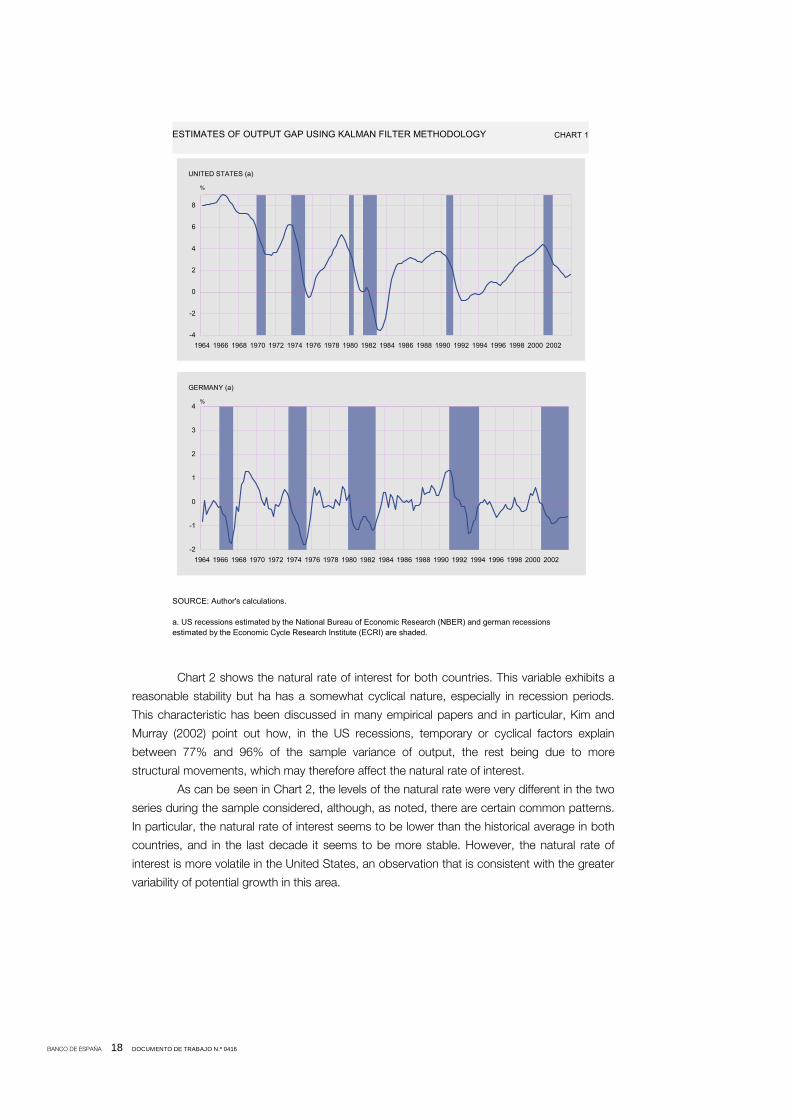
Chart 2 shows the natural rate of interest for both countries. This variable exhibits a
reasonable stability but ha has a somewhat cyclical nature, especially in recession periods.
This characteristic has been discussed in many empirical papers and in particular, Kim and
Murray (2002) point out how, in the US recessions, temporary or cyclical factors explain
between 77% and 96% of the sample variance of output, the rest being due to more
structural movements, which may therefore affect the natural rate of interest.
As can be seen in Chart 2, the levels of the natural rate were very different in the two
series during the sample considered, although, as noted, there are certain common patterns.
In particular, the natural rate of interest seems to be lower than the historical average in both
countries, and in the last decade it seems to be more stable. However, the natural rate of
interest is more volatile in the United States, an observation that is consistent with the greater
variability of potential growth in this area.
BANCO DE ESPAÑA 19 DOCUMENTO DE TRABAJO N.º 0416
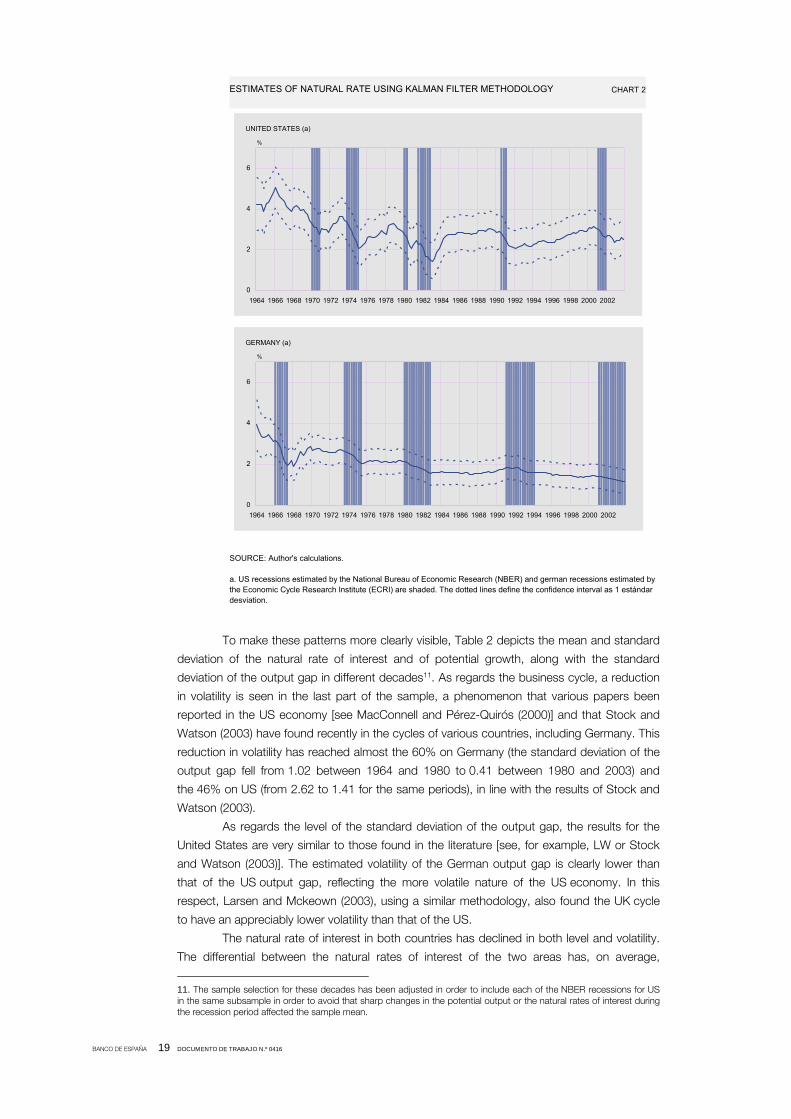
ESTIMATES OF NATURAL RATE USING KALMAN FILTER METHODOLOGY CHART 2
0
2
4
6
1964 1966 1968 1970 1972 1974 1976 1978 1980 1982 1984 1986 1988 1990 1992 1994 1996 1998 2000 2002
UNITED STATES (a)
%
0
2
4
6
1964 1966 1968 1970 1972 1974 1976 1978 1980 1982 1984 1986 1988 1990 1992 1994 1996 1998 2000 2002
GERMANY (a)
%
SOURCE: Author's calculations.
a. US recessions estimated by the National Bureau of Economic Research (NBER) and german recessions estimated by the Economic Cycle Research Institute (ECRI) are shaded. The dotted lines define the confidence interval as 1 estándar desviation.
To make these patterns more clearly visible, Table 2 depicts the mean and standard
deviation of the natural rate of interest and of potential growth, along with the standard
deviation of the output gap in different decades11. As regards the business cycle, a reduction
in volatility is seen in the last part of the sample, a phenomenon that various papers been
reported in the US economy [see MacConnell and Pérez-Quirós (2000)] and that Stock and
Watson (2003) have found recently in the cycles of various countries, including Germany. This
reduction in volatility has reached almost the 60% on Germany (the standard deviation of the
output gap fell from 1.02 between 1964 and 1980 to 0.41 between 1980 and 2003) and
the 46% on US (from 2.62 to 1.41 for the same periods), in line with the results of Stock and
Watson (2003).
As regards the level of the standard deviation of the output gap, the results for the
United States are very similar to those found in the literature [see, for example, LW or Stock
and Watson (2003)]. The estimated volatility of the German output gap is clearly lower than
that of the US output gap, reflecting the more volatile nature of the US economy. In this
respect, Larsen and Mckeown (2003), using a similar methodology, also found the UK cycle
to have an appreciably lower volatility than that of the US.
The natural rate of interest in both countries has declined in both level and volatility.
The differential between the natural rates of interest of the two areas has, on average,
11. The sample selection for these decades has been adjusted in order to include each of the NBER recessions for US in the same subsample in order to avoid that sharp changes in the potential output or the natural rates of interest during the recession period affected the sample mean.

BANCO DE ESPAÑA 20 DOCUMENTO DE TRABAJO N.º 0416
OUTPUT GAP
Average level Volatility (a) Average level Volatility (a) Volatility (a)
UNITED STATES1964-2003 2.9 0.7 3.4 0.8 2.8 1964-1981 3.3 0.7 4.0 0.8 2.6 1982-1992 2.5 0.5 2.9 0.5 2.2 1993-2003 2.6 0.3 3.1 0.3 1.4GERMANY1964-2003 1.9 0.5 3.2 0.9 0.8 1964-1981 2.4 0.4 4.0 0.7 1.0 1982-1992 1.7 0.1 2.7 0.3 0.6 1993-2003 1.4 0.1 2.4 0.2 0.4
POTENCIAL GROWTHNATURAL RATE
NATURAL RATE OF INTEREST AND OUTPUT GAP TABLE 2
SOURCE: Author's calculations.
a. Sample standard deviation.
%
increased from 90 basis points between 1964 and 1980 to 120 basis points in the 1990s.
This result seems consistent with recent estimates for the euro area [see, among others,
Cuaresma et al. (2003)] and with the results of LW for the United States. Moreover, this
performance of the differential between the two areas seems compatible with the divergent
behaviour of productivity –probably related to the different uses of new technologies– and
population growth in the two countries. Moreover, the natural rate of interest during the last
part of the sample indicate an important degree of easy from monetary policy stance on
United States and a moderate ease on Germany.
In this country the estimates for the natural rate of interest on the recent past seems
significantly lower than the results obtained for the euro area aggregate in other papers. In
particular, Giammaroli and Valla (2003) estimate a dynamic general equilibrium for the euro
area and find that the natural interest rate fluctuates between 3% and 3.7% during last
decade. In the same vein but using an unobserved component approach, Crespo, Cuaresma
and Ritzberger-Gruenwald (2003) obtained that natural interest rate for the euro area would
result close to the 2% at the end of the 90,s. This spread between the real equilibrium interest
rate for Germany and for the euro area could create some restrictiveness of the euro area
monetary policy for this country. However, this bias could be partially offset if the equilibrium
inflation rate for Germany will be lower than the average since this creates less tolerance for
the inflation than in other countries12.
Moreover, the lower variability of the "latent" variables (potential growth and natural
rate of interest) in both countries seems to indicate that changes in these variables represent
less uncertainty for the design of economic policy objectives than in previous periods.
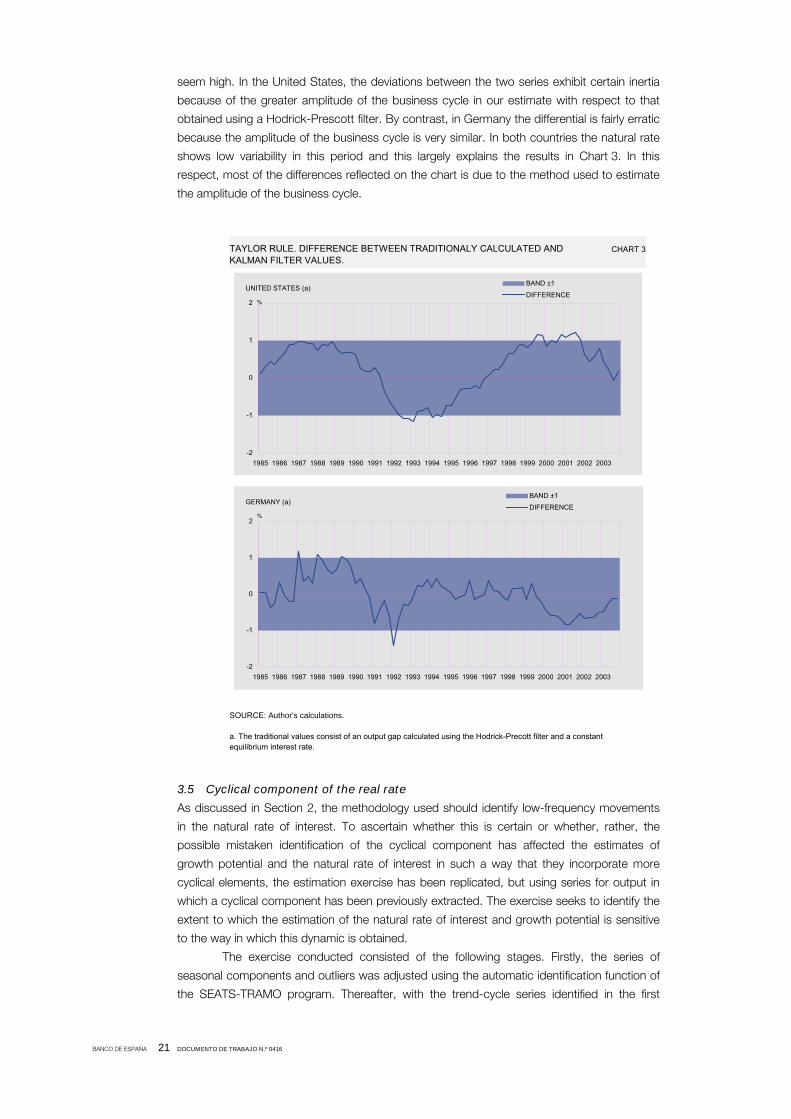
Specifically, in the case of monetary policy, Chart 2 plots the amount by which the interest
rate that would result from applying a Taylor rule with the natural rate and output gap
estimated in this study differs from that obtained by the traditional approach of assuming the
equilibrium real interest rate to be constant and calculating the business cycle by the
Hodrick-Prescott filter. As can be seen in the chart, in the last two decades the deviation
between the two interest rates is barely one percentage point in absolute terms. This
discrepancy, taking into account the error margin in estimating the two variables, does not
12. In terms of the Taylor rule this would imply that the constant is inferior in the rule for Germany but, for the same level of inflation creates a higher response in Germany since the equilibrium inflation rate is reduced.
BANCO DE ESPAÑA 21 DOCUMENTO DE TRABAJO N.º 0416
TAYLOR RULE. DIFFERENCE BETWEEN TRADITIONALY CALCULATED AND KALMAN FILTER VALUES.
CHART 3
SOURCE: Author's calculations.
a. The traditional values consist of an output gap calculated using the Hodrick-Precott filter and a constant equilibrium interest rate.
-2
-1
0
1
2
1985 1986 1987 1988 1989 1990 1991 1992 1993 1994 1995 1996 1997 1998 1999 2000 2001 2002 2003
BAND ±1
DIFFERENCEUNITED STATES (a)
%
-2
-1
0
1
2
1985 1986 1987 1988 1989 1990 1991 1992 1993 1994 1995 1996 1997 1998 1999 2000 2001 2002 2003
BAND ±1
DIFFERENCEGERMANY (a)
%
seem high. In the United States, the deviations between the two series exhibit certain inertia
because of the greater amplitude of the business cycle in our estimate with respect to that
obtained using a Hodrick-Prescott filter. By contrast, in Germany the differential is fairly erratic
because the amplitude of the business cycle is very similar. In both countries the natural rate
shows low variability in this period and this largely explains the results in Chart 3. In this
respect, most of the differences reflected on the chart is due to the method used to estimate
the amplitude of the business cycle.
3.5 Cyclical component of the real rate
As discussed in Section 2, the methodology used should identify low-frequency movements
in the natural rate of interest. To ascertain whether this is certain or whether, rather, the
possible mistaken identification of the cyclical component has affected the estimates of
growth potential and the natural rate of interest in such a way that they incorporate more
cyclical elements, the estimation exercise has been replicated, but using series for output in
which a cyclical component has been previously extracted. The exercise seeks to identify the
extent to which the estimation of the natural rate of interest and growth potential is sensitive
to the way in which this dynamic is obtained.
The exercise conducted consisted of the following stages. Firstly, the series of
seasonal components and outliers was adjusted using the automatic identification function of
the SEATS-TRAMO program. Thereafter, with the trend-cycle series identified in the first

BANCO DE ESPAÑA 22 DOCUMENTO DE TRABAJO N.º 0416
stage, the cyclical component was extracted, having been identified as the residual of
an IMA (2,2) process where the parameters are obtained on the basis of the size of the cycle
it is intended to estimate using the Kaiser-Maravall algorithm (2001). This process was
followed for all series and has been calculated for cycles of 10 and 20 years.
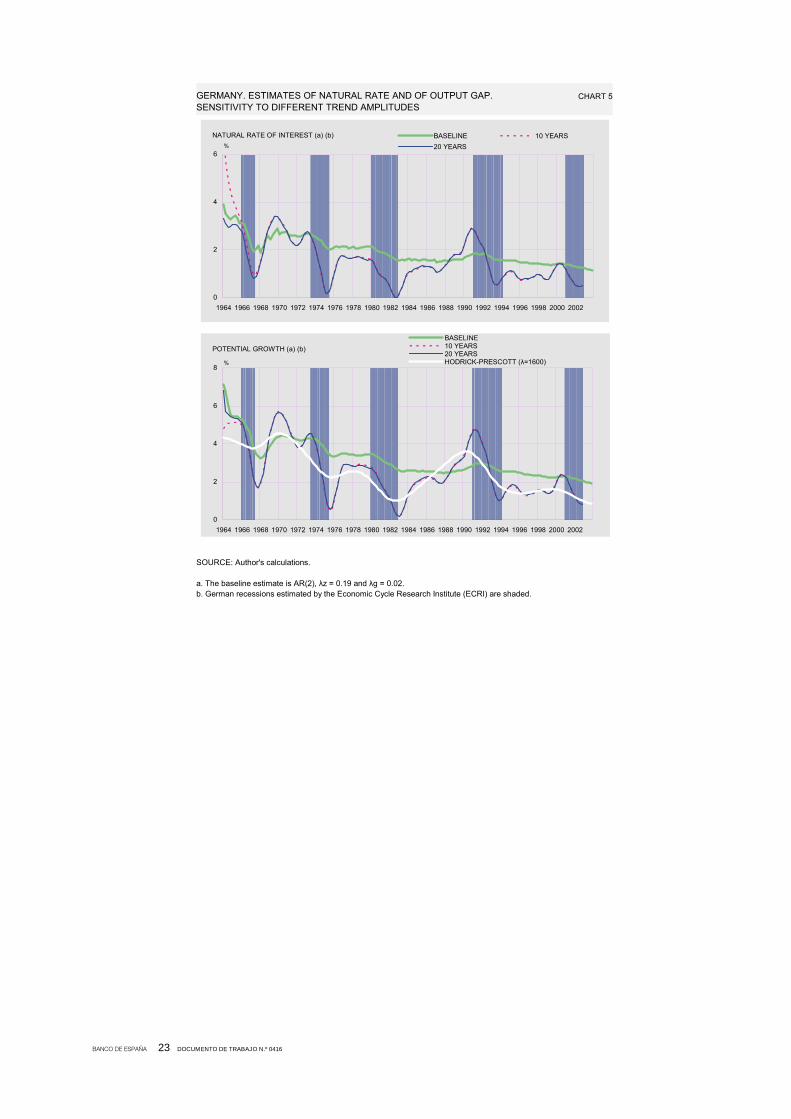
Charts 4 and 5 offer the results for the United States and Germany, respectively,
comparing them with those obtained previously. Moreover, the growth potential estimate is
presented using the Hodrick-Prescott filter in the habitual fashion. The charts show how the
results are very similar, although in some periods minor differences arise. In the case of the
United States, these differences only appear slightly to affect the level of the natural rate in
certain periods of time, while a somewhat less stable behaviour of the natural rate of interest
is obtained in the case of Germany. In sum, this exercise suggests that the estimation of both
components appears to be independent of the way in which the business cycle is
characterised. In any event, the main regularities discussed for the natural rate and growth
potential (reduction in the level and in volatility during the second half of the sample), are not
affected in the case of extracting the cyclical component from output by means of a prior
filter.
UNITED STATES. ESTIMATES OF NATURAL RATE AND OF OUTPUT GAP.SENSITIVITY TO DIFFERENT TREND AMPLITUDES
CHART 4
SOURCE: Author's calculations.
a. Recessions estimated by the National Bureau of Economic Research (NBER) are shaded.
0
2
4
6
1964 1966 1968 1970 1972 1974 1976 1978 1980 1982 1984 1986 1988 1990 1992 1994 1996 1998 2000 2002
BASELINE 10 YEARS20 YEARS
NATURAL RATE OF INTEREST (a)%
0
2
4
6
1964 1966 1968 1970 1972 1974 1976 1978 1980 1982 1984 1986 1988 1990 1992 1994 1996 1998 2000 2002
BASELINE10 YEARS20 YEARSHODRICK-PRESCOTT (λ=1600)
POTENTIAL GROWTH (a)
%
BANCO DE ESPAÑA 23 DOCUMENTO DE TRABAJO N.º 0416
GERMANY. ESTIMATES OF NATURAL RATE AND OF OUTPUT GAP.SENSITIVITY TO DIFFERENT TREND AMPLITUDES
CHART 5
SOURCE: Author's calculations.
a. The baseline estimate is AR(2), λz = 0.19 and λg = 0.02.b. German recessions estimated by the Economic Cycle Research Institute (ECRI) are shaded.
0
2
4
6
1964 1966 1968 1970 1972 1974 1976 1978 1980 1982 1984 1986 1988 1990 1992 1994 1996 1998 2000 2002
BASELINE 10 YEARS20 YEARS
NATURAL RATE OF INTEREST (a) (b)%
0
2
4
6
8
1964 1966 1968 1970 1972 1974 1976 1978 1980 1982 1984 1986 1988 1990 1992 1994 1996 1998 2000 2002
BASELINE10 YEARS20 YEARSHODRICK-PRESCOTT (λ=1600)
POTENTIAL GROWTH (a) (b)
%
BANCO DE ESPAÑA 24 DOCUMENTO DE TRABAJO N.º 0416
4 Conclusions
This paper presents the estimates of the natural rate of interest and the output gap for the
United States and Germany via the methodology developed by LW. Output gap values
consistent with the periods of recession and expansion established for these countries are
obtained and it may be concluded, with the necessary caveats inherent in these types of
estimates, that the natural rate of interest and the output gap in both countries have shown
volatility over the past decade below their historical mean. The greater stability of these
variables allows the possible impact on the design of economic policies of recent phenomena
such as the technology revolution or the “new economy” to be relativised, in the sense that
recent changes in growth potential and the natural rate of interest do not appear to have
come about in the immediate past more sharply than in previous periods.
Moreover, the positive differential of the US natural rate over that of Germany is
found to have increased recently. That would appear to be consistent with the information
available on the growth potential differential between both areas as a likely consequence of
the different incorporation of new technologies in both economies.
Finally, these results could be use for the assessment of monetary policy stance in
these areas. This exercise should be considered with some concern since the level for the
natural rate of interest was obtained with some uncertainty and was specially affected by the
estimation assumptions. Taking into account those caveats, the results points to some
slackness for monetary conditions at the end of the sample. In fact, the natural rate of interest
for US was situated on 2003 between 1.6% and 2.3% compared with the -0.6% of
ex-post US real rate of interest. However in Germany natural rate of interest fluctuates
around 0.5% and 1.7% closer to the 0.3% of observed real rate of interest on this country.

BANCO DE ESPAÑA 25 DOCUMENTO DE TRABAJO N.º 0416
BIBLIOGRAPHY
ANDRÉS, J., D. LÓPEZ-SALIDO, and E. NELSON (2003). Money and the Natural Rate of Interest, mimeo. ANDREWS, D., and W. PLOBERGER (1994). “Optimal Tests When Nuisance Parameter is Present Only Under the
Alternative”, Econometrica, 62, pp. 1383-1414. BJORKSTEND, N., and O. KARAGEDIKLI (2003). Neutral interest rates revisited, Reserve Bank Bulletin of New Zealand,
Vol. 66, n.º 3. BLINDER, AL. S. (1998). Central Banking in Theory and Practice, MIT Press, Cambridge. BOMFIM, A. (1997). “The Equilibrium Fed Funds Rate and the Indicator Properties of Term-Structure Spreads”,
Economic Inquiry, 35 (4), pp. 830-846. –– (2001). Measuring Equilibrium Real Interest Rates: What can we learn from indexed bonds?, Working Paper n.º 53,
Board of Governors of the Federal Reserve System. CLARIDA, R., J. GALI, and M. GERTLER (2000). “Monetary Policy Rules and Macroeconomic Stability: Evidence and
Some Theory”, Quaterly Journal of Economics, 115, pp. 147-180. CLARK, P. (1987). “The Cyclical Component of U.S. Economic Activity”, Quaterly Journal of Economics, 102,
pp. 797-814. CRESPO-CUARESMA, J., E. GNAN, and D. RITZBERGER-GRUENWALD (2003). Searching for the natural Rate of
Interest: A Euro-Area Perspective, Working Paper n.º 84, Oesterreichische Nationalbank. FRIEDMAN, M. (1968). “The role of Monetary Policy”, American Economic Review, 58, pp. 1-17. GIAMMARIOLI, N., and N. VALLA (2003). The natural rate of interest in the euro area, Working Paper n.º 233, European
Central Bank . JUDD, J. P., and G. D. RUDEBUSCH (1998). “Taylor's Rule and the Fed: 1970-1997”, Economic Review, n.º 3,
pp. 3-22, Federal Reserve Bank of San Francisco. KAISER, R., and A. MARAVALL (2001). “Measuring Business Cycles in Economic Time Series”, Lecture Notes on
Statistics, 154, Springer-Verlag. KIM, CH.-J., and C. J. MURRAY (2002). “Permanent and Transitory Components of Recessions”, Empirical Economics,
27, pp. 163-183. KOZICKI, S., and P. A. TINSLEY (2001). “Term Structure Views of Monetary Policy Under Alternative Models of agent
Expectations”, Journal of Economic Dynamics & Control, 25, pp. 149-184. KUTTNER, K. (1994). “Estimating Potential Output as a Latent Variable”, Journal of Business and Economic Statistics,
n.º 12 (3), July, pp. 361-368. LARSEN, J. D. J., and J. MCKEOWN (2003). “The informational content of empirical measures of real interest rate and
outputs gaps for the United Kingdom”, in Monetary Policy in a changing environment, BIS Papers n.º 19, pp. 414-442.
LAUBACH, T. and J. C. WILLIAMS. (2003) “Measuring the Natural rate of Interest”, The Review of Economics and
Statistics, 85 (4), November. LEVIN, A., V. WIELAND, and J. C. WILLIAMS (1999). “Robustness of Simple Monetary Policy Rules under Model
Uncertainty” in John B. Taylor (ed.), Monetary Policy Rules, Chicago, University of Chicago Press. pp. 263-299. MANRIQUE, M., and J. M. MARQUES (2002). “Patrones históricos de la evolución del tipo de interés real”, Boletín
económico, julio–agosto, pp. 57-62, Banco de España. MCCONNELL, M., and G. PEREZ-QUIROS (2000). “Output Fluctuations in the United States: What has Changed since
the Early 1980's”, American Economic Review, 90 (5), pp. 1464-1476. NEISS, K. S., and E. NELSON (2003). “The Real Interest Gap as an Inflation Indicator”, Macroeconomics Dynamics, 7,
pp. 239-262. ORPHANIDES, A. (2003). “Monetary Policy evaluation with noisy information”, Journal of Monetary Economics, 50,
pp. 605-631. ORPHANIDES, A., and J. C. WILLIAMS (2002). “Robust Monetary Policy Rules with Unknown Natural Rates”, Brookings
Papers on Economic Activity, 2, pp. 63-145. ROTEMBERG, J., and M. WOODFORD (1997). “An Optimization-Based Econometric Framework for the Evaluation of
Monetary Policy”, NBER Macroeconomics Annual, 12, pp. 297-346. RUDEBUSCH, G. D., and L. E. O. SVENSSON (1999). “Policy Rules for Inflation Targeting” in J.B. Taylor (ed.), Monetary
Policy Rules, University of Chicago Press, pp. 203-253. SILKOS, P. L., and L. F. SKOCZYLAS (2002). “Volatility Clustering in Real Interest Rates: International Evidence”, Journal
of Macroeconomics, Vol. 24, Issue 2, pp. 193-209. STOCK, J. (1994). “Unit Roots, Structural Breaks ans Trends”, in R. Engle and D. McFadden (eds.), Handbook of
Econometrics, Vol . 4, Amsterdam, Elsevier. pp. 2739-2841. STOCK, J., and M. WATSON (1998). “Median Unbiased Estimation of Coefficient Variance in a Time-Varying Parameter
Model” Journal of the American Statistical Association, 93, pp. 349-358. –– (2003). “Has the Business Cycle Changed? Evidence and Explanations”, 27TH Annual Economic Symposium on
Public Policy Issues, FRB Kansas City, Jackson Hole, Wyoming, August 28-30. TAYLOR, J. B. (1993). “Discretion versus Policy Rules in Practice”, Carnegie Rochester Conference on Public Policy, 39,
pp. 195-214. WATSON, M. (1986). “Univariate Detrending Methods with Stochastic Trends” Journal of Monetary Economics, 18,
pp. 49-75. WICKSELL, K. (1898). Interest and Prices, London, Macmillan, 1936. Traducción de la edición de 1898 por R.F. Kahn. WOODFORD, M. (2003). Interest and Prices: Foundations of a Theory of Monetary Policy, Princeton University Press.

BANCO DE ESPAÑA 26 DOCUMENTO DE TRABAJO N.º 0416
ANNEX 1. ROBUSTNESS ANALYSIS
The main disadvantage of estimating the natural rate of interest and growth potential using a
methodology in which specific behaviour equations are not detailed is that the results may
show high volatility depending on the different changes to the assumptions included in the
estimate. In this respect, the foreseeable low volatility of the series to be estimated (the
natural rate and growth potential) compared with the actual series (inflation and output)
means that several optimal points may be found in the estimate. In particular, given the high
number of parameters estimated and the small number of variables observed, likelihood
functions with several critical points can be obtained, in which it is complicated to select
those that are most suitable. In the estimates presented, only those specifications whose
result provided values for the unobserved parameters that were reasonable in economic
terms were considered. In addition, the initial values selected for the parameters for which
information was not available beforehand were established so as to satisfy the cyclical profile
of each economy. In this connection, regard was had to the business cycle recessions dated
by the NBER, in the case of the United States, and by the ECRI (Economic Cycle Research
Institute, which uses the same methodology as the NBER) in the case of Germany.
Nonetheless, in such estimates it is advisable to perform robustness exercises in
order to assess the sensitivity of the estimates to those factors of greater uncertainty, such as
the restrictions imposed on the variance of growth potential and of the natural rate of interest,
or a specification of the model in which real interest rates correspond to ex-ante interest rates
consistent with the model.
Sensitivity to restrictions in the variance of growth potential and the natural rate of
interest
As the estimate includes restrictions on the variance of growth potential and of the natural
rate of interest, which have been obtained on the basis of a prior estimate, it would seem
appropriate to estimate to what extent the uncertainty of this prior estimate may affect the
final results. To do this, the extreme values of a confidence interval for the restriction of the
variance of growth potential, λg, obtained by means of a Montecarlo experiment, are used. In
the case of the United States, the central estimate obtained by LW is also used. These
extreme values are then used to estimate once more the restriction of the variance of the
natural rate, λz, and the model is re-estimated with the new values of λg and λz.
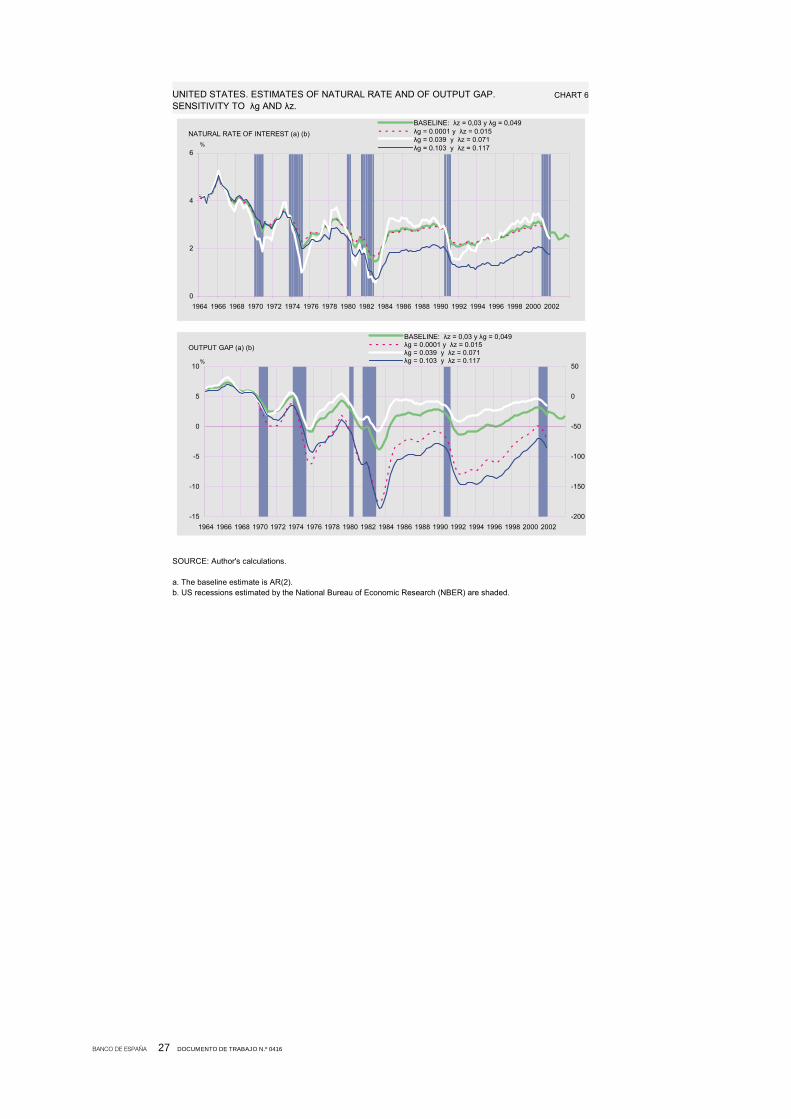
Charts 6 and 7 show the effect of different restrictions on the variance of the United
States and Germany. The charts reveal how the introduction of very low variance has scant
effects on the course of the natural interest rate in the United States and causes significant
smoothing in the case of Germany. However, in the case of the output gap these low values
of λg and λz give rise to a very high change in both countries13. Moreover, it is worth
highlighting that although the course of the natural rate appears relatively unresponsive to
how high the values of λg and λz are, its level, especially in the final segment depicted for the
United States, and does change significantly on the basis of the restrictions imposed.
13. In the extreme case of not introducing the restriction, the results obtained prove rather unreasonable.
BANCO DE ESPAÑA 27 DOCUMENTO DE TRABAJO N.º 0416
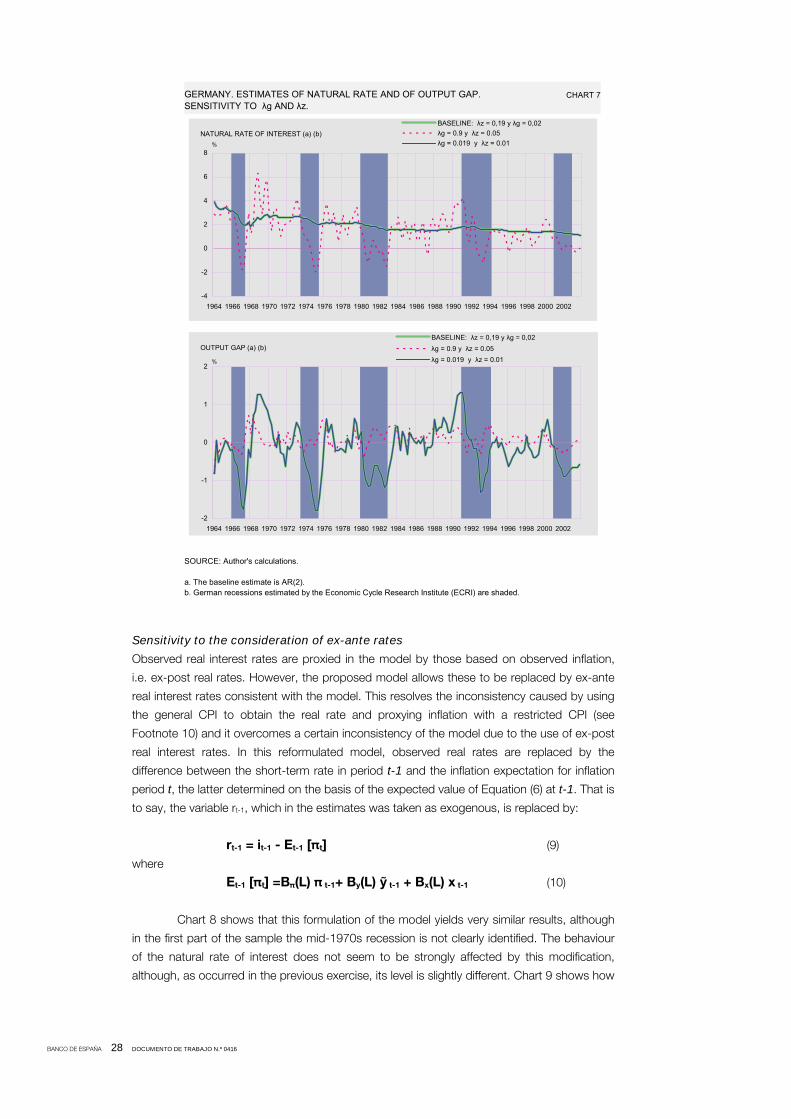
UNITED STATES. ESTIMATES OF NATURAL RATE AND OF OUTPUT GAP.SENSITIVITY TO λg AND λz.
CHART 6
SOURCE: Author's calculations.
a. The baseline estimate is AR(2).b. US recessions estimated by the National Bureau of Economic Research (NBER) are shaded.
0
2
4
6
1964 1966 1968 1970 1972 1974 1976 1978 1980 1982 1984 1986 1988 1990 1992 1994 1996 1998 2000 2002
BASELINE: λz = 0,03 y λg = 0,049λg = 0.0001 y λz = 0.015λg = 0.039 y λz = 0.071λg = 0.103 y λz = 0.117
NATURAL RATE OF INTEREST (a) (b)%
-15
-10
-5
0
5
10
1964 1966 1968 1970 1972 1974 1976 1978 1980 1982 1984 1986 1988 1990 1992 1994 1996 1998 2000 2002-200
-150
-100
-50
0
50
BASELINE: λz = 0,03 y λg = 0,049λg = 0.0001 y λz = 0.015λg = 0.039 y λz = 0.071λg = 0.103 y λz = 0.117
OUTPUT GAP (a) (b)
%
BANCO DE ESPAÑA 28 DOCUMENTO DE TRABAJO N.º 0416
GERMANY. ESTIMATES OF NATURAL RATE AND OF OUTPUT GAP.SENSITIVITY TO λg AND λz.
CHART 7
SOURCE: Author's calculations.
a. The baseline estimate is AR(2).b. German recessions estimated by the Economic Cycle Research Institute (ECRI) are shaded.
-4
-2
0
2
4
6
8
1964 1966 1968 1970 1972 1974 1976 1978 1980 1982 1984 1986 1988 1990 1992 1994 1996 1998 2000 2002
BASELINE: λz = 0,19 y λg = 0,02λg = 0.9 y λz = 0.05λg = 0.019 y λz = 0.01
NATURAL RATE OF INTEREST (a) (b)%
-2
-1
0
1
2
1964 1966 1968 1970 1972 1974 1976 1978 1980 1982 1984 1986 1988 1990 1992 1994 1996 1998 2000 2002
BASELINE: λz = 0,19 y λg = 0,02λg = 0.9 y λz = 0.05λg = 0.019 y λz = 0.01
OUTPUT GAP (a) (b)
%
Sensitivity to the consideration of ex-ante rates
Observed real interest rates are proxied in the model by those based on observed inflation,
i.e. ex-post real rates. However, the proposed model allows these to be replaced by ex-ante
real interest rates consistent with the model. This resolves the inconsistency caused by using
the general CPI to obtain the real rate and proxying inflation with a restricted CPI (see
Footnote 10) and it overcomes a certain inconsistency of the model due to the use of ex-post
real interest rates. In this reformulated model, observed real rates are replaced by the
difference between the short-term rate in period t-1 and the inflation expectation for inflation
period t, the latter determined on the basis of the expected value of Equation (6) at t-1. That is
to say, the variable rt-1, which in the estimates was taken as exogenous, is replaced by:
rt-1 = it-1 - Et-1 [πt] (9)
where
Et-1 [πt] =Bπ(L) π t-1+ By(L) ỹ t-1 + Bx(L) x t-1 (10)
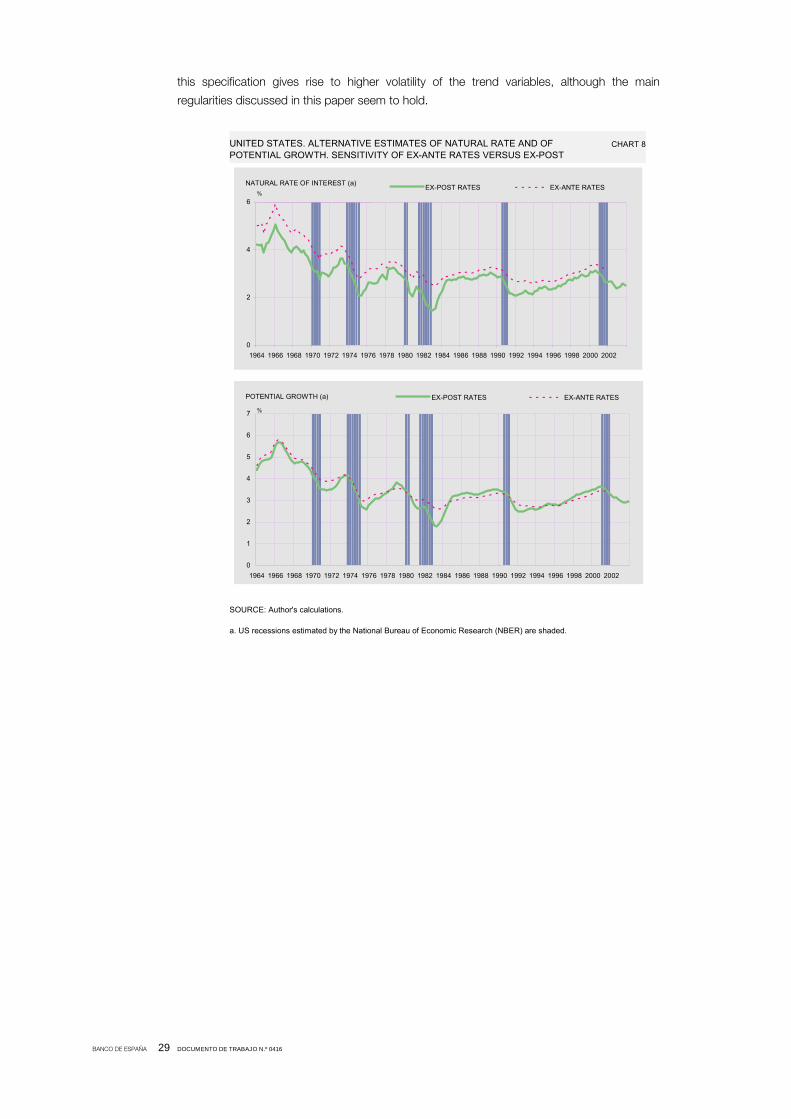
Chart 8 shows that this formulation of the model yields very similar results, although
in the first part of the sample the mid-1970s recession is not clearly identified. The behaviour
of the natural rate of interest does not seem to be strongly affected by this modification,
although, as occurred in the previous exercise, its level is slightly different. Chart 9 shows how
BANCO DE ESPAÑA 29 DOCUMENTO DE TRABAJO N.º 0416
UNITED STATES. ALTERNATIVE ESTIMATES OF NATURAL RATE AND OF POTENTIAL GROWTH. SENSITIVITY OF EX-ANTE RATES VERSUS EX-POST
CHART 8
SOURCE: Author's calculations.
a. US recessions estimated by the National Bureau of Economic Research (NBER) are shaded.
0
2
4
6
1964 1966 1968 1970 1972 1974 1976 1978 1980 1982 1984 1986 1988 1990 1992 1994 1996 1998 2000 2002
EX-POST RATES EX-ANTE RATESNATURAL RATE OF INTEREST (a)%
0
1
2
3
4
5
6
7
1964 1966 1968 1970 1972 1974 1976 1978 1980 1982 1984 1986 1988 1990 1992 1994 1996 1998 2000 2002
EX-POST RATES EX-ANTE RATESPOTENTIAL GROWTH (a)
%
this specification gives rise to higher volatility of the trend variables, although the main
regularities discussed in this paper seem to hold.

BANCO DE ESPAÑA 30 DOCUMENTO DE TRABAJO N.º 0416
ANNEX 2. KALMAN FILTER ESTIMATION
To estimate the model by Kalman filter methodology, it must be rewritten in the form of state
equations and observation equations:
yt = A’ xt + H’ ht + wt (11)
ht+1 = F’ ht + vt+1 (12)
Where ht(rx1) denotes the unobservable variables, xt(nx1) stands for the exogenous
variables and the matrices A(nxn) and H(rxn) include the model parameters.
In the case at hand, after some algebra on the model presented in Section 3.2, the
particular form taken by these matrices is as follows:
1 -a1 -a2 -a3 -a3 0 0 0
H’ =
0 -b4 0 0 0 0 0 0
A1 a2 a3 a3 0 0 0 0 0 0 0 0 0
A’ =
B4 0 0 0 (1-3*b2-3*b3) b2 b2 b2 b3 b3 b3 b3 b5
1 0 0 0 0 1 0 0 0
1 0 0 0 0 0 0 0 0
0 1 0 0 0 0 0 0 0
F = 0 0 0 0 0 0 1 c 0
0 0 0 1 0 0 0 0 0
0 0 0 0 0 1 0 0 0
0 0 0 0 0 0 p1 0 P2
0 0 0 0 0 1 0 0 0
0 0 0 0 0 0 1 0 0

BANCO DE ESPAÑA 31 DOCUMENTO DE TRABAJO N.º 0416
With the matrices of unobservable and observable variables given by:
Y*t Yt-1
Y*t-1 Yt-2
Y*t-2 Rt-1
ht = r*t-1 Rt-2
r*t-2 π t-1
Gt+1 xt = π t-2
Zt π t-3
Gt π t-4
ZT-1 π t-5
π t-6
π t-7
π t-8
Xt-1
The initial parameter values used for the United States were those of LW and those
for Germany were the results of individual estimates of the equations by the least squares
method. Different values of the autoregressive parameters of the unobservable term zt were
tested until reasonable estimates of the output gap and of the natural rate of interest were
obtained. In this respect, it should be noted that, although the estimation procedure allows
numerous critical points, when only the economically reasonable ones that reproduce the
recessions in the two economies are considered, the results are fairly stable. However, the
Annex discusses in greater detail the selection process used and analyses the robustness of
the results reported in the next section.
The estimates of the initial parameter values are highly sensitive. However, if account
is taken only of those combinations that provide a cyclical profile of the economy conforming
with the cycles established by other methodologies and a reasonable natural rate in terms of
level and variation, the sensitivity of the results to various initial parameters is low.

PUBLICACIONES DEL BANCO DE ESPAÑA
WORKING PAPERS1
0216 ALICIA GARCÍA HERRERO, JAVIER SANTILLÁN, SONSOLES GALLEGO, LUCÍA CUADRO AND CARLOS
EGEA: Latin American Financial Development in Perspective.
0217 SONSOLES GALLEGO, ALICIA GARCÍA HERRERO AND JESÚS SAURINA: The Asian and European Banking
Systems: The case of Spain in the Quest for Development and Stability.
0218 JOSÉ RAMÓN MARTÍNEZ RESANO Y LILIANA TOLEDO FALCÓN: Futuros sobre acciones: Demanda e
implicaciones sobre los mercados de renta variable.
0219 JOSÉ MANUEL CAMPA AND JOSÉ M. GONZÁLEZ MÍNGUEZ: Differences in exchange Rate Pass-Through in
the Euro Area.
0220 LUIS JULIÁN ÁLVAREZ GONZÁLEZ Y JAVIER JAREÑO MORAGO: ISIS, Un indicador sintético integral de los
servicios de mercado.
0221 MARCO HOEBERICHTS: The Credibility of Central Bank Announcements.
0222 KLAUS DESMET: Asymmetric Shocks, Risk Sharing, and the Latter Mundell.
0223 JOSÉ MANUEL CAMPA AND IGNACIO HERNANDO: Value creation in European M&As.
0224 JUAN AYUSO HUERTAS, DANIEL PÉREZ CID AND JESÚS SAURINA SALAS: Are capital buffers pro-cyclical?
Evidence from Spanish panel data.
0225 ANDREW BENITO: Does job insecurity affect household consumption?
0226 ANDREW BENITO: Financial pressure, monetary policy effects and inventory adjustment by UK and Spanish
firms.
0227 ANDREW BENITO AND IGNACIO HERNANDO: Extricate: Financial Pressure and Firm Behaviour in Spain.
0228 ANA DEL RÍO, El endeudamiento de los hogares españoles.
0229 GABRIEL PÉREZ QUIRÓS AND JORGE SICILIA: Is the European Central Bank (and the United States Federal
Reserve) predictable?
0301 JAVIER ANDRÉS, EVA ORTEGA AND JAVIER VALLÉS: Market structure and inflation differentials in the
European Monetary Union.
0302 JORDI GALÍ, MARK GERTLER AND J. DAVID LÓPEZ-SALIDO: The euro area inefficiency gap.
0303 ANDREW BENITO, The incidence and persistence of dividend omissions by Spanish firms.
0304 JUAN AYUSO AND FERNANDO RESTOY: House prices and rents: an equilibrium asset pricing approach.
0305 EVA ORTEGA, Persistent inflation differentials in Europe.
0306 PEDRO PABLO ÁLVAREZ LOIS: Capacity utilization and monetary policy.
0307 JORGE MARTÍNEZ PAGÉS AND LUIS ÁNGEL MAZA: Analysis of house prices in Spain. (The Spanish original of
this publication has the same number).
0308 CLAUDIO MICHELACCI AND DAVID LÓPEZ-SALIDO: Technology shocks and job flows.
0309 ENRIQUE ALBEROLA: Misalignment, liabilities dollarization and exchange rate adjustment in Latin America.
0310 ANDREW BENITO: The capital structure decisions of firms: is there a pecking order?
0311 FRANCISCO DE CASTRO: The macroeconomic effects of fiscal policy in Spain.
0312 ANDREW BENITO AND IGNACIO HERNANDO: Labour demand, flexible contracts and financial factors: new
evidence from Spain.
0313 GABRIEL PÉREZ QUIRÓS AND HUGO RODRÍGUEZ MENDIZÁBAL: The daily market for funds in Europe: what
has changed with the EMU?
0314 JAVIER ANDRÉS AND RAFAEL DOMÉNECH: Automatic stabilizers, fiscal rules and macroeconomic stability
0315 ALICIA GARCÍA HERRERO AND PEDRO DEL RÍO: Financial stability and the design of monetary policy.
0316 JUAN CARLOS BERGANZA, ROBERTO CHANG AND ALICIA GARCÍA HERRERO: Balance sheet effects and
the country risk premium: an empirical investigation.
0317 ANTONIO DÍEZ DE LOS RÍOS AND ALICIA GARCÍA HERRERO: Contagion and portfolio shift in emerging
countries’ sovereign bonds.
0318 RAFAEL GÓMEZ AND PABLO HERNÁNDEZ DE COS: Demographic maturity and economic performance: the
effect of demographic transitions on per capita GDP growth.
0319 IGNACIO HERNANDO AND CARMEN MARTÍNEZ-CARRASCAL: The impact of financial variables on firms’ real
decisions: evidence from Spanish firm-level data.
1. Previously published Working Papers are listed in the Banco de España publications calalogue.

0320 JORDI GALÍ, J. DAVID LÓPEZ-SALIDO AND JAVIER VALLÉS: Rule-of-thumb consumers and the design of
interest rate rules.
0321 JORDI GALÍ, J. DAVID LÓPEZ-SALIDO AND JAVIER VALLÉS: Understanding the effects of government
spending on consumption.
0322 ANA BUISÁN Y JUAN CARLOS CABALLERO: Análisis comparado de la demanda de exportación de
manufacturas en los países de la UEM.
0401 ROBERTO BLANCO, SIMON BRENNAN AND IAN W. MARSH: An empirical analysis of the dynamic relationship
between investment grade bonds and credit default swaps.
0402 ENRIQUE ALBEROLA AND LUIS MOLINA: What does really discipline fiscal policy in emerging markets? The role
and dynamics of exchange rate regimes.
0403 PABLO BURRIEL-LLOMBART: An economic analysis of education externalities in the matching process of UK
regions (1992-1999).
0404 FABIO CANOVA, MATTEO CICCARELLI AND EVA ORTEGA: Similarities and convergence in G-7 cycles.
0405 ENRIQUE ALBEROLA, HUMBERTO LÓPEZ AND LUIS SERVÉN: Tango with the gringo: the hard peg and real
misalignment in Argentina.
0406 ANA BUISÁN, JUAN CARLOS CABALLERO Y NOE LIA JIMÉNEZ: Determinación de las exportaciones de
manufacturas en los países de la UEM a partir de un modelo de oferta-demanda.
0407 VÍTOR GASPAR, GABRIEL PÉREZ QUIRÓS AND HUGO RODRÍGUEZ MENDIZÁBAL: Interest rate determination
in the interbank market.
0408 MÁXIMO CAMACHO, GABRIEL PÉREZ-QUIRÓS AND LORENA SAIZ: Are European business cycles close
enough to be just one?
0409 JAVIER ANDRÉS, J. DAVID LÓPEZ-SALIDO AND EDWARD NELSON: Tobin’s imperfect assets substitution in
optimizing general equilibrium.
0410 A. BUISÁN, J. C. CABALLERO, J. M. CAMPA Y N. JIMÉNEZ: La importancia de la histéresis en las
exportaciones de manufacturas de los países de la UEM.
0411 ANDREW BENITO, FRANCISCO JAVIER DELGADO AND JORGE MARTÍNEZ PAGÉS: A synthetic indicator of
financial pressure for Spanish firms.
0412 JAVIER DELGADO, IGNACIO HERNANDO AND MARÍA J. NIETO: Do European primarily Internet banks show
scale and experience efficiencies?
0413 ÁNGEL ESTRADA, JOSÉ LUIS FERNÁNDEZ, ESTHER MORAL AND ANA V. REGIL: A quarterly
macroeconometric model of the Spanish economy.
0414 GABRIEL JIMÉNEZ AND JESÚS SAURINA: Collateral, type of lender and relationship banking as determinants of
credit risk.
0415 MIGUEL CASARES: On monetary policy rules for the euro area.
0416 MARTA MANRIQUE AND JOSÉ MANUEL MARQUÉS: An empirical approximation of the natural rate of interest
and potential growth. (The Spanish original of this publication has the same number).
Unidad de Publicaciones Alcalá, 522; 28027 Madrid
Telephone +34 91 338 6363. Fax +34 91 338 6488 e-mail: [email protected]
www.bde.es


