DOD AREA COST FACTORS (ACF) PAX Newsletter No 3.2.1, dated 25 Mar 2015 TABLE – 4-1, UFC 3-701-01, Change 7, March 2015 1. The attached Area Cost Factors (ACF) supersedes the ACF values published by the PAX Newsletter No 3.2.1, dated 20 Mar 2014, and Table 4-1, Area Cost Factors of the 2014 DoD Facilities Pricing Guide, UFC 3-701-01, Change-4, dated Mar 2013. The updated ACF shall be used, along with Primary Facilities Unit Costs from the latest issue of the Army PAX Newsletter No 3.2.2, in preparation and review of FY 2017-18 Military Construction, Army (MCA) and Army Family Housing (AFH) projects’ DD Forms 1391 and ENG Form 3086 (budget cost estimates). These factors are NOT intended for use to develop and/or modify individual facilities Sustainment Costs, detailed Quantity-Take-offs, Unit Price Book (UPB) line items, Commercial cost data, or User Generated unit costs. These other cost estimating systems and databases have their own methodology and factors for adjusting costs to different locations. This Newsletter is published and maintained on the web at: http://www.usace.army.mil/CostEngineering/ProgrammingAdministrationandExecutionSystemNe.aspx 2. The ACF calculation methodology/algorithms were re-evaluated and revised in 2013 by the Tri- Service Cost Engineering Steering Committee to better reflect current market conditions. The revisions to the algorithms which generate the ACF index have caused some fluctuations in area cost factor values, however the relative relationship of construction costs for a location to the National Cost average of ACF=1 has remained unchanged. 3. There is no easy correlation between the current ACF and the previous ACF for a specific location. No common benchmark exists because both the Base City average and the relationships between cities may change from year to year. It is possible, however, to compare differences between several locations in this database with differences between the same locations in previous databases. 4. The ACF values are based on a 2014 CONUS construction market survey of 96 Base Cities (two cities per State in Bold font) average construction costs. In addition, 90 CONUS and 110 OCONUS locations were surveyed, too. In general, the ACF index is developed based on the local construction costs for a market basket of 8 Labor Crafts, 18 Construction Materials (updated list), 4 Equipment items, and seven (7) other Matrix Factors that reflect local conditions affecting construction costs, such as weather, climatic (frost zone, wind load), seismic, contractor overhead and profit, life support and mobilization, labor availability and labor productivity. The selected labor, materials, and equipment (LME) items are representative of the types of products and services used to construct most military facilities. ACF for some locations has been updated from the previous list utilizing the latest data input from the Services’ and field offices (Districts). 5. The overall ACF value of the State should be used when the project location has no specific ACF listed in the attached Table. The ACF for the closest location should be used only when market conditions (e.g. material prices, labor rates, labor availability, bidding climate) are similar. 6. Point of contacts for this Newsletter at Headquarters, US Army Corps of Engineers are: Mr. Ami Ghosh, e-mail [email protected], and Mr. Raymond Lynn, e-mail [email protected]1
Transcript
DOD AREA COST FACTORS (ACF) PAX Newsletter No 3.2.1, dated 25 Mar 2015
TABLE – 4-1, UFC 3-701-01, Change 7, March 2015 1. The attached Area Cost Factors (ACF) supersedes the ACF values published by the PAX Newsletter No 3.2.1, dated 20 Mar 2014, and Table 4-1, Area Cost Factors of the 2014 DoD Facilities Pricing Guide, UFC 3-701-01, Change-4, dated Mar 2013. The updated ACF shall be used, along with Primary Facilities Unit Costs from the latest issue of the Army PAX Newsletter No 3.2.2, in preparation and review of FY 2017-18 Military Construction, Army (MCA) and Army Family Housing (AFH) projects’ DD Forms 1391 and ENG Form 3086 (budget cost estimates). These factors are NOT intended for use to develop and/or modify individual facilities Sustainment Costs, detailed Quantity-Take-offs, Unit Price Book (UPB) line items, Commercial cost data, or User Generated unit costs. These other cost estimating systems and databases have their own methodology and factors for adjusting costs to different locations. This Newsletter is published and maintained on the web at: http://www.usace.army.mil/CostEngineering/ProgrammingAdministrationandExecutionSystemNe.aspx 2. The ACF calculation methodology/algorithms were re-evaluated and revised in 2013 by the Tri-Service Cost Engineering Steering Committee to better reflect current market conditions. The revisions to the algorithms which generate the ACF index have caused some fluctuations in area cost factor values, however the relative relationship of construction costs for a location to the National Cost average of ACF=1 has remained unchanged. 3. There is no easy correlation between the current ACF and the previous ACF for a specific location. No common benchmark exists because both the Base City average and the relationships between cities may change from year to year. It is possible, however, to compare differences between several locations in this database with differences between the same locations in previous databases. 4. The ACF values are based on a 2014 CONUS construction market survey of 96 Base Cities (two cities per State in Bold font) average construction costs. In addition, 90 CONUS and 110 OCONUS locations were surveyed, too. In general, the ACF index is developed based on the local construction costs for a market basket of 8 Labor Crafts, 18 Construction Materials (updated list), 4 Equipment items, and seven (7) other Matrix Factors that reflect local conditions affecting construction costs, such as weather, climatic (frost zone, wind load), seismic, contractor overhead and profit, life support and mobilization, labor availability and labor productivity. The selected labor, materials, and equipment (LME) items are representative of the types of products and services used to construct most military facilities. ACF for some locations has been updated from the previous list utilizing the latest data input from the Services’ and field offices (Districts). 5. The overall ACF value of the State should be used when the project location has no specific ACF listed in the attached Table. The ACF for the closest location should be used only when market conditions (e.g. material prices, labor rates, labor availability, bidding climate) are similar. 6. Point of contacts for this Newsletter at Headquarters, US Army Corps of Engineers are: Mr. Ami Ghosh, e-mail [email protected], and Mr. Raymond Lynn, e-mail [email protected]
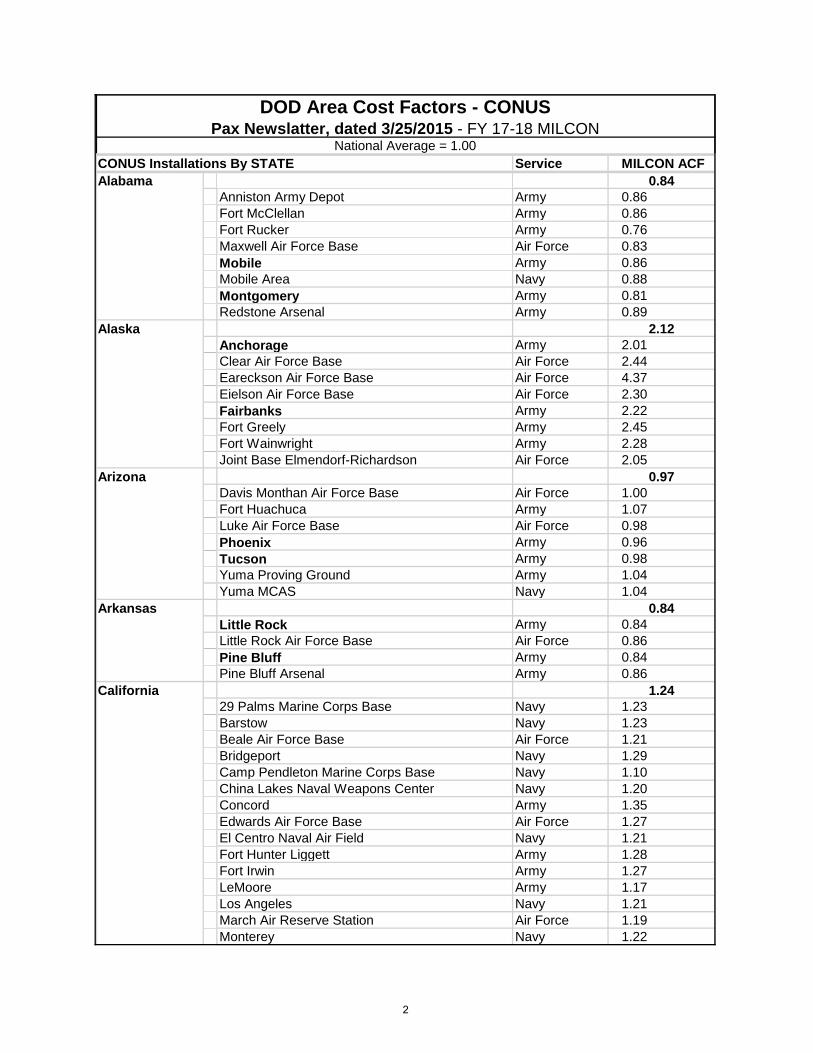
CONUS Installations By STATE Service MILCON ACF0.84
Anniston Army Depot Army 0.86Fort McClellan Army 0.86Fort Rucker Army 0.76Maxwell Air Force Base Air Force 0.83Mobile Army 0.86Mobile Area Navy 0.88Montgomery Army 0.81Redstone Arsenal Army 0.89
2.12Anchorage Army 2.01Clear Air Force Base Air Force 2.44Eareckson Air Force Base Air Force 4.37Eielson Air Force Base Air Force 2.30Fairbanks Army 2.22Fort Greely Army 2.45Fort Wainwright Army 2.28Joint Base Elmendorf-Richardson Air Force 2.05
0.97Davis Monthan Air Force Base Air Force 1.00Fort Huachuca Army 1.07Luke Air Force Base Air Force 0.98Phoenix Army 0.96Tucson Army 0.98Yuma Proving Ground Army 1.04Yuma MCAS Navy 1.04
0.84Little Rock Army 0.84Little Rock Air Force Base Air Force 0.86Pine Bluff Army 0.84Pine Bluff Arsenal Army 0.86
1.2429 Palms Marine Corps Base Navy 1.23Barstow Navy 1.23Beale Air Force Base Air Force 1.21Bridgeport Navy 1.29Camp Pendleton Marine Corps Base Navy 1.10China Lakes Naval Weapons Center Navy 1.20Concord Army 1.35Edwards Air Force Base Air Force 1.27El Centro Naval Air Field Navy 1.21Fort Hunter Liggett Army 1.28Fort Irwin Army 1.27LeMoore Army 1.17Los Angeles Navy 1.21March Air Reserve Station Air Force 1.19Monterey Navy 1.22
DOD Area Cost Factors - CONUSPax Newslatter, dated 3/25/2015 - FY 17-18 MILCON
National Average = 1.00
Alabama
Alaska
Arizona
Arkansas
California
2
CONUS Installations By STATE Service MILCON ACF
DOD Area Cost Factors - CONUSPax Newslatter, dated 3/25/2015 - FY 17-18 MILCON
National Average = 1.00
Oakland Navy 1.33Port Hueneme Area Navy 1.15Sacramento Area Army 1.22San Clemente Island Navy 1.62San Diego Army 1.15San Nicolas Island Navy 1.69Seal Beach Navy 1.21Sierra Army Depot Army 1.31Stockton Area Army 1.21Travis Air Force Base Air Force 1.27Vandenberg Air Force Base Air Force 1.22
1.03Air Force Academy Air Force 1.06Buckley Air Force Base Air Force 1.03Cheyenne Mountain Air Force 1.15Colorado Springs Army 1.04Denver Army 1.01Fort Carson Army 1.06Peterson Air Force Base Air Force 1.06Pueblo Army Depot Army 1.02Schriever Air Force Base Air Force 1.06
1.15Bridgeport Army 1.14New London Army 1.16New London Area Navy 1.18Stratford Engine Plant Army 1.16
1.06Dover Army 1.05Dover Air Force Base Air Force 1.07Wilmington Army 1.06
0.86Eglin Air Force Base Air Force 0.86Homestead Air Reserve Station Air Force 0.97Hurlburt Field Army 0.86Jacksonville Navy 0.86Key West Naval Air Station Navy 1.03MacDill Air Force Base Air Force 0.92Mayport Army 0.86Miami Army 0.95Panama City Army 0.85Panama City Area Navy 0.87Patrick Air Force Base Air Force 0.93Pensacola Navy 0.86Tyndall Air Force Base Air Force 0.87Whiting Field Army 0.86
0.82Albany Navy 0.82
Connecticut
Delaware
Georgia
Florida
Colorado
3
CONUS Installations By STATE Service MILCON ACF
DOD Area Cost Factors - CONUSPax Newslatter, dated 3/25/2015 - FY 17-18 MILCON
National Average = 1.00
Athens Army 0.85Atlanta Army 0.90Fort Benning Army 0.89Fort Gordon Army 0.90Fort Stewart Army 0.84Kings Bay Navy 0.90Marine Corps Logistics Base Navy 0.83Moody Air Force Base Air Force 0.82Robins AFB Air Force 0.82Savannah Army 0.82
2.32Barbers Point Navy 2.28Barking Sands Navy 2.68Fort Derussy Army 2.20Fort Shafter Army 2.20Honolulu Army 2.21Joint Base Pearl Harbor-Hickam Navy 2.20Kaneohe Bay Navy 2.43Pohakuloa Navy 2.60Schofield Barracks Army 2.20Tripler Army Medical Center Army 2.20Wheeler Army Air Field Army 2.20
1.03Boise Army 0.99Mountain Home Army 1.06Mountain Home AFB Air Force 1.11
1.04Belleville Army 1.07Great Lakes (NTC) Navy 1.27Rock Island Army 1.01Rock Island Arsenal Army 1.03Scott Air Force Base Air Force 1.09
0.99Crane NWSC Navy 1.08Grissom Air Reserve Base Air Force 0.98Indianapolis Army 1.01Logansport Army 0.96
1.00Burlington Army 1.00Des Moines Army 1.00Iowa Army Ammo Plant Army 1.07
0.92Fort Leavenworth Army 1.05Fort Riley Army 1.05Manhattan Army 0.94McConnell AFB Air Force 0.92Wichita Army 0.90
Illinois
Indiana
Iowa
Kansas
Hawaii
Idaho
4
CONUS Installations By STATE Service MILCON ACF
DOD Area Cost Factors - CONUSPax Newslatter, dated 3/25/2015 - FY 17-18 MILCON
National Average = 1.00
0.90Fort Campbell Army 0.98Fort Knox Army 1.05Lexington Army 0.88Lexington/Blue Grass AD Army 0.97Louisville Army 0.91
0.87Barksdale Air Force Base Air Force 0.84Fort Polk Army 0.81Louisiana Army Ammo Plant Army 0.84NAS, JRB, New Orleans Navy 0.93New Orleans Army 0.91New Orleans Army Base Army 0.93Shreveport Army 0.82
1.03Bangor Army 1.02Kittery/Portsmouth Navy 1.08Portland Army 1.03
0.97Aberdeen Proving Ground Army 0.97Annapolis Navy 0.97Baltimore Army 0.95Bethesda Area Navy 1.00Chesapeake Beach Navy 0.98Fort Detrick Army 1.00Fort George G Meade Army 0.97Indian Head Navy 0.99Joint Base Andrews AFB & Naval Air Facility Air Force 1.00Lexington Park Navy 0.98Patuxent River Area Navy 1.03Thurmont Army 1.06
1.17Boston Army 1.24Fort Devens Army 1.17Hanscom Air Force Base Air Force 1.26Natick Soldiers System Center Army 1.22Springfield Army 1.10
1.06Detroit Army 1.10Detroit Arsenal Army 1.11Marquette Army 1.01
1.15Duluth Army 1.14Minneapolis Army 1.15
0.83Biloxi Army 0.86Columbus Army 0.80
Maine
Maryland
Massachusetts
Michigan
Minnesota
Mississippi
Kentucky
Louisiana
5
CONUS Installations By STATE Service MILCON ACF
DOD Area Cost Factors - CONUSPax Newslatter, dated 3/25/2015 - FY 17-18 MILCON
National Average = 1.00
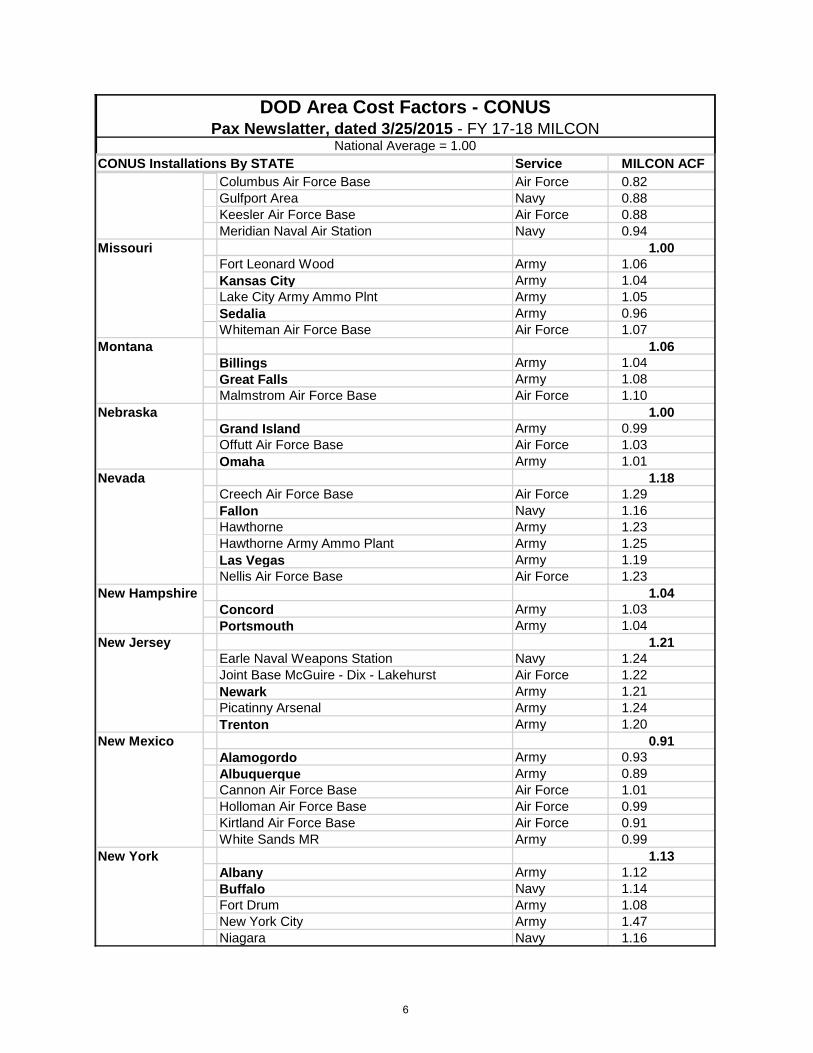
Columbus Air Force Base Air Force 0.82Gulfport Area Navy 0.88Keesler Air Force Base Air Force 0.88Meridian Naval Air Station Navy 0.94
1.00Fort Leonard Wood Army 1.06Kansas City Army 1.04Lake City Army Ammo Plnt Army 1.05Sedalia Army 0.96Whiteman Air Force Base Air Force 1.07
1.06Billings Army 1.04Great Falls Army 1.08Malmstrom Air Force Base Air Force 1.10
1.00Grand Island Army 0.99Offutt Air Force Base Air Force 1.03Omaha Army 1.01
1.18Creech Air Force Base Air Force 1.29Fallon Navy 1.16Hawthorne Army 1.23Hawthorne Army Ammo Plant Army 1.25Las Vegas Army 1.19Nellis Air Force Base Air Force 1.23
1.04Concord Army 1.03Portsmouth Army 1.04
1.21Earle Naval Weapons Station Navy 1.24Joint Base McGuire - Dix - Lakehurst Air Force 1.22Newark Army 1.21Picatinny Arsenal Army 1.24Trenton Army 1.20
0.91Alamogordo Army 0.93Albuquerque Army 0.89Cannon Air Force Base Air Force 1.01Holloman Air Force Base Air Force 0.99Kirtland Air Force Base Air Force 0.91White Sands MR Army 0.99
1.13Albany Army 1.12Buffalo Navy 1.14Fort Drum Army 1.08New York City Army 1.47Niagara Navy 1.16
Missouri
Montana
Nebraska
Nevada
New Hampshire
New Jersey
New Mexico
New York
6
CONUS Installations By STATE Service MILCON ACF
DOD Area Cost Factors - CONUSPax Newslatter, dated 3/25/2015 - FY 17-18 MILCON
National Average = 1.00
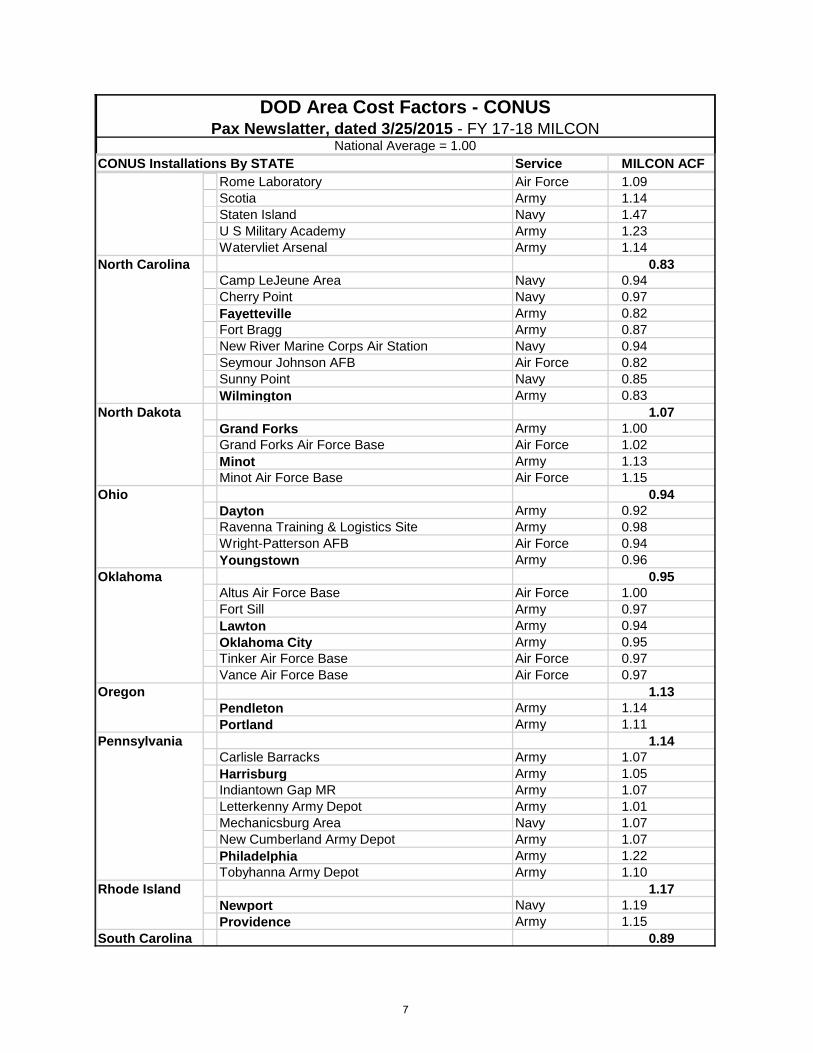
Rome Laboratory Air Force 1.09Scotia Army 1.14Staten Island Navy 1.47U S Military Academy Army 1.23Watervliet Arsenal Army 1.14
0.83Camp LeJeune Area Navy 0.94Cherry Point Navy 0.97Fayetteville Army 0.82Fort Bragg Army 0.87New River Marine Corps Air Station Navy 0.94Seymour Johnson AFB Air Force 0.82Sunny Point Navy 0.85Wilmington Army 0.83
1.07Grand Forks Army 1.00Grand Forks Air Force Base Air Force 1.02Minot Army 1.13Minot Air Force Base Air Force 1.15
0.94Dayton Army 0.92Ravenna Training & Logistics Site Army 0.98Wright-Patterson AFB Air Force 0.94Youngstown Army 0.96
0.95Altus Air Force Base Air Force 1.00Fort Sill Army 0.97Lawton Army 0.94Oklahoma City Army 0.95Tinker Air Force Base Air Force 0.97Vance Air Force Base Air Force 0.97
1.13Pendleton Army 1.14Portland Army 1.11
1.14Carlisle Barracks Army 1.07Harrisburg Army 1.05Indiantown Gap MR Army 1.07Letterkenny Army Depot Army 1.01Mechanicsburg Area Navy 1.07New Cumberland Army Depot Army 1.07Philadelphia Army 1.22Tobyhanna Army Depot Army 1.10
1.17Newport Navy 1.19Providence Army 1.15
0.89
Ohio
Oklahoma
Oregon
Pennsylvania
North Carolina
North Dakota
Rhode Island
South Carolina
7
CONUS Installations By STATE Service MILCON ACF
DOD Area Cost Factors - CONUSPax Newslatter, dated 3/25/2015 - FY 17-18 MILCON
National Average = 1.00
Beaufort Navy 0.92Charleston Army 0.94Columbia Army 0.83Fort Jackson Army 0.83Joint Base Charleston AFB & Naval Weapons Stn
Air Force 0.96
Shaw Air Force Base Air Force 0.890.93
Ellsworth Air Force Base Air Force 0.94Rapid City Army 0.92Sioux Falls Army 0.94
0.85Arnold Air Force Base Air Force 0.86Chattanooga Army 0.82Memphis Army 0.88Millington Naval Support Activity Navy 0.90Volunteer Ordinance Works Army 0.84
0.84Camp Bullis Army 0.84Corpus Christi Area Navy 0.87Dyess Air Force Base Air Force 0.89El Paso Army 0.86Fort Bliss Army 0.92Fort Hood Army 0.86Fort Worth Navy 0.82Goodfellow Air Force Base Air Force 0.86Joint Base, San Antonio (Lackland AFB, Randolph AFB & Ft Sam Houston)
Air Force 0.84
Kingsville Navy 0.87Laughlin Air Force Base Air Force 0.89Longhorn Army Ammo Plant Army 0.72Red River Army Depot Army 0.77San Angelo Army 0.84San Antonio Army 0.82Sheppard Air Force Base Air Force 0.90
1.04Dugway Proving Ground Army 1.13Hill Air Force Base Air Force 1.06Ogden Army 1.04Salt Lake City Army 1.04Tooele Army Depot Army 1.13
1.02Burlington Army 1.03Montpelier Army 1.00
0.90Camp Peary Army 0.95Chesapeake Navy 0.95
South Dakota
Tennessee
Texas
Utah
Vermont
Virginia
8
CONUS Installations By STATE Service MILCON ACF
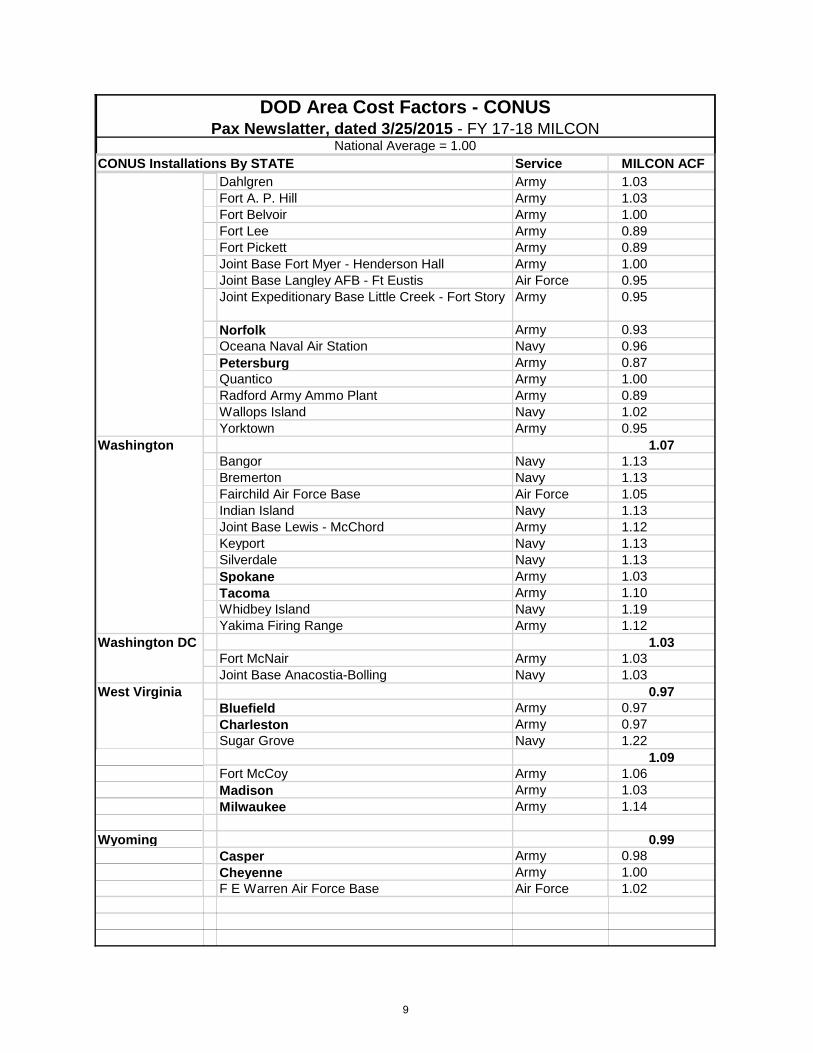
DOD Area Cost Factors - CONUSPax Newslatter, dated 3/25/2015 - FY 17-18 MILCON
National Average = 1.00
Dahlgren Army 1.03Fort A. P. Hill Army 1.03Fort Belvoir Army 1.00Fort Lee Army 0.89Fort Pickett Army 0.89Joint Base Fort Myer - Henderson Hall Army 1.00Joint Base Langley AFB - Ft Eustis Air Force 0.95Joint Expeditionary Base Little Creek - Fort Story Army 0.95
Norfolk Army 0.93Oceana Naval Air Station Navy 0.96Petersburg Army 0.87Quantico Army 1.00Radford Army Ammo Plant Army 0.89Wallops Island Navy 1.02Yorktown Army 0.95
1.07Bangor Navy 1.13Bremerton Navy 1.13Fairchild Air Force Base Air Force 1.05Indian Island Navy 1.13Joint Base Lewis - McChord Army 1.12Keyport Navy 1.13Silverdale Navy 1.13Spokane Army 1.03Tacoma Army 1.10Whidbey Island Navy 1.19Yakima Firing Range Army 1.12
1.03Fort McNair Army 1.03Joint Base Anacostia-Bolling Navy 1.03
0.97Bluefield Army 0.97Charleston Army 0.97Sugar Grove Navy 1.22
1.09Fort McCoy Army 1.06Madison Army 1.03Milwaukee Army 1.14
Wyoming 0.99Casper Army 0.98Cheyenne Army 1.00F E Warren Air Force Base Air Force 1.02
Washington
Washington DC
West Virginia
9
Country Location & Local Currency per US Dollar Service MILCON ACF
Afghani - 56.95 1.66Kabul Army 1.66
Albanian Leke - 108.434 1.07Tirana Army 1.07
Algerian Dinar - 81.9851 1.27Algiers Army 1.27
US Dollar - 1.00000 2.03Pago Pago Navy 2.03
Argentine Peso - 8.437 1.02Buenos Aires Army 1.02
Australian Dollar - 1.1448 1.49Darwin Navy 1.49
Azerbaijan New Manat - 0.7839 1.27Baku Army 1.27
Euro - 0..74570 1.70Lajes Air Force 1.70
Bahamian Dollar - 0.9941 1.43San Andros Navy 1.43
Bahraini Dinar - 0.3748 1.42Askar Navy 1.42
Euro - 0.74570 1.52Brussels Army 1.53Mons/Chieveres Army 1.50
Belizean Dollar - 1.95640 1.15Belize City Army 1.15
Bolivian Boliviano - 6.76470 1.23Santa Cruz de la Sierra Army 1.23
Bosnian Mark - 1.54580 1.12Sarajevo Army 1.12
Brazilian Real - 2.44540 1.11Rio de Janeiro Army 1.11
US Average = 1.00
Argentina
Australia
Azores
Bahamas
Bahrain
Belgium
Bolivia
Azerbaijan
Belize
Brazil
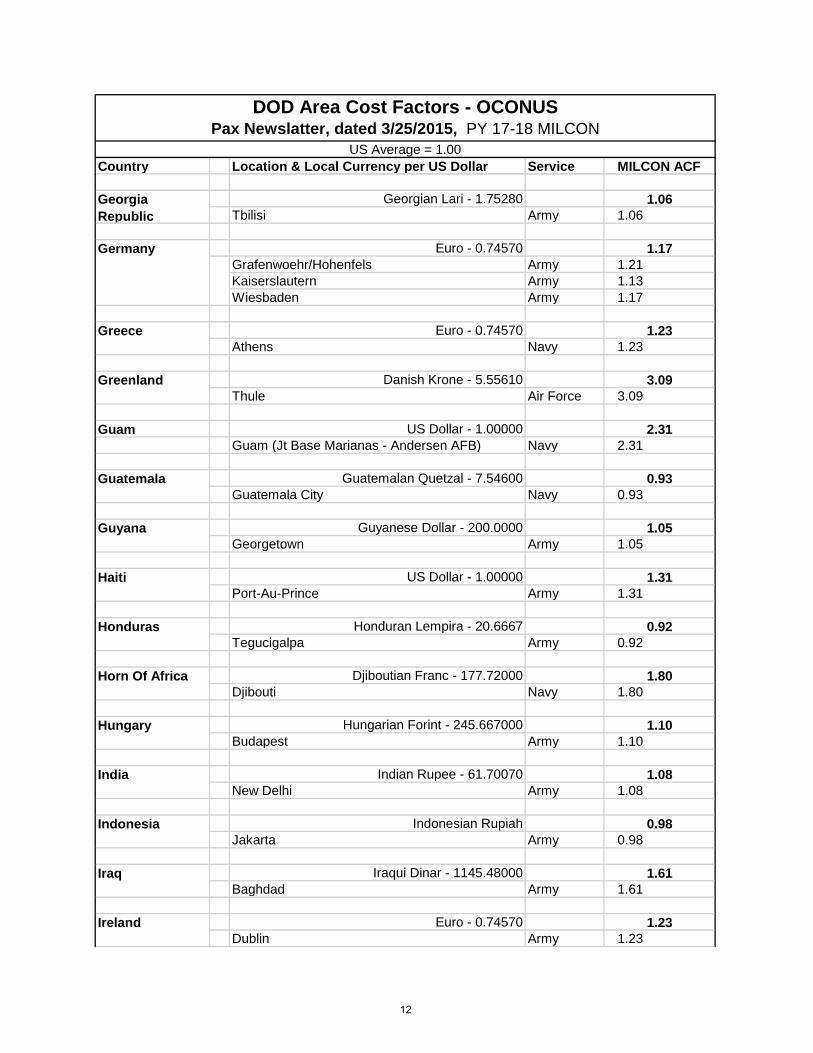
DOD Area Cost Factors - OCONUSPax Newslatter, dated 3/25/2015, PY 17-18 MILCON
Afghanistan
American Samoa
Bosnia
Albania
Algeria
10
Country Location & Local Currency per US Dollar Service MILCON ACFUS Average = 1.00
DOD Area Cost Factors - OCONUSPax Newslatter, dated 3/25/2015, PY 17-18 MILCON
Bulgarian Lev - 1.54570 0.94Sofia Army 0.94
Cambodian Riel - 4018.50000 1.18Phnom Penh Navy 1.18
Chilean Peso - 599.77800 1.08Santiago Army 1.08
Chinese Yuan Renminbi - 6.15170 1.21Hong Kong Army 1.21
Columbian Peso - 1994.14000 1.16Bogota Army 1.16
Costarican Colon - 528.32600 1.04San Jose Army 1.04
Euro - 0.74570 1.30Souda Bay Navy 1.30
Croatian Kuna - 6.03670 1.03Zagreb Army 1.03
US Dollar - 1.00000 1.71Guantanamo Bay Navy 1.71
Czech Koruna - 21.73760 1.04Prague Army 1.04
US Dollar - 1.00000 2.67Diego Garcia Navy 2.67
US Dollar - 1.00000 1.03Quito Navy 1.03
Egyptian Pound - 7.13030 1.24Cairo Navy 1.24
US Dollar - 1.00000 0.96El Salvador Army 0.96
Euro - 0.74570 1.33Tallinn Army 1.33
Euro - 0.74570 1.26Marseille Army 1.26
France
Crete
Croatia
Cuba
Czech Republic
Diego Garcia
Columbia
Bulgaria
Ecuador
Chile
China
Cambodia
Estonia
Egypt
El Salvador
Costa Rica
11
Country Location & Local Currency per US Dollar Service MILCON ACFUS Average = 1.00
DOD Area Cost Factors - OCONUSPax Newslatter, dated 3/25/2015, PY 17-18 MILCON
Georgian Lari - 1.75280 1.06Tbilisi Army 1.06
Euro - 0.74570 1.17Grafenwoehr/Hohenfels Army 1.21Kaiserslautern Army 1.13Wiesbaden Army 1.17
Euro - 0.74570 1.23Athens Navy 1.23
Danish Krone - 5.55610 3.09Thule Air Force 3.09
Guam US Dollar - 1.00000 2.31Guam (Jt Base Marianas - Andersen AFB) Navy 2.31
Guatemalan Quetzal - 7.54600 0.93Guatemala City Navy 0.93
Guyanese Dollar - 200.0000 1.05Georgetown Army 1.05
US Dollar - 1.00000 1.31Port-Au-Prince Army 1.31
Honduran Lempira - 20.6667 0.92Tegucigalpa Army 0.92
Djiboutian Franc - 177.72000 1.80Djibouti Navy 1.80
Hungarian Forint - 245.667000 1.10Budapest Army 1.10
Indian Rupee - 61.70070 1.08New Delhi Army 1.08
Indonesian Rupiah 0.98Jakarta Army 0.98
Iraqui Dinar - 1145.48000 1.61Baghdad Army 1.61
Euro - 0.74570 1.23Dublin Army 1.23
Ireland
Guyana
Honduras
India
Indonesia
Horn Of Africa
Hungary
Georgia Republic
Germany
Iraq
Greece
Greenland
Guatemala
Haiti
12
Country Location & Local Currency per US Dollar Service MILCON ACFUS Average = 1.00
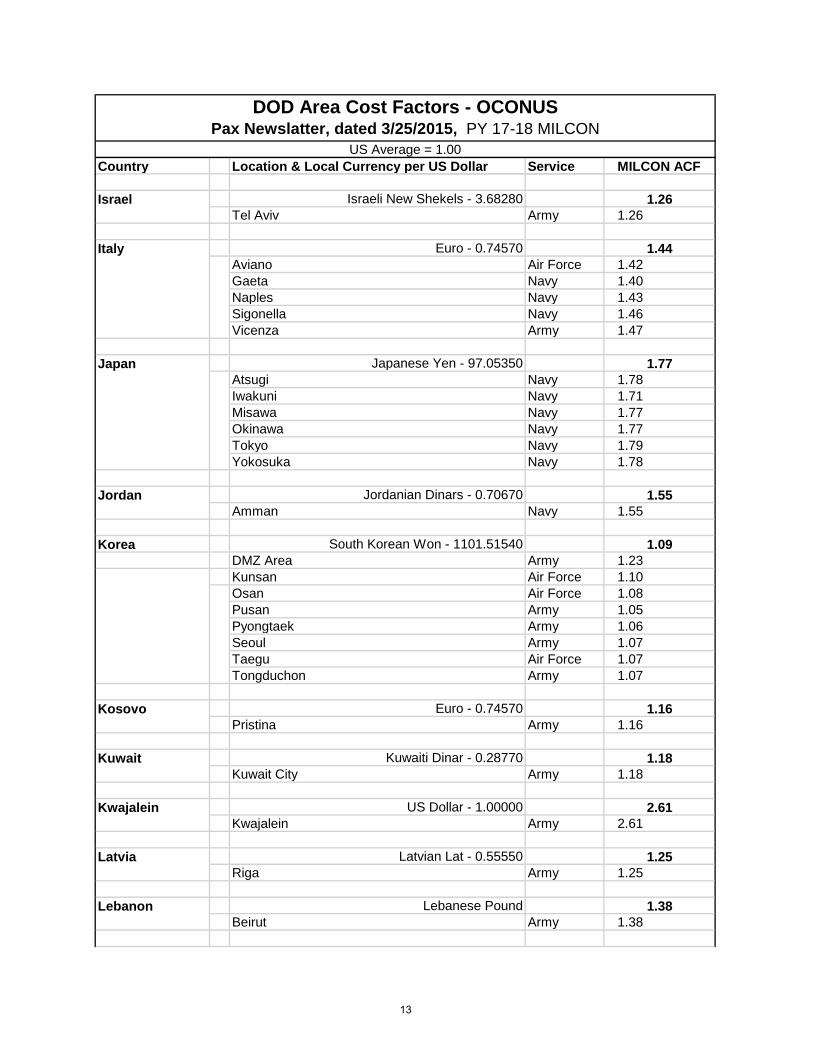
DOD Area Cost Factors - OCONUSPax Newslatter, dated 3/25/2015, PY 17-18 MILCON
Israeli New Shekels - 3.68280 1.26Tel Aviv Army 1.26
Euro - 0.74570 1.44Aviano Air Force 1.42Gaeta Navy 1.40Naples Navy 1.43Sigonella Navy 1.46Vicenza Army 1.47
Japanese Yen - 97.05350 1.77Atsugi Navy 1.78Iwakuni Navy 1.71Misawa Navy 1.77Okinawa Navy 1.77Tokyo Navy 1.79Yokosuka Navy 1.78
Jordanian Dinars - 0.70670 1.55Amman Navy 1.55
Korea South Korean Won - 1101.51540 1.09DMZ Area Army 1.23Kunsan Air Force 1.10Osan Air Force 1.08Pusan Army 1.05Pyongtaek Army 1.06Seoul Army 1.07Taegu Air Force 1.07Tongduchon Army 1.07
Euro - 0.74570 1.16Pristina Army 1.16
Kuwaiti Dinar - 0.28770 1.18Kuwait City Army 1.18
US Dollar - 1.00000 2.61Kwajalein Army 2.61
Latvian Lat - 0.55550 1.25Riga Army 1.25
Lebanese Pound 1.38Beirut Army 1.38
Kosovo
Latvia
Lebanon
Kuwait
Kwajalein
Israel
Italy
Japan
Jordan
13
Country Location & Local Currency per US Dollar Service MILCON ACFUS Average = 1.00
DOD Area Cost Factors - OCONUSPax Newslatter, dated 3/25/2015, PY 17-18 MILCON
Lithuanian Litas - 2.72010 1.26Vilnius Army 1.26
Euro - 0.74570 1.43Oss Army 1.43
Nicaraguan Cordoba - 25.83170 1.04Managua Navy 1.04
US Dollar - 1.00000 2.42Saipan 2.42
Norwegian Kroner - 5.86850 2.12Oslo Navy 2.12
Omani Rial - 0.38380 1.19Ruwi Army 1.19
US Dollar - 1.00000 1.11Panama City Army 1.11
Paraguayan Guarani - 4380.22000 1.01Asuncion Army 1.01
Peru Peruvian Neuvo Sol - 2.84710 0.89Lima Navy 0.89
Philippine Peso - 44.87140 1.19Zamboanga Navy 1.19
Polish Zloty - 3.30110 0.95Warsaw Army 0.95
US Dollar - 1.00000 1.13Ponce/Fort Allen Army 1.13San Juan Metro/Fort Buchanan Army 1.12
Qatari Rial - 3.63860 1.20Doha Navy 1.20
Romanian New Leu - 3.48260 1.05Bucharest Army 1.05
Sauid Riyal - 3.75060 1.20Riyadh Navy 1.20
Lithuania
Netherlands
Poland
Puerto Rico
Romania
Saudi Arabia
Qatar
Nicaragua
Northern Marianas
Norway
Panama
Paraguay
Oman
Philippines
14
Country Location & Local Currency per US Dollar Service MILCON ACFUS Average = 1.00
DOD Area Cost Factors - OCONUSPax Newslatter, dated 3/25/2015, PY 17-18 MILCON
Singapore Dollar - 1.28420 1.15Singapore Navy 1.15
Euro - 0.74570 1.16Moron Army 1.16Rota Navy 1.16
Thai Baht - 32.35450 0.94Bangkok Navy 0.94
Turkish Lira - 2.08320 0.98Ankara Air Force 0.95Incirlik Air Force 1.00
Ukraine Hryvnia - 12.71770 0.95Kiev Army 0.95
UAE Dirham - 3.67200 1.16Dubai Navy 1.16
British Pound - 0.62890 1.11Fairford/Croughton Air Force 1.11Lakenheath Air Force 1.11Menwith Hill Air Force 1.09West Ruislip Air Force 1.12
Uruguayan Peso - 24.31810 1.01Montevideo Army 1.01