52


DOD RFID Shelf-Life Study, Phase II:
Adaptive and Dynamic Shelf-Life
Estimation
Ismail Uysal, Ph.D.
Jean-Pierre Emond, Ph.D.
College of Technology and Innovation
University of South Florida Polytechnic
Today’s agenda
• RFID lab at the University of South Florida
Polytechnic and what we do…
• Project definition, goals and requirements
• Testing protocol and accuracy metric
• Adaptive temperature estimation
• Shelf life algorithm and its implications on supply
chain management
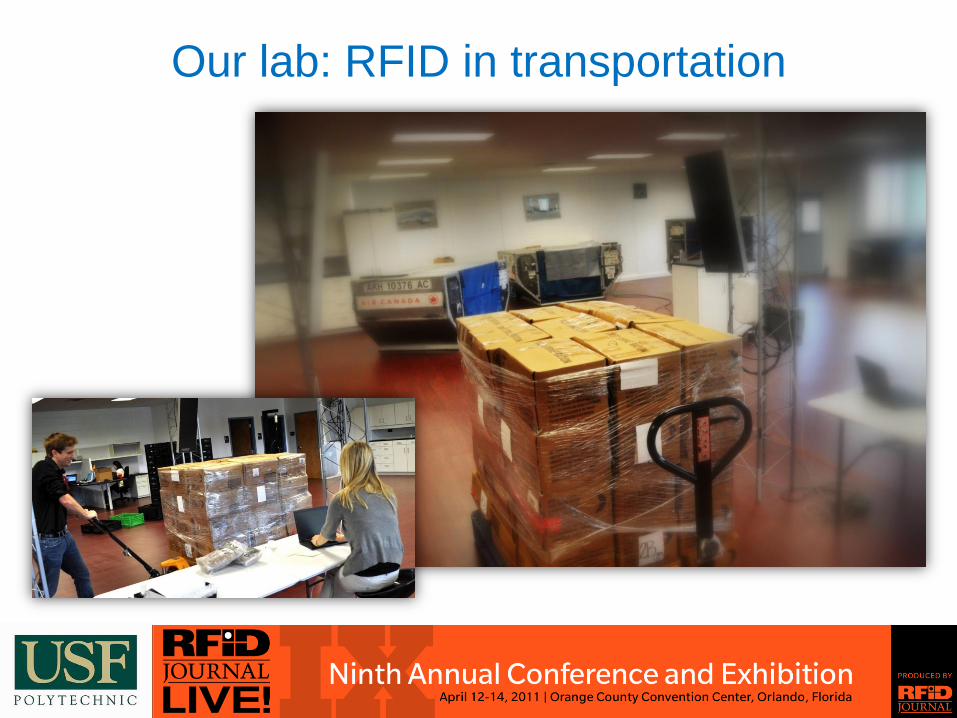
Our lab: RFID in transportation
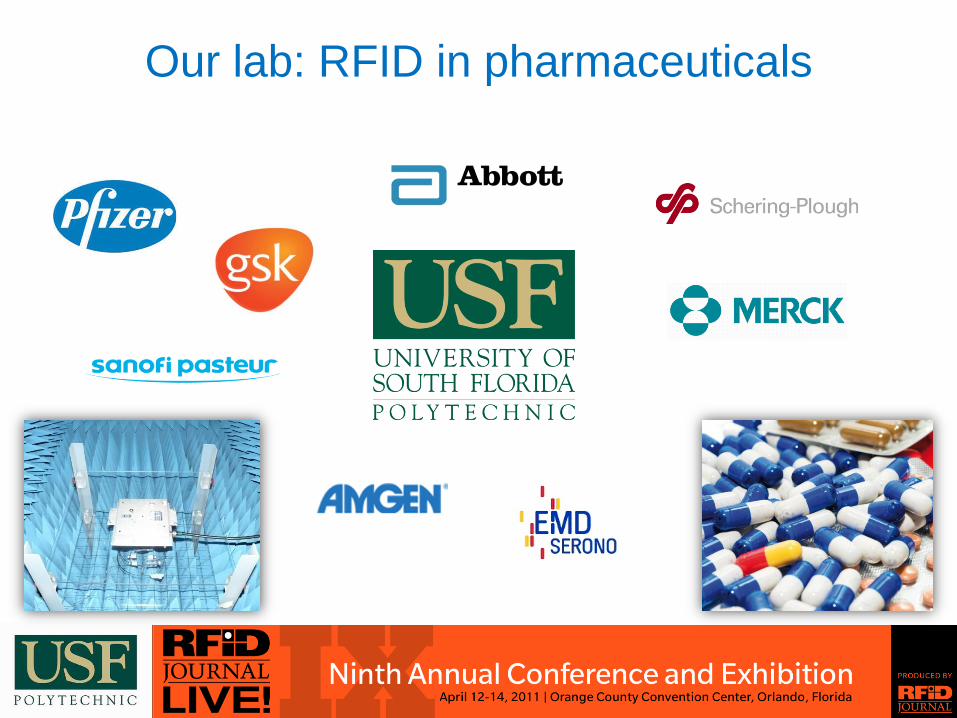
Our lab: RFID in pharmaceuticals

Our lab: RFID in sensory monitoring

Temperature monitoring of First Strike Rations
Project definition
• Monitor the environmental temperature of First-strike-
rations (FSR):
– During shipment and storage
– 100% portable, RFID based solution
• Should be usable in the most remote locations
– Dynamically estimate remaining shelf life
• Any point in the supply chain or on the field

What is FSR?
• Army First strike rations (FSR)
– A semi-perishable product
– Two year shelf life under
normal storage conditions
– Significant degradation under
high temperature conditions
Research goals and requirements
From a broad perspective
– Track the temperature of a shipped product
• During both storage and transportation
• Use radio frequency identification (RFID)
enabled sensors
– Using the recorded temperatures
• Estimate its remaining shelf life prior to
consumption
• First-expired-first-out (FEFO) over first-in-first-
out (FIFO)
What does it mean?
• No more date of expiration printed on label
– A static date for assumed temperature conditions
• Advantages of dynamic shelf life estimation
– Improved food quality and safety
– Intelligent distribution practices
• FEFO vs. FIFO
• Advantage of using RFID
– Increased product safety, especially food and
perishables
– Early (even real time) detection of refrigeration
equipment failure

Two paths to follow…
• (Engineering) RFID testing, system and software
design - Objective 1
• (Food Science) FSR shelf life estimation studies –
Objective 2

Participants
• The United States Army Natick Labs
• University of Florida
• University of South Florida Polytechnic
• Georgia Institute of Technology
• Franwell, Inc.

Project requirements
• Temperature sensors should be able to record and
withstand temperatures between -30C and +60C
(-20F to 140F).
• Ultra-high frequency (UHF) RFID system, preferably
915MHz.
• Standard and passive communication protocol.
• 2 year shelf life means at least 2 years of battery life.
• 100% portable solution.
• 6 to 10 feet read range from a side of the pallet.
Biggest challenges
• Portable and passive
– No passive RFID logger full-solution readily
available on the market
• UHF – 915MHz
– Eliminates majority of active technologies
• Standard and passive protocol
– Eliminates rest of the active technologies
• Temperature range
– Atypically wide for RFID sensors

Objectives
• Review state-of-the-art technologies on the market
• Develop a test setup and protocol to identify the most
reliable technology
• Design a performance metric to identify the most
accurate technology
• Design the necessary software tools to initialize,
start, and read the temperature loggers to estimate
shelf life on a handheld device.
A few words on testing protocol
Common testing protocols
• Temperature (performed by manufacturer)
– Validate accuracy
– Validate reliability
• Vibration (performed by manufacturer)
– Validate operation
– Validate reliability

Proposed testing protocol
• Goes beyond simple temperature & vibration tests
– Realistic environmental simulation
– Real transportation parameters
• Temperature profiles of shipping lanes
• Vibration profiles for different modes of
transportation
• Introduces a more definitive quantitative performance
metric for comparison
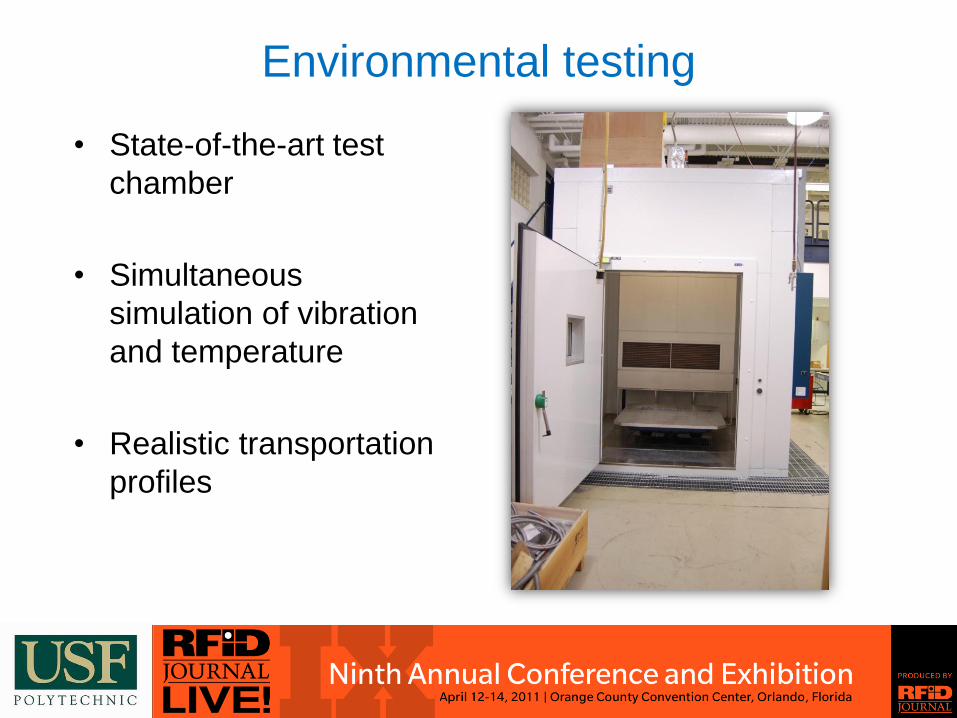
Environmental testing
• State-of-the-art test
chamber
• Simultaneous
simulation of vibration
and temperature
• Realistic transportation
profiles
Developed testing protocol
• Pure temperature accuracy analysis
– Requirement limits
– Higher resolution
• Environmental reliability and accuracy analysis
– Temperature + vibration
– Max range within system limitations
– Fully data driven
Temperature accuracy testing
• 80% requirement range span
– Temperature range within +/-10% of requirement
range
– Higher resolution within the 80% span
– Faster temperature changes
• Extended requirement range span
– Prolonged exposure to requirement limits
– Longer temperature recordings at very high and
very low temperatures
– Sharper temperature transition
Temperature accuracy testing
• Two point swing test
– Fully data driven
– Ship out loggers and monitor the supply chain
– Determine average maximum and average
minimum temperatures
– Swing between the two temperatures with full 24-
hour intervals to emulate shipping lane
– Multiple swings for prolonged exposure
• Freezing test
– Very critical for shelf life estimation
– Will the tag freeze within the requirement range?

Realistic Environmental Testing
• Transportation profiles
– Temperature
• Loggers on shipping lanes
• A priori information available
– Vibration
• Transportation modes: truck, rail, air
• Bounce test
• Both temperature and vibration variables change at
the same time
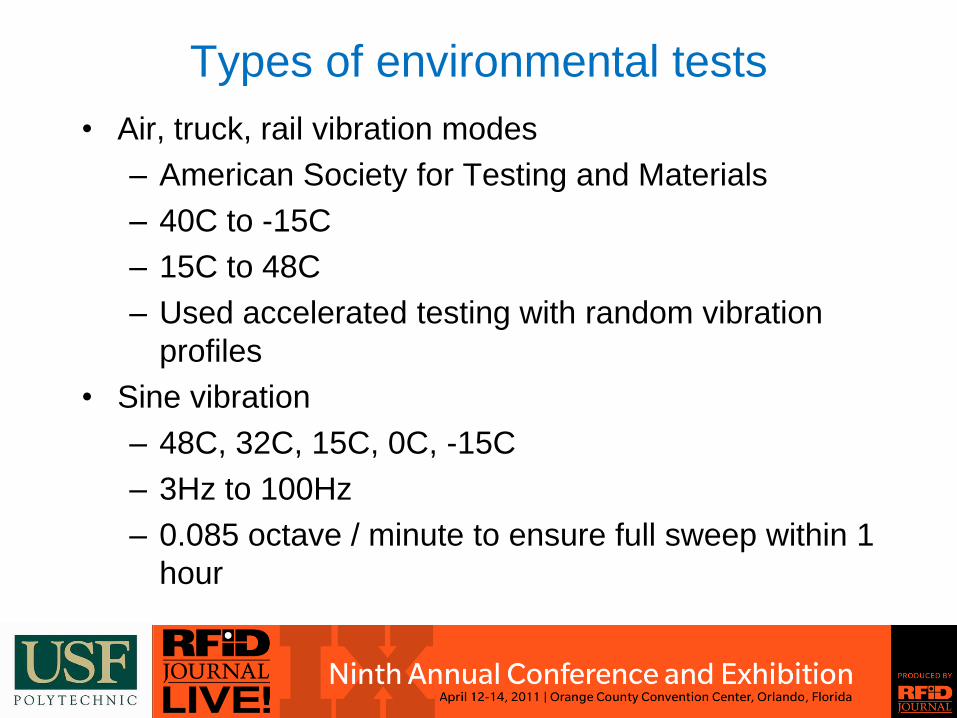
Types of environmental tests
• Air, truck, rail vibration modes
– American Society for Testing and Materials
– 40C to -15C
– 15C to 48C
– Used accelerated testing with random vibration
profiles
• Sine vibration
– 48C, 32C, 15C, 0C, -15C
– 3Hz to 100Hz
– 0.085 octave / minute to ensure full sweep within 1
hour
Do we need to test with vibration?
• Tags might fail
– We had 3 tags fail, 2 from one manufacturer and 1
from another
• Tags might skip sampling instants due to loss of
battery contact
• Accuracy drops
– Especially at low temperatures

When choosing the right technology…
• Both accuracy and reliability matters
– Multi-step testing for accuracy, emphasis on
extremes
– Temperature dependent reliability
• Comprehensive testing with real life parameters
• Performance metric is important !
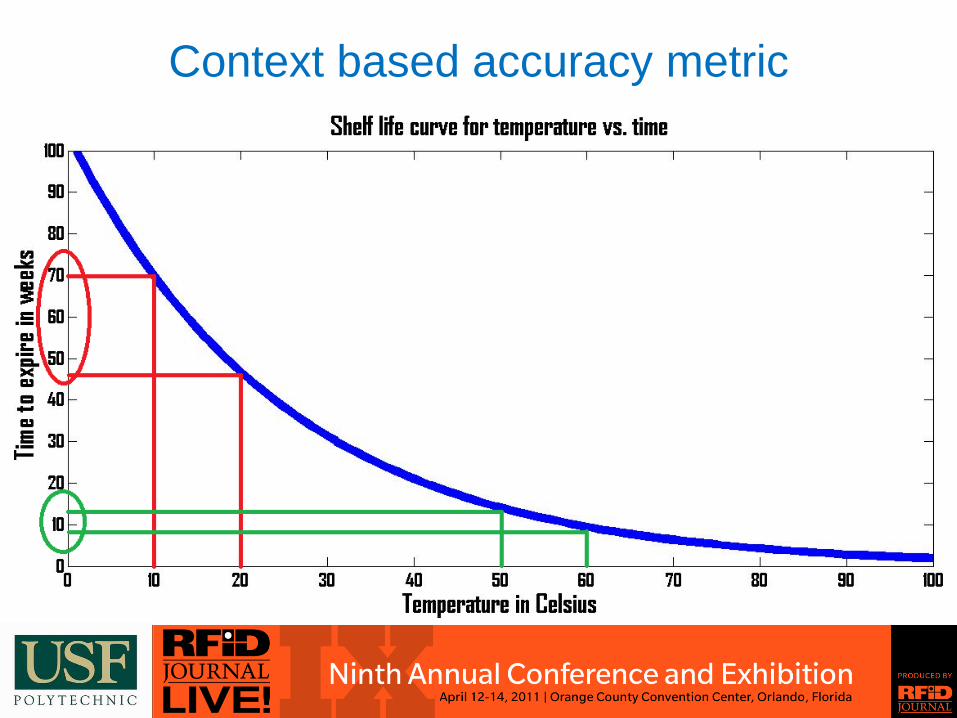
Context based accuracy metric

Context based accuracy
MSE Standard
Deviation
CBA Price
Temperature
Tag A
0.248 0.215 0.34 $30
Temperature
Tag B
0.382 0.556 0.38 $15

Overcoming limitations of RFID
Stu
ck in b
etw
ee
n !

Where you place the tag is important !
• Inside the pallet…
– Better for monitoring the inside temperature
– Better for shelf life prediction
– Worse RFID performance
• Outside the pallet…
– Worse for monitoring the inside temperature
– Worse for shelf life prediction
– Better RFID performance

Temperature estimation
• Instrument the pallet with
temperature sensors
– Inside
– Outside
• Find a mathematical model
to estimate the inside
temperature from the
outside temperature

Temperature profiles
• Multiple heat – cool
cycles
• Calculate heat
exchange time
constant
• Construct your
estimator
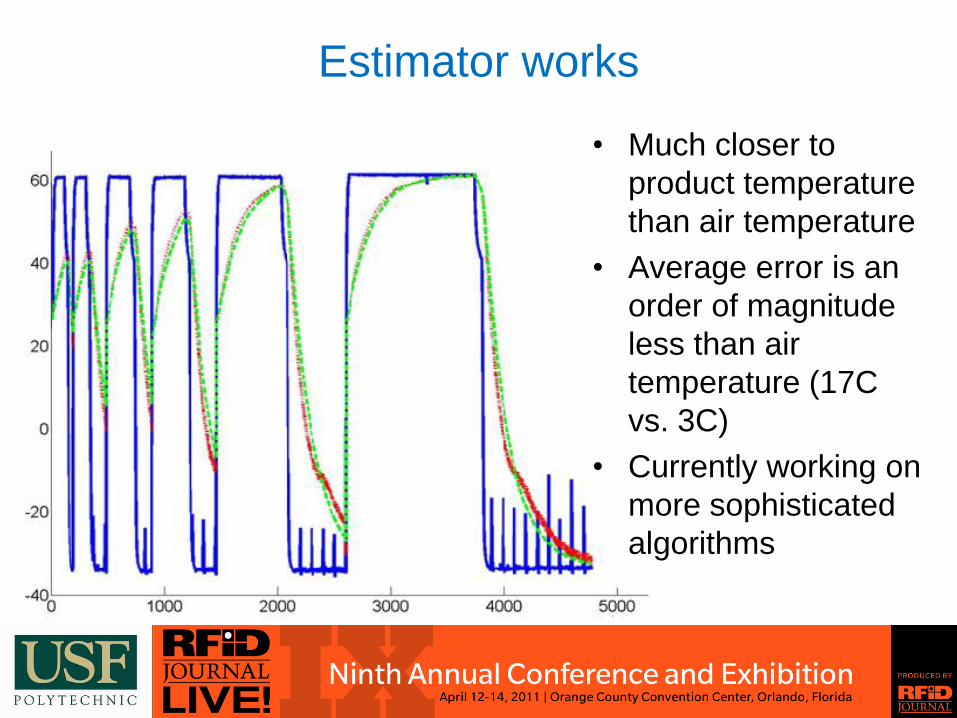
Estimator works
• Much closer to
product temperature
than air temperature
• Average error is an
order of magnitude
less than air
temperature (17C
vs. 3C)
• Currently working on
more sophisticated
algorithms

Next step: Information processing
• Found the right technology
• Employed mathematical tools to improve efficiency
• Most important question now is:
– What to do with all the information?
• Pallet origin
• Pallet destination
• Temperature history
• First step -> shelf life estimation

Why quality monitoring?
To provide visibility from farm to store
and convert collected data into decision
making information, including shelf life
estimation of perishable products at pre-
defined points along the supply chain

Benefits (Suppliers, distributors, retailers)
• Enhanced quality control (QC) decision making
• Reduce time to perform QC
• Enhanced dispute resolution
• Identification of breaks such as cold chain
• Better stock management
• Improve product recall plans
• Brand protection
• Reduce shrink
• Increase revenue
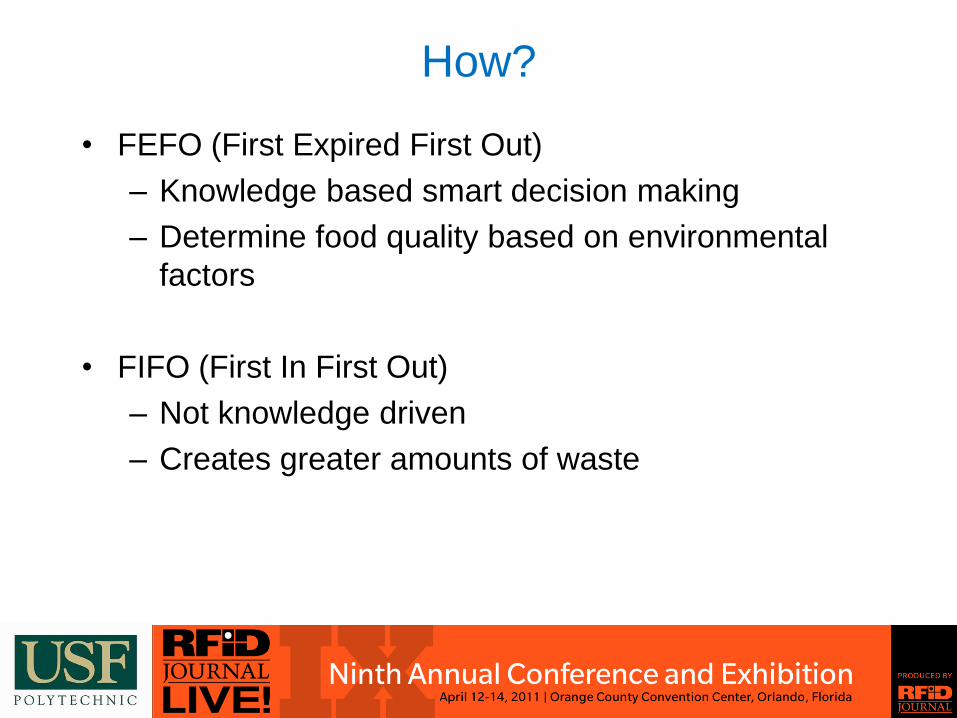
How?
• FEFO (First Expired First Out)
– Knowledge based smart decision making
– Determine food quality based on environmental
factors
• FIFO (First In First Out)
– Not knowledge driven
– Creates greater amounts of waste

For FEFO you need dynamic shelf life…
• Shelf life is the period during which a
product retains its desired quality
attributes
• Shelf life depends on a multiplicity of
variables and their changes, including
the product, the environmental
conditions such as temperature,
humidity, gas concentrations and also
the packaging
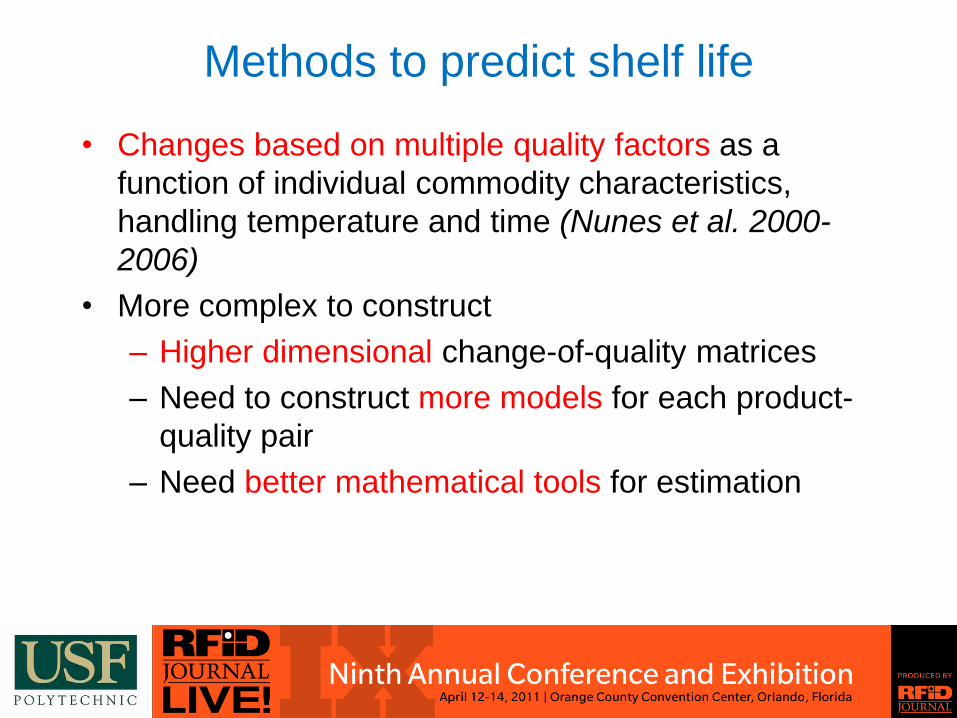
Methods to predict shelf life
• Changes based on multiple quality factors as a
function of individual commodity characteristics,
handling temperature and time (Nunes et al. 2000-
2006)
• More complex to construct
– Higher dimensional change-of-quality matrices
– Need to construct more models for each product-
quality pair
– Need better mathematical tools for estimation

From a 2D Approach to 3D
• Current model
– X - axis environmental variable
– Y- axis shelf-life
• Proposed model
– X - axis environmental variable
– Y - axis quality factor value
– Z - axis type of quality factor
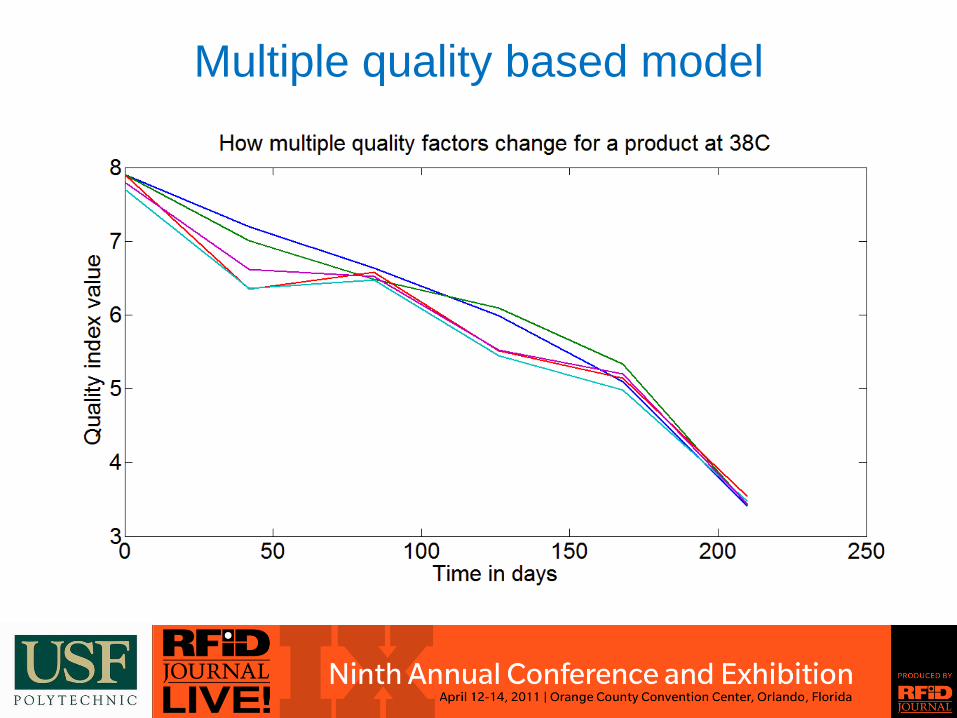
Multiple quality based model
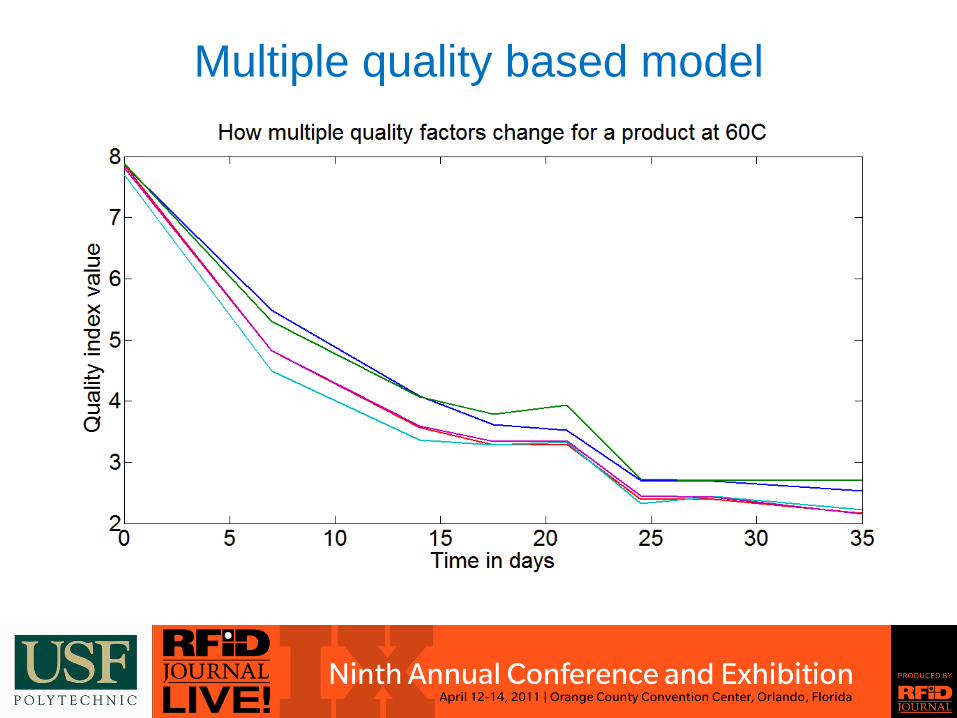
Multiple quality based model
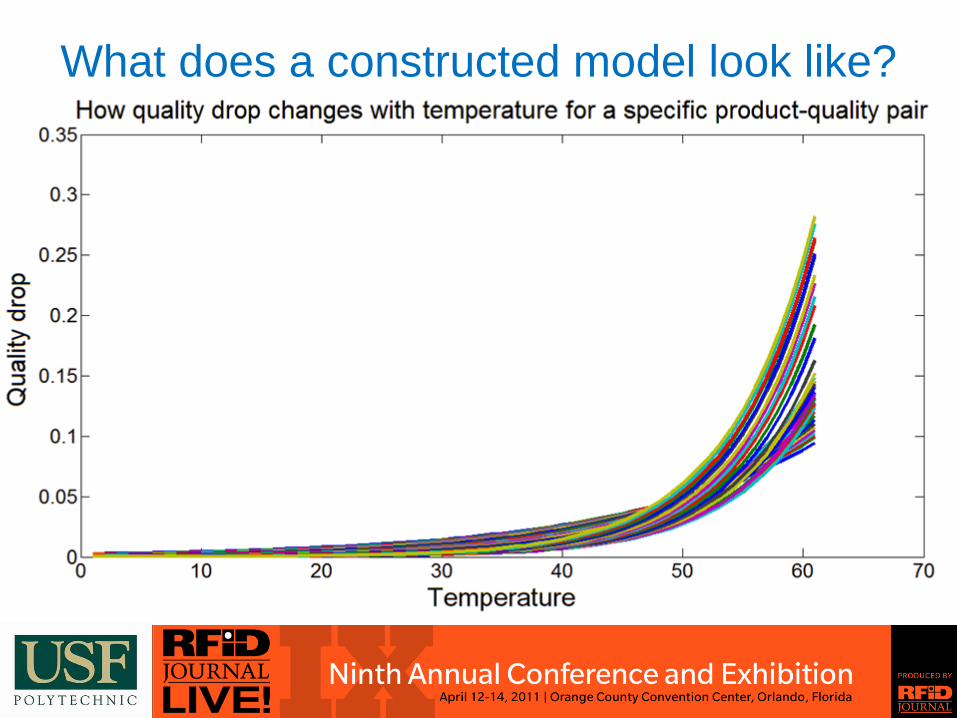
What does a constructed model look like?
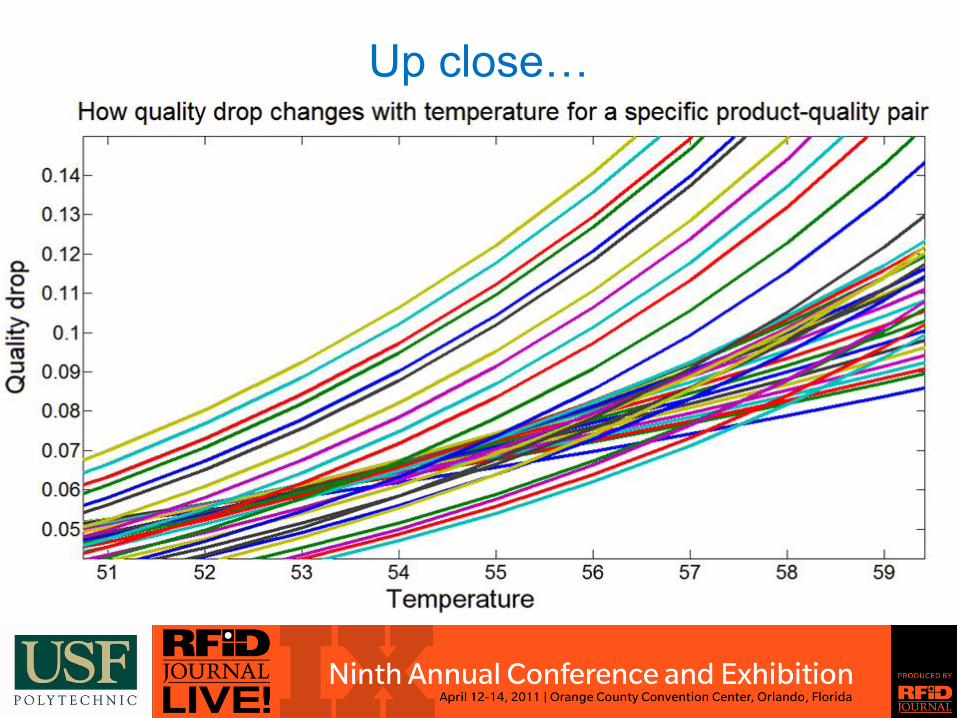
Up close…

Model validation in real life
• FSR shelf life model has been completed
• Validation of the shelf life model and its supply chain
management implications -> phase II activities
• Another example: a recent real life study done on a
shipment of strawberries
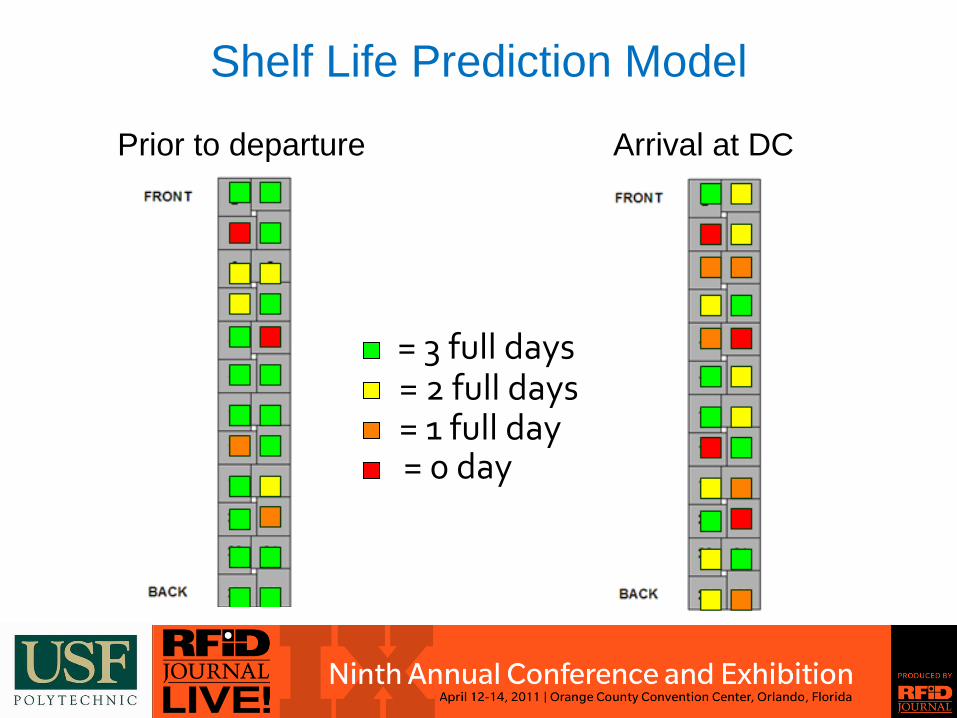
Shelf Life Prediction Model
Prior to departure Arrival at DC
= 3 full days= 2 full days= 1 full day= 0 day

Typical Visual Inspection by the Retailer
22/24 = accepted
2/24 = rejected
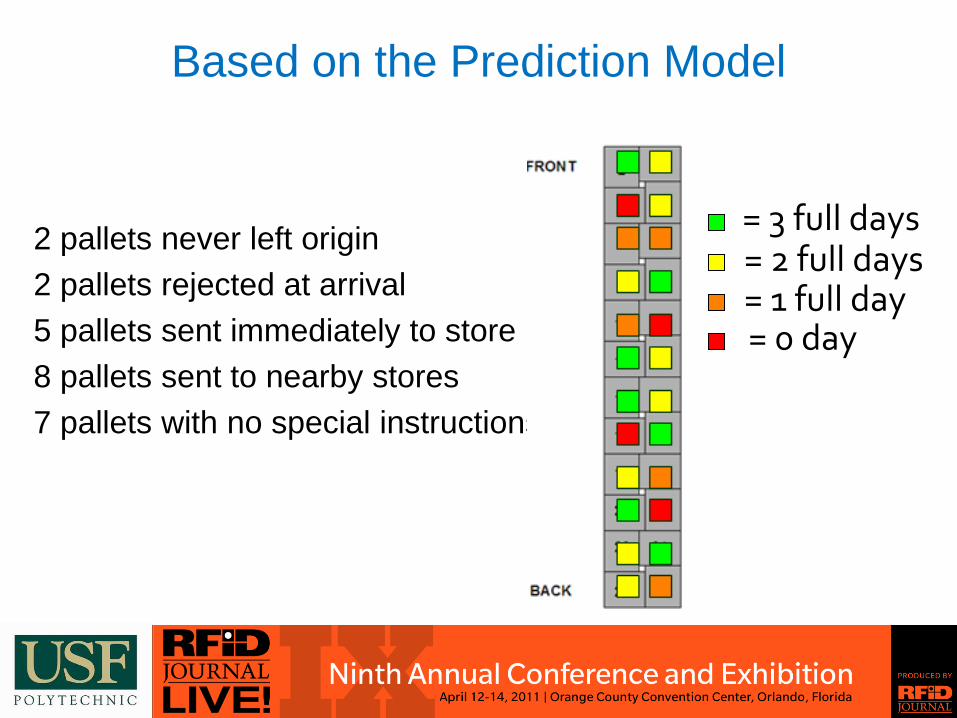
Based on the Prediction Model
2 pallets never left origin
2 pallets rejected at arrival
5 pallets sent immediately to store
8 pallets sent to nearby stores
7 pallets with no special instructions
= 3 full days= 2 full days= 1 full day= 0 day

What Happens at the Store?
# Pallet FIFO Waste (SL + FEFO Waste)
2 91.7% (rejected)
5 53 % (25%)
8 36.7% (13.3%)
7 10% (10%)
•Provide safer products for consumers.
•Better quality and consistency of products in the stores
throughout the year
•Waste reduction

Conclusions
• Adaptive and dynamic shelf life estimation with RFID
– How to find the most reliable technology
• Developed a universally applicable test setup and
protocol to go beyond simple accuracy tests
• Novel context based accuracy over general accuracy
– How to overcome limitations of RFID
• Adaptive temperature estimation
– Dynamic in monitoring the entire temperature history
– Dynamic with on demand shelf life estimation
50

Conclusions
• Fully portable, ready to be used in remote locations
– No infrastructure required
• Handheld software development including shelf life
implementation completed
• System and model validation in phase II with FSR pallets
• Full database interfacing in phase II to enable FEFO
practice over FIFO
• Temperature based multiple quality models are:
– Accurate
– Ensures higher quality and safer products for
consumers
51


