170
Dodd-Frank Act Stress Test 2017: Supervisory Stress Test Methodology and Results June 2017 B O A R D O F G O V E R N O R S O F T H E F EDERAL R ESERVE S YSTEM
Dodd-Frank Act Stress Test 2017: Supervisory Stress Test
Methodology and Results
June 2017
B O A R D O F G O V E R N O R S O F T H E F E D E R A L R E S E R V E S Y S T E M

Dodd-Frank Act Stress Test 2017: Supervisory Stress Test
Methodology and Results
June 2017
B O A R D O F G O V E R N O R S O F T H E F E D E R A L R E S E R V E S Y S T E M

This and other Federal Reserve Board reports and publications are available online at
www.federalreserve.gov/publications/default.htm.
To order copies of Federal Reserve Board publications offered in print,
see the Board’s Publication Order Form (www.federalreserve.gov/files/orderform.pdf)
or contact:
Printing and Fulfillment
Mail Stop K1-120
Board of Governors of the Federal Reserve System
Washington, DC 20551
(ph) 202-452-3245
(fax) 202-728-5886
(e-mail) [email protected]
Preface
The Federal Reserve promotes a safe, sound, and
stable banking and financial system that supports the
growth and stability of the U.S. economy through its
supervision of bank holding companies (BHCs),
U.S. intermediate holding companies (IHCs), savings
and loan holding companies, state member banks,
and nonbank financial institutions that the Financial
Stability Oversight Council (FSOC) has determined
shall be supervised by the Board of Governors of the
Federal Reserve System (Board).1
The Federal Reserve has established frameworks and
programs for the supervision of its largest and most
complex financial institutions to achieve its supervi-
sory objectives, incorporating the lessons learned
from the 2007 to 2009 financial crisis and in the
period since. As part of these supervisory frame-
works and programs, the Federal Reserve annually
assesses whether financial firms with $50 billion or
more in total consolidated assets are sufficiently
capitalized to absorb losses during stressful condi-
tions, while meeting obligations to creditors and
counterparties and continuing to be able to lend to
households and businesses. The Federal Reserve's
expectations for capital planning practices are tai-
lored to the size, scope of operations, activities, and
systemic importance of a particular firm. In particu-
lar, the Federal Reserve has significantly heightened
expectations for BHCs and U.S. IHCs supervised by
the Large Institution Supervision Coordinating
Committee (LISCC firms) and large and complex
firms.2
This annual assessment includes two related
programs:
• Dodd-Frank Act supervisory stress testing is a
forward-looking quantitative evaluation of the
impact of stressful economic and financial market
conditions on BHCs’ capital. The supervisory
stress test that is carried out pursuant to the Dodd-
Frank Wall Street Reform and Consumer Protec-
tion Act (Dodd-Frank Act) and the Board's rules3
serves to inform the Federal Reserve, BHCs, and
the general public of how institutions’ capital
ratios might change under a hypothetical set of
stressful economic conditions developed by the
Federal Reserve.4 The supervisory stress test
results, after incorporating firms’ planned capital
actions, are also used for the quantitative assess-
ment in the Comprehensive Capital Analysis and
Review (CCAR). All BHCs and U.S. IHCs with
$50 billion or more in total consolidated assets are
currently subject to Dodd-Frank supervisory stress
testing.5
• The Comprehensive Capital Analysis and Review
(CCAR) consists of a quantitative assessment for
all BHCs with $50 billion or more in total consoli-
dated assets and a qualitative assessment for BHCs
that are LISCC or large and complex firms. The
quantitative assessment evaluates a firm’s capital
adequacy and planned capital distributions, such
1 Information on the Federal Reserve’s regulation and supervi-sion function, including more detail on stress testing and capital planning assessment, is available on the Federal Reserve website at www.federalreserve.gov/supervisionreg.htm.
2 Large and complex firms are BHCs or U.S. IHCs that (i) have average total consolidated assets over $250 billion or (ii) have average total nonbank assets of $75 billion or more, and (iii) are not LISCC firms.
3 Pub. L. No. 111-203, 124 Stat. 1376 (2010); 12 CFR part 252, subpart E.
4 In addition to an annual supervisory stress test conducted by the Federal Reserve, each participating institution is required to conduct annual company-run stress tests under the same super-visory scenarios and conduct a mid-cycle stress test under company-developed scenarios.
5 Certain newly formed U.S. IHCs are not yet subject to Dodd-Frank Act supervisory stress testing, but are required under the capital plan rule to submit a capital plan to the Federal Reserve that will be subject to a confidential review process. These firms are Barclays US LLC; BNP Paribas USA, Inc.; Credit Suisse Holdings (USA) LLC; Deutsche Bank USA Corp; RBC USA Holdco Corporation; and UBS Americas Holdings LLC. This set of firms will be subject to Dodd-Frank stress testing begin-ning January 1, 2018. Deutsche Bank Trust Corporation is a subsidiary of a newly formed U.S. IHC that has participated in DFAST and CCAR in previous years and is subject to the supervisory stress test. See 12 CFR 225.8(c)(2); 12 CFR 252.153(e)(l)(ii)(c). Currently, no nonbank financial companies supervised by the Board are subject to the capital planning or stress test requirements.
iii
as any dividend payments and common stock
repurchases. The Federal Reserve assesses whether
firms have sufficient capital to continue operating
and lending to creditworthy households and busi-
nesses throughout times of economic and financial
market stress. CCAR also includes a qualitative
assessment of capital planning practices at the
largest and most complex firms. As part of the
qualitative assessment, the Federal Reserve evalu-
ates the reliability of each firm’s analyses and
other processes for capital planning, focusing on
the areas that are most critical to sound capital
planning—namely, how a firm identifies, measures,
and determines capital needs for its material risks,
and a firm’s controls and governance around those
processes. The Federal Reserve recently further tai-
lored its rules to remove large and noncomplex
firms from the qualitative objection process.6 At
the conclusion of the process, the Federal Reserve
either does not object or objects to a firm's capital
plan. If the Federal Reserve objects to a firm’s
capital plan, the firm may only make capital distri-
butions that the Federal Reserve has not objected
to in writing.
6 Large and noncomplex firms are BHCs or U.S. IHCs that (i) have average total consolidated assets between $50 billion and $250 billion, (ii) have average total nonbank assets of less than $75 billion, and (iii) are not U.S. global systemically important banks.
iv Supervisory Stress Test Methodology and Results
Executive Summary ................................................................................................................ 1
Background on Dodd-Frank Act Stress Testing ........................................................... 3
Supervisory Scenarios ............................................................................................................ 5
Severely Adverse Scenario .......................................................................................................... 5
Adverse Scenario ....................................................................................................................... 7
Global Market Shock and Counterparty Default Components ........................................................ 8
Supervisory Stress Test Framework and Model Methodology .............................. 11
Analytical Framework ................................................................................................................ 11
Model Methodology .................................................................................................................. 12
Model Risk Management, Governance, and Validation ................................................................ 15
Data Inputs ............................................................................................................................... 18
Capital Action Assumptions and Regulatory Capital Ratios ......................................................... 19
Supervisory Stress Test Results ......................................................................................... 21
Severely Adverse Scenario ........................................................................................................ 21
Adverse Scenario ...................................................................................................................... 36
Appendix A: Supervisory Scenarios ................................................................................ 51
Appendix B: Models to Project Net Income and Stressed Capital ........................ 61
Losses on the Accrual Loan Portfolio ......................................................................................... 61
Loan-Loss Provisions for the Accrual Loan Portfolio ................................................................... 66
Other Losses ............................................................................................................................ 67
PPNR ....................................................................................................................................... 70
Balance-Sheet Items and Risk-Weighted Assets ......................................................................... 73
Regulatory Capital .................................................................................................................... 74
Appendix C: BHC-Specific Results ................................................................................. 77
Appendix D: Additional Aggregate Results ................................................................ 147
v
Contents

Executive Summary
The Dodd-Frank Act requires the Federal Reserve to
conduct an annual stress test of BHCs and U.S.
IHCs7 with $50 billion or more in total consolidated
assets and any nonbank financial company that the
FSOC has determined shall be supervised by the
Board.8 The Board first adopted rules implementing
this requirement in October 2012 and most recently
modified these rules in February 2017.9
For this year’s stress test cycle (DFAST 2017), which
began January 1, 2017, the Federal Reserve con-
ducted supervisory stress tests of 34 BHCs.
This report provides
• background on Dodd-Frank Act stress testing;
• details of the adverse and severely adverse supervi-
sory scenarios used in DFAST 2017;
• an overview of the analytical framework and meth-
ods used to generate the Federal Reserve’s projec-
tions, highlighting notable changes from last year’s
program; and
• the results of the supervisory stress tests under
adverse and severely adverse scenarios for the
BHCs that participated in the DFAST 2017 pro-
gram, presented both in the aggregate and for indi-
vidual institutions.
The adverse and severely adverse supervisory sce-
narios used in DFAST 2017 feature U.S. and global
recessions. In particular, the severely adverse sce-
nario is characterized by a severe global recession in
which the U.S. unemployment rate rises by about
5.25 percentage points to 10 percent, accompanied
by a period of heightened stress in corporate loan
markets and commercial real estate markets. The
adverse scenario features a moderate recession in the
United States, as well as weakening economic activ-
ity across all countries included in the scenario.
In conducting its supervisory stress tests, the Federal
Reserve calculated its projections of each BHC’s bal-
ance sheet, risk-weighted assets (RWAs), net income,
and resulting regulatory capital ratios under these
scenarios using data on BHCs’ financial conditions
and risk characteristics provided by the BHCs and a
set of models developed or selected by the Federal
Reserve. For DFAST 2017, the Federal Reserve
updated the calculation of projected capital to incor-
porate the supplementary leverage ratio, which will
become effective starting in 2018. As in past years,
the Federal Reserve also enhanced some of the
supervisory models to improve model stability and
performance and incorporated new data, where
available. The enhanced models generally exhibit an
increased sensitivity to economic conditions com-
pared to past years’ models. These changes are high-
lighted in box 1. A description of enhancements to
the models used to project pre-provision net revenue
(PPNR) is included in box 2. Specific descriptions of
the supervisory models and related assumptions can
be found in appendix B.
The results of the DFAST 2017 projections suggest
that, in the aggregate, the 34 BHCs would experience
substantial losses under both the adverse and the
severely adverse scenarios but, in the aggregate,
could continue lending to businesses and households,
thanks to the capital built up by the sector following
the financial crisis.
Over the nine quarters of the planning horizon,
aggregate losses at the 34 BHCs under the severely
adverse scenario are projected to be $493 billion.
This includes losses across loan portfolios, losses
from credit impairment on securities held in the
BHCs’ investment portfolios, trading and counter-
party credit losses from a global market shock, and
other losses. Projected aggregate pre-provision net
revenue is $418 billion, and net income before taxes
is projected to be -$111 billion.
7 U.S. IHCs of foreign banking organizations are subject to the annual stress test in accordance with the transition provisions under the capital plan rule and subpart O of the Federal Reserve’s Regulation YY (12 CFR part 252).
8 12 USC 5365(i)(1).9 See 82 Fed. Reg. 9308 (February 3, 2017).
1
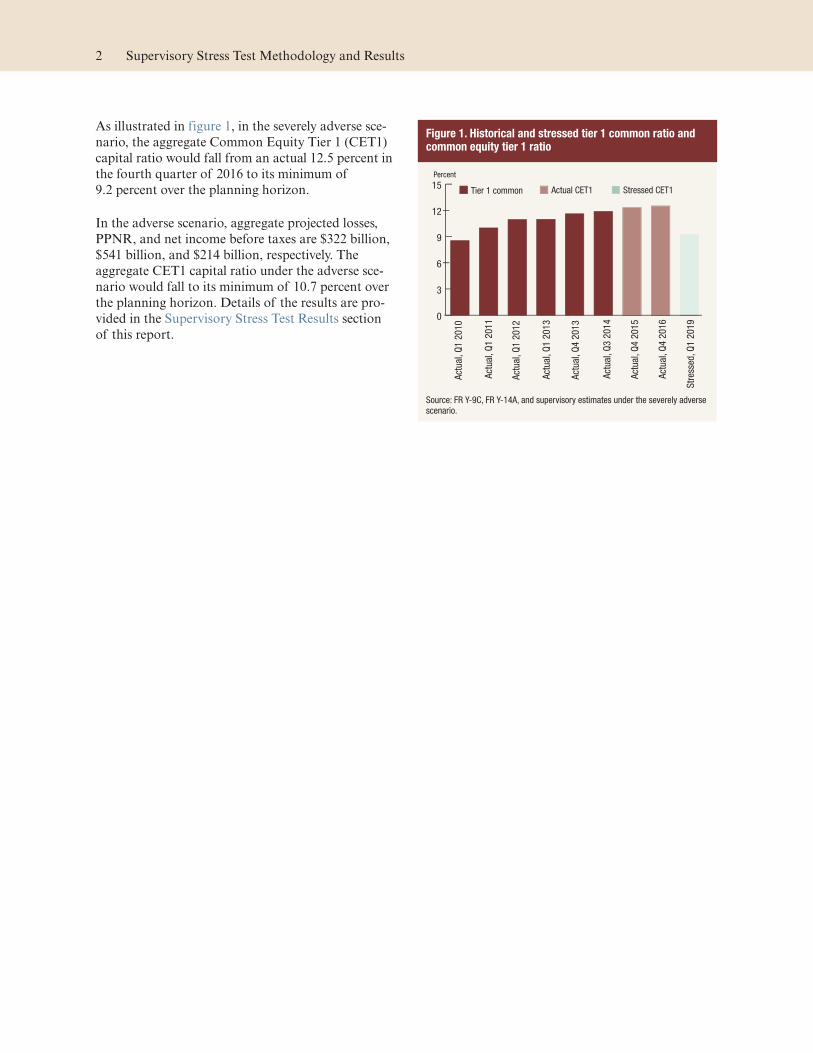
As illustrated in figure 1, in the severely adverse sce-
nario, the aggregate Common Equity Tier 1 (CET1)
capital ratio would fall from an actual 12.5 percent in
the fourth quarter of 2016 to its minimum of
9.2 percent over the planning horizon.
In the adverse scenario, aggregate projected losses,
PPNR, and net income before taxes are $322 billion,
$541 billion, and $214 billion, respectively. The
aggregate CET1 capital ratio under the adverse sce-
nario would fall to its minimum of 10.7 percent over
the planning horizon. Details of the results are pro-
vided in the Supervisory Stress Test Results section
of this report.
Figure 1. Historical and stressed tier 1 common ratio and common equity tier 1 ratio
Percent
0
3
6
9
12
15
Str
esse
d, Q
1 2
019
Act
ual
, Q4 2
016
Act
ual
, Q4 2
015
Act
ual
, Q3 2
014
Act
ual
, Q4 2
013
Act
ual
, Q1 2
013
Act
ual
, Q1 2
012
Act
ual
, Q1 2
011
Act
ual
, Q1 2
010
Stressed CET1Tier 1 common Actual CET1
Source: FR Y-9C, FR Y-14A, and supervisory estimates under the severely adverse
scenario.
2 Supervisory Stress Test Methodology and Results
Background on Dodd-Frank Act Stress Testing
In the wake of the financial crisis, Congress enacted
the Dodd-Frank Act,10 which, among other provi-
sions, requires the Federal Reserve to conduct an
annual supervisory stress test. The Dodd-Frank Act
also requires the same firms that are subject to the
supervisory stress test to conduct their own stress
tests and report the results to the Federal Reserve
twice a year (company-run stress test).11 LISCC
firms are subject to Dodd-Frank Act supervisory
stress testing, as are large and complex firms12 and
large and noncomplex firms.13
In conducting the supervisory stress tests, the Fed-
eral Reserve projects balance sheets, RWAs, net
income, and resulting post-stress capital levels and
regulatory capital ratios over a nine-quarter “plan-
ning horizon,” generally using a set of capital action
assumptions prescribed in the Dodd-Frank Act
stress test rules (see Capital Action Assumptions and
Regulatory Capital Ratios). The projections are
based on three macroeconomic scenarios required by
the Dodd-Frank Act (baseline, adverse, and severely
adverse) and developed annually by the Federal
Reserve.14 For the annual company-run stress test,
the BHCs use the same planning horizon, capital
action assumptions, and scenarios15 as those used in
the supervisory stress test.16 The use of common
capital action assumptions and scenarios enhances
the comparability of the supervisory and company-
run results.
Together, the Dodd-Frank Act supervisory stress
tests and the company-run stress tests are intended
to provide company management and boards of
directors, the public, and supervisors with forward-
looking information to help gauge the potential
effect of stressful conditions on the ability of these
large banking organizations to absorb losses, while
meeting obligations to creditors and other counter-
parties and continuing to lend. The Dodd-Frank Act
requires each BHC to disclose a summary of its
company-run stress test results and also requires the
Federal Reserve to disclose a summary of its supervi-
sory stress test results.17 The Federal Reserve must
publicly disclose supervisory stress test results by
June 30 of the calendar year in which the stress test
was conducted, and each BHC must disclose a sum-
mary of its company-run stress test within the 15 cal-
endar days following.18
10 Pub. L. No. 111-203, 124 Stat. 1376 (2010).11 Under the Dodd-Frank Act, all financial companies with more
than $10 billion in total consolidated assets that are supervised by a primary federal financial regulatory agency are required to conduct an annual company-run stress test. However, only cov-ered companies, defined as BHCs, U.S. IHCs, or nonbank financial companies with average total consolidated assets of $50 billion or more, are subject to the additional mid-cycle stress test and the supervisory stress test. See 12 USC 5365(i)(2) and 12 CFR 252.52(g).
12 The LISCC or large and complex firms required to participate in DFAST 2017 are Bank of America Corporation; The Bank of New York Mellon Corporation; Capital One Financial Cor-poration; Citigroup Inc.; The Goldman Sachs Group, Inc.; HSBC North America Holdings Inc.; JPMorgan Chase & Co.; Morgan Stanley; The PNC Financial Services Group, Inc.; State Street Corporation; TD Group US Holdings LLC; U.S. Bancorp; and Wells Fargo & Company.
13 The large and noncomplex firms participating in DFAST 2017 are Ally Financial Inc.; American Express Company; BancWest Corporation; BB&T Corporation; BBVA Compass Bancshares, Inc.; BMO Financial Corp.; CIT Group Inc.; Citizens Financial Group, Inc.; Comerica Incorporated; Discover Financial Ser-vices; Fifth Third Bancorp; Huntington Bancshares Incorpo-rated; KeyCorp; M&T Bank Corporation; MUFG Americas Holdings Corporation; Northern Trust Corporation; Regions Financial Corporation; Santander Holdings USA, Inc.; Sun-Trust Banks, Inc.; and Zions Bancorporation.
14 The Board has issued a policy statement regarding its process for designing the scenarios. See Policy Statement on the Sce-nario Design Framework for Stress Testing, 78 Fed. Reg. 71,435 (November 29, 2013), www.gpo.gov/fdsys/pkg/FR-2013-11-29/pdf/2013-27009.pdf (12 CFR part 252, appendix A).
15 Under the stress test rules, the Federal Reserve was required to provide the scenarios to companies no later than February 15, 2017, for DFAST 2017. See 12 CFR 252.54(b)(1).
16 See 12 CFR 252.54.17 12 USC 5365(i)(1)(B)(v) and 5365(i)(2)(C)(iv).18 See 12 CFR 252.46(b) and 12 CFR 252.58(a)(i).
3

Supervisory Scenarios
On February 3, 2017, the Federal Reserve released
the three supervisory scenarios: baseline, adverse,
and severely adverse.19 This section describes the
adverse and severely adverse scenarios that were used
for the projections contained in this report. These
scenarios were developed using the approach
described in the Board’s Policy Statement on the
Scenario Design Framework for Stress Testing.20
The adverse and severely adverse scenarios are not
forecasts, but rather hypothetical scenarios designed
to assess the strength of banking organizations and
their resilience to an unfavorable economic
environment.
Supervisory scenarios include trajectories for 28 vari-
ables. These include 16 variables that capture eco-
nomic activity, asset prices, and interest rates in the
U.S. economy and financial markets and three vari-
ables (real gross domestic product (GDP) growth,
inflation, and the U.S./foreign currency exchange
rate) in each of the four countries/country blocks.
Similar to last year, the Federal Reserve applied a
global market shock to the trading portfolio of six
BHCs with large trading and private equity expo-
sures and a counterparty default scenario compo-
nent to eight BHCs with substantial trading, process-
ing, or custodial operations (see Global Market
Shock and Counterparty Default Components).
Severely Adverse Scenario
Figures 2 through 7 illustrate the hypothetical trajec-
tories for some of the key variables describing U.S.
economic activity and asset prices under the severely
adverse scenario.
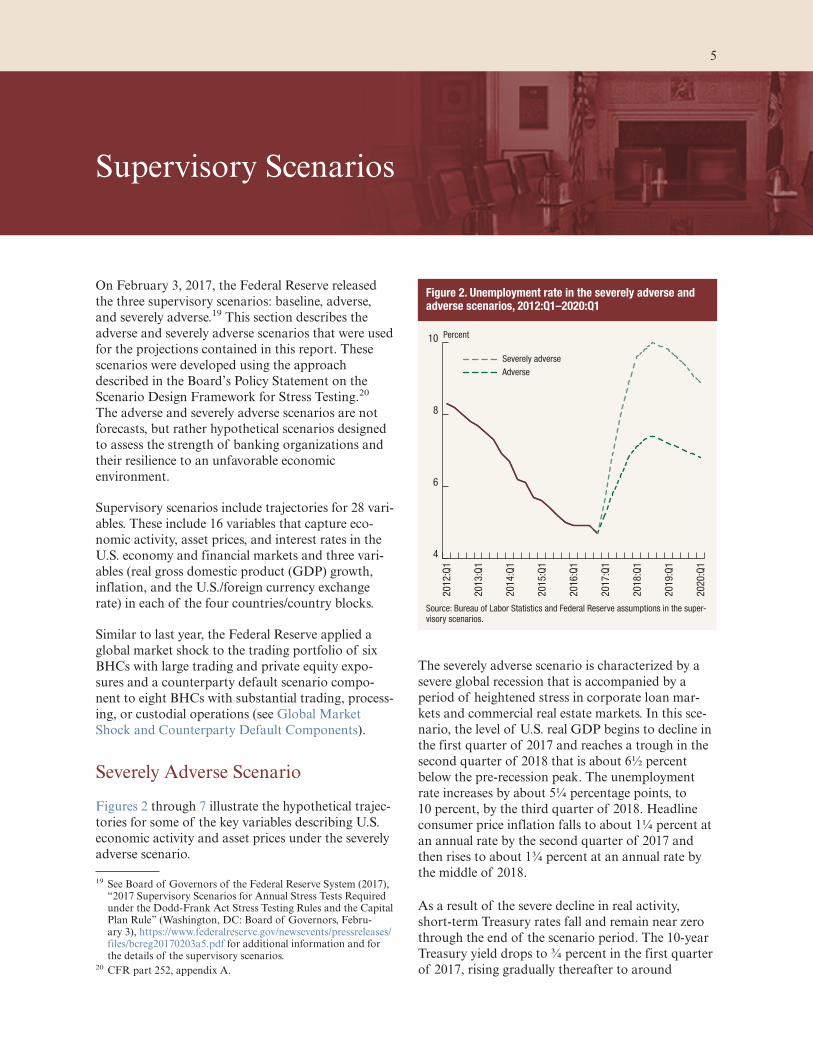
The severely adverse scenario is characterized by a
severe global recession that is accompanied by a
period of heightened stress in corporate loan mar-
kets and commercial real estate markets. In this sce-
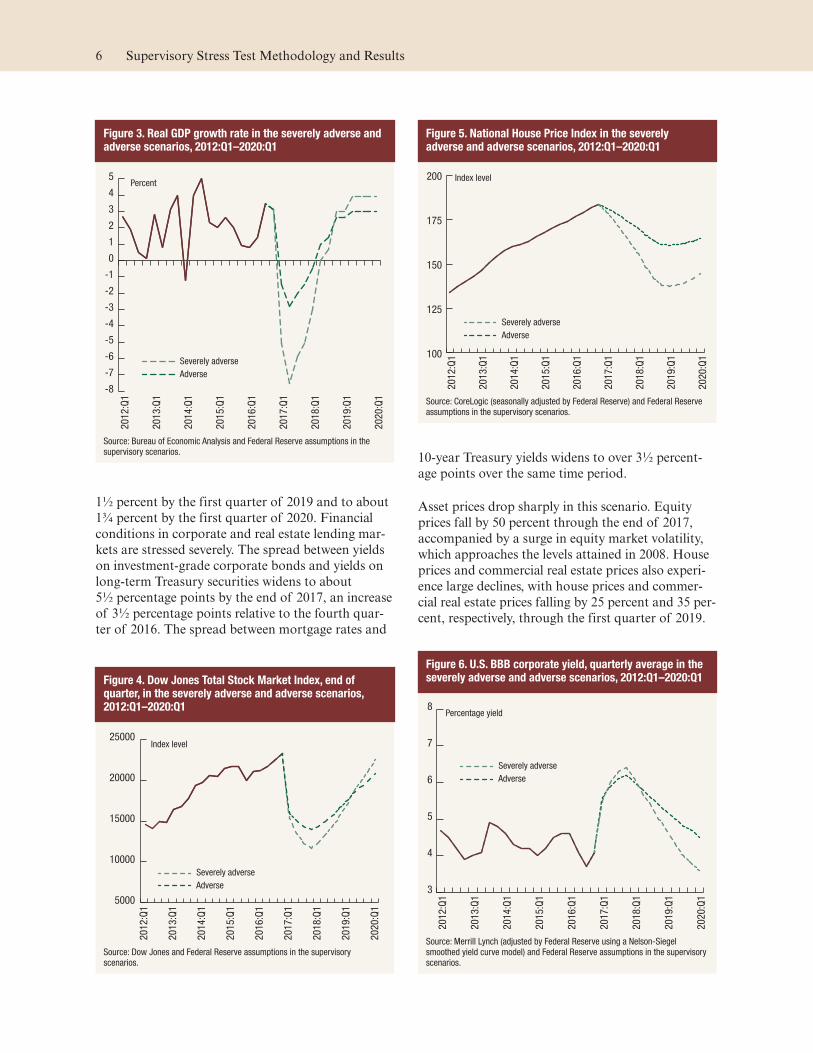
nario, the level of U.S. real GDP begins to decline in
the first quarter of 2017 and reaches a trough in the
second quarter of 2018 that is about 6½ percent
below the pre-recession peak. The unemployment
rate increases by about 5¼ percentage points, to
10 percent, by the third quarter of 2018. Headline
consumer price inflation falls to about 1¼ percent at
an annual rate by the second quarter of 2017 and
then rises to about 1¾ percent at an annual rate by
the middle of 2018.
As a result of the severe decline in real activity,
short-term Treasury rates fall and remain near zero
through the end of the scenario period. The 10-year
Treasury yield drops to ¾ percent in the first quarter
of 2017, rising gradually thereafter to around
19 See Board of Governors of the Federal Reserve System (2017), “2017 Supervisory Scenarios for Annual Stress Tests Required under the Dodd-Frank Act Stress Testing Rules and the Capital Plan Rule” (Washington, DC: Board of Governors, Febru-ary 3), https://www.federalreserve.gov/newsevents/pressreleases/files/bcreg20170203a5.pdf for additional information and for the details of the supervisory scenarios.
20 CFR part 252, appendix A.
Figure 2. Unemployment rate in the severely adverse and adverse scenarios, 2012:Q1–2020:Q1
Severely adverse
Adverse
4
6
8
10
2020:Q
1
2019:Q
1
2018:Q
1
2017:Q
1
2016:Q
1
2015:Q
1
2014:Q
1
2013:Q
1
2012:Q
1
Percent
Source: Bureau of Labor Statistics and Federal Reserve assumptions in the super-
visory scenarios.
5
1½ percent by the first quarter of 2019 and to about
1¾ percent by the first quarter of 2020. Financial
conditions in corporate and real estate lending mar-
kets are stressed severely. The spread between yields
on investment-grade corporate bonds and yields on
long-term Treasury securities widens to about
5½ percentage points by the end of 2017, an increase
of 3½ percentage points relative to the fourth quar-
ter of 2016. The spread between mortgage rates and
10-year Treasury yields widens to over 3½ percent-
age points over the same time period.
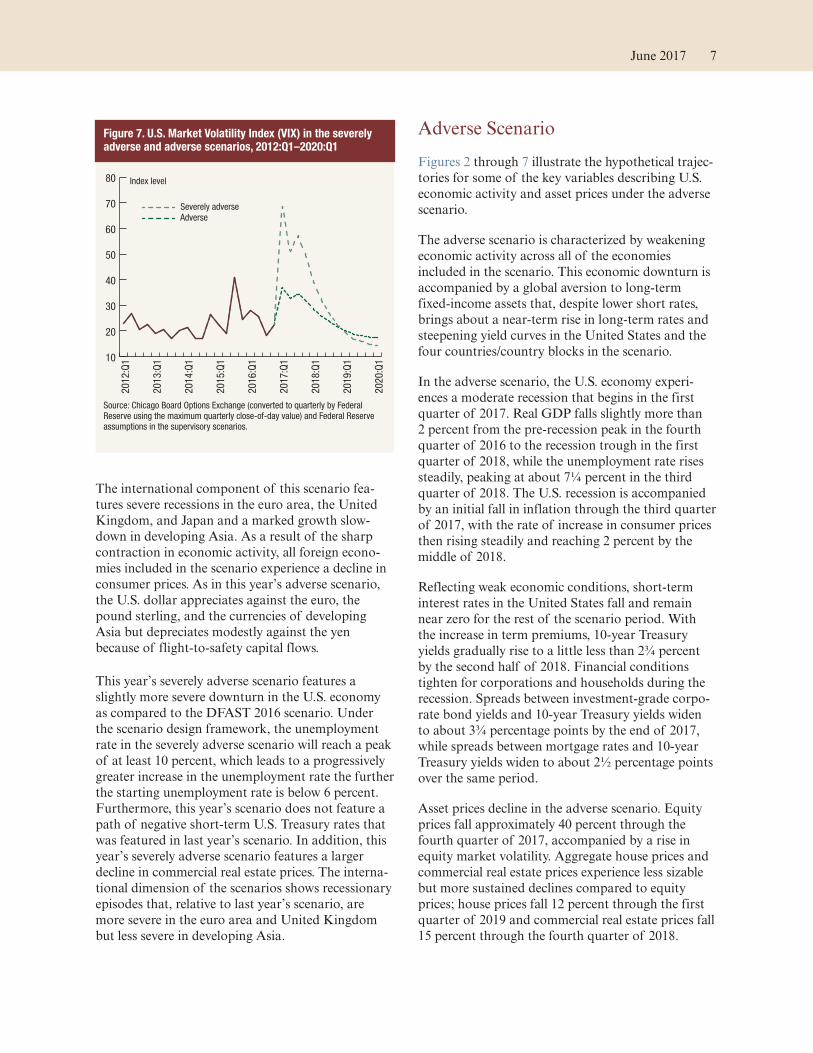
Asset prices drop sharply in this scenario. Equity
prices fall by 50 percent through the end of 2017,
accompanied by a surge in equity market volatility,
which approaches the levels attained in 2008. House
prices and commercial real estate prices also experi-
ence large declines, with house prices and commer-
cial real estate prices falling by 25 percent and 35 per-
cent, respectively, through the first quarter of 2019.
Figure 3. Real GDP growth rate in the severely adverse and adverse scenarios, 2012:Q1–2020:Q1
Severely adverse
Adverse
-8
-7
-6
-5
-4
-3
-2
-1
0
1
2
3
4
5
2020:Q
1
2019:Q
1
2018:Q
1
2017:Q
1
2016:Q
1
2015:Q
1
2014:Q
1
2013:Q
1
2012:Q
1
Percent
Source: Bureau of Economic Analysis and Federal Reserve assumptions in the
supervisory scenarios.
Figure 4. Dow Jones Total Stock Market Index, end of quarter, in the severely adverse and adverse scenarios, 2012:Q1–2020:Q1
5000
10000
15000
20000
25000
2020:Q
1
2019:Q
1
2018:Q
1
2017:Q
1
2016:Q
1
2015:Q
1
2014:Q
1
2013:Q
1
2012:Q
1
Index level
Severely adverse
Adverse
Source: Dow Jones and Federal Reserve assumptions in the supervisory
scenarios.
Figure 5. National House Price Index in the severely adverse and adverse scenarios, 2012:Q1–2020:Q1
100
125
150
175
200
2020
:Q1
2019:Q
1
2018:Q
1
2017:Q
1
2016:Q
1
2015:Q
1
2014:Q
1
2013:Q
1
2012:Q
1
Index level
Severely adverse
Adverse
Source: CoreLogic (seasonally adjusted by Federal Reserve) and Federal Reserve
assumptions in the supervisory scenarios.
Figure 6. U.S. BBB corporate yield, quarterly average in the severely adverse and adverse scenarios, 2012:Q1–2020:Q1
3
4
5
6
7
82020:Q
1
2019:Q
1
2018:Q
1
2017:Q
1
2016:Q
1
2015:Q
1
2014:Q
1
2013:Q
1
2012:Q
1
Severely adverse
Adverse
Percentage yield
Source: Merrill Lynch (adjusted by Federal Reserve using a Nelson-Siegel
smoothed yield curve model) and Federal Reserve assumptions in the supervisory
scenarios.
6 Supervisory Stress Test Methodology and Results
The international component of this scenario fea-
tures severe recessions in the euro area, the United
Kingdom, and Japan and a marked growth slow-
down in developing Asia. As a result of the sharp
contraction in economic activity, all foreign econo-
mies included in the scenario experience a decline in
consumer prices. As in this year’s adverse scenario,
the U.S. dollar appreciates against the euro, the
pound sterling, and the currencies of developing
Asia but depreciates modestly against the yen
because of flight-to-safety capital flows.
This year’s severely adverse scenario features a
slightly more severe downturn in the U.S. economy
as compared to the DFAST 2016 scenario. Under
the scenario design framework, the unemployment
rate in the severely adverse scenario will reach a peak
of at least 10 percent, which leads to a progressively
greater increase in the unemployment rate the further
the starting unemployment rate is below 6 percent.
Furthermore, this year’s scenario does not feature a
path of negative short-term U.S. Treasury rates that
was featured in last year’s scenario. In addition, this
year’s severely adverse scenario features a larger
decline in commercial real estate prices. The interna-
tional dimension of the scenarios shows recessionary
episodes that, relative to last year’s scenario, are
more severe in the euro area and United Kingdom
but less severe in developing Asia.
Adverse Scenario
Figures 2 through 7 illustrate the hypothetical trajec-
tories for some of the key variables describing U.S.
economic activity and asset prices under the adverse
scenario.
The adverse scenario is characterized by weakening
economic activity across all of the economies
included in the scenario. This economic downturn is
accompanied by a global aversion to long-term
fixed-income assets that, despite lower short rates,
brings about a near-term rise in long-term rates and
steepening yield curves in the United States and the
four countries/country blocks in the scenario.
In the adverse scenario, the U.S. economy experi-
ences a moderate recession that begins in the first
quarter of 2017. Real GDP falls slightly more than
2 percent from the pre-recession peak in the fourth
quarter of 2016 to the recession trough in the first
quarter of 2018, while the unemployment rate rises
steadily, peaking at about 7¼ percent in the third
quarter of 2018. The U.S. recession is accompanied
by an initial fall in inflation through the third quarter
of 2017, with the rate of increase in consumer prices
then rising steadily and reaching 2 percent by the
middle of 2018.
Reflecting weak economic conditions, short-term
interest rates in the United States fall and remain
near zero for the rest of the scenario period. With
the increase in term premiums, 10-year Treasury
yields gradually rise to a little less than 2¾ percent
by the second half of 2018. Financial conditions
tighten for corporations and households during the
recession. Spreads between investment-grade corpo-
rate bond yields and 10-year Treasury yields widen
to about 3¾ percentage points by the end of 2017,
while spreads between mortgage rates and 10-year
Treasury yields widen to about 2½ percentage points
over the same period.
Asset prices decline in the adverse scenario. Equity
prices fall approximately 40 percent through the
fourth quarter of 2017, accompanied by a rise in
equity market volatility. Aggregate house prices and
commercial real estate prices experience less sizable
but more sustained declines compared to equity
prices; house prices fall 12 percent through the first
quarter of 2019 and commercial real estate prices fall
15 percent through the fourth quarter of 2018.
Figure 7. U.S. Market Volatility Index (VIX) in the severely adverse and adverse scenarios, 2012:Q1–2020:Q1
10
20
30
40
50
60
70
80
2020:Q
1
2019:Q
1
2018:Q
1
2017:Q
1
2016:Q
1
2015:Q
1
2014:Q
1
2013:Q
1
2012:Q
1
Index level
Severely adverse
Adverse
Source: Chicago Board Options Exchange (converted to quarterly by Federal
Reserve using the maximum quarterly close-of-day value) and Federal Reserve
assumptions in the supervisory scenarios.
June 2017 7
Following the recession in the United States, real
activity picks up slowly at first and then gains
momentum; growth in real U.S. GDP accelerates
from an increase of 1 percent at an annual rate in the
second quarter of 2018 to an increase of 3 percent at
an annual rate by the middle of 2019. The unemploy-
ment rate declines modestly, from its peak of about
7¼ percent in the third quarter of 2018 to under
7 percent by the end of the scenario period. Con-
sumer price inflation remains at roughly 2 percent
from the middle of 2018 through the end of the sce-
nario period. Ten-year Treasury yields show little
change after the second half of 2018 and remain
around 2¾ percent.
Outside of the United States, the adverse scenario
features recessions in the euro area, the United King-
dom, and Japan, as well as below-trend growth in
developing Asia. The declines in activity in the euro
area and the United Kingdom are broadly similar
and less pronounced than in Japan.
Weakness in global demand results in a slowing in
inflation in all of the foreign economies under con-
sideration. Japan experiences outright deflation
through the first quarter of 2019. Reflecting flight-
to-safety capital flows, the U.S. dollar appreciates
against the euro, the pound sterling, and the curren-
cies of developing Asia. The dollar depreciates mod-
estly against the yen, also in line with flight-to-safety
capital flows.
The main difference relative to the 2016 adverse sce-
nario is that this year’s adverse scenario features
higher long-term rates and a steeper yield curve
across all of the economies during the recession.
Another difference from last year’s scenario is the
incidence and extent of deflationary episodes. The
2016 adverse scenario featured wide-spread deflation
across all of the economies included in the scenario.
In this year’s adverse scenario, deflation is regionally
concentrated—more pronounced in Japan, less
severe in the euro area and developing Asia, and
absent in the United Kingdom and United States.
Global Market Shock and Counterparty Default Components
The Federal Reserve applied a global market shock
to the trading portfolios of six BHCs with large trad-
ing and private equity exposures.21 In addition, the
Federal Reserve applied a counterparty default com-
ponent, which assumes the default of a BHC’s larg-
est counterparty under the global market shock, to
the same six BHCs and two other BHCs with sub-
stantial trading, processing, or custodial opera-
tions.22 These components are an add-on to the eco-
nomic conditions and financial market environment
specified in the adverse and severely adverse
scenarios.
The global market shock is a set of instantaneous,
hypothetical shocks to a large set of risk factors.
Generally, these shocks involve large and sudden
changes in asset prices, interest rates, and spreads,
reflecting general market dislocation and heightened
uncertainty.23 The Federal Reserve published the
global market shock for the adverse and severely
adverse scenarios on February 3, 2017; the as-of date
for the global market shock and the counterparty
default is January 3, 2017.
The severely adverse scenario’s global market shock
is designed around three main elements: a sudden
sharp increase in general risk premiums and credit
risk; significant market illiquidity; and the distress of
one or more large entities that rapidly sell a variety
of assets into an already fragile market. Liquidity
deterioration is most severe in those asset markets
that are typically less liquid, such as non-agency
securitized products, corporate debt, and private
equity, and is less pronounced in those markets that
are typically more liquid, such as foreign exchange,
publicly traded equity, and U.S. Treasury markets.
Markets facing a significant deterioration in liquidity
experience conditions that are generally comparable
to the peak-to-trough changes in asset valuations
during the 2007–2009 period. The severity of dete-
21 The six BHCs subject to the global market shock are Bank of America Corporation; Citigroup Inc.; The Goldman Sachs Group, Inc.; JPMorgan Chase & Co.; Morgan Stanley; and Wells Fargo & Co. See 12 CFR 252.54(b)(2).
22 The eight BHCs subject to the counterparty default component are Bank of America Corporation; The Bank of New York Mellon Corporation; Citigroup Inc.; The Goldman Sachs Group, Inc.; JPMorgan Chase & Co.; Morgan Stanley; State Street Corporation; and Wells Fargo & Co. See 12 CFR 252.54(b)(2).
23 See CCAR 2017: Severely Adverse Global Market Shocks at https://www.federalreserve.gov/econres/files/ccar-2017-severely-adverse-market-shocks.xlsx, and CCAR 2017: Adverse Global Market Shocks at https://www.federalreserve.gov/econres/files/ccar-2017-adverse-market-shocks.xlsx.
8 Supervisory Stress Test Methodology and Results
rioration reflects the market conditions that could
occur in the event of a significant pullback in market
liquidity in which market participants are less able to
engage in market transactions that could offset or
moderate the price dislocations. Worsening liquidity
also leads prices of related assets that would ordinar-
ily be expected to move together to diverge markedly.
In particular, the valuation of certain cash market
securities and their derivative counterparts fail to
move together because the normal market mechanics
that would ordinarily result in small pricing differen-
tials are impeded by a lack of market liquidity. Nota-
bly, option-adjusted spreads on agency mortgage-
backed securities (MBSs) increase significantly.
Globally, government bond yield curves undergo
marked shifts in level and shape due to market par-
ticipants’ increased risk aversion. The flight-to-
quality and lack of liquidity in affected markets push
risk-free rates down in the United States. The yield
curves for government bonds flatten or invert across
Europe and Asia while volatility increases across the
term structure. Emerging market countries with dete-
riorating economic and fiscal accounts would also
experience a sharp increase in sovereign spreads.
The major differences between the global market
shock under the 2017 and 2016 severely adverse sce-
narios include (1) dampened shocks to interest rates
and other liquid markets, (2) increased shocks to
select commodities and equities basis risks, and (3) a
less severe widening in spreads between agency
MBSs and to-be-announced (TBA) forwards.
The global market shock component for the adverse
scenario simulates an extended low-growth environ-
ment and muted market volatility across most asset
classes and term structures. Generally, domestic gov-
ernment yields and associated volatility move lower,
while swap spreads widen. Due to reduced demand,
global commodity prices decline moderately, while
MBSs and domestic credit spreads widen moderately.
Select currency markets also experience small flight-
to-quality moves. Equity markets experience a mild
correction with a measured increase in volatility. The
2017 adverse scenario addresses themes similar to
those of the 2016 adverse scenario.
The eight BHCs with substantial trading or custodial
operations were also required to incorporate a coun-
terparty default scenario component into their
supervisory adverse and severely adverse stress sce-
narios. These BHCs were required to estimate and
report the potential losses and related effects on capi-
tal associated with the instantaneous and unexpected
default of the counterparty that would generate the
largest losses across their derivatives and securities
financing activities, including securities lending and
repurchase or reverse-repurchase agreement
activities.
June 2017 9

Supervisory Stress Test Framework and Model Methodology
Analytical Framework
The Federal Reserve estimated the effect of the
supervisory scenarios on the regulatory capital ratios
of the 34 BHCs participating in DFAST 2017 by
projecting the balance sheet, RWAs, net income, and
resulting capital for each BHC over a nine-quarter
planning horizon, which for DFAST 2017 begins in
the first quarter of 2017 and ends in the first quarter
of 2019. Projected net income, adjusted for the effect
of taxes, is combined with capital action assump-
tions to project changes in equity capital. The
approach followed U.S. generally accepted account-
ing principles (GAAP) and regulatory revised capital
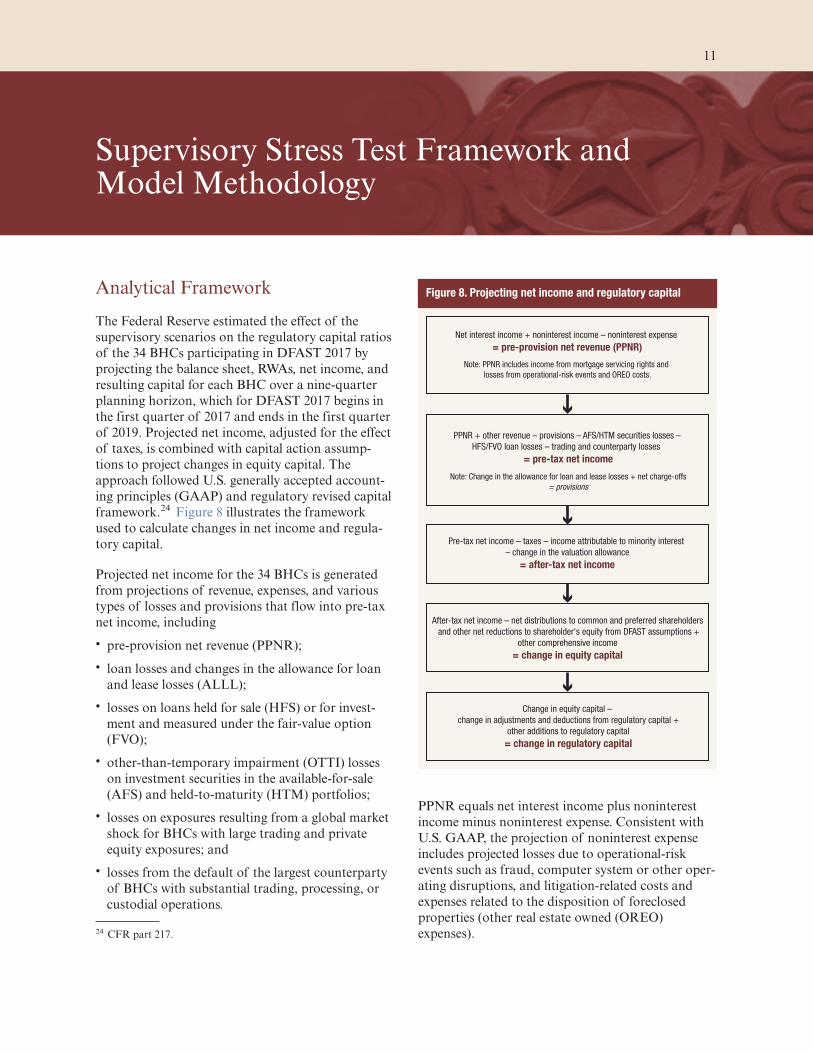
framework.24 Figure 8 illustrates the framework
used to calculate changes in net income and regula-
tory capital.
Projected net income for the 34 BHCs is generated
from projections of revenue, expenses, and various
types of losses and provisions that flow into pre-tax
net income, including
• pre-provision net revenue (PPNR);
• loan losses and changes in the allowance for loan
and lease losses (ALLL);
• losses on loans held for sale (HFS) or for invest-
ment and measured under the fair-value option
(FVO);
• other-than-temporary impairment (OTTI) losses
on investment securities in the available-for-sale
(AFS) and held-to-maturity (HTM) portfolios;
• losses on exposures resulting from a global market
shock for BHCs with large trading and private
equity exposures; and
• losses from the default of the largest counterparty
of BHCs with substantial trading, processing, or
custodial operations.
PPNR equals net interest income plus noninterest
income minus noninterest expense. Consistent with
U.S. GAAP, the projection of noninterest expense
includes projected losses due to operational-risk
events such as fraud, computer system or other oper-
ating disruptions, and litigation-related costs and
expenses related to the disposition of foreclosed
properties (other real estate owned (OREO)
expenses).24 CFR part 217.
Figure 8. Projecting net income and regulatory capital
Net interest income + noninterest income – noninterest expense
= pre-provision net revenue (PPNR)
PPNR + other revenue – provisions – AFS/HTM securities losses –
HFS/FVO loan losses – trading and counterparty losses
= pre-tax net income
Pre-tax net income – taxes – income attributable to minority interest
– change in the valuation allowance
= after-tax net income
After-tax net income – net distributions to common and preferred shareholders
and other net reductions to shareholder's equity from DFAST assumptions +
other comprehensive income
= change in equity capital
Change in equity capital –
change in adjustments and deductions from regulatory capital +
other additions to regulatory capital
= change in regulatory capital
Note: Change in the allowance for loan and lease losses + net charge-offs
= provisions
Note: PPNR includes income from mortgage servicing rights and
losses from operational-risk events and OREO costs.
11
Provisions for loan and lease losses equal projected
loan losses for the quarter plus the amount needed
for the ending ALLL to be at an appropriate level to
account for projected future loan losses. The amount
of provisions over and above loan losses may be
negative, representing a drawdown of the ALLL (an
ALLL release, increasing net income), or positive,
representing a need to build the ALLL (an addi-
tional provision, decreasing net income).
Because the loss projections follow U.S. GAAP and
the Board’s capital adequacy rules, they incorporate
any differences in the way these guidelines recognize
income and losses based on where assets are held on
the BHCs’ balance sheets. As a result, losses pro-
jected for similar or identical assets held in different
portfolios can sometimes differ. For example, losses
on loans held in the accrual portfolio equal credit
losses due to failure to pay obligations (cash flow
losses resulting in net charge-offs). For similar loans
that are held for sale or held for investment and clas-
sified as fair value loans, projected losses represent
the change in fair value of the underlying assets in
the supervisory scenario.
Following this approach, changes in the fair value of
AFS securities and OTTI losses on securities are
separately projected over the nine-quarter planning
horizon. Under U.S. GAAP, changes in the fair value
of AFS securities are reflected in changes in accumu-
lated other comprehensive income (AOCI) but do
not flow through net income. In addition, if a secu-
rity becomes OTTI, all or a portion of the difference
between the fair value and amortized cost of the
security must be recognized in earnings.25 Consistent
with U.S. GAAP, OTTI projections incorporate
other-than-temporary differences between book
value and fair value due to credit impairment but
generally do not incorporate differences reflecting
changes in liquidity or market conditions.
For the six BHCs subject to the global market shock,
the losses on trading and private equity positions as
well as the credit valuation adjustment are projected
assuming an instantaneous re-pricing of these posi-
tions under the global market shock (see Global
Market Shock and Counterparty Default Compo-
nents). Losses from the global market shock are
assumed to occur in the first quarter of the planning
horizon. No subsequent recoveries on these positions
are assumed, nor are there offsetting changes such as
reductions in compensation or other expenses in
reaction to the global market shock. In addition,
incremental losses from potential defaults of obligors
underlying BHCs’ trading positions are projected
over the planning horizon.
For the eight BHCs subject to the counterparty
default component, the losses associated with the
instantaneous and unexpected default of the largest
counterparty across derivatives and securities financ-
ing transaction (SFT) activities are projected. These
losses are assumed to occur in the first quarter of the
planning horizon.
Over the planning horizon, the Federal Reserve proj-
ects quarter-end amounts for the components of the
balance sheet. These projections are made under the
assumption that BHCs maintain their willingness to
lend while demand for credit changes in response to
conditions in the scenario. BHCs are assumed to use
lending standards in line with their long-run behav-
ior. Any new balances implied by these projections
are assumed to have the same risk characteristics as
those held by the BHC at the start of the planning
horizon except for loan age. Where applicable, new
loans are assumed to be current, and BHCs are
assumed not to originate types of loans that are no
longer allowed under various regulations. The Fed-
eral Reserve also incorporates material changes in a
BHC’s business plan, such as a planned merger,
acquisition, consolidation, or divestiture.26 Only
divestitures that had been completed or contractually
agreed to prior to April 5, 2017, are incorporated.
Once adjusted, assets are assumed to grow at the
same rate as the pre-adjusted balance sheet.
Model Methodology
The Federal Reserve’s projections of revenue,
expenses, and various types of losses and provisions
that flow into pre-tax net income are based on data
provided by the 34 BHCs participating in DFAST
2017 and on models developed or selected by Federal
Reserve staff and evaluated by an independent team
of Federal Reserve model reviewers. The models are
intended to capture how the balance sheet, RWAs,
and net income of each BHC would be affected by
the macroeconomic and financial conditions
described in the supervisory scenarios, given the
25 A security is considered impaired when the fair value of the security falls below its amortized cost.
26 The inclusion of the effects of such expected changes to a BHC’s business plan does not—and is not intended to—express a view on the merits of such proposals and is not an approval or non-objection to such plans.
12 Supervisory Stress Test Methodology and Results
characteristics of the BHCs’ loans and securities
portfolios; trading, private equity, and counterparty
exposures from derivatives and SFTs; business activi-
ties; and other relevant factors.27
Detail of model-specific methodology is provided in
appendix B.
Models were developed using multiple data sources,
including pooled historical data from financial insti-
tutions. An industrywide approach was generally
adhered to, in which the estimated model parameters
are the same for all BHCs and reflect the industry-
wide, portfolio-specific, instrument-specific response
to variation in the macroeconomic and financial
market variables. This approach reflects both the
challenge in estimating separate statistically robust
models for each of the 34 BHCs and the desire of the
Federal Reserve not to assume that historical BHC-
specific results will prevail in the future. This means
that the projections made by the Federal Reserve will
not necessarily match similar projections made by
individual BHCs.
The Federal Reserve deviated from the industrywide
modeling approach when the historical data used to
estimate the model were not sufficiently granular to
capture the impact of firm-specific risk factors, and
BHC-specific indicator variables (fixed effects) repre-
senting the firm’s average longer-term history were
more predictive of the firm's future performance
than industry variables. For example, the models to
project components of PPNR feature BHC-specific
indicator variables because available data are not suf-
ficiently granular and a BHC’s own history, after
controlling for structural changes over time, is
proven to be more predictive of the BHC’s revenues
and expenses under stress than industry-level history
(see box 2). In some other cases, such as the projec-
tions of trading and counterparty losses, sensitivities
to risk factors and other information generated by
the BHCs from their internal pricing models are used
due to the lack of position-level data and modeling
complexity.
Loan losses are estimated separately for different cat-
egories of loans, based on the type of obligor (e.g.,
consumer or commercial and industrial), collateral
(e.g., residential real estate, commercial real estate),
loan structure (e.g., revolving credit lines), and
accounting treatment (accrual or fair value). These
categories generally follow the classifications of the
Consolidated Financial Statements for Holding
Companies (FR Y-9C) regulatory report, though
some loss projections are made for more granular
loan categories.
Two general approaches are taken to model losses on
the accrual loan portfolio. In the first approach, the
models estimate expected losses under the macroeco-
nomic scenario. These models generally involve pro-
jections of the probability of default, loss given
default, and exposure at default for each loan or seg-
ment of loans in the portfolio, given conditions in
the scenario. In the second approach, the models
capture the historical behavior of net charge-offs
relative to changes in macroeconomic and financial
market variables.
Accrual loan losses are projected using detailed loan
information, including borrower characteristics, col-
lateral characteristics, characteristics of the loans or
credit facilities, amounts outstanding and yet to be
drawn down (for credit lines), payment history, and
current payment status.
Data are collected on individual loans or credit
facilities for wholesale loan, domestic retail credit
card, and residential mortgage portfolios. For other
domestic and international retail loans, the data are
collected based on segments of the portfolio (e.g.,
segments defined by borrower credit score, geo-
graphic location, and loan-to-value (LTV) ratio).
Losses on retail loans for which a BHC chose the
fair-value option accounting treatment and loans
carried at the lower of cost or market value (i.e.,
loans held for sale and held for investment) are esti-
mated over the nine quarters of the planning horizon
using a duration-based approach. Losses on whole-
sale loans held for sale or measured under the fair-
value option are estimated by revaluing each loan or
commitment each quarter of the planning horizon.
Losses on securities held in the AFS and HTM port-
folios are estimated using models that incorporate
other-than-temporary differences between amortized
cost and fair market value due to credit impairment
but generally do not incorporate differences reflect-
ing changes in liquidity or market conditions. Some
securities, including U.S. Treasury and U.S. govern-
ment agency obligations and U.S. government
agency mortgage-backed securities, are assumed not
to be at risk for the kind of credit impairment that
27 In some cases, the loss models estimated the effect of local-level macroeconomic data, which were projected based on their his-torical covariance with national variables included in the super-visory scenarios.
June 2017 13
results in OTTI charges. For securitized obligations,
models estimate delinquency, default, severity, and
prepayment on the underlying pool of collateral.
OTTI on direct obligations such as corporate bonds
is based on an assessment of the probability of
default or severe credit deterioration of the security
issuer or group of issuers over the planning horizon.
The models use securities data collected at the indi-
vidual security level, including the amortized cost,
market value, and any OTTI taken on the security to
date.
Losses related to the global market shock and the
counterparty default components are estimated
based on BHC-estimated sensitivities to various mar-
ket risk factors, market values, and revaluations of
counterparty exposures and credit valuation adjust-
ment under the global market shock.
PPNR is generally projected using a series of models
that relate the components of a BHC’s revenues and
non-credit-related expenses, expressed as a share of
relevant asset or liability balances, to BHC character-
istics and to macroeconomic variables. Most compo-
nents are projected using data on historical revenues
and operating and other non-credit-related expenses
reported on the FR Y-9C report. Separate data are
collected about BHCs’ historical losses related to
operational-risk events, which are modeled sepa-
rately from other components of PPNR.
The balance sheet projections are derived using a
common framework for determining the effect of the
scenarios on balance sheet growth, and, as noted,
incorporate assumptions about credit supply that
limit aggregate credit contraction. These sets of pro-
jections are based on historical data from the Federal
Box 1. Model Changes for DFAST 2017
Each year, the Federal Reserve has refined both thesubstance and process of the Dodd-Frank Actsupervisory stress tests, including its developmentand enhancement of independent supervisory mod-els. The supervisory stress test models may berevised to reflect advances in modeling techniques,enhancements in response to model validation find-ings, the incorporation of richer and more detaileddata, and identification of more stable models ormodels with improved performance, particularlyunder stressful economic conditions.
For DFAST 2017, the Federal Reserve’s operationalrisk and commercial real estate (CRE) loan lossmodels were enhanced, the mortgage repurchasemodel was retired due to the decline in repurchaserisk, and the supplementary leverage ratio wasadded to the calculation of projected capital. Each ofthese modifications are described in more detailbelow. In addition, the Federal Reserve began tophase in material enhancements to the model thatestimates certain components of PPNR.
In addition to the model changes described below,overall changes in PPNR projections and CRE loanlosses are attributable to several other factors,including portfolio composition changes, changes inthe macroeconomic scenario, and changes in thehistorical data used to estimate the models.
Enhancement of PPNR Models
Operational Risk Model Enhancements
Operational risk events and expenses related tomortgage repurchases represent two significantcomponents of PPNR. For DFAST 2017, the Fed-eral Reserve used an enhanced operational risk
model to capture losses from both of these compo-nents, and discontinued the use of the mortgagerepurchase model used in prior years. Mortgagerepurchase risk has declined in recent years due toimproved underwriting standards and settlementsrelating to representations and warranties for pre-crisis vintages. Further, new data from recent mort-gage repurchase settlements have allowed theoperational risk model to better incorporate mort-gage repurchase risk, reducing the need to have aseparate mortgage repurchase model.
The Federal Reserve’s operational risk model fore-casts losses using an average of estimates from twomodels—a historical simulation model, whichremains unchanged, and a regression-based model,which relates operational risk to economic condi-tions. The regression-based model used in previousstress testing cycles determined total losses fromloss frequency and severity separately. Loss fre-quency was modeled as a function of economic con-ditions, while loss severity was based on a firm-specific, long-run average for each type of opera-tional risk event. This dampened the sensitivity ofprojected losses to economic conditions.
For DFAST 2017, the Federal Reserve used anenhanced regression-based model that forecaststotal losses at the industry level and then distributesthose losses to each firm based on its asset size.The use of the industry model allows the FederalReserve to account for operational-risk losses moreconsistently across BHCs. In addition, this approachsimplifies the methodology and increases the sensi-tivity of projected losses to economic conditions.
(continued on next page)
14 Supervisory Stress Test Methodology and Results
Reserve’s Financial Accounts of the United States
(Z.1) statistical release, which is a quarterly publica-
tion by the Federal Reserve of national flow of
funds, consolidated balance sheet information for
each BHC, and additional data collected by the Fed-
eral Reserve.28
Once pre-tax net income is determined using the
above components, a consistent tax rate is applied to
calculate after-tax net income. After-tax net income
also includes other tax effects, such as changes in the
valuation allowance applied to deferred tax assets
(DTAs) and income attributable to minority
interests.
Model Risk Management, Governance, and Validation
The Federal Reserve places great emphasis on the
credibility of its supervisory stress testing process,
which is supported by a rigorous program of super-
visory model risk management. The Federal
Reserve’s supervisory model risk management pro-
gram includes effective oversight of model develop-
ment to ensure adherence to consistent development
principles; rigorous and independent model valida-
tion; a strong supervisory model governance struc-
ture; and annual communication of the state of
model risk in the overall program to the Board of
Governors. Several aspects of the Federal Reserve’s
supervisory stress testing program, including its
28 Financial Accounts of the United States (Z.1) is available on the Federal Reserve website at www.federalreserve.gov/releases/z1/.
Box 1. Model Changes for DFAST 2017 (continued)
Enhancements to Other PPNR Component Models
The models that estimate certain components ofPPNR—such as net interest income, noninterestincome, and noninterest expense—have beenenhanced for DFAST 2017 to better account for dif-ferences in post-crisis performance across firms.The enhancements to this model and the timelinefor their completion are described in more detail inbox 2.
The enhanced models have material effects on theprojections for individual firms. As a result, the Fed-eral Reserve will phase in the change over twoyears to smooth the effect on post-stress capitalratios. For the 2017 stress test, PPNR estimatesreflect the average of the model used during DFAST2016 and the enhanced model. PPNR estimates forthe 2018 stress test will reflect the updated modelonly.
Impact of Changes to PPNR Models
The combined effect of PPNR model changes inDFAST 2017 is a slight decrease in industry PPNRunder the supervisory severely adverse scenario.However, certain firms experienced materialincreases or decreases in projected PPNR.
CRE Loan Loss Model Enhancement
The CRE loan loss model projects losses on loanscollateralized by income-producing properties aswell as construction and land development loans.The model used in previous stress test cycles reliedon parameters estimated separately, using CapitalAssessments and Stress Testing (FR Y-14Q) data
and commercial mortgage-backed securities data,respectively, to capture the losses from the financialcrisis and more recent times. Assumptions wererequired to combine those parameters in a consis-tent fashion.
For DFAST 2017, the Federal Reserve streamlinedthe estimation process by combining the two data-sets before model estimation. In addition, in the pro-cess of re-estimating the model, the FederalReserve updated the model’s macroeconomic vari-ables to better capture loan losses under stress.
Addition of the Supplementary Leverage Ratio(SLR) to the Calculation of Projected Capital
The calculation of projected capital incorporates afirm’s projected losses, revenue, balances, RWAs,and applicable capital actions to construct projectedsupervisory capital ratios. For DFAST 2017, theFederal Reserve updated the capital calculation toinclude post-stress projections of the SLR. Underthe Federal Reserve’s capital regulations, advancedapproaches BHCs are required to maintain at leasta 3 percent SLR, starting in 2018.
The SLR is defined as tier 1 capital divided by totalleverage exposure, which includes both on- and off-balance sheet items. The calculation of projectedSLR incorporates the projections of tier 1 capital andon-balance sheet assets included in the tier 1 lever-age ratio, as well as the projected path of off-balance sheet exposures. The path of those off-balance sheet items is based on the bank-reportedoff-balance sheet SLR exposure, and is assumed togrow at the supervisory model-projected total assetgrowth rate.
June 2017 15
model risk management framework, have been
reviewed by external parties.
Most of the models used for supervisory stress test-
ing were developed by Federal Reserve staff,
although certain models were developed by third
parties.29 In developing the supervisory models, Fed-
eral Reserve staff draws on economic research as well
as industry practice in modeling the effects of bor-
rower, instrument, collateral characteristics, and
macroeconomic factors on revenues, expenses, and
losses. Three groups are, collectively, responsible for
managing and validating the Federal Reserve’s super-
visory stress testing models: the Model Oversight
Group (MOG), the System Model Validation unit,
and the Supervisory Stress Test Model Governance
Committee.
Supervisory model development, implementation,
and use is overseen by the MOG, a national commit-
tee of senior staff drawn from across the Federal
Reserve System. The MOG strives to produce super-
visory stress test results that reflect likely outcomes
under the supervisory scenarios and ensures that
model design across the system of supervisory stress
testing models result in projections that are
• from an independent supervisory perspective;
• forward-looking and may incorporate outcomes
outside of historical experience, where appropriate;
• based on the same set of models and assumptions
across BHCs;
• generated from simpler and more transparent
approaches, where appropriate;
• stable such that changes in model projections over
time reflect underlying risk factors, scenarios, and
model enhancements, rather than transitory
factors;
29 A list of providers of the proprietary models and data used by the Federal Reserve in connection with DFAST 2017 is avail-able in appendix B. In some instances, the Federal Reserve relies on firm-provided estimates in place of model output.
Box 2. Changes to the Models Used to Estimate PPNR in DFAST 2017
A key component of the DFAST results is pre-provision net revenue (PPNR).1 A firm’s PPNR canoffset losses, and PPNR itself is sensitive to thestate of the economy. As a result, PPNR projectionsare important in assessing whether a firm canabsorb losses and remain adequately capitalizedunder stressful economic conditions.
As noted in box 1, the Federal Reserve hasenhanced the models it uses to estimate PPNR. ForDFAST 2017, the Federal Reserve applied anenhanced operational risk model to capture lossesfrom both operational risk events and expensesrelated to mortgage repurchases, which are bothcomponents of PPNR.2 The Federal Reserve hasalso enhanced models used to estimate other com-ponents of PPNR, key details of which aredescribed below. The Federal Reserve expectsthese changes to lead to more accurate revenueand expense projections under stress.
For other components of PPNR, the projections pre-viously depended on several factors: the firm’s own
performance over the most recent quarter or two;the longer-run average performance of similar firms;and relevant measures of economic conditions, suchas Treasury yields. Enhancements to the models,which project those other components of PPNR, aredescribed below.
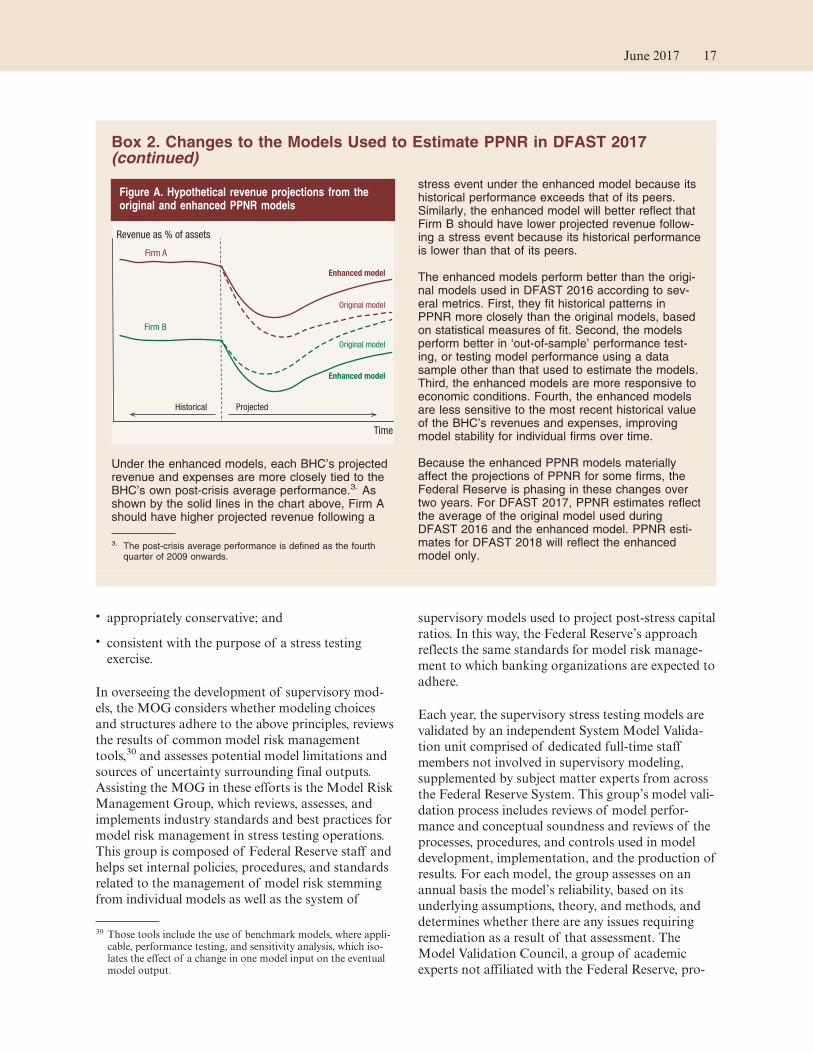
Under the original models—as illustrated in fig-ure A—revenues or expenses for firms with a similarmix of assets would be projected to converge overtime, even if a particular firm had consistently out-performed or underperformed its peers in the past.Since persistent strong or weak performance relativeto peers was not being taken into account, thisapproach somewhat benefitted firms who underper-formed their peers and impaired firms who outper-formed their peers.
In the hypothetical example presented in figure A,although Firm A and Firm B hold similar assets,Firm A consistently earns more revenue than FirmB. The dashed lines represent the projected futurerevenues under the original models, which predictthat the firms’ revenues converge over time. As aresult, the revenue (scaled by assets) of Firm A isprojected to reach a level below its own historicalaverage while the revenue of Firm B is projected toreach a level above its own historical average.
(continued on next page)
1 PPNR is defined as net interest income plus non-interest incomeminus noninterest expense. Specific descriptions of the compo-nents of net interest income, noninterest income, and noninter-est expense can be found in appendix B.
2 The separate mortgage repurchase model has been retired. SeeBox 1 for further information and for a description of theenhanced operational risk model.
16 Supervisory Stress Test Methodology and Results
• appropriately conservative; and
• consistent with the purpose of a stress testing
exercise.
In overseeing the development of supervisory mod-
els, the MOG considers whether modeling choices
and structures adhere to the above principles, reviews
the results of common model risk management
tools,30 and assesses potential model limitations and
sources of uncertainty surrounding final outputs.
Assisting the MOG in these efforts is the Model Risk
Management Group, which reviews, assesses, and
implements industry standards and best practices for
model risk management in stress testing operations.
This group is composed of Federal Reserve staff and
helps set internal policies, procedures, and standards
related to the management of model risk stemming
from individual models as well as the system of
supervisory models used to project post-stress capital
ratios. In this way, the Federal Reserve’s approach
reflects the same standards for model risk manage-
ment to which banking organizations are expected to
adhere.
Each year, the supervisory stress testing models are
validated by an independent System Model Valida-
tion unit comprised of dedicated full-time staff
members not involved in supervisory modeling,
supplemented by subject matter experts from across
the Federal Reserve System. This group’s model vali-
dation process includes reviews of model perfor-
mance and conceptual soundness and reviews of the
processes, procedures, and controls used in model
development, implementation, and the production of
results. For each model, the group assesses on an
annual basis the model’s reliability, based on its
underlying assumptions, theory, and methods, and
determines whether there are any issues requiring
remediation as a result of that assessment. The
Model Validation Council, a group of academic
experts not affiliated with the Federal Reserve, pro-
30 Those tools include the use of benchmark models, where appli-cable, performance testing, and sensitivity analysis, which iso-lates the effect of a change in one model input on the eventual model output.
Box 2. Changes to the Models Used to Estimate PPNR in DFAST 2017(continued)
Under the enhanced models, each BHC’s projectedrevenue and expenses are more closely tied to theBHC’s own post-crisis average performance.3. Asshown by the solid lines in the chart above, Firm Ashould have higher projected revenue following a
stress event under the enhanced model because itshistorical performance exceeds that of its peers.Similarly, the enhanced model will better reflect thatFirm B should have lower projected revenue follow-ing a stress event because its historical performanceis lower than that of its peers.
The enhanced models perform better than the origi-nal models used in DFAST 2016 according to sev-eral metrics. First, they fit historical patterns inPPNR more closely than the original models, basedon statistical measures of fit. Second, the modelsperform better in ‘out-of-sample’ performance test-ing, or testing model performance using a datasample other than that used to estimate the models.Third, the enhanced models are more responsive toeconomic conditions. Fourth, the enhanced modelsare less sensitive to the most recent historical valueof the BHC’s revenues and expenses, improvingmodel stability for individual firms over time.
Because the enhanced PPNR models materiallyaffect the projections of PPNR for some firms, theFederal Reserve is phasing in these changes overtwo years. For DFAST 2017, PPNR estimates reflectthe average of the original model used duringDFAST 2016 and the enhanced model. PPNR esti-mates for DFAST 2018 will reflect the enhancedmodel only.
3. The post-crisis average performance is defined as the fourthquarter of 2009 onwards.
Figure A. Hypothetical revenue projections from theoriginal and enhanced PPNR models
Historical Projected
Time
Revenue as % of assets
Firm A
Enhanced model
Original model
Firm B
Enhanced model
Original model
June 2017 17
vides advice to the Federal Reserve on the validation
program and activities.31
The MOG and the System Model Validation unit are
overseen by the Director of the Federal Reserve
Board’s Division of Supervision and Regulation.
The Supervisory Stress Test Model Governance
Committee, a committee of senior Federal Reserve
staff that includes representatives from model devel-
opment, implementation, and validation, advises the
Director on matters related to the governance of
supervisory stress test models and facilitates the
Director’s oversight role by providing a regular
forum to present and discuss relevant issues. This
committee also identifies key model risk issues in the
supervisory stress testing program and elevates these
issues to the Director and the Board of Governors.
In 2016, the committee initiated an annual formal
communication to the Board of Governors on the
structure of the supervisory stress test model risk
management program and the state of model risk as
determined by each year's model validation process.
The development and validation of the supervisory
stress testing models have been subject to rigorous
review by both internal and external parties. In 2015,
the Federal Reserve Office of the Inspector General
(OIG) reviewed supervisory stress testing model vali-
dation activities and recommended improvements in
staffing, model inventories, and communication with
management.32 As of this year, each of the suggested
improvements recommended by the OIG have been
implemented, and the OIG has formally closed its
findings. In 2016, the Government Accountability
Office (GAO) issued a report on the Federal
Reserve’s stress testing and capital planning pro-
grams.33 The GAO’s report recognized that the Fed-
eral Reserve’s stress testing program has played a key
role in evaluating and maintaining the stability of the
U.S. financial system during and since the most
recent financial crisis. The GAO report included five
recommendations as to how the Federal Reserve
could improve its management of model risk and
ensure that decisions based on supervisory stress test
results are informed by an understanding of model
risk. The Federal Reserve is actively addressing these
recommendations and views these evaluations as
opportunities to continue to strengthen the credibil-
ity of the supervisory stress test.
Data Inputs
The models are developed and implemented with
data collected by the Federal Reserve on regulatory
reports as well as proprietary third-party industry
data.
Certain projections rely on aggregate information
from the Financial Accounts of the United States
(Z.1) statistical release. Others rely on the FR Y-9C
report, which contains consolidated income state-
ment and balance sheet information for each BHC.
Additionally, FR Y-9C includes off-balance sheet
items and other supporting schedules, such as the
components of RWAs and regulatory capital.
Most of the data used in the Federal Reserve’s stress
test projections are collected through the Capital
Assessments and Stress Testing (FR Y-14A/Q/M)
information collection, which include a set of
annual, quarterly, or monthly schedules.34 These
reports collect detailed data on PPNR, loans, securi-
ties, trading and counterparty risk, losses related to
operational-risk events, and business plan changes.
Each of the 34 BHCs participating in DFAST 2017
submitted data as of December 31, 2016, through
the FR Y-14M and FR Y-14Q reports in February,
March, and April 2017. The same BHCs submitted
the FR Y-14A reports, which also include projected
data, on April 5, 2017.
BHCs were required to submit detailed loan and
securities information for all material portfolios,
where the portfolio is deemed to be “material” if the
size of the portfolio exceeds either 5 percent of the
BHC’s tier 1 capital or $5 billion for LISCC and
large and complex firms. Portfolios are deemed to be
material for large and noncomplex firms if the size of
the portfolio exceeds either 10 percent of the BHC’s
tier 1 capital or $5 billion.35 The portfolio categories
31 See “Federal Reserve Board announces the formation of the Model Validation Council,” April 20, 2012, https://www.federalreserve.gov/newsevents/pressreleases/bcreg20120420a.htm.
32 See “The Board Identified Areas of Improvement for Its Super-visory Stress Testing Model Validation Activities, and Opportu-nities Exist for Further Enhancement,” October 29, 2015, https://oig.federalreserve.gov/reports/board-supervisory-stress-testing-model-validation-reissue-oct2015.pdf.
33 See “Additional Actions Could Help Ensure the Achievement of Stress Test Goals,” GAO-17-48, November 2016, https://www.gao.gov/assets/690/681020.pdf.
34 The FR Y-14 reports are available on the Federal Reserve web-site at www.federalreserve.gov/apps/reportforms/default.aspx.
35 The Federal Reserve raised the immateriality threshold for large and noncomplex firms from 5 percent of tier 1 capital or $5 bil-lion to 10 percent of tier 1 capital or $5 billion. See Amend-ments to the Capital Plan and Stress Test Rules, 82 Fed. Reg.
18 Supervisory Stress Test Methodology and Results
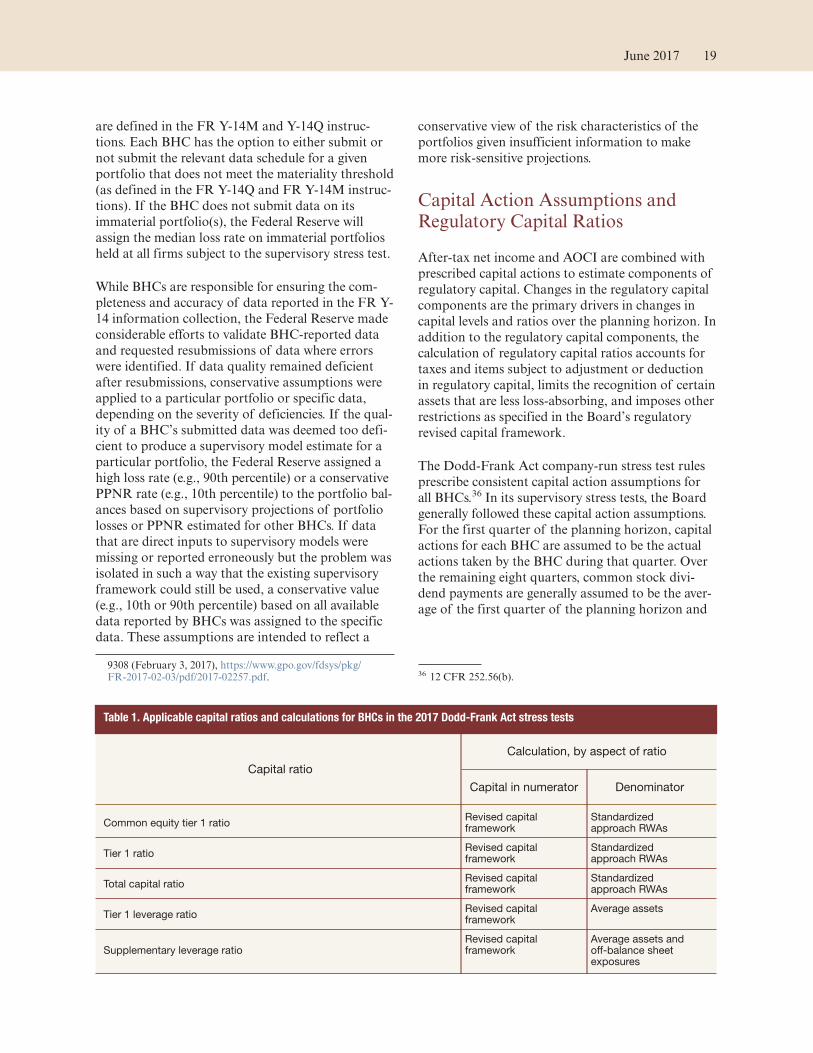
are defined in the FR Y-14M and Y-14Q instruc-
tions. Each BHC has the option to either submit or
not submit the relevant data schedule for a given
portfolio that does not meet the materiality threshold
(as defined in the FR Y-14Q and FR Y-14M instruc-
tions). If the BHC does not submit data on its
immaterial portfolio(s), the Federal Reserve will
assign the median loss rate on immaterial portfolios
held at all firms subject to the supervisory stress test.
While BHCs are responsible for ensuring the com-
pleteness and accuracy of data reported in the FR Y-
14 information collection, the Federal Reserve made
considerable efforts to validate BHC-reported data
and requested resubmissions of data where errors
were identified. If data quality remained deficient
after resubmissions, conservative assumptions were
applied to a particular portfolio or specific data,
depending on the severity of deficiencies. If the qual-
ity of a BHC’s submitted data was deemed too defi-
cient to produce a supervisory model estimate for a
particular portfolio, the Federal Reserve assigned a
high loss rate (e.g., 90th percentile) or a conservative
PPNR rate (e.g., 10th percentile) to the portfolio bal-
ances based on supervisory projections of portfolio
losses or PPNR estimated for other BHCs. If data
that are direct inputs to supervisory models were
missing or reported erroneously but the problem was
isolated in such a way that the existing supervisory
framework could still be used, a conservative value
(e.g., 10th or 90th percentile) based on all available
data reported by BHCs was assigned to the specific
data. These assumptions are intended to reflect a
conservative view of the risk characteristics of the
portfolios given insufficient information to make
more risk-sensitive projections.
Capital Action Assumptions and Regulatory Capital Ratios
After-tax net income and AOCI are combined with
prescribed capital actions to estimate components of
regulatory capital. Changes in the regulatory capital
components are the primary drivers in changes in
capital levels and ratios over the planning horizon. In
addition to the regulatory capital components, the
calculation of regulatory capital ratios accounts for
taxes and items subject to adjustment or deduction
in regulatory capital, limits the recognition of certain
assets that are less loss-absorbing, and imposes other
restrictions as specified in the Board’s regulatory
revised capital framework.
The Dodd-Frank Act company-run stress test rules
prescribe consistent capital action assumptions for
all BHCs.36 In its supervisory stress tests, the Board
generally followed these capital action assumptions.
For the first quarter of the planning horizon, capital
actions for each BHC are assumed to be the actual
actions taken by the BHC during that quarter. Over
the remaining eight quarters, common stock divi-
dend payments are generally assumed to be the aver-
age of the first quarter of the planning horizon and
9308 (February 3, 2017), https://www.gpo.gov/fdsys/pkg/FR-2017-02-03/pdf/2017-02257.pdf. 36 12 CFR 252.56(b).
Table 1. Applicable capital ratios and calculations for BHCs in the 2017 Dodd-Frank Act stress tests
Capital ratio
Calculation, by aspect of ratio
Capital in numerator Denominator
Common equity tier 1 ratio Revised capital framework
Standardized approach RWAs
Tier 1 ratio Revised capital framework
Standardized approach RWAs
Total capital ratio Revised capital framework
Standardized approach RWAs
Tier 1 leverage ratio Revised capital framework
Average assets
Supplementary leverage ratio Revised capital framework
Average assets and off-balance sheet exposures
June 2017 19
the three preceding calendar quarters.37 Also, BHCs
are assumed to pay scheduled dividend, interest, or
principal payments on any other capital instrument
eligible for inclusion in the numerator of a regulatory
capital ratio. However, repurchases of such capital
instruments and issuance of stock are assumed to be
zero, except for issuance of common or preferred
stock associated with expensed employee compensa-
tion or in connection with a planned merger or
acquisition.
The five regulatory capital measures in DFAST 2017
are the common equity tier 1, tier 1 risk-based capi-
tal, total risk-based capital, tier 1 leverage, and
supplementary leverage ratios. A BHC’s regulatory
capital ratios are calculated in accordance with the
Board’s regulatory capital rules using Federal
Reserve projections of assets, RWAs, and off-balance
sheet exposures.
The denominator of each BHC’s regulatory capital
ratios, other than the leverage ratios, was calculated
using the standardized approach for calculating
RWAs for each quarter of the planning horizon in
accordance with the transition arrangements in the
Board’s capital rules.38
37 Additionally, common stock dividends attributable to issuances related to expensed employee compensation or in connection with a planned merger or acquisition are included to the extent that they are reflected in the BHC’s pro forma balance sheet estimates. This assumption provides consistency with assump-tions regarding issuance of common stock.
38 See 12 CFR 252.42(m); 80 Fed. Reg. 75,419; 12 CFR part 217, subpart G.
20 Supervisory Stress Test Methodology and Results
Supervisory Stress Test Results
This section describes the Federal Reserve’s projec-
tions of RWAs, losses, revenues, expenses, and capital
positions for the 34 BHCs participating in DFAST
2017 under the severely adverse and adverse sce-
narios. Results are presented both in the aggregate
for the 34 BHCs and for individual BHCs. The
aggregate results provide a sense of the stringency of
the adverse and severely adverse scenario projections
and the sensitivities of losses, revenues, and capital at
these BHCs as a group to the stressed economic and
financial market conditions contained in those sce-
narios. The range of results across individual BHCs
reflects differences in business focus, asset composi-
tion, revenue and expense sources, and portfolio risk
characteristics. The comprehensive results for indi-
vidual BHCs are reported in Appendix C.
Year-over-year changes in supervisory stress test
results reflect changes in
• BHC starting capital positions;
• scenarios used for the supervisory stress test;
• portfolio composition and risk characteristics; and
• models used in the supervisory stress test.
In the aggregate, changes in portfolio composition
and risk characteristics have contributed to lower
loss rates in DFAST 2017 compared to DFAST
2016. However, the trend varied across the firms. In
the aggregate, DFAST firms have increased the share
of agency MBS and Treasuries in their securities
portfolios and have reduced the holdings of less liq-
uid assets like securitized products in their trading
portfolios. Overall loan portfolios have grown, driven
by strong growth in corporate, commercial real
estate, and credit card loans. Residential mortgage
growth lagged behind the overall loan growth, as
healthy growth in first-lien mortgages was offset by a
notable decline in home equity loans. The credit
quality of some loan portfolios, including first-lien
mortgages and commercial mortgages, has improved,
in large part due to recent rises in real estate prices.
However, improvements in portfolios collateralized
by real estate were partially offset by continued stress
on certain corporate loans due to persistently low oil
prices and a recent uptick in delinquency rates in
credit card portfolios.
Severely Adverse Scenario
Stressed Regulatory Capital Ratios and
Risk-Weighted Assets
The projections suggest declines in capital ratios for
all the BHCs under the severely adverse scenario. In
the aggregate, each of the four capital ratios calcu-
lated in the fourth quarter of 2016 declines over the
course of the planning horizon, with first-quarter
2019 levels ranging from 2.1 percentage points to
3.2 percentage points lower than at the start of the
planning horizon (see table 2).39 Tables 4.A, 4.B, and
4.C present these ratios for each of the 34 BHCs.
The changes in post-stress capital ratios vary consid-
erably across BHCs (see figure 10). The capital ratios
for all firms decline over the course of the planning
horizon. The post-stress capital ratios incorporate
Federal Reserve projections of the levels of total
average assets and RWAs over the planning horizon.
Declines in capital ratios in part reflect an increase in
projected RWAs over the planning horizon. The
increase in RWAs reflects projected asset and loan
growth in the scenario and the impact of the scenar-
io’s assumed increase in equity market volatility on
market risk-weighted assets (MRWAs) at firms with
large trading portfolios.
Projected Losses
The Federal Reserve projects that the 34 BHCs as a
group would experience significant losses on posi-
tions and loans under the severely adverse scenario.
39 In table 2, the decline from starting to ending aggregate tier 1 leverage ratio is 2.2 percentage points. The difference is due to rounding.
21
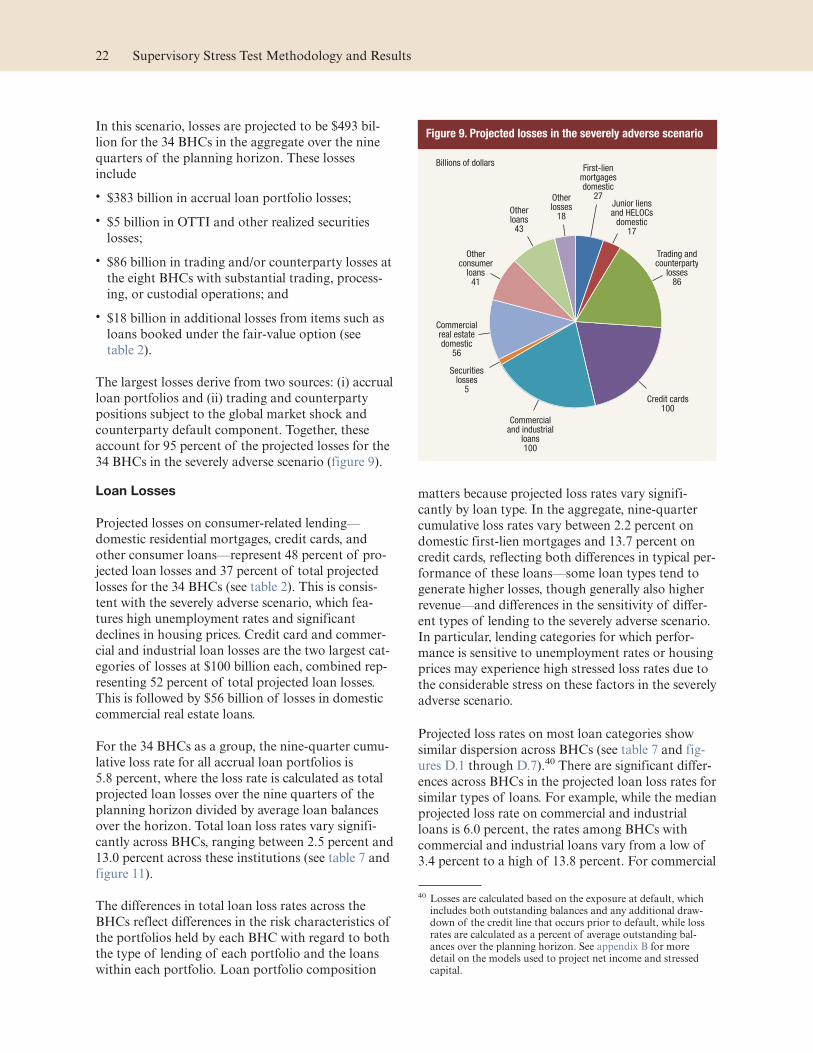
In this scenario, losses are projected to be $493 bil-
lion for the 34 BHCs in the aggregate over the nine
quarters of the planning horizon. These losses
include
• $383 billion in accrual loan portfolio losses;
• $5 billion in OTTI and other realized securities
losses;
• $86 billion in trading and/or counterparty losses at
the eight BHCs with substantial trading, process-
ing, or custodial operations; and
• $18 billion in additional losses from items such as
loans booked under the fair-value option (see
table 2).
The largest losses derive from two sources: (i) accrual
loan portfolios and (ii) trading and counterparty
positions subject to the global market shock and
counterparty default component. Together, these
account for 95 percent of the projected losses for the
34 BHCs in the severely adverse scenario (figure 9).
Loan Losses
Projected losses on consumer-related lending—
domestic residential mortgages, credit cards, and
other consumer loans—represent 48 percent of pro-
jected loan losses and 37 percent of total projected
losses for the 34 BHCs (see table 2). This is consis-
tent with the severely adverse scenario, which fea-
tures high unemployment rates and significant
declines in housing prices. Credit card and commer-
cial and industrial loan losses are the two largest cat-
egories of losses at $100 billion each, combined rep-
resenting 52 percent of total projected loan losses.
This is followed by $56 billion of losses in domestic
commercial real estate loans.
For the 34 BHCs as a group, the nine-quarter cumu-
lative loss rate for all accrual loan portfolios is
5.8 percent, where the loss rate is calculated as total
projected loan losses over the nine quarters of the
planning horizon divided by average loan balances
over the horizon. Total loan loss rates vary signifi-
cantly across BHCs, ranging between 2.5 percent and
13.0 percent across these institutions (see table 7 and
figure 11).
The differences in total loan loss rates across the
BHCs reflect differences in the risk characteristics of
the portfolios held by each BHC with regard to both
the type of lending of each portfolio and the loans
within each portfolio. Loan portfolio composition
matters because projected loss rates vary signifi-
cantly by loan type. In the aggregate, nine-quarter
cumulative loss rates vary between 2.2 percent on
domestic first-lien mortgages and 13.7 percent on
credit cards, reflecting both differences in typical per-
formance of these loans—some loan types tend to
generate higher losses, though generally also higher
revenue—and differences in the sensitivity of differ-
ent types of lending to the severely adverse scenario.
In particular, lending categories for which perfor-
mance is sensitive to unemployment rates or housing
prices may experience high stressed loss rates due to
the considerable stress on these factors in the severely
adverse scenario.
Projected loss rates on most loan categories show
similar dispersion across BHCs (see table 7 and fig-
ures D.1 through D.7).40 There are significant differ-
ences across BHCs in the projected loan loss rates for
similar types of loans. For example, while the median
projected loss rate on commercial and industrial
loans is 6.0 percent, the rates among BHCs with
commercial and industrial loans vary from a low of
3.4 percent to a high of 13.8 percent. For commercial
40 Losses are calculated based on the exposure at default, which includes both outstanding balances and any additional draw-down of the credit line that occurs prior to default, while loss rates are calculated as a percent of average outstanding bal-ances over the planning horizon. See appendix B for more detail on the models used to project net income and stressed capital.
Figure 9. Projected losses in the severely adverse scenario
Billions of dollars
Otherlosses
18Otherloans
43
Otherconsumer
loans41
Commercialreal estatedomestic
56
Securitieslosses
5
Commercialand industrial
loans100
Credit cards100
Trading andcounterparty
losses86
Junior liensand HELOCs
domestic17
First-lienmortgagesdomestic
27
22 Supervisory Stress Test Methodology and Results
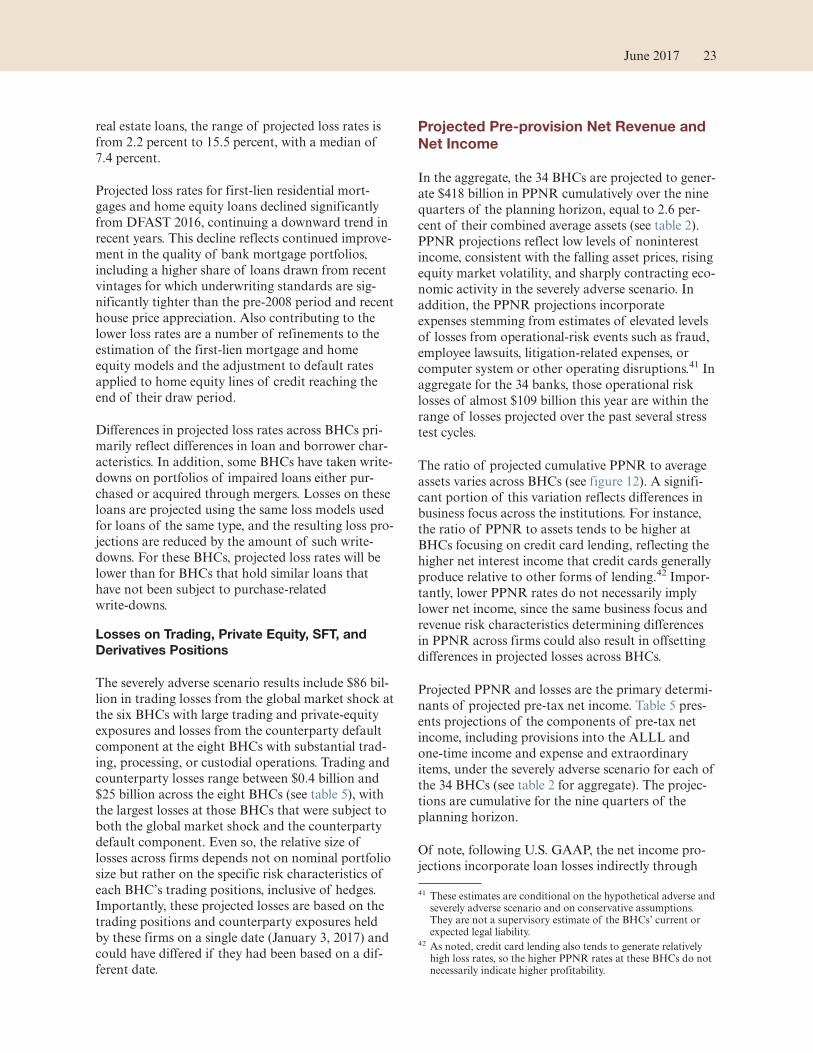
real estate loans, the range of projected loss rates is
from 2.2 percent to 15.5 percent, with a median of
7.4 percent.
Projected loss rates for first-lien residential mort-
gages and home equity loans declined significantly
from DFAST 2016, continuing a downward trend in
recent years. This decline reflects continued improve-
ment in the quality of bank mortgage portfolios,
including a higher share of loans drawn from recent
vintages for which underwriting standards are sig-
nificantly tighter than the pre-2008 period and recent
house price appreciation. Also contributing to the
lower loss rates are a number of refinements to the
estimation of the first-lien mortgage and home
equity models and the adjustment to default rates
applied to home equity lines of credit reaching the
end of their draw period.
Differences in projected loss rates across BHCs pri-
marily reflect differences in loan and borrower char-
acteristics. In addition, some BHCs have taken write-
downs on portfolios of impaired loans either pur-
chased or acquired through mergers. Losses on these
loans are projected using the same loss models used
for loans of the same type, and the resulting loss pro-
jections are reduced by the amount of such write-
downs. For these BHCs, projected loss rates will be
lower than for BHCs that hold similar loans that
have not been subject to purchase-related
write-downs.
Losses on Trading, Private Equity, SFT, and
Derivatives Positions
The severely adverse scenario results include $86 bil-
lion in trading losses from the global market shock at
the six BHCs with large trading and private-equity
exposures and losses from the counterparty default
component at the eight BHCs with substantial trad-
ing, processing, or custodial operations. Trading and
counterparty losses range between $0.4 billion and
$25 billion across the eight BHCs (see table 5), with
the largest losses at those BHCs that were subject to
both the global market shock and the counterparty
default component. Even so, the relative size of
losses across firms depends not on nominal portfolio
size but rather on the specific risk characteristics of
each BHC’s trading positions, inclusive of hedges.
Importantly, these projected losses are based on the
trading positions and counterparty exposures held
by these firms on a single date (January 3, 2017) and
could have differed if they had been based on a dif-
ferent date.
Projected Pre-provision Net Revenue and
Net Income
In the aggregate, the 34 BHCs are projected to gener-
ate $418 billion in PPNR cumulatively over the nine
quarters of the planning horizon, equal to 2.6 per-
cent of their combined average assets (see table 2).
PPNR projections reflect low levels of noninterest
income, consistent with the falling asset prices, rising
equity market volatility, and sharply contracting eco-
nomic activity in the severely adverse scenario. In
addition, the PPNR projections incorporate
expenses stemming from estimates of elevated levels
of losses from operational-risk events such as fraud,
employee lawsuits, litigation-related expenses, or
computer system or other operating disruptions.41 In
aggregate for the 34 banks, those operational risk
losses of almost $109 billion this year are within the
range of losses projected over the past several stress
test cycles.
The ratio of projected cumulative PPNR to average
assets varies across BHCs (see figure 12). A signifi-
cant portion of this variation reflects differences in
business focus across the institutions. For instance,
the ratio of PPNR to assets tends to be higher at
BHCs focusing on credit card lending, reflecting the
higher net interest income that credit cards generally
produce relative to other forms of lending.42 Impor-
tantly, lower PPNR rates do not necessarily imply
lower net income, since the same business focus and
revenue risk characteristics determining differences
in PPNR across firms could also result in offsetting
differences in projected losses across BHCs.
Projected PPNR and losses are the primary determi-
nants of projected pre-tax net income. Table 5 pres-
ents projections of the components of pre-tax net
income, including provisions into the ALLL and
one-time income and expense and extraordinary
items, under the severely adverse scenario for each of
the 34 BHCs (see table 2 for aggregate). The projec-
tions are cumulative for the nine quarters of the
planning horizon.
Of note, following U.S. GAAP, the net income pro-
jections incorporate loan losses indirectly through
41 These estimates are conditional on the hypothetical adverse and severely adverse scenario and on conservative assumptions. They are not a supervisory estimate of the BHCs’ current or expected legal liability.
42 As noted, credit card lending also tends to generate relatively high loss rates, so the higher PPNR rates at these BHCs do not necessarily indicate higher profitability.
June 2017 23
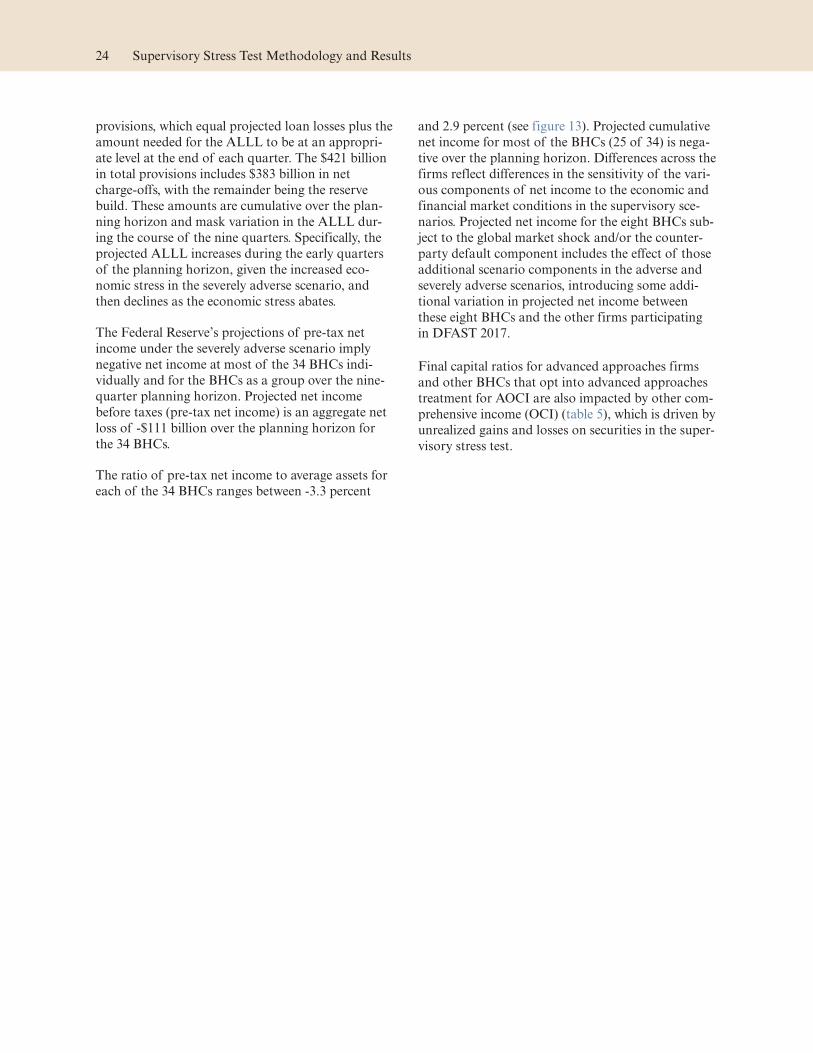
provisions, which equal projected loan losses plus the
amount needed for the ALLL to be at an appropri-
ate level at the end of each quarter. The $421 billion
in total provisions includes $383 billion in net
charge-offs, with the remainder being the reserve
build. These amounts are cumulative over the plan-
ning horizon and mask variation in the ALLL dur-
ing the course of the nine quarters. Specifically, the
projected ALLL increases during the early quarters
of the planning horizon, given the increased eco-
nomic stress in the severely adverse scenario, and
then declines as the economic stress abates.
The Federal Reserve’s projections of pre-tax net
income under the severely adverse scenario imply
negative net income at most of the 34 BHCs indi-
vidually and for the BHCs as a group over the nine-
quarter planning horizon. Projected net income
before taxes (pre-tax net income) is an aggregate net
loss of -$111 billion over the planning horizon for
the 34 BHCs.
The ratio of pre-tax net income to average assets for
each of the 34 BHCs ranges between -3.3 percent
and 2.9 percent (see figure 13). Projected cumulative
net income for most of the BHCs (25 of 34) is nega-
tive over the planning horizon. Differences across the
firms reflect differences in the sensitivity of the vari-
ous components of net income to the economic and
financial market conditions in the supervisory sce-
narios. Projected net income for the eight BHCs sub-
ject to the global market shock and/or the counter-
party default component includes the effect of those
additional scenario components in the adverse and
severely adverse scenarios, introducing some addi-
tional variation in projected net income between
these eight BHCs and the other firms participating
in DFAST 2017.
Final capital ratios for advanced approaches firms
and other BHCs that opt into advanced approaches
treatment for AOCI are also impacted by other com-
prehensive income (OCI) (table 5), which is driven by
unrealized gains and losses on securities in the super-
visory stress test.
24 Supervisory Stress Test Methodology and Results
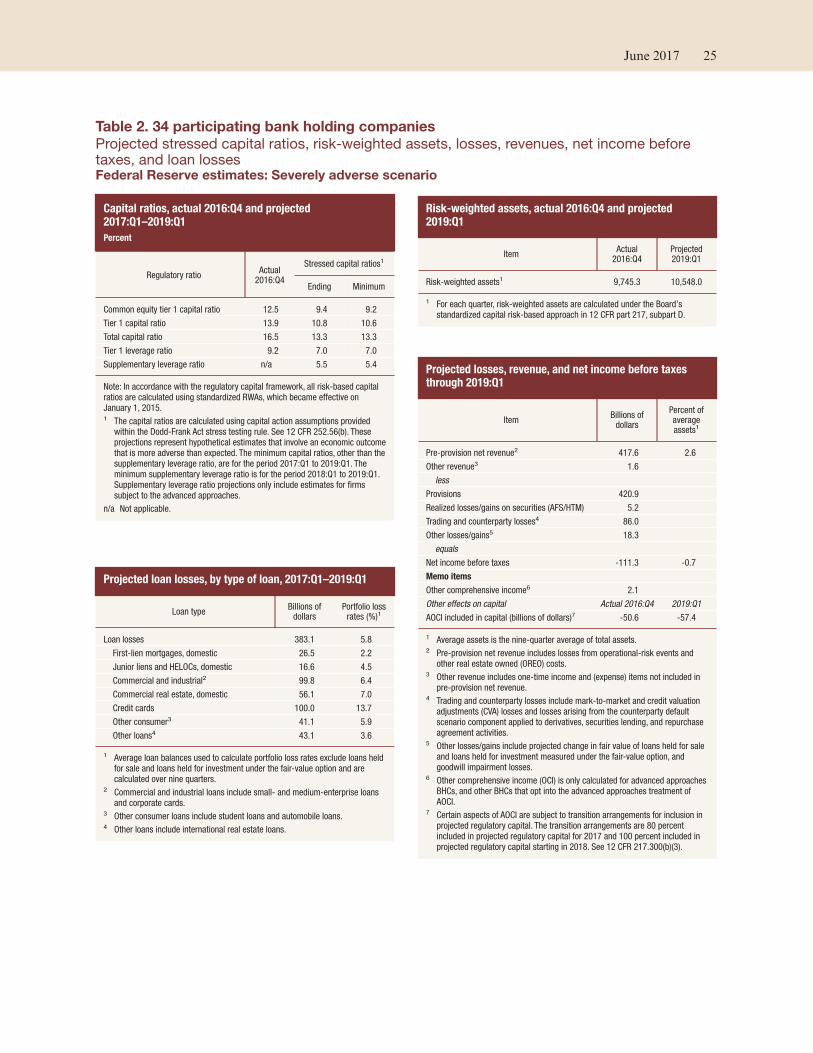
Table 2. 34 participating bank holding companies
Projected stressed capital ratios, risk-weighted assets, losses, revenues, net income before taxes, and loan losses Federal Reserve estimates: Severely adverse scenario
Capital ratios, actual 2016:Q4 and projected 2017:Q1–2019:Q1
Percent
Regulatory ratio Actual
2016:Q4
Stressed capital ratios1
Ending Minimum
Common equity tier 1 capital ratio 12.5 9.4 9.2
Tier 1 capital ratio 13.9 10.8 10.6
Total capital ratio 16.5 13.3 13.3
Tier 1 leverage ratio 9.2 7.0 7.0
Supplementary leverage ratio n/a 5.5 5.4
Note: In accordance with the regulatory capital framework, all risk-based capital
ratios are calculated using standardized RWAs, which became effective on
January 1, 2015.1 The capital ratios are calculated using capital action assumptions provided
within the Dodd-Frank Act stress testing rule. See 12 CFR 252.56(b). These
projections represent hypothetical estimates that involve an economic outcome
that is more adverse than expected. The minimum capital ratios, other than the
supplementary leverage ratio, are for the period 2017:Q1 to 2019:Q1. The
minimum supplementary leverage ratio is for the period 2018:Q1 to 2019:Q1.
Supplementary leverage ratio projections only include estimates for firms
subject to the advanced approaches.
n/a Not applicable.
Projected loan losses, by type of loan, 2017:Q1–2019:Q1
Loan type Billions of
dollars Portfolio loss
rates (%)1
Loan losses 383.1 5.8
First-lien mortgages, domestic 26.5 2.2
Junior liens and HELOCs, domestic 16.6 4.5
Commercial and industrial2 99.8 6.4
Commercial real estate, domestic 56.1 7.0
Credit cards 100.0 13.7
Other consumer3 41.1 5.9
Other loans4 43.1 3.6
1 Average loan balances used to calculate portfolio loss rates exclude loans held
for sale and loans held for investment under the fair-value option and are
calculated over nine quarters.2 Commercial and industrial loans include small- and medium-enterprise loans
and corporate cards.3 Other consumer loans include student loans and automobile loans.4 Other loans include international real estate loans.
Risk-weighted assets, actual 2016:Q4 and projected 2019:Q1
Item Actual
2016:Q4 Projected 2019:Q1
Risk-weighted assets1 9,745.3 10,548.0
1 For each quarter, risk-weighted assets are calculated under the Board's
standardized capital risk-based approach in 12 CFR part 217, subpart D.
Projected losses, revenue, and net income before taxes through 2019:Q1
Item Billions of
dollars
Percent of average assets1
Pre-provision net revenue2 417.6 2.6
Other revenue3 1.6
less
Provisions 420.9
Realized losses/gains on securities (AFS/HTM) 5.2
Trading and counterparty losses4 86.0
Other losses/gains5 18.3
equals
Net income before taxes -111.3 -0.7
Memo items
Other comprehensive income6 2.1
Other effects on capital Actual 2016:Q4 2019:Q1
AOCI included in capital (billions of dollars)7 -50.6 -57.4
1 Average assets is the nine-quarter average of total assets.2 Pre-provision net revenue includes losses from operational-risk events and
other real estate owned (OREO) costs.3 Other revenue includes one-time income and (expense) items not included in
pre-provision net revenue.4 Trading and counterparty losses include mark-to-market and credit valuation
adjustments (CVA) losses and losses arising from the counterparty default
scenario component applied to derivatives, securities lending, and repurchase
agreement activities.5 Other losses/gains include projected change in fair value of loans held for sale
and loans held for investment measured under the fair-value option, and
goodwill impairment losses.6 Other comprehensive income (OCI) is only calculated for advanced approaches
BHCs, and other BHCs that opt into the advanced approaches treatment of
AOCI.7 Certain aspects of AOCI are subject to transition arrangements for inclusion in
projected regulatory capital. The transition arrangements are 80 percent
included in projected regulatory capital for 2017 and 100 percent included in
projected regulatory capital starting in 2018. See 12 CFR 217.300(b)(3).
June 2017 25
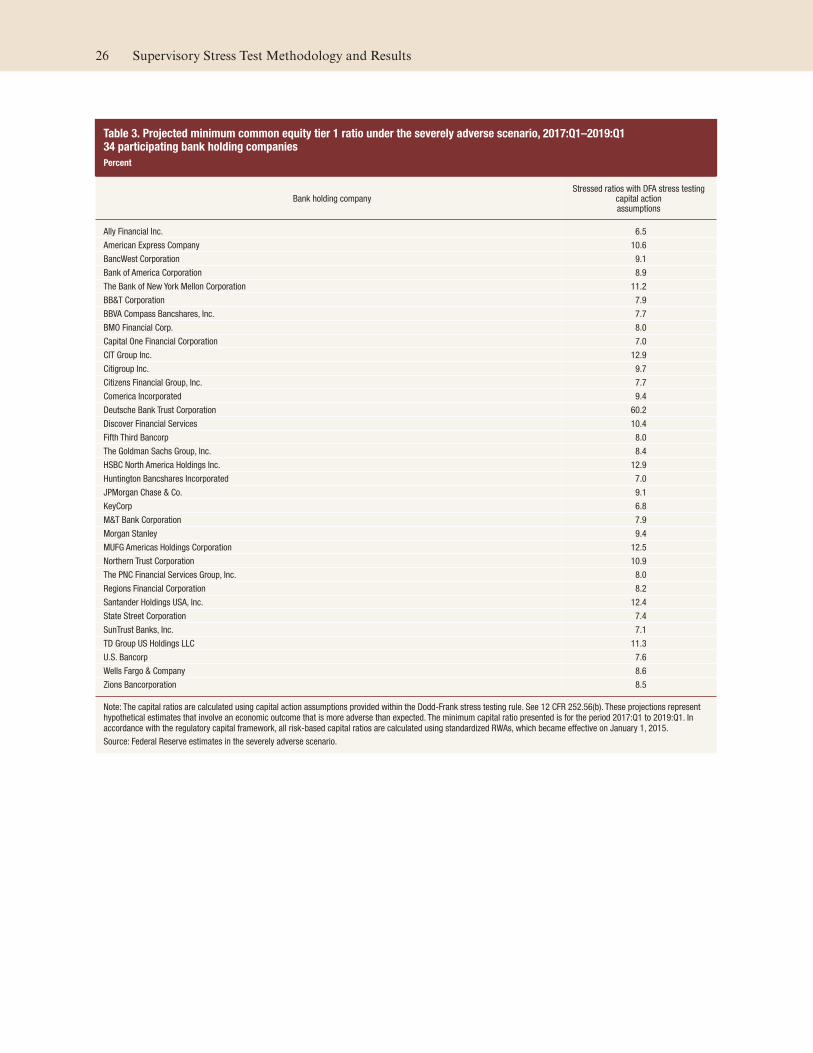
Table 3. Projected minimum common equity tier 1 ratio under the severely adverse scenario, 2017:Q1–2019:Q1 34 participating bank holding companies
Percent
Bank holding company Stressed ratios with DFA stress testing
capital action assumptions
Ally Financial Inc. 6.5
American Express Company 10.6
BancWest Corporation 9.1
Bank of America Corporation 8.9
The Bank of New York Mellon Corporation 11.2
BB&T Corporation 7.9
BBVA Compass Bancshares, Inc. 7.7
BMO Financial Corp. 8.0
Capital One Financial Corporation 7.0
CIT Group Inc. 12.9
Citigroup Inc. 9.7
Citizens Financial Group, Inc. 7.7
Comerica Incorporated 9.4
Deutsche Bank Trust Corporation 60.2
Discover Financial Services 10.4
Fifth Third Bancorp 8.0
The Goldman Sachs Group, Inc. 8.4
HSBC North America Holdings Inc. 12.9
Huntington Bancshares Incorporated 7.0
JPMorgan Chase & Co. 9.1
KeyCorp 6.8
M&T Bank Corporation 7.9
Morgan Stanley 9.4
MUFG Americas Holdings Corporation 12.5
Northern Trust Corporation 10.9
The PNC Financial Services Group, Inc. 8.0
Regions Financial Corporation 8.2
Santander Holdings USA, Inc. 12.4
State Street Corporation 7.4
SunTrust Banks, Inc. 7.1
TD Group US Holdings LLC 11.3
U.S. Bancorp 7.6
Wells Fargo & Company 8.6
Zions Bancorporation 8.5
Note: The capital ratios are calculated using capital action assumptions provided within the Dodd-Frank stress testing rule. See 12 CFR 252.56(b). These projections represent
hypothetical estimates that involve an economic outcome that is more adverse than expected. The minimum capital ratio presented is for the period 2017:Q1 to 2019:Q1. In
accordance with the regulatory capital framework, all risk-based capital ratios are calculated using standardized RWAs, which became effective on January 1, 2015.
Source: Federal Reserve estimates in the severely adverse scenario.
26 Supervisory Stress Test Methodology and Results
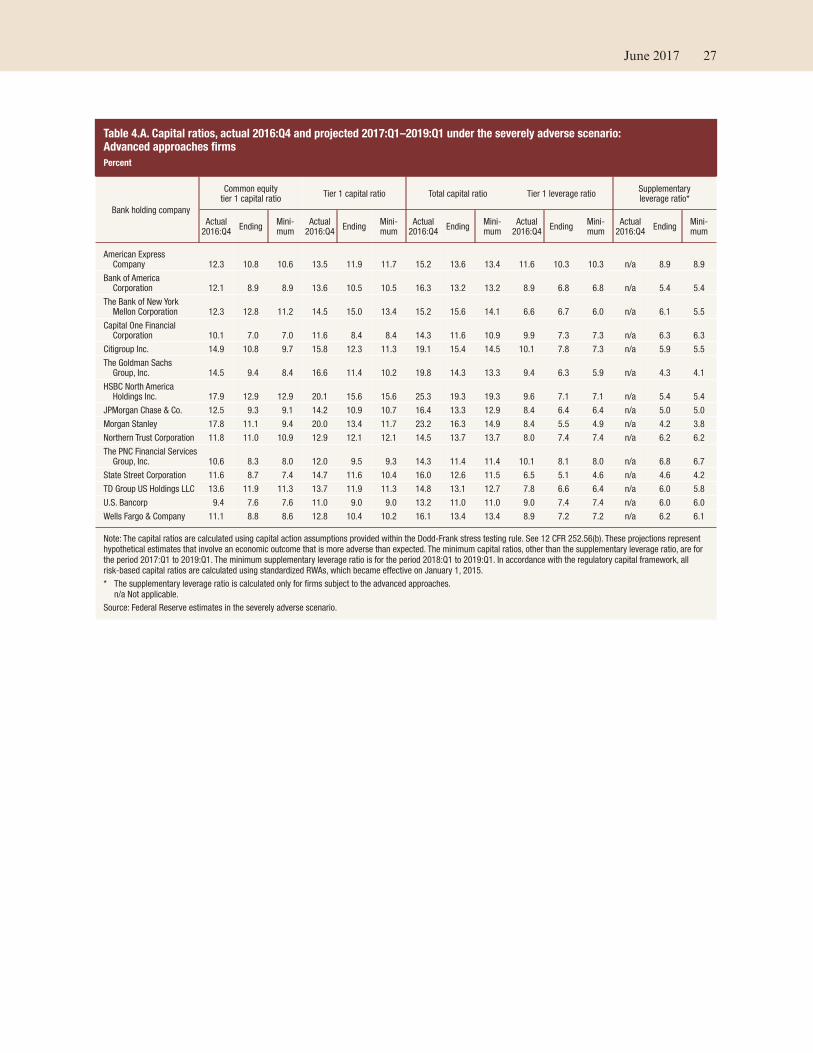
Table 4.A. Capital ratios, actual 2016:Q4 and projected 2017:Q1–2019:Q1 under the severely adverse scenario: Advanced approaches firms
Percent
Bank holding company
Common equitytier 1 capital ratio
Tier 1 capital ratio Total capital ratio Tier 1 leverage ratio Supplementary leverage ratio*
Actual 2016:Q4
Ending Mini-mum
Actual 2016:Q4
Ending Mini-mum
Actual 2016:Q4
Ending Mini-mum
Actual 2016:Q4
Ending Mini-mum
Actual 2016:Q4
Ending Mini-mum
American Express Company 12.3 10.8 10.6 13.5 11.9 11.7 15.2 13.6 13.4 11.6 10.3 10.3 n/a 8.9 8.9
Bank of America Corporation 12.1 8.9 8.9 13.6 10.5 10.5 16.3 13.2 13.2 8.9 6.8 6.8 n/a 5.4 5.4
The Bank of New York Mellon Corporation 12.3 12.8 11.2 14.5 15.0 13.4 15.2 15.6 14.1 6.6 6.7 6.0 n/a 6.1 5.5
Capital One Financial Corporation 10.1 7.0 7.0 11.6 8.4 8.4 14.3 11.6 10.9 9.9 7.3 7.3 n/a 6.3 6.3
Citigroup Inc. 14.9 10.8 9.7 15.8 12.3 11.3 19.1 15.4 14.5 10.1 7.8 7.3 n/a 5.9 5.5
The Goldman Sachs Group, Inc. 14.5 9.4 8.4 16.6 11.4 10.2 19.8 14.3 13.3 9.4 6.3 5.9 n/a 4.3 4.1
HSBC North America Holdings Inc. 17.9 12.9 12.9 20.1 15.6 15.6 25.3 19.3 19.3 9.6 7.1 7.1 n/a 5.4 5.4
JPMorgan Chase & Co. 12.5 9.3 9.1 14.2 10.9 10.7 16.4 13.3 12.9 8.4 6.4 6.4 n/a 5.0 5.0
Morgan Stanley 17.8 11.1 9.4 20.0 13.4 11.7 23.2 16.3 14.9 8.4 5.5 4.9 n/a 4.2 3.8
Northern Trust Corporation 11.8 11.0 10.9 12.9 12.1 12.1 14.5 13.7 13.7 8.0 7.4 7.4 n/a 6.2 6.2
The PNC Financial Services Group, Inc. 10.6 8.3 8.0 12.0 9.5 9.3 14.3 11.4 11.4 10.1 8.1 8.0 n/a 6.8 6.7
State Street Corporation 11.6 8.7 7.4 14.7 11.6 10.4 16.0 12.6 11.5 6.5 5.1 4.6 n/a 4.6 4.2
TD Group US Holdings LLC 13.6 11.9 11.3 13.7 11.9 11.3 14.8 13.1 12.7 7.8 6.6 6.4 n/a 6.0 5.8
U.S. Bancorp 9.4 7.6 7.6 11.0 9.0 9.0 13.2 11.0 11.0 9.0 7.4 7.4 n/a 6.0 6.0
Wells Fargo & Company 11.1 8.8 8.6 12.8 10.4 10.2 16.1 13.4 13.4 8.9 7.2 7.2 n/a 6.2 6.1
Note: The capital ratios are calculated using capital action assumptions provided within the Dodd-Frank stress testing rule. See 12 CFR 252.56(b). These projections represent
hypothetical estimates that involve an economic outcome that is more adverse than expected. The minimum capital ratios, other than the supplementary leverage ratio, are for
the period 2017:Q1 to 2019:Q1. The minimum supplementary leverage ratio is for the period 2018:Q1 to 2019:Q1. In accordance with the regulatory capital framework, all
risk-based capital ratios are calculated using standardized RWAs, which became effective on January 1, 2015.
* The supplementary leverage ratio is calculated only for firms subject to the advanced approaches.
n/a Not applicable.
Source: Federal Reserve estimates in the severely adverse scenario.
June 2017 27
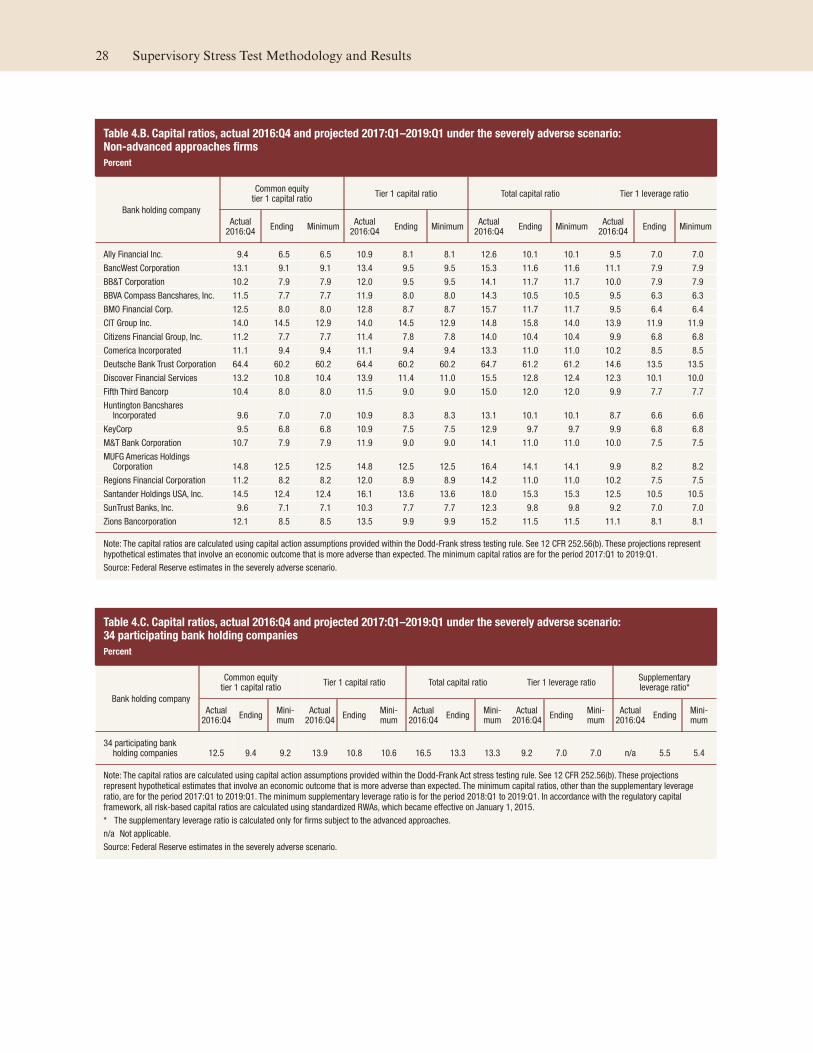
Table 4.B. Capital ratios, actual 2016:Q4 and projected 2017:Q1–2019:Q1 under the severely adverse scenario: Non-advanced approaches firms
Percent
Bank holding company
Common equitytier 1 capital ratio
Tier 1 capital ratio Total capital ratio Tier 1 leverage ratio
Actual 2016:Q4
Ending Minimum Actual
2016:Q4 Ending Minimum
Actual 2016:Q4
Ending Minimum Actual
2016:Q4 Ending Minimum
Ally Financial Inc. 9.4 6.5 6.5 10.9 8.1 8.1 12.6 10.1 10.1 9.5 7.0 7.0
BancWest Corporation 13.1 9.1 9.1 13.4 9.5 9.5 15.3 11.6 11.6 11.1 7.9 7.9
BB&T Corporation 10.2 7.9 7.9 12.0 9.5 9.5 14.1 11.7 11.7 10.0 7.9 7.9
BBVA Compass Bancshares, Inc. 11.5 7.7 7.7 11.9 8.0 8.0 14.3 10.5 10.5 9.5 6.3 6.3
BMO Financial Corp. 12.5 8.0 8.0 12.8 8.7 8.7 15.7 11.7 11.7 9.5 6.4 6.4
CIT Group Inc. 14.0 14.5 12.9 14.0 14.5 12.9 14.8 15.8 14.0 13.9 11.9 11.9
Citizens Financial Group, Inc. 11.2 7.7 7.7 11.4 7.8 7.8 14.0 10.4 10.4 9.9 6.8 6.8
Comerica Incorporated 11.1 9.4 9.4 11.1 9.4 9.4 13.3 11.0 11.0 10.2 8.5 8.5
Deutsche Bank Trust Corporation 64.4 60.2 60.2 64.4 60.2 60.2 64.7 61.2 61.2 14.6 13.5 13.5
Discover Financial Services 13.2 10.8 10.4 13.9 11.4 11.0 15.5 12.8 12.4 12.3 10.1 10.0
Fifth Third Bancorp 10.4 8.0 8.0 11.5 9.0 9.0 15.0 12.0 12.0 9.9 7.7 7.7
Huntington Bancshares Incorporated 9.6 7.0 7.0 10.9 8.3 8.3 13.1 10.1 10.1 8.7 6.6 6.6
KeyCorp 9.5 6.8 6.8 10.9 7.5 7.5 12.9 9.7 9.7 9.9 6.8 6.8
M&T Bank Corporation 10.7 7.9 7.9 11.9 9.0 9.0 14.1 11.0 11.0 10.0 7.5 7.5
MUFG Americas Holdings Corporation 14.8 12.5 12.5 14.8 12.5 12.5 16.4 14.1 14.1 9.9 8.2 8.2
Regions Financial Corporation 11.2 8.2 8.2 12.0 8.9 8.9 14.2 11.0 11.0 10.2 7.5 7.5
Santander Holdings USA, Inc. 14.5 12.4 12.4 16.1 13.6 13.6 18.0 15.3 15.3 12.5 10.5 10.5
SunTrust Banks, Inc. 9.6 7.1 7.1 10.3 7.7 7.7 12.3 9.8 9.8 9.2 7.0 7.0
Zions Bancorporation 12.1 8.5 8.5 13.5 9.9 9.9 15.2 11.5 11.5 11.1 8.1 8.1
Note: The capital ratios are calculated using capital action assumptions provided within the Dodd-Frank stress testing rule. See 12 CFR 252.56(b). These projections represent
hypothetical estimates that involve an economic outcome that is more adverse than expected. The minimum capital ratios are for the period 2017:Q1 to 2019:Q1.
Source: Federal Reserve estimates in the severely adverse scenario.
Table 4.C. Capital ratios, actual 2016:Q4 and projected 2017:Q1–2019:Q1 under the severely adverse scenario: 34 participating bank holding companies
Percent
Bank holding company
Common equitytier 1 capital ratio
Tier 1 capital ratio Total capital ratio Tier 1 leverage ratio Supplementary leverage ratio*
Actual 2016:Q4
Ending Mini-mum
Actual 2016:Q4
Ending Mini-mum
Actual 2016:Q4
Ending Mini-mum
Actual 2016:Q4
Ending Mini-mum
Actual 2016:Q4
Ending Mini-mum
34 participating bank holding companies 12.5 9.4 9.2 13.9 10.8 10.6 16.5 13.3 13.3 9.2 7.0 7.0 n/a 5.5 5.4
Note: The capital ratios are calculated using capital action assumptions provided within the Dodd-Frank Act stress testing rule. See 12 CFR 252.56(b). These projections
represent hypothetical estimates that involve an economic outcome that is more adverse than expected. The minimum capital ratios, other than the supplementary leverage
ratio, are for the period 2017:Q1 to 2019:Q1. The minimum supplementary leverage ratio is for the period 2018:Q1 to 2019:Q1. In accordance with the regulatory capital
framework, all risk-based capital ratios are calculated using standardized RWAs, which became effective on January 1, 2015.
* The supplementary leverage ratio is calculated only for firms subject to the advanced approaches.
n/a Not applicable.
Source: Federal Reserve estimates in the severely adverse scenario.
28 Supervisory Stress Test Methodology and Results
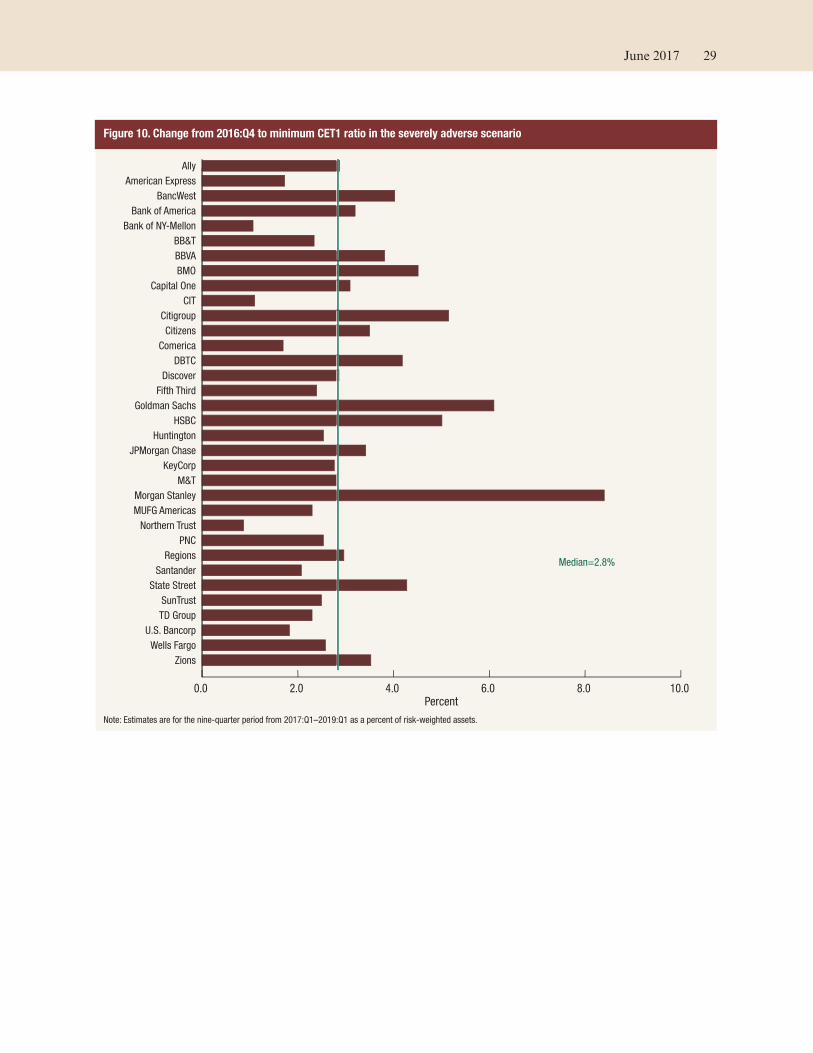
Figure 10. Change from 2016:Q4 to minimum CET1 ratio in the severely adverse scenario
0.0 2.0 4.0 6.0 8.0 10.0
Zions
Wells Fargo
U.S. Bancorp
TD Group
SunTrust
State Street
Santander
Regions
PNC
Northern Trust
MUFG Americas
Morgan Stanley
M&T
KeyCorp
JPMorgan Chase
Huntington
HSBC
Goldman Sachs
Fifth Third
Discover
DBTC
Comerica
Citizens
Citigroup
CIT
Capital One
BMO
BBVA
BB&T
Bank of NY-Mellon
Bank of America
BancWest
American Express
Ally
Percent
Median=2.8%
Note: Estimates are for the nine-quarter period from 2017:Q1–2019:Q1 as a percent of risk-weighted assets.
June 2017 29
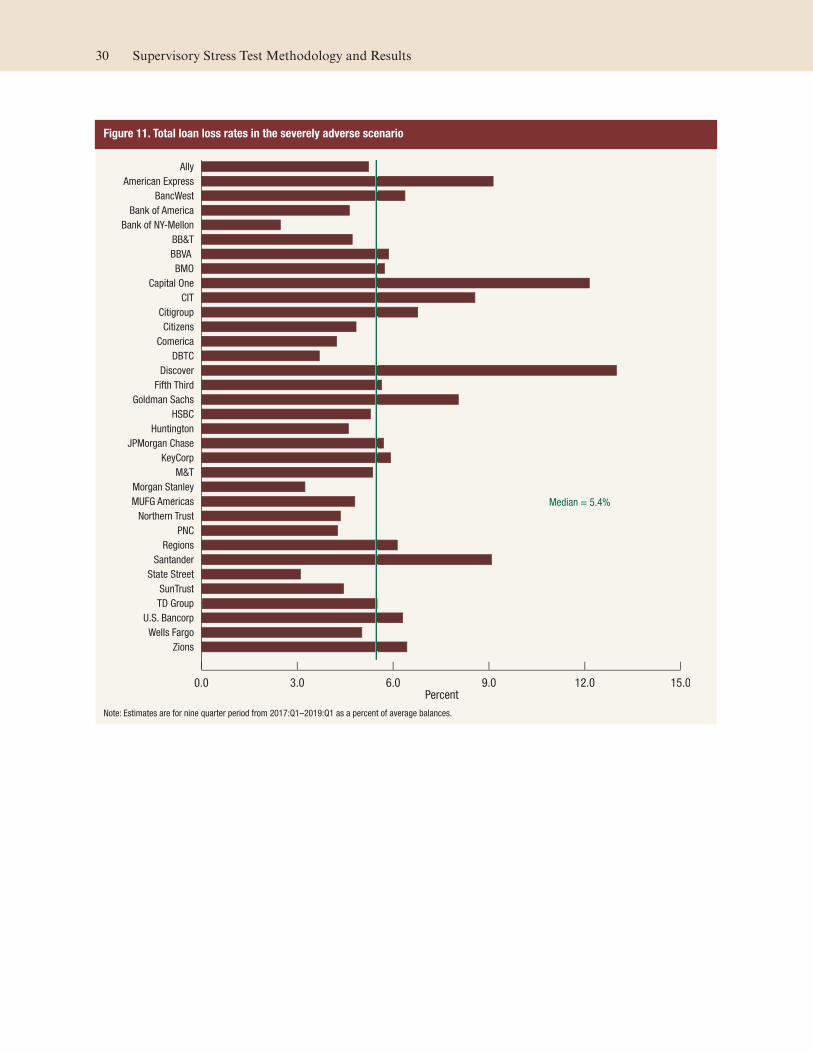
Figure 11. Total loan loss rates in the severely adverse scenario
0.0 3.0 6.0 9.0 12.0 15.0
Zions
Wells Fargo
U.S. Bancorp
TD Group
SunTrust
State Street
Santander
Regions
PNC
Northern Trust
MUFG Americas
Morgan Stanley
M&T
KeyCorp
JPMorgan Chase
Huntington
HSBC
Goldman Sachs
Fifth Third
Discover
DBTC
Comerica
Citizens
Citigroup
CIT
Capital One
BMO
BBVA
BB&T
Bank of NY-Mellon
Bank of America
BancWest
American Express
Ally
Percent
Median = 5.4%
Note: Estimates are for nine quarter period from 2017:Q1–2019:Q1 as a percent of average balances.
30 Supervisory Stress Test Methodology and Results
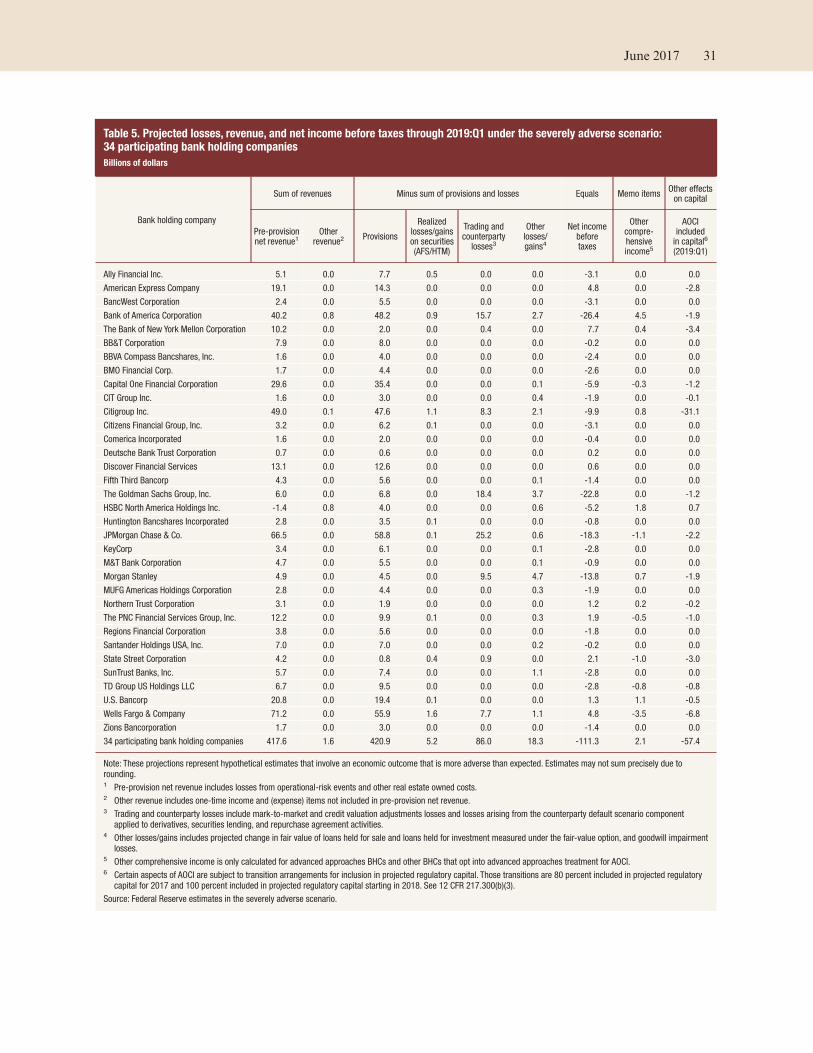
Table 5. Projected losses, revenue, and net income before taxes through 2019:Q1 under the severely adverse scenario: 34 participating bank holding companies
Billions of dollars
Bank holding company
Sum of revenues Minus sum of provisions and losses Equals Memo items Other effects
on capital
Pre-provision net revenue1
Otherrevenue2 Provisions
Realized losses/gains on securities (AFS/HTM)
Trading and counterparty
losses3
Otherlosses/gains4
Net incomebeforetaxes
Othercompre-hensiveincome5
AOCIincluded
in capital6
(2019:Q1)
Ally Financial Inc. 5.1 0.0 7.7 0.5 0.0 0.0 -3.1 0.0 0.0
American Express Company 19.1 0.0 14.3 0.0 0.0 0.0 4.8 0.0 -2.8
BancWest Corporation 2.4 0.0 5.5 0.0 0.0 0.0 -3.1 0.0 0.0
Bank of America Corporation 40.2 0.8 48.2 0.9 15.7 2.7 -26.4 4.5 -1.9
The Bank of New York Mellon Corporation 10.2 0.0 2.0 0.0 0.4 0.0 7.7 0.4 -3.4
BB&T Corporation 7.9 0.0 8.0 0.0 0.0 0.0 -0.2 0.0 0.0
BBVA Compass Bancshares, Inc. 1.6 0.0 4.0 0.0 0.0 0.0 -2.4 0.0 0.0
BMO Financial Corp. 1.7 0.0 4.4 0.0 0.0 0.0 -2.6 0.0 0.0
Capital One Financial Corporation 29.6 0.0 35.4 0.0 0.0 0.1 -5.9 -0.3 -1.2
CIT Group Inc. 1.6 0.0 3.0 0.0 0.0 0.4 -1.9 0.0 -0.1
Citigroup Inc. 49.0 0.1 47.6 1.1 8.3 2.1 -9.9 0.8 -31.1
Citizens Financial Group, Inc. 3.2 0.0 6.2 0.1 0.0 0.0 -3.1 0.0 0.0
Comerica Incorporated 1.6 0.0 2.0 0.0 0.0 0.0 -0.4 0.0 0.0
Deutsche Bank Trust Corporation 0.7 0.0 0.6 0.0 0.0 0.0 0.2 0.0 0.0
Discover Financial Services 13.1 0.0 12.6 0.0 0.0 0.0 0.6 0.0 0.0
Fifth Third Bancorp 4.3 0.0 5.6 0.0 0.0 0.1 -1.4 0.0 0.0
The Goldman Sachs Group, Inc. 6.0 0.0 6.8 0.0 18.4 3.7 -22.8 0.0 -1.2
HSBC North America Holdings Inc. -1.4 0.8 4.0 0.0 0.0 0.6 -5.2 1.8 0.7
Huntington Bancshares Incorporated 2.8 0.0 3.5 0.1 0.0 0.0 -0.8 0.0 0.0
JPMorgan Chase & Co. 66.5 0.0 58.8 0.1 25.2 0.6 -18.3 -1.1 -2.2
KeyCorp 3.4 0.0 6.1 0.0 0.0 0.1 -2.8 0.0 0.0
M&T Bank Corporation 4.7 0.0 5.5 0.0 0.0 0.1 -0.9 0.0 0.0
Morgan Stanley 4.9 0.0 4.5 0.0 9.5 4.7 -13.8 0.7 -1.9
MUFG Americas Holdings Corporation 2.8 0.0 4.4 0.0 0.0 0.3 -1.9 0.0 0.0
Northern Trust Corporation 3.1 0.0 1.9 0.0 0.0 0.0 1.2 0.2 -0.2
The PNC Financial Services Group, Inc. 12.2 0.0 9.9 0.1 0.0 0.3 1.9 -0.5 -1.0
Regions Financial Corporation 3.8 0.0 5.6 0.0 0.0 0.0 -1.8 0.0 0.0
Santander Holdings USA, Inc. 7.0 0.0 7.0 0.0 0.0 0.2 -0.2 0.0 0.0
State Street Corporation 4.2 0.0 0.8 0.4 0.9 0.0 2.1 -1.0 -3.0
SunTrust Banks, Inc. 5.7 0.0 7.4 0.0 0.0 1.1 -2.8 0.0 0.0
TD Group US Holdings LLC 6.7 0.0 9.5 0.0 0.0 0.0 -2.8 -0.8 -0.8
U.S. Bancorp 20.8 0.0 19.4 0.1 0.0 0.0 1.3 1.1 -0.5
Wells Fargo & Company 71.2 0.0 55.9 1.6 7.7 1.1 4.8 -3.5 -6.8
Zions Bancorporation 1.7 0.0 3.0 0.0 0.0 0.0 -1.4 0.0 0.0
34 participating bank holding companies 417.6 1.6 420.9 5.2 86.0 18.3 -111.3 2.1 -57.4
Note: These projections represent hypothetical estimates that involve an economic outcome that is more adverse than expected. Estimates may not sum precisely due to
rounding.1 Pre-provision net revenue includes losses from operational-risk events and other real estate owned costs.2 Other revenue includes one-time income and (expense) items not included in pre-provision net revenue.3 Trading and counterparty losses include mark-to-market and credit valuation adjustments losses and losses arising from the counterparty default scenario component
applied to derivatives, securities lending, and repurchase agreement activities.4 Other losses/gains includes projected change in fair value of loans held for sale and loans held for investment measured under the fair-value option, and goodwill impairment
losses.5 Other comprehensive income is only calculated for advanced approaches BHCs and other BHCs that opt into advanced approaches treatment for AOCI.6 Certain aspects of AOCI are subject to transition arrangements for inclusion in projected regulatory capital. Those transitions are 80 percent included in projected regulatory
capital for 2017 and 100 percent included in projected regulatory capital starting in 2018. See 12 CFR 217.300(b)(3).
Source: Federal Reserve estimates in the severely adverse scenario.
June 2017 31

Table 6. Projected loan losses by type of loan for 2017:Q1-2019:Q1 under the severely adverse scenario: 34 participating bank holding companies
Billions of dollars
Bank holding company Loan
losses
First-lienmortgages,domestic
Junior liensand HELOCs,
domestic
Commercialand
industrial
Commercialreal estate,domestic1
Creditcards
Otherconsumer2
Otherloans3
Ally Financial Inc. 6.5 0.2 0.1 2.0 0.1 0.0 4.1 0.0
American Express Company 10.9 0.0 0.0 4.2 0.0 6.7 0.0 0.0
BancWest Corporation 4.7 0.2 0.1 1.5 1.4 0.1 1.0 0.4
Bank of America Corporation 45.0 4.1 3.5 12.1 5.9 11.7 1.9 5.7
The Bank of New York Mellon Corporation 1.7 0.2 0.0 0.1 0.3 0.0 0.3 0.8
BB&T Corporation 7.1 0.8 0.3 1.5 2.3 0.3 1.3 0.6
BBVA Compass Bancshares, Inc. 3.7 0.4 0.1 1.4 1.1 0.1 0.3 0.2
BMO Financial Corp. 4.0 0.2 0.4 1.7 0.7 0.1 0.1 0.7
Capital One Financial Corporation 31.7 0.2 0.1 3.1 1.6 21.7 4.1 0.8
CIT Group Inc. 2.6 0.1 0.0 1.4 0.7 0.0 0.0 0.4
Citigroup Inc. 44.5 2.1 1.4 8.1 1.3 21.4 3.5 6.8
Citizens Financial Group, Inc. 5.4 0.2 0.7 1.8 1.1 0.2 1.1 0.3
Comerica Incorporated 2.2 0.0 0.1 1.0 0.7 0.0 0.1 0.3
Deutsche Bank Trust Corporation 0.5 0.1 0.0 0.1 0.2 0.0 0.0 0.1
Discover Financial Services 10.5 0.0 0.0 0.0 0.0 8.7 1.8 0.0
Fifth Third Bancorp 5.4 0.5 0.4 2.0 1.4 0.4 0.4 0.4
The Goldman Sachs Group, Inc. 6.2 1.3 0.0 2.1 0.3 0.0 0.1 2.3
HSBC North America Holdings Inc. 3.9 0.3 0.1 2.4 0.7 0.1 0.0 0.4
Huntington Bancshares Incorporated 3.2 0.3 0.3 1.0 0.8 0.1 0.6 0.2
JPMorgan Chase & Co. 54.0 4.1 2.3 15.9 4.3 15.7 3.2 8.6
KeyCorp 5.4 0.3 0.4 2.0 1.8 0.1 0.5 0.4
M&T Bank Corporation 5.0 1.0 0.3 0.8 2.4 0.1 0.4 0.2
Morgan Stanley 3.6 0.4 0.0 1.2 0.5 0.0 0.1 1.4
MUFG Americas Holdings Corporation 3.9 0.6 0.1 1.4 1.3 0.0 0.1 0.3
Northern Trust Corporation 1.5 0.1 0.1 0.3 0.3 0.0 0.0 0.6
The PNC Financial Services Group, Inc. 9.3 0.4 0.4 4.3 2.3 0.6 0.7 0.6
Regions Financial Corporation 5.1 0.5 0.4 1.7 1.5 0.2 0.4 0.4
Santander Holdings USA, Inc. 8.1 0.2 0.2 0.8 1.0 0.1 4.9 0.8
State Street Corporation 0.6 0.0 0.0 0.2 0.0 0.0 0.0 0.4
SunTrust Banks, Inc. 6.7 0.8 0.5 2.2 1.3 0.2 1.3 0.3
TD Group US Holdings LLC 8.8 0.7 0.5 2.1 1.8 2.3 0.6 0.8
U.S. Bancorp 17.9 1.0 0.8 5.9 4.0 3.4 1.4 1.3
Wells Fargo & Company 50.4 4.9 2.8 12.4 11.4 5.9 6.8 6.4
Zions Bancorporation 2.9 0.0 0.1 1.0 1.4 0.0 0.0 0.2
34 participating bank holding companies 383.1 26.5 16.6 99.8 56.1 100.0 41.1 43.1
Note: These projections represent hypothetical estimates that involve an economic outcome that is more adverse than expected. 1 Commercial and industrial loans include small- and medium-enterprise loans and corporate cards.2 Other consumer loans include student loans and automobile loans.3 Other loans include international real estate loans.
Source: Federal Reserve estimates in the severely adverse scenario.
32 Supervisory Stress Test Methodology and Results

Table 7. Projected loan losses by type of loan for 2017:Q1–2019:Q1 under the severely adverse scenario: 34 participating bank holding companies
Percent of average balances1
Bank holding company Loan
losses
First-lienmortgages,domestic
Junior liensand HELOCs,
domestic
Commercialand
industrial
Commercialreal estate,domestic2
Credit cards Other
consumer3 Other loans4
Ally Financial Inc. 5.2 2.4 6.3 4.3 2.2 0.0 6.6 7.5
American Express Company 9.1 0.0 0.0 10.2 0.0 8.6 0.0 0.0
BancWest Corporation 6.4 2.3 3.9 8.8 7.6 13.0 5.6 6.6
Bank of America Corporation 4.6 2.1 5.1 4.7 8.0 12.2 2.2 3.0
The Bank of New York Mellon Corporation 2.5 2.2 5.0 3.4 7.9 0.0 9.3 1.6
BB&T Corporation 4.7 2.5 3.2 5.2 6.0 13.2 6.3 3.4
BBVA Compass Bancshares, Inc. 5.9 2.9 4.8 7.1 8.2 16.9 7.0 2.5
BMO Financial Corp. 5.7 3.2 10.4 5.9 7.9 11.7 2.4 4.9
Capital One Financial Corporation 12.2 1.1 7.0 10.2 5.3 20.3 8.1 4.3
CIT Group Inc. 8.6 1.3 2.6 10.3 10.9 0.0 12.9 11.1
Citigroup Inc. 6.8 2.6 6.9 5.1 7.8 13.7 12.1 3.5
Citizens Financial Group, Inc. 4.8 1.2 4.5 5.5 7.9 11.9 4.9 3.3
Comerica Incorporated 4.2 2.2 3.1 3.5 6.0 0.0 8.4 4.8
Deutsche Bank Trust Corporation 3.7 2.2 4.7 4.9 7.4 0.0 3.7 1.8
Discover Financial Services 13.0 2.7 9.4 13.8 15.5 13.5 11.0 5.1
Fifth Third Bancorp 5.6 3.2 4.9 5.5 11.8 16.6 3.7 3.4
The Goldman Sachs Group, Inc. 8.1 52.3 4.5 11.1 8.9 0.0 5.5 4.7
HSBC North America Holdings Inc. 5.3 1.5 3.7 7.6 5.9 13.5 7.0 3.9
Huntington Bancshares Incorporated 4.6 2.8 3.4 4.8 7.0 13.5 4.2 3.9
JPMorgan Chase & Co. 5.7 1.8 4.4 9.7 3.8 11.5 4.3 4.7
KeyCorp 5.9 3.3 3.9 6.0 9.8 12.8 6.9 2.8
M&T Bank Corporation 5.4 4.2 4.3 4.2 7.1 13.5 6.0 3.6
Morgan Stanley 3.2 1.6 4.5 10.4 5.0 0.0 0.6 3.0
MUFG Americas Holdings Corporation 4.8 1.9 3.4 7.2 7.5 13.5 12.9 3.5
Northern Trust Corporation 4.4 1.7 7.2 4.2 7.3 0.0 13.8 4.2
The PNC Financial Services Group, Inc. 4.3 1.7 2.0 5.8 6.1 12.6 3.2 1.8
Regions Financial Corporation 6.1 3.2 4.9 7.2 10.4 15.2 7.1 2.7
Santander Holdings USA, Inc. 9.1 2.7 3.7 4.0 5.7 13.2 17.5 10.0
State Street Corporation 3.1 0.0 0.0 6.2 6.6 0.0 0.6 2.5
SunTrust Banks, Inc. 4.5 2.9 4.4 4.7 6.9 14.1 4.9 2.1
TD Group US Holdings LLC 5.5 2.7 5.1 5.8 6.7 18.9 2.5 3.2
U.S. Bancorp 6.3 1.7 4.6 7.9 9.7 15.2 3.6 4.9
Wells Fargo & Company 5.0 1.8 4.3 6.4 7.7 15.3 6.9 3.4
Zions Bancorporation 6.4 0.6 2.6 8.6 7.3 13.5 9.5 7.5
34 participating bank holding companies 5.8 2.2 4.5 6.4 7.0 13.7 5.9 3.6
Note: These projections represent hypothetical estimates that involve an economic outcome that is more adverse than expected.1 Average loan balances used to calculate portfolio loss rates exclude loans held for sale and loans held for investment under the fair-value option, and are calculated over
nine quarters.2 Commercial and industrial loans include small- and medium-enterprise loans and corporate cards.3 Other consumer loans include student loans and automobile loans.4 Other loans include international real estate loans.
Source: Federal Reserve estimates in the severely adverse scenario.
June 2017 33
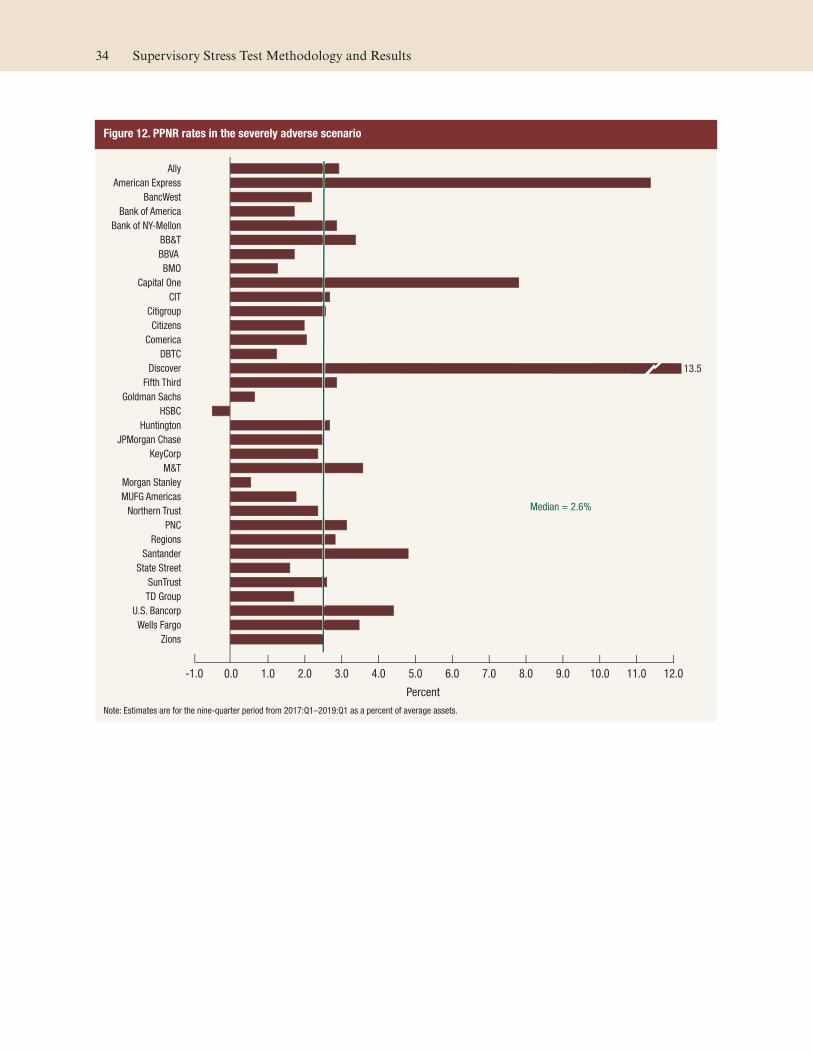
Figure 12. PPNR rates in the severely adverse scenario
-1.0 0.0 1.0 2.0 3.0 4.0 5.0 6.0 7.0 8.0 9.0 10.0 11.0 12.0
Zions
Wells Fargo
U.S. Bancorp
TD Group
SunTrust
State Street
Santander
Regions
PNC
Northern Trust
MUFG Americas
Morgan Stanley
M&T
KeyCorp
JPMorgan Chase
Huntington
HSBC
Goldman Sachs
Fifth Third
Discover
DBTC
Comerica
Citizens
Citigroup
CIT
Capital One
BMO
BBVA
BB&T
Bank of NY-Mellon
Bank of America
BancWest
American Express
Ally
Percent
Median = 2.6%
13.5
Note: Estimates are for the nine-quarter period from 2017:Q1–2019:Q1 as a percent of average assets.
34 Supervisory Stress Test Methodology and Results
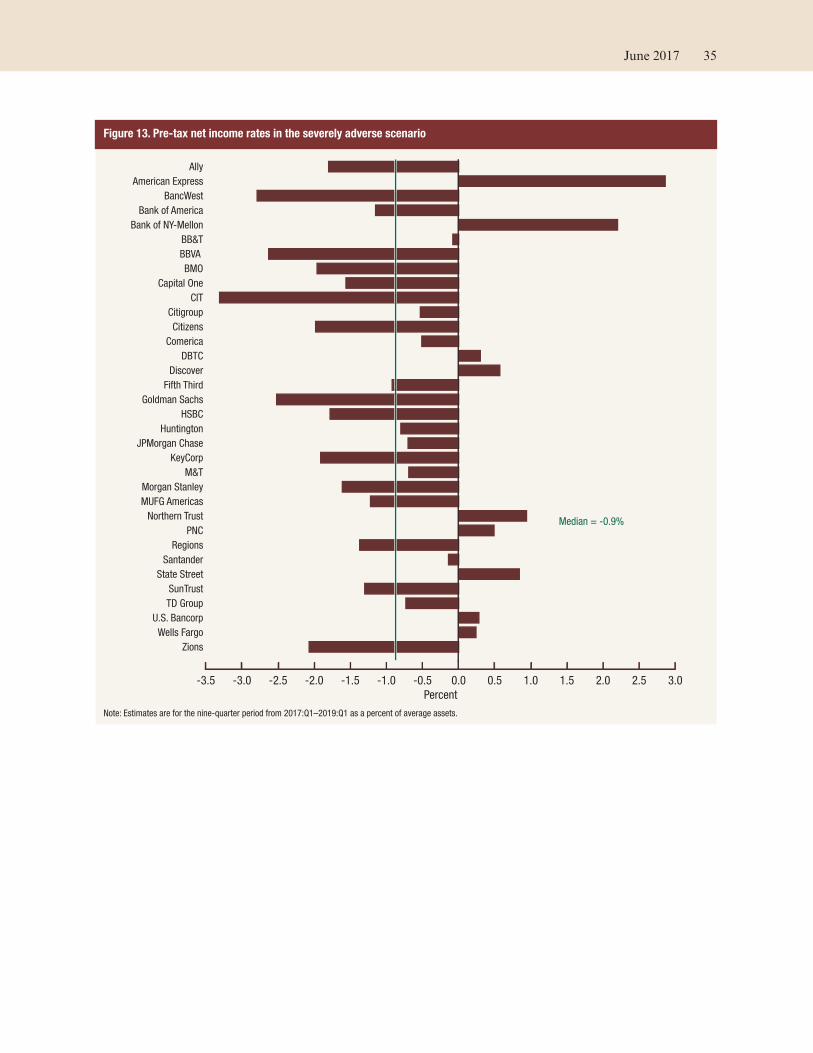
Figure 13. Pre-tax net income rates in the severely adverse scenario
-3.5 -3.0 -2.5 -2.0 -1.5 -1.0 -0.5 0.0 0.5 1.0 1.5 2.0 2.5 3.0
Zions
Wells Fargo
U.S. Bancorp
TD Group
SunTrust
State Street
Santander
Regions
PNC
Northern Trust
MUFG Americas
Morgan Stanley
M&T
KeyCorp
JPMorgan Chase
Huntington
HSBC
Goldman Sachs
Fifth Third
Discover
DBTC
Comerica
Citizens
Citigroup
CIT
Capital One
BMO
BBVA
BB&T
Bank of NY-Mellon
Bank of America
BancWest
American Express
Ally
Percent
Median = -0.9%
Note: Estimates are for the nine-quarter period from 2017:Q1–2019:Q1 as a percent of average assets.
June 2017 35
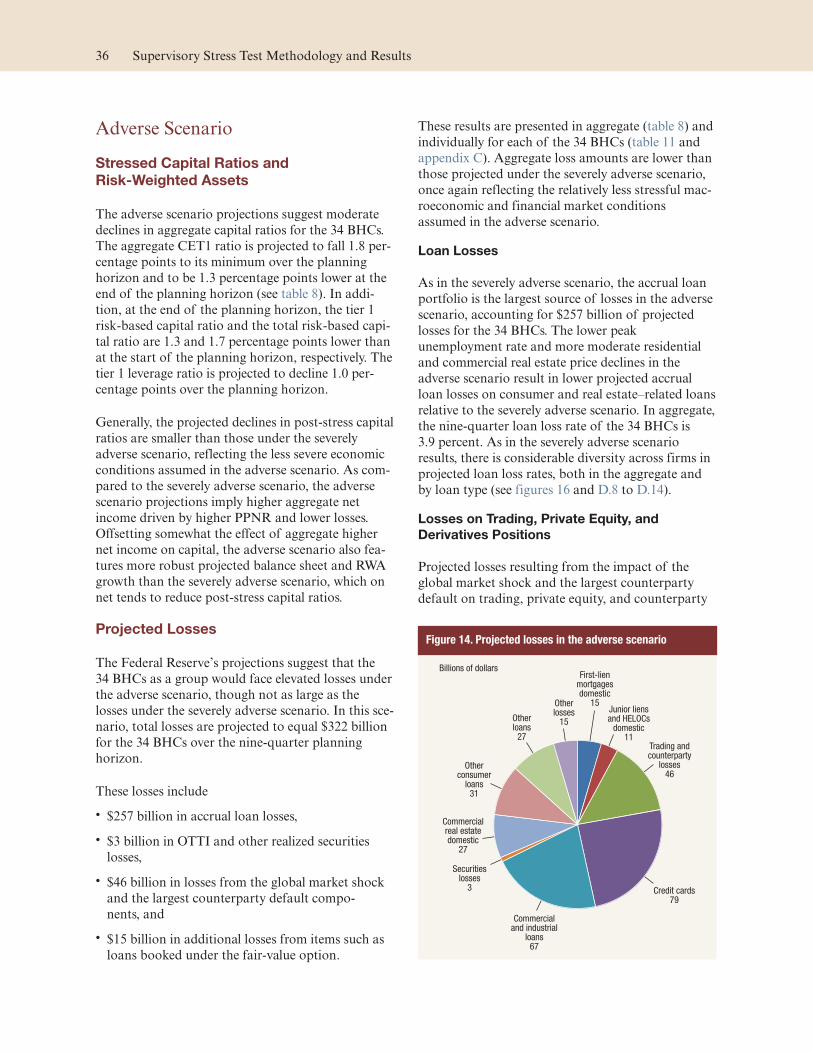
Adverse Scenario
Stressed Capital Ratios and
Risk-Weighted Assets
The adverse scenario projections suggest moderate
declines in aggregate capital ratios for the 34 BHCs.
The aggregate CET1 ratio is projected to fall 1.8 per-
centage points to its minimum over the planning
horizon and to be 1.3 percentage points lower at the
end of the planning horizon (see table 8). In addi-
tion, at the end of the planning horizon, the tier 1
risk-based capital ratio and the total risk-based capi-
tal ratio are 1.3 and 1.7 percentage points lower than
at the start of the planning horizon, respectively. The
tier 1 leverage ratio is projected to decline 1.0 per-
centage points over the planning horizon.
Generally, the projected declines in post-stress capital
ratios are smaller than those under the severely
adverse scenario, reflecting the less severe economic
conditions assumed in the adverse scenario. As com-
pared to the severely adverse scenario, the adverse
scenario projections imply higher aggregate net
income driven by higher PPNR and lower losses.
Offsetting somewhat the effect of aggregate higher
net income on capital, the adverse scenario also fea-
tures more robust projected balance sheet and RWA
growth than the severely adverse scenario, which on
net tends to reduce post-stress capital ratios.
Projected Losses
The Federal Reserve’s projections suggest that the
34 BHCs as a group would face elevated losses under
the adverse scenario, though not as large as the
losses under the severely adverse scenario. In this sce-
nario, total losses are projected to equal $322 billion
for the 34 BHCs over the nine-quarter planning
horizon.
These losses include
• $257 billion in accrual loan losses,
• $3 billion in OTTI and other realized securities
losses,
• $46 billion in losses from the global market shock
and the largest counterparty default compo-
nents, and
• $15 billion in additional losses from items such as
loans booked under the fair-value option.
These results are presented in aggregate (table 8) and
individually for each of the 34 BHCs (table 11 and
appendix C). Aggregate loss amounts are lower than
those projected under the severely adverse scenario,
once again reflecting the relatively less stressful mac-
roeconomic and financial market conditions
assumed in the adverse scenario.
Loan Losses
As in the severely adverse scenario, the accrual loan
portfolio is the largest source of losses in the adverse
scenario, accounting for $257 billion of projected
losses for the 34 BHCs. The lower peak
unemployment rate and more moderate residential
and commercial real estate price declines in the
adverse scenario result in lower projected accrual
loan losses on consumer and real estate–related loans
relative to the severely adverse scenario. In aggregate,
the nine-quarter loan loss rate of the 34 BHCs is
3.9 percent. As in the severely adverse scenario
results, there is considerable diversity across firms in
projected loan loss rates, both in the aggregate and
by loan type (see figures 16 and D.8 to D.14).
Losses on Trading, Private Equity, and
Derivatives Positions
Projected losses resulting from the impact of the
global market shock and the largest counterparty
default on trading, private equity, and counterparty
Figure 14. Projected losses in the adverse scenario
Otherlosses
15Otherloans
27
Otherconsumer
loans31
Commercialreal estatedomestic
27
Securitieslosses
3
Commercialand industrial
loans67
Credit cards79
Trading andcounterparty
losses46
Junior liensand HELOCs
domestic11
First-lienmortgagesdomestic
15
Billions of dollars
36 Supervisory Stress Test Methodology and Results
exposures for the eight BHCs with large trading, pro-
cessing, or custodial operations equal $46 billion
under the adverse scenario. These losses are slightly
more than half those projected under the severely
adverse scenario, reflecting the less severe market
shocks assumed in the global market shock compo-
nent of the adverse scenario.
Projected PPNR and Net Income
Aggregate PPNR is projected to equal $541 billion
for the 34 BHCs under the adverse scenario, equal to
3.3 percent of average projected assets for these
firms. Projected PPNR is higher than under the
severely adverse scenario due to a steeper yield curve
and less severe economic and financial market condi-
tions, resulting in a smaller reduction in noninterest
income and operational risk losses. However, pro-
jected operational risk losses are lower compared to
the severely adverse scenario, the latter being consis-
tent with the adverse scenario’s more moderate hous-
ing price decline. Projected ratios of PPNR to assets
vary significantly across the 34 BHCs (see figure 17).
In the aggregate, the 34 BHCs are projected to have
cumulative pre-tax net income of $214 billion over
the nine-quarter planning horizon under the adverse
scenario. Twenty-seven of the BHCs are projected to
have positive cumulative pre-tax net income, though
20 firms experience at least one quarter of negative
pre-tax net income during the planning horizon. The
higher net income, as compared to the severely
adverse scenario projections, reflects the combina-
tion of higher projected PPNR and lower projected
losses, especially on trading, private equity and coun-
terparty positions, and on the accrual loan portfolio.
The $264 billion in total provisions reported in
table 8 includes $257 billion in net charge-offs, with
the remainder being the reserve build, or the increase
in loan loss reserves.
Aggregate pre-tax net income under the adverse sce-
nario is positive, with a ratio of income to average
assets of 1.3 percent. Projected nine-quarter return
on assets under the adverse scenario ranges between
-0.8 and 5.8 percent for the 34 BHCs (see figure 18).
The interest rate path and credit spreads assumed in
the scenario result in -$21 billion of OCI over the
nine quarters of the planning horizon for advanced
approaches BHCs and other BHCs that opt into
advanced approaches treatment for AOCI. Reflect-
ing the gradual phasing-in of portions of AOCI in
the revised regulatory capital framework, -$80 billion
in AOCI is included in post-stress regulatory capital
as of the first quarter of 2019.
June 2017 37
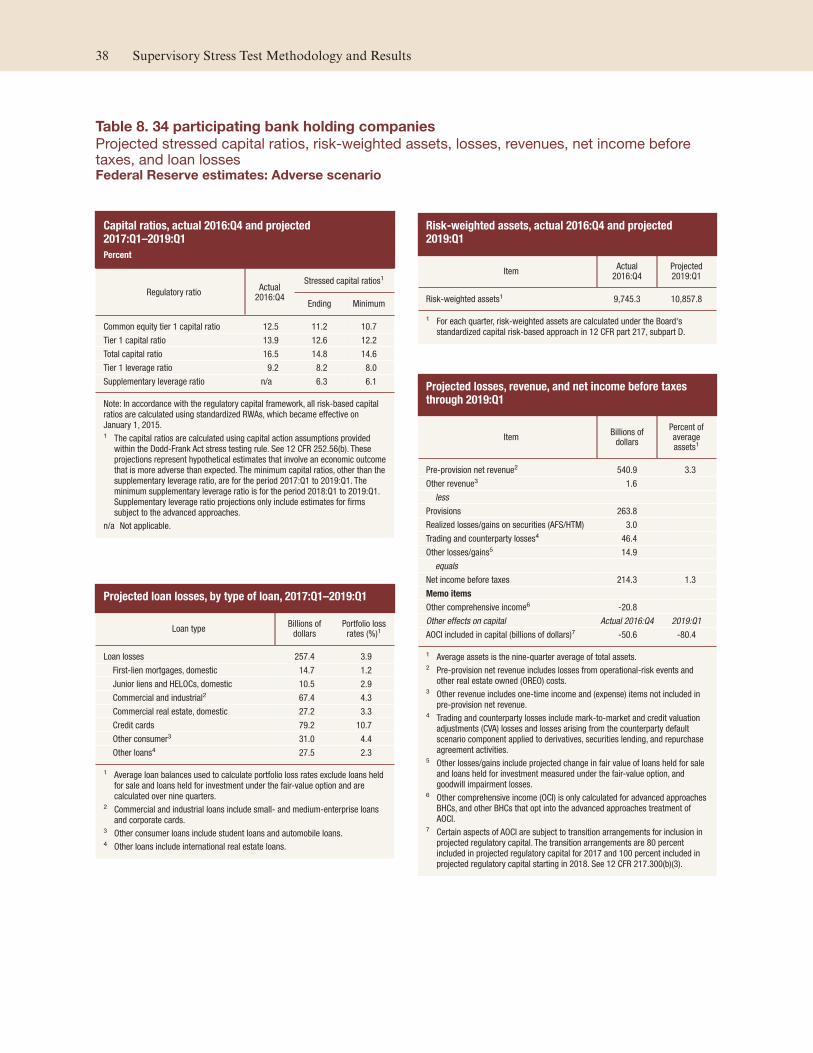
Table 8. 34 participating bank holding companies
Projected stressed capital ratios, risk-weighted assets, losses, revenues, net income before taxes, and loan losses Federal Reserve estimates: Adverse scenario
Capital ratios, actual 2016:Q4 and projected 2017:Q1–2019:Q1
Percent
Regulatory ratio Actual
2016:Q4
Stressed capital ratios1
Ending Minimum
Common equity tier 1 capital ratio 12.5 11.2 10.7
Tier 1 capital ratio 13.9 12.6 12.2
Total capital ratio 16.5 14.8 14.6
Tier 1 leverage ratio 9.2 8.2 8.0
Supplementary leverage ratio n/a 6.3 6.1
Note: In accordance with the regulatory capital framework, all risk-based capital
ratios are calculated using standardized RWAs, which became effective on
January 1, 2015.1 The capital ratios are calculated using capital action assumptions provided
within the Dodd-Frank Act stress testing rule. See 12 CFR 252.56(b). These
projections represent hypothetical estimates that involve an economic outcome
that is more adverse than expected. The minimum capital ratios, other than the
supplementary leverage ratio, are for the period 2017:Q1 to 2019:Q1. The
minimum supplementary leverage ratio is for the period 2018:Q1 to 2019:Q1.
Supplementary leverage ratio projections only include estimates for firms
subject to the advanced approaches.
n/a Not applicable.
Projected loan losses, by type of loan, 2017:Q1–2019:Q1
Loan type Billions of
dollars Portfolio loss
rates (%)1
Loan losses 257.4 3.9
First-lien mortgages, domestic 14.7 1.2
Junior liens and HELOCs, domestic 10.5 2.9
Commercial and industrial2 67.4 4.3
Commercial real estate, domestic 27.2 3.3
Credit cards 79.2 10.7
Other consumer3 31.0 4.4
Other loans4 27.5 2.3
1 Average loan balances used to calculate portfolio loss rates exclude loans held
for sale and loans held for investment under the fair-value option and are
calculated over nine quarters.2 Commercial and industrial loans include small- and medium-enterprise loans
and corporate cards.3 Other consumer loans include student loans and automobile loans.4 Other loans include international real estate loans.
Risk-weighted assets, actual 2016:Q4 and projected 2019:Q1
Item Actual
2016:Q4 Projected 2019:Q1
Risk-weighted assets1 9,745.3 10,857.8
1 For each quarter, risk-weighted assets are calculated under the Board's
standardized capital risk-based approach in 12 CFR part 217, subpart D.
Projected losses, revenue, and net income before taxes through 2019:Q1
Item Billions of
dollars
Percent of average assets1
Pre-provision net revenue2 540.9 3.3
Other revenue3 1.6
less
Provisions 263.8
Realized losses/gains on securities (AFS/HTM) 3.0
Trading and counterparty losses4 46.4
Other losses/gains5 14.9
equals
Net income before taxes 214.3 1.3
Memo items
Other comprehensive income6 -20.8
Other effects on capital Actual 2016:Q4 2019:Q1
AOCI included in capital (billions of dollars)7 -50.6 -80.4
1 Average assets is the nine-quarter average of total assets.2 Pre-provision net revenue includes losses from operational-risk events and
other real estate owned (OREO) costs.3 Other revenue includes one-time income and (expense) items not included in
pre-provision net revenue.4 Trading and counterparty losses include mark-to-market and credit valuation
adjustments (CVA) losses and losses arising from the counterparty default
scenario component applied to derivatives, securities lending, and repurchase
agreement activities.5 Other losses/gains include projected change in fair value of loans held for sale
and loans held for investment measured under the fair-value option, and
goodwill impairment losses.6 Other comprehensive income (OCI) is only calculated for advanced approaches
BHCs, and other BHCs that opt into the advanced approaches treatment of
AOCI.7 Certain aspects of AOCI are subject to transition arrangements for inclusion in
projected regulatory capital. The transition arrangements are 80 percent
included in projected regulatory capital for 2017 and 100 percent included in
projected regulatory capital starting in 2018. See 12 CFR 217.300(b)(3).
38 Supervisory Stress Test Methodology and Results
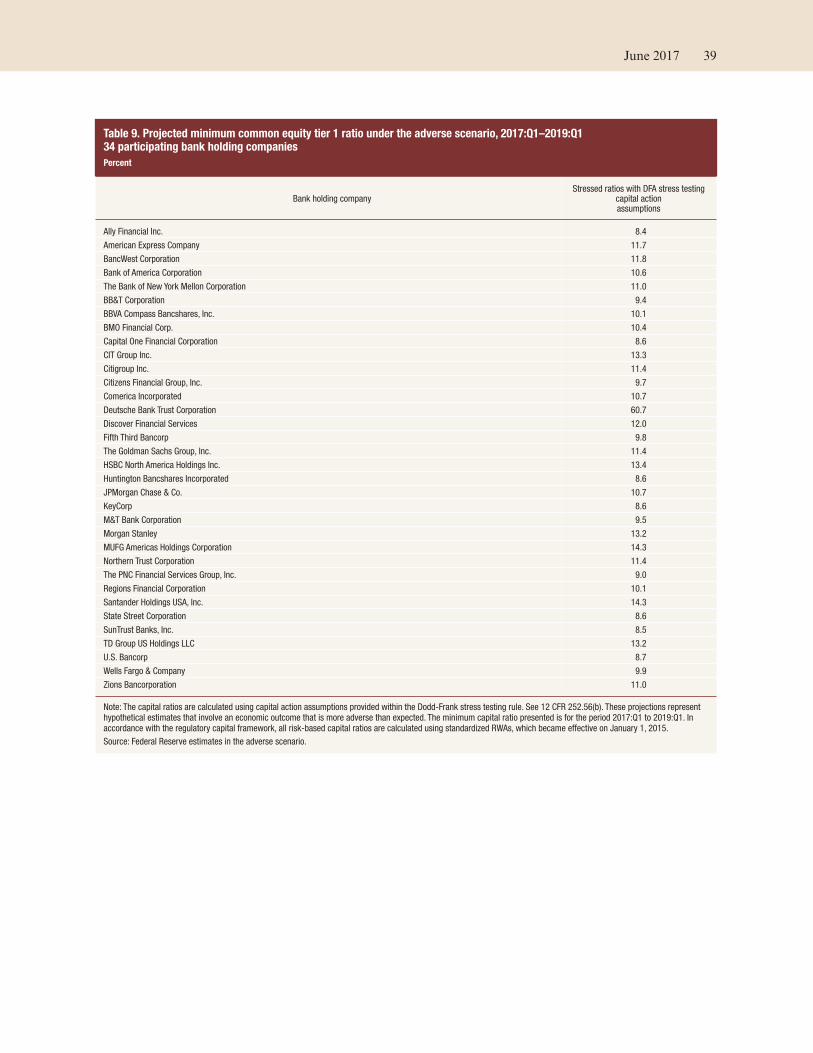
Table 9. Projected minimum common equity tier 1 ratio under the adverse scenario, 2017:Q1–2019:Q134 participating bank holding companies
Percent
Bank holding company Stressed ratios with DFA stress testing
capital action assumptions
Ally Financial Inc. 8.4
American Express Company 11.7
BancWest Corporation 11.8
Bank of America Corporation 10.6
The Bank of New York Mellon Corporation 11.0
BB&T Corporation 9.4
BBVA Compass Bancshares, Inc. 10.1
BMO Financial Corp. 10.4
Capital One Financial Corporation 8.6
CIT Group Inc. 13.3
Citigroup Inc. 11.4
Citizens Financial Group, Inc. 9.7
Comerica Incorporated 10.7
Deutsche Bank Trust Corporation 60.7
Discover Financial Services 12.0
Fifth Third Bancorp 9.8
The Goldman Sachs Group, Inc. 11.4
HSBC North America Holdings Inc. 13.4
Huntington Bancshares Incorporated 8.6
JPMorgan Chase & Co. 10.7
KeyCorp 8.6
M&T Bank Corporation 9.5
Morgan Stanley 13.2
MUFG Americas Holdings Corporation 14.3
Northern Trust Corporation 11.4
The PNC Financial Services Group, Inc. 9.0
Regions Financial Corporation 10.1
Santander Holdings USA, Inc. 14.3
State Street Corporation 8.6
SunTrust Banks, Inc. 8.5
TD Group US Holdings LLC 13.2
U.S. Bancorp 8.7
Wells Fargo & Company 9.9
Zions Bancorporation 11.0
Note: The capital ratios are calculated using capital action assumptions provided within the Dodd-Frank stress testing rule. See 12 CFR 252.56(b). These projections represent
hypothetical estimates that involve an economic outcome that is more adverse than expected. The minimum capital ratio presented is for the period 2017:Q1 to 2019:Q1. In
accordance with the regulatory capital framework, all risk-based capital ratios are calculated using standardized RWAs, which became effective on January 1, 2015.
Source: Federal Reserve estimates in the adverse scenario.
June 2017 39
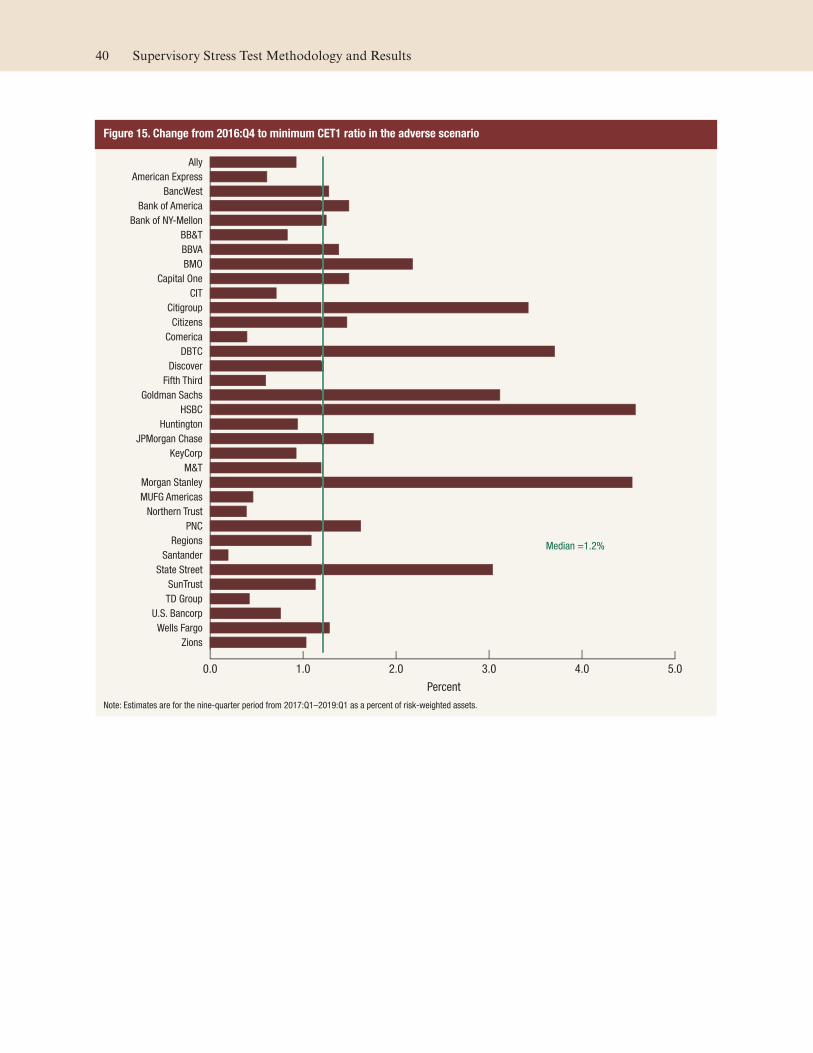
Figure 15. Change from 2016:Q4 to minimum CET1 ratio in the adverse scenario
0.0 1.0 2.0 3.0 4.0 5.0
Zions
Wells Fargo
U.S. Bancorp
TD Group
SunTrust
State Street
Santander
Regions
PNC
Northern Trust
MUFG Americas
Morgan Stanley
M&T
KeyCorp
JPMorgan Chase
Huntington
HSBC
Goldman Sachs
Fifth Third
Discover
DBTC
Comerica
Citizens
Citigroup
CIT
Capital One
BMO
BBVA
BB&T
Bank of NY-Mellon
Bank of America
BancWest
American Express
Ally
Percent
Median =1.2%
Note: Estimates are for the nine-quarter period from 2017:Q1–2019:Q1 as a percent of risk-weighted assets.
40 Supervisory Stress Test Methodology and Results
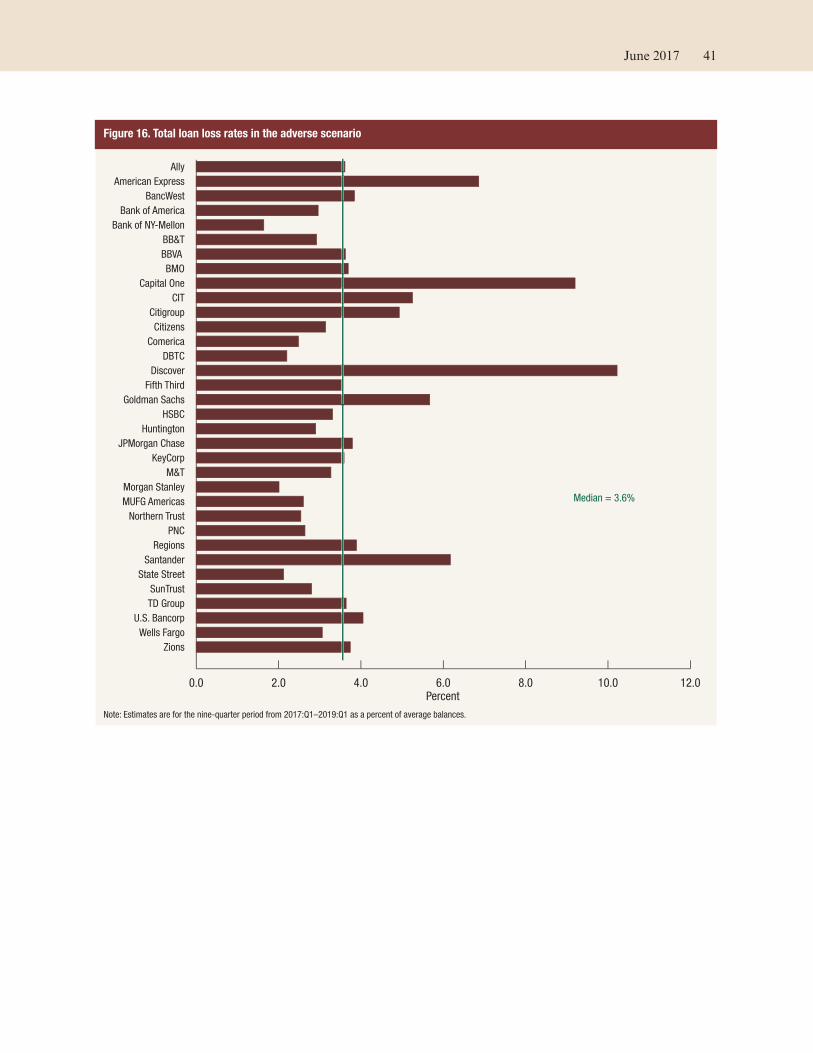
Figure 16. Total loan loss rates in the adverse scenario
0.0 2.0 4.0 6.0 8.0 10.0 12.0
Zions
Wells Fargo
U.S. Bancorp
TD Group
SunTrust
State Street
Santander
Regions
PNC
Northern Trust
MUFG Americas
Morgan Stanley
M&T
KeyCorp
JPMorgan Chase
Huntington
HSBC
Goldman Sachs
Fifth Third
Discover
DBTC
Comerica
Citizens
Citigroup
CIT
Capital One
BMO
BBVA
BB&T
Bank of NY-Mellon
Bank of America
BancWest
American Express
Ally
Percent
Median = 3.6%
Note: Estimates are for the nine-quarter period from 2017:Q1–2019:Q1 as a percent of average balances.
June 2017 41

Table 10.A. Capital ratios, actual 2016:Q4 and projected 2017:Q1–2019:Q1 under the adverse scenario: Advanced approaches firms
Percent
Bank holding company
Common equitytier 1 capital ratio
Tier 1 capital ratio Total capital ratio Tier 1 leverage ratio Supplementary leverage ratio*
Actual 2016:Q4
Ending Mini-mum
Actual 2016:Q4
Ending Mini-mum
Actual 2016:Q4
Ending Mini-mum
Actual 2016:Q4
Ending Mini-mum
Actual 2016:Q4
Ending Mini-mum
American Express Company 12.3 12.9 11.7 13.5 14.0 12.9 15.2 15.6 14.6 11.6 11.9 11.0 n/a 10.2 9.8
Bank of America Corporation 12.1 11.1 10.6 13.6 12.7 12.2 16.3 14.8 14.7 8.9 8.2 8.0 n/a 6.5 6.3
The Bank of New York Mellon Corporation 12.3 13.3 11.0 14.5 15.4 13.3 15.2 16.0 13.8 6.6 6.8 6.0 n/a 6.2 5.6
Capital One Financial Corporation 10.1 9.2 8.6 11.6 10.5 10.0 14.3 13.6 12.4 9.9 8.9 8.7 n/a 7.7 7.5
Citigroup Inc. 14.9 12.6 11.4 15.8 14.1 13.0 19.1 16.9 16.1 10.1 9.0 8.3 n/a 6.7 6.3
The Goldman Sachs Group, Inc. 14.5 11.5 11.4 16.6 13.4 13.3 19.8 16.2 16.1 9.4 7.4 7.4 n/a 5.1 5.1
HSBC North America Holdings Inc. 17.9 13.4 13.4 20.1 16.0 16.0 25.3 19.2 19.2 9.6 7.2 7.2 n/a 5.5 5.5
JPMorgan Chase & Co. 12.5 11.1 10.7 14.2 12.6 12.3 16.4 14.6 14.3 8.4 7.3 7.2 n/a 5.7 5.6
Morgan Stanley 17.8 13.9 13.2 20.0 16.1 15.6 23.2 18.8 18.5 8.4 6.6 6.4 n/a 5.0 4.9
Northern Trust Corporation 11.8 11.8 11.4 12.9 12.9 12.5 14.5 14.2 14.1 8.0 7.7 7.6 n/a 6.6 6.5
The PNC Financial Services Group, Inc. 10.6 9.5 9.0 12.0 10.6 10.2 14.3 12.2 12.1 10.1 8.9 8.7 n/a 7.5 7.3
State Street Corporation 11.6 9.9 8.6 14.7 12.8 11.6 16.0 13.7 12.7 6.5 5.5 5.1 n/a 5.0 4.6
TD Group US Holdings LLC 13.6 13.9 13.2 13.7 13.9 13.2 14.8 14.8 14.3 7.8 7.6 7.4 n/a 7.0 6.8
U.S. Bancorp 9.4 9.0 8.7 11.0 10.4 10.1 13.2 12.1 12.0 9.0 8.4 8.3 n/a 6.8 6.7
Wells Fargo & Company 11.1 10.5 9.9 12.8 12.0 11.4 16.1 14.7 14.5 8.9 8.3 8.0 n/a 7.1 6.8
Note: The capital ratios are calculated using capital action assumptions provided within the Dodd-Frank stress testing rule. See 12 CFR 252.56(b). These projections represent
hypothetical estimates that involve an economic outcome that is more adverse than expected. The minimum capital ratios, other than the supplementary leverage ratio, are for
the period 2017:Q1 to 2019:Q1. The minimum supplementary leverage ratio is for the period 2018:Q1 to 2019:Q1. In accordance with the regulatory capital framework, all
risk-based capital ratios are calculated using standardized RWAs, which became effective on January 1, 2015.
* The supplementary leverage ratio is calculated only for firms subject to the advanced approaches.
n/a Not applicable.
Source: Federal Reserve estimates in the adverse scenario.
42 Supervisory Stress Test Methodology and Results
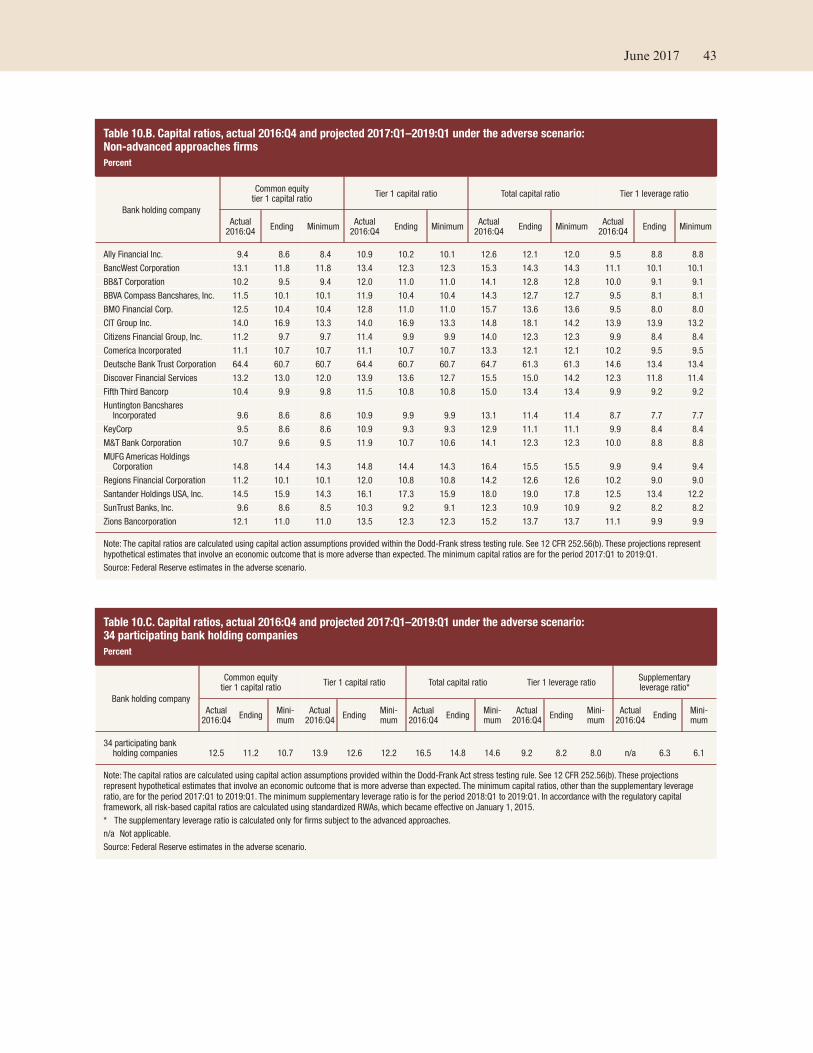
Table 10.B. Capital ratios, actual 2016:Q4 and projected 2017:Q1–2019:Q1 under the adverse scenario: Non-advanced approaches firms
Percent
Bank holding company
Common equitytier 1 capital ratio
Tier 1 capital ratio Total capital ratio Tier 1 leverage ratio
Actual 2016:Q4
Ending Minimum Actual
2016:Q4 Ending Minimum
Actual 2016:Q4
Ending Minimum Actual
2016:Q4 Ending Minimum
Ally Financial Inc. 9.4 8.6 8.4 10.9 10.2 10.1 12.6 12.1 12.0 9.5 8.8 8.8
BancWest Corporation 13.1 11.8 11.8 13.4 12.3 12.3 15.3 14.3 14.3 11.1 10.1 10.1
BB&T Corporation 10.2 9.5 9.4 12.0 11.0 11.0 14.1 12.8 12.8 10.0 9.1 9.1
BBVA Compass Bancshares, Inc. 11.5 10.1 10.1 11.9 10.4 10.4 14.3 12.7 12.7 9.5 8.1 8.1
BMO Financial Corp. 12.5 10.4 10.4 12.8 11.0 11.0 15.7 13.6 13.6 9.5 8.0 8.0
CIT Group Inc. 14.0 16.9 13.3 14.0 16.9 13.3 14.8 18.1 14.2 13.9 13.9 13.2
Citizens Financial Group, Inc. 11.2 9.7 9.7 11.4 9.9 9.9 14.0 12.3 12.3 9.9 8.4 8.4
Comerica Incorporated 11.1 10.7 10.7 11.1 10.7 10.7 13.3 12.1 12.1 10.2 9.5 9.5
Deutsche Bank Trust Corporation 64.4 60.7 60.7 64.4 60.7 60.7 64.7 61.3 61.3 14.6 13.4 13.4
Discover Financial Services 13.2 13.0 12.0 13.9 13.6 12.7 15.5 15.0 14.2 12.3 11.8 11.4
Fifth Third Bancorp 10.4 9.9 9.8 11.5 10.8 10.8 15.0 13.4 13.4 9.9 9.2 9.2
Huntington Bancshares Incorporated 9.6 8.6 8.6 10.9 9.9 9.9 13.1 11.4 11.4 8.7 7.7 7.7
KeyCorp 9.5 8.6 8.6 10.9 9.3 9.3 12.9 11.1 11.1 9.9 8.4 8.4
M&T Bank Corporation 10.7 9.6 9.5 11.9 10.7 10.6 14.1 12.3 12.3 10.0 8.8 8.8
MUFG Americas Holdings Corporation 14.8 14.4 14.3 14.8 14.4 14.3 16.4 15.5 15.5 9.9 9.4 9.4
Regions Financial Corporation 11.2 10.1 10.1 12.0 10.8 10.8 14.2 12.6 12.6 10.2 9.0 9.0
Santander Holdings USA, Inc. 14.5 15.9 14.3 16.1 17.3 15.9 18.0 19.0 17.8 12.5 13.4 12.2
SunTrust Banks, Inc. 9.6 8.6 8.5 10.3 9.2 9.1 12.3 10.9 10.9 9.2 8.2 8.2
Zions Bancorporation 12.1 11.0 11.0 13.5 12.3 12.3 15.2 13.7 13.7 11.1 9.9 9.9
Note: The capital ratios are calculated using capital action assumptions provided within the Dodd-Frank stress testing rule. See 12 CFR 252.56(b). These projections represent
hypothetical estimates that involve an economic outcome that is more adverse than expected. The minimum capital ratios are for the period 2017:Q1 to 2019:Q1.
Source: Federal Reserve estimates in the adverse scenario.
Table 10.C. Capital ratios, actual 2016:Q4 and projected 2017:Q1–2019:Q1 under the adverse scenario: 34 participating bank holding companies
Percent
Bank holding company
Common equitytier 1 capital ratio
Tier 1 capital ratio Total capital ratio Tier 1 leverage ratio Supplementary leverage ratio*
Actual 2016:Q4
Ending Mini-mum
Actual 2016:Q4
Ending Mini-mum
Actual 2016:Q4
Ending Mini-mum
Actual 2016:Q4
Ending Mini-mum
Actual 2016:Q4
Ending Mini-mum
34 participating bank holding companies 12.5 11.2 10.7 13.9 12.6 12.2 16.5 14.8 14.6 9.2 8.2 8.0 n/a 6.3 6.1
Note: The capital ratios are calculated using capital action assumptions provided within the Dodd-Frank Act stress testing rule. See 12 CFR 252.56(b). These projections
represent hypothetical estimates that involve an economic outcome that is more adverse than expected. The minimum capital ratios, other than the supplementary leverage
ratio, are for the period 2017:Q1 to 2019:Q1. The minimum supplementary leverage ratio is for the period 2018:Q1 to 2019:Q1. In accordance with the regulatory capital
framework, all risk-based capital ratios are calculated using standardized RWAs, which became effective on January 1, 2015.
* The supplementary leverage ratio is calculated only for firms subject to the advanced approaches.
n/a Not applicable.
Source: Federal Reserve estimates in the adverse scenario.
June 2017 43
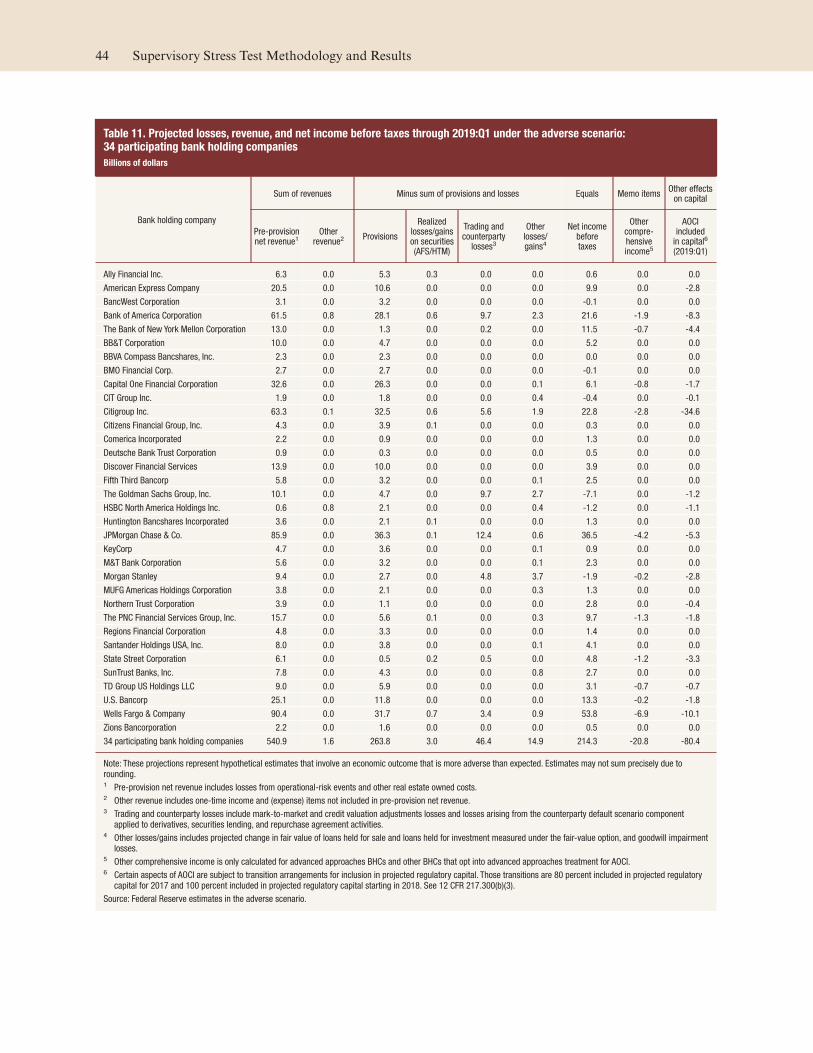
Table 11. Projected losses, revenue, and net income before taxes through 2019:Q1 under the adverse scenario: 34 participating bank holding companies
Billions of dollars
Bank holding company
Sum of revenues Minus sum of provisions and losses Equals Memo items Other effects
on capital
Pre-provision net revenue1
Otherrevenue2 Provisions
Realized losses/gains on securities (AFS/HTM)
Trading and counterparty
losses3
Otherlosses/gains4
Net incomebeforetaxes
Othercompre-hensiveincome5
AOCIincluded
in capital6
(2019:Q1)
Ally Financial Inc. 6.3 0.0 5.3 0.3 0.0 0.0 0.6 0.0 0.0
American Express Company 20.5 0.0 10.6 0.0 0.0 0.0 9.9 0.0 -2.8
BancWest Corporation 3.1 0.0 3.2 0.0 0.0 0.0 -0.1 0.0 0.0
Bank of America Corporation 61.5 0.8 28.1 0.6 9.7 2.3 21.6 -1.9 -8.3
The Bank of New York Mellon Corporation 13.0 0.0 1.3 0.0 0.2 0.0 11.5 -0.7 -4.4
BB&T Corporation 10.0 0.0 4.7 0.0 0.0 0.0 5.2 0.0 0.0
BBVA Compass Bancshares, Inc. 2.3 0.0 2.3 0.0 0.0 0.0 0.0 0.0 0.0
BMO Financial Corp. 2.7 0.0 2.7 0.0 0.0 0.0 -0.1 0.0 0.0
Capital One Financial Corporation 32.6 0.0 26.3 0.0 0.0 0.1 6.1 -0.8 -1.7
CIT Group Inc. 1.9 0.0 1.8 0.0 0.0 0.4 -0.4 0.0 -0.1
Citigroup Inc. 63.3 0.1 32.5 0.6 5.6 1.9 22.8 -2.8 -34.6
Citizens Financial Group, Inc. 4.3 0.0 3.9 0.1 0.0 0.0 0.3 0.0 0.0
Comerica Incorporated 2.2 0.0 0.9 0.0 0.0 0.0 1.3 0.0 0.0
Deutsche Bank Trust Corporation 0.9 0.0 0.3 0.0 0.0 0.0 0.5 0.0 0.0
Discover Financial Services 13.9 0.0 10.0 0.0 0.0 0.0 3.9 0.0 0.0
Fifth Third Bancorp 5.8 0.0 3.2 0.0 0.0 0.1 2.5 0.0 0.0
The Goldman Sachs Group, Inc. 10.1 0.0 4.7 0.0 9.7 2.7 -7.1 0.0 -1.2
HSBC North America Holdings Inc. 0.6 0.8 2.1 0.0 0.0 0.4 -1.2 0.0 -1.1
Huntington Bancshares Incorporated 3.6 0.0 2.1 0.1 0.0 0.0 1.3 0.0 0.0
JPMorgan Chase & Co. 85.9 0.0 36.3 0.1 12.4 0.6 36.5 -4.2 -5.3
KeyCorp 4.7 0.0 3.6 0.0 0.0 0.1 0.9 0.0 0.0
M&T Bank Corporation 5.6 0.0 3.2 0.0 0.0 0.1 2.3 0.0 0.0
Morgan Stanley 9.4 0.0 2.7 0.0 4.8 3.7 -1.9 -0.2 -2.8
MUFG Americas Holdings Corporation 3.8 0.0 2.1 0.0 0.0 0.3 1.3 0.0 0.0
Northern Trust Corporation 3.9 0.0 1.1 0.0 0.0 0.0 2.8 0.0 -0.4
The PNC Financial Services Group, Inc. 15.7 0.0 5.6 0.1 0.0 0.3 9.7 -1.3 -1.8
Regions Financial Corporation 4.8 0.0 3.3 0.0 0.0 0.0 1.4 0.0 0.0
Santander Holdings USA, Inc. 8.0 0.0 3.8 0.0 0.0 0.1 4.1 0.0 0.0
State Street Corporation 6.1 0.0 0.5 0.2 0.5 0.0 4.8 -1.2 -3.3
SunTrust Banks, Inc. 7.8 0.0 4.3 0.0 0.0 0.8 2.7 0.0 0.0
TD Group US Holdings LLC 9.0 0.0 5.9 0.0 0.0 0.0 3.1 -0.7 -0.7
U.S. Bancorp 25.1 0.0 11.8 0.0 0.0 0.0 13.3 -0.2 -1.8
Wells Fargo & Company 90.4 0.0 31.7 0.7 3.4 0.9 53.8 -6.9 -10.1
Zions Bancorporation 2.2 0.0 1.6 0.0 0.0 0.0 0.5 0.0 0.0
34 participating bank holding companies 540.9 1.6 263.8 3.0 46.4 14.9 214.3 -20.8 -80.4
Note: These projections represent hypothetical estimates that involve an economic outcome that is more adverse than expected. Estimates may not sum precisely due to
rounding.1 Pre-provision net revenue includes losses from operational-risk events and other real estate owned costs.2 Other revenue includes one-time income and (expense) items not included in pre-provision net revenue.3 Trading and counterparty losses include mark-to-market and credit valuation adjustments losses and losses arising from the counterparty default scenario component
applied to derivatives, securities lending, and repurchase agreement activities.4 Other losses/gains includes projected change in fair value of loans held for sale and loans held for investment measured under the fair-value option, and goodwill impairment
losses.5 Other comprehensive income is only calculated for advanced approaches BHCs and other BHCs that opt into advanced approaches treatment for AOCI.6 Certain aspects of AOCI are subject to transition arrangements for inclusion in projected regulatory capital. Those transitions are 80 percent included in projected regulatory
capital for 2017 and 100 percent included in projected regulatory capital starting in 2018. See 12 CFR 217.300(b)(3).
Source: Federal Reserve estimates in the adverse scenario.
44 Supervisory Stress Test Methodology and Results
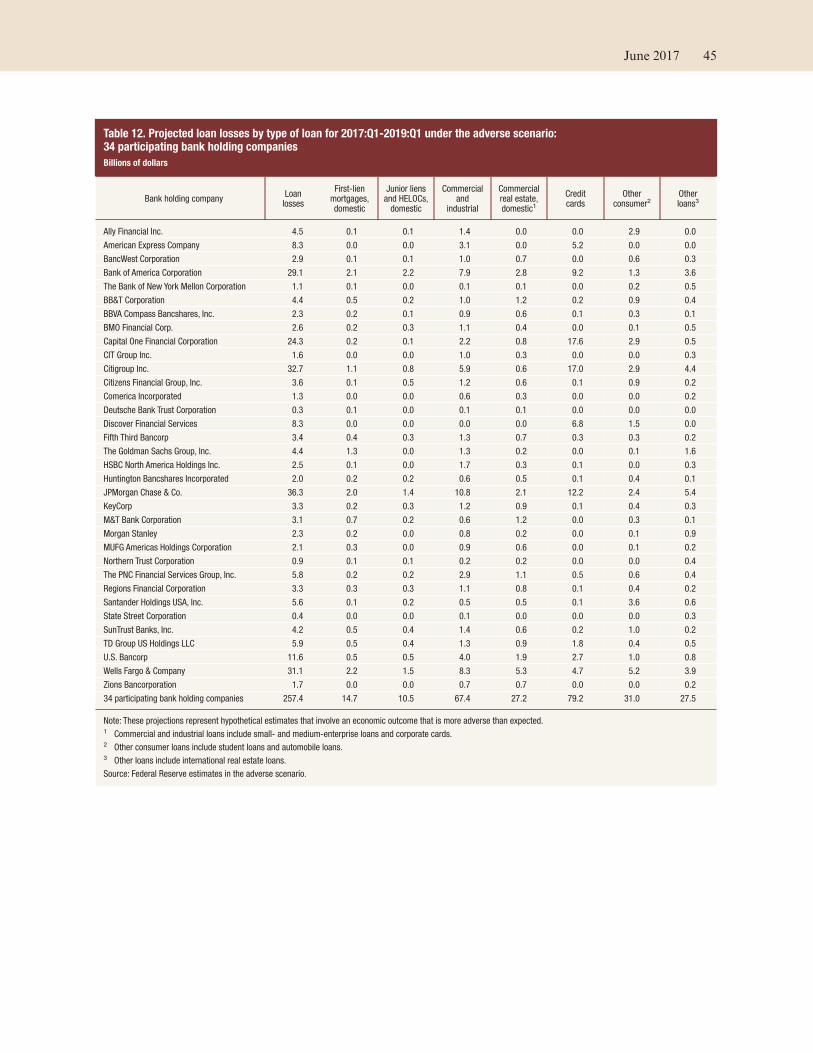
Table 12. Projected loan losses by type of loan for 2017:Q1-2019:Q1 under the adverse scenario: 34 participating bank holding companies
Billions of dollars
Bank holding company Loan
losses
First-lienmortgages,domestic
Junior liensand HELOCs,
domestic
Commercialand
industrial
Commercialreal estate,domestic1
Creditcards
Otherconsumer2
Otherloans3
Ally Financial Inc. 4.5 0.1 0.1 1.4 0.0 0.0 2.9 0.0
American Express Company 8.3 0.0 0.0 3.1 0.0 5.2 0.0 0.0
BancWest Corporation 2.9 0.1 0.1 1.0 0.7 0.0 0.6 0.3
Bank of America Corporation 29.1 2.1 2.2 7.9 2.8 9.2 1.3 3.6
The Bank of New York Mellon Corporation 1.1 0.1 0.0 0.1 0.1 0.0 0.2 0.5
BB&T Corporation 4.4 0.5 0.2 1.0 1.2 0.2 0.9 0.4
BBVA Compass Bancshares, Inc. 2.3 0.2 0.1 0.9 0.6 0.1 0.3 0.1
BMO Financial Corp. 2.6 0.2 0.3 1.1 0.4 0.0 0.1 0.5
Capital One Financial Corporation 24.3 0.2 0.1 2.2 0.8 17.6 2.9 0.5
CIT Group Inc. 1.6 0.0 0.0 1.0 0.3 0.0 0.0 0.3
Citigroup Inc. 32.7 1.1 0.8 5.9 0.6 17.0 2.9 4.4
Citizens Financial Group, Inc. 3.6 0.1 0.5 1.2 0.6 0.1 0.9 0.2
Comerica Incorporated 1.3 0.0 0.0 0.6 0.3 0.0 0.0 0.2
Deutsche Bank Trust Corporation 0.3 0.1 0.0 0.1 0.1 0.0 0.0 0.0
Discover Financial Services 8.3 0.0 0.0 0.0 0.0 6.8 1.5 0.0
Fifth Third Bancorp 3.4 0.4 0.3 1.3 0.7 0.3 0.3 0.2
The Goldman Sachs Group, Inc. 4.4 1.3 0.0 1.3 0.2 0.0 0.1 1.6
HSBC North America Holdings Inc. 2.5 0.1 0.0 1.7 0.3 0.1 0.0 0.3
Huntington Bancshares Incorporated 2.0 0.2 0.2 0.6 0.5 0.1 0.4 0.1
JPMorgan Chase & Co. 36.3 2.0 1.4 10.8 2.1 12.2 2.4 5.4
KeyCorp 3.3 0.2 0.3 1.2 0.9 0.1 0.4 0.3
M&T Bank Corporation 3.1 0.7 0.2 0.6 1.2 0.0 0.3 0.1
Morgan Stanley 2.3 0.2 0.0 0.8 0.2 0.0 0.1 0.9
MUFG Americas Holdings Corporation 2.1 0.3 0.0 0.9 0.6 0.0 0.1 0.2
Northern Trust Corporation 0.9 0.1 0.1 0.2 0.2 0.0 0.0 0.4
The PNC Financial Services Group, Inc. 5.8 0.2 0.2 2.9 1.1 0.5 0.6 0.4
Regions Financial Corporation 3.3 0.3 0.3 1.1 0.8 0.1 0.4 0.2
Santander Holdings USA, Inc. 5.6 0.1 0.2 0.5 0.5 0.1 3.6 0.6
State Street Corporation 0.4 0.0 0.0 0.1 0.0 0.0 0.0 0.3
SunTrust Banks, Inc. 4.2 0.5 0.4 1.4 0.6 0.2 1.0 0.2
TD Group US Holdings LLC 5.9 0.5 0.4 1.3 0.9 1.8 0.4 0.5
U.S. Bancorp 11.6 0.5 0.5 4.0 1.9 2.7 1.0 0.8
Wells Fargo & Company 31.1 2.2 1.5 8.3 5.3 4.7 5.2 3.9
Zions Bancorporation 1.7 0.0 0.0 0.7 0.7 0.0 0.0 0.2
34 participating bank holding companies 257.4 14.7 10.5 67.4 27.2 79.2 31.0 27.5
Note: These projections represent hypothetical estimates that involve an economic outcome that is more adverse than expected. 1 Commercial and industrial loans include small- and medium-enterprise loans and corporate cards.2 Other consumer loans include student loans and automobile loans.3 Other loans include international real estate loans.
Source: Federal Reserve estimates in the adverse scenario.
June 2017 45
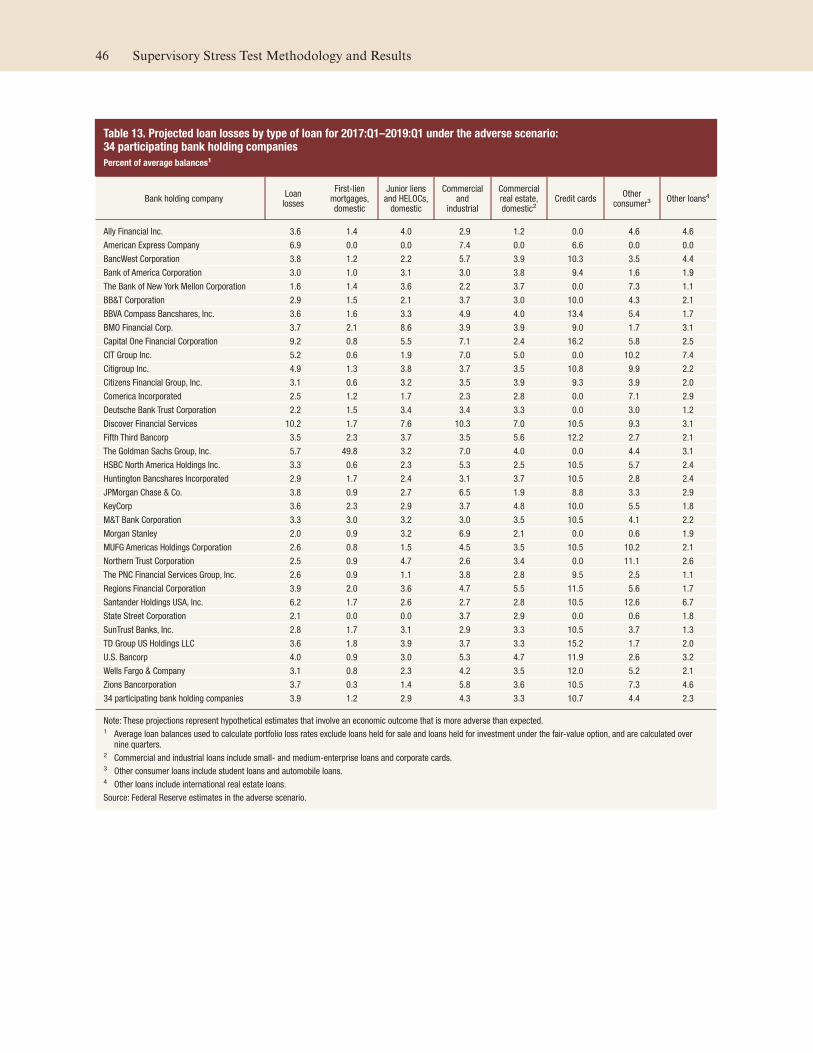
Table 13. Projected loan losses by type of loan for 2017:Q1–2019:Q1 under the adverse scenario: 34 participating bank holding companies
Percent of average balances1
Bank holding company Loan
losses
First-lienmortgages,domestic
Junior liensand HELOCs,
domestic
Commercialand
industrial
Commercialreal estate,domestic2
Credit cards Other
consumer3 Other loans4
Ally Financial Inc. 3.6 1.4 4.0 2.9 1.2 0.0 4.6 4.6
American Express Company 6.9 0.0 0.0 7.4 0.0 6.6 0.0 0.0
BancWest Corporation 3.8 1.2 2.2 5.7 3.9 10.3 3.5 4.4
Bank of America Corporation 3.0 1.0 3.1 3.0 3.8 9.4 1.6 1.9
The Bank of New York Mellon Corporation 1.6 1.4 3.6 2.2 3.7 0.0 7.3 1.1
BB&T Corporation 2.9 1.5 2.1 3.7 3.0 10.0 4.3 2.1
BBVA Compass Bancshares, Inc. 3.6 1.6 3.3 4.9 4.0 13.4 5.4 1.7
BMO Financial Corp. 3.7 2.1 8.6 3.9 3.9 9.0 1.7 3.1
Capital One Financial Corporation 9.2 0.8 5.5 7.1 2.4 16.2 5.8 2.5
CIT Group Inc. 5.2 0.6 1.9 7.0 5.0 0.0 10.2 7.4
Citigroup Inc. 4.9 1.3 3.8 3.7 3.5 10.8 9.9 2.2
Citizens Financial Group, Inc. 3.1 0.6 3.2 3.5 3.9 9.3 3.9 2.0
Comerica Incorporated 2.5 1.2 1.7 2.3 2.8 0.0 7.1 2.9
Deutsche Bank Trust Corporation 2.2 1.5 3.4 3.4 3.3 0.0 3.0 1.2
Discover Financial Services 10.2 1.7 7.6 10.3 7.0 10.5 9.3 3.1
Fifth Third Bancorp 3.5 2.3 3.7 3.5 5.6 12.2 2.7 2.1
The Goldman Sachs Group, Inc. 5.7 49.8 3.2 7.0 4.0 0.0 4.4 3.1
HSBC North America Holdings Inc. 3.3 0.6 2.3 5.3 2.5 10.5 5.7 2.4
Huntington Bancshares Incorporated 2.9 1.7 2.4 3.1 3.7 10.5 2.8 2.4
JPMorgan Chase & Co. 3.8 0.9 2.7 6.5 1.9 8.8 3.3 2.9
KeyCorp 3.6 2.3 2.9 3.7 4.8 10.0 5.5 1.8
M&T Bank Corporation 3.3 3.0 3.2 3.0 3.5 10.5 4.1 2.2
Morgan Stanley 2.0 0.9 3.2 6.9 2.1 0.0 0.6 1.9
MUFG Americas Holdings Corporation 2.6 0.8 1.5 4.5 3.5 10.5 10.2 2.1
Northern Trust Corporation 2.5 0.9 4.7 2.6 3.4 0.0 11.1 2.6
The PNC Financial Services Group, Inc. 2.6 0.9 1.1 3.8 2.8 9.5 2.5 1.1
Regions Financial Corporation 3.9 2.0 3.6 4.7 5.5 11.5 5.6 1.7
Santander Holdings USA, Inc. 6.2 1.7 2.6 2.7 2.8 10.5 12.6 6.7
State Street Corporation 2.1 0.0 0.0 3.7 2.9 0.0 0.6 1.8
SunTrust Banks, Inc. 2.8 1.7 3.1 2.9 3.3 10.5 3.7 1.3
TD Group US Holdings LLC 3.6 1.8 3.9 3.7 3.3 15.2 1.7 2.0
U.S. Bancorp 4.0 0.9 3.0 5.3 4.7 11.9 2.6 3.2
Wells Fargo & Company 3.1 0.8 2.3 4.2 3.5 12.0 5.2 2.1
Zions Bancorporation 3.7 0.3 1.4 5.8 3.6 10.5 7.3 4.6
34 participating bank holding companies 3.9 1.2 2.9 4.3 3.3 10.7 4.4 2.3
Note: These projections represent hypothetical estimates that involve an economic outcome that is more adverse than expected.1 Average loan balances used to calculate portfolio loss rates exclude loans held for sale and loans held for investment under the fair-value option, and are calculated over
nine quarters.2 Commercial and industrial loans include small- and medium-enterprise loans and corporate cards.3 Other consumer loans include student loans and automobile loans.4 Other loans include international real estate loans.
Source: Federal Reserve estimates in the adverse scenario.
46 Supervisory Stress Test Methodology and Results
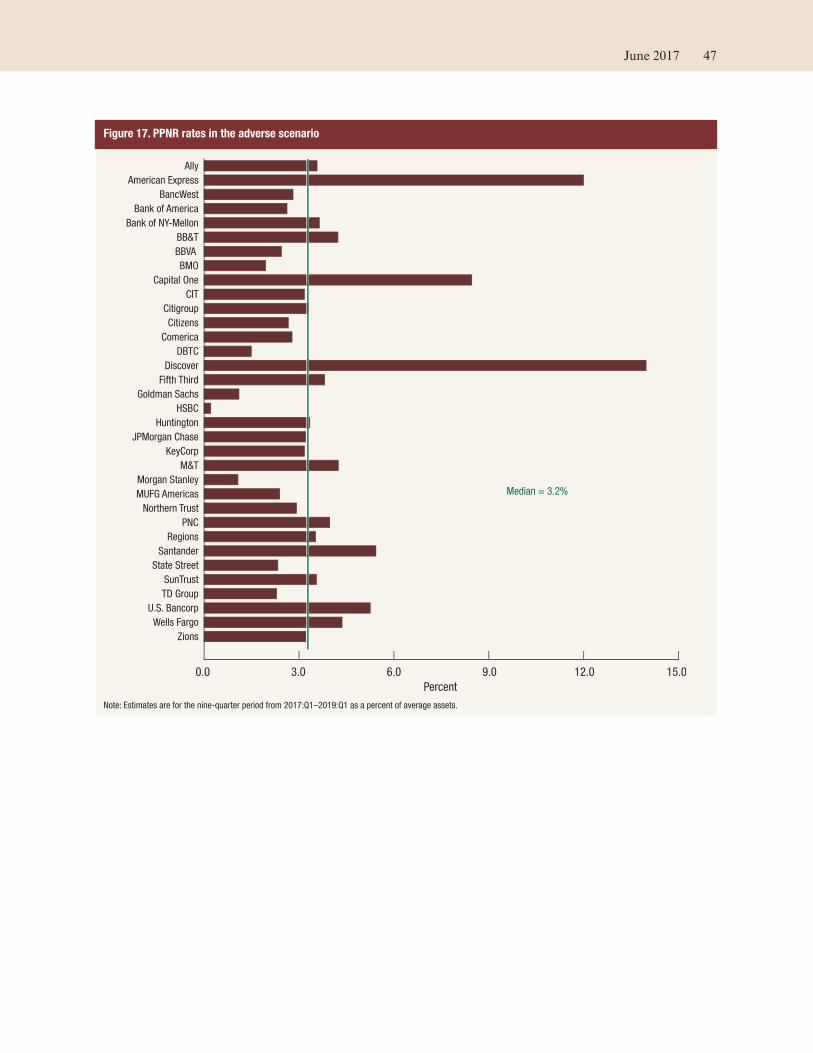
Figure 17. PPNR rates in the adverse scenario
0.0 3.0 6.0 9.0 12.0 15.0
Zions
Wells Fargo
U.S. Bancorp
TD Group
SunTrust
State Street
Santander
Regions
PNC
Northern Trust
MUFG Americas
Morgan Stanley
M&T
KeyCorp
JPMorgan Chase
Huntington
HSBC
Goldman Sachs
Fifth Third
Discover
DBTC
Comerica
Citizens
Citigroup
CIT
Capital One
BMO
BBVA
BB&T
Bank of NY-Mellon
Bank of America
BancWest
American Express
Ally
Percent
Median = 3.2%
Note: Estimates are for the nine-quarter period from 2017:Q1–2019:Q1 as a percent of average assets.
June 2017 47
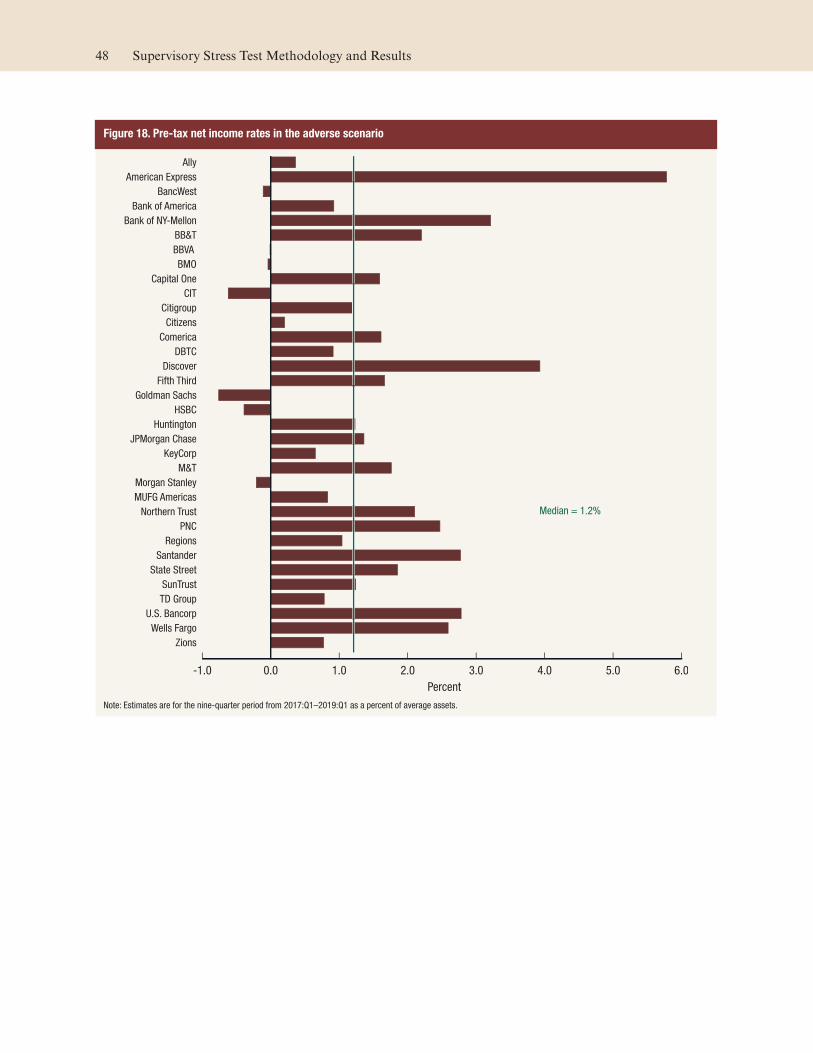
Figure 18. Pre-tax net income rates in the adverse scenario
-1.0 0.0 1.0 2.0 3.0 4.0 5.0 6.0
Zions
Wells Fargo
U.S. Bancorp
TD Group
SunTrust
State Street
Santander
Regions
PNC
Northern Trust
MUFG Americas
Morgan Stanley
M&T
KeyCorp
JPMorgan Chase
Huntington
HSBC
Goldman Sachs
Fifth Third
Discover
DBTC
Comerica
Citizens
Citigroup
CIT
Capital One
BMO
BBVA
BB&T
Bank of NY-Mellon
Bank of America
BancWest
American Express
Ally
Percent
Median = 1.2%
Note: Estimates are for the nine-quarter period from 2017:Q1–2019:Q1 as a percent of average assets.
48 Supervisory Stress Test Methodology and Results
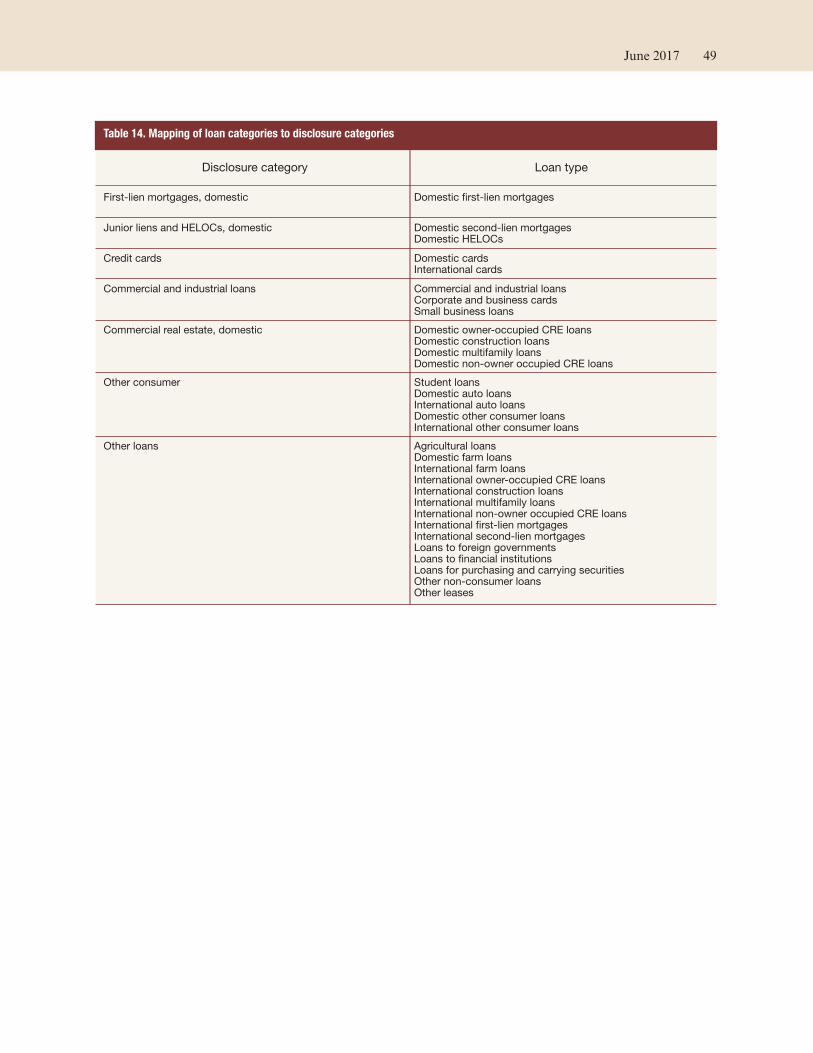
Table 14. Mapping of loan categories to disclosure categories
Disclosure category Loan type
First-lien mortgages, domestic Domestic first-lien mortgages
Junior liens and HELOCs, domestic Domestic second-lien mortgagesDomestic HELOCs
Credit cards Domestic cardsInternational cards
Commercial and industrial loans Commercial and industrial loansCorporate and business cardsSmall business loans
Commercial real estate, domestic Domestic owner-occupied CRE loansDomestic construction loansDomestic multifamily loansDomestic non-owner occupied CRE loans
Other consumer Student loansDomestic auto loansInternational auto loansDomestic other consumer loansInternational other consumer loans
Other loans Agricultural loansDomestic farm loansInternational farm loansInternational owner-occupied CRE loansInternational construction loansInternational multifamily loansInternational non-owner occupied CRE loansInternational first-lien mortgagesInternational second-lien mortgagesLoans to foreign governmentsLoans to financial institutionsLoans for purchasing and carrying securitiesOther non-consumer loansOther leases
June 2017 49

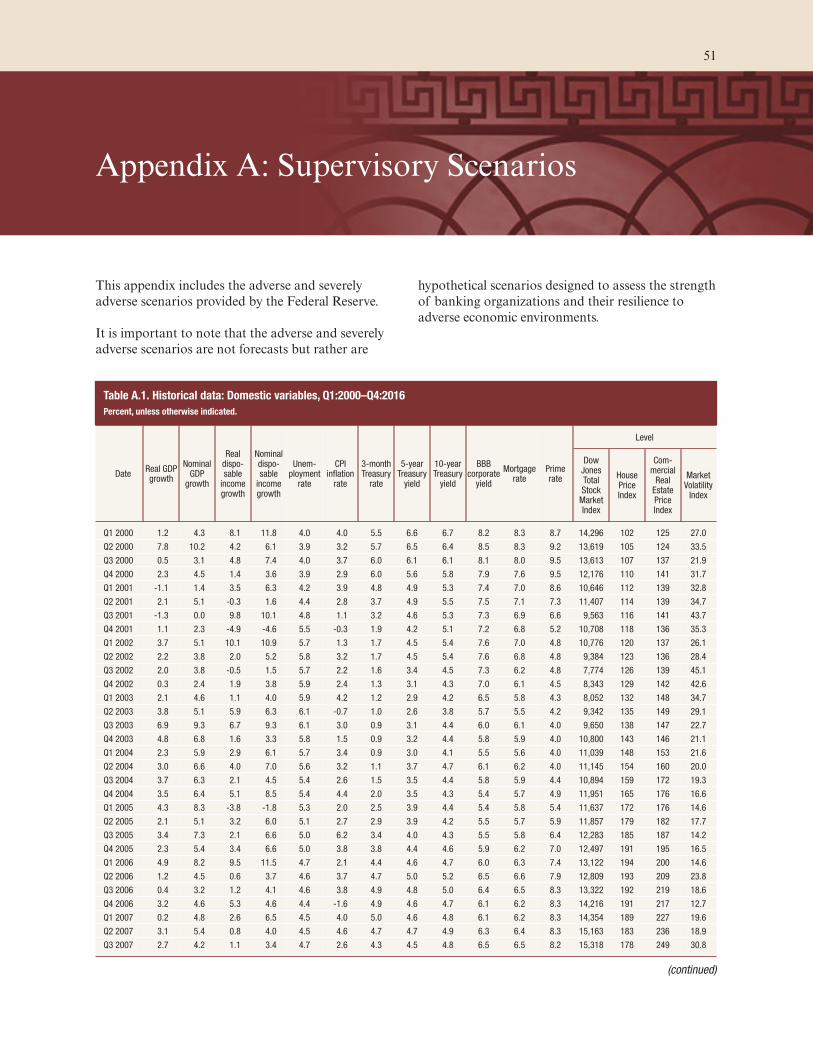
Appendix A: Supervisory Scenarios
This appendix includes the adverse and severely
adverse scenarios provided by the Federal Reserve.
It is important to note that the adverse and severely
adverse scenarios are not forecasts but rather are
hypothetical scenarios designed to assess the strength
of banking organizations and their resilience to
adverse economic environments.
Table A.1. Historical data: Domestic variables, Q1:2000–Q4:2016
Percent, unless otherwise indicated.
DateReal GDP growth
Nominal GDP
growth
Real dispo-sable
income growth
Nominal dispo-sable
income growth
Unem-ployment
rate
CPI inflation
rate
3-month Treasury
rate
5-year Treasury
yield
10-year Treasury
yield
BBB corporate
yield
Mortgagerate
Prime rate
Level
Dow Jones Total Stock
Market Index
House Price Index
Com-mercial
Real Estate Price Index
Market Volatility
Index
Q1 2000 1.2 4.3 8.1 11.8 4.0 4.0 5.5 6.6 6.7 8.2 8.3 8.7 14,296 102 125 27.0
Q2 2000 7.8 10.2 4.2 6.1 3.9 3.2 5.7 6.5 6.4 8.5 8.3 9.2 13,619 105 124 33.5
Q3 2000 0.5 3.1 4.8 7.4 4.0 3.7 6.0 6.1 6.1 8.1 8.0 9.5 13,613 107 137 21.9
Q4 2000 2.3 4.5 1.4 3.6 3.9 2.9 6.0 5.6 5.8 7.9 7.6 9.5 12,176 110 141 31.7
Q1 2001 -1.1 1.4 3.5 6.3 4.2 3.9 4.8 4.9 5.3 7.4 7.0 8.6 10,646 112 139 32.8
Q2 2001 2.1 5.1 -0.3 1.6 4.4 2.8 3.7 4.9 5.5 7.5 7.1 7.3 11,407 114 139 34.7
Q3 2001 -1.3 0.0 9.8 10.1 4.8 1.1 3.2 4.6 5.3 7.3 6.9 6.6 9,563 116 141 43.7
Q4 2001 1.1 2.3 -4.9 -4.6 5.5 -0.3 1.9 4.2 5.1 7.2 6.8 5.2 10,708 118 136 35.3
Q1 2002 3.7 5.1 10.1 10.9 5.7 1.3 1.7 4.5 5.4 7.6 7.0 4.8 10,776 120 137 26.1
Q2 2002 2.2 3.8 2.0 5.2 5.8 3.2 1.7 4.5 5.4 7.6 6.8 4.8 9,384 123 136 28.4
Q3 2002 2.0 3.8 -0.5 1.5 5.7 2.2 1.6 3.4 4.5 7.3 6.2 4.8 7,774 126 139 45.1
Q4 2002 0.3 2.4 1.9 3.8 5.9 2.4 1.3 3.1 4.3 7.0 6.1 4.5 8,343 129 142 42.6
Q1 2003 2.1 4.6 1.1 4.0 5.9 4.2 1.2 2.9 4.2 6.5 5.8 4.3 8,052 132 148 34.7
Q2 2003 3.8 5.1 5.9 6.3 6.1 -0.7 1.0 2.6 3.8 5.7 5.5 4.2 9,342 135 149 29.1
Q3 2003 6.9 9.3 6.7 9.3 6.1 3.0 0.9 3.1 4.4 6.0 6.1 4.0 9,650 138 147 22.7
Q4 2003 4.8 6.8 1.6 3.3 5.8 1.5 0.9 3.2 4.4 5.8 5.9 4.0 10,800 143 146 21.1
Q1 2004 2.3 5.9 2.9 6.1 5.7 3.4 0.9 3.0 4.1 5.5 5.6 4.0 11,039 148 153 21.6
Q2 2004 3.0 6.6 4.0 7.0 5.6 3.2 1.1 3.7 4.7 6.1 6.2 4.0 11,145 154 160 20.0
Q3 2004 3.7 6.3 2.1 4.5 5.4 2.6 1.5 3.5 4.4 5.8 5.9 4.4 10,894 159 172 19.3
Q4 2004 3.5 6.4 5.1 8.5 5.4 4.4 2.0 3.5 4.3 5.4 5.7 4.9 11,951 165 176 16.6
Q1 2005 4.3 8.3 -3.8 -1.8 5.3 2.0 2.5 3.9 4.4 5.4 5.8 5.4 11,637 172 176 14.6
Q2 2005 2.1 5.1 3.2 6.0 5.1 2.7 2.9 3.9 4.2 5.5 5.7 5.9 11,857 179 182 17.7
Q3 2005 3.4 7.3 2.1 6.6 5.0 6.2 3.4 4.0 4.3 5.5 5.8 6.4 12,283 185 187 14.2
Q4 2005 2.3 5.4 3.4 6.6 5.0 3.8 3.8 4.4 4.6 5.9 6.2 7.0 12,497 191 195 16.5
Q1 2006 4.9 8.2 9.5 11.5 4.7 2.1 4.4 4.6 4.7 6.0 6.3 7.4 13,122 194 200 14.6
Q2 2006 1.2 4.5 0.6 3.7 4.6 3.7 4.7 5.0 5.2 6.5 6.6 7.9 12,809 193 209 23.8
Q3 2006 0.4 3.2 1.2 4.1 4.6 3.8 4.9 4.8 5.0 6.4 6.5 8.3 13,322 192 219 18.6
Q4 2006 3.2 4.6 5.3 4.6 4.4 -1.6 4.9 4.6 4.7 6.1 6.2 8.3 14,216 191 217 12.7
Q1 2007 0.2 4.8 2.6 6.5 4.5 4.0 5.0 4.6 4.8 6.1 6.2 8.3 14,354 189 227 19.6
Q2 2007 3.1 5.4 0.8 4.0 4.5 4.6 4.7 4.7 4.9 6.3 6.4 8.3 15,163 183 236 18.9
Q3 2007 2.7 4.2 1.1 3.4 4.7 2.6 4.3 4.5 4.8 6.5 6.5 8.2 15,318 178 249 30.8
(continued)
51
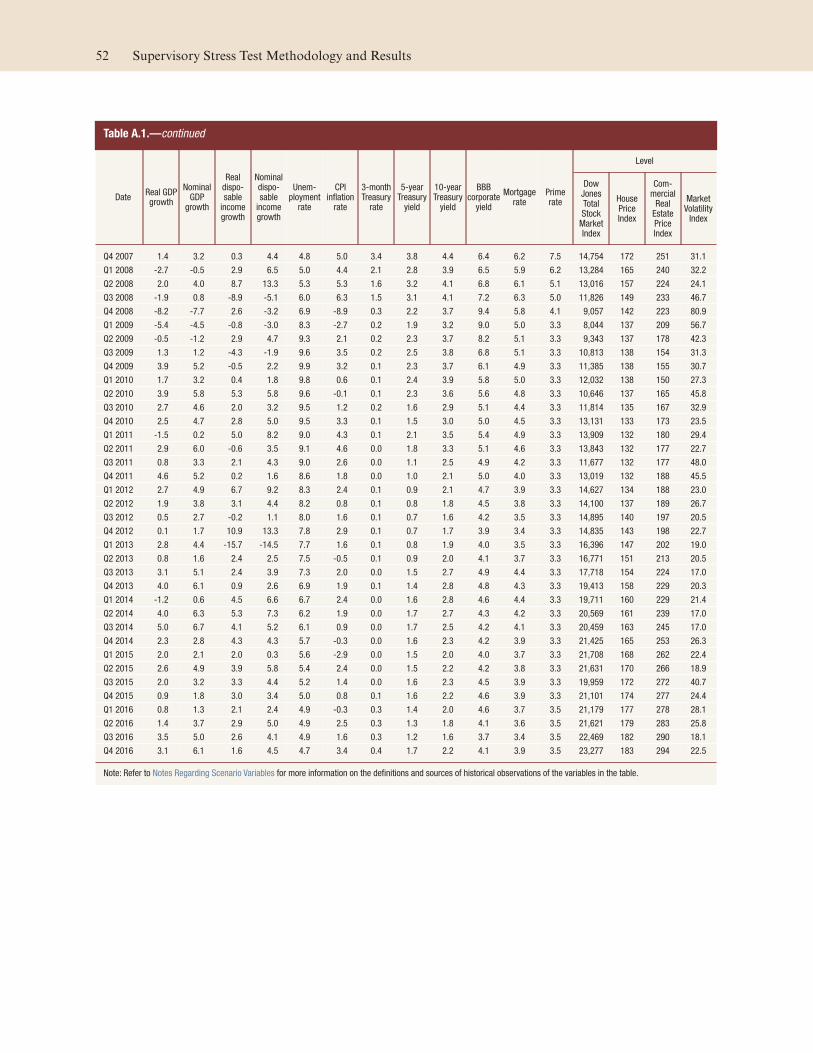
Table A.1.—continued
DateReal GDP growth
Nominal GDP
growth
Real dispo-sable
income growth
Nominal dispo-sable
income growth
Unem-ployment
rate
CPI inflation
rate
3-month Treasury
rate
5-year Treasury
yield
10-year Treasury
yield
BBB corporate
yield
Mortgagerate
Prime rate
Level
Dow Jones Total Stock
Market Index
House Price Index
Com-mercial
Real Estate Price Index
Market Volatility
Index
Q4 2007 1.4 3.2 0.3 4.4 4.8 5.0 3.4 3.8 4.4 6.4 6.2 7.5 14,754 172 251 31.1
Q1 2008 -2.7 -0.5 2.9 6.5 5.0 4.4 2.1 2.8 3.9 6.5 5.9 6.2 13,284 165 240 32.2
Q2 2008 2.0 4.0 8.7 13.3 5.3 5.3 1.6 3.2 4.1 6.8 6.1 5.1 13,016 157 224 24.1
Q3 2008 -1.9 0.8 -8.9 -5.1 6.0 6.3 1.5 3.1 4.1 7.2 6.3 5.0 11,826 149 233 46.7
Q4 2008 -8.2 -7.7 2.6 -3.2 6.9 -8.9 0.3 2.2 3.7 9.4 5.8 4.1 9,057 142 223 80.9
Q1 2009 -5.4 -4.5 -0.8 -3.0 8.3 -2.7 0.2 1.9 3.2 9.0 5.0 3.3 8,044 137 209 56.7
Q2 2009 -0.5 -1.2 2.9 4.7 9.3 2.1 0.2 2.3 3.7 8.2 5.1 3.3 9,343 137 178 42.3
Q3 2009 1.3 1.2 -4.3 -1.9 9.6 3.5 0.2 2.5 3.8 6.8 5.1 3.3 10,813 138 154 31.3
Q4 2009 3.9 5.2 -0.5 2.2 9.9 3.2 0.1 2.3 3.7 6.1 4.9 3.3 11,385 138 155 30.7
Q1 2010 1.7 3.2 0.4 1.8 9.8 0.6 0.1 2.4 3.9 5.8 5.0 3.3 12,032 138 150 27.3
Q2 2010 3.9 5.8 5.3 5.8 9.6 -0.1 0.1 2.3 3.6 5.6 4.8 3.3 10,646 137 165 45.8
Q3 2010 2.7 4.6 2.0 3.2 9.5 1.2 0.2 1.6 2.9 5.1 4.4 3.3 11,814 135 167 32.9
Q4 2010 2.5 4.7 2.8 5.0 9.5 3.3 0.1 1.5 3.0 5.0 4.5 3.3 13,131 133 173 23.5
Q1 2011 -1.5 0.2 5.0 8.2 9.0 4.3 0.1 2.1 3.5 5.4 4.9 3.3 13,909 132 180 29.4
Q2 2011 2.9 6.0 -0.6 3.5 9.1 4.6 0.0 1.8 3.3 5.1 4.6 3.3 13,843 132 177 22.7
Q3 2011 0.8 3.3 2.1 4.3 9.0 2.6 0.0 1.1 2.5 4.9 4.2 3.3 11,677 132 177 48.0
Q4 2011 4.6 5.2 0.2 1.6 8.6 1.8 0.0 1.0 2.1 5.0 4.0 3.3 13,019 132 188 45.5
Q1 2012 2.7 4.9 6.7 9.2 8.3 2.4 0.1 0.9 2.1 4.7 3.9 3.3 14,627 134 188 23.0
Q2 2012 1.9 3.8 3.1 4.4 8.2 0.8 0.1 0.8 1.8 4.5 3.8 3.3 14,100 137 189 26.7
Q3 2012 0.5 2.7 -0.2 1.1 8.0 1.6 0.1 0.7 1.6 4.2 3.5 3.3 14,895 140 197 20.5
Q4 2012 0.1 1.7 10.9 13.3 7.8 2.9 0.1 0.7 1.7 3.9 3.4 3.3 14,835 143 198 22.7
Q1 2013 2.8 4.4 -15.7 -14.5 7.7 1.6 0.1 0.8 1.9 4.0 3.5 3.3 16,396 147 202 19.0
Q2 2013 0.8 1.6 2.4 2.5 7.5 -0.5 0.1 0.9 2.0 4.1 3.7 3.3 16,771 151 213 20.5
Q3 2013 3.1 5.1 2.4 3.9 7.3 2.0 0.0 1.5 2.7 4.9 4.4 3.3 17,718 154 224 17.0
Q4 2013 4.0 6.1 0.9 2.6 6.9 1.9 0.1 1.4 2.8 4.8 4.3 3.3 19,413 158 229 20.3
Q1 2014 -1.2 0.6 4.5 6.6 6.7 2.4 0.0 1.6 2.8 4.6 4.4 3.3 19,711 160 229 21.4
Q2 2014 4.0 6.3 5.3 7.3 6.2 1.9 0.0 1.7 2.7 4.3 4.2 3.3 20,569 161 239 17.0
Q3 2014 5.0 6.7 4.1 5.2 6.1 0.9 0.0 1.7 2.5 4.2 4.1 3.3 20,459 163 245 17.0
Q4 2014 2.3 2.8 4.3 4.3 5.7 -0.3 0.0 1.6 2.3 4.2 3.9 3.3 21,425 165 253 26.3
Q1 2015 2.0 2.1 2.0 0.3 5.6 -2.9 0.0 1.5 2.0 4.0 3.7 3.3 21,708 168 262 22.4
Q2 2015 2.6 4.9 3.9 5.8 5.4 2.4 0.0 1.5 2.2 4.2 3.8 3.3 21,631 170 266 18.9
Q3 2015 2.0 3.2 3.3 4.4 5.2 1.4 0.0 1.6 2.3 4.5 3.9 3.3 19,959 172 272 40.7
Q4 2015 0.9 1.8 3.0 3.4 5.0 0.8 0.1 1.6 2.2 4.6 3.9 3.3 21,101 174 277 24.4
Q1 2016 0.8 1.3 2.1 2.4 4.9 -0.3 0.3 1.4 2.0 4.6 3.7 3.5 21,179 177 278 28.1
Q2 2016 1.4 3.7 2.9 5.0 4.9 2.5 0.3 1.3 1.8 4.1 3.6 3.5 21,621 179 283 25.8
Q3 2016 3.5 5.0 2.6 4.1 4.9 1.6 0.3 1.2 1.6 3.7 3.4 3.5 22,469 182 290 18.1
Q4 2016 3.1 6.1 1.6 4.5 4.7 3.4 0.4 1.7 2.2 4.1 3.9 3.5 23,277 183 294 22.5
Note: Refer to Notes Regarding Scenario Variables for more information on the definitions and sources of historical observations of the variables in the table.
52 Supervisory Stress Test Methodology and Results
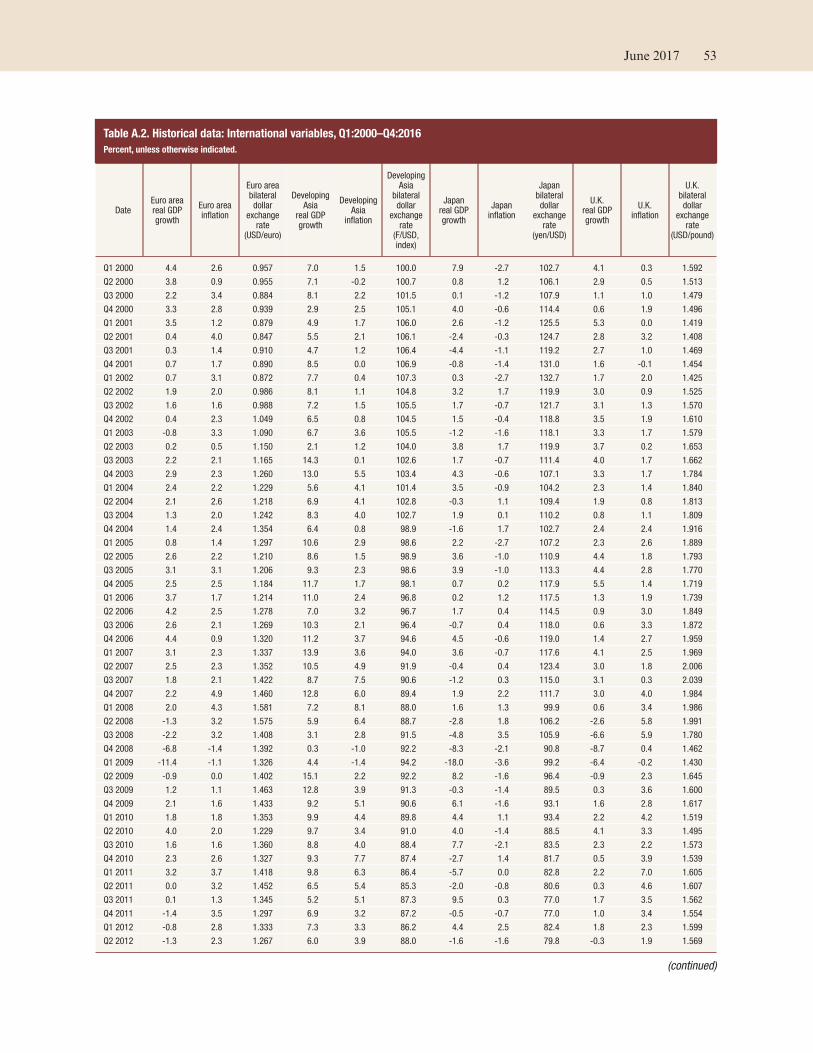
Table A.2. Historical data: International variables, Q1:2000–Q4:2016
Percent, unless otherwise indicated.
Date Euro area real GDP growth
Euro area inflation
Euro area bilateral dollar
exchange rate
(USD/euro)
Developing Asia
real GDP growth
Developing Asia
inflation
Developing Asia
bilateral dollar
exchange rate
(F/USD, index)
Japan real GDP growth
Japan inflation
Japan bilateral dollar
exchange rate
(yen/USD)
U.K. real GDP growth
U.K. inflation
U.K. bilateral dollar
exchange rate
(USD/pound)
Q1 2000 4.4 2.6 0.957 7.0 1.5 100.0 7.9 -2.7 102.7 4.1 0.3 1.592
Q2 2000 3.8 0.9 0.955 7.1 -0.2 100.7 0.8 1.2 106.1 2.9 0.5 1.513
Q3 2000 2.2 3.4 0.884 8.1 2.2 101.5 0.1 -1.2 107.9 1.1 1.0 1.479
Q4 2000 3.3 2.8 0.939 2.9 2.5 105.1 4.0 -0.6 114.4 0.6 1.9 1.496
Q1 2001 3.5 1.2 0.879 4.9 1.7 106.0 2.6 -1.2 125.5 5.3 0.0 1.419
Q2 2001 0.4 4.0 0.847 5.5 2.1 106.1 -2.4 -0.3 124.7 2.8 3.2 1.408
Q3 2001 0.3 1.4 0.910 4.7 1.2 106.4 -4.4 -1.1 119.2 2.7 1.0 1.469
Q4 2001 0.7 1.7 0.890 8.5 0.0 106.9 -0.8 -1.4 131.0 1.6 -0.1 1.454
Q1 2002 0.7 3.1 0.872 7.7 0.4 107.3 0.3 -2.7 132.7 1.7 2.0 1.425
Q2 2002 1.9 2.0 0.986 8.1 1.1 104.8 3.2 1.7 119.9 3.0 0.9 1.525
Q3 2002 1.6 1.6 0.988 7.2 1.5 105.5 1.7 -0.7 121.7 3.1 1.3 1.570
Q4 2002 0.4 2.3 1.049 6.5 0.8 104.5 1.5 -0.4 118.8 3.5 1.9 1.610
Q1 2003 -0.8 3.3 1.090 6.7 3.6 105.5 -1.2 -1.6 118.1 3.3 1.7 1.579
Q2 2003 0.2 0.5 1.150 2.1 1.2 104.0 3.8 1.7 119.9 3.7 0.2 1.653
Q3 2003 2.2 2.1 1.165 14.3 0.1 102.6 1.7 -0.7 111.4 4.0 1.7 1.662
Q4 2003 2.9 2.3 1.260 13.0 5.5 103.4 4.3 -0.6 107.1 3.3 1.7 1.784
Q1 2004 2.4 2.2 1.229 5.6 4.1 101.4 3.5 -0.9 104.2 2.3 1.4 1.840
Q2 2004 2.1 2.6 1.218 6.9 4.1 102.8 -0.3 1.1 109.4 1.9 0.8 1.813
Q3 2004 1.3 2.0 1.242 8.3 4.0 102.7 1.9 0.1 110.2 0.8 1.1 1.809
Q4 2004 1.4 2.4 1.354 6.4 0.8 98.9 -1.6 1.7 102.7 2.4 2.4 1.916
Q1 2005 0.8 1.4 1.297 10.6 2.9 98.6 2.2 -2.7 107.2 2.3 2.6 1.889
Q2 2005 2.6 2.2 1.210 8.6 1.5 98.9 3.6 -1.0 110.9 4.4 1.8 1.793
Q3 2005 3.1 3.1 1.206 9.3 2.3 98.6 3.9 -1.0 113.3 4.4 2.8 1.770
Q4 2005 2.5 2.5 1.184 11.7 1.7 98.1 0.7 0.2 117.9 5.5 1.4 1.719
Q1 2006 3.7 1.7 1.214 11.0 2.4 96.8 0.2 1.2 117.5 1.3 1.9 1.739
Q2 2006 4.2 2.5 1.278 7.0 3.2 96.7 1.7 0.4 114.5 0.9 3.0 1.849
Q3 2006 2.6 2.1 1.269 10.3 2.1 96.4 -0.7 0.4 118.0 0.6 3.3 1.872
Q4 2006 4.4 0.9 1.320 11.2 3.7 94.6 4.5 -0.6 119.0 1.4 2.7 1.959
Q1 2007 3.1 2.3 1.337 13.9 3.6 94.0 3.6 -0.7 117.6 4.1 2.5 1.969
Q2 2007 2.5 2.3 1.352 10.5 4.9 91.9 -0.4 0.4 123.4 3.0 1.8 2.006
Q3 2007 1.8 2.1 1.422 8.7 7.5 90.6 -1.2 0.3 115.0 3.1 0.3 2.039
Q4 2007 2.2 4.9 1.460 12.8 6.0 89.4 1.9 2.2 111.7 3.0 4.0 1.984
Q1 2008 2.0 4.3 1.581 7.2 8.1 88.0 1.6 1.3 99.9 0.6 3.4 1.986
Q2 2008 -1.3 3.2 1.575 5.9 6.4 88.7 -2.8 1.8 106.2 -2.6 5.8 1.991
Q3 2008 -2.2 3.2 1.408 3.1 2.8 91.5 -4.8 3.5 105.9 -6.6 5.9 1.780
Q4 2008 -6.8 -1.4 1.392 0.3 -1.0 92.2 -8.3 -2.1 90.8 -8.7 0.4 1.462
Q1 2009 -11.4 -1.1 1.326 4.4 -1.4 94.2 -18.0 -3.6 99.2 -6.4 -0.2 1.430
Q2 2009 -0.9 0.0 1.402 15.1 2.2 92.2 8.2 -1.6 96.4 -0.9 2.3 1.645
Q3 2009 1.2 1.1 1.463 12.8 3.9 91.3 -0.3 -1.4 89.5 0.3 3.6 1.600
Q4 2009 2.1 1.6 1.433 9.2 5.1 90.6 6.1 -1.6 93.1 1.6 2.8 1.617
Q1 2010 1.8 1.8 1.353 9.9 4.4 89.8 4.4 1.1 93.4 2.2 4.2 1.519
Q2 2010 4.0 2.0 1.229 9.7 3.4 91.0 4.0 -1.4 88.5 4.1 3.3 1.495
Q3 2010 1.6 1.6 1.360 8.8 4.0 88.4 7.7 -2.1 83.5 2.3 2.2 1.573
Q4 2010 2.3 2.6 1.327 9.3 7.7 87.4 -2.7 1.4 81.7 0.5 3.9 1.539
Q1 2011 3.2 3.7 1.418 9.8 6.3 86.4 -5.7 0.0 82.8 2.2 7.0 1.605
Q2 2011 0.0 3.2 1.452 6.5 5.4 85.3 -2.0 -0.8 80.6 0.3 4.6 1.607
Q3 2011 0.1 1.3 1.345 5.2 5.1 87.3 9.5 0.3 77.0 1.7 3.5 1.562
Q4 2011 -1.4 3.5 1.297 6.9 3.2 87.2 -0.5 -0.7 77.0 1.0 3.4 1.554
Q1 2012 -0.8 2.8 1.333 7.3 3.3 86.2 4.4 2.5 82.4 1.8 2.3 1.599
Q2 2012 -1.3 2.3 1.267 6.0 3.9 88.0 -1.6 -1.6 79.8 -0.3 1.9 1.569
(continued)
June 2017 53
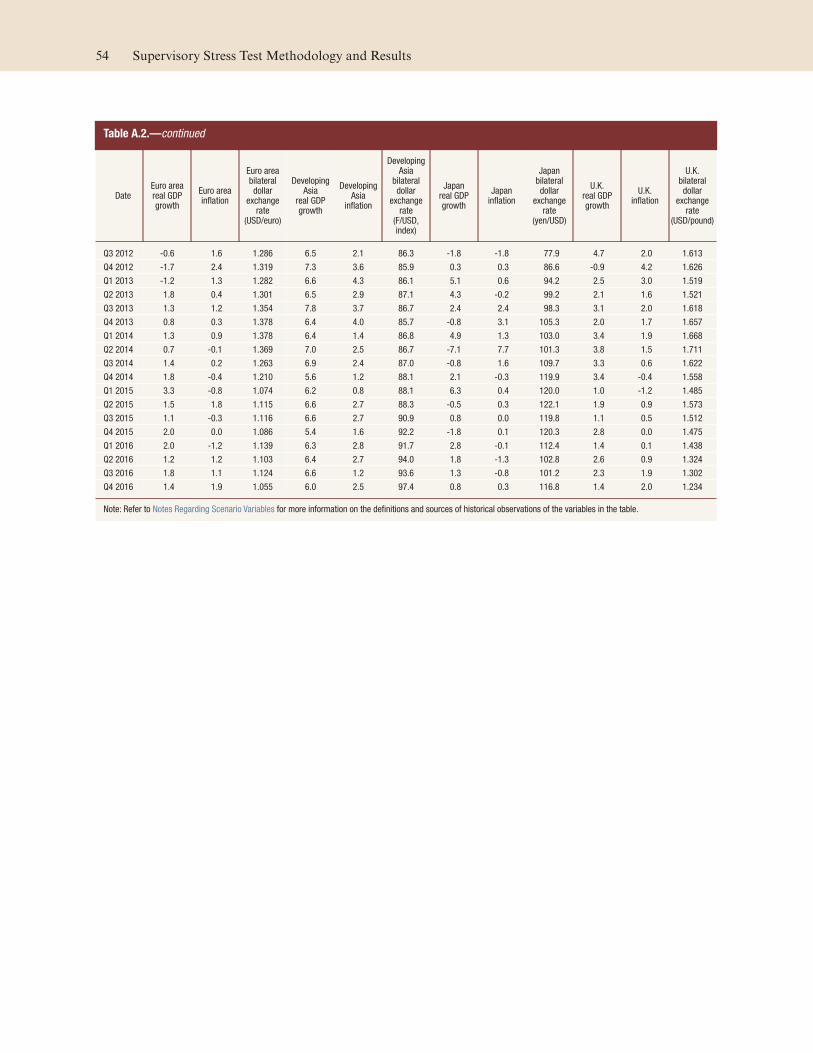
Table A.2.—continued
Date Euro area real GDP growth
Euro area inflation
Euro area bilateral dollar
exchange rate
(USD/euro)
Developing Asia
real GDP growth
Developing Asia
inflation
Developing Asia
bilateral dollar
exchange rate
(F/USD, index)
Japan real GDP growth
Japan inflation
Japan bilateral dollar
exchange rate
(yen/USD)
U.K. real GDP growth
U.K. inflation
U.K. bilateral dollar
exchange rate
(USD/pound)
Q3 2012 -0.6 1.6 1.286 6.5 2.1 86.3 -1.8 -1.8 77.9 4.7 2.0 1.613
Q4 2012 -1.7 2.4 1.319 7.3 3.6 85.9 0.3 0.3 86.6 -0.9 4.2 1.626
Q1 2013 -1.2 1.3 1.282 6.6 4.3 86.1 5.1 0.6 94.2 2.5 3.0 1.519
Q2 2013 1.8 0.4 1.301 6.5 2.9 87.1 4.3 -0.2 99.2 2.1 1.6 1.521
Q3 2013 1.3 1.2 1.354 7.8 3.7 86.7 2.4 2.4 98.3 3.1 2.0 1.618
Q4 2013 0.8 0.3 1.378 6.4 4.0 85.7 -0.8 3.1 105.3 2.0 1.7 1.657
Q1 2014 1.3 0.9 1.378 6.4 1.4 86.8 4.9 1.3 103.0 3.4 1.9 1.668
Q2 2014 0.7 -0.1 1.369 7.0 2.5 86.7 -7.1 7.7 101.3 3.8 1.5 1.711
Q3 2014 1.4 0.2 1.263 6.9 2.4 87.0 -0.8 1.6 109.7 3.3 0.6 1.622
Q4 2014 1.8 -0.4 1.210 5.6 1.2 88.1 2.1 -0.3 119.9 3.4 -0.4 1.558
Q1 2015 3.3 -0.8 1.074 6.2 0.8 88.1 6.3 0.4 120.0 1.0 -1.2 1.485
Q2 2015 1.5 1.8 1.115 6.6 2.7 88.3 -0.5 0.3 122.1 1.9 0.9 1.573
Q3 2015 1.1 -0.3 1.116 6.6 2.7 90.9 0.8 0.0 119.8 1.1 0.5 1.512
Q4 2015 2.0 0.0 1.086 5.4 1.6 92.2 -1.8 0.1 120.3 2.8 0.0 1.475
Q1 2016 2.0 -1.2 1.139 6.3 2.8 91.7 2.8 -0.1 112.4 1.4 0.1 1.438
Q2 2016 1.2 1.2 1.103 6.4 2.7 94.0 1.8 -1.3 102.8 2.6 0.9 1.324
Q3 2016 1.8 1.1 1.124 6.6 1.2 93.6 1.3 -0.8 101.2 2.3 1.9 1.302
Q4 2016 1.4 1.9 1.055 6.0 2.5 97.4 0.8 0.3 116.8 1.4 2.0 1.234
Note: Refer to Notes Regarding Scenario Variables for more information on the definitions and sources of historical observations of the variables in the table.
54 Supervisory Stress Test Methodology and Results

Table A.3. Supervisory baseline scenario: Domestic variables, Q1:2017–Q1:2020
Percent, unless otherwise indicated.
DateReal GDP growth
Nominal GDP
growth
Real dispo-sable
income growth
Nominal dispo-sable
income growth
Unem-ployment
rate
CPI inflation
rate
3-month Treasury
rate
5-year Treasury
yield
10-year Treasury
yield
BBB corporate
yield
Mortgagerate
Prime rate
Level
Dow Jones Total Stock
Market Index
House Price Index
Com-mercial
Real Estate Price Index
Market Volatility
Index
Q1 2017 2.2 4.3 2.2 4.3 4.7 2.4 0.6 1.7 2.5 4.2 4.2 3.8 23,551 184 298 19.0
Q2 2017 2.3 4.3 2.5 4.6 4.6 2.4 0.7 1.9 2.6 4.4 4.3 3.9 23,831 185 301 20.3
Q3 2017 2.4 4.5 2.9 5.0 4.6 2.3 0.9 2.0 2.7 4.5 4.4 4.1 24,123 187 305 19.3
Q4 2017 2.3 4.5 2.7 4.8 4.5 2.3 1.1 2.2 2.9 4.6 4.5 4.3 24,422 188 309 19.4
Q1 2018 2.4 4.6 2.9 4.9 4.5 2.3 1.3 2.3 3.0 4.7 4.6 4.4 24,727 189 313 19.2
Q2 2018 2.4 4.7 2.6 4.7 4.5 2.3 1.5 2.4 3.1 4.8 4.7 4.6 25,042 190 317 19.2
Q3 2018 2.4 4.6 2.6 4.7 4.4 2.3 1.7 2.6 3.2 4.9 4.8 4.8 25,354 191 321 19.3
Q4 2018 2.3 4.5 2.4 4.6 4.4 2.4 1.9 2.7 3.3 5.0 5.0 5.0 25,668 193 325 19.4
Q1 2019 2.0 4.2 2.2 4.3 4.5 2.3 2.2 2.8 3.4 5.1 5.0 5.2 25,968 194 327 19.8
Q2 2019 2.1 4.2 2.3 4.3 4.6 2.3 2.4 2.9 3.4 5.1 5.1 5.5 26,269 195 330 20.0
Q3 2019 2.1 4.1 2.2 4.3 4.6 2.2 2.6 2.9 3.5 5.2 5.1 5.7 26,571 197 332 20.2
Q4 2019 2.0 4.1 2.2 4.2 4.7 2.2 2.8 3.0 3.5 5.2 5.2 5.9 26,874 198 335 20.3
Q1 2020 2.0 4.0 2.1 4.0 4.7 2.1 2.9 3.0 3.5 5.2 5.2 5.9 27,173 200 337 20.2
Note: Refer to Notes Regarding Scenario Variables for more information on the definitions and sources of historical observations of the variables in the table.
Table A.4. Supervisory baseline scenario: International variables, Q1:2017–Q1:2020
Percent, unless otherwise indicated.
Date Euro area real GDP growth
Euro area inflation
Euro area bilateral dollar
exchange rate
(USD/euro)
Developing Asia
real GDP growth
Developing Asia
inflation
Developing Asia
bilateral dollar
exchange rate
(F/USD, index)
Japan real GDP growth
Japan inflation
Japan bilateral dollar
exchange rate
(yen/USD)
U.K. real GDP growth
U.K. inflation
U.K. bilateral dollar
exchange rate
(USD/pound)
Q1 2017 1.5 1.3 1.050 6.0 2.4 97.9 0.9 0.5 116.4 1.2 1.9 1.228
Q2 2017 1.5 1.4 1.044 5.9 2.5 98.4 0.9 0.6 116.0 1.1 2.0 1.222
Q3 2017 1.6 1.5 1.039 5.9 2.6 98.9 0.9 0.8 115.6 1.0 2.1 1.216
Q4 2017 1.6 1.5 1.034 5.8 2.6 99.4 0.9 0.9 115.2 1.1 2.2 1.210
Q1 2018 1.6 1.5 1.036 5.8 2.6 99.7 0.9 1.1 115.6 1.3 2.2 1.222
Q2 2018 1.6 1.6 1.039 5.7 2.6 100.0 0.8 1.2 116.1 1.4 2.2 1.234
Q3 2018 1.5 1.6 1.041 5.7 2.6 100.3 0.8 1.3 116.5 1.6 2.2 1.245
Q4 2018 1.5 1.6 1.044 5.8 2.7 100.6 0.8 1.3 117.0 1.7 2.1 1.257
Q1 2019 1.5 1.7 1.044 5.8 2.7 100.6 0.8 1.4 117.0 1.8 2.1 1.257
Q2 2019 1.5 1.7 1.044 5.9 2.8 100.6 0.8 1.5 117.0 1.8 2.0 1.257
Q3 2019 1.5 1.7 1.044 5.9 2.9 100.6 0.8 1.5 117.0 1.9 2.0 1.257
Q4 2019 1.5 1.8 1.044 5.8 2.9 100.6 0.8 1.6 117.0 1.9 2.0 1.257
Q1 2020 1.5 1.8 1.044 5.8 3.0 100.6 0.8 1.6 117.0 1.9 1.9 1.257
Note: Refer to Notes Regarding Scenario Variables for more information on the definitions and sources of historical observations of the variables in the table.
June 2017 55
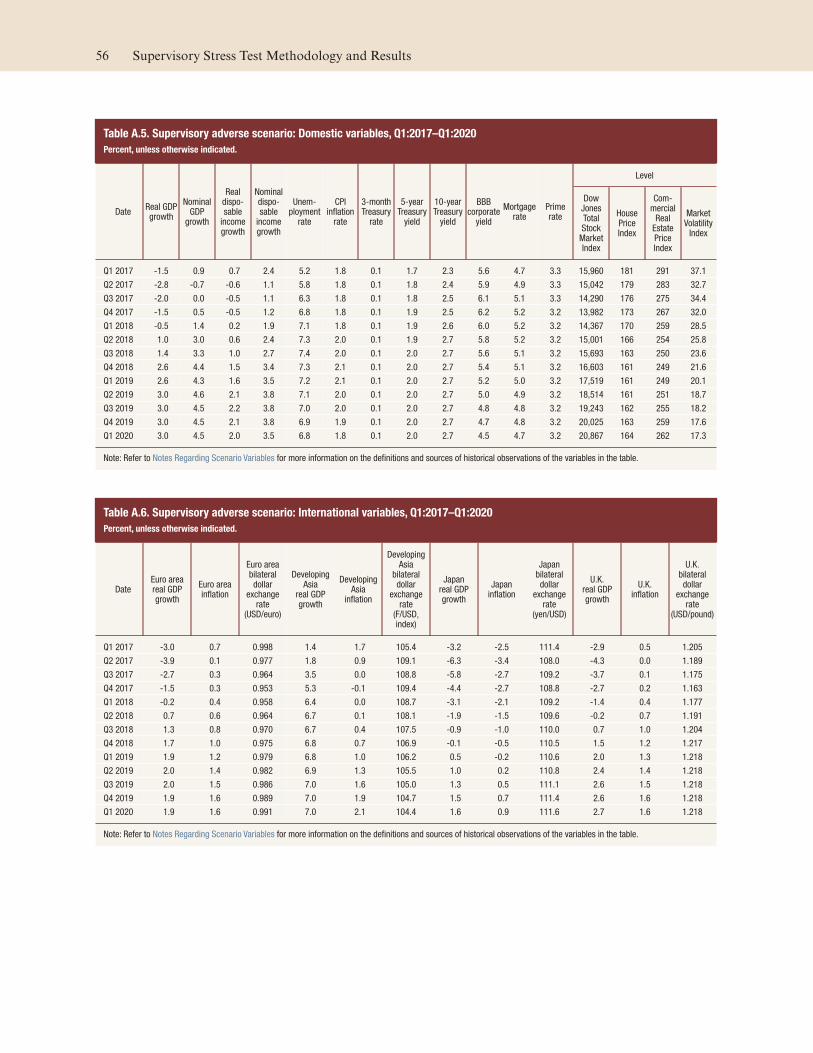
Table A.5. Supervisory adverse scenario: Domestic variables, Q1:2017–Q1:2020
Percent, unless otherwise indicated.
DateReal GDP growth
Nominal GDP
growth
Real dispo-sable
income growth
Nominal dispo-sable
income growth
Unem-ployment
rate
CPI inflation
rate
3-month Treasury
rate
5-year Treasury
yield
10-year Treasury
yield
BBB corporate
yield
Mortgagerate
Prime rate
Level
Dow Jones Total Stock
Market Index
House Price Index
Com-mercial
Real Estate Price Index
Market Volatility
Index
Q1 2017 -1.5 0.9 0.7 2.4 5.2 1.8 0.1 1.7 2.3 5.6 4.7 3.3 15,960 181 291 37.1
Q2 2017 -2.8 -0.7 -0.6 1.1 5.8 1.8 0.1 1.8 2.4 5.9 4.9 3.3 15,042 179 283 32.7
Q3 2017 -2.0 0.0 -0.5 1.1 6.3 1.8 0.1 1.8 2.5 6.1 5.1 3.3 14,290 176 275 34.4
Q4 2017 -1.5 0.5 -0.5 1.2 6.8 1.8 0.1 1.9 2.5 6.2 5.2 3.2 13,982 173 267 32.0
Q1 2018 -0.5 1.4 0.2 1.9 7.1 1.8 0.1 1.9 2.6 6.0 5.2 3.2 14,367 170 259 28.5
Q2 2018 1.0 3.0 0.6 2.4 7.3 2.0 0.1 1.9 2.7 5.8 5.2 3.2 15,001 166 254 25.8
Q3 2018 1.4 3.3 1.0 2.7 7.4 2.0 0.1 2.0 2.7 5.6 5.1 3.2 15,693 163 250 23.6
Q4 2018 2.6 4.4 1.5 3.4 7.3 2.1 0.1 2.0 2.7 5.4 5.1 3.2 16,603 161 249 21.6
Q1 2019 2.6 4.3 1.6 3.5 7.2 2.1 0.1 2.0 2.7 5.2 5.0 3.2 17,519 161 249 20.1
Q2 2019 3.0 4.6 2.1 3.8 7.1 2.0 0.1 2.0 2.7 5.0 4.9 3.2 18,514 161 251 18.7
Q3 2019 3.0 4.5 2.2 3.8 7.0 2.0 0.1 2.0 2.7 4.8 4.8 3.2 19,243 162 255 18.2
Q4 2019 3.0 4.5 2.1 3.8 6.9 1.9 0.1 2.0 2.7 4.7 4.8 3.2 20,025 163 259 17.6
Q1 2020 3.0 4.5 2.0 3.5 6.8 1.8 0.1 2.0 2.7 4.5 4.7 3.2 20,867 164 262 17.3
Note: Refer to Notes Regarding Scenario Variables for more information on the definitions and sources of historical observations of the variables in the table.
Table A.6. Supervisory adverse scenario: International variables, Q1:2017–Q1:2020
Percent, unless otherwise indicated.
Date Euro area real GDP growth
Euro area inflation
Euro area bilateral dollar
exchange rate
(USD/euro)
Developing Asia
real GDP growth
Developing Asia
inflation
Developing Asia
bilateral dollar
exchange rate
(F/USD, index)
Japan real GDP growth
Japan inflation
Japan bilateral dollar
exchange rate
(yen/USD)
U.K. real GDP growth
U.K. inflation
U.K. bilateral dollar
exchange rate
(USD/pound)
Q1 2017 -3.0 0.7 0.998 1.4 1.7 105.4 -3.2 -2.5 111.4 -2.9 0.5 1.205
Q2 2017 -3.9 0.1 0.977 1.8 0.9 109.1 -6.3 -3.4 108.0 -4.3 0.0 1.189
Q3 2017 -2.7 0.3 0.964 3.5 0.0 108.8 -5.8 -2.7 109.2 -3.7 0.1 1.175
Q4 2017 -1.5 0.3 0.953 5.3 -0.1 109.4 -4.4 -2.7 108.8 -2.7 0.2 1.163
Q1 2018 -0.2 0.4 0.958 6.4 0.0 108.7 -3.1 -2.1 109.2 -1.4 0.4 1.177
Q2 2018 0.7 0.6 0.964 6.7 0.1 108.1 -1.9 -1.5 109.6 -0.2 0.7 1.191
Q3 2018 1.3 0.8 0.970 6.7 0.4 107.5 -0.9 -1.0 110.0 0.7 1.0 1.204
Q4 2018 1.7 1.0 0.975 6.8 0.7 106.9 -0.1 -0.5 110.5 1.5 1.2 1.217
Q1 2019 1.9 1.2 0.979 6.8 1.0 106.2 0.5 -0.2 110.6 2.0 1.3 1.218
Q2 2019 2.0 1.4 0.982 6.9 1.3 105.5 1.0 0.2 110.8 2.4 1.4 1.218
Q3 2019 2.0 1.5 0.986 7.0 1.6 105.0 1.3 0.5 111.1 2.6 1.5 1.218
Q4 2019 1.9 1.6 0.989 7.0 1.9 104.7 1.5 0.7 111.4 2.6 1.6 1.218
Q1 2020 1.9 1.6 0.991 7.0 2.1 104.4 1.6 0.9 111.6 2.7 1.6 1.218
Note: Refer to Notes Regarding Scenario Variables for more information on the definitions and sources of historical observations of the variables in the table.
56 Supervisory Stress Test Methodology and Results
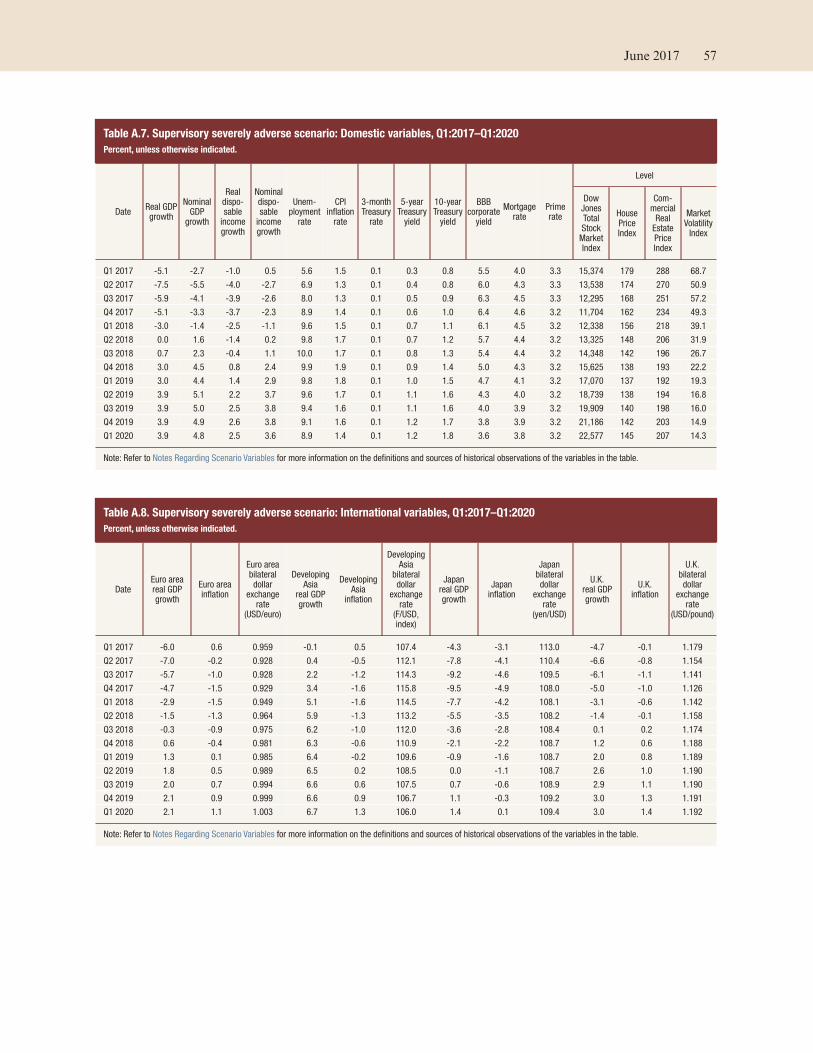
Table A.7. Supervisory severely adverse scenario: Domestic variables, Q1:2017–Q1:2020
Percent, unless otherwise indicated.
DateReal GDP growth
Nominal GDP
growth
Real dispo-sable
income growth
Nominal dispo-sable
income growth
Unem-ployment
rate
CPI inflation
rate
3-month Treasury
rate
5-year Treasury
yield
10-year Treasury
yield
BBB corporate
yield
Mortgagerate
Prime rate
Level
Dow Jones Total Stock
Market Index
House Price Index
Com-mercial
Real Estate Price Index
Market Volatility
Index
Q1 2017 -5.1 -2.7 -1.0 0.5 5.6 1.5 0.1 0.3 0.8 5.5 4.0 3.3 15,374 179 288 68.7
Q2 2017 -7.5 -5.5 -4.0 -2.7 6.9 1.3 0.1 0.4 0.8 6.0 4.3 3.3 13,538 174 270 50.9
Q3 2017 -5.9 -4.1 -3.9 -2.6 8.0 1.3 0.1 0.5 0.9 6.3 4.5 3.3 12,295 168 251 57.2
Q4 2017 -5.1 -3.3 -3.7 -2.3 8.9 1.4 0.1 0.6 1.0 6.4 4.6 3.2 11,704 162 234 49.3
Q1 2018 -3.0 -1.4 -2.5 -1.1 9.6 1.5 0.1 0.7 1.1 6.1 4.5 3.2 12,338 156 218 39.1
Q2 2018 0.0 1.6 -1.4 0.2 9.8 1.7 0.1 0.7 1.2 5.7 4.4 3.2 13,325 148 206 31.9
Q3 2018 0.7 2.3 -0.4 1.1 10.0 1.7 0.1 0.8 1.3 5.4 4.4 3.2 14,348 142 196 26.7
Q4 2018 3.0 4.5 0.8 2.4 9.9 1.9 0.1 0.9 1.4 5.0 4.3 3.2 15,625 138 193 22.2
Q1 2019 3.0 4.4 1.4 2.9 9.8 1.8 0.1 1.0 1.5 4.7 4.1 3.2 17,070 137 192 19.3
Q2 2019 3.9 5.1 2.2 3.7 9.6 1.7 0.1 1.1 1.6 4.3 4.0 3.2 18,739 138 194 16.8
Q3 2019 3.9 5.0 2.5 3.8 9.4 1.6 0.1 1.1 1.6 4.0 3.9 3.2 19,909 140 198 16.0
Q4 2019 3.9 4.9 2.6 3.8 9.1 1.6 0.1 1.2 1.7 3.8 3.9 3.2 21,186 142 203 14.9
Q1 2020 3.9 4.8 2.5 3.6 8.9 1.4 0.1 1.2 1.8 3.6 3.8 3.2 22,577 145 207 14.3
Note: Refer to Notes Regarding Scenario Variables for more information on the definitions and sources of historical observations of the variables in the table.
Table A.8. Supervisory severely adverse scenario: International variables, Q1:2017–Q1:2020
Percent, unless otherwise indicated.
Date Euro area real GDP growth
Euro area inflation
Euro area bilateral dollar
exchange rate
(USD/euro)
Developing Asia
real GDP growth
Developing Asia
inflation
Developing Asia
bilateral dollar
exchange rate
(F/USD, index)
Japan real GDP growth
Japan inflation
Japan bilateral dollar
exchange rate
(yen/USD)
U.K. real GDP growth
U.K. inflation
U.K. bilateral dollar
exchange rate
(USD/pound)
Q1 2017 -6.0 0.6 0.959 -0.1 0.5 107.4 -4.3 -3.1 113.0 -4.7 -0.1 1.179
Q2 2017 -7.0 -0.2 0.928 0.4 -0.5 112.1 -7.8 -4.1 110.4 -6.6 -0.8 1.154
Q3 2017 -5.7 -1.0 0.928 2.2 -1.2 114.3 -9.2 -4.6 109.5 -6.1 -1.1 1.141
Q4 2017 -4.7 -1.5 0.929 3.4 -1.6 115.8 -9.5 -4.9 108.0 -5.0 -1.0 1.126
Q1 2018 -2.9 -1.5 0.949 5.1 -1.6 114.5 -7.7 -4.2 108.1 -3.1 -0.6 1.142
Q2 2018 -1.5 -1.3 0.964 5.9 -1.3 113.2 -5.5 -3.5 108.2 -1.4 -0.1 1.158
Q3 2018 -0.3 -0.9 0.975 6.2 -1.0 112.0 -3.6 -2.8 108.4 0.1 0.2 1.174
Q4 2018 0.6 -0.4 0.981 6.3 -0.6 110.9 -2.1 -2.2 108.7 1.2 0.6 1.188
Q1 2019 1.3 0.1 0.985 6.4 -0.2 109.6 -0.9 -1.6 108.7 2.0 0.8 1.189
Q2 2019 1.8 0.5 0.989 6.5 0.2 108.5 0.0 -1.1 108.7 2.6 1.0 1.190
Q3 2019 2.0 0.7 0.994 6.6 0.6 107.5 0.7 -0.6 108.9 2.9 1.1 1.190
Q4 2019 2.1 0.9 0.999 6.6 0.9 106.7 1.1 -0.3 109.2 3.0 1.3 1.191
Q1 2020 2.1 1.1 1.003 6.7 1.3 106.0 1.4 0.1 109.4 3.0 1.4 1.192
Note: Refer to Notes Regarding Scenario Variables for more information on the definitions and sources of historical observations of the variables in the table.
June 2017 57
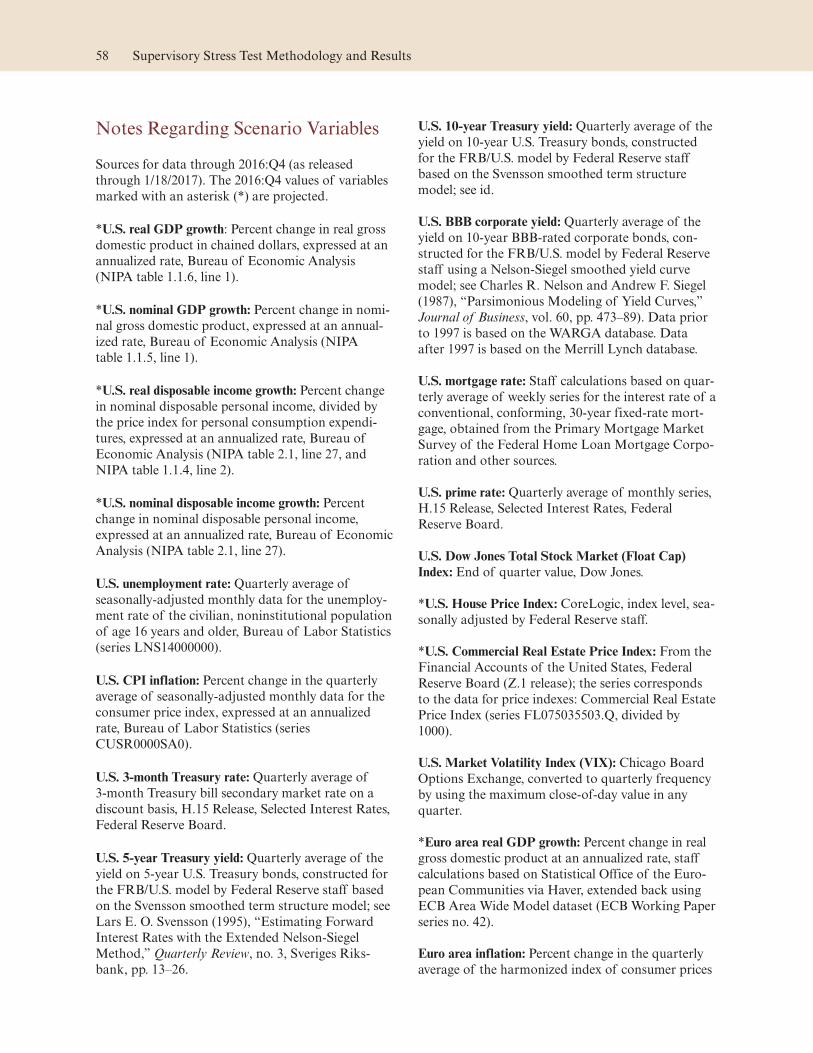
Notes Regarding Scenario Variables
Sources for data through 2016:Q4 (as released
through 1/18/2017). The 2016:Q4 values of variables
marked with an asterisk (*) are projected.
*U.S. real GDP growth: Percent change in real gross
domestic product in chained dollars, expressed at an
annualized rate, Bureau of Economic Analysis
(NIPA table 1.1.6, line 1).
*U.S. nominal GDP growth: Percent change in nomi-
nal gross domestic product, expressed at an annual-
ized rate, Bureau of Economic Analysis (NIPA
table 1.1.5, line 1).
*U.S. real disposable income growth: Percent change
in nominal disposable personal income, divided by
the price index for personal consumption expendi-
tures, expressed at an annualized rate, Bureau of
Economic Analysis (NIPA table 2.1, line 27, and
NIPA table 1.1.4, line 2).
*U.S. nominal disposable income growth: Percent
change in nominal disposable personal income,
expressed at an annualized rate, Bureau of Economic
Analysis (NIPA table 2.1, line 27).
U.S. unemployment rate: Quarterly average of
seasonally-adjusted monthly data for the unemploy-
ment rate of the civilian, noninstitutional population
of age 16 years and older, Bureau of Labor Statistics
(series LNS14000000).
U.S. CPI inflation: Percent change in the quarterly
average of seasonally-adjusted monthly data for the
consumer price index, expressed at an annualized
rate, Bureau of Labor Statistics (series
CUSR0000SA0).
U.S. 3-month Treasury rate: Quarterly average of
3-month Treasury bill secondary market rate on a
discount basis, H.15 Release, Selected Interest Rates,
Federal Reserve Board.
U.S. 5-year Treasury yield: Quarterly average of the
yield on 5-year U.S. Treasury bonds, constructed for
the FRB/U.S. model by Federal Reserve staff based
on the Svensson smoothed term structure model; see
Lars E. O. Svensson (1995), “Estimating Forward
Interest Rates with the Extended Nelson-Siegel
Method,” Quarterly Review, no. 3, Sveriges Riks-
bank, pp. 13–26.
U.S. 10-year Treasury yield: Quarterly average of the
yield on 10-year U.S. Treasury bonds, constructed
for the FRB/U.S. model by Federal Reserve staff
based on the Svensson smoothed term structure
model; see id.
U.S. BBB corporate yield: Quarterly average of the
yield on 10-year BBB-rated corporate bonds, con-
structed for the FRB/U.S. model by Federal Reserve
staff using a Nelson-Siegel smoothed yield curve
model; see Charles R. Nelson and Andrew F. Siegel
(1987), “Parsimonious Modeling of Yield Curves,”
Journal of Business, vol. 60, pp. 473–89). Data prior
to 1997 is based on the WARGA database. Data
after 1997 is based on the Merrill Lynch database.
U.S. mortgage rate: Staff calculations based on quar-
terly average of weekly series for the interest rate of a
conventional, conforming, 30-year fixed-rate mort-
gage, obtained from the Primary Mortgage Market
Survey of the Federal Home Loan Mortgage Corpo-
ration and other sources.
U.S. prime rate: Quarterly average of monthly series,
H.15 Release, Selected Interest Rates, Federal
Reserve Board.
U.S. Dow Jones Total Stock Market (Float Cap)
Index: End of quarter value, Dow Jones.
*U.S. House Price Index: CoreLogic, index level, sea-
sonally adjusted by Federal Reserve staff.
*U.S. Commercial Real Estate Price Index: From the
Financial Accounts of the United States, Federal
Reserve Board (Z.1 release); the series corresponds
to the data for price indexes: Commercial Real Estate
Price Index (series FL075035503.Q, divided by
1000).
U.S. Market Volatility Index (VIX): Chicago Board
Options Exchange, converted to quarterly frequency
by using the maximum close-of-day value in any
quarter.
*Euro area real GDP growth: Percent change in real
gross domestic product at an annualized rate, staff
calculations based on Statistical Office of the Euro-
pean Communities via Haver, extended back using
ECB Area Wide Model dataset (ECB Working Paper
series no. 42).
Euro area inflation: Percent change in the quarterly
average of the harmonized index of consumer prices
58 Supervisory Stress Test Methodology and Results
at an annualized rate, staff calculations based on Sta-
tistical Office of the European Communities via
Haver.
*Developing Asia real GDP growth: Percent change
in real gross domestic product at an annualized rate,
staff calculations based on Bank of Korea via Haver;
Chinese National Bureau of Statistics via CEIC;
Indian Central Statistical Organization via CEIC;
Census and Statistics Department of Hong Kong via
CEIC; and Taiwan Directorate-General of Budget,
Accounting, and Statistics via CEIC.
*Developing Asia inflation: Percent change in the
quarterly average of the consumer price index, or
local equivalent, at an annualized rate, staff calcula-
tions based on Chinese National Bureau of Statistics
via CEIC; Indian Ministry of Statistics and Pro-
gramme Implementation via Haver; Labour Bureau
of India via CEIC; National Statistical Office of
Korea via CEIC; Census and Statistic Department of
Hong Kong via CEIC; and Taiwan Directorate-
General of Budget, Accounting, and Statistics via
CEIC.
*Japan real GDP growth: Percent change in gross
domestic product at an annualized rate, Cabinet
Office via Haver.
*Japan inflation: Percent change in the quarterly
average of the consumer price index at an annualized
rate, staff calculations based on Ministry of Internal
Affairs and Communications via Haver.
*U.K. real GDP growth: Percent change in gross
domestic product at an annualized rate, Office for
National Statistics via Haver.
U.K. inflation: Percent change in the quarterly aver-
age of the consumer price index at an annualized
rate, staff calculations based on Office for National
Statistics via Haver.
Exchange rates: End-of-quarter rates from the H.10
Release, Foreign Exchange Rates, Federal Reserve
Board.
June 2017 59

Appendix B: Models to Project Net Income and Stressed Capital
This appendix describes the models used to project
stressed capital ratios and pre-tax net income and its
components for the 34 bank holding companies
(BHCs) subject to DFAST 2017.43 The models fall
into five broad categories:
1. Models to project losses on loans held in the
accrual loan portfolio; loans in the accrual loan
portfolio are those measured under accrual
accounting, rather than fair-value accounting.
2. Models to project other types of losses, including
those from changes in fair value on loans held for
sale or measured under the fair-value option;
losses on securities, trading, and counterparty
exposures.
3. Models to project the components of PPNR (rev-
enues and non-credit-related expenses) and losses
related to operational-risk events that are part of
PPNR.
4. Models to project balance sheet items and risk-
weighted assets (RWAs).
5. The calculations to project capital ratios, given
projections of pre-tax net income, assumptions
for determining provisions into the allowance for
loan and lease losses (ALLL), and prescribed
capital actions.
For DFAST 2017, the Federal Reserve has materially
enhanced its models for projecting PPNR, opera-
tional risk and mortgage repurchase losses, and
credit losses on commercial real estate (CRE) loans.
In addition, the calculation of regulatory capital and
capital ratios has been expanded to include post-
stress projections of the supplementary leverage
ratio.
Losses on the Accrual Loan Portfolio
More than a dozen individual models are used to
project losses on loans held in the accrual loan port-
folio. The individual loan types modeled can broadly
be divided into wholesale loans, such as commercial
and industrial (C&I) loans and commercial real
estate loans, and retail loans, including various types
of residential mortgages, credit cards, student loans,
auto loans, small business loans, and other consumer
loans.
The models project losses using detailed loan portfo-
lio data provided by the BHCs on the Capital Assess-
ments and Stress Testing (FR Y-14) information
collection.
Within larger loan categories, loan portfolios may be
subcategorized by loan type, each with their own
specific loss projection model. Generally, the loss
models for all loan portfolios belonging to a larger
category are similar. For example, losses on first-lien
mortgage, junior-lien mortgage, and home equity
loan portfolios are each estimated by separate mod-
els, but each model follows the same structural form.
Two general approaches are taken to model losses on
the accrual loan portfolio. In the first approach—an
approach broadly used for DFAST 2017—the mod-
els estimate expected losses under the macroeco-
nomic scenario; that is, they project the probability
43 In connection with DFAST 2017, and in addition to the models developed and data collected by federal banking regulators, the Federal Reserve used proprietary models or data licensed from the following providers: Andrew Davidson & Co., Inc.; BofA Merrill Lynch Global Research; BlackRock Financial Manage-ment, Inc.; Bloomberg L.P.; CB Richard Ellis, Inc.; CoreLogic Inc.; CoStar Group, Inc.; Equifax Information Services LLC; Kenneth French; Haver Analytics, Intex Solutions, Inc.; McDash Analytics, LLC, a wholly owned subsidiary of Lender Processing Services, Inc.; Markit Group; Moody’s Analytics, Inc.; Moody’s Investors Service, Inc.; Mergent, Inc.; Morning-star, Inc.; MSCI, Inc.; StataCorp LP; and Standard & Poor’s Financial Services LLC. In addition, with respect to the global market shock component of the adverse and severely adverse scenarios, the Federal Reserve used proprietary data licensed from the following providers: Bank of America Corporation; Barclays Bank PLC; Bloomberg L.P.; CoreLogic, Inc.; Intex Solutions, Inc.; JPMorgan Chase & Co.; Lender Processing Ser-vices, Inc.; Markit Group; Moody's Investors Service, Inc.; New York University; and Standard & Poor’s Financial Ser-vices LLC.
61
of default (PD), loss given default (LGD), and expo-
sure at default (EAD) for each quarter of the plan-
ning horizon. Expected losses in quarter t are the
product of these three components:
Loss t = PD t * LGD t * EAD t
PD is generally modeled as part of a transition pro-
cess in which loans move from one payment status to
another (e.g., from current to delinquent) in response
to economic conditions. Default is a terminal transi-
tion, and PD represents the likelihood that a loan
will default during a given period. The number of
payment statuses and the transition paths modeled
differ by loan type.
LGD is typically defined as a percentage of EAD
and is modeled based on historical data. For some
loan types, LGD is modeled as a function of bor-
rower, collateral, or loan characteristics and the mac-
roeconomic variables from the supervisory scenarios.
For other loan types, LGD is assumed to be a
fixed percentage for all loans in a category. Finally,
the approach to modeling EAD varies by loan type
and depends on whether the outstanding loan
amount can change between the current period and
the period in which the loan defaults (e.g., for lines
of credit).
In the second approach, the models capture the his-
torical behavior of net charge-offs relative to changes
in macroeconomic and financial market variables
and loan portfolio characteristics.
The loss models primarily focus on losses arising
from loans in the accrual loan portfolio as of
December 31, 2016. The loss projections also incor-
porate losses on loans originated after the planning
horizon begins. These incremental loan balances are
calculated based on the Federal Reserve’s projections
of loan balances over the planning horizon. These
new balances are assumed to have the same risk
characteristics as those of the loan portfolio as of
December 31, 2016, with the exception of loan age in
the retail and CRE portfolios, where seasoning is
incorporated. Where applicable, new loans are
assumed to be current, and BHCs are assumed not
to originate types of loans that are no longer permit-
ted under various regulations. Loss projections also
incorporate losses on loans acquired through merg-
ers or purchase after the planning horizon begins.
Additional information provided by the BHCs about
the size and composition of acquired loan portfolios
is used to estimate losses on acquired portfolios.
Loss projections generated by the models are
adjusted to take account of purchase accounting
treatment, which recognizes discounts on impaired
loans acquired during mergers and any other write-
downs already taken on loans held in the accrual
loan portfolio. This latter adjustment ensures that
losses related to these loans are not double counted
in the projections.
Wholesale Loans: Corporate Loans
Losses stemming from default on corporate loans are
projected at the loan level using an expected loss
modeling framework. Corporate loans consist of a
number of different categories of loans, as defined
by the Consolidated Financial Statements for Hold-
ing Companies—FR Y-9C report (FR Y-9C). The
largest group of these loans includes C&I loans,
which are generally defined as loans to corporate or
commercial borrowers with more than $1 million in
committed balances that are “graded” using a BHC’s
corporate loan rating process.44 Small business loans
with less than $1 million in committed balances are
included in other retail loans and are modeled
separately.
The PD for a C&I loan is projected over the plan-
ning horizon by first calculating the loan’s PD at the
beginning of the planning horizon and then project-
ing it forward using an equation that relates histori-
cal changes in PD to changes in the macroeconomic
environment. The PD as of December 31, 2016, is
calculated for every C&I loan in a BHC’s portfolio
using detailed, loan-level information submitted by
the BHC. For publicly traded borrowers, a borrower-
specific PD, based on the expected default frequency,
is used. For other borrowers, the PD is calculated
based on the borrower’s industry category and the
BHC’s internal credit rating for the borrower, which
is converted to a standardized rating scale and then
mapped to a PD. Loans that are 90 days past due, in
non-accrual status, or that have a Financial Account-
ing Standards Board Accounting Standards Codifi-
cation Subtopic 310-10 (ASC 310-10) reserve as of
December 31, 2016, are considered in default.
PDs are projected over the planning horizon using a
series of equations fitted to the historical relation-
ship between changes in the PD and macroeconomic
variables, including growth in real gross domestic
44 All definitions of loan categories and default in this appendix are definitions used for the purposes of the supervisory stress test models and do not necessarily align with general industry definitions or classifications.
62 Supervisory Stress Test Methodology and Results
product (GDP), changes in the unemployment rate,
and changes in the spread on BBB-rated corporate
bonds. The equations are estimated separately by
borrower industries, credit quality categories, and
whether the borrower is foreign or domestic.
The LGD for a C&I loan at the beginning of the
planning horizon is determined by the line of busi-
ness, seniority of lien (if secured), country, and ASC
310-10 reserve, if applicable. The LGD is then pro-
jected forward by relating the change in the LGD to
changes in the PD. In the model, the PD is used as a
proxy for economic conditions, and, by construct,
increases in PD generally lead to higher LGDs.
The EAD for C&I lines of credit and other revolving
commitments equals the sum of the funded balance
and a portion of the unfunded commitment, which
reflects the amount that is likely to be drawn down
by the borrower in the event of default. This draw-
down amount is calibrated to the historical draw-
down experience for defaulted U.S. syndicated
revolving lines of credit that are in the Shared
National Credit (SNC) database.45 In the case of
closed-end C&I loans, the funded balance and the
corresponding EAD equals the outstanding balance.
The EAD for standby letters of credit and trade
finance credit are conservatively assumed to equal
the total commitment.
Other corporate loans that are similar in some
respects to C&I loans are modeled using the same
framework. These loans include owner-occupied
CRE loans, capital equipment leases, loans to
depositories, loans to syndicated pipeline, non-
purpose margin loans (net of loans to purchase and
carry securities), and other loans.46 Projected losses
on owner-occupied CRE loans are disclosed in total
CRE losses, while projected losses for the remaining
other corporate loans are disclosed in the other loans
category.
Wholesale Loans: CRE
CRE loans are loans collateralized by domestic and
international non-owner occupied multifamily or
nonfarm, nonresidential properties, and construction
and land development loans (C&LD), as defined by
the FR Y-9C report. Losses stemming from default
on CRE loans are projected at the loan level using an
expected-loss modeling framework.
The PD model for CRE loans is a hazard model of
the probability that a loan transitions from current
to default status, given the characteristics of the loan
as well as macroeconomic variables, including com-
mercial and residential property price indices and
unemployment rates, at both the geographic market
and national level. Once defaulted, the model
assumes the loan does not re-perform; the effect of
re-performance on the estimated loan loss is cap-
tured in the LGD model. A CRE loan is considered
in default if it is 90 days past due, in non-accrual sta-
tus, has an ASC 310-10 reserve, or had a very low
internal credit rating at the most recent time its
maturity was extended. The PD model also incorpo-
rates a nonlinear increase in PD as the loan maturity
nears. The effect of loan age on the PD is calculated
jointly for income-producing and C&LD loans.
However, controls are included for income-
producing, multifamily, and C&LD loans, and the
effect of reaching loan maturity on the PD is allowed
to vary for each type of loan. The models are esti-
mated using the historical Capital Assessments and
Stress Testing (FR Y-14) information collection and
historical commercial mortgage-backed security
(CMBS) data pooled together. The models include
controls for the types of loans to account for differ-
ences in risk characteristics between income-
producing, C&LD, and CMBS loans.
The LGD for CRE loans is calculated using Capital
Assessments and Stress Testing (FR Y-14Q) report
data on ASC 310-10 reserves. The model first esti-
mates the probability that a defaulted loan will have
losses as a function of loan characteristics and mac-
roeconomic variables, including commercial property
prices, residential house prices, and the unemploy-
ment rate. Then, using loans with losses, the model
estimates the loss on the CRE mortgage as a func-
tion of the expected probability of loss, characteris-
tics of the loan, and residential house prices and the
unemployment rate. Finally, the EAD for CRE loans
45 SNCs have commitments of greater than $20 million and are held by three or more regulated participating entities. For addi-tional information, see “Shared National Credit Program,” Board of Governors of the Federal Reserve System, www.federalreserve.gov/supervisionreg/snc.htm.
46 The corporate loan category also includes loans that are dis-similar from typical corporate loans, such as securities lending and farmland loans, which are generally a small share of BHC portfolios. For these loans, a conservative and uniform loss rate based on analysis of historical data is assigned.
June 2017 63
is assumed to equal the loan’s full committed balance
for both income producing and C&LD loans.
Retail Loans: Residential Mortgages
Residential mortgages held in BHC portfolios
include first and junior liens—both closed-end loans
and revolving credits—that are secured by one- to
four-family residential real estate as defined by the
FR Y-9C report. Losses stemming from default on
residential mortgages are projected at the loan level
using an expected-loss modeling framework.47
The PD model for first-lien residential mortgages
estimates the probability that a loan transitions to
different payment statuses, including current, delin-
quent, servicing transfer, default, and paid off. Sepa-
rate PD models are estimated for three types of
closed-end, first-lien mortgages: fixed-rate,
adjustable-rate, and option adjustable-rate mort-
gages. The PD model specification varies somewhat
by loan type; however, in general, each model esti-
mates the probability that a loan transitions from
one payment state to another (e.g., from current to
delinquent or from delinquent to default) over a
single quarter, given the characteristics of the loan,
borrower, and underlying property as well as macro-
economic variables, including local house prices, the
statewide unemployment rate, and interest rates.48
Origination vintage effects are also included in the
estimation in part to capture unobserved characteris-
tics of loan quality.
The historical data used to estimate this model are
industrywide, loan-level data from many banks and
mortgage loan originators. These estimated PD mod-
els are used to predict default for each loan reported
by each BHC under the supervisory scenarios. Resi-
dential mortgage loans are considered in default
when they are 180 days or more past due.
The LGD for residential mortgages is estimated
using two models. One model estimates the amount
of time that elapses between default and real estate
owned (REO) disposition (timeline model), while the
other relates characteristics of the defaulted loan,
such as the property value at default, to one compo-
nent of losses net of recoveries—the proceeds from
the sale of the property net of foreclosure expenses
(loss model).49
These net proceeds are calculated from historical
data on loan balances, servicer advances, and losses
from defaulted loans in private-label, residential
mortgage-backed securities (RMBS). These RMBS
data are also used to estimate the LGD loss model
separately for prime jumbo loans, subprime, and
alt-A loans.50
Finally, using the elapsed time between default and
REO disposition estimated in the timeline model,
total estimated losses are allocated into credit losses
on the defaulted loans, which are fully written down
at the time of default, or net losses arising from the
eventual sale of the underlying property (other real
estate owned—or OREO—expenses), which flow
through PPNR. House price changes from the time
of default to foreclosure completion (REO acquisi-
tion) are captured in LGD, while house price
changes after foreclosure completion and before sale
of the property are captured in OREO expenses. The
LGD for loans already in default as of December 31,
2016, includes further home price declines through
the point of foreclosure.
Home equity loans (HELs) are junior-lien, closed-
end loans, and home equity lines of credit
(HELOCs) are revolving open-end loans extended
under lines of credit. Both are secured by one- to
four-family residential real estate as defined by the
FR Y-9C report. Losses stemming from default on
HELs and HELOCs are projected at the loan level in
an expected loss framework that is similar to first-
lien mortgages, with a few differences. The PD model
for HELOCs estimates the probability that the loan
transitions from its status as of December 31,
2016, to payment statuses, including current,
impaired, default, prepaid, and paid off. At each
point in time, each transition model is a function of
account characteristics, customer characteristics,
economic environment, and past delinquency his-
47 To predict losses on new originations over the planning hori-zon, newly originated loans are assumed to have the same risk characteristics as the existing portfolio, with the exception of loan age and delinquency status.
48 The effects of loan modification and evolving modification practices are captured in the probability that a delinquent loan transitions back to current status (re-performing loans).
49 Other components of losses net of recoveries are calculated directly from available data. Private mortgage insurance is not incorporated into the LGD models. Industry data suggest that insurance coverage on portfolio loans is infrequent and cancel-lation or nullification of guarantees was a common occurrence during the recent downturn.
50 The differences between characteristics of mortgages in RMBS and mortgages in bank portfolios, such as loan-to-value (LTV) ratio, are controlled for by including various risk characteristics in the LGD model, such as original LTV ratio, credit score, and credit quality segment (prime, alt-A, and subprime).
64 Supervisory Stress Test Methodology and Results
tory. Economic drivers include interest rates, home
prices, and the unemployment rate.
For second-lien HELs and HELOCs that are current
as of December 31, 2016, but are junior to a seri-
ously delinquent first-lien mortgage, the model
assumes elevated default rates under the supervisory
scenarios. In addition, most HELOC contracts
require only payment of interest on the outstanding
line balance during the period when the line can be
drawn upon (draw period). When the line reaches the
end of its draw period (end-of-draw), the outstand-
ing line balance either becomes immediately payable
or converts to a fully amortizing loan. HELOCs that
reach the end-of-draw period are assumed to prepay
at a higher rate just prior to end-of-draw and to
default at a higher rate just after end-of-draw than
HELOCs that are still in their draw period.
The LGD for HELs and HELOCs is estimated using
data from private-label mortgage-backed securities,
using the same models used for closed-end first-lien
mortgages, but the estimated total mortgage losses
for properties with a defaulted HEL or HELOC are
allocated based on the lien position. Finally, for
HELOCs, EAD is assumed to equal the maximum of
the outstanding line balance and the credit limit.
Retail Loans: Credit Cards
Credit cards include both general purpose and
private-label credit cards, as well as charge cards, as
defined by the FR Y-9C report. Credit card loans
extended to individuals are included in retail credit
cards, while credit cards loans extended to businesses
and corporations are included in other retail lending
and are modeled separately. Losses stemming from
defaults on credit cards are projected at the loan level
using an expected-loss modeling framework.
The PD model for credit cards estimates the prob-
ability that a loan transitions from delinquency sta-
tus to default status, given the characteristics of the
account and borrower as well as macroeconomic
variables, including unemployment. When an
account defaults, it is assumed to be closed and does
not return to current status. Credit card loans are
considered in default when they are 120 days or more
past due. Because the relationship between the PD
and its determinants can vary with the initial status
of the account, separate transition models are esti-
mated for accounts that are current and active, cur-
rent and inactive accounts, and delinquent accounts.
In addition, because this relationship can also vary
with time horizons, separate transition models are
estimated for short-, medium-, and long-term hori-
zons. The historical data used to estimate this model
are industrywide, loan-level data from many banks,
and separate models were estimated for bank cards
and charge cards. The PD model is used to forecast
the PD for each loan reported by each BHC in the
Capital Assessments and Stress Testing (FR Y-
14) information collection.
The LGD for credit cards is assumed to be a
fixed percentage of EAD and is calculated separately
for bank cards and charge cards based on historical
industry data on LGD during the most recent eco-
nomic downturn. The EAD for credit cards equals
the sum of the amount outstanding on the account
and a portion of the credit line, which reflects the
amount that is likely to be drawn down by the bor-
rower between the beginning of the planning horizon
and the time of default. This drawdown amount is
estimated as a function of account and borrower
characteristics. Because this relationship can vary
with the initial status of the account and time to
default, separate models are estimated for current
and delinquent accounts and for accounts with
short-, medium-, and long-term transition to default.
For accounts that are current, separate models were
also estimated for different credit-line-size segments.
Retail Loans: Auto
Auto loans are consumer loans extended for the pur-
pose of purchasing new and used automobiles and
light motor vehicles as defined by the FR Y-9C
report. Losses stemming from default in auto retail
loan portfolios are projected at the portfolio segment
level using an expected loss framework.
The PD model for auto loans estimates the probabil-
ity that a loan transitions from either a current or
delinquent status to default status, given the charac-
teristics of the loan and borrower as well as macro-
economic variables, including house prices and the
unemployment rate. Auto loans are defined as being
in default based on either the payment status
(120 days or more past due), actions of the borrower
(bankruptcy), or actions of the lender (repossession).
Because the relationship between the PD and its
determinants can vary with the initial status of the
account, separate transition models are estimated for
June 2017 65
accounts that are current and delinquent accounts.
The historical data used to estimate this model are
loan-level, credit bureau data.
The LGD for auto loans is modeled as a function of
the characteristics of the loan as well as macroeco-
nomic variables, such as the unemployment rate and
used car prices. The historical data used to estimate
this model are pooled, segment-level data provided
by the BHCs on the Capital Assessments and Stress
Testing (FR Y-14) information collection. The EAD
for auto loans is based on the typical pattern of
amortization of loans that ultimately defaulted in
historical credit bureau data. The estimated EAD
model captures the average amortization by loan age
for current and delinquent loans over nine quarters.
Retail Loans: Other Retail Loans
The other retail loans category includes the small
business loan portfolio, the other consumer loan
portfolio, the student loan portfolio, the business
and corporate credit card portfolio, and interna-
tional retail portfolio. Losses due to default on other
retail loans are forecast by modeling as a function of
portfolio risk characteristics and macroeconomic
variables. This model is then used to predict future
charge-offs consistent with the evolution of eco-
nomic conditions under the supervisory scenarios.51
The predicted net charge-off rate is applied to bal-
ances projected by the Federal Reserve to estimate
projected losses.
The net charge-off rate is projected using a system of
equations that also generates projections of the
delinquency rate and the default rate. Default is
defined as 90 days or more past due for domestic and
international other consumer loans and 120 days or
more past due for student loans, small business
loans, corporate cards, and international retail port-
folios. In general, each rate is modeled in an autore-
gressive specification that also includes the rate in the
previous delinquency state, characteristics of the
underlying loans, macroeconomic variables, such as
changes in the unemployment rate and disposable
personal income growth, and, in some cases, seasonal
factors. The models are specified to implicitly cap-
ture roll-rate dynamics.52 Each retail product type is
modeled separately and, for each product type, eco-
nomic theory and the institutional characteristics of
the product guide the inclusion and lag structure of
the macroeconomic variables in the model.
Because of data limitations and the relatively small
size of these portfolios, the net charge-off rate for
each loan type is modeled using industry-
wide, monthly data at the segment level. For most
portfolios, these data are collected on the FR Y-14Q
Retail schedule, which segments each portfolio by
characteristics such as borrower credit score; loan
vintage; type of facility (e.g., installment versus
revolving); and, for international portfolios, geo-
graphic region.53
Charge-off rates are projected by applying the esti-
mated system of equations to each segment of the
BHC’s loan portfolio as of December 31, 2016. The
portfolio-level charge-off rate equals the dollar-
weighted average of the segment-level charge-off
rates.54
Loan-Loss Provisions for the Accrual Loan Portfolio
Losses on the accrual loan portfolio flow into net
income through provisions for loan and lease losses.
Provisions for loan and lease losses equal projected
loan losses for the quarter plus the amount needed
for the ALLL to be at an appropriate level at the end
of the quarter, which is a function of projected
future loan losses. The appropriate level of ALLL at
the end of a given quarter is generally assumed to be
the amount needed to cover projected loan losses
over the next four quarters.55 Because this calcula-
tion of ALLL is based on projected losses under the
adverse or severely adverse scenarios, it may differ
from a BHC’s actual level of ALLL at the beginning
of the planning horizon, which is based on the
BHC’s assessment of future losses in the current eco-
nomic environment. Any difference between these
51 For the government-guaranteed portion of BHCs’ student loan portfolios, an assumption of low PD and LGD is applied.
52 Roll-rate dynamics refers to how delinquent loans in one period transition to defaulted loans in the next, and how defaulted loans in a period transition to net charge-offs in the next.
53 Business and corporate credit card portfolio data, which were previously collected on the FR Y-14Q Retail schedule, are now collected at the loan level on the FR Y-14M Credit Card sched-ule and subsequently aggregated to the segment level.
54 The dollar weights used are based on the distribution reported during the previous observation period. This method assumes that the distribution of loans across risk segments, other than delinquency status segments, remains constant over the projec-tion period.
55 For loan types modeled in a charge-off framework, the appro-priate level of ALLL is adjusted to reflect the difference in tim-ing between the recognition of expected losses and that of charge-offs.
66 Supervisory Stress Test Methodology and Results
two measures of ALLL is smoothed into the provi-
sions projection over the nine quarters of the plan-
ning horizon. Because projected loan losses include
off-balance sheet commitments, the BHC’s allowance
at the beginning of the planning horizon for credit
losses on off-balance sheet exposures (as reported on
the FR Y-9C report) is subtracted from the provi-
sions projection in equal amounts each quarter.
Other Losses
Loans Held for Sale or Measured under the
Fair-Value Option
Certain loans are not accounted for on an accrual
basis. Loans to which the fair-value option (FVO) is
applied are valued as mark-to-market assets. Loans
that are held-for-sale (HFS) are carried at the lower
of cost or market value.
FVO/HFS loan portfolios are identified by BHCs
and reported on the FR Y-14Q report. Losses related
to FVO/HFS loans are recognized in earnings on the
income statement at the time of the devaluation and
are calculated by applying scenario-specific interest
rate and credit spread projections.
Losses on C&I and CRE loans and commitments are
calculated by revaluing each loan or commitment
each quarter using a stressed discount yield. The ini-
tial discount yield is based on the loan or commit-
ment’s initial fair value, settlement date, maturity
date, and interest rate. Quarterly movements in the
discount yield over the planning horizon are
assumed to equal the stressed change in corporate
bond yields of the same credit rating and maturity,
adjusted for potential changes in credit ratings. The
models estimate changes in the fair value of the loan
in a given scenario on a committed-balance basis.
Losses on retail loans held under FVO/HFS
accounting are calculated over the nine quarters of
the planning horizon using a duration-based
approach. This approach uses balances on these
loans reported on the FR Y-14Q report, estimates of
portfolio-weighted duration, and quarterly changes
in stressed spreads from the macroeconomic sce-
nario. Estimates are calculated separately by vintage
and loan type. No losses are assumed for residential
mortgage loans under forward contract with the
government-sponsored enterprises (GSEs).
Gains and losses on FVO loan hedges are modeled
on a quarterly basis, using a set of scenario-specific
factor projections and factor sensitivities submitted
by BHCs. Profits and losses are calculated for a vari-
ety of hedge types, including corporate credit, rates,
equities, and commercial mortgage-backed securities
(CMBS). These profits and losses are netted from
estimated losses on the FVO loans.
Projections of fair value losses assume that each
position has a constant maturity over the projection
horizon. Aggregate gains and losses on hedges at the
firm level are netted against projected gains and
losses on wholesale and retail exposures in order to
arrive at final estimates.
Securities in the Available-for-Sale and
Held-to-Maturity Portfolios
Securities in the available-for-sale and held-to-
maturity (AFS/HTM) portfolios include U.S. Treas-
ury, U.S. Agency, municipal, mortgage-backed, asset-
backed, corporate debt, and equity securities. The
AFS/HTM portfolio does not include securities held
for trading; losses on these securities are projected
separately. Changes in the value of the AFS/HTM
portfolio can potentially impact a BHC’s capital in
two ways. First, other-than-temporary impairment
(OTTI) losses on AFS/HTM securities and other
realized gains and losses are recognized in the net
income of all BHCs. Second, under regulatory capi-
tal rules, advanced approaches BHCs and other
BHCs that opt into advanced approaches treatment
for the accumulated other comprehensive income
(AOCI) must incorporate into Common Equity Tier
1 (CET1) capital the AOCI that arises, in part, from
changes in the value of AFS securities. Both OTTI
and unrealized gains and losses on AFS securities are
projected at the security level, based on FR Y-
14Q data, and aggregated up to the BHC level.
OCI associated with AFS securities arises from
changes in the unrealized gains and losses on those
securities, which are calculated as the difference
between each security’s fair value and its amortized
cost. The amortized cost of each AFS security is col-
lected by the Federal Reserve and equals the pur-
chase price of a debt security periodically adjusted if
the debt security was purchased at a price other than
par or face value or has had a prior impairment rec-
ognized in earnings. The fair value of each AFS
security is projected over the nine-quarter planning
June 2017 67
horizon using one of three methods: a present-value
calculation, a full revaluation, or a duration-based
approach. The simple present-value calculation is
used to directly re-price U.S. Treasury securities. This
calculation incorporates both the timing and amount
of contractual cash flows and quarterly Treasury
yields from the macroeconomic scenario. Full revalu-
ation uses a security-specific discounted cash flow
model to re-price agency MBS. Finally, the duration-
based approach is used for all other securities. The
duration-based approach forecasts the quarterly
price path based on an approximation of the rela-
tionship between the securities price and its yield,
taking into account security-specific information.
Separate spread projections are calculated for securi-
ties in each asset class using projections of interest
rates, corporate credit spreads, volatility, and asset
prices included in supervisory scenarios. Final pro-
jections of OCI take into account applicable interest
hedges on the securities.
Securities experiencing an impairment over the fore-
cast horizon may be at risk of an OTTI, which
affects earnings and regulatory capital.56 An impair-
ment occurs when the fair value of a security falls
below its amortized cost. If the BHC intends to sell a
security, or if it is more likely than not that the BHC
will have to sell without recovering its investment,
then any impairment on that security will flow
through the BHC’s earnings and the full write-down
to fair value is recognized periodically as OTTI until
the quarter in which the security is sold. Otherwise, a
BHC must recognize as a charge to earnings only the
credit component of OTTI, which reflects a non-
temporary decline in present value below amortized
cost. The supervisory OTTI models are designed to
incorporate the credit component only, unless the
firm will be required to sell the security.57
U.S. Treasury and U.S. government agency obliga-
tions and U.S. government agency or GSE mortgage-
backed securities are assumed not to be at risk for
the kind of credit impairment that results in credit-
related OTTI charges. The supervisory OTTI models
test all other securities for the potential for OTTI
impairment under the stress scenario. For all securi-
ties at risk for impairment that would result in credit-
related OTTI charges, future balances are assumed to
have risk characteristics similar to those of the initial
balances.
Securities at risk of an impairment that would result
in credit-related OTTI charges can be grouped into
three categories: securitizations, direct debt obliga-
tions, and equity securities.
Securitized obligations include CMBS, U.S. non-
agency RMBS, collateralized loan obligations
(CLOs), auto asset-backed securities (ABS), credit
card ABS, and foreign RMBS. The present value of
security-level cash flows is calculated based on the
projected collateral cash flows and the structure of
the security using the contractual rate of interest on
the security as the discount rate. The projected col-
lateral cash flows of securitized obligations depend
on the performance of the collateral pool, which is
projected using internally developed or third-party
models that are conditioned on macroeconomic vari-
ables such as the unemployment rate, real estate
prices, GDP, and interest rates. The CMBS, U.S.
non-agency RMBS, and CLO models project the
performance of each loan in the pool. These models
are broken into PD and LGD components and
include applicable loan and borrower characteristics,
such as loan-to-value ratio, issuer credit rating, and
loan geography. Other models project the perfor-
mance of the overall portfolio. All models consider
variables specifying the type of loan and loan delin-
quency status.
Direct debt obligations are issued by a single issuer
with recourse and include corporate bonds and sov-
ereign bonds. In the models, whether a credit-related
OTTI charge is taken on these securities is based on
the potential for a rating downgrade. The potential
of a rating downgrade is determined by projected
changes in the one-year PD of the issuer for corpo-
rate bonds and the credit default swap (CDS) spread
for sovereign bonds in response to changes in macro-
economic drivers, such as interest rates, spreads, and
regional GDP. If the projected value of either the PD
or the CDS spread crosses a threshold level consis-
tent with a “CCC/Caa” rating or below, then the
security is considered to have an OTTI, to the extent
the projected present value of cash flow is below
amortized cost. If a security is considered OTTI,
then the present value of cash flows is projected
using historical data on bond recovery rates given
default.
56 Recognition and Presentation of Other-Than-Temporary-Impairments, Financial Accounting Standards Board, Staff Position No. FAS 115-2 and FAS 124-2 (April 9, 2009), www.fasb.org/jsp/FASB/Document_C/DocumentPage?cid=1176154545419&acceptedDisclaimer=true.
57 The model assumes that a collateralized loan obligation (CLO) considered a covered fund under the Board’s Regulation VV (the Volcker Rule) is required to be sold during the projection horizon, and that the CLO will be held until the date when it is required to be sold. See 12 CFR part 248.
68 Supervisory Stress Test Methodology and Results
Projected OTTI charges on other direct debt obliga-
tions, including municipal bonds and security types
with smaller levels of exposure, are based on the sta-
tistical relationship between observed OTTI write-
downs and the evolution of unrealized losses over
the scenario as projected by the fair value model. The
probability of an OTTI write-down and the severity
of the write-down are calculated separately.
Observed OTTI write-downs are based on data
reported on the FR Y-14Q report and unrealized loss
is calculated based on the initial amortized cost and
projections of the fair value model for the security.
Projected OTTI charges on equity securities are
based on the projected fair value of each security as
determined by the path of the U.S. equities index
and the sensitivity of each security’s returns to the
overall returns of the index.
Balances at risk of OTTI are assumed not to
decrease. After a security is written down as OTTI,
the difference between its original value and its post-
OTTI value is assumed to be invested in securities
with the same risk characteristics. Similarly, the fair
value projections assume that duration and remain-
ing life remain constant. Net increases projected by
the Federal Reserve in a BHC’s securities portfolio
after December 31, 2016, are assumed to be in short-
term, riskless assets, and no OTTI or OCI are pro-
jected on these securities.
Trading and Private Equity
Losses related to trading positions that are included
in the supervisory stress test are of two primary
types. The first type arises from changes in the mark-
to-market value of the trading positions. The second
type is associated with either the potential or the
realized default of obligors and counterparties. The
models used to project losses on trading positions
under the global market shock account for both
types of losses and rely on the market values and
stressed revaluation of positions provided by BHCs
on the FR Y-14Q report.
Mark-to-market gains and losses on trading posi-
tions are calculated by applying the movements in
the global market shock factors to the associated
market values or market value movements provided
by BHCs. The global market shock specifies move-
ments in numerous market factors, such as equity
prices, foreign exchange rates, interest rates and
spreads, commodity prices, securitized product
prices, and private equity values. BHCs provide the
market value of their securitized products and pri-
vate equity positions. For all other market factors,
BHCs provide the estimated market value change
(i.e., the profit or loss) across the trading book asso-
ciated with a single, limited movement in a market
factor (e.g., +1 basis point movement in a foreign
exchange rate) or a range of positive and negative
movements in a market factor (e.g., –30 percent,
–25 percent, +30 percent for a foreign exchange rate).
These market values and market value changes are
collected for the same factors specified in the global
market shock. The computation of gains and losses
is performed by applying the market factor move-
ments specified in the global market shock to the
information reported by BHCs. For securitized prod-
ucts and private equity positions, the market values
are multiplied by the global market shock market
value movements. For all other market factors the
gains and losses are computed by either multiplica-
tion of the global market shock movement and a
single associated market value change or by interpo-
lation using the range of associated market value
changes. The ranges are used to capture the non-
linear market value changes associated with certain
assets.
Credit Valuation Adjustments
Losses that are related to the potential adverse
changes in credit quality of a counterparty to deriva-
tives positions are captured through credit valuation
adjustments (CVA). CVA is an adjustment to the
mark-to-market valuation of a BHC’s trading posi-
tions that accounts for the risk of adverse changes in
counterparty credit quality prior to default on its
obligations. BHCs report their baseline and stressed
CVA on a counterparty-level on the FR Y-14Q
report as well as the associated baseline and stressed
values of the components of CVA: expected expo-
sure, PD, and LGD. The loss estimate is computed as
the difference between the baseline and the stressed
CVA for all counterparties.
Incremental Default Risk
In addition to mark-to-market and CVA losses on
trading positions, the losses associated with the
default of issuers of credit instruments is captured
through an incremental default risk (IDR) model
that estimates the losses in excess of mark-to-market
losses subsequent to default of an issuer. The expo-
sure types captured through this issuer default-loss
estimate include single-name products (e.g., corpo-
rate bonds and single name CDS), index and index-
tranche products, and securitized products, which are
June 2017 69
distinct from the bilateral derivatives agreements and
securities financing transactions included in the larg-
est counterparty default scenario component
(described below). A distribution of simulated sets of
issuer defaults is created through a random jump-to-
default framework that is based on factors such as
probability of default and obligor correlations.
Default distributions are simulated at the level of
individual obligors or at the instrument and rating
level, depending on exposure type. Losses associated
with each default are derived from exposure at
default, which is based on position information
reported on the FR Y-14Q report, and loss given
default, which is based on historical information.
The loss estimate is the loss associated with a
tail percentile of the distribution, which is calibrated
to the severity of the macroeconomic scenario.
Largest Counterparty Default
To estimate losses from the default of counterparties
to derivatives and securities financing transactions,
the Federal Reserve applied a counterparty default
scenario component to the eight BHCs that have
substantial trading or custodial operations. The loss
is based on the assumed instantaneous and unex-
pected default of a BHC’s largest counterparty,
defined as the counterparty that would produce the
largest total net stressed loss if it were to default on
all of its derivatives and securities financing transac-
tions. Net stressed loss was calculated using net
stressed current exposure (CE), which is derived by
applying the global market shock to the unstressed
positions as well as any collateral posted or received
and reported by BHCs. For derivative agreements,
net stressed current exposure was calculated net of
any stressed credit valuation adjustment (CVA)
losses and any gains from CVA hedges not included
in the calculation of trading gains or losses. A recov-
ery rate of 10 percent is assumed for both net
stressed CE and applicable CDS hedges.
Similar to the global market shock component, the
loss associated with the counterparty default compo-
nent occurs in the first quarter of the projection and
is an add-on to the economic conditions and finan-
cial market environment in the supervisory scenarios.
Certain sovereign entities (Canada, France, Ger-
many, Italy, Japan, the United Kingdom, and the
United States) and designated clearing counterpar-
ties were excluded when selecting the largest
counterparty.
PPNR
PPNR is the sum of net interest income (interest
income minus interest expense) plus noninterest
income less noninterest expense, including losses
from operational risk events and OREO expenses.
PPNR does not include provisions for credit losses
on loans or losses from other than temporary
impairments on securities.
Core components of PPNR
Core components of PPNR are forecast separately,
using autoregressive models, aggregate models,
simple nonparametric models, or structural models.
Significant efforts are made to eliminate or minimize
potential double-counting of losses. For example, in
estimating certain components of PPNR, historical
data series are adjusted, where appropriate, to
exclude losses from operational-risk events and
OREO expenses, which are modeled separately, as
described below. In addition, the modeling approach
for trading revenue (described below) limits the influ-
ence of severe market events captured in the global
market shock. Finally, PPNR projections do not
include debt valuation adjustments (DVA), which is
not included in regulatory capital.
When choosing the level of detail at which to model
the components of PPNR, consideration is given
both to BHCs’ business models and the ability to
model the individual income or expense component
accurately. Separate models are estimated for 22 dif-
ferent components of PPNR:
• The seven components of interest income modeled
include income on loans, Treasury securities,
mortgage-backed securities, federal funds and
repurchase agreements, other securities, trading
assets, and all other interest income.
• The five components of interest expense modeled
include interest expense on deposits, federal funds
and repurchase agreements, trading liabilities and
other borrowed money, subordinated debt, and all
other interest expenses.
70 Supervisory Stress Test Methodology and Results
• The seven components of noninterest income
include trading revenue and six components of
noninterest, non-trading income: service charges
on deposits, fiduciary income, income from insur-
ance, investment banking fees, net servicing fees,
and all other noninterest income.
• Finally, three components of noninterest expense
include compensation expense, fixed asset expense,
and all other noninterest expense (excluding losses
from operational-risk events or OREO expenses).
Each model generates projections of the PPNR com-
ponent scaled by a relevant asset or liability balance
(e.g., interest income on Treasury securities as a ratio
of the book value of Treasury securities). The ratio
forecast is then multiplied by the firm’s projected
asset or liability balance to generate a projection of
the dollars of PPNR for that component.
The types of models used to forecast various compo-
nents of PPNR include
• autoregressive models that relate the components
of a BHC’s revenues and non-provision-related
expenses, expressed as a share of relevant asset or
liability balances, to BHC characteristics and to
macroeconomic variables;
• aggregate models in which the revenue or expense
is allocated to each BHC based on a measure of
the BHC’s market share;
• simple nonparametric models based on recent
firm-level performance; and
• structural models that use granular data on indi-
vidual positions.
The specific macroeconomic variables included in
the models differ across equations based on statisti-
cal predictive power and economic theory. Macro-
economic variables used to project interest income
and interest expense include yields on short- and
long-term Treasury securities, and corporate bond
spreads. Noninterest non-trading income and nonin-
terest expense are projected as a function of GDP
growth, stock market volatility, stock returns, and
home price growth.
Trading revenues are volatile because they include
both changes in the market value of trading assets
and fees from market-making activities. Forecasts of
PPNR from trading activities at the six BHCs sub-
ject to the global market shock are modeled in the
aggregate, as a function of stock market returns and
changes in stock market volatility, and then allocated
to each BHC based on a measure of the BHC’s mar-
ket share. Net trading revenue is modeled using a
median regression approach to lessen the influence
of extreme movements in trading revenue, and,
thereby, to avoid double-counting of trading losses
that are captured under the global market shock.
Trading revenues for the remaining BHCs are mod-
eled as a function of corporate bond yields and long-
term Treasury yields, in an autoregressive framework
similar to that of other PPNR components.
Some noninterest income and noninterest expense
components are highly volatile quarter-to-quarter
but do not exhibit a clear cyclical pattern. As a
result, these components are modeled as a constant
forecast ratio to reflect median performance over the
past eight quarters.
The estimate of interest expenses on subordinated
debt is based on security-level information and takes
into account differences in the maturity schedule and
debt pricing across firms. The estimate also reflects
yields on short-term and long-term Treasury securi-
ties, and corporate bond spreads under various
scenarios.
An enhanced modeling approach for projecting cer-
tain components of PPNR was used for the first
time in DFAST 2017 (discussed in greater detail in
box 2). The enhanced autoregressive models follow
the same framework as the models used in DFAST
2016, but employ a different assumption about what
firm revenues and expenses converge towards over
time. Specifically, in the enhanced models, projec-
tions for PPNR components (expressed as a share of
a relevant asset or liability balance) converge over
time towards the BHC’s own post-crisis performance
for that revenue or expense category while still vary-
ing in response to changes in macro conditions. The
post-crisis period in this context is defined as the
time period from 2009:Q4 onwards. In contrast, in
the DFAST 2016 PPNR models, BHC projections
for some models are generally assumed to converge
towards industry average performance or the average
performance of a class of firms. The enhanced mod-
els also feature updates to the set of macroeconomic
variables and controls used in the model
specifications.
The enhanced models perform better according to a
number of key metrics. They better capture differ-
ences in business models across BHCs, produce pro-
jections which are more sensitive to economic condi-
tions, and have improved in-sample and out-of-
June 2017 71
sample forecasting performance compared to the
models used in DFAST 2016. The enhanced models
are also less sensitive to the most recent value of the
BHC’s revenues and expenses, improving the stabil-
ity of model projections over time.
For DFAST 2017, PPNR projections are calculated
as the arithmetic average of the projection from the
models used in DFAST 2016 and the enhanced mod-
els, consistent with the Federal Reserve’s policy of
phasing in the most material model enhancements
over two stress test cycles to smooth the effect on
post-stress capital ratios.58
Losses Related to Operational-Risk Events
Losses related to operational-risk events are a com-
ponent of PPNR and include losses stemming from
events such as fraud, computer system failures, pro-
cess errors, and lawsuits by employees, customers or
other parties. Operational-risk loss estimates include
the average of loss estimates from two modeling
approaches and estimates of potential costs from
unfavorable litigation outcomes.
Both modeling approaches— a historical simulation
approach and a regression model—project opera-
tional losses for the 34 BHCs and are based on his-
torical operational-loss data submitted by the BHCs
on the FR Y-14A/Q reports.
In the historical simulation model, losses at differ-
ent percentiles of simulated, nine-quarter loss distri-
butions are used as a proxy for the expected opera-
tional losses conditional on the macroeconomic sce-
narios. Losses are modeled for each BHC and each
of the seven operational-risk categories identified in
the Board’s advanced approaches rule.59 The histori-
cal simulation approach models the loss frequency
and loss severity separately. The tails of the loss
severity and frequency distributions are informed by
historical industry loss severity and frequency scaled
to the assets of individual BHCs, while the bodies of
these distributions are informed by each BHC’s his-
torical loss severity and frequency. The distribution
of aggregate losses is then simulated by repeatedly
drawing the 9-quarter event frequency from this fre-
quency distribution, and the severity of those events
from the severity distribution. The percentiles of loss
distributions, which are used to estimate stressed
losses, are tied to the frequency of severe recessions
for the severely adverse scenario and to the frequency
of all recessions for the adverse scenario. Loss fore-
casts for an individual BHC are the sum of the
BHC’s loss estimates for each event type.
The regression model is a two-step model. The first
step projects the industry aggregate operational
losses conditional on macroeconomic factors over
the nine-quarter horizon.60 A regression approach is
used to model industry operational losses as a func-
tion of macroeconomic variables, including measures
of economic activity, financial conditions, and inter-
est rate environment, and to produce industry aggre-
gate projected losses for each of the different sce-
narios. Finally, the second step estimates weights to
distribute industry losses to individual BHCs based
on each BHC’s size.
Mortgage Repurchase Losses
Mortgage repurchase losses are credit losses incurred
relating to breaches of representations and warran-
ties on mortgage loans sold to investors (GSEs,
private-label security investors, or whole loan buy-
ers). Mortgage repurchase risk has declined in recent
years due to improvements in underwriting stan-
dards and settlements relating to representations and
warranties for pre-crisis vintages. Furthermore, new
data from recent mortgage repurchase settlements
has allowed the operational risk model to better
incorporate mortgage repurchase risk, reducing the
need for a separate mortgage repurchase model.
As a result, the separate mortgage repurchase model
used in DFAST 2016 has now been retired.
58 For more information on the Federal Reserve's policy regarding material model changes, see Daniel K. Tarullo (2016), "Next Steps in the Evolution of Stress Testing," speech delivered at the Yale University School of Management Leaders Forum, New Haven, CT, September 26. Projections of the components of PPNR in DFAST 2018 will reflect the enhanced models only.
59 The seven operational-loss event type categories identified in the Federal Reserve’s advanced approaches rule are internal fraud; external fraud; employment practices and workplace safety; clients, products, and business practices; damage to physical assets; business disruption and system failures; and execution, delivery, and process management. See 12 CFR 217.101(b).
60 Losses are aggregated for six of the seven operational-risk cat-egories. Operational-risk losses due to damage to physical assets are the exception. These losses are not expected to be depen-dent on the macroeconomic environment and therefore are modelled separately only as a function of size, but not of mac-roeconomic variables.
72 Supervisory Stress Test Methodology and Results
Balance-Sheet Items and Risk-Weighted Assets
The size of each BHC’s balance sheet is projected
based on a model that relates industrywide loan and
non-loan asset growth to each other and to broader
economic variables, including a proxy for loan sup-
ply. The model allows for both long-run relationships
between the industry aggregates and macroeconomic
variables, as well as short-term dynamics that cause
deviations from these relationships. It is calculated
using aggregate data from the Federal Reserve’s
Financial Accounts of the United States (Z.1) and
the Bureau of Economic Analysis.
Industry loan and asset growth rates are projected
over the planning horizon using the macroeconomic
variables prescribed in the supervisory scenario. The
growth rates embed the assumption that the industry
will continue to lend using standards that are consis-
tent with long-run behavior. This tends to raise the
projected growth of lending by removing the effects
of BHC tightening that often occur in stressful peri-
ods. Over this horizon, each BHC is assumed to
maintain a constant share of the industry’s total
assets, total loans, and total trading assets. In addi-
tion, each BHC is assumed to maintain a constant
mix within their loan and trading asset categories.
These assumptions are applied as follows:
• Each category of loans at a BHC is assumed to
grow at the projected rate of total loans in the
industry.
• Each category of trading assets at a BHC is
assumed to grow as a function of both the pro-
jected rate of total assets and the projected market
value of trading assets in the industry.
• All other assets of a BHC, including securities, are
assumed to grow at the projected rate of non-loan
assets in the industry.
• A BHC’s cash holdings level, the residual category,
is set such that the sum of cash and noncash assets
grows at the projected rate of total assets.
• Growth in securities is assumed to be in short-
term, riskless assets.
Balance sheet projections incorporate expected
changes to a BHC’s business plan, such as mergers,
acquisitions, and divestitures that are likely to have a
material impact on its capital adequacy and funding
profile. BHC-submitted data are used to adjust the
projected balance sheet in the quarter when the
change is expected to occur. Once adjusted, assets
are assumed to grow at the same rate as the pre-
adjusted balance sheet. Only submitted divestitures
that are either completed or contractually agreed
upon before April 5, 2017, are incorporated.
The projection of RWAs is accomplished in two
parts and is based on the tenets of the standardized
approach and market risk rule in the Board’s Regu-
lation Q.61 The first part requires estimating the path
of credit RWAs based on exposures from loans and
securities.62 The second requires estimating the path
of MRWA based on exposures under the market risk
rule.63
Credit RWA projection is a straightforward imple-
mentation of the standardized approach. Most risk
weights are imputed from the FR Y-9C report and
held fixed throughout the projection horizon. Risk
weights are applied to appropriate balance paths and
summed across categories. This treatment is consis-
tent with the assumption that the general features of
the credit portfolio and non-trading book assets
remain constant during the projection period.
MRWA projections incorporate the assumption that
market risk is sensitive to the economic scenario. In
particular, the path of MRWAs is sensitive to
changes in the projected volatility of the underlying
mix of trading assets. While the underlying mix of
exposures subject to the market risk rule is assumed
to remain constant throughout the scenario, some
elements of MRWAs are affected by changes in mar-
ket conditions assumed in supervisory scenarios. For
example, projected value-at-risk (VaR) calcula-
tions—an important element of MRWAs—rise as
the volatility of the portfolio’s underlying assets
increases. Similarly, a firm’s incremental risk charge
and its comprehensive risk measure are affected by
the volatility of credit products. The remaining cat-
egories of MRWAs are assumed to evolve according
to projections of a BHC’s trading assets. These prop-
erties make the trajectory of MRWAs more dynamic
than credit RWAs because both the underlying path
of trading assets and the volatility associated with
the portfolio evolve.
61 12 CFR part 217, subparts D and F. The use of the advanced approaches for calculating risk-based capital ratios under the capital plan and stress test rules has been indefinitely deferred. See 80 Fed. Reg. 75,419 and 12 CFR 225.8(d)(8), 252.12(n), 252.42(m), and 252.52(n).
62 12 CFR part 217, subpart D.63 12 CFR part 217, subpart F.
June 2017 73
Regulatory Capital
The final modeling step translates the projections of
revenues, expenses, losses, provisions, balances, and
RWAs from the models described above into calcula-
tions of regulatory capital for each BHC under the
supervisory scenarios. Regulatory capital is calcu-
lated using the definitions of capital in the Board’s
Regulation Q.64 Regulatory capital is calculated con-
sistent with the requirements that will be in effect
during the projected quarter of the planning hori-
zon.65 The definition of regulatory capital changes
throughout the planning horizon in accordance with
the transition arrangements in the revised regulatory
capital framework.66
Regulatory capital is calculated incorporating esti-
mates of net income and taxable income based on
supervisory projections of total losses and revenues.
After-tax net income is calculated by applying a con-
sistent tax rate to taxable income for all BHCs.67 The
consistent tax rate is also used to generate projec-
tions of DTAs from temporary timing differences
and net operating losses. DTA projections are also
based on a firm’s starting tax position, including net
operating loss carrybacks and tax history. Then, a
valuation allowance is calculated to determine
whether a BHC will have sufficient taxable income in
the future to realize its DTAs. Changes in the valua-
tion allowance are factored into after-tax net income.
Finally, projected after-tax income adjusts for
income attributable to minority interests.
For DFAST 2017, the quarterly change in CET1
capital before adjustments and deductions equals
projected after-tax net income minus capital distribu-
tions (dividends and any other actions that disperse
equity), plus any issuance or other corporate actions
that increase equity, plus other changes in equity
capital such as other comprehensive income, and
changes incident to business combinations.68
Projected regulatory capital levels are calculated
using the applicable revised capital framework to
incorporate, as appropriate, projected levels of non-
common capital and certain items that are subject to
adjustment or deduction in capital. Some items, such
as DVA, goodwill, and intangible assets (other than
mortgage servicing assets), and components of
AOCI other than unrealized gains (losses) on AFS
securities, are assumed to remain constant at their
starting value over the planning horizon. For other
items, BHC projections—with supervisory adjust-
ments—were factored into the regulatory capital cal-
culation. Those items include the reported path of
additional tier 1 and tier 2 capital and significant
investments in the capital of unconsolidated finan-
cial institutions in the form of common stock. Other
items subject to deduction, including DTAs and
mortgage servicing assets, are projected under each
supervisory scenario. The Federal Reserve also
includes the effects of certain planned mergers,
acquisitions, or divestitures in its projections of capi-
tal and the components of capital.
The projections of regulatory capital levels are com-
bined with Federal Reserve projections of total assets
for the leverage ratio, total assets and off-balance
sheet exposures for the supplementary leverage ratio,
and RWAs to calculate regulatory capital ratios. The
risk-based regulatory capital ratios use risk-weighted
assets calculated under the standardized approach.69
Risk-weighted assets and on-balance sheet total
assets for the leverage ratio are projected based on
supervisory projections of each firm’s balance sheet.
Off-balance sheet items are projected based on the
64 See 12 CFR part 217.65 See 12 CFR 225.8(e)(2)(i)(A) and 12 CFR 252.56(a)(2).66 See 12 CFR part 217, subpart G.67 For a discussion of the effect of changing this tax rate assump-
tion, see Board of Governors of the Federal Reserve System, Dodd-Frank Act Stress Test 2013: Supervisory Stress Test Meth-odology and Results, (Washington: Board of Governors, March 2013), www.federalreserve.gov/newsevents/press/bcreg/dfast_2013_results_20130314.pdf, box 2.
68 The Federal Reserve used the following capital action assump-tions in projecting post-stress capital levels and ratios: (1) for the first quarter of 2017, each company’s actual capital actions as of the end of that quarter; and (2) for each quarter from the second quarter of 2017 through the first quarter of 2019, each
company’s projections of capital included (i) common stock dividends equal to the quarterly average dollar amount of com-mon stock dividends that the company paid in the previous year (that is, from the second quarter of 2016 through the first quarter of 2017) plus common stock dividends attributable to issuances related to expensed employee compensation or in connection with a planned merger or acquisition to the extent that the merger or acquisition is reflected in the covered compa-ny’s pro forma balance sheet estimates; (ii) payments on any other instrument that is eligible for inclusion in the numerator of a regulatory capital ratio equal to the stated dividend, inter-est, or principal due on such instrument during the quarter; (iii) an assumption of no redemption or repurchase of any capital instrument that is eligible for inclusion in the numerator of a regulatory capital ratio; and (iv) an assumption of no issuances of common stock or preferred stock, except for issuances related to expensed employee compensation or in connection with a planned merger or acquisition to the extent that the merger or acquisition is reflected in the covered company’s pro forma balance sheet estimates. These assumptions are generally consistent with the capital action assumptions BHCs are required to use in their Dodd-Frank Act company-run stress tests. See 12 CFR 252.56(b)(2).
69 See 12 CFR part 217.
74 Supervisory Stress Test Methodology and Results

bank-reported off-balance sheet SLR exposure and
are assumed to grow at the supervisory model-
projected total asset growth rate. The capital ratio
denominators are adjusted for items subject to
adjustment or deduction from capital, consistent
with the projection of each item in the numerator of
the regulatory capital ratios and the regulatory capi-
tal requirements. Projected capital levels and ratios
are not adjusted to account for any differences
between projected and actual performance of the
BHCs observed at the time the supervisory stress test
results were being produced in the second quarter of
2017.
June 2017 75


Appendix C: BHC-Specific Results
Tables begin on next page.
77

Table C.1.A. Ally Financial Inc.
Projected stressed capital ratios, risk-weighted assets, losses, revenues, net income before taxes, and loan lossesFederal Reserve estimates: Severely adverse scenario
Capital ratios, actual 2016:Q4 and projected 2017:Q1–2019:Q1
Percent
Regulatory ratio Actual
2016:Q4
Stressed capital ratios1
Ending Minimum
Common equity tier 1 capital ratio 9.4 6.5 6.5
Tier 1 capital ratio 10.9 8.1 8.1
Total capital ratio 12.6 10.1 10.1
Tier 1 leverage ratio 9.5 7.0 7.0
Supplementary leverage ratio n/a
1 The capital ratios are calculated using capital action assumptions provided
within the Dodd-Frank Act stress testing rule. See 12 CFR 252.56(b). These
projections represent hypothetical estimates that involve an economic outcome
that is more adverse than expected. The minimum capital ratios, other than the
supplementary leverage ratio, are for the period 2017:Q1 to 2019:Q1. The
minimum supplementary leverage ratio is for the period 2018:Q1 to 2019:Q1.
Supplementary leverage ratio projections only include estimates for firms
subject to the advanced approaches.
n/a Not applicable.
Projected loan losses, by type of loan, 2017:Q1–2019:Q1
Loan type Billions of
dollars Portfolio loss
rates (percent)1
Loan losses 6.5 5.2
First-lien mortgages, domestic 0.2 2.4
Junior liens and HELOCs, domestic 0.1 6.3
Commercial and industrial2 2.0 4.3
Commercial real estate, domestic 0.1 2.2
Credit cards 0.0 0.0
Other consumer3 4.1 6.6
Other loans4 0.0 7.5
1 Average loan balances used to calculate portfolio loss rates exclude loans held
for sale and loans held for investment under the fair-value option, and are
calculated over nine quarters.2 Commercial and industrial loans include small- and medium-enterprise loans
and corporate cards.3 Other consumer loans include student loans and automobile loans.4 Other loans include international real estate loans.
Risk-weighted assets, actual 2016:Q4 and projected 2019:Q1
Billions of dollars
Item Actual 2016:Q4 Projected 2019:Q1
Risk-weighted assets1 138.5 150.1
1 For each quarter, risk-weighted assets are calculated under the Board's
standardized capital risk-based approach in 12 CFR part 217, subpart D.
Projected losses, revenue, and net income before taxes through 2019:Q1
Item Billions of
dollars Percent of
average assets1
Pre-provision net revenue2 5.1 3.0
Other revenue3 0.0
less
Provisions 7.7
Realized losses/gains on securities (AFS/HTM) 0.5
Trading and counterparty losses4 0.0
Other losses/gains5 0.0
equals
Net income before taxes -3.1 -1.8
Memo items
Other comprehensive income6 0.0
Other effects on capital Actual 2016:Q4 2019:Q1
AOCI included in capital (billions of dollars)7 0.0 0.0
1 Average assets is the nine-quarter average of total assets.2 Pre-provision net revenue includes losses from operational-risk events and
other real estate owned (OREO) costs.3 Other revenue includes one-time income and (expense) items not included in
pre-provision net revenue.4 Trading and counterparty losses include mark-to-market and credit valuation
adjustments (CVA) losses and losses arising from the counterparty default
scenario component applied to derivatives, securities lending, and repurchase
agreement activities.5 Other losses/gains includes projected change in fair value of loans held for sale
and loans held for investment measured under the fair-value option, and
goodwill impairment losses.6 Other comprehensive income (OCI) is only calculated for advanced approaches
BHCs, and other BHCs that opt into the advanced approaches treatment of
AOCI.7 Certain aspects of AOCI are subject to transition arrangements for inclusion in
projected regulatory capital. The transition arrangements are 80 percent
included in projected regulatory capital for 2017 and 100 percent included in
projected regulatory capital starting in 2018. See 12 CFR 217.300(b)(3).
78 Supervisory Stress Test Methodology and Results

Table C.1.B. Ally Financial Inc.
Projected stressed capital ratios, risk-weighted assets, losses, revenues, net income before taxes, and loan lossesFederal Reserve estimates: Adverse scenario
Capital ratios, actual 2016:Q4 and projected 2017:Q1–2019:Q1
Percent
Regulatory ratio Actual
2016:Q4
Stressed capital ratios1
Ending Minimum
Common equity tier 1 capital ratio 9.4 8.6 8.4
Tier 1 capital ratio 10.9 10.2 10.1
Total capital ratio 12.6 12.1 12.0
Tier 1 leverage ratio 9.5 8.8 8.8
Supplementary leverage ratio n/a
1 The capital ratios are calculated using capital action assumptions provided
within the Dodd-Frank Act stress testing rule. See 12 CFR 252.56(b). These
projections represent hypothetical estimates that involve an economic outcome
that is more adverse than expected. The minimum capital ratios, other than the
supplementary leverage ratio, are for the period 2017:Q1 to 2019:Q1. The
minimum supplementary leverage ratio is for the period 2018:Q1 to 2019:Q1.
Supplementary leverage ratio projections only include estimates for firms
subject to the advanced approaches.
n/a Not applicable.
Projected loan losses, by type of loan, 2017:Q1–2019:Q1
Loan type Billions of
dollars Portfolio loss
rates (percent)1
Loan losses 4.5 3.6
First-lien mortgages, domestic 0.1 1.4
Junior liens and HELOCs, domestic 0.1 4.0
Commercial and industrial2 1.4 2.9
Commercial real estate, domestic 0.0 1.2
Credit cards 0.0 0.0
Other consumer3 2.9 4.6
Other loans4 0.0 4.6
1 Average loan balances used to calculate portfolio loss rates exclude loans held
for sale and loans held for investment under the fair-value option, and are
calculated over nine quarters.2 Commercial and industrial loans include small- and medium-enterprise loans
and corporate cards.3 Other consumer loans include student loans and automobile loans.4 Other loans include international real estate loans.
Risk-weighted assets, actual 2016:Q4 and projected 2019:Q1
Billions of dollars
Item Actual 2016:Q4 Projected 2019:Q1
Risk-weighted assets1 138.5 155.0
1 For each quarter, risk-weighted assets are calculated under the Board's
standardized capital risk-based approach in 12 CFR part 217, subpart D.
Projected losses, revenue, and net income before taxes through 2019:Q1
Item Billions of
dollars Percent of
average assets1
Pre-provision net revenue2 6.3 3.6
Other revenue3 0.0
less
Provisions 5.3
Realized losses/gains on securities (AFS/HTM) 0.3
Trading and counterparty losses4 0.0
Other losses/gains5 0.0
equals
Net income before taxes 0.6 0.4
Memo items
Other comprehensive income6 0.0
Other effects on capital Actual 2016:Q4 2019:Q1
AOCI included in capital (billions of dollars)7 0.0 0.0
1 Average assets is the nine-quarter average of total assets.2 Pre-provision net revenue includes losses from operational-risk events and
other real estate owned (OREO) costs.3 Other revenue includes one-time income and (expense) items not included in
pre-provision net revenue.4 Trading and counterparty losses include mark-to-market and credit valuation
adjustments (CVA) losses and losses arising from the counterparty default
scenario component applied to derivatives, securities lending, and repurchase
agreement activities.5 Other losses/gains includes projected change in fair value of loans held for sale
and loans held for investment measured under the fair-value option, and
goodwill impairment losses.6 Other comprehensive income (OCI) is only calculated for advanced approaches
BHCs, and other BHCs that opt into the advanced approaches treatment of
AOCI.7 Certain aspects of AOCI are subject to transition arrangements for inclusion in
projected regulatory capital. The transition arrangements are 80 percent
included in projected regulatory capital for 2017 and 100 percent included in
projected regulatory capital starting in 2018. See 12 CFR 217.300(b)(3).
June 2017 79

Table C.2.A. American Express Company
Projected stressed capital ratios, risk-weighted assets, losses, revenues, net income before taxes, and loan lossesFederal Reserve estimates: Severely adverse scenario
Capital ratios, actual 2016:Q4 and projected 2017:Q1–2019:Q1
Percent
Regulatory ratio Actual
2016:Q4
Stressed capital ratios1
Ending Minimum
Common equity tier 1 capital ratio 12.3 10.8 10.6
Tier 1 capital ratio 13.5 11.9 11.7
Total capital ratio 15.2 13.6 13.4
Tier 1 leverage ratio 11.6 10.3 10.3
Supplementary leverage ratio n/a 8.9 8.9
1 The capital ratios are calculated using capital action assumptions provided
within the Dodd-Frank Act stress testing rule. See 12 CFR 252.56(b). These
projections represent hypothetical estimates that involve an economic outcome
that is more adverse than expected. The minimum capital ratios, other than the
supplementary leverage ratio, are for the period 2017:Q1 to 2019:Q1. The
minimum supplementary leverage ratio is for the period 2018:Q1 to 2019:Q1.
Supplementary leverage ratio projections only include estimates for firms
subject to the advanced approaches.
n/a Not applicable.
Projected loan losses, by type of loan, 2017:Q1–2019:Q1
Loan type Billions of
dollars Portfolio loss
rates (percent)1
Loan losses 10.9 9.1
First-lien mortgages, domestic 0.0 0.0
Junior liens and HELOCs, domestic 0.0 0.0
Commercial and industrial2 4.2 10.2
Commercial real estate, domestic 0.0 0.0
Credit cards 6.7 8.6
Other consumer3 0.0 0.0
Other loans4 0.0 0.0
1 Average loan balances used to calculate portfolio loss rates exclude loans held
for sale and loans held for investment under the fair-value option, and are
calculated over nine quarters.2 Commercial and industrial loans include small- and medium-enterprise loans
and corporate cards.3 Other consumer loans include student loans and automobile loans.4 Other loans include international real estate loans.
Risk-weighted assets, actual 2016:Q4 and projected 2019:Q1
Billions of dollars
Item Actual 2016:Q4 Projected 2019:Q1
Risk-weighted assets1 131.0 145.0
1 For each quarter, risk-weighted assets are calculated under the Board's
standardized capital risk-based approach in 12 CFR part 217, subpart D.
Projected losses, revenue, and net income before taxes through 2019:Q1
Item Billions of
dollars Percent of
average assets1
Pre-provision net revenue2 19.1 11.4
Other revenue3 0.0
less
Provisions 14.3
Realized losses/gains on securities (AFS/HTM) 0.0
Trading and counterparty losses4 0.0
Other losses/gains5 0.0
equals
Net income before taxes 4.8 2.9
Memo items
Other comprehensive income6 0.0
Other effects on capital Actual 2016:Q4 2019:Q1
AOCI included in capital (billions of dollars)7 -2.6 -2.8
1 Average assets is the nine-quarter average of total assets.2 Pre-provision net revenue includes losses from operational-risk events and
other real estate owned (OREO) costs.3 Other revenue includes one-time income and (expense) items not included in
pre-provision net revenue.4 Trading and counterparty losses include mark-to-market and credit valuation
adjustments (CVA) losses and losses arising from the counterparty default
scenario component applied to derivatives, securities lending, and repurchase
agreement activities.5 Other losses/gains includes projected change in fair value of loans held for sale
and loans held for investment measured under the fair-value option, and
goodwill impairment losses.6 Other comprehensive income (OCI) is only calculated for advanced approaches
BHCs, and other BHCs that opt into the advanced approaches treatment of
AOCI.7 Certain aspects of AOCI are subject to transition arrangements for inclusion in
projected regulatory capital. The transition arrangements are 80 percent
included in projected regulatory capital for 2017 and 100 percent included in
projected regulatory capital starting in 2018. See 12 CFR 217.300(b)(3).
80 Supervisory Stress Test Methodology and Results

Table C.2.B. American Express Company
Projected stressed capital ratios, risk-weighted assets, losses, revenues, net income before taxes, and loan lossesFederal Reserve estimates: Adverse scenario
Capital ratios, actual 2016:Q4 and projected 2017:Q1–2019:Q1
Percent
Regulatory ratio Actual
2016:Q4
Stressed capital ratios1
Ending Minimum
Common equity tier 1 capital ratio 12.3 12.9 11.7
Tier 1 capital ratio 13.5 14.0 12.9
Total capital ratio 15.2 15.6 14.6
Tier 1 leverage ratio 11.6 11.9 11.0
Supplementary leverage ratio n/a 10.2 9.8
1 The capital ratios are calculated using capital action assumptions provided
within the Dodd-Frank Act stress testing rule. See 12 CFR 252.56(b). These
projections represent hypothetical estimates that involve an economic outcome
that is more adverse than expected. The minimum capital ratios, other than the
supplementary leverage ratio, are for the period 2017:Q1 to 2019:Q1. The
minimum supplementary leverage ratio is for the period 2018:Q1 to 2019:Q1.
Supplementary leverage ratio projections only include estimates for firms
subject to the advanced approaches.
n/a Not applicable.
Projected loan losses, by type of loan, 2017:Q1–2019:Q1
Loan type Billions of
dollars Portfolio loss
rates (percent)1
Loan losses 8.3 6.9
First-lien mortgages, domestic 0.0 0.0
Junior liens and HELOCs, domestic 0.0 0.0
Commercial and industrial2 3.1 7.4
Commercial real estate, domestic 0.0 0.0
Credit cards 5.2 6.6
Other consumer3 0.0 0.0
Other loans4 0.0 0.0
1 Average loan balances used to calculate portfolio loss rates exclude loans held
for sale and loans held for investment under the fair-value option, and are
calculated over nine quarters.2 Commercial and industrial loans include small- and medium-enterprise loans
and corporate cards.3 Other consumer loans include student loans and automobile loans.4 Other loans include international real estate loans.
Risk-weighted assets, actual 2016:Q4 and projected 2019:Q1
Billions of dollars
Item Actual 2016:Q4 Projected 2019:Q1
Risk-weighted assets1 131.0 147.3
1 For each quarter, risk-weighted assets are calculated under the Board's
standardized capital risk-based approach in 12 CFR part 217, subpart D.
Projected losses, revenue, and net income before taxes through 2019:Q1
Item Billions of
dollars Percent of
average assets1
Pre-provision net revenue2 20.5 12.0
Other revenue3 0.0
less
Provisions 10.6
Realized losses/gains on securities (AFS/HTM) 0.0
Trading and counterparty losses4 0.0
Other losses/gains5 0.0
equals
Net income before taxes 9.9 5.8
Memo items
Other comprehensive income6 0.0
Other effects on capital Actual 2016:Q4 2019:Q1
AOCI included in capital (billions of dollars)7 -2.6 -2.8
1 Average assets is the nine-quarter average of total assets.2 Pre-provision net revenue includes losses from operational-risk events and
other real estate owned (OREO) costs.3 Other revenue includes one-time income and (expense) items not included in
pre-provision net revenue.4 Trading and counterparty losses include mark-to-market and credit valuation
adjustments (CVA) losses and losses arising from the counterparty default
scenario component applied to derivatives, securities lending, and repurchase
agreement activities.5 Other losses/gains includes projected change in fair value of loans held for sale
and loans held for investment measured under the fair-value option, and
goodwill impairment losses.6 Other comprehensive income (OCI) is only calculated for advanced approaches
BHCs, and other BHCs that opt into the advanced approaches treatment of
AOCI.7 Certain aspects of AOCI are subject to transition arrangements for inclusion in
projected regulatory capital. The transition arrangements are 80 percent
included in projected regulatory capital for 2017 and 100 percent included in
projected regulatory capital starting in 2018. See 12 CFR 217.300(b)(3).
June 2017 81

Table C.3.A. BancWest Corporation
Projected stressed capital ratios, risk-weighted assets, losses, revenues, net income before taxes, and loan lossesFederal Reserve estimates: Severely adverse scenario
Capital ratios, actual 2016:Q4 and projected 2017:Q1–2019:Q1
Percent
Regulatory ratio Actual
2016:Q4
Stressed capital ratios1
Ending Minimum
Common equity tier 1 capital ratio 13.1 9.1 9.1
Tier 1 capital ratio 13.4 9.5 9.5
Total capital ratio 15.3 11.6 11.6
Tier 1 leverage ratio 11.1 7.9 7.9
Supplementary leverage ratio n/a
1 The capital ratios are calculated using capital action assumptions provided
within the Dodd-Frank Act stress testing rule. See 12 CFR 252.56(b). These
projections represent hypothetical estimates that involve an economic outcome
that is more adverse than expected. The minimum capital ratios, other than the
supplementary leverage ratio, are for the period 2017:Q1 to 2019:Q1. The
minimum supplementary leverage ratio is for the period 2018:Q1 to 2019:Q1.
Supplementary leverage ratio projections only include estimates for firms
subject to the advanced approaches.
n/a Not applicable.
Projected loan losses, by type of loan, 2017:Q1–2019:Q1
Loan type Billions of
dollars Portfolio loss
rates (percent)1
Loan losses 4.7 6.4
First-lien mortgages, domestic 0.2 2.3
Junior liens and HELOCs, domestic 0.1 3.9
Commercial and industrial2 1.5 8.8
Commercial real estate, domestic 1.4 7.6
Credit cards 0.1 13.0
Other consumer3 1.0 5.6
Other loans4 0.4 6.6
1 Average loan balances used to calculate portfolio loss rates exclude loans held
for sale and loans held for investment under the fair-value option, and are
calculated over nine quarters.2 Commercial and industrial loans include small- and medium-enterprise loans
and corporate cards.3 Other consumer loans include student loans and automobile loans.4 Other loans include international real estate loans.
Risk-weighted assets, actual 2016:Q4 and projected 2019:Q1
Billions of dollars
Item Actual 2016:Q4 Projected 2019:Q1
Risk-weighted assets1 80.1 87.2
1 For each quarter, risk-weighted assets are calculated under the Board's
standardized capital risk-based approach in 12 CFR part 217, subpart D.
Projected losses, revenue, and net income before taxes through 2019:Q1
Item Billions of
dollars Percent of
average assets1
Pre-provision net revenue2 2.4 2.2
Other revenue3 0.0
less
Provisions 5.5
Realized losses/gains on securities (AFS/HTM) 0.0
Trading and counterparty losses4 0.0
Other losses/gains5 0.0
equals
Net income before taxes -3.1 -2.8
Memo items
Other comprehensive income6 0.0
Other effects on capital Actual 2016:Q4 2019:Q1
AOCI included in capital (billions of dollars)7 0.0 0.0
1 Average assets is the nine-quarter average of total assets.2 Pre-provision net revenue includes losses from operational-risk events and
other real estate owned (OREO) costs.3 Other revenue includes one-time income and (expense) items not included in
pre-provision net revenue.4 Trading and counterparty losses include mark-to-market and credit valuation
adjustments (CVA) losses and losses arising from the counterparty default
scenario component applied to derivatives, securities lending, and repurchase
agreement activities.5 Other losses/gains includes projected change in fair value of loans held for sale
and loans held for investment measured under the fair-value option, and
goodwill impairment losses.6 Other comprehensive income (OCI) is only calculated for advanced approaches
BHCs, and other BHCs that opt into the advanced approaches treatment of
AOCI.7 Certain aspects of AOCI are subject to transition arrangements for inclusion in
projected regulatory capital. The transition arrangements are 80 percent
included in projected regulatory capital for 2017 and 100 percent included in
projected regulatory capital starting in 2018. See 12 CFR 217.300(b)(3).
82 Supervisory Stress Test Methodology and Results

Table C.3.B. BancWest Corporation
Projected stressed capital ratios, risk-weighted assets, losses, revenues, net income before taxes, and loan lossesFederal Reserve estimates: Adverse scenario
Capital ratios, actual 2016:Q4 and projected 2017:Q1–2019:Q1
Percent
Regulatory ratio Actual
2016:Q4
Stressed capital ratios1
Ending Minimum
Common equity tier 1 capital ratio 13.1 11.8 11.8
Tier 1 capital ratio 13.4 12.3 12.3
Total capital ratio 15.3 14.3 14.3
Tier 1 leverage ratio 11.1 10.1 10.1
Supplementary leverage ratio n/a
1 The capital ratios are calculated using capital action assumptions provided
within the Dodd-Frank Act stress testing rule. See 12 CFR 252.56(b). These
projections represent hypothetical estimates that involve an economic outcome
that is more adverse than expected. The minimum capital ratios, other than the
supplementary leverage ratio, are for the period 2017:Q1 to 2019:Q1. The
minimum supplementary leverage ratio is for the period 2018:Q1 to 2019:Q1.
Supplementary leverage ratio projections only include estimates for firms
subject to the advanced approaches.
n/a Not applicable.
Projected loan losses, by type of loan, 2017:Q1–2019:Q1
Loan type Billions of
dollars Portfolio loss
rates (percent)1
Loan losses 2.9 3.8
First-lien mortgages, domestic 0.1 1.2
Junior liens and HELOCs, domestic 0.1 2.2
Commercial and industrial2 1.0 5.7
Commercial real estate, domestic 0.7 3.9
Credit cards 0.0 10.3
Other consumer3 0.6 3.5
Other loans4 0.3 4.4
1 Average loan balances used to calculate portfolio loss rates exclude loans held
for sale and loans held for investment under the fair-value option, and are
calculated over nine quarters.2 Commercial and industrial loans include small- and medium-enterprise loans
and corporate cards.3 Other consumer loans include student loans and automobile loans.4 Other loans include international real estate loans.
Risk-weighted assets, actual 2016:Q4 and projected 2019:Q1
Billions of dollars
Item Actual 2016:Q4 Projected 2019:Q1
Risk-weighted assets1 80.1 90.1
1 For each quarter, risk-weighted assets are calculated under the Board's
standardized capital risk-based approach in 12 CFR part 217, subpart D.
Projected losses, revenue, and net income before taxes through 2019:Q1
Item Billions of
dollars Percent of
average assets1
Pre-provision net revenue2 3.1 2.8
Other revenue3 0.0
less
Provisions 3.2
Realized losses/gains on securities (AFS/HTM) 0.0
Trading and counterparty losses4 0.0
Other losses/gains5 0.0
equals
Net income before taxes -0.1 -0.1
Memo items
Other comprehensive income6 0.0
Other effects on capital Actual 2016:Q4 2019:Q1
AOCI included in capital (billions of dollars)7 0.0 0.0
1 Average assets is the nine-quarter average of total assets.2 Pre-provision net revenue includes losses from operational-risk events and
other real estate owned (OREO) costs.3 Other revenue includes one-time income and (expense) items not included in
pre-provision net revenue.4 Trading and counterparty losses include mark-to-market and credit valuation
adjustments (CVA) losses and losses arising from the counterparty default
scenario component applied to derivatives, securities lending, and repurchase
agreement activities.5 Other losses/gains includes projected change in fair value of loans held for sale
and loans held for investment measured under the fair-value option, and
goodwill impairment losses.6 Other comprehensive income (OCI) is only calculated for advanced approaches
BHCs, and other BHCs that opt into the advanced approaches treatment of
AOCI.7 Certain aspects of AOCI are subject to transition arrangements for inclusion in
projected regulatory capital. The transition arrangements are 80 percent
included in projected regulatory capital for 2017 and 100 percent included in
projected regulatory capital starting in 2018. See 12 CFR 217.300(b)(3).
June 2017 83

Table C.4.A. Bank of America Corporation
Projected stressed capital ratios, risk-weighted assets, losses, revenues, net income before taxes, and loan lossesFederal Reserve estimates: Severely adverse scenario
Capital ratios, actual 2016:Q4 and projected 2017:Q1–2019:Q1
Percent
Regulatory ratio Actual
2016:Q4
Stressed capital ratios1
Ending Minimum
Common equity tier 1 capital ratio 12.1 8.9 8.9
Tier 1 capital ratio 13.6 10.5 10.5
Total capital ratio 16.3 13.2 13.2
Tier 1 leverage ratio 8.9 6.8 6.8
Supplementary leverage ratio n/a 5.4 5.4
1 The capital ratios are calculated using capital action assumptions provided
within the Dodd-Frank Act stress testing rule. See 12 CFR 252.56(b). These
projections represent hypothetical estimates that involve an economic outcome
that is more adverse than expected. The minimum capital ratios, other than the
supplementary leverage ratio, are for the period 2017:Q1 to 2019:Q1. The
minimum supplementary leverage ratio is for the period 2018:Q1 to 2019:Q1.
Supplementary leverage ratio projections only include estimates for firms
subject to the advanced approaches.
n/a Not applicable.
Projected loan losses, by type of loan, 2017:Q1–2019:Q1
Loan type Billions of
dollars Portfolio loss
rates (percent)1
Loan losses 45.0 4.6
First-lien mortgages, domestic 4.1 2.1
Junior liens and HELOCs, domestic 3.5 5.1
Commercial and industrial2 12.1 4.7
Commercial real estate, domestic 5.9 8.0
Credit cards 11.7 12.2
Other consumer3 1.9 2.2
Other loans4 5.7 3.0
1 Average loan balances used to calculate portfolio loss rates exclude loans held
for sale and loans held for investment under the fair-value option, and are
calculated over nine quarters.2 Commercial and industrial loans include small- and medium-enterprise loans
and corporate cards.3 Other consumer loans include student loans and automobile loans.4 Other loans include international real estate loans.
Risk-weighted assets, actual 2016:Q4 and projected 2019:Q1
Billions of dollars
Item Actual 2016:Q4 Projected 2019:Q1
Risk-weighted assets1 1,399.5 1,505.5
1 For each quarter, risk-weighted assets are calculated under the Board's
standardized capital risk-based approach in 12 CFR part 217, subpart D.
Projected losses, revenue, and net income before taxes through 2019:Q1
Item Billions of
dollars Percent of
average assets1
Pre-provision net revenue2 40.2 1.7
Other revenue3 0.8
less
Provisions 48.2
Realized losses/gains on securities (AFS/HTM) 0.9
Trading and counterparty losses4 15.7
Other losses/gains5 2.7
equals
Net income before taxes -26.4 -1.1
Memo items
Other comprehensive income6 4.5
Other effects on capital Actual 2016:Q4 2019:Q1
AOCI included in capital (billions of dollars)7 -4.5 -1.9
1 Average assets is the nine-quarter average of total assets.2 Pre-provision net revenue includes losses from operational-risk events and
other real estate owned (OREO) costs.3 Other revenue includes one-time income and (expense) items not included in
pre-provision net revenue.4 Trading and counterparty losses include mark-to-market and credit valuation
adjustments (CVA) losses and losses arising from the counterparty default
scenario component applied to derivatives, securities lending, and repurchase
agreement activities.5 Other losses/gains includes projected change in fair value of loans held for sale
and loans held for investment measured under the fair-value option, and
goodwill impairment losses.6 Other comprehensive income (OCI) is only calculated for advanced approaches
BHCs, and other BHCs that opt into the advanced approaches treatment of
AOCI.7 Certain aspects of AOCI are subject to transition arrangements for inclusion in
projected regulatory capital. The transition arrangements are 80 percent
included in projected regulatory capital for 2017 and 100 percent included in
projected regulatory capital starting in 2018. See 12 CFR 217.300(b)(3).
84 Supervisory Stress Test Methodology and Results

Table C.4.B. Bank of America Corporation
Projected stressed capital ratios, risk-weighted assets, losses, revenues, net income before taxes, and loan lossesFederal Reserve estimates: Adverse scenario
Capital ratios, actual 2016:Q4 and projected 2017:Q1–2019:Q1
Percent
Regulatory ratio Actual
2016:Q4
Stressed capital ratios1
Ending Minimum
Common equity tier 1 capital ratio 12.1 11.1 10.6
Tier 1 capital ratio 13.6 12.7 12.2
Total capital ratio 16.3 14.8 14.7
Tier 1 leverage ratio 8.9 8.2 8.0
Supplementary leverage ratio n/a 6.5 6.3
1 The capital ratios are calculated using capital action assumptions provided
within the Dodd-Frank Act stress testing rule. See 12 CFR 252.56(b). These
projections represent hypothetical estimates that involve an economic outcome
that is more adverse than expected. The minimum capital ratios, other than the
supplementary leverage ratio, are for the period 2017:Q1 to 2019:Q1. The
minimum supplementary leverage ratio is for the period 2018:Q1 to 2019:Q1.
Supplementary leverage ratio projections only include estimates for firms
subject to the advanced approaches.
n/a Not applicable.
Projected loan losses, by type of loan, 2017:Q1–2019:Q1
Loan type Billions of
dollars Portfolio loss
rates (percent)1
Loan losses 29.1 3.0
First-lien mortgages, domestic 2.1 1.0
Junior liens and HELOCs, domestic 2.2 3.1
Commercial and industrial2 7.9 3.0
Commercial real estate, domestic 2.8 3.8
Credit cards 9.2 9.4
Other consumer3 1.3 1.6
Other loans4 3.6 1.9
1 Average loan balances used to calculate portfolio loss rates exclude loans held
for sale and loans held for investment under the fair-value option, and are
calculated over nine quarters.2 Commercial and industrial loans include small- and medium-enterprise loans
and corporate cards.3 Other consumer loans include student loans and automobile loans.4 Other loans include international real estate loans.
Risk-weighted assets, actual 2016:Q4 and projected 2019:Q1
Billions of dollars
Item Actual 2016:Q4 Projected 2019:Q1
Risk-weighted assets1 1,399.5 1,560.7
1 For each quarter, risk-weighted assets are calculated under the Board's
standardized capital risk-based approach in 12 CFR part 217, subpart D.
Projected losses, revenue, and net income before taxes through 2019:Q1
Item Billions of
dollars Percent of
average assets1
Pre-provision net revenue2 61.5 2.6
Other revenue3 0.8
less
Provisions 28.1
Realized losses/gains on securities (AFS/HTM) 0.6
Trading and counterparty losses4 9.7
Other losses/gains5 2.3
equals
Net income before taxes 21.6 0.9
Memo items
Other comprehensive income6 -1.9
Other effects on capital Actual 2016:Q4 2019:Q1
AOCI included in capital (billions of dollars)7 -4.5 -8.3
1 Average assets is the nine-quarter average of total assets.2 Pre-provision net revenue includes losses from operational-risk events and
other real estate owned (OREO) costs.3 Other revenue includes one-time income and (expense) items not included in
pre-provision net revenue.4 Trading and counterparty losses include mark-to-market and credit valuation
adjustments (CVA) losses and losses arising from the counterparty default
scenario component applied to derivatives, securities lending, and repurchase
agreement activities.5 Other losses/gains includes projected change in fair value of loans held for sale
and loans held for investment measured under the fair-value option, and
goodwill impairment losses.6 Other comprehensive income (OCI) is only calculated for advanced approaches
BHCs, and other BHCs that opt into the advanced approaches treatment of
AOCI.7 Certain aspects of AOCI are subject to transition arrangements for inclusion in
projected regulatory capital. The transition arrangements are 80 percent
included in projected regulatory capital for 2017 and 100 percent included in
projected regulatory capital starting in 2018. See 12 CFR 217.300(b)(3).
June 2017 85

Table C.5.A. The Bank of New York Mellon Corporation
Projected stressed capital ratios, risk-weighted assets, losses, revenues, net income before taxes, and loan lossesFederal Reserve estimates: Severely adverse scenario
Capital ratios, actual 2016:Q4 and projected 2017:Q1–2019:Q1
Percent
Regulatory ratio Actual
2016:Q4
Stressed capital ratios1
Ending Minimum
Common equity tier 1 capital ratio 12.3 12.8 11.2
Tier 1 capital ratio 14.5 15.0 13.4
Total capital ratio 15.2 15.6 14.1
Tier 1 leverage ratio 6.6 6.7 6.0
Supplementary leverage ratio n/a 6.1 5.5
1 The capital ratios are calculated using capital action assumptions provided
within the Dodd-Frank Act stress testing rule. See 12 CFR 252.56(b). These
projections represent hypothetical estimates that involve an economic outcome
that is more adverse than expected. The minimum capital ratios, other than the
supplementary leverage ratio, are for the period 2017:Q1 to 2019:Q1. The
minimum supplementary leverage ratio is for the period 2018:Q1 to 2019:Q1.
Supplementary leverage ratio projections only include estimates for firms
subject to the advanced approaches.
n/a Not applicable.
Projected loan losses, by type of loan, 2017:Q1–2019:Q1
Loan type Billions of
dollars Portfolio loss
rates (percent)1
Loan losses 1.7 2.5
First-lien mortgages, domestic 0.2 2.2
Junior liens and HELOCs, domestic 0.0 5.0
Commercial and industrial2 0.1 3.4
Commercial real estate, domestic 0.3 7.9
Credit cards 0.0 0.0
Other consumer3 0.3 9.3
Other loans4 0.8 1.6
1 Average loan balances used to calculate portfolio loss rates exclude loans held
for sale and loans held for investment under the fair-value option, and are
calculated over nine quarters.2 Commercial and industrial loans include small- and medium-enterprise loans
and corporate cards.3 Other consumer loans include student loans and automobile loans.4 Other loans include international real estate loans.
Risk-weighted assets, actual 2016:Q4 and projected 2019:Q1
Billions of dollars
Item Actual 2016:Q4 Projected 2019:Q1
Risk-weighted assets1 147.7 158.4
1 For each quarter, risk-weighted assets are calculated under the Board's
standardized capital risk-based approach in 12 CFR part 217, subpart D.
Projected losses, revenue, and net income before taxes through 2019:Q1
Item Billions of
dollars Percent of
average assets1
Pre-provision net revenue2 10.2 2.9
Other revenue3 0.0
less
Provisions 2.0
Realized losses/gains on securities (AFS/HTM) 0.0
Trading and counterparty losses4 0.4
Other losses/gains5 0.0
equals
Net income before taxes 7.7 2.2
Memo items
Other comprehensive income6 0.4
Other effects on capital Actual 2016:Q4 2019:Q1
AOCI included in capital (billions of dollars)7 -3.2 -3.4
1 Average assets is the nine-quarter average of total assets.2 Pre-provision net revenue includes losses from operational-risk events and
other real estate owned (OREO) costs.3 Other revenue includes one-time income and (expense) items not included in
pre-provision net revenue.4 Trading and counterparty losses include mark-to-market and credit valuation
adjustments (CVA) losses and losses arising from the counterparty default
scenario component applied to derivatives, securities lending, and repurchase
agreement activities.5 Other losses/gains includes projected change in fair value of loans held for sale
and loans held for investment measured under the fair-value option, and
goodwill impairment losses.6 Other comprehensive income (OCI) is only calculated for advanced approaches
BHCs, and other BHCs that opt into the advanced approaches treatment of
AOCI.7 Certain aspects of AOCI are subject to transition arrangements for inclusion in
projected regulatory capital. The transition arrangements are 80 percent
included in projected regulatory capital for 2017 and 100 percent included in
projected regulatory capital starting in 2018. See 12 CFR 217.300(b)(3).
86 Supervisory Stress Test Methodology and Results

Table C.5.B. The Bank of New York Mellon Corporation
Projected stressed capital ratios, risk-weighted assets, losses, revenues, net income before taxes, and loan lossesFederal Reserve estimates: Adverse scenario
Capital ratios, actual 2016:Q4 and projected 2017:Q1–2019:Q1
Percent
Regulatory ratio Actual
2016:Q4
Stressed capital ratios1
Ending Minimum
Common equity tier 1 capital ratio 12.3 13.3 11.0
Tier 1 capital ratio 14.5 15.4 13.3
Total capital ratio 15.2 16.0 13.8
Tier 1 leverage ratio 6.6 6.8 6.0
Supplementary leverage ratio n/a 6.2 5.6
1 The capital ratios are calculated using capital action assumptions provided
within the Dodd-Frank Act stress testing rule. See 12 CFR 252.56(b). These
projections represent hypothetical estimates that involve an economic outcome
that is more adverse than expected. The minimum capital ratios, other than the
supplementary leverage ratio, are for the period 2017:Q1 to 2019:Q1. The
minimum supplementary leverage ratio is for the period 2018:Q1 to 2019:Q1.
Supplementary leverage ratio projections only include estimates for firms
subject to the advanced approaches.
n/a Not applicable.
Projected loan losses, by type of loan, 2017:Q1–2019:Q1
Loan type Billions of
dollars Portfolio loss
rates (percent)1
Loan losses 1.1 1.6
First-lien mortgages, domestic 0.1 1.4
Junior liens and HELOCs, domestic 0.0 3.6
Commercial and industrial2 0.1 2.2
Commercial real estate, domestic 0.1 3.7
Credit cards 0.0 0.0
Other consumer3 0.2 7.3
Other loans4 0.5 1.1
1 Average loan balances used to calculate portfolio loss rates exclude loans held
for sale and loans held for investment under the fair-value option, and are
calculated over nine quarters.2 Commercial and industrial loans include small- and medium-enterprise loans
and corporate cards.3 Other consumer loans include student loans and automobile loans.4 Other loans include international real estate loans.
Risk-weighted assets, actual 2016:Q4 and projected 2019:Q1
Billions of dollars
Item Actual 2016:Q4 Projected 2019:Q1
Risk-weighted assets1 147.7 162.8
1 For each quarter, risk-weighted assets are calculated under the Board's
standardized capital risk-based approach in 12 CFR part 217, subpart D.
Projected losses, revenue, and net income before taxes through 2019:Q1
Item Billions of
dollars Percent of
average assets1
Pre-provision net revenue2 13.0 3.6
Other revenue3 0.0
less
Provisions 1.3
Realized losses/gains on securities (AFS/HTM) 0.0
Trading and counterparty losses4 0.2
Other losses/gains5 0.0
equals
Net income before taxes 11.5 3.2
Memo items
Other comprehensive income6 -0.7
Other effects on capital Actual 2016:Q4 2019:Q1
AOCI included in capital (billions of dollars)7 -3.2 -4.4
1 Average assets is the nine-quarter average of total assets.2 Pre-provision net revenue includes losses from operational-risk events and
other real estate owned (OREO) costs.3 Other revenue includes one-time income and (expense) items not included in
pre-provision net revenue.4 Trading and counterparty losses include mark-to-market and credit valuation
adjustments (CVA) losses and losses arising from the counterparty default
scenario component applied to derivatives, securities lending, and repurchase
agreement activities.5 Other losses/gains includes projected change in fair value of loans held for sale
and loans held for investment measured under the fair-value option, and
goodwill impairment losses.6 Other comprehensive income (OCI) is only calculated for advanced approaches
BHCs, and other BHCs that opt into the advanced approaches treatment of
AOCI.7 Certain aspects of AOCI are subject to transition arrangements for inclusion in
projected regulatory capital. The transition arrangements are 80 percent
included in projected regulatory capital for 2017 and 100 percent included in
projected regulatory capital starting in 2018. See 12 CFR 217.300(b)(3).
June 2017 87

Table C.6.A. BB&T Corporation
Projected stressed capital ratios, risk-weighted assets, losses, revenues, net income before taxes, and loan lossesFederal Reserve estimates: Severely adverse scenario
Capital ratios, actual 2016:Q4 and projected 2017:Q1–2019:Q1
Percent
Regulatory ratio Actual
2016:Q4
Stressed capital ratios1
Ending Minimum
Common equity tier 1 capital ratio 10.2 7.9 7.9
Tier 1 capital ratio 12.0 9.5 9.5
Total capital ratio 14.1 11.7 11.7
Tier 1 leverage ratio 10.0 7.9 7.9
Supplementary leverage ratio n/a
1 The capital ratios are calculated using capital action assumptions provided
within the Dodd-Frank Act stress testing rule. See 12 CFR 252.56(b). These
projections represent hypothetical estimates that involve an economic outcome
that is more adverse than expected. The minimum capital ratios, other than the
supplementary leverage ratio, are for the period 2017:Q1 to 2019:Q1. The
minimum supplementary leverage ratio is for the period 2018:Q1 to 2019:Q1.
Supplementary leverage ratio projections only include estimates for firms
subject to the advanced approaches.
n/a Not applicable.
Projected loan losses, by type of loan, 2017:Q1–2019:Q1
Loan type Billions of
dollars Portfolio loss
rates (percent)1
Loan losses 7.1 4.7
First-lien mortgages, domestic 0.8 2.5
Junior liens and HELOCs, domestic 0.3 3.2
Commercial and industrial2 1.5 5.2
Commercial real estate, domestic 2.3 6.0
Credit cards 0.3 13.2
Other consumer3 1.3 6.3
Other loans4 0.6 3.4
1 Average loan balances used to calculate portfolio loss rates exclude loans held
for sale and loans held for investment under the fair-value option, and are
calculated over nine quarters.2 Commercial and industrial loans include small- and medium-enterprise loans
and corporate cards.3 Other consumer loans include student loans and automobile loans.4 Other loans include international real estate loans.
Risk-weighted assets, actual 2016:Q4 and projected 2019:Q1
Billions of dollars
Item Actual 2016:Q4 Projected 2019:Q1
Risk-weighted assets1 176.1 192.7
1 For each quarter, risk-weighted assets are calculated under the Board's
standardized capital risk-based approach in 12 CFR part 217, subpart D.
Projected losses, revenue, and net income before taxes through 2019:Q1
Item Billions of
dollars Percent of
average assets1
Pre-provision net revenue2 7.9 3.4
Other revenue3 0.0
less
Provisions 8.0
Realized losses/gains on securities (AFS/HTM) 0.0
Trading and counterparty losses4 0.0
Other losses/gains5 0.0
equals
Net income before taxes -0.2 -0.1
Memo items
Other comprehensive income6 0.0
Other effects on capital Actual 2016:Q4 2019:Q1
AOCI included in capital (billions of dollars)7 0.0 0.0
1 Average assets is the nine-quarter average of total assets.2 Pre-provision net revenue includes losses from operational-risk events and
other real estate owned (OREO) costs.3 Other revenue includes one-time income and (expense) items not included in
pre-provision net revenue.4 Trading and counterparty losses include mark-to-market and credit valuation
adjustments (CVA) losses and losses arising from the counterparty default
scenario component applied to derivatives, securities lending, and repurchase
agreement activities.5 Other losses/gains includes projected change in fair value of loans held for sale
and loans held for investment measured under the fair-value option, and
goodwill impairment losses.6 Other comprehensive income (OCI) is only calculated for advanced approaches
BHCs, and other BHCs that opt into the advanced approaches treatment of
AOCI.7 Certain aspects of AOCI are subject to transition arrangements for inclusion in
projected regulatory capital. The transition arrangements are 80 percent
included in projected regulatory capital for 2017 and 100 percent included in
projected regulatory capital starting in 2018. See 12 CFR 217.300(b)(3).
88 Supervisory Stress Test Methodology and Results

Table C.6.B. BB&T Corporation
Projected stressed capital ratios, risk-weighted assets, losses, revenues, net income before taxes, and loan lossesFederal Reserve estimates: Adverse scenario
Capital ratios, actual 2016:Q4 and projected 2017:Q1–2019:Q1
Percent
Regulatory ratio Actual
2016:Q4
Stressed capital ratios1
Ending Minimum
Common equity tier 1 capital ratio 10.2 9.5 9.4
Tier 1 capital ratio 12.0 11.0 11.0
Total capital ratio 14.1 12.8 12.8
Tier 1 leverage ratio 10.0 9.1 9.1
Supplementary leverage ratio n/a
1 The capital ratios are calculated using capital action assumptions provided
within the Dodd-Frank Act stress testing rule. See 12 CFR 252.56(b). These
projections represent hypothetical estimates that involve an economic outcome
that is more adverse than expected. The minimum capital ratios, other than the
supplementary leverage ratio, are for the period 2017:Q1 to 2019:Q1. The
minimum supplementary leverage ratio is for the period 2018:Q1 to 2019:Q1.
Supplementary leverage ratio projections only include estimates for firms
subject to the advanced approaches.
n/a Not applicable.
Projected loan losses, by type of loan, 2017:Q1–2019:Q1
Loan type Billions of
dollars Portfolio loss
rates (percent)1
Loan losses 4.4 2.9
First-lien mortgages, domestic 0.5 1.5
Junior liens and HELOCs, domestic 0.2 2.1
Commercial and industrial2 1.0 3.7
Commercial real estate, domestic 1.2 3.0
Credit cards 0.2 10.0
Other consumer3 0.9 4.3
Other loans4 0.4 2.1
1 Average loan balances used to calculate portfolio loss rates exclude loans held
for sale and loans held for investment under the fair-value option, and are
calculated over nine quarters.2 Commercial and industrial loans include small- and medium-enterprise loans
and corporate cards.3 Other consumer loans include student loans and automobile loans.4 Other loans include international real estate loans.
Risk-weighted assets, actual 2016:Q4 and projected 2019:Q1
Billions of dollars
Item Actual 2016:Q4 Projected 2019:Q1
Risk-weighted assets1 176.1 197.4
1 For each quarter, risk-weighted assets are calculated under the Board's
standardized capital risk-based approach in 12 CFR part 217, subpart D.
Projected losses, revenue, and net income before taxes through 2019:Q1
Item Billions of
dollars Percent of
average assets1
Pre-provision net revenue2 10.0 4.2
Other revenue3 0.0
less
Provisions 4.7
Realized losses/gains on securities (AFS/HTM) 0.0
Trading and counterparty losses4 0.0
Other losses/gains5 0.0
equals
Net income before taxes 5.2 2.2
Memo items
Other comprehensive income6 0.0
Other effects on capital Actual 2016:Q4 2019:Q1
AOCI included in capital (billions of dollars)7 0.0 0.0
1 Average assets is the nine-quarter average of total assets.2 Pre-provision net revenue includes losses from operational-risk events and
other real estate owned (OREO) costs.3 Other revenue includes one-time income and (expense) items not included in
pre-provision net revenue.4 Trading and counterparty losses include mark-to-market and credit valuation
adjustments (CVA) losses and losses arising from the counterparty default
scenario component applied to derivatives, securities lending, and repurchase
agreement activities.5 Other losses/gains includes projected change in fair value of loans held for sale
and loans held for investment measured under the fair-value option, and
goodwill impairment losses.6 Other comprehensive income (OCI) is only calculated for advanced approaches
BHCs, and other BHCs that opt into the advanced approaches treatment of
AOCI.7 Certain aspects of AOCI are subject to transition arrangements for inclusion in
projected regulatory capital. The transition arrangements are 80 percent
included in projected regulatory capital for 2017 and 100 percent included in
projected regulatory capital starting in 2018. See 12 CFR 217.300(b)(3).
June 2017 89

Table C.7.A. BBVA Compass Bancshares, Inc.
Projected stressed capital ratios, risk-weighted assets, losses, revenues, net income before taxes, and loan lossesFederal Reserve estimates: Severely adverse scenario
Capital ratios, actual 2016:Q4 and projected 2017:Q1–2019:Q1
Percent
Regulatory ratio Actual
2016:Q4
Stressed capital ratios1
Ending Minimum
Common equity tier 1 capital ratio 11.5 7.7 7.7
Tier 1 capital ratio 11.9 8.0 8.0
Total capital ratio 14.3 10.5 10.5
Tier 1 leverage ratio 9.5 6.3 6.3
Supplementary leverage ratio n/a
1 The capital ratios are calculated using capital action assumptions provided
within the Dodd-Frank Act stress testing rule. See 12 CFR 252.56(b). These
projections represent hypothetical estimates that involve an economic outcome
that is more adverse than expected. The minimum capital ratios, other than the
supplementary leverage ratio, are for the period 2017:Q1 to 2019:Q1. The
minimum supplementary leverage ratio is for the period 2018:Q1 to 2019:Q1.
Supplementary leverage ratio projections only include estimates for firms
subject to the advanced approaches.
n/a Not applicable.
Projected loan losses, by type of loan, 2017:Q1–2019:Q1
Loan type Billions of
dollars Portfolio loss
rates (percent)1
Loan losses 3.7 5.9
First-lien mortgages, domestic 0.4 2.9
Junior liens and HELOCs, domestic 0.1 4.8
Commercial and industrial2 1.4 7.1
Commercial real estate, domestic 1.1 8.2
Credit cards 0.1 16.9
Other consumer3 0.3 7.0
Other loans4 0.2 2.5
1 Average loan balances used to calculate portfolio loss rates exclude loans held
for sale and loans held for investment under the fair-value option, and are
calculated over nine quarters.2 Commercial and industrial loans include small- and medium-enterprise loans
and corporate cards.3 Other consumer loans include student loans and automobile loans.4 Other loans include international real estate loans.
Risk-weighted assets, actual 2016:Q4 and projected 2019:Q1
Billions of dollars
Item Actual 2016:Q4 Projected 2019:Q1
Risk-weighted assets1 66.7 71.7
1 For each quarter, risk-weighted assets are calculated under the Board's
standardized capital risk-based approach in 12 CFR part 217, subpart D.
Projected losses, revenue, and net income before taxes through 2019:Q1
Item Billions of
dollars Percent of
average assets1
Pre-provision net revenue2 1.6 1.8
Other revenue3 0.0
less
Provisions 4.0
Realized losses/gains on securities (AFS/HTM) 0.0
Trading and counterparty losses4 0.0
Other losses/gains5 0.0
equals
Net income before taxes -2.4 -2.6
Memo items
Other comprehensive income6 0.0
Other effects on capital Actual 2016:Q4 2019:Q1
AOCI included in capital (billions of dollars)7 0.0 0.0
1 Average assets is the nine-quarter average of total assets.2 Pre-provision net revenue includes losses from operational-risk events and
other real estate owned (OREO) costs.3 Other revenue includes one-time income and (expense) items not included in
pre-provision net revenue.4 Trading and counterparty losses include mark-to-market and credit valuation
adjustments (CVA) losses and losses arising from the counterparty default
scenario component applied to derivatives, securities lending, and repurchase
agreement activities.5 Other losses/gains includes projected change in fair value of loans held for sale
and loans held for investment measured under the fair-value option, and
goodwill impairment losses.6 Other comprehensive income (OCI) is only calculated for advanced approaches
BHCs, and other BHCs that opt into the advanced approaches treatment of
AOCI.7 Certain aspects of AOCI are subject to transition arrangements for inclusion in
projected regulatory capital. The transition arrangements are 80 percent
included in projected regulatory capital for 2017 and 100 percent included in
projected regulatory capital starting in 2018. See 12 CFR 217.300(b)(3).
90 Supervisory Stress Test Methodology and Results

Table C.7.B. BBVA Compass Bancshares, Inc.
Projected stressed capital ratios, risk-weighted assets, losses, revenues, net income before taxes, and loan lossesFederal Reserve estimates: Adverse scenario
Capital ratios, actual 2016:Q4 and projected 2017:Q1–2019:Q1
Percent
Regulatory ratio Actual
2016:Q4
Stressed capital ratios1
Ending Minimum
Common equity tier 1 capital ratio 11.5 10.1 10.1
Tier 1 capital ratio 11.9 10.4 10.4
Total capital ratio 14.3 12.7 12.7
Tier 1 leverage ratio 9.5 8.1 8.1
Supplementary leverage ratio n/a
1 The capital ratios are calculated using capital action assumptions provided
within the Dodd-Frank Act stress testing rule. See 12 CFR 252.56(b). These
projections represent hypothetical estimates that involve an economic outcome
that is more adverse than expected. The minimum capital ratios, other than the
supplementary leverage ratio, are for the period 2017:Q1 to 2019:Q1. The
minimum supplementary leverage ratio is for the period 2018:Q1 to 2019:Q1.
Supplementary leverage ratio projections only include estimates for firms
subject to the advanced approaches.
n/a Not applicable.
Projected loan losses, by type of loan, 2017:Q1–2019:Q1
Loan type Billions of
dollars Portfolio loss
rates (percent)1
Loan losses 2.3 3.6
First-lien mortgages, domestic 0.2 1.6
Junior liens and HELOCs, domestic 0.1 3.3
Commercial and industrial2 0.9 4.9
Commercial real estate, domestic 0.6 4.0
Credit cards 0.1 13.4
Other consumer3 0.3 5.4
Other loans4 0.1 1.7
1 Average loan balances used to calculate portfolio loss rates exclude loans held
for sale and loans held for investment under the fair-value option, and are
calculated over nine quarters.2 Commercial and industrial loans include small- and medium-enterprise loans
and corporate cards.3 Other consumer loans include student loans and automobile loans.4 Other loans include international real estate loans.
Risk-weighted assets, actual 2016:Q4 and projected 2019:Q1
Billions of dollars
Item Actual 2016:Q4 Projected 2019:Q1
Risk-weighted assets1 66.7 73.6
1 For each quarter, risk-weighted assets are calculated under the Board's
standardized capital risk-based approach in 12 CFR part 217, subpart D.
Projected losses, revenue, and net income before taxes through 2019:Q1
Item Billions of
dollars Percent of
average assets1
Pre-provision net revenue2 2.3 2.4
Other revenue3 0.0
less
Provisions 2.3
Realized losses/gains on securities (AFS/HTM) 0.0
Trading and counterparty losses4 0.0
Other losses/gains5 0.0
equals
Net income before taxes 0.0 0.0
Memo items
Other comprehensive income6 0.0
Other effects on capital Actual 2016:Q4 2019:Q1
AOCI included in capital (billions of dollars)7 0.0 0.0
1 Average assets is the nine-quarter average of total assets.2 Pre-provision net revenue includes losses from operational-risk events and
other real estate owned (OREO) costs.3 Other revenue includes one-time income and (expense) items not included in
pre-provision net revenue.4 Trading and counterparty losses include mark-to-market and credit valuation
adjustments (CVA) losses and losses arising from the counterparty default
scenario component applied to derivatives, securities lending, and repurchase
agreement activities.5 Other losses/gains includes projected change in fair value of loans held for sale
and loans held for investment measured under the fair-value option, and
goodwill impairment losses.6 Other comprehensive income (OCI) is only calculated for advanced approaches
BHCs, and other BHCs that opt into the advanced approaches treatment of
AOCI.7 Certain aspects of AOCI are subject to transition arrangements for inclusion in
projected regulatory capital. The transition arrangements are 80 percent
included in projected regulatory capital for 2017 and 100 percent included in
projected regulatory capital starting in 2018. See 12 CFR 217.300(b)(3).
June 2017 91

Table C.8.A. BMO Financial Corp.
Projected stressed capital ratios, risk-weighted assets, losses, revenues, net income before taxes, and loan lossesFederal Reserve estimates: Severely adverse scenario
Capital ratios, actual 2016:Q4 and projected 2017:Q1–2019:Q1
Percent
Regulatory ratio Actual
2016:Q4
Stressed capital ratios1
Ending Minimum
Common equity tier 1 capital ratio 12.5 8.0 8.0
Tier 1 capital ratio 12.8 8.7 8.7
Total capital ratio 15.7 11.7 11.7
Tier 1 leverage ratio 9.5 6.4 6.4
Supplementary leverage ratio n/a
1 The capital ratios are calculated using capital action assumptions provided
within the Dodd-Frank Act stress testing rule. See 12 CFR 252.56(b). These
projections represent hypothetical estimates that involve an economic outcome
that is more adverse than expected. The minimum capital ratios, other than the
supplementary leverage ratio, are for the period 2017:Q1 to 2019:Q1. The
minimum supplementary leverage ratio is for the period 2018:Q1 to 2019:Q1.
Supplementary leverage ratio projections only include estimates for firms
subject to the advanced approaches.
n/a Not applicable.
Projected loan losses, by type of loan, 2017:Q1–2019:Q1
Loan type Billions of
dollars Portfolio loss
rates (percent)1
Loan losses 4.0 5.7
First-lien mortgages, domestic 0.2 3.2
Junior liens and HELOCs, domestic 0.4 10.4
Commercial and industrial2 1.7 5.9
Commercial real estate, domestic 0.7 7.9
Credit cards 0.1 11.7
Other consumer3 0.1 2.4
Other loans4 0.7 4.9
1 Average loan balances used to calculate portfolio loss rates exclude loans held
for sale and loans held for investment under the fair-value option, and are
calculated over nine quarters.2 Commercial and industrial loans include small- and medium-enterprise loans
and corporate cards.3 Other consumer loans include student loans and automobile loans.4 Other loans include international real estate loans.
Risk-weighted assets, actual 2016:Q4 and projected 2019:Q1
Billions of dollars
Item Actual 2016:Q4 Projected 2019:Q1
Risk-weighted assets1 93.3 99.7
1 For each quarter, risk-weighted assets are calculated under the Board's
standardized capital risk-based approach in 12 CFR part 217, subpart D.
Projected losses, revenue, and net income before taxes through 2019:Q1
Item Billions of
dollars Percent of
average assets1
Pre-provision net revenue2 1.7 1.3
Other revenue3 0.0
less
Provisions 4.4
Realized losses/gains on securities (AFS/HTM) 0.0
Trading and counterparty losses4 0.0
Other losses/gains5 0.0
equals
Net income before taxes -2.6 -2.0
Memo items
Other comprehensive income6 0.0
Other effects on capital Actual 2016:Q4 2019:Q1
AOCI included in capital (billions of dollars)7 0.0 0.0
1 Average assets is the nine-quarter average of total assets.2 Pre-provision net revenue includes losses from operational-risk events and
other real estate owned (OREO) costs.3 Other revenue includes one-time income and (expense) items not included in
pre-provision net revenue.4 Trading and counterparty losses include mark-to-market and credit valuation
adjustments (CVA) losses and losses arising from the counterparty default
scenario component applied to derivatives, securities lending, and repurchase
agreement activities.5 Other losses/gains includes projected change in fair value of loans held for sale
and loans held for investment measured under the fair-value option, and
goodwill impairment losses.6 Other comprehensive income (OCI) is only calculated for advanced approaches
BHCs, and other BHCs that opt into the advanced approaches treatment of
AOCI.7 Certain aspects of AOCI are subject to transition arrangements for inclusion in
projected regulatory capital. The transition arrangements are 80 percent
included in projected regulatory capital for 2017 and 100 percent included in
projected regulatory capital starting in 2018. See 12 CFR 217.300(b)(3).
92 Supervisory Stress Test Methodology and Results

Table C.8.B. BMO Financial Corp.
Projected stressed capital ratios, risk-weighted assets, losses, revenues, net income before taxes, and loan lossesFederal Reserve estimates: Adverse scenario
Capital ratios, actual 2016:Q4 and projected 2017:Q1–2019:Q1
Percent
Regulatory ratio Actual
2016:Q4
Stressed capital ratios1
Ending Minimum
Common equity tier 1 capital ratio 12.5 10.4 10.4
Tier 1 capital ratio 12.8 11.0 11.0
Total capital ratio 15.7 13.6 13.6
Tier 1 leverage ratio 9.5 8.0 8.0
Supplementary leverage ratio n/a
1 The capital ratios are calculated using capital action assumptions provided
within the Dodd-Frank Act stress testing rule. See 12 CFR 252.56(b). These
projections represent hypothetical estimates that involve an economic outcome
that is more adverse than expected. The minimum capital ratios, other than the
supplementary leverage ratio, are for the period 2017:Q1 to 2019:Q1. The
minimum supplementary leverage ratio is for the period 2018:Q1 to 2019:Q1.
Supplementary leverage ratio projections only include estimates for firms
subject to the advanced approaches.
n/a Not applicable.
Projected loan losses, by type of loan, 2017:Q1–2019:Q1
Loan type Billions of
dollars Portfolio loss
rates (percent)1
Loan losses 2.6 3.7
First-lien mortgages, domestic 0.2 2.1
Junior liens and HELOCs, domestic 0.3 8.6
Commercial and industrial2 1.1 3.9
Commercial real estate, domestic 0.4 3.9
Credit cards 0.0 9.0
Other consumer3 0.1 1.7
Other loans4 0.5 3.1
1 Average loan balances used to calculate portfolio loss rates exclude loans held
for sale and loans held for investment under the fair-value option, and are
calculated over nine quarters.2 Commercial and industrial loans include small- and medium-enterprise loans
and corporate cards.3 Other consumer loans include student loans and automobile loans.4 Other loans include international real estate loans.
Risk-weighted assets, actual 2016:Q4 and projected 2019:Q1
Billions of dollars
Item Actual 2016:Q4 Projected 2019:Q1
Risk-weighted assets1 93.3 103.4
1 For each quarter, risk-weighted assets are calculated under the Board's
standardized capital risk-based approach in 12 CFR part 217, subpart D.
Projected losses, revenue, and net income before taxes through 2019:Q1
Item Billions of
dollars Percent of
average assets1
Pre-provision net revenue2 2.7 1.9
Other revenue3 0.0
less
Provisions 2.7
Realized losses/gains on securities (AFS/HTM) 0.0
Trading and counterparty losses4 0.0
Other losses/gains5 0.0
equals
Net income before taxes -0.1 0.0
Memo items
Other comprehensive income6 0.0
Other effects on capital Actual 2016:Q4 2019:Q1
AOCI included in capital (billions of dollars)7 0.0 0.0
1 Average assets is the nine-quarter average of total assets.2 Pre-provision net revenue includes losses from operational-risk events and
other real estate owned (OREO) costs.3 Other revenue includes one-time income and (expense) items not included in
pre-provision net revenue.4 Trading and counterparty losses include mark-to-market and credit valuation
adjustments (CVA) losses and losses arising from the counterparty default
scenario component applied to derivatives, securities lending, and repurchase
agreement activities.5 Other losses/gains includes projected change in fair value of loans held for sale
and loans held for investment measured under the fair-value option, and
goodwill impairment losses.6 Other comprehensive income (OCI) is only calculated for advanced approaches
BHCs, and other BHCs that opt into the advanced approaches treatment of
AOCI.7 Certain aspects of AOCI are subject to transition arrangements for inclusion in
projected regulatory capital. The transition arrangements are 80 percent
included in projected regulatory capital for 2017 and 100 percent included in
projected regulatory capital starting in 2018. See 12 CFR 217.300(b)(3).
June 2017 93

Table C.9.A. Capital One Financial Corporation
Projected stressed capital ratios, risk-weighted assets, losses, revenues, net income before taxes, and loan lossesFederal Reserve estimates: Severely adverse scenario
Capital ratios, actual 2016:Q4 and projected 2017:Q1–2019:Q1
Percent
Regulatory ratio Actual
2016:Q4
Stressed capital ratios1
Ending Minimum
Common equity tier 1 capital ratio 10.1 7.0 7.0
Tier 1 capital ratio 11.6 8.4 8.4
Total capital ratio 14.3 11.6 10.9
Tier 1 leverage ratio 9.9 7.3 7.3
Supplementary leverage ratio n/a 6.3 6.3
1 The capital ratios are calculated using capital action assumptions provided
within the Dodd-Frank Act stress testing rule. See 12 CFR 252.56(b). These
projections represent hypothetical estimates that involve an economic outcome
that is more adverse than expected. The minimum capital ratios, other than the
supplementary leverage ratio, are for the period 2017:Q1 to 2019:Q1. The
minimum supplementary leverage ratio is for the period 2018:Q1 to 2019:Q1.
Supplementary leverage ratio projections only include estimates for firms
subject to the advanced approaches.
n/a Not applicable.
Projected loan losses, by type of loan, 2017:Q1–2019:Q1
Loan type Billions of
dollars Portfolio loss
rates (percent)1
Loan losses 31.7 12.2
First-lien mortgages, domestic 0.2 1.1
Junior liens and HELOCs, domestic 0.1 7.0
Commercial and industrial2 3.1 10.2
Commercial real estate, domestic 1.6 5.3
Credit cards 21.7 20.3
Other consumer3 4.1 8.1
Other loans4 0.8 4.3
1 Average loan balances used to calculate portfolio loss rates exclude loans held
for sale and loans held for investment under the fair-value option, and are
calculated over nine quarters.2 Commercial and industrial loans include small- and medium-enterprise loans
and corporate cards.3 Other consumer loans include student loans and automobile loans.4 Other loans include international real estate loans.
Risk-weighted assets, actual 2016:Q4 and projected 2019:Q1
Billions of dollars
Item Actual 2016:Q4 Projected 2019:Q1
Risk-weighted assets1 285.8 319.7
1 For each quarter, risk-weighted assets are calculated under the Board's
standardized capital risk-based approach in 12 CFR part 217, subpart D.
Projected losses, revenue, and net income before taxes through 2019:Q1
Item Billions of
dollars Percent of
average assets1
Pre-provision net revenue2 29.6 7.8
Other revenue3 0.0
less
Provisions 35.4
Realized losses/gains on securities (AFS/HTM) 0.0
Trading and counterparty losses4 0.0
Other losses/gains5 0.1
equals
Net income before taxes -5.9 -1.6
Memo items
Other comprehensive income6 -0.3
Other effects on capital Actual 2016:Q4 2019:Q1
AOCI included in capital (billions of dollars)7 -0.6 -1.2
1 Average assets is the nine-quarter average of total assets.2 Pre-provision net revenue includes losses from operational-risk events and
other real estate owned (OREO) costs.3 Other revenue includes one-time income and (expense) items not included in
pre-provision net revenue.4 Trading and counterparty losses include mark-to-market and credit valuation
adjustments (CVA) losses and losses arising from the counterparty default
scenario component applied to derivatives, securities lending, and repurchase
agreement activities.5 Other losses/gains includes projected change in fair value of loans held for sale
and loans held for investment measured under the fair-value option, and
goodwill impairment losses.6 Other comprehensive income (OCI) is only calculated for advanced approaches
BHCs, and other BHCs that opt into the advanced approaches treatment of
AOCI.7 Certain aspects of AOCI are subject to transition arrangements for inclusion in
projected regulatory capital. The transition arrangements are 80 percent
included in projected regulatory capital for 2017 and 100 percent included in
projected regulatory capital starting in 2018. See 12 CFR 217.300(b)(3).
94 Supervisory Stress Test Methodology and Results

Table C.9.B. Capital One Financial Corporation
Projected stressed capital ratios, risk-weighted assets, losses, revenues, net income before taxes, and loan lossesFederal Reserve estimates: Adverse scenario
Capital ratios, actual 2016:Q4 and projected 2017:Q1–2019:Q1
Percent
Regulatory ratio Actual
2016:Q4
Stressed capital ratios1
Ending Minimum
Common equity tier 1 capital ratio 10.1 9.2 8.6
Tier 1 capital ratio 11.6 10.5 10.0
Total capital ratio 14.3 13.6 12.4
Tier 1 leverage ratio 9.9 8.9 8.7
Supplementary leverage ratio n/a 7.7 7.5
1 The capital ratios are calculated using capital action assumptions provided
within the Dodd-Frank Act stress testing rule. See 12 CFR 252.56(b). These
projections represent hypothetical estimates that involve an economic outcome
that is more adverse than expected. The minimum capital ratios, other than the
supplementary leverage ratio, are for the period 2017:Q1 to 2019:Q1. The
minimum supplementary leverage ratio is for the period 2018:Q1 to 2019:Q1.
Supplementary leverage ratio projections only include estimates for firms
subject to the advanced approaches.
n/a Not applicable.
Projected loan losses, by type of loan, 2017:Q1–2019:Q1
Loan type Billions of
dollars Portfolio loss
rates (percent)1
Loan losses 24.3 9.2
First-lien mortgages, domestic 0.2 0.8
Junior liens and HELOCs, domestic 0.1 5.5
Commercial and industrial2 2.2 7.1
Commercial real estate, domestic 0.8 2.4
Credit cards 17.6 16.2
Other consumer3 2.9 5.8
Other loans4 0.5 2.5
1 Average loan balances used to calculate portfolio loss rates exclude loans held
for sale and loans held for investment under the fair-value option, and are
calculated over nine quarters.2 Commercial and industrial loans include small- and medium-enterprise loans
and corporate cards.3 Other consumer loans include student loans and automobile loans.4 Other loans include international real estate loans.
Risk-weighted assets, actual 2016:Q4 and projected 2019:Q1
Billions of dollars
Item Actual 2016:Q4 Projected 2019:Q1
Risk-weighted assets1 285.8 323.8
1 For each quarter, risk-weighted assets are calculated under the Board's
standardized capital risk-based approach in 12 CFR part 217, subpart D.
Projected losses, revenue, and net income before taxes through 2019:Q1
Item Billions of
dollars Percent of
average assets1
Pre-provision net revenue2 32.6 8.5
Other revenue3 0.0
less
Provisions 26.3
Realized losses/gains on securities (AFS/HTM) 0.0
Trading and counterparty losses4 0.0
Other losses/gains5 0.1
equals
Net income before taxes 6.1 1.6
Memo items
Other comprehensive income6 -0.8
Other effects on capital Actual 2016:Q4 2019:Q1
AOCI included in capital (billions of dollars)7 -0.6 -1.7
1 Average assets is the nine-quarter average of total assets.2 Pre-provision net revenue includes losses from operational-risk events and
other real estate owned (OREO) costs.3 Other revenue includes one-time income and (expense) items not included in
pre-provision net revenue.4 Trading and counterparty losses include mark-to-market and credit valuation
adjustments (CVA) losses and losses arising from the counterparty default
scenario component applied to derivatives, securities lending, and repurchase
agreement activities.5 Other losses/gains includes projected change in fair value of loans held for sale
and loans held for investment measured under the fair-value option, and
goodwill impairment losses.6 Other comprehensive income (OCI) is only calculated for advanced approaches
BHCs, and other BHCs that opt into the advanced approaches treatment of
AOCI.7 Certain aspects of AOCI are subject to transition arrangements for inclusion in
projected regulatory capital. The transition arrangements are 80 percent
included in projected regulatory capital for 2017 and 100 percent included in
projected regulatory capital starting in 2018. See 12 CFR 217.300(b)(3).
June 2017 95

Table C.10.A. CIT Group Inc.
Projected stressed capital ratios, risk-weighted assets, losses, revenues, net income before taxes, and loan lossesFederal Reserve estimates: Severely adverse scenario
Capital ratios, actual 2016:Q4 and projected 2017:Q1–2019:Q1
Percent
Regulatory ratio Actual
2016:Q4
Stressed capital ratios1
Ending Minimum
Common equity tier 1 capital ratio 14.0 14.5 12.9
Tier 1 capital ratio 14.0 14.5 12.9
Total capital ratio 14.8 15.8 14.0
Tier 1 leverage ratio 13.9 11.9 11.9
Supplementary leverage ratio n/a
1 The capital ratios are calculated using capital action assumptions provided
within the Dodd-Frank Act stress testing rule. See 12 CFR 252.56(b). These
projections represent hypothetical estimates that involve an economic outcome
that is more adverse than expected. The minimum capital ratios, other than the
supplementary leverage ratio, are for the period 2017:Q1 to 2019:Q1. The
minimum supplementary leverage ratio is for the period 2018:Q1 to 2019:Q1.
Supplementary leverage ratio projections only include estimates for firms
subject to the advanced approaches.
n/a Not applicable.
Projected loan losses, by type of loan, 2017:Q1–2019:Q1
Loan type Billions of
dollars Portfolio loss
rates (percent)1
Loan losses 2.6 8.6
First-lien mortgages, domestic 0.1 1.3
Junior liens and HELOCs, domestic 0.0 2.6
Commercial and industrial2 1.4 10.3
Commercial real estate, domestic 0.7 10.9
Credit cards 0.0 0.0
Other consumer3 0.0 12.9
Other loans4 0.4 11.1
1 Average loan balances used to calculate portfolio loss rates exclude loans held
for sale and loans held for investment under the fair-value option, and are
calculated over nine quarters.2 Commercial and industrial loans include small- and medium-enterprise loans
and corporate cards.3 Other consumer loans include student loans and automobile loans.4 Other loans include international real estate loans.
Risk-weighted assets, actual 2016:Q4 and projected 2019:Q1
Billions of dollars
Item Actual 2016:Q4 Projected 2019:Q1
Risk-weighted assets1 64.6 48.7
1 For each quarter, risk-weighted assets are calculated under the Board's
standardized capital risk-based approach in 12 CFR part 217, subpart D.
Projected losses, revenue, and net income before taxes through 2019:Q1
Item Billions of
dollars Percent of
average assets1
Pre-provision net revenue2 1.6 2.7
Other revenue3 0.0
less
Provisions 3.0
Realized losses/gains on securities (AFS/HTM) 0.0
Trading and counterparty losses4 0.0
Other losses/gains5 0.4
equals
Net income before taxes -1.9 -3.3
Memo items
Other comprehensive income6 0.0
Other effects on capital Actual 2016:Q4 2019:Q1
AOCI included in capital (billions of dollars)7 -0.1 -0.1
1 Average assets is the nine-quarter average of total assets.2 Pre-provision net revenue includes losses from operational-risk events and
other real estate owned (OREO) costs.3 Other revenue includes one-time income and (expense) items not included in
pre-provision net revenue.4 Trading and counterparty losses include mark-to-market and credit valuation
adjustments (CVA) losses and losses arising from the counterparty default
scenario component applied to derivatives, securities lending, and repurchase
agreement activities.5 Other losses/gains includes projected change in fair value of loans held for sale
and loans held for investment measured under the fair-value option, and
goodwill impairment losses.6 Other comprehensive income (OCI) is only calculated for advanced approaches
BHCs, and other BHCs that opt into the advanced approaches treatment of
AOCI.7 Certain aspects of AOCI are subject to transition arrangements for inclusion in
projected regulatory capital. The transition arrangements are 80 percent
included in projected regulatory capital for 2017 and 100 percent included in
projected regulatory capital starting in 2018. See 12 CFR 217.300(b)(3).
96 Supervisory Stress Test Methodology and Results

Table C.10.B. CIT Group Inc.
Projected stressed capital ratios, risk-weighted assets, losses, revenues, net income before taxes, and loan lossesFederal Reserve estimates: Adverse scenario
Capital ratios, actual 2016:Q4 and projected 2017:Q1–2019:Q1
Percent
Regulatory ratio Actual
2016:Q4
Stressed capital ratios1
Ending Minimum
Common equity tier 1 capital ratio 14.0 16.9 13.3
Tier 1 capital ratio 14.0 16.9 13.3
Total capital ratio 14.8 18.1 14.2
Tier 1 leverage ratio 13.9 13.9 13.2
Supplementary leverage ratio n/a
1 The capital ratios are calculated using capital action assumptions provided
within the Dodd-Frank Act stress testing rule. See 12 CFR 252.56(b). These
projections represent hypothetical estimates that involve an economic outcome
that is more adverse than expected. The minimum capital ratios, other than the
supplementary leverage ratio, are for the period 2017:Q1 to 2019:Q1. The
minimum supplementary leverage ratio is for the period 2018:Q1 to 2019:Q1.
Supplementary leverage ratio projections only include estimates for firms
subject to the advanced approaches.
n/a Not applicable.
Projected loan losses, by type of loan, 2017:Q1–2019:Q1
Loan type Billions of
dollars Portfolio loss
rates (percent)1
Loan losses 1.6 5.2
First-lien mortgages, domestic 0.0 0.6
Junior liens and HELOCs, domestic 0.0 1.9
Commercial and industrial2 1.0 7.0
Commercial real estate, domestic 0.3 5.0
Credit cards 0.0 0.0
Other consumer3 0.0 10.2
Other loans4 0.3 7.4
1 Average loan balances used to calculate portfolio loss rates exclude loans held
for sale and loans held for investment under the fair-value option, and are
calculated over nine quarters.2 Commercial and industrial loans include small- and medium-enterprise loans
and corporate cards.3 Other consumer loans include student loans and automobile loans.4 Other loans include international real estate loans.
Risk-weighted assets, actual 2016:Q4 and projected 2019:Q1
Billions of dollars
Item Actual 2016:Q4 Projected 2019:Q1
Risk-weighted assets1 64.6 50.7
1 For each quarter, risk-weighted assets are calculated under the Board's
standardized capital risk-based approach in 12 CFR part 217, subpart D.
Projected losses, revenue, and net income before taxes through 2019:Q1
Item Billions of
dollars Percent of
average assets1
Pre-provision net revenue2 1.9 3.2
Other revenue3 0.0
less
Provisions 1.8
Realized losses/gains on securities (AFS/HTM) 0.0
Trading and counterparty losses4 0.0
Other losses/gains5 0.4
equals
Net income before taxes -0.4 -0.6
Memo items
Other comprehensive income6 0.0
Other effects on capital Actual 2016:Q4 2019:Q1
AOCI included in capital (billions of dollars)7 -0.1 -0.1
1 Average assets is the nine-quarter average of total assets.2 Pre-provision net revenue includes losses from operational-risk events and
other real estate owned (OREO) costs.3 Other revenue includes one-time income and (expense) items not included in
pre-provision net revenue.4 Trading and counterparty losses include mark-to-market and credit valuation
adjustments (CVA) losses and losses arising from the counterparty default
scenario component applied to derivatives, securities lending, and repurchase
agreement activities.5 Other losses/gains includes projected change in fair value of loans held for sale
and loans held for investment measured under the fair-value option, and
goodwill impairment losses.6 Other comprehensive income (OCI) is only calculated for advanced approaches
BHCs, and other BHCs that opt into the advanced approaches treatment of
AOCI.7 Certain aspects of AOCI are subject to transition arrangements for inclusion in
projected regulatory capital. The transition arrangements are 80 percent
included in projected regulatory capital for 2017 and 100 percent included in
projected regulatory capital starting in 2018. See 12 CFR 217.300(b)(3).
June 2017 97

Table C.11.A. Citigroup Inc.
Projected stressed capital ratios, risk-weighted assets, losses, revenues, net income before taxes, and loan lossesFederal Reserve estimates: Severely adverse scenario
Capital ratios, actual 2016:Q4 and projected 2017:Q1–2019:Q1
Percent
Regulatory ratio Actual
2016:Q4
Stressed capital ratios1
Ending Minimum
Common equity tier 1 capital ratio 14.9 10.8 9.7
Tier 1 capital ratio 15.8 12.3 11.3
Total capital ratio 19.1 15.4 14.5
Tier 1 leverage ratio 10.1 7.8 7.3
Supplementary leverage ratio n/a 5.9 5.5
1 The capital ratios are calculated using capital action assumptions provided
within the Dodd-Frank Act stress testing rule. See 12 CFR 252.56(b). These
projections represent hypothetical estimates that involve an economic outcome
that is more adverse than expected. The minimum capital ratios, other than the
supplementary leverage ratio, are for the period 2017:Q1 to 2019:Q1. The
minimum supplementary leverage ratio is for the period 2018:Q1 to 2019:Q1.
Supplementary leverage ratio projections only include estimates for firms
subject to the advanced approaches.
n/a Not applicable.
Projected loan losses, by type of loan, 2017:Q1–2019:Q1
Loan type Billions of
dollars Portfolio loss
rates (percent)1
Loan losses 44.5 6.8
First-lien mortgages, domestic 2.1 2.6
Junior liens and HELOCs, domestic 1.4 6.9
Commercial and industrial2 8.1 5.1
Commercial real estate, domestic 1.3 7.8
Credit cards 21.4 13.7
Other consumer3 3.5 12.1
Other loans4 6.8 3.5
1 Average loan balances used to calculate portfolio loss rates exclude loans held
for sale and loans held for investment under the fair-value option, and are
calculated over nine quarters.2 Commercial and industrial loans include small- and medium-enterprise loans
and corporate cards.3 Other consumer loans include student loans and automobile loans.4 Other loans include international real estate loans.
Risk-weighted assets, actual 2016:Q4 and projected 2019:Q1
Billions of dollars
Item Actual 2016:Q4 Projected 2019:Q1
Risk-weighted assets1 1,126.3 1,220.3
1 For each quarter, risk-weighted assets are calculated under the Board's
standardized capital risk-based approach in 12 CFR part 217, subpart D.
Projected losses, revenue, and net income before taxes through 2019:Q1
Item Billions of
dollars Percent of
average assets1
Pre-provision net revenue2 49.0 2.6
Other revenue3 0.1
less
Provisions 47.6
Realized losses/gains on securities (AFS/HTM) 1.1
Trading and counterparty losses4 8.3
Other losses/gains5 2.1
equals
Net income before taxes -9.9 -0.5
Memo items
Other comprehensive income6 0.8
Other effects on capital Actual 2016:Q4 2019:Q1
AOCI included in capital (billions of dollars)7 -29.4 -31.1
1 Average assets is the nine-quarter average of total assets.2 Pre-provision net revenue includes losses from operational-risk events and
other real estate owned (OREO) costs.3 Other revenue includes one-time income and (expense) items not included in
pre-provision net revenue.4 Trading and counterparty losses include mark-to-market and credit valuation
adjustments (CVA) losses and losses arising from the counterparty default
scenario component applied to derivatives, securities lending, and repurchase
agreement activities.5 Other losses/gains includes projected change in fair value of loans held for sale
and loans held for investment measured under the fair-value option, and
goodwill impairment losses.6 Other comprehensive income (OCI) is only calculated for advanced approaches
BHCs, and other BHCs that opt into the advanced approaches treatment of
AOCI.7 Certain aspects of AOCI are subject to transition arrangements for inclusion in
projected regulatory capital. The transition arrangements are 80 percent
included in projected regulatory capital for 2017 and 100 percent included in
projected regulatory capital starting in 2018. See 12 CFR 217.300(b)(3).
98 Supervisory Stress Test Methodology and Results

Table C.11.B. Citigroup Inc.
Projected stressed capital ratios, risk-weighted assets, losses, revenues, net income before taxes, and loan lossesFederal Reserve estimates: Adverse scenario
Capital ratios, actual 2016:Q4 and projected 2017:Q1–2019:Q1
Percent
Regulatory ratio Actual
2016:Q4
Stressed capital ratios1
Ending Minimum
Common equity tier 1 capital ratio 14.9 12.6 11.4
Tier 1 capital ratio 15.8 14.1 13.0
Total capital ratio 19.1 16.9 16.1
Tier 1 leverage ratio 10.1 9.0 8.3
Supplementary leverage ratio n/a 6.7 6.3
1 The capital ratios are calculated using capital action assumptions provided
within the Dodd-Frank Act stress testing rule. See 12 CFR 252.56(b). These
projections represent hypothetical estimates that involve an economic outcome
that is more adverse than expected. The minimum capital ratios, other than the
supplementary leverage ratio, are for the period 2017:Q1 to 2019:Q1. The
minimum supplementary leverage ratio is for the period 2018:Q1 to 2019:Q1.
Supplementary leverage ratio projections only include estimates for firms
subject to the advanced approaches.
n/a Not applicable.
Projected loan losses, by type of loan, 2017:Q1–2019:Q1
Loan type Billions of
dollars Portfolio loss
rates (percent)1
Loan losses 32.7 4.9
First-lien mortgages, domestic 1.1 1.3
Junior liens and HELOCs, domestic 0.8 3.8
Commercial and industrial2 5.9 3.7
Commercial real estate, domestic 0.6 3.5
Credit cards 17.0 10.8
Other consumer3 2.9 9.9
Other loans4 4.4 2.2
1 Average loan balances used to calculate portfolio loss rates exclude loans held
for sale and loans held for investment under the fair-value option, and are
calculated over nine quarters.2 Commercial and industrial loans include small- and medium-enterprise loans
and corporate cards.3 Other consumer loans include student loans and automobile loans.4 Other loans include international real estate loans.
Risk-weighted assets, actual 2016:Q4 and projected 2019:Q1
Billions of dollars
Item Actual 2016:Q4 Projected 2019:Q1
Risk-weighted assets1 1,126.3 1,263.8
1 For each quarter, risk-weighted assets are calculated under the Board's
standardized capital risk-based approach in 12 CFR part 217, subpart D.
Projected losses, revenue, and net income before taxes through 2019:Q1
Item Billions of
dollars Percent of
average assets1
Pre-provision net revenue2 63.3 3.3
Other revenue3 0.1
less
Provisions 32.5
Realized losses/gains on securities (AFS/HTM) 0.6
Trading and counterparty losses4 5.6
Other losses/gains5 1.9
equals
Net income before taxes 22.8 1.2
Memo items
Other comprehensive income6 -2.8
Other effects on capital Actual 2016:Q4 2019:Q1
AOCI included in capital (billions of dollars)7 -29.4 -34.6
1 Average assets is the nine-quarter average of total assets.2 Pre-provision net revenue includes losses from operational-risk events and
other real estate owned (OREO) costs.3 Other revenue includes one-time income and (expense) items not included in
pre-provision net revenue.4 Trading and counterparty losses include mark-to-market and credit valuation
adjustments (CVA) losses and losses arising from the counterparty default
scenario component applied to derivatives, securities lending, and repurchase
agreement activities.5 Other losses/gains includes projected change in fair value of loans held for sale
and loans held for investment measured under the fair-value option, and
goodwill impairment losses.6 Other comprehensive income (OCI) is only calculated for advanced approaches
BHCs, and other BHCs that opt into the advanced approaches treatment of
AOCI.7 Certain aspects of AOCI are subject to transition arrangements for inclusion in
projected regulatory capital. The transition arrangements are 80 percent
included in projected regulatory capital for 2017 and 100 percent included in
projected regulatory capital starting in 2018. See 12 CFR 217.300(b)(3).
June 2017 99

Table C.12.A. Citizens Financial Group, Inc.
Projected stressed capital ratios, risk-weighted assets, losses, revenues, net income before taxes, and loan lossesFederal Reserve estimates: Severely adverse scenario
Capital ratios, actual 2016:Q4 and projected 2017:Q1–2019:Q1
Percent
Regulatory ratio Actual
2016:Q4
Stressed capital ratios1
Ending Minimum
Common equity tier 1 capital ratio 11.2 7.7 7.7
Tier 1 capital ratio 11.4 7.8 7.8
Total capital ratio 14.0 10.4 10.4
Tier 1 leverage ratio 9.9 6.8 6.8
Supplementary leverage ratio n/a
1 The capital ratios are calculated using capital action assumptions provided
within the Dodd-Frank Act stress testing rule. See 12 CFR 252.56(b). These
projections represent hypothetical estimates that involve an economic outcome
that is more adverse than expected. The minimum capital ratios, other than the
supplementary leverage ratio, are for the period 2017:Q1 to 2019:Q1. The
minimum supplementary leverage ratio is for the period 2018:Q1 to 2019:Q1.
Supplementary leverage ratio projections only include estimates for firms
subject to the advanced approaches.
n/a Not applicable.
Projected loan losses, by type of loan, 2017:Q1–2019:Q1
Loan type Billions of
dollars Portfolio loss
rates (percent)1
Loan losses 5.4 4.8
First-lien mortgages, domestic 0.2 1.2
Junior liens and HELOCs, domestic 0.7 4.5
Commercial and industrial2 1.8 5.5
Commercial real estate, domestic 1.1 7.9
Credit cards 0.2 11.9
Other consumer3 1.1 4.9
Other loans4 0.3 3.3
1 Average loan balances used to calculate portfolio loss rates exclude loans held
for sale and loans held for investment under the fair-value option, and are
calculated over nine quarters.2 Commercial and industrial loans include small- and medium-enterprise loans
and corporate cards.3 Other consumer loans include student loans and automobile loans.4 Other loans include international real estate loans.
Risk-weighted assets, actual 2016:Q4 and projected 2019:Q1
Billions of dollars
Item Actual 2016:Q4 Projected 2019:Q1
Risk-weighted assets1 123.9 133.5
1 For each quarter, risk-weighted assets are calculated under the Board's
standardized capital risk-based approach in 12 CFR part 217, subpart D.
Projected losses, revenue, and net income before taxes through 2019:Q1
Item Billions of
dollars Percent of
average assets1
Pre-provision net revenue2 3.2 2.0
Other revenue3 0.0
less
Provisions 6.2
Realized losses/gains on securities (AFS/HTM) 0.1
Trading and counterparty losses4 0.0
Other losses/gains5 0.0
equals
Net income before taxes -3.1 -2.0
Memo items
Other comprehensive income6 0.0
Other effects on capital Actual 2016:Q4 2019:Q1
AOCI included in capital (billions of dollars)7 0.0 0.0
1 Average assets is the nine-quarter average of total assets.2 Pre-provision net revenue includes losses from operational-risk events and
other real estate owned (OREO) costs.3 Other revenue includes one-time income and (expense) items not included in
pre-provision net revenue.4 Trading and counterparty losses include mark-to-market and credit valuation
adjustments (CVA) losses and losses arising from the counterparty default
scenario component applied to derivatives, securities lending, and repurchase
agreement activities.5 Other losses/gains includes projected change in fair value of loans held for sale
and loans held for investment measured under the fair-value option, and
goodwill impairment losses.6 Other comprehensive income (OCI) is only calculated for advanced approaches
BHCs, and other BHCs that opt into the advanced approaches treatment of
AOCI.7 Certain aspects of AOCI are subject to transition arrangements for inclusion in
projected regulatory capital. The transition arrangements are 80 percent
included in projected regulatory capital for 2017 and 100 percent included in
projected regulatory capital starting in 2018. See 12 CFR 217.300(b)(3).
100 Supervisory Stress Test Methodology and Results

Table C.12.B. Citizens Financial Group, Inc.
Projected stressed capital ratios, risk-weighted assets, losses, revenues, net income before taxes, and loan lossesFederal Reserve estimates: Adverse scenario
Capital ratios, actual 2016:Q4 and projected 2017:Q1–2019:Q1
Percent
Regulatory ratio Actual
2016:Q4
Stressed capital ratios1
Ending Minimum
Common equity tier 1 capital ratio 11.2 9.7 9.7
Tier 1 capital ratio 11.4 9.9 9.9
Total capital ratio 14.0 12.3 12.3
Tier 1 leverage ratio 9.9 8.4 8.4
Supplementary leverage ratio n/a
1 The capital ratios are calculated using capital action assumptions provided
within the Dodd-Frank Act stress testing rule. See 12 CFR 252.56(b). These
projections represent hypothetical estimates that involve an economic outcome
that is more adverse than expected. The minimum capital ratios, other than the
supplementary leverage ratio, are for the period 2017:Q1 to 2019:Q1. The
minimum supplementary leverage ratio is for the period 2018:Q1 to 2019:Q1.
Supplementary leverage ratio projections only include estimates for firms
subject to the advanced approaches.
n/a Not applicable.
Projected loan losses, by type of loan, 2017:Q1–2019:Q1
Loan type Billions of
dollars Portfolio loss
rates (percent)1
Loan losses 3.6 3.1
First-lien mortgages, domestic 0.1 0.6
Junior liens and HELOCs, domestic 0.5 3.2
Commercial and industrial2 1.2 3.5
Commercial real estate, domestic 0.6 3.9
Credit cards 0.1 9.3
Other consumer3 0.9 3.9
Other loans4 0.2 2.0
1 Average loan balances used to calculate portfolio loss rates exclude loans held
for sale and loans held for investment under the fair-value option, and are
calculated over nine quarters.2 Commercial and industrial loans include small- and medium-enterprise loans
and corporate cards.3 Other consumer loans include student loans and automobile loans.4 Other loans include international real estate loans.
Risk-weighted assets, actual 2016:Q4 and projected 2019:Q1
Billions of dollars
Item Actual 2016:Q4 Projected 2019:Q1
Risk-weighted assets1 123.9 137.4
1 For each quarter, risk-weighted assets are calculated under the Board's
standardized capital risk-based approach in 12 CFR part 217, subpart D.
Projected losses, revenue, and net income before taxes through 2019:Q1
Item Billions of
dollars Percent of
average assets1
Pre-provision net revenue2 4.3 2.7
Other revenue3 0.0
less
Provisions 3.9
Realized losses/gains on securities (AFS/HTM) 0.1
Trading and counterparty losses4 0.0
Other losses/gains5 0.0
equals
Net income before taxes 0.3 0.2
Memo items
Other comprehensive income6 0.0
Other effects on capital Actual 2016:Q4 2019:Q1
AOCI included in capital (billions of dollars)7 0.0 0.0
1 Average assets is the nine-quarter average of total assets.2 Pre-provision net revenue includes losses from operational-risk events and
other real estate owned (OREO) costs.3 Other revenue includes one-time income and (expense) items not included in
pre-provision net revenue.4 Trading and counterparty losses include mark-to-market and credit valuation
adjustments (CVA) losses and losses arising from the counterparty default
scenario component applied to derivatives, securities lending, and repurchase
agreement activities.5 Other losses/gains includes projected change in fair value of loans held for sale
and loans held for investment measured under the fair-value option, and
goodwill impairment losses.6 Other comprehensive income (OCI) is only calculated for advanced approaches
BHCs, and other BHCs that opt into the advanced approaches treatment of
AOCI.7 Certain aspects of AOCI are subject to transition arrangements for inclusion in
projected regulatory capital. The transition arrangements are 80 percent
included in projected regulatory capital for 2017 and 100 percent included in
projected regulatory capital starting in 2018. See 12 CFR 217.300(b)(3).
June 2017 101

Table C.13.A. Comerica Incorporated
Projected stressed capital ratios, risk-weighted assets, losses, revenues, net income before taxes, and loan lossesFederal Reserve estimates: Severely adverse scenario
Capital ratios, actual 2016:Q4 and projected 2017:Q1–2019:Q1
Percent
Regulatory ratio Actual
2016:Q4
Stressed capital ratios1
Ending Minimum
Common equity tier 1 capital ratio 11.1 9.4 9.4
Tier 1 capital ratio 11.1 9.4 9.4
Total capital ratio 13.3 11.0 11.0
Tier 1 leverage ratio 10.2 8.5 8.5
Supplementary leverage ratio n/a
1 The capital ratios are calculated using capital action assumptions provided
within the Dodd-Frank Act stress testing rule. See 12 CFR 252.56(b). These
projections represent hypothetical estimates that involve an economic outcome
that is more adverse than expected. The minimum capital ratios, other than the
supplementary leverage ratio, are for the period 2017:Q1 to 2019:Q1. The
minimum supplementary leverage ratio is for the period 2018:Q1 to 2019:Q1.
Supplementary leverage ratio projections only include estimates for firms
subject to the advanced approaches.
n/a Not applicable.
Projected loan losses, by type of loan, 2017:Q1–2019:Q1
Loan type Billions of
dollars Portfolio loss
rates (percent)1
Loan losses 2.2 4.2
First-lien mortgages, domestic 0.0 2.2
Junior liens and HELOCs, domestic 0.1 3.1
Commercial and industrial2 1.0 3.5
Commercial real estate, domestic 0.7 6.0
Credit cards 0.0 0.0
Other consumer3 0.1 8.4
Other loans4 0.3 4.8
1 Average loan balances used to calculate portfolio loss rates exclude loans held
for sale and loans held for investment under the fair-value option, and are
calculated over nine quarters.2 Commercial and industrial loans include small- and medium-enterprise loans
and corporate cards.3 Other consumer loans include student loans and automobile loans.4 Other loans include international real estate loans.
Risk-weighted assets, actual 2016:Q4 and projected 2019:Q1
Billions of dollars
Item Actual 2016:Q4 Projected 2019:Q1
Risk-weighted assets1 68.0 72.9
1 For each quarter, risk-weighted assets are calculated under the Board's
standardized capital risk-based approach in 12 CFR part 217, subpart D.
Projected losses, revenue, and net income before taxes through 2019:Q1
Item Billions of
dollars Percent of
average assets1
Pre-provision net revenue2 1.6 2.1
Other revenue3 0.0
less
Provisions 2.0
Realized losses/gains on securities (AFS/HTM) 0.0
Trading and counterparty losses4 0.0
Other losses/gains5 0.0
equals
Net income before taxes -0.4 -0.5
Memo items
Other comprehensive income6 0.0
Other effects on capital Actual 2016:Q4 2019:Q1
AOCI included in capital (billions of dollars)7 0.0 0.0
1 Average assets is the nine-quarter average of total assets.2 Pre-provision net revenue includes losses from operational-risk events and
other real estate owned (OREO) costs.3 Other revenue includes one-time income and (expense) items not included in
pre-provision net revenue.4 Trading and counterparty losses include mark-to-market and credit valuation
adjustments (CVA) losses and losses arising from the counterparty default
scenario component applied to derivatives, securities lending, and repurchase
agreement activities.5 Other losses/gains includes projected change in fair value of loans held for sale
and loans held for investment measured under the fair-value option, and
goodwill impairment losses.6 Other comprehensive income (OCI) is only calculated for advanced approaches
BHCs, and other BHCs that opt into the advanced approaches treatment of
AOCI.7 Certain aspects of AOCI are subject to transition arrangements for inclusion in
projected regulatory capital. The transition arrangements are 80 percent
included in projected regulatory capital for 2017 and 100 percent included in
projected regulatory capital starting in 2018. See 12 CFR 217.300(b)(3).
102 Supervisory Stress Test Methodology and Results

Table C.13.B. Comerica Incorporated
Projected stressed capital ratios, risk-weighted assets, losses, revenues, net income before taxes, and loan lossesFederal Reserve estimates: Adverse scenario
Capital ratios, actual 2016:Q4 and projected 2017:Q1–2019:Q1
Percent
Regulatory ratio Actual
2016:Q4
Stressed capital ratios1
Ending Minimum
Common equity tier 1 capital ratio 11.1 10.7 10.7
Tier 1 capital ratio 11.1 10.7 10.7
Total capital ratio 13.3 12.1 12.1
Tier 1 leverage ratio 10.2 9.5 9.5
Supplementary leverage ratio n/a
1 The capital ratios are calculated using capital action assumptions provided
within the Dodd-Frank Act stress testing rule. See 12 CFR 252.56(b). These
projections represent hypothetical estimates that involve an economic outcome
that is more adverse than expected. The minimum capital ratios, other than the
supplementary leverage ratio, are for the period 2017:Q1 to 2019:Q1. The
minimum supplementary leverage ratio is for the period 2018:Q1 to 2019:Q1.
Supplementary leverage ratio projections only include estimates for firms
subject to the advanced approaches.
n/a Not applicable.
Projected loan losses, by type of loan, 2017:Q1–2019:Q1
Loan type Billions of
dollars Portfolio loss
rates (percent)1
Loan losses 1.3 2.5
First-lien mortgages, domestic 0.0 1.2
Junior liens and HELOCs, domestic 0.0 1.7
Commercial and industrial2 0.6 2.3
Commercial real estate, domestic 0.3 2.8
Credit cards 0.0 0.0
Other consumer3 0.0 7.1
Other loans4 0.2 2.9
1 Average loan balances used to calculate portfolio loss rates exclude loans held
for sale and loans held for investment under the fair-value option, and are
calculated over nine quarters.2 Commercial and industrial loans include small- and medium-enterprise loans
and corporate cards.3 Other consumer loans include student loans and automobile loans.4 Other loans include international real estate loans.
Risk-weighted assets, actual 2016:Q4 and projected 2019:Q1
Billions of dollars
Item Actual 2016:Q4 Projected 2019:Q1
Risk-weighted assets1 68.0 74.9
1 For each quarter, risk-weighted assets are calculated under the Board's
standardized capital risk-based approach in 12 CFR part 217, subpart D.
Projected losses, revenue, and net income before taxes through 2019:Q1
Item Billions of
dollars Percent of
average assets1
Pre-provision net revenue2 2.2 2.8
Other revenue3 0.0
less
Provisions 0.9
Realized losses/gains on securities (AFS/HTM) 0.0
Trading and counterparty losses4 0.0
Other losses/gains5 0.0
equals
Net income before taxes 1.3 1.6
Memo items
Other comprehensive income6 0.0
Other effects on capital Actual 2016:Q4 2019:Q1
AOCI included in capital (billions of dollars)7 0.0 0.0
1 Average assets is the nine-quarter average of total assets.2 Pre-provision net revenue includes losses from operational-risk events and
other real estate owned (OREO) costs.3 Other revenue includes one-time income and (expense) items not included in
pre-provision net revenue.4 Trading and counterparty losses include mark-to-market and credit valuation
adjustments (CVA) losses and losses arising from the counterparty default
scenario component applied to derivatives, securities lending, and repurchase
agreement activities.5 Other losses/gains includes projected change in fair value of loans held for sale
and loans held for investment measured under the fair-value option, and
goodwill impairment losses.6 Other comprehensive income (OCI) is only calculated for advanced approaches
BHCs, and other BHCs that opt into the advanced approaches treatment of
AOCI.7 Certain aspects of AOCI are subject to transition arrangements for inclusion in
projected regulatory capital. The transition arrangements are 80 percent
included in projected regulatory capital for 2017 and 100 percent included in
projected regulatory capital starting in 2018. See 12 CFR 217.300(b)(3).
June 2017 103

Table C.14.A. Deutsche Bank Trust Corporation
Projected stressed capital ratios, risk-weighted assets, losses, revenues, net income before taxes, and loan lossesFederal Reserve estimates: Severely adverse scenario
Capital ratios, actual 2016:Q4 and projected 2017:Q1–2019:Q1
Percent
Regulatory ratio Actual
2016:Q4
Stressed capital ratios1
Ending Minimum
Common equity tier 1 capital ratio 64.4 60.2 60.2
Tier 1 capital ratio 64.4 60.2 60.2
Total capital ratio 64.7 61.2 61.2
Tier 1 leverage ratio 14.6 13.5 13.5
Supplementary leverage ratio n/a
1 The capital ratios are calculated using capital action assumptions provided
within the Dodd-Frank Act stress testing rule. See 12 CFR 252.56(b). These
projections represent hypothetical estimates that involve an economic outcome
that is more adverse than expected. The minimum capital ratios, other than the
supplementary leverage ratio, are for the period 2017:Q1 to 2019:Q1. The
minimum supplementary leverage ratio is for the period 2018:Q1 to 2019:Q1.
Supplementary leverage ratio projections only include estimates for firms
subject to the advanced approaches.
n/a Not applicable.
Projected loan losses, by type of loan, 2017:Q1–2019:Q1
Loan type Billions of
dollars Portfolio loss
rates (percent)1
Loan losses 0.5 3.7
First-lien mortgages, domestic 0.1 2.2
Junior liens and HELOCs, domestic 0.0 4.7
Commercial and industrial2 0.1 4.9
Commercial real estate, domestic 0.2 7.4
Credit cards 0.0 0.0
Other consumer3 0.0 3.7
Other loans4 0.1 1.8
1 Average loan balances used to calculate portfolio loss rates exclude loans held
for sale and loans held for investment under the fair-value option, and are
calculated over nine quarters.2 Commercial and industrial loans include small- and medium-enterprise loans
and corporate cards.3 Other consumer loans include student loans and automobile loans.4 Other loans include international real estate loans.
Risk-weighted assets, actual 2016:Q4 and projected 2019:Q1
Billions of dollars
Item Actual 2016:Q4 Projected 2019:Q1
Risk-weighted assets1 12.1 13.0
1 For each quarter, risk-weighted assets are calculated under the Board's
standardized capital risk-based approach in 12 CFR part 217, subpart D.
Projected losses, revenue, and net income before taxes through 2019:Q1
Item Billions of
dollars Percent of
average assets1
Pre-provision net revenue2 0.7 1.3
Other revenue3 0.0
less
Provisions 0.6
Realized losses/gains on securities (AFS/HTM) 0.0
Trading and counterparty losses4 0.0
Other losses/gains5 0.0
equals
Net income before taxes 0.2 0.3
Memo items
Other comprehensive income6 0.0
Other effects on capital Actual 2016:Q4 2019:Q1
AOCI included in capital (billions of dollars)7 0.0 0.0
1 Average assets is the nine-quarter average of total assets.2 Pre-provision net revenue includes losses from operational-risk events and
other real estate owned (OREO) costs.3 Other revenue includes one-time income and (expense) items not included in
pre-provision net revenue.4 Trading and counterparty losses include mark-to-market and credit valuation
adjustments (CVA) losses and losses arising from the counterparty default
scenario component applied to derivatives, securities lending, and repurchase
agreement activities.5 Other losses/gains includes projected change in fair value of loans held for sale
and loans held for investment measured under the fair-value option, and
goodwill impairment losses.6 Other comprehensive income (OCI) is only calculated for advanced approaches
BHCs, and other BHCs that opt into the advanced approaches treatment of
AOCI.7 Certain aspects of AOCI are subject to transition arrangements for inclusion in
projected regulatory capital. The transition arrangements are 80 percent
included in projected regulatory capital for 2017 and 100 percent included in
projected regulatory capital starting in 2018. See 12 CFR 217.300(b)(3).
104 Supervisory Stress Test Methodology and Results

Table C.14.B. Deutsche Bank Trust Corporation
Projected stressed capital ratios, risk-weighted assets, losses, revenues, net income before taxes, and loan lossesFederal Reserve estimates: Adverse scenario
Capital ratios, actual 2016:Q4 and projected 2017:Q1–2019:Q1
Percent
Regulatory ratio Actual
2016:Q4
Stressed capital ratios1
Ending Minimum
Common equity tier 1 capital ratio 64.4 60.7 60.7
Tier 1 capital ratio 64.4 60.7 60.7
Total capital ratio 64.7 61.3 61.3
Tier 1 leverage ratio 14.6 13.4 13.4
Supplementary leverage ratio n/a
1 The capital ratios are calculated using capital action assumptions provided
within the Dodd-Frank Act stress testing rule. See 12 CFR 252.56(b). These
projections represent hypothetical estimates that involve an economic outcome
that is more adverse than expected. The minimum capital ratios, other than the
supplementary leverage ratio, are for the period 2017:Q1 to 2019:Q1. The
minimum supplementary leverage ratio is for the period 2018:Q1 to 2019:Q1.
Supplementary leverage ratio projections only include estimates for firms
subject to the advanced approaches.
n/a Not applicable.
Projected loan losses, by type of loan, 2017:Q1–2019:Q1
Loan type Billions of
dollars Portfolio loss
rates (percent)1
Loan losses 0.3 2.2
First-lien mortgages, domestic 0.1 1.5
Junior liens and HELOCs, domestic 0.0 3.4
Commercial and industrial2 0.1 3.4
Commercial real estate, domestic 0.1 3.3
Credit cards 0.0 0.0
Other consumer3 0.0 3.0
Other loans4 0.0 1.2
1 Average loan balances used to calculate portfolio loss rates exclude loans held
for sale and loans held for investment under the fair-value option, and are
calculated over nine quarters.2 Commercial and industrial loans include small- and medium-enterprise loans
and corporate cards.3 Other consumer loans include student loans and automobile loans.4 Other loans include international real estate loans.
Risk-weighted assets, actual 2016:Q4 and projected 2019:Q1
Billions of dollars
Item Actual 2016:Q4 Projected 2019:Q1
Risk-weighted assets1 12.1 13.3
1 For each quarter, risk-weighted assets are calculated under the Board's
standardized capital risk-based approach in 12 CFR part 217, subpart D.
Projected losses, revenue, and net income before taxes through 2019:Q1
Item Billions of
dollars Percent of
average assets1
Pre-provision net revenue2 0.9 1.5
Other revenue3 0.0
less
Provisions 0.3
Realized losses/gains on securities (AFS/HTM) 0.0
Trading and counterparty losses4 0.0
Other losses/gains5 0.0
equals
Net income before taxes 0.5 0.9
Memo items
Other comprehensive income6 0.0
Other effects on capital Actual 2016:Q4 2019:Q1
AOCI included in capital (billions of dollars)7 0.0 0.0
1 Average assets is the nine-quarter average of total assets.2 Pre-provision net revenue includes losses from operational-risk events and
other real estate owned (OREO) costs.3 Other revenue includes one-time income and (expense) items not included in
pre-provision net revenue.4 Trading and counterparty losses include mark-to-market and credit valuation
adjustments (CVA) losses and losses arising from the counterparty default
scenario component applied to derivatives, securities lending, and repurchase
agreement activities.5 Other losses/gains includes projected change in fair value of loans held for sale
and loans held for investment measured under the fair-value option, and
goodwill impairment losses.6 Other comprehensive income (OCI) is only calculated for advanced approaches
BHCs, and other BHCs that opt into the advanced approaches treatment of
AOCI.7 Certain aspects of AOCI are subject to transition arrangements for inclusion in
projected regulatory capital. The transition arrangements are 80 percent
included in projected regulatory capital for 2017 and 100 percent included in
projected regulatory capital starting in 2018. See 12 CFR 217.300(b)(3).
June 2017 105
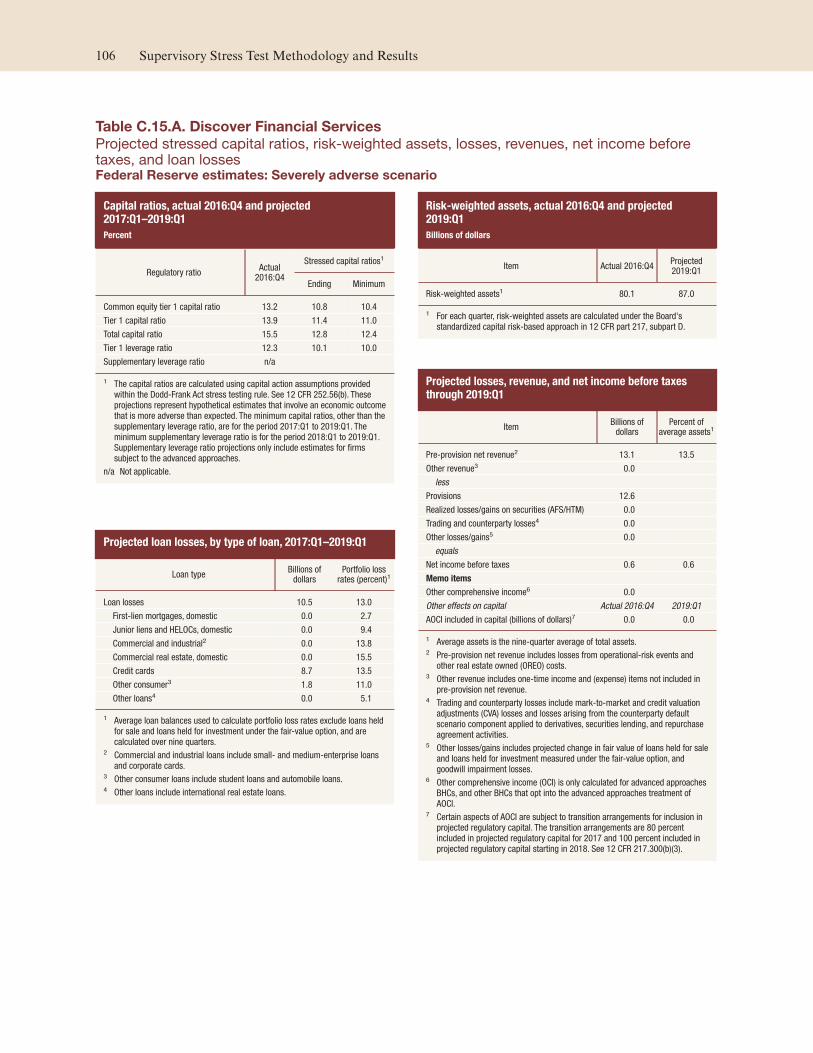
Table C.15.A. Discover Financial Services
Projected stressed capital ratios, risk-weighted assets, losses, revenues, net income before taxes, and loan lossesFederal Reserve estimates: Severely adverse scenario
Capital ratios, actual 2016:Q4 and projected 2017:Q1–2019:Q1
Percent
Regulatory ratio Actual
2016:Q4
Stressed capital ratios1
Ending Minimum
Common equity tier 1 capital ratio 13.2 10.8 10.4
Tier 1 capital ratio 13.9 11.4 11.0
Total capital ratio 15.5 12.8 12.4
Tier 1 leverage ratio 12.3 10.1 10.0
Supplementary leverage ratio n/a
1 The capital ratios are calculated using capital action assumptions provided
within the Dodd-Frank Act stress testing rule. See 12 CFR 252.56(b). These
projections represent hypothetical estimates that involve an economic outcome
that is more adverse than expected. The minimum capital ratios, other than the
supplementary leverage ratio, are for the period 2017:Q1 to 2019:Q1. The
minimum supplementary leverage ratio is for the period 2018:Q1 to 2019:Q1.
Supplementary leverage ratio projections only include estimates for firms
subject to the advanced approaches.
n/a Not applicable.
Projected loan losses, by type of loan, 2017:Q1–2019:Q1
Loan type Billions of
dollars Portfolio loss
rates (percent)1
Loan losses 10.5 13.0
First-lien mortgages, domestic 0.0 2.7
Junior liens and HELOCs, domestic 0.0 9.4
Commercial and industrial2 0.0 13.8
Commercial real estate, domestic 0.0 15.5
Credit cards 8.7 13.5
Other consumer3 1.8 11.0
Other loans4 0.0 5.1
1 Average loan balances used to calculate portfolio loss rates exclude loans held
for sale and loans held for investment under the fair-value option, and are
calculated over nine quarters.2 Commercial and industrial loans include small- and medium-enterprise loans
and corporate cards.3 Other consumer loans include student loans and automobile loans.4 Other loans include international real estate loans.
Risk-weighted assets, actual 2016:Q4 and projected 2019:Q1
Billions of dollars
Item Actual 2016:Q4 Projected 2019:Q1
Risk-weighted assets1 80.1 87.0
1 For each quarter, risk-weighted assets are calculated under the Board's
standardized capital risk-based approach in 12 CFR part 217, subpart D.
Projected losses, revenue, and net income before taxes through 2019:Q1
Item Billions of
dollars Percent of
average assets1
Pre-provision net revenue2 13.1 13.5
Other revenue3 0.0
less
Provisions 12.6
Realized losses/gains on securities (AFS/HTM) 0.0
Trading and counterparty losses4 0.0
Other losses/gains5 0.0
equals
Net income before taxes 0.6 0.6
Memo items
Other comprehensive income6 0.0
Other effects on capital Actual 2016:Q4 2019:Q1
AOCI included in capital (billions of dollars)7 0.0 0.0
1 Average assets is the nine-quarter average of total assets.2 Pre-provision net revenue includes losses from operational-risk events and
other real estate owned (OREO) costs.3 Other revenue includes one-time income and (expense) items not included in
pre-provision net revenue.4 Trading and counterparty losses include mark-to-market and credit valuation
adjustments (CVA) losses and losses arising from the counterparty default
scenario component applied to derivatives, securities lending, and repurchase
agreement activities.5 Other losses/gains includes projected change in fair value of loans held for sale
and loans held for investment measured under the fair-value option, and
goodwill impairment losses.6 Other comprehensive income (OCI) is only calculated for advanced approaches
BHCs, and other BHCs that opt into the advanced approaches treatment of
AOCI.7 Certain aspects of AOCI are subject to transition arrangements for inclusion in
projected regulatory capital. The transition arrangements are 80 percent
included in projected regulatory capital for 2017 and 100 percent included in
projected regulatory capital starting in 2018. See 12 CFR 217.300(b)(3).
106 Supervisory Stress Test Methodology and Results

Table C.15.B. Discover Financial Services
Projected stressed capital ratios, risk-weighted assets, losses, revenues, net income before taxes, and loan lossesFederal Reserve estimates: Adverse scenario
Capital ratios, actual 2016:Q4 and projected 2017:Q1–2019:Q1
Percent
Regulatory ratio Actual
2016:Q4
Stressed capital ratios1
Ending Minimum
Common equity tier 1 capital ratio 13.2 13.0 12.0
Tier 1 capital ratio 13.9 13.6 12.7
Total capital ratio 15.5 15.0 14.2
Tier 1 leverage ratio 12.3 11.8 11.4
Supplementary leverage ratio n/a
1 The capital ratios are calculated using capital action assumptions provided
within the Dodd-Frank Act stress testing rule. See 12 CFR 252.56(b). These
projections represent hypothetical estimates that involve an economic outcome
that is more adverse than expected. The minimum capital ratios, other than the
supplementary leverage ratio, are for the period 2017:Q1 to 2019:Q1. The
minimum supplementary leverage ratio is for the period 2018:Q1 to 2019:Q1.
Supplementary leverage ratio projections only include estimates for firms
subject to the advanced approaches.
n/a Not applicable.
Projected loan losses, by type of loan, 2017:Q1–2019:Q1
Loan type Billions of
dollars Portfolio loss
rates (percent)1
Loan losses 8.3 10.2
First-lien mortgages, domestic 0.0 1.7
Junior liens and HELOCs, domestic 0.0 7.6
Commercial and industrial2 0.0 10.3
Commercial real estate, domestic 0.0 7.0
Credit cards 6.8 10.5
Other consumer3 1.5 9.3
Other loans4 0.0 3.1
1 Average loan balances used to calculate portfolio loss rates exclude loans held
for sale and loans held for investment under the fair-value option, and are
calculated over nine quarters.2 Commercial and industrial loans include small- and medium-enterprise loans
and corporate cards.3 Other consumer loans include student loans and automobile loans.4 Other loans include international real estate loans.
Risk-weighted assets, actual 2016:Q4 and projected 2019:Q1
Billions of dollars
Item Actual 2016:Q4 Projected 2019:Q1
Risk-weighted assets1 80.1 89.0
1 For each quarter, risk-weighted assets are calculated under the Board's
standardized capital risk-based approach in 12 CFR part 217, subpart D.
Projected losses, revenue, and net income before taxes through 2019:Q1
Item Billions of
dollars Percent of
average assets1
Pre-provision net revenue2 13.9 14.0
Other revenue3 0.0
less
Provisions 10.0
Realized losses/gains on securities (AFS/HTM) 0.0
Trading and counterparty losses4 0.0
Other losses/gains5 0.0
equals
Net income before taxes 3.9 3.9
Memo items
Other comprehensive income6 0.0
Other effects on capital Actual 2016:Q4 2019:Q1
AOCI included in capital (billions of dollars)7 0.0 0.0
1 Average assets is the nine-quarter average of total assets.2 Pre-provision net revenue includes losses from operational-risk events and
other real estate owned (OREO) costs.3 Other revenue includes one-time income and (expense) items not included in
pre-provision net revenue.4 Trading and counterparty losses include mark-to-market and credit valuation
adjustments (CVA) losses and losses arising from the counterparty default
scenario component applied to derivatives, securities lending, and repurchase
agreement activities.5 Other losses/gains includes projected change in fair value of loans held for sale
and loans held for investment measured under the fair-value option, and
goodwill impairment losses.6 Other comprehensive income (OCI) is only calculated for advanced approaches
BHCs, and other BHCs that opt into the advanced approaches treatment of
AOCI.7 Certain aspects of AOCI are subject to transition arrangements for inclusion in
projected regulatory capital. The transition arrangements are 80 percent
included in projected regulatory capital for 2017 and 100 percent included in
projected regulatory capital starting in 2018. See 12 CFR 217.300(b)(3).
June 2017 107

Table C.16.A. Fifth Third Bancorp
Projected stressed capital ratios, risk-weighted assets, losses, revenues, net income before taxes, and loan lossesFederal Reserve estimates: Severely adverse scenario
Capital ratios, actual 2016:Q4 and projected 2017:Q1–2019:Q1
Percent
Regulatory ratio Actual
2016:Q4
Stressed capital ratios1
Ending Minimum
Common equity tier 1 capital ratio 10.4 8.0 8.0
Tier 1 capital ratio 11.5 9.0 9.0
Total capital ratio 15.0 12.0 12.0
Tier 1 leverage ratio 9.9 7.7 7.7
Supplementary leverage ratio n/a
1 The capital ratios are calculated using capital action assumptions provided
within the Dodd-Frank Act stress testing rule. See 12 CFR 252.56(b). These
projections represent hypothetical estimates that involve an economic outcome
that is more adverse than expected. The minimum capital ratios, other than the
supplementary leverage ratio, are for the period 2017:Q1 to 2019:Q1. The
minimum supplementary leverage ratio is for the period 2018:Q1 to 2019:Q1.
Supplementary leverage ratio projections only include estimates for firms
subject to the advanced approaches.
n/a Not applicable.
Projected loan losses, by type of loan, 2017:Q1–2019:Q1
Loan type Billions of
dollars Portfolio loss
rates (percent)1
Loan losses 5.4 5.6
First-lien mortgages, domestic 0.5 3.2
Junior liens and HELOCs, domestic 0.4 4.9
Commercial and industrial2 2.0 5.5
Commercial real estate, domestic 1.4 11.8
Credit cards 0.4 16.6
Other consumer3 0.4 3.7
Other loans4 0.4 3.4
1 Average loan balances used to calculate portfolio loss rates exclude loans held
for sale and loans held for investment under the fair-value option, and are
calculated over nine quarters.2 Commercial and industrial loans include small- and medium-enterprise loans
and corporate cards.3 Other consumer loans include student loans and automobile loans.4 Other loans include international real estate loans.
Risk-weighted assets, actual 2016:Q4 and projected 2019:Q1
Billions of dollars
Item Actual 2016:Q4 Projected 2019:Q1
Risk-weighted assets1 119.6 130.2
1 For each quarter, risk-weighted assets are calculated under the Board's
standardized capital risk-based approach in 12 CFR part 217, subpart D.
Projected losses, revenue, and net income before taxes through 2019:Q1
Item Billions of
dollars Percent of
average assets1
Pre-provision net revenue2 4.3 2.9
Other revenue3 0.0
less
Provisions 5.6
Realized losses/gains on securities (AFS/HTM) 0.0
Trading and counterparty losses4 0.0
Other losses/gains5 0.1
equals
Net income before taxes -1.4 -0.9
Memo items
Other comprehensive income6 0.0
Other effects on capital Actual 2016:Q4 2019:Q1
AOCI included in capital (billions of dollars)7 0.0 0.0
1 Average assets is the nine-quarter average of total assets.2 Pre-provision net revenue includes losses from operational-risk events and
other real estate owned (OREO) costs.3 Other revenue includes one-time income and (expense) items not included in
pre-provision net revenue.4 Trading and counterparty losses include mark-to-market and credit valuation
adjustments (CVA) losses and losses arising from the counterparty default
scenario component applied to derivatives, securities lending, and repurchase
agreement activities.5 Other losses/gains includes projected change in fair value of loans held for sale
and loans held for investment measured under the fair-value option, and
goodwill impairment losses.6 Other comprehensive income (OCI) is only calculated for advanced approaches
BHCs, and other BHCs that opt into the advanced approaches treatment of
AOCI.7 Certain aspects of AOCI are subject to transition arrangements for inclusion in
projected regulatory capital. The transition arrangements are 80 percent
included in projected regulatory capital for 2017 and 100 percent included in
projected regulatory capital starting in 2018. See 12 CFR 217.300(b)(3).
108 Supervisory Stress Test Methodology and Results

Table C.16.B. Fifth Third Bancorp
Projected stressed capital ratios, risk-weighted assets, losses, revenues, net income before taxes, and loan lossesFederal Reserve estimates: Adverse scenario
Capital ratios, actual 2016:Q4 and projected 2017:Q1–2019:Q1
Percent
Regulatory ratio Actual
2016:Q4
Stressed capital ratios1
Ending Minimum
Common equity tier 1 capital ratio 10.4 9.9 9.8
Tier 1 capital ratio 11.5 10.8 10.8
Total capital ratio 15.0 13.4 13.4
Tier 1 leverage ratio 9.9 9.2 9.2
Supplementary leverage ratio n/a
1 The capital ratios are calculated using capital action assumptions provided
within the Dodd-Frank Act stress testing rule. See 12 CFR 252.56(b). These
projections represent hypothetical estimates that involve an economic outcome
that is more adverse than expected. The minimum capital ratios, other than the
supplementary leverage ratio, are for the period 2017:Q1 to 2019:Q1. The
minimum supplementary leverage ratio is for the period 2018:Q1 to 2019:Q1.
Supplementary leverage ratio projections only include estimates for firms
subject to the advanced approaches.
n/a Not applicable.
Projected loan losses, by type of loan, 2017:Q1–2019:Q1
Loan type Billions of
dollars Portfolio loss
rates (percent)1
Loan losses 3.4 3.5
First-lien mortgages, domestic 0.4 2.3
Junior liens and HELOCs, domestic 0.3 3.7
Commercial and industrial2 1.3 3.5
Commercial real estate, domestic 0.7 5.6
Credit cards 0.3 12.2
Other consumer3 0.3 2.7
Other loans4 0.2 2.1
1 Average loan balances used to calculate portfolio loss rates exclude loans held
for sale and loans held for investment under the fair-value option, and are
calculated over nine quarters.2 Commercial and industrial loans include small- and medium-enterprise loans
and corporate cards.3 Other consumer loans include student loans and automobile loans.4 Other loans include international real estate loans.
Risk-weighted assets, actual 2016:Q4 and projected 2019:Q1
Billions of dollars
Item Actual 2016:Q4 Projected 2019:Q1
Risk-weighted assets1 119.6 133.5
1 For each quarter, risk-weighted assets are calculated under the Board's
standardized capital risk-based approach in 12 CFR part 217, subpart D.
Projected losses, revenue, and net income before taxes through 2019:Q1
Item Billions of
dollars Percent of
average assets1
Pre-provision net revenue2 5.8 3.8
Other revenue3 0.0
less
Provisions 3.2
Realized losses/gains on securities (AFS/HTM) 0.0
Trading and counterparty losses4 0.0
Other losses/gains5 0.1
equals
Net income before taxes 2.5 1.7
Memo items
Other comprehensive income6 0.0
Other effects on capital Actual 2016:Q4 2019:Q1
AOCI included in capital (billions of dollars)7 0.0 0.0
1 Average assets is the nine-quarter average of total assets.2 Pre-provision net revenue includes losses from operational-risk events and
other real estate owned (OREO) costs.3 Other revenue includes one-time income and (expense) items not included in
pre-provision net revenue.4 Trading and counterparty losses include mark-to-market and credit valuation
adjustments (CVA) losses and losses arising from the counterparty default
scenario component applied to derivatives, securities lending, and repurchase
agreement activities.5 Other losses/gains includes projected change in fair value of loans held for sale
and loans held for investment measured under the fair-value option, and
goodwill impairment losses.6 Other comprehensive income (OCI) is only calculated for advanced approaches
BHCs, and other BHCs that opt into the advanced approaches treatment of
AOCI.7 Certain aspects of AOCI are subject to transition arrangements for inclusion in
projected regulatory capital. The transition arrangements are 80 percent
included in projected regulatory capital for 2017 and 100 percent included in
projected regulatory capital starting in 2018. See 12 CFR 217.300(b)(3).
June 2017 109

Table C.17.A. The Goldman Sachs Group, Inc.
Projected stressed capital ratios, risk-weighted assets, losses, revenues, net income before taxes, and loan lossesFederal Reserve estimates: Severely adverse scenario
Capital ratios, actual 2016:Q4 and projected 2017:Q1–2019:Q1
Percent
Regulatory ratio Actual
2016:Q4
Stressed capital ratios1
Ending Minimum
Common equity tier 1 capital ratio 14.5 9.4 8.4
Tier 1 capital ratio 16.6 11.4 10.2
Total capital ratio 19.8 14.3 13.3
Tier 1 leverage ratio 9.4 6.3 5.9
Supplementary leverage ratio n/a 4.3 4.1
1 The capital ratios are calculated using capital action assumptions provided
within the Dodd-Frank Act stress testing rule. See 12 CFR 252.56(b). These
projections represent hypothetical estimates that involve an economic outcome
that is more adverse than expected. The minimum capital ratios, other than the
supplementary leverage ratio, are for the period 2017:Q1 to 2019:Q1. The
minimum supplementary leverage ratio is for the period 2018:Q1 to 2019:Q1.
Supplementary leverage ratio projections only include estimates for firms
subject to the advanced approaches.
n/a Not applicable.
Projected loan losses, by type of loan, 2017:Q1–2019:Q1
Loan type Billions of
dollars Portfolio loss
rates (percent)1
Loan losses 6.2 8.1
First-lien mortgages, domestic 1.3 52.3
Junior liens and HELOCs, domestic 0.0 4.5
Commercial and industrial2 2.1 11.1
Commercial real estate, domestic 0.3 8.9
Credit cards 0.0 0.0
Other consumer3 0.1 5.5
Other loans4 2.3 4.7
1 Average loan balances used to calculate portfolio loss rates exclude loans held
for sale and loans held for investment under the fair-value option, and are
calculated over nine quarters.2 Commercial and industrial loans include small- and medium-enterprise loans
and corporate cards.3 Other consumer loans include student loans and automobile loans.4 Other loans include international real estate loans.
Risk-weighted assets, actual 2016:Q4 and projected 2019:Q1
Billions of dollars
Item Actual 2016:Q4 Projected 2019:Q1
Risk-weighted assets1 496.7 523.5
1 For each quarter, risk-weighted assets are calculated under the Board's
standardized capital risk-based approach in 12 CFR part 217, subpart D.
Projected losses, revenue, and net income before taxes through 2019:Q1
Item Billions of
dollars Percent of
average assets1
Pre-provision net revenue2 6.0 0.7
Other revenue3 0.0
less
Provisions 6.8
Realized losses/gains on securities (AFS/HTM) 0.0
Trading and counterparty losses4 18.4
Other losses/gains5 3.7
equals
Net income before taxes -22.8 -2.5
Memo items
Other comprehensive income6 0.0
Other effects on capital Actual 2016:Q4 2019:Q1
AOCI included in capital (billions of dollars)7 -1.1 -1.2
1 Average assets is the nine-quarter average of total assets.2 Pre-provision net revenue includes losses from operational-risk events and
other real estate owned (OREO) costs.3 Other revenue includes one-time income and (expense) items not included in
pre-provision net revenue.4 Trading and counterparty losses include mark-to-market and credit valuation
adjustments (CVA) losses and losses arising from the counterparty default
scenario component applied to derivatives, securities lending, and repurchase
agreement activities.5 Other losses/gains includes projected change in fair value of loans held for sale
and loans held for investment measured under the fair-value option, and
goodwill impairment losses.6 Other comprehensive income (OCI) is only calculated for advanced approaches
BHCs, and other BHCs that opt into the advanced approaches treatment of
AOCI.7 Certain aspects of AOCI are subject to transition arrangements for inclusion in
projected regulatory capital. The transition arrangements are 80 percent
included in projected regulatory capital for 2017 and 100 percent included in
projected regulatory capital starting in 2018. See 12 CFR 217.300(b)(3).
110 Supervisory Stress Test Methodology and Results

Table C.17.B. The Goldman Sachs Group, Inc.
Projected stressed capital ratios, risk-weighted assets, losses, revenues, net income before taxes, and loan lossesFederal Reserve estimates: Adverse scenario
Capital ratios, actual 2016:Q4 and projected 2017:Q1–2019:Q1
Percent
Regulatory ratio Actual
2016:Q4
Stressed capital ratios1
Ending Minimum
Common equity tier 1 capital ratio 14.5 11.5 11.4
Tier 1 capital ratio 16.6 13.4 13.3
Total capital ratio 19.8 16.2 16.1
Tier 1 leverage ratio 9.4 7.4 7.4
Supplementary leverage ratio n/a 5.1 5.1
1 The capital ratios are calculated using capital action assumptions provided
within the Dodd-Frank Act stress testing rule. See 12 CFR 252.56(b). These
projections represent hypothetical estimates that involve an economic outcome
that is more adverse than expected. The minimum capital ratios, other than the
supplementary leverage ratio, are for the period 2017:Q1 to 2019:Q1. The
minimum supplementary leverage ratio is for the period 2018:Q1 to 2019:Q1.
Supplementary leverage ratio projections only include estimates for firms
subject to the advanced approaches.
n/a Not applicable.
Projected loan losses, by type of loan, 2017:Q1–2019:Q1
Loan type Billions of
dollars Portfolio loss
rates (percent)1
Loan losses 4.4 5.7
First-lien mortgages, domestic 1.3 49.8
Junior liens and HELOCs, domestic 0.0 3.2
Commercial and industrial2 1.3 7.0
Commercial real estate, domestic 0.2 4.0
Credit cards 0.0 0.0
Other consumer3 0.1 4.4
Other loans4 1.6 3.1
1 Average loan balances used to calculate portfolio loss rates exclude loans held
for sale and loans held for investment under the fair-value option, and are
calculated over nine quarters.2 Commercial and industrial loans include small- and medium-enterprise loans
and corporate cards.3 Other consumer loans include student loans and automobile loans.4 Other loans include international real estate loans.
Risk-weighted assets, actual 2016:Q4 and projected 2019:Q1
Billions of dollars
Item Actual 2016:Q4 Projected 2019:Q1
Risk-weighted assets1 496.7 546.1
1 For each quarter, risk-weighted assets are calculated under the Board's
standardized capital risk-based approach in 12 CFR part 217, subpart D.
Projected losses, revenue, and net income before taxes through 2019:Q1
Item Billions of
dollars Percent of
average assets1
Pre-provision net revenue2 10.1 1.1
Other revenue3 0.0
less
Provisions 4.7
Realized losses/gains on securities (AFS/HTM) 0.0
Trading and counterparty losses4 9.7
Other losses/gains5 2.7
equals
Net income before taxes -7.1 -0.8
Memo items
Other comprehensive income6 0.0
Other effects on capital Actual 2016:Q4 2019:Q1
AOCI included in capital (billions of dollars)7 -1.1 -1.2
1 Average assets is the nine-quarter average of total assets.2 Pre-provision net revenue includes losses from operational-risk events and
other real estate owned (OREO) costs.3 Other revenue includes one-time income and (expense) items not included in
pre-provision net revenue.4 Trading and counterparty losses include mark-to-market and credit valuation
adjustments (CVA) losses and losses arising from the counterparty default
scenario component applied to derivatives, securities lending, and repurchase
agreement activities.5 Other losses/gains includes projected change in fair value of loans held for sale
and loans held for investment measured under the fair-value option, and
goodwill impairment losses.6 Other comprehensive income (OCI) is only calculated for advanced approaches
BHCs, and other BHCs that opt into the advanced approaches treatment of
AOCI.7 Certain aspects of AOCI are subject to transition arrangements for inclusion in
projected regulatory capital. The transition arrangements are 80 percent
included in projected regulatory capital for 2017 and 100 percent included in
projected regulatory capital starting in 2018. See 12 CFR 217.300(b)(3).
June 2017 111

Table C.18.A. HSBC North America Holdings Inc.
Projected stressed capital ratios, risk-weighted assets, losses, revenues, net income before taxes, and loan lossesFederal Reserve estimates: Severely adverse scenario
Capital ratios, actual 2016:Q4 and projected 2017:Q1–2019:Q1
Percent
Regulatory ratio Actual
2016:Q4
Stressed capital ratios1
Ending Minimum
Common equity tier 1 capital ratio 17.9 12.9 12.9
Tier 1 capital ratio 20.1 15.6 15.6
Total capital ratio 25.3 19.3 19.3
Tier 1 leverage ratio 9.6 7.1 7.1
Supplementary leverage ratio n/a 5.4 5.4
1 The capital ratios are calculated using capital action assumptions provided
within the Dodd-Frank Act stress testing rule. See 12 CFR 252.56(b). These
projections represent hypothetical estimates that involve an economic outcome
that is more adverse than expected. The minimum capital ratios, other than the
supplementary leverage ratio, are for the period 2017:Q1 to 2019:Q1. The
minimum supplementary leverage ratio is for the period 2018:Q1 to 2019:Q1.
Supplementary leverage ratio projections only include estimates for firms
subject to the advanced approaches.
n/a Not applicable.
Projected loan losses, by type of loan, 2017:Q1–2019:Q1
Loan type Billions of
dollars Portfolio loss
rates (percent)1
Loan losses 3.9 5.3
First-lien mortgages, domestic 0.3 1.5
Junior liens and HELOCs, domestic 0.1 3.7
Commercial and industrial2 2.4 7.6
Commercial real estate, domestic 0.7 5.9
Credit cards 0.1 13.5
Other consumer3 0.0 7.0
Other loans4 0.4 3.9
1 Average loan balances used to calculate portfolio loss rates exclude loans held
for sale and loans held for investment under the fair-value option, and are
calculated over nine quarters.2 Commercial and industrial loans include small- and medium-enterprise loans
and corporate cards.3 Other consumer loans include student loans and automobile loans.4 Other loans include international real estate loans.
Risk-weighted assets, actual 2016:Q4 and projected 2019:Q1
Billions of dollars
Item Actual 2016:Q4 Projected 2019:Q1
Risk-weighted assets1 139.9 143.0
1 For each quarter, risk-weighted assets are calculated under the Board's
standardized capital risk-based approach in 12 CFR part 217, subpart D.
Projected losses, revenue, and net income before taxes through 2019:Q1
Item Billions of
dollars Percent of
average assets1
Pre-provision net revenue2 -1.4 -0.5
Other revenue3 0.8
less
Provisions 4.0
Realized losses/gains on securities (AFS/HTM) 0.0
Trading and counterparty losses4 0.0
Other losses/gains5 0.6
equals
Net income before taxes -5.2 -1.8
Memo items
Other comprehensive income6 1.8
Other effects on capital Actual 2016:Q4 2019:Q1
AOCI included in capital (billions of dollars)7 -0.7 0.7
1 Average assets is the nine-quarter average of total assets.2 Pre-provision net revenue includes losses from operational-risk events and
other real estate owned (OREO) costs.3 Other revenue includes one-time income and (expense) items not included in
pre-provision net revenue.4 Trading and counterparty losses include mark-to-market and credit valuation
adjustments (CVA) losses and losses arising from the counterparty default
scenario component applied to derivatives, securities lending, and repurchase
agreement activities.5 Other losses/gains includes projected change in fair value of loans held for sale
and loans held for investment measured under the fair-value option, and
goodwill impairment losses.6 Other comprehensive income (OCI) is only calculated for advanced approaches
BHCs, and other BHCs that opt into the advanced approaches treatment of
AOCI.7 Certain aspects of AOCI are subject to transition arrangements for inclusion in
projected regulatory capital. The transition arrangements are 80 percent
included in projected regulatory capital for 2017 and 100 percent included in
projected regulatory capital starting in 2018. See 12 CFR 217.300(b)(3).
112 Supervisory Stress Test Methodology and Results

Table C.18.B. HSBC North America Holdings Inc.
Projected stressed capital ratios, risk-weighted assets, losses, revenues, net income before taxes, and loan lossesFederal Reserve estimates: Adverse scenario
Capital ratios, actual 2016:Q4 and projected 2017:Q1–2019:Q1
Percent
Regulatory ratio Actual
2016:Q4
Stressed capital ratios1
Ending Minimum
Common equity tier 1 capital ratio 17.9 13.4 13.4
Tier 1 capital ratio 20.1 16.0 16.0
Total capital ratio 25.3 19.2 19.2
Tier 1 leverage ratio 9.6 7.2 7.2
Supplementary leverage ratio n/a 5.5 5.5
1 The capital ratios are calculated using capital action assumptions provided
within the Dodd-Frank Act stress testing rule. See 12 CFR 252.56(b). These
projections represent hypothetical estimates that involve an economic outcome
that is more adverse than expected. The minimum capital ratios, other than the
supplementary leverage ratio, are for the period 2017:Q1 to 2019:Q1. The
minimum supplementary leverage ratio is for the period 2018:Q1 to 2019:Q1.
Supplementary leverage ratio projections only include estimates for firms
subject to the advanced approaches.
n/a Not applicable.
Projected loan losses, by type of loan, 2017:Q1–2019:Q1
Loan type Billions of
dollars Portfolio loss
rates (percent)1
Loan losses 2.5 3.3
First-lien mortgages, domestic 0.1 0.6
Junior liens and HELOCs, domestic 0.0 2.3
Commercial and industrial2 1.7 5.3
Commercial real estate, domestic 0.3 2.5
Credit cards 0.1 10.5
Other consumer3 0.0 5.7
Other loans4 0.3 2.4
1 Average loan balances used to calculate portfolio loss rates exclude loans held
for sale and loans held for investment under the fair-value option, and are
calculated over nine quarters.2 Commercial and industrial loans include small- and medium-enterprise loans
and corporate cards.3 Other consumer loans include student loans and automobile loans.4 Other loans include international real estate loans.
Risk-weighted assets, actual 2016:Q4 and projected 2019:Q1
Billions of dollars
Item Actual 2016:Q4 Projected 2019:Q1
Risk-weighted assets1 139.9 148.6
1 For each quarter, risk-weighted assets are calculated under the Board's
standardized capital risk-based approach in 12 CFR part 217, subpart D.
Projected losses, revenue, and net income before taxes through 2019:Q1
Item Billions of
dollars Percent of
average assets1
Pre-provision net revenue2 0.6 0.2
Other revenue3 0.8
less
Provisions 2.1
Realized losses/gains on securities (AFS/HTM) 0.0
Trading and counterparty losses4 0.0
Other losses/gains5 0.4
equals
Net income before taxes -1.2 -0.4
Memo items
Other comprehensive income6 0.0
Other effects on capital Actual 2016:Q4 2019:Q1
AOCI included in capital (billions of dollars)7 -0.7 -1.1
1 Average assets is the nine-quarter average of total assets.2 Pre-provision net revenue includes losses from operational-risk events and
other real estate owned (OREO) costs.3 Other revenue includes one-time income and (expense) items not included in
pre-provision net revenue.4 Trading and counterparty losses include mark-to-market and credit valuation
adjustments (CVA) losses and losses arising from the counterparty default
scenario component applied to derivatives, securities lending, and repurchase
agreement activities.5 Other losses/gains includes projected change in fair value of loans held for sale
and loans held for investment measured under the fair-value option, and
goodwill impairment losses.6 Other comprehensive income (OCI) is only calculated for advanced approaches
BHCs, and other BHCs that opt into the advanced approaches treatment of
AOCI.7 Certain aspects of AOCI are subject to transition arrangements for inclusion in
projected regulatory capital. The transition arrangements are 80 percent
included in projected regulatory capital for 2017 and 100 percent included in
projected regulatory capital starting in 2018. See 12 CFR 217.300(b)(3).
June 2017 113

Table C.19.A. Huntington Bancshares Incorporated
Projected stressed capital ratios, risk-weighted assets, losses, revenues, net income before taxes, and loan lossesFederal Reserve estimates: Severely adverse scenario
Capital ratios, actual 2016:Q4 and projected 2017:Q1–2019:Q1
Percent
Regulatory ratio Actual
2016:Q4
Stressed capital ratios1
Ending Minimum
Common equity tier 1 capital ratio 9.6 7.0 7.0
Tier 1 capital ratio 10.9 8.3 8.3
Total capital ratio 13.1 10.1 10.1
Tier 1 leverage ratio 8.7 6.6 6.6
Supplementary leverage ratio n/a
1 The capital ratios are calculated using capital action assumptions provided
within the Dodd-Frank Act stress testing rule. See 12 CFR 252.56(b). These
projections represent hypothetical estimates that involve an economic outcome
that is more adverse than expected. The minimum capital ratios, other than the
supplementary leverage ratio, are for the period 2017:Q1 to 2019:Q1. The
minimum supplementary leverage ratio is for the period 2018:Q1 to 2019:Q1.
Supplementary leverage ratio projections only include estimates for firms
subject to the advanced approaches.
n/a Not applicable.
Projected loan losses, by type of loan, 2017:Q1–2019:Q1
Loan type Billions of
dollars Portfolio loss
rates (percent)1
Loan losses 3.2 4.6
First-lien mortgages, domestic 0.3 2.8
Junior liens and HELOCs, domestic 0.3 3.4
Commercial and industrial2 1.0 4.8
Commercial real estate, domestic 0.8 7.0
Credit cards 0.1 13.5
Other consumer3 0.6 4.2
Other loans4 0.2 3.9
1 Average loan balances used to calculate portfolio loss rates exclude loans held
for sale and loans held for investment under the fair-value option, and are
calculated over nine quarters.2 Commercial and industrial loans include small- and medium-enterprise loans
and corporate cards.3 Other consumer loans include student loans and automobile loans.4 Other loans include international real estate loans.
Risk-weighted assets, actual 2016:Q4 and projected 2019:Q1
Billions of dollars
Item Actual 2016:Q4 Projected 2019:Q1
Risk-weighted assets1 78.3 84.9
1 For each quarter, risk-weighted assets are calculated under the Board's
standardized capital risk-based approach in 12 CFR part 217, subpart D.
Projected losses, revenue, and net income before taxes through 2019:Q1
Item Billions of
dollars Percent of
average assets1
Pre-provision net revenue2 2.8 2.7
Other revenue3 0.0
less
Provisions 3.5
Realized losses/gains on securities (AFS/HTM) 0.1
Trading and counterparty losses4 0.0
Other losses/gains5 0.0
equals
Net income before taxes -0.8 -0.8
Memo items
Other comprehensive income6 0.0
Other effects on capital Actual 2016:Q4 2019:Q1
AOCI included in capital (billions of dollars)7 0.0 0.0
1 Average assets is the nine-quarter average of total assets.2 Pre-provision net revenue includes losses from operational-risk events and
other real estate owned (OREO) costs.3 Other revenue includes one-time income and (expense) items not included in
pre-provision net revenue.4 Trading and counterparty losses include mark-to-market and credit valuation
adjustments (CVA) losses and losses arising from the counterparty default
scenario component applied to derivatives, securities lending, and repurchase
agreement activities.5 Other losses/gains includes projected change in fair value of loans held for sale
and loans held for investment measured under the fair-value option, and
goodwill impairment losses.6 Other comprehensive income (OCI) is only calculated for advanced approaches
BHCs, and other BHCs that opt into the advanced approaches treatment of
AOCI.7 Certain aspects of AOCI are subject to transition arrangements for inclusion in
projected regulatory capital. The transition arrangements are 80 percent
included in projected regulatory capital for 2017 and 100 percent included in
projected regulatory capital starting in 2018. See 12 CFR 217.300(b)(3).
114 Supervisory Stress Test Methodology and Results

Table C.19.B. Huntington Bancshares Incorporated
Projected stressed capital ratios, risk-weighted assets, losses, revenues, net income before taxes, and loan lossesFederal Reserve estimates: Adverse scenario
Capital ratios, actual 2016:Q4 and projected 2017:Q1–2019:Q1
Percent
Regulatory ratio Actual
2016:Q4
Stressed capital ratios1
Ending Minimum
Common equity tier 1 capital ratio 9.6 8.6 8.6
Tier 1 capital ratio 10.9 9.9 9.9
Total capital ratio 13.1 11.4 11.4
Tier 1 leverage ratio 8.7 7.7 7.7
Supplementary leverage ratio n/a
1 The capital ratios are calculated using capital action assumptions provided
within the Dodd-Frank Act stress testing rule. See 12 CFR 252.56(b). These
projections represent hypothetical estimates that involve an economic outcome
that is more adverse than expected. The minimum capital ratios, other than the
supplementary leverage ratio, are for the period 2017:Q1 to 2019:Q1. The
minimum supplementary leverage ratio is for the period 2018:Q1 to 2019:Q1.
Supplementary leverage ratio projections only include estimates for firms
subject to the advanced approaches.
n/a Not applicable.
Projected loan losses, by type of loan, 2017:Q1–2019:Q1
Loan type Billions of
dollars Portfolio loss
rates (percent)1
Loan losses 2.0 2.9
First-lien mortgages, domestic 0.2 1.7
Junior liens and HELOCs, domestic 0.2 2.4
Commercial and industrial2 0.6 3.1
Commercial real estate, domestic 0.5 3.7
Credit cards 0.1 10.5
Other consumer3 0.4 2.8
Other loans4 0.1 2.4
1 Average loan balances used to calculate portfolio loss rates exclude loans held
for sale and loans held for investment under the fair-value option, and are
calculated over nine quarters.2 Commercial and industrial loans include small- and medium-enterprise loans
and corporate cards.3 Other consumer loans include student loans and automobile loans.4 Other loans include international real estate loans.
Risk-weighted assets, actual 2016:Q4 and projected 2019:Q1
Billions of dollars
Item Actual 2016:Q4 Projected 2019:Q1
Risk-weighted assets1 78.3 86.8
1 For each quarter, risk-weighted assets are calculated under the Board's
standardized capital risk-based approach in 12 CFR part 217, subpart D.
Projected losses, revenue, and net income before taxes through 2019:Q1
Item Billions of
dollars Percent of
average assets1
Pre-provision net revenue2 3.6 3.3
Other revenue3 0.0
less
Provisions 2.1
Realized losses/gains on securities (AFS/HTM) 0.1
Trading and counterparty losses4 0.0
Other losses/gains5 0.0
equals
Net income before taxes 1.3 1.2
Memo items
Other comprehensive income6 0.0
Other effects on capital Actual 2016:Q4 2019:Q1
AOCI included in capital (billions of dollars)7 0.0 0.0
1 Average assets is the nine-quarter average of total assets.2 Pre-provision net revenue includes losses from operational-risk events and
other real estate owned (OREO) costs.3 Other revenue includes one-time income and (expense) items not included in
pre-provision net revenue.4 Trading and counterparty losses include mark-to-market and credit valuation
adjustments (CVA) losses and losses arising from the counterparty default
scenario component applied to derivatives, securities lending, and repurchase
agreement activities.5 Other losses/gains includes projected change in fair value of loans held for sale
and loans held for investment measured under the fair-value option, and
goodwill impairment losses.6 Other comprehensive income (OCI) is only calculated for advanced approaches
BHCs, and other BHCs that opt into the advanced approaches treatment of
AOCI.7 Certain aspects of AOCI are subject to transition arrangements for inclusion in
projected regulatory capital. The transition arrangements are 80 percent
included in projected regulatory capital for 2017 and 100 percent included in
projected regulatory capital starting in 2018. See 12 CFR 217.300(b)(3).
June 2017 115

Table C.20.A. JPMorgan Chase & Co.
Projected stressed capital ratios, risk-weighted assets, losses, revenues, net income before taxes, and loan lossesFederal Reserve estimates: Severely adverse scenario
Capital ratios, actual 2016:Q4 and projected 2017:Q1–2019:Q1
Percent
Regulatory ratio Actual
2016:Q4
Stressed capital ratios1
Ending Minimum
Common equity tier 1 capital ratio 12.5 9.3 9.1
Tier 1 capital ratio 14.2 10.9 10.7
Total capital ratio 16.4 13.3 12.9
Tier 1 leverage ratio 8.4 6.4 6.4
Supplementary leverage ratio n/a 5.0 5.0
1 The capital ratios are calculated using capital action assumptions provided
within the Dodd-Frank Act stress testing rule. See 12 CFR 252.56(b). These
projections represent hypothetical estimates that involve an economic outcome
that is more adverse than expected. The minimum capital ratios, other than the
supplementary leverage ratio, are for the period 2017:Q1 to 2019:Q1. The
minimum supplementary leverage ratio is for the period 2018:Q1 to 2019:Q1.
Supplementary leverage ratio projections only include estimates for firms
subject to the advanced approaches.
n/a Not applicable.
Projected loan losses, by type of loan, 2017:Q1–2019:Q1
Loan type Billions of
dollars Portfolio loss
rates (percent)1
Loan losses 54.0 5.7
First-lien mortgages, domestic 4.1 1.8
Junior liens and HELOCs, domestic 2.3 4.4
Commercial and industrial2 15.9 9.7
Commercial real estate, domestic 4.3 3.8
Credit cards 15.7 11.5
Other consumer3 3.2 4.3
Other loans4 8.6 4.7
1 Average loan balances used to calculate portfolio loss rates exclude loans held
for sale and loans held for investment under the fair-value option, and are
calculated over nine quarters.2 Commercial and industrial loans include small- and medium-enterprise loans
and corporate cards.3 Other consumer loans include student loans and automobile loans.4 Other loans include international real estate loans.
Risk-weighted assets, actual 2016:Q4 and projected 2019:Q1
Billions of dollars
Item Actual 2016:Q4 Projected 2019:Q1
Risk-weighted assets1 1,465.0 1,596.2
1 For each quarter, risk-weighted assets are calculated under the Board's
standardized capital risk-based approach in 12 CFR part 217, subpart D.
Projected losses, revenue, and net income before taxes through 2019:Q1
Item Billions of
dollars Percent of
average assets1
Pre-provision net revenue2 66.5 2.5
Other revenue3 0.0
less
Provisions 58.8
Realized losses/gains on securities (AFS/HTM) 0.1
Trading and counterparty losses4 25.2
Other losses/gains5 0.6
equals
Net income before taxes -18.3 -0.7
Memo items
Other comprehensive income6 -1.1
Other effects on capital Actual 2016:Q4 2019:Q1
AOCI included in capital (billions of dollars)7 -0.6 -2.2
1 Average assets is the nine-quarter average of total assets.2 Pre-provision net revenue includes losses from operational-risk events and
other real estate owned (OREO) costs.3 Other revenue includes one-time income and (expense) items not included in
pre-provision net revenue.4 Trading and counterparty losses include mark-to-market and credit valuation
adjustments (CVA) losses and losses arising from the counterparty default
scenario component applied to derivatives, securities lending, and repurchase
agreement activities.5 Other losses/gains includes projected change in fair value of loans held for sale
and loans held for investment measured under the fair-value option, and
goodwill impairment losses.6 Other comprehensive income (OCI) is only calculated for advanced approaches
BHCs, and other BHCs that opt into the advanced approaches treatment of
AOCI.7 Certain aspects of AOCI are subject to transition arrangements for inclusion in
projected regulatory capital. The transition arrangements are 80 percent
included in projected regulatory capital for 2017 and 100 percent included in
projected regulatory capital starting in 2018. See 12 CFR 217.300(b)(3).
116 Supervisory Stress Test Methodology and Results

Table C.20.B. JPMorgan Chase & Co.
Projected stressed capital ratios, risk-weighted assets, losses, revenues, net income before taxes, and loan lossesFederal Reserve estimates: Adverse scenario
Capital ratios, actual 2016:Q4 and projected 2017:Q1–2019:Q1
Percent
Regulatory ratio Actual
2016:Q4
Stressed capital ratios1
Ending Minimum
Common equity tier 1 capital ratio 12.5 11.1 10.7
Tier 1 capital ratio 14.2 12.6 12.3
Total capital ratio 16.4 14.6 14.3
Tier 1 leverage ratio 8.4 7.3 7.2
Supplementary leverage ratio n/a 5.7 5.6
1 The capital ratios are calculated using capital action assumptions provided
within the Dodd-Frank Act stress testing rule. See 12 CFR 252.56(b). These
projections represent hypothetical estimates that involve an economic outcome
that is more adverse than expected. The minimum capital ratios, other than the
supplementary leverage ratio, are for the period 2017:Q1 to 2019:Q1. The
minimum supplementary leverage ratio is for the period 2018:Q1 to 2019:Q1.
Supplementary leverage ratio projections only include estimates for firms
subject to the advanced approaches.
n/a Not applicable.
Projected loan losses, by type of loan, 2017:Q1–2019:Q1
Loan type Billions of
dollars Portfolio loss
rates (percent)1
Loan losses 36.3 3.8
First-lien mortgages, domestic 2.0 0.9
Junior liens and HELOCs, domestic 1.4 2.7
Commercial and industrial2 10.8 6.5
Commercial real estate, domestic 2.1 1.9
Credit cards 12.2 8.8
Other consumer3 2.4 3.3
Other loans4 5.4 2.9
1 Average loan balances used to calculate portfolio loss rates exclude loans held
for sale and loans held for investment under the fair-value option, and are
calculated over nine quarters.2 Commercial and industrial loans include small- and medium-enterprise loans
and corporate cards.3 Other consumer loans include student loans and automobile loans.4 Other loans include international real estate loans.
Risk-weighted assets, actual 2016:Q4 and projected 2019:Q1
Billions of dollars
Item Actual 2016:Q4 Projected 2019:Q1
Risk-weighted assets1 1,465.0 1,637.3
1 For each quarter, risk-weighted assets are calculated under the Board's
standardized capital risk-based approach in 12 CFR part 217, subpart D.
Projected losses, revenue, and net income before taxes through 2019:Q1
Item Billions of
dollars Percent of
average assets1
Pre-provision net revenue2 85.9 3.2
Other revenue3 0.0
less
Provisions 36.3
Realized losses/gains on securities (AFS/HTM) 0.1
Trading and counterparty losses4 12.4
Other losses/gains5 0.6
equals
Net income before taxes 36.5 1.4
Memo items
Other comprehensive income6 -4.2
Other effects on capital Actual 2016:Q4 2019:Q1
AOCI included in capital (billions of dollars)7 -0.6 -5.3
1 Average assets is the nine-quarter average of total assets.2 Pre-provision net revenue includes losses from operational-risk events and
other real estate owned (OREO) costs.3 Other revenue includes one-time income and (expense) items not included in
pre-provision net revenue.4 Trading and counterparty losses include mark-to-market and credit valuation
adjustments (CVA) losses and losses arising from the counterparty default
scenario component applied to derivatives, securities lending, and repurchase
agreement activities.5 Other losses/gains includes projected change in fair value of loans held for sale
and loans held for investment measured under the fair-value option, and
goodwill impairment losses.6 Other comprehensive income (OCI) is only calculated for advanced approaches
BHCs, and other BHCs that opt into the advanced approaches treatment of
AOCI.7 Certain aspects of AOCI are subject to transition arrangements for inclusion in
projected regulatory capital. The transition arrangements are 80 percent
included in projected regulatory capital for 2017 and 100 percent included in
projected regulatory capital starting in 2018. See 12 CFR 217.300(b)(3).
June 2017 117

Table C.21.A. KeyCorp
Projected stressed capital ratios, risk-weighted assets, losses, revenues, net income before taxes, and loan lossesFederal Reserve estimates: Severely adverse scenario
Capital ratios, actual 2016:Q4 and projected 2017:Q1–2019:Q1
Percent
Regulatory ratio Actual
2016:Q4
Stressed capital ratios1
Ending Minimum
Common equity tier 1 capital ratio 9.5 6.8 6.8
Tier 1 capital ratio 10.9 7.5 7.5
Total capital ratio 12.9 9.7 9.7
Tier 1 leverage ratio 9.9 6.8 6.8
Supplementary leverage ratio n/a
1 The capital ratios are calculated using capital action assumptions provided
within the Dodd-Frank Act stress testing rule. See 12 CFR 252.56(b). These
projections represent hypothetical estimates that involve an economic outcome
that is more adverse than expected. The minimum capital ratios, other than the
supplementary leverage ratio, are for the period 2017:Q1 to 2019:Q1. The
minimum supplementary leverage ratio is for the period 2018:Q1 to 2019:Q1.
Supplementary leverage ratio projections only include estimates for firms
subject to the advanced approaches.
n/a Not applicable.
Projected loan losses, by type of loan, 2017:Q1–2019:Q1
Loan type Billions of
dollars Portfolio loss
rates (percent)1
Loan losses 5.4 5.9
First-lien mortgages, domestic 0.3 3.3
Junior liens and HELOCs, domestic 0.4 3.9
Commercial and industrial2 2.0 6.0
Commercial real estate, domestic 1.8 9.8
Credit cards 0.1 12.8
Other consumer3 0.5 6.9
Other loans4 0.4 2.8
1 Average loan balances used to calculate portfolio loss rates exclude loans held
for sale and loans held for investment under the fair-value option, and are
calculated over nine quarters.2 Commercial and industrial loans include small- and medium-enterprise loans
and corporate cards.3 Other consumer loans include student loans and automobile loans.4 Other loans include international real estate loans.
Risk-weighted assets, actual 2016:Q4 and projected 2019:Q1
Billions of dollars
Item Actual 2016:Q4 Projected 2019:Q1
Risk-weighted assets1 121.7 132.9
1 For each quarter, risk-weighted assets are calculated under the Board's
standardized capital risk-based approach in 12 CFR part 217, subpart D.
Projected losses, revenue, and net income before taxes through 2019:Q1
Item Billions of
dollars Percent of
average assets1
Pre-provision net revenue2 3.4 2.4
Other revenue3 0.0
less
Provisions 6.1
Realized losses/gains on securities (AFS/HTM) 0.0
Trading and counterparty losses4 0.0
Other losses/gains5 0.1
equals
Net income before taxes -2.8 -1.9
Memo items
Other comprehensive income6 0.0
Other effects on capital Actual 2016:Q4 2019:Q1
AOCI included in capital (billions of dollars)7 0.0 0.0
1 Average assets is the nine-quarter average of total assets.2 Pre-provision net revenue includes losses from operational-risk events and
other real estate owned (OREO) costs.3 Other revenue includes one-time income and (expense) items not included in
pre-provision net revenue.4 Trading and counterparty losses include mark-to-market and credit valuation
adjustments (CVA) losses and losses arising from the counterparty default
scenario component applied to derivatives, securities lending, and repurchase
agreement activities.5 Other losses/gains includes projected change in fair value of loans held for sale
and loans held for investment measured under the fair-value option, and
goodwill impairment losses.6 Other comprehensive income (OCI) is only calculated for advanced approaches
BHCs, and other BHCs that opt into the advanced approaches treatment of
AOCI.7 Certain aspects of AOCI are subject to transition arrangements for inclusion in
projected regulatory capital. The transition arrangements are 80 percent
included in projected regulatory capital for 2017 and 100 percent included in
projected regulatory capital starting in 2018. See 12 CFR 217.300(b)(3).
118 Supervisory Stress Test Methodology and Results

Table C.21.B. KeyCorp
Projected stressed capital ratios, risk-weighted assets, losses, revenues, net income before taxes, and loan lossesFederal Reserve estimates: Adverse scenario
Capital ratios, actual 2016:Q4 and projected 2017:Q1–2019:Q1
Percent
Regulatory ratio Actual
2016:Q4
Stressed capital ratios1
Ending Minimum
Common equity tier 1 capital ratio 9.5 8.6 8.6
Tier 1 capital ratio 10.9 9.3 9.3
Total capital ratio 12.9 11.1 11.1
Tier 1 leverage ratio 9.9 8.4 8.4
Supplementary leverage ratio n/a
1 The capital ratios are calculated using capital action assumptions provided
within the Dodd-Frank Act stress testing rule. See 12 CFR 252.56(b). These
projections represent hypothetical estimates that involve an economic outcome
that is more adverse than expected. The minimum capital ratios, other than the
supplementary leverage ratio, are for the period 2017:Q1 to 2019:Q1. The
minimum supplementary leverage ratio is for the period 2018:Q1 to 2019:Q1.
Supplementary leverage ratio projections only include estimates for firms
subject to the advanced approaches.
n/a Not applicable.
Projected loan losses, by type of loan, 2017:Q1–2019:Q1
Loan type Billions of
dollars Portfolio loss
rates (percent)1
Loan losses 3.3 3.6
First-lien mortgages, domestic 0.2 2.3
Junior liens and HELOCs, domestic 0.3 2.9
Commercial and industrial2 1.2 3.7
Commercial real estate, domestic 0.9 4.8
Credit cards 0.1 10.0
Other consumer3 0.4 5.5
Other loans4 0.3 1.8
1 Average loan balances used to calculate portfolio loss rates exclude loans held
for sale and loans held for investment under the fair-value option, and are
calculated over nine quarters.2 Commercial and industrial loans include small- and medium-enterprise loans
and corporate cards.3 Other consumer loans include student loans and automobile loans.4 Other loans include international real estate loans.
Risk-weighted assets, actual 2016:Q4 and projected 2019:Q1
Billions of dollars
Item Actual 2016:Q4 Projected 2019:Q1
Risk-weighted assets1 121.7 135.8
1 For each quarter, risk-weighted assets are calculated under the Board's
standardized capital risk-based approach in 12 CFR part 217, subpart D.
Projected losses, revenue, and net income before taxes through 2019:Q1
Item Billions of
dollars Percent of
average assets1
Pre-provision net revenue2 4.7 3.2
Other revenue3 0.0
less
Provisions 3.6
Realized losses/gains on securities (AFS/HTM) 0.0
Trading and counterparty losses4 0.0
Other losses/gains5 0.1
equals
Net income before taxes 0.9 0.6
Memo items
Other comprehensive income6 0.0
Other effects on capital Actual 2016:Q4 2019:Q1
AOCI included in capital (billions of dollars)7 0.0 0.0
1 Average assets is the nine-quarter average of total assets.2 Pre-provision net revenue includes losses from operational-risk events and
other real estate owned (OREO) costs.3 Other revenue includes one-time income and (expense) items not included in
pre-provision net revenue.4 Trading and counterparty losses include mark-to-market and credit valuation
adjustments (CVA) losses and losses arising from the counterparty default
scenario component applied to derivatives, securities lending, and repurchase
agreement activities.5 Other losses/gains includes projected change in fair value of loans held for sale
and loans held for investment measured under the fair-value option, and
goodwill impairment losses.6 Other comprehensive income (OCI) is only calculated for advanced approaches
BHCs, and other BHCs that opt into the advanced approaches treatment of
AOCI.7 Certain aspects of AOCI are subject to transition arrangements for inclusion in
projected regulatory capital. The transition arrangements are 80 percent
included in projected regulatory capital for 2017 and 100 percent included in
projected regulatory capital starting in 2018. See 12 CFR 217.300(b)(3).
June 2017 119

Table C.22.A. M&T Bank Corporation
Projected stressed capital ratios, risk-weighted assets, losses, revenues, net income before taxes, and loan lossesFederal Reserve estimates: Severely adverse scenario
Capital ratios, actual 2016:Q4 and projected 2017:Q1–2019:Q1
Percent
Regulatory ratio Actual
2016:Q4
Stressed capital ratios1
Ending Minimum
Common equity tier 1 capital ratio 10.7 7.9 7.9
Tier 1 capital ratio 11.9 9.0 9.0
Total capital ratio 14.1 11.0 11.0
Tier 1 leverage ratio 10.0 7.5 7.5
Supplementary leverage ratio n/a
1 The capital ratios are calculated using capital action assumptions provided
within the Dodd-Frank Act stress testing rule. See 12 CFR 252.56(b). These
projections represent hypothetical estimates that involve an economic outcome
that is more adverse than expected. The minimum capital ratios, other than the
supplementary leverage ratio, are for the period 2017:Q1 to 2019:Q1. The
minimum supplementary leverage ratio is for the period 2018:Q1 to 2019:Q1.
Supplementary leverage ratio projections only include estimates for firms
subject to the advanced approaches.
n/a Not applicable.
Projected loan losses, by type of loan, 2017:Q1–2019:Q1
Loan type Billions of
dollars Portfolio loss
rates (percent)1
Loan losses 5.0 5.4
First-lien mortgages, domestic 1.0 4.2
Junior liens and HELOCs, domestic 0.3 4.3
Commercial and industrial2 0.8 4.2
Commercial real estate, domestic 2.4 7.1
Credit cards 0.1 13.5
Other consumer3 0.4 6.0
Other loans4 0.2 3.6
1 Average loan balances used to calculate portfolio loss rates exclude loans held
for sale and loans held for investment under the fair-value option, and are
calculated over nine quarters.2 Commercial and industrial loans include small- and medium-enterprise loans
and corporate cards.3 Other consumer loans include student loans and automobile loans.4 Other loans include international real estate loans.
Risk-weighted assets, actual 2016:Q4 and projected 2019:Q1
Billions of dollars
Item Actual 2016:Q4 Projected 2019:Q1
Risk-weighted assets1 101.4 110.1
1 For each quarter, risk-weighted assets are calculated under the Board's
standardized capital risk-based approach in 12 CFR part 217, subpart D.
Projected losses, revenue, and net income before taxes through 2019:Q1
Item Billions of
dollars Percent of
average assets1
Pre-provision net revenue2 4.7 3.6
Other revenue3 0.0
less
Provisions 5.5
Realized losses/gains on securities (AFS/HTM) 0.0
Trading and counterparty losses4 0.0
Other losses/gains5 0.1
equals
Net income before taxes -0.9 -0.7
Memo items
Other comprehensive income6 0.0
Other effects on capital Actual 2016:Q4 2019:Q1
AOCI included in capital (billions of dollars)7 0.0 0.0
1 Average assets is the nine-quarter average of total assets.2 Pre-provision net revenue includes losses from operational-risk events and
other real estate owned (OREO) costs.3 Other revenue includes one-time income and (expense) items not included in
pre-provision net revenue.4 Trading and counterparty losses include mark-to-market and credit valuation
adjustments (CVA) losses and losses arising from the counterparty default
scenario component applied to derivatives, securities lending, and repurchase
agreement activities.5 Other losses/gains includes projected change in fair value of loans held for sale
and loans held for investment measured under the fair-value option, and
goodwill impairment losses.6 Other comprehensive income (OCI) is only calculated for advanced approaches
BHCs, and other BHCs that opt into the advanced approaches treatment of
AOCI.7 Certain aspects of AOCI are subject to transition arrangements for inclusion in
projected regulatory capital. The transition arrangements are 80 percent
included in projected regulatory capital for 2017 and 100 percent included in
projected regulatory capital starting in 2018. See 12 CFR 217.300(b)(3).
120 Supervisory Stress Test Methodology and Results

Table C.22.B. M&T Bank Corporation
Projected stressed capital ratios, risk-weighted assets, losses, revenues, net income before taxes, and loan lossesFederal Reserve estimates: Adverse scenario
Capital ratios, actual 2016:Q4 and projected 2017:Q1–2019:Q1
Percent
Regulatory ratio Actual
2016:Q4
Stressed capital ratios1
Ending Minimum
Common equity tier 1 capital ratio 10.7 9.6 9.5
Tier 1 capital ratio 11.9 10.7 10.6
Total capital ratio 14.1 12.3 12.3
Tier 1 leverage ratio 10.0 8.8 8.8
Supplementary leverage ratio n/a
1 The capital ratios are calculated using capital action assumptions provided
within the Dodd-Frank Act stress testing rule. See 12 CFR 252.56(b). These
projections represent hypothetical estimates that involve an economic outcome
that is more adverse than expected. The minimum capital ratios, other than the
supplementary leverage ratio, are for the period 2017:Q1 to 2019:Q1. The
minimum supplementary leverage ratio is for the period 2018:Q1 to 2019:Q1.
Supplementary leverage ratio projections only include estimates for firms
subject to the advanced approaches.
n/a Not applicable.
Projected loan losses, by type of loan, 2017:Q1–2019:Q1
Loan type Billions of
dollars Portfolio loss
rates (percent)1
Loan losses 3.1 3.3
First-lien mortgages, domestic 0.7 3.0
Junior liens and HELOCs, domestic 0.2 3.2
Commercial and industrial2 0.6 3.0
Commercial real estate, domestic 1.2 3.5
Credit cards 0.0 10.5
Other consumer3 0.3 4.1
Other loans4 0.1 2.2
1 Average loan balances used to calculate portfolio loss rates exclude loans held
for sale and loans held for investment under the fair-value option, and are
calculated over nine quarters.2 Commercial and industrial loans include small- and medium-enterprise loans
and corporate cards.3 Other consumer loans include student loans and automobile loans.4 Other loans include international real estate loans.
Risk-weighted assets, actual 2016:Q4 and projected 2019:Q1
Billions of dollars
Item Actual 2016:Q4 Projected 2019:Q1
Risk-weighted assets1 101.4 112.2
1 For each quarter, risk-weighted assets are calculated under the Board's
standardized capital risk-based approach in 12 CFR part 217, subpart D.
Projected losses, revenue, and net income before taxes through 2019:Q1
Item Billions of
dollars Percent of
average assets1
Pre-provision net revenue2 5.6 4.2
Other revenue3 0.0
less
Provisions 3.2
Realized losses/gains on securities (AFS/HTM) 0.0
Trading and counterparty losses4 0.0
Other losses/gains5 0.1
equals
Net income before taxes 2.3 1.8
Memo items
Other comprehensive income6 0.0
Other effects on capital Actual 2016:Q4 2019:Q1
AOCI included in capital (billions of dollars)7 0.0 0.0
1 Average assets is the nine-quarter average of total assets.2 Pre-provision net revenue includes losses from operational-risk events and
other real estate owned (OREO) costs.3 Other revenue includes one-time income and (expense) items not included in
pre-provision net revenue.4 Trading and counterparty losses include mark-to-market and credit valuation
adjustments (CVA) losses and losses arising from the counterparty default
scenario component applied to derivatives, securities lending, and repurchase
agreement activities.5 Other losses/gains includes projected change in fair value of loans held for sale
and loans held for investment measured under the fair-value option, and
goodwill impairment losses.6 Other comprehensive income (OCI) is only calculated for advanced approaches
BHCs, and other BHCs that opt into the advanced approaches treatment of
AOCI.7 Certain aspects of AOCI are subject to transition arrangements for inclusion in
projected regulatory capital. The transition arrangements are 80 percent
included in projected regulatory capital for 2017 and 100 percent included in
projected regulatory capital starting in 2018. See 12 CFR 217.300(b)(3).
June 2017 121

Table C.23.A. Morgan Stanley
Projected stressed capital ratios, risk-weighted assets, losses, revenues, net income before taxes, and loan lossesFederal Reserve estimates: Severely adverse scenario
Capital ratios, actual 2016:Q4 and projected 2017:Q1–2019:Q1
Percent
Regulatory ratio Actual
2016:Q4
Stressed capital ratios1
Ending Minimum
Common equity tier 1 capital ratio 17.8 11.1 9.4
Tier 1 capital ratio 20.0 13.4 11.7
Total capital ratio 23.2 16.3 14.9
Tier 1 leverage ratio 8.4 5.5 4.9
Supplementary leverage ratio n/a 4.2 3.8
1 The capital ratios are calculated using capital action assumptions provided
within the Dodd-Frank Act stress testing rule. See 12 CFR 252.56(b). These
projections represent hypothetical estimates that involve an economic outcome
that is more adverse than expected. The minimum capital ratios, other than the
supplementary leverage ratio, are for the period 2017:Q1 to 2019:Q1. The
minimum supplementary leverage ratio is for the period 2018:Q1 to 2019:Q1.
Supplementary leverage ratio projections only include estimates for firms
subject to the advanced approaches.
n/a Not applicable.
Projected loan losses, by type of loan, 2017:Q1–2019:Q1
Loan type Billions of
dollars Portfolio loss
rates (percent)1
Loan losses 3.6 3.2
First-lien mortgages, domestic 0.4 1.6
Junior liens and HELOCs, domestic 0.0 4.5
Commercial and industrial2 1.2 10.4
Commercial real estate, domestic 0.5 5.0
Credit cards 0.0 0.0
Other consumer3 0.1 0.6
Other loans4 1.4 3.0
1 Average loan balances used to calculate portfolio loss rates exclude loans held
for sale and loans held for investment under the fair-value option, and are
calculated over nine quarters.2 Commercial and industrial loans include small- and medium-enterprise loans
and corporate cards.3 Other consumer loans include student loans and automobile loans.4 Other loans include international real estate loans.
Risk-weighted assets, actual 2016:Q4 and projected 2019:Q1
Billions of dollars
Item Actual 2016:Q4 Projected 2019:Q1
Risk-weighted assets1 340.2 359.8
1 For each quarter, risk-weighted assets are calculated under the Board's
standardized capital risk-based approach in 12 CFR part 217, subpart D.
Projected losses, revenue, and net income before taxes through 2019:Q1
Item Billions of
dollars Percent of
average assets1
Pre-provision net revenue2 4.9 0.6
Other revenue3 0.0
less
Provisions 4.5
Realized losses/gains on securities (AFS/HTM) 0.0
Trading and counterparty losses4 9.5
Other losses/gains5 4.7
equals
Net income before taxes -13.8 -1.6
Memo items
Other comprehensive income6 0.7
Other effects on capital Actual 2016:Q4 2019:Q1
AOCI included in capital (billions of dollars)7 -2.2 -1.9
1 Average assets is the nine-quarter average of total assets.2 Pre-provision net revenue includes losses from operational-risk events and
other real estate owned (OREO) costs.3 Other revenue includes one-time income and (expense) items not included in
pre-provision net revenue.4 Trading and counterparty losses include mark-to-market and credit valuation
adjustments (CVA) losses and losses arising from the counterparty default
scenario component applied to derivatives, securities lending, and repurchase
agreement activities.5 Other losses/gains includes projected change in fair value of loans held for sale
and loans held for investment measured under the fair-value option, and
goodwill impairment losses.6 Other comprehensive income (OCI) is only calculated for advanced approaches
BHCs, and other BHCs that opt into the advanced approaches treatment of
AOCI.7 Certain aspects of AOCI are subject to transition arrangements for inclusion in
projected regulatory capital. The transition arrangements are 80 percent
included in projected regulatory capital for 2017 and 100 percent included in
projected regulatory capital starting in 2018. See 12 CFR 217.300(b)(3).
122 Supervisory Stress Test Methodology and Results

Table C.23.B. Morgan Stanley
Projected stressed capital ratios, risk-weighted assets, losses, revenues, net income before taxes, and loan lossesFederal Reserve estimates: Adverse scenario
Capital ratios, actual 2016:Q4 and projected 2017:Q1–2019:Q1
Percent
Regulatory ratio Actual
2016:Q4
Stressed capital ratios1
Ending Minimum
Common equity tier 1 capital ratio 17.8 13.9 13.2
Tier 1 capital ratio 20.0 16.1 15.6
Total capital ratio 23.2 18.8 18.5
Tier 1 leverage ratio 8.4 6.6 6.4
Supplementary leverage ratio n/a 5.0 4.9
1 The capital ratios are calculated using capital action assumptions provided
within the Dodd-Frank Act stress testing rule. See 12 CFR 252.56(b). These
projections represent hypothetical estimates that involve an economic outcome
that is more adverse than expected. The minimum capital ratios, other than the
supplementary leverage ratio, are for the period 2017:Q1 to 2019:Q1. The
minimum supplementary leverage ratio is for the period 2018:Q1 to 2019:Q1.
Supplementary leverage ratio projections only include estimates for firms
subject to the advanced approaches.
n/a Not applicable.
Projected loan losses, by type of loan, 2017:Q1–2019:Q1
Loan type Billions of
dollars Portfolio loss
rates (percent)1
Loan losses 2.3 2.0
First-lien mortgages, domestic 0.2 0.9
Junior liens and HELOCs, domestic 0.0 3.2
Commercial and industrial2 0.8 6.9
Commercial real estate, domestic 0.2 2.1
Credit cards 0.0 0.0
Other consumer3 0.1 0.6
Other loans4 0.9 1.9
1 Average loan balances used to calculate portfolio loss rates exclude loans held
for sale and loans held for investment under the fair-value option, and are
calculated over nine quarters.2 Commercial and industrial loans include small- and medium-enterprise loans
and corporate cards.3 Other consumer loans include student loans and automobile loans.4 Other loans include international real estate loans.
Risk-weighted assets, actual 2016:Q4 and projected 2019:Q1
Billions of dollars
Item Actual 2016:Q4 Projected 2019:Q1
Risk-weighted assets1 340.2 372.8
1 For each quarter, risk-weighted assets are calculated under the Board's
standardized capital risk-based approach in 12 CFR part 217, subpart D.
Projected losses, revenue, and net income before taxes through 2019:Q1
Item Billions of
dollars Percent of
average assets1
Pre-provision net revenue2 9.4 1.1
Other revenue3 0.0
less
Provisions 2.7
Realized losses/gains on securities (AFS/HTM) 0.0
Trading and counterparty losses4 4.8
Other losses/gains5 3.7
equals
Net income before taxes -1.9 -0.2
Memo items
Other comprehensive income6 -0.2
Other effects on capital Actual 2016:Q4 2019:Q1
AOCI included in capital (billions of dollars)7 -2.2 -2.8
1 Average assets is the nine-quarter average of total assets.2 Pre-provision net revenue includes losses from operational-risk events and
other real estate owned (OREO) costs.3 Other revenue includes one-time income and (expense) items not included in
pre-provision net revenue.4 Trading and counterparty losses include mark-to-market and credit valuation
adjustments (CVA) losses and losses arising from the counterparty default
scenario component applied to derivatives, securities lending, and repurchase
agreement activities.5 Other losses/gains includes projected change in fair value of loans held for sale
and loans held for investment measured under the fair-value option, and
goodwill impairment losses.6 Other comprehensive income (OCI) is only calculated for advanced approaches
BHCs, and other BHCs that opt into the advanced approaches treatment of
AOCI.7 Certain aspects of AOCI are subject to transition arrangements for inclusion in
projected regulatory capital. The transition arrangements are 80 percent
included in projected regulatory capital for 2017 and 100 percent included in
projected regulatory capital starting in 2018. See 12 CFR 217.300(b)(3).
June 2017 123

Table C.24.A. MUFG Americas Holdings Corporation
Projected stressed capital ratios, risk-weighted assets, losses, revenues, net income before taxes, and loan lossesFederal Reserve estimates: Severely adverse scenario
Capital ratios, actual 2016:Q4 and projected 2017:Q1–2019:Q1
Percent
Regulatory ratio Actual
2016:Q4
Stressed capital ratios1
Ending Minimum
Common equity tier 1 capital ratio 14.8 12.5 12.5
Tier 1 capital ratio 14.8 12.5 12.5
Total capital ratio 16.4 14.1 14.1
Tier 1 leverage ratio 9.9 8.2 8.2
Supplementary leverage ratio n/a
1 The capital ratios are calculated using capital action assumptions provided
within the Dodd-Frank Act stress testing rule. See 12 CFR 252.56(b). These
projections represent hypothetical estimates that involve an economic outcome
that is more adverse than expected. The minimum capital ratios, other than the
supplementary leverage ratio, are for the period 2017:Q1 to 2019:Q1. The
minimum supplementary leverage ratio is for the period 2018:Q1 to 2019:Q1.
Supplementary leverage ratio projections only include estimates for firms
subject to the advanced approaches.
n/a Not applicable.
Projected loan losses, by type of loan, 2017:Q1–2019:Q1
Loan type Billions of
dollars Portfolio loss
rates (percent)1
Loan losses 3.9 4.8
First-lien mortgages, domestic 0.6 1.9
Junior liens and HELOCs, domestic 0.1 3.4
Commercial and industrial2 1.4 7.2
Commercial real estate, domestic 1.3 7.5
Credit cards 0.0 13.5
Other consumer3 0.1 12.9
Other loans4 0.3 3.5
1 Average loan balances used to calculate portfolio loss rates exclude loans held
for sale and loans held for investment under the fair-value option, and are
calculated over nine quarters.2 Commercial and industrial loans include small- and medium-enterprise loans
and corporate cards.3 Other consumer loans include student loans and automobile loans.4 Other loans include international real estate loans.
Risk-weighted assets, actual 2016:Q4 and projected 2019:Q1
Billions of dollars
Item Actual 2016:Q4 Projected 2019:Q1
Risk-weighted assets1 99.9 107.9
1 For each quarter, risk-weighted assets are calculated under the Board's
standardized capital risk-based approach in 12 CFR part 217, subpart D.
Projected losses, revenue, and net income before taxes through 2019:Q1
Item Billions of
dollars Percent of
average assets1
Pre-provision net revenue2 2.8 1.8
Other revenue3 0.0
less
Provisions 4.4
Realized losses/gains on securities (AFS/HTM) 0.0
Trading and counterparty losses4 0.0
Other losses/gains5 0.3
equals
Net income before taxes -1.9 -1.2
Memo items
Other comprehensive income6 0.0
Other effects on capital Actual 2016:Q4 2019:Q1
AOCI included in capital (billions of dollars)7 0.0 0.0
1 Average assets is the nine-quarter average of total assets.2 Pre-provision net revenue includes losses from operational-risk events and
other real estate owned (OREO) costs.3 Other revenue includes one-time income and (expense) items not included in
pre-provision net revenue.4 Trading and counterparty losses include mark-to-market and credit valuation
adjustments (CVA) losses and losses arising from the counterparty default
scenario component applied to derivatives, securities lending, and repurchase
agreement activities.5 Other losses/gains includes projected change in fair value of loans held for sale
and loans held for investment measured under the fair-value option, and
goodwill impairment losses.6 Other comprehensive income (OCI) is only calculated for advanced approaches
BHCs, and other BHCs that opt into the advanced approaches treatment of
AOCI.7 Certain aspects of AOCI are subject to transition arrangements for inclusion in
projected regulatory capital. The transition arrangements are 80 percent
included in projected regulatory capital for 2017 and 100 percent included in
projected regulatory capital starting in 2018. See 12 CFR 217.300(b)(3).
124 Supervisory Stress Test Methodology and Results

Table C.24.B. MUFG Americas Holdings Corporation
Projected stressed capital ratios, risk-weighted assets, losses, revenues, net income before taxes, and loan lossesFederal Reserve estimates: Adverse scenario
Capital ratios, actual 2016:Q4 and projected 2017:Q1–2019:Q1
Percent
Regulatory ratio Actual
2016:Q4
Stressed capital ratios1
Ending Minimum
Common equity tier 1 capital ratio 14.8 14.4 14.3
Tier 1 capital ratio 14.8 14.4 14.3
Total capital ratio 16.4 15.5 15.5
Tier 1 leverage ratio 9.9 9.4 9.4
Supplementary leverage ratio n/a
1 The capital ratios are calculated using capital action assumptions provided
within the Dodd-Frank Act stress testing rule. See 12 CFR 252.56(b). These
projections represent hypothetical estimates that involve an economic outcome
that is more adverse than expected. The minimum capital ratios, other than the
supplementary leverage ratio, are for the period 2017:Q1 to 2019:Q1. The
minimum supplementary leverage ratio is for the period 2018:Q1 to 2019:Q1.
Supplementary leverage ratio projections only include estimates for firms
subject to the advanced approaches.
n/a Not applicable.
Projected loan losses, by type of loan, 2017:Q1–2019:Q1
Loan type Billions of
dollars Portfolio loss
rates (percent)1
Loan losses 2.1 2.6
First-lien mortgages, domestic 0.3 0.8
Junior liens and HELOCs, domestic 0.0 1.5
Commercial and industrial2 0.9 4.5
Commercial real estate, domestic 0.6 3.5
Credit cards 0.0 10.5
Other consumer3 0.1 10.2
Other loans4 0.2 2.1
1 Average loan balances used to calculate portfolio loss rates exclude loans held
for sale and loans held for investment under the fair-value option, and are
calculated over nine quarters.2 Commercial and industrial loans include small- and medium-enterprise loans
and corporate cards.3 Other consumer loans include student loans and automobile loans.4 Other loans include international real estate loans.
Risk-weighted assets, actual 2016:Q4 and projected 2019:Q1
Billions of dollars
Item Actual 2016:Q4 Projected 2019:Q1
Risk-weighted assets1 99.9 110.7
1 For each quarter, risk-weighted assets are calculated under the Board's
standardized capital risk-based approach in 12 CFR part 217, subpart D.
Projected losses, revenue, and net income before taxes through 2019:Q1
Item Billions of
dollars Percent of
average assets1
Pre-provision net revenue2 3.8 2.4
Other revenue3 0.0
less
Provisions 2.1
Realized losses/gains on securities (AFS/HTM) 0.0
Trading and counterparty losses4 0.0
Other losses/gains5 0.3
equals
Net income before taxes 1.3 0.8
Memo items
Other comprehensive income6 0.0
Other effects on capital Actual 2016:Q4 2019:Q1
AOCI included in capital (billions of dollars)7 0.0 0.0
1 Average assets is the nine-quarter average of total assets.2 Pre-provision net revenue includes losses from operational-risk events and
other real estate owned (OREO) costs.3 Other revenue includes one-time income and (expense) items not included in
pre-provision net revenue.4 Trading and counterparty losses include mark-to-market and credit valuation
adjustments (CVA) losses and losses arising from the counterparty default
scenario component applied to derivatives, securities lending, and repurchase
agreement activities.5 Other losses/gains includes projected change in fair value of loans held for sale
and loans held for investment measured under the fair-value option, and
goodwill impairment losses.6 Other comprehensive income (OCI) is only calculated for advanced approaches
BHCs, and other BHCs that opt into the advanced approaches treatment of
AOCI.7 Certain aspects of AOCI are subject to transition arrangements for inclusion in
projected regulatory capital. The transition arrangements are 80 percent
included in projected regulatory capital for 2017 and 100 percent included in
projected regulatory capital starting in 2018. See 12 CFR 217.300(b)(3).
June 2017 125

Table C.25.A. Northern Trust Corporation
Projected stressed capital ratios, risk-weighted assets, losses, revenues, net income before taxes, and loan lossesFederal Reserve estimates: Severely adverse scenario
Capital ratios, actual 2016:Q4 and projected 2017:Q1–2019:Q1
Percent
Regulatory ratio Actual
2016:Q4
Stressed capital ratios1
Ending Minimum
Common equity tier 1 capital ratio 11.8 11.0 10.9
Tier 1 capital ratio 12.9 12.1 12.1
Total capital ratio 14.5 13.7 13.7
Tier 1 leverage ratio 8.0 7.4 7.4
Supplementary leverage ratio n/a 6.2 6.2
1 The capital ratios are calculated using capital action assumptions provided
within the Dodd-Frank Act stress testing rule. See 12 CFR 252.56(b). These
projections represent hypothetical estimates that involve an economic outcome
that is more adverse than expected. The minimum capital ratios, other than the
supplementary leverage ratio, are for the period 2017:Q1 to 2019:Q1. The
minimum supplementary leverage ratio is for the period 2018:Q1 to 2019:Q1.
Supplementary leverage ratio projections only include estimates for firms
subject to the advanced approaches.
n/a Not applicable.
Projected loan losses, by type of loan, 2017:Q1–2019:Q1
Loan type Billions of
dollars Portfolio loss
rates (percent)1
Loan losses 1.5 4.4
First-lien mortgages, domestic 0.1 1.7
Junior liens and HELOCs, domestic 0.1 7.2
Commercial and industrial2 0.3 4.2
Commercial real estate, domestic 0.3 7.3
Credit cards 0.0 0.0
Other consumer3 0.0 13.8
Other loans4 0.6 4.2
1 Average loan balances used to calculate portfolio loss rates exclude loans held
for sale and loans held for investment under the fair-value option, and are
calculated over nine quarters.2 Commercial and industrial loans include small- and medium-enterprise loans
and corporate cards.3 Other consumer loans include student loans and automobile loans.4 Other loans include international real estate loans.
Risk-weighted assets, actual 2016:Q4 and projected 2019:Q1
Billions of dollars
Item Actual 2016:Q4 Projected 2019:Q1
Risk-weighted assets1 72.0 77.5
1 For each quarter, risk-weighted assets are calculated under the Board's
standardized capital risk-based approach in 12 CFR part 217, subpart D.
Projected losses, revenue, and net income before taxes through 2019:Q1
Item Billions of
dollars Percent of
average assets1
Pre-provision net revenue2 3.1 2.4
Other revenue3 0.0
less
Provisions 1.9
Realized losses/gains on securities (AFS/HTM) 0.0
Trading and counterparty losses4 0.0
Other losses/gains5 0.0
equals
Net income before taxes 1.2 0.9
Memo items
Other comprehensive income6 0.2
Other effects on capital Actual 2016:Q4 2019:Q1
AOCI included in capital (billions of dollars)7 -0.2 -0.2
1 Average assets is the nine-quarter average of total assets.2 Pre-provision net revenue includes losses from operational-risk events and
other real estate owned (OREO) costs.3 Other revenue includes one-time income and (expense) items not included in
pre-provision net revenue.4 Trading and counterparty losses include mark-to-market and credit valuation
adjustments (CVA) losses and losses arising from the counterparty default
scenario component applied to derivatives, securities lending, and repurchase
agreement activities.5 Other losses/gains includes projected change in fair value of loans held for sale
and loans held for investment measured under the fair-value option, and
goodwill impairment losses.6 Other comprehensive income (OCI) is only calculated for advanced approaches
BHCs, and other BHCs that opt into the advanced approaches treatment of
AOCI.7 Certain aspects of AOCI are subject to transition arrangements for inclusion in
projected regulatory capital. The transition arrangements are 80 percent
included in projected regulatory capital for 2017 and 100 percent included in
projected regulatory capital starting in 2018. See 12 CFR 217.300(b)(3).
126 Supervisory Stress Test Methodology and Results

Table C.25.B. Northern Trust Corporation
Projected stressed capital ratios, risk-weighted assets, losses, revenues, net income before taxes, and loan lossesFederal Reserve estimates: Adverse scenario
Capital ratios, actual 2016:Q4 and projected 2017:Q1–2019:Q1
Percent
Regulatory ratio Actual
2016:Q4
Stressed capital ratios1
Ending Minimum
Common equity tier 1 capital ratio 11.8 11.8 11.4
Tier 1 capital ratio 12.9 12.9 12.5
Total capital ratio 14.5 14.2 14.1
Tier 1 leverage ratio 8.0 7.7 7.6
Supplementary leverage ratio n/a 6.6 6.5
1 The capital ratios are calculated using capital action assumptions provided
within the Dodd-Frank Act stress testing rule. See 12 CFR 252.56(b). These
projections represent hypothetical estimates that involve an economic outcome
that is more adverse than expected. The minimum capital ratios, other than the
supplementary leverage ratio, are for the period 2017:Q1 to 2019:Q1. The
minimum supplementary leverage ratio is for the period 2018:Q1 to 2019:Q1.
Supplementary leverage ratio projections only include estimates for firms
subject to the advanced approaches.
n/a Not applicable.
Projected loan losses, by type of loan, 2017:Q1–2019:Q1
Loan type Billions of
dollars Portfolio loss
rates (percent)1
Loan losses 0.9 2.5
First-lien mortgages, domestic 0.1 0.9
Junior liens and HELOCs, domestic 0.1 4.7
Commercial and industrial2 0.2 2.6
Commercial real estate, domestic 0.2 3.4
Credit cards 0.0 0.0
Other consumer3 0.0 11.1
Other loans4 0.4 2.6
1 Average loan balances used to calculate portfolio loss rates exclude loans held
for sale and loans held for investment under the fair-value option, and are
calculated over nine quarters.2 Commercial and industrial loans include small- and medium-enterprise loans
and corporate cards.3 Other consumer loans include student loans and automobile loans.4 Other loans include international real estate loans.
Risk-weighted assets, actual 2016:Q4 and projected 2019:Q1
Billions of dollars
Item Actual 2016:Q4 Projected 2019:Q1
Risk-weighted assets1 72.0 79.5
1 For each quarter, risk-weighted assets are calculated under the Board's
standardized capital risk-based approach in 12 CFR part 217, subpart D.
Projected losses, revenue, and net income before taxes through 2019:Q1
Item Billions of
dollars Percent of
average assets1
Pre-provision net revenue2 3.9 2.9
Other revenue3 0.0
less
Provisions 1.1
Realized losses/gains on securities (AFS/HTM) 0.0
Trading and counterparty losses4 0.0
Other losses/gains5 0.0
equals
Net income before taxes 2.8 2.1
Memo items
Other comprehensive income6 0.0
Other effects on capital Actual 2016:Q4 2019:Q1
AOCI included in capital (billions of dollars)7 -0.2 -0.4
1 Average assets is the nine-quarter average of total assets.2 Pre-provision net revenue includes losses from operational-risk events and
other real estate owned (OREO) costs.3 Other revenue includes one-time income and (expense) items not included in
pre-provision net revenue.4 Trading and counterparty losses include mark-to-market and credit valuation
adjustments (CVA) losses and losses arising from the counterparty default
scenario component applied to derivatives, securities lending, and repurchase
agreement activities.5 Other losses/gains includes projected change in fair value of loans held for sale
and loans held for investment measured under the fair-value option, and
goodwill impairment losses.6 Other comprehensive income (OCI) is only calculated for advanced approaches
BHCs, and other BHCs that opt into the advanced approaches treatment of
AOCI.7 Certain aspects of AOCI are subject to transition arrangements for inclusion in
projected regulatory capital. The transition arrangements are 80 percent
included in projected regulatory capital for 2017 and 100 percent included in
projected regulatory capital starting in 2018. See 12 CFR 217.300(b)(3).
June 2017 127

Table C.26.A. The PNC Financial Services Group, Inc.
Projected stressed capital ratios, risk-weighted assets, losses, revenues, net income before taxes, and loan lossesFederal Reserve estimates: Severely adverse scenario
Capital ratios, actual 2016:Q4 and projected 2017:Q1–2019:Q1
Percent
Regulatory ratio Actual
2016:Q4
Stressed capital ratios1
Ending Minimum
Common equity tier 1 capital ratio 10.6 8.3 8.0
Tier 1 capital ratio 12.0 9.5 9.3
Total capital ratio 14.3 11.4 11.4
Tier 1 leverage ratio 10.1 8.1 8.0
Supplementary leverage ratio n/a 6.8 6.7
1 The capital ratios are calculated using capital action assumptions provided
within the Dodd-Frank Act stress testing rule. See 12 CFR 252.56(b). These
projections represent hypothetical estimates that involve an economic outcome
that is more adverse than expected. The minimum capital ratios, other than the
supplementary leverage ratio, are for the period 2017:Q1 to 2019:Q1. The
minimum supplementary leverage ratio is for the period 2018:Q1 to 2019:Q1.
Supplementary leverage ratio projections only include estimates for firms
subject to the advanced approaches.
n/a Not applicable.
Projected loan losses, by type of loan, 2017:Q1–2019:Q1
Loan type Billions of
dollars Portfolio loss
rates (percent)1
Loan losses 9.3 4.3
First-lien mortgages, domestic 0.4 1.7
Junior liens and HELOCs, domestic 0.4 2.0
Commercial and industrial2 4.3 5.8
Commercial real estate, domestic 2.3 6.1
Credit cards 0.6 12.6
Other consumer3 0.7 3.2
Other loans4 0.6 1.8
1 Average loan balances used to calculate portfolio loss rates exclude loans held
for sale and loans held for investment under the fair-value option, and are
calculated over nine quarters.2 Commercial and industrial loans include small- and medium-enterprise loans
and corporate cards.3 Other consumer loans include student loans and automobile loans.4 Other loans include international real estate loans.
Risk-weighted assets, actual 2016:Q4 and projected 2019:Q1
Billions of dollars
Item Actual 2016:Q4 Projected 2019:Q1
Risk-weighted assets1 300.5 329.0
1 For each quarter, risk-weighted assets are calculated under the Board's
standardized capital risk-based approach in 12 CFR part 217, subpart D.
Projected losses, revenue, and net income before taxes through 2019:Q1
Item Billions of
dollars Percent of
average assets1
Pre-provision net revenue2 12.2 3.2
Other revenue3 0.0
less
Provisions 9.9
Realized losses/gains on securities (AFS/HTM) 0.1
Trading and counterparty losses4 0.0
Other losses/gains5 0.3
equals
Net income before taxes 1.9 0.5
Memo items
Other comprehensive income6 -0.5
Other effects on capital Actual 2016:Q4 2019:Q1
AOCI included in capital (billions of dollars)7 -0.4 -1.0
1 Average assets is the nine-quarter average of total assets.2 Pre-provision net revenue includes losses from operational-risk events and
other real estate owned (OREO) costs.3 Other revenue includes one-time income and (expense) items not included in
pre-provision net revenue.4 Trading and counterparty losses include mark-to-market and credit valuation
adjustments (CVA) losses and losses arising from the counterparty default
scenario component applied to derivatives, securities lending, and repurchase
agreement activities.5 Other losses/gains includes projected change in fair value of loans held for sale
and loans held for investment measured under the fair-value option, and
goodwill impairment losses.6 Other comprehensive income (OCI) is only calculated for advanced approaches
BHCs, and other BHCs that opt into the advanced approaches treatment of
AOCI.7 Certain aspects of AOCI are subject to transition arrangements for inclusion in
projected regulatory capital. The transition arrangements are 80 percent
included in projected regulatory capital for 2017 and 100 percent included in
projected regulatory capital starting in 2018. See 12 CFR 217.300(b)(3).
128 Supervisory Stress Test Methodology and Results

Table C.26.B. The PNC Financial Services Group, Inc.
Projected stressed capital ratios, risk-weighted assets, losses, revenues, net income before taxes, and loan lossesFederal Reserve estimates: Adverse scenario
Capital ratios, actual 2016:Q4 and projected 2017:Q1–2019:Q1
Percent
Regulatory ratio Actual
2016:Q4
Stressed capital ratios1
Ending Minimum
Common equity tier 1 capital ratio 10.6 9.5 9.0
Tier 1 capital ratio 12.0 10.6 10.2
Total capital ratio 14.3 12.2 12.1
Tier 1 leverage ratio 10.1 8.9 8.7
Supplementary leverage ratio n/a 7.5 7.3
1 The capital ratios are calculated using capital action assumptions provided
within the Dodd-Frank Act stress testing rule. See 12 CFR 252.56(b). These
projections represent hypothetical estimates that involve an economic outcome
that is more adverse than expected. The minimum capital ratios, other than the
supplementary leverage ratio, are for the period 2017:Q1 to 2019:Q1. The
minimum supplementary leverage ratio is for the period 2018:Q1 to 2019:Q1.
Supplementary leverage ratio projections only include estimates for firms
subject to the advanced approaches.
n/a Not applicable.
Projected loan losses, by type of loan, 2017:Q1–2019:Q1
Loan type Billions of
dollars Portfolio loss
rates (percent)1
Loan losses 5.8 2.6
First-lien mortgages, domestic 0.2 0.9
Junior liens and HELOCs, domestic 0.2 1.1
Commercial and industrial2 2.9 3.8
Commercial real estate, domestic 1.1 2.8
Credit cards 0.5 9.5
Other consumer3 0.6 2.5
Other loans4 0.4 1.1
1 Average loan balances used to calculate portfolio loss rates exclude loans held
for sale and loans held for investment under the fair-value option, and are
calculated over nine quarters.2 Commercial and industrial loans include small- and medium-enterprise loans
and corporate cards.3 Other consumer loans include student loans and automobile loans.4 Other loans include international real estate loans.
Risk-weighted assets, actual 2016:Q4 and projected 2019:Q1
Billions of dollars
Item Actual 2016:Q4 Projected 2019:Q1
Risk-weighted assets1 300.5 339.0
1 For each quarter, risk-weighted assets are calculated under the Board's
standardized capital risk-based approach in 12 CFR part 217, subpart D.
Projected losses, revenue, and net income before taxes through 2019:Q1
Item Billions of
dollars Percent of
average assets1
Pre-provision net revenue2 15.7 4.0
Other revenue3 0.0
less
Provisions 5.6
Realized losses/gains on securities (AFS/HTM) 0.1
Trading and counterparty losses4 0.0
Other losses/gains5 0.3
equals
Net income before taxes 9.7 2.5
Memo items
Other comprehensive income6 -1.3
Other effects on capital Actual 2016:Q4 2019:Q1
AOCI included in capital (billions of dollars)7 -0.4 -1.8
1 Average assets is the nine-quarter average of total assets.2 Pre-provision net revenue includes losses from operational-risk events and
other real estate owned (OREO) costs.3 Other revenue includes one-time income and (expense) items not included in
pre-provision net revenue.4 Trading and counterparty losses include mark-to-market and credit valuation
adjustments (CVA) losses and losses arising from the counterparty default
scenario component applied to derivatives, securities lending, and repurchase
agreement activities.5 Other losses/gains includes projected change in fair value of loans held for sale
and loans held for investment measured under the fair-value option, and
goodwill impairment losses.6 Other comprehensive income (OCI) is only calculated for advanced approaches
BHCs, and other BHCs that opt into the advanced approaches treatment of
AOCI.7 Certain aspects of AOCI are subject to transition arrangements for inclusion in
projected regulatory capital. The transition arrangements are 80 percent
included in projected regulatory capital for 2017 and 100 percent included in
projected regulatory capital starting in 2018. See 12 CFR 217.300(b)(3).
June 2017 129

Table C.27.A. Regions Financial Corporation
Projected stressed capital ratios, risk-weighted assets, losses, revenues, net income before taxes, and loan lossesFederal Reserve estimates: Severely adverse scenario
Capital ratios, actual 2016:Q4 and projected 2017:Q1–2019:Q1
Percent
Regulatory ratio Actual
2016:Q4
Stressed capital ratios1
Ending Minimum
Common equity tier 1 capital ratio 11.2 8.2 8.2
Tier 1 capital ratio 12.0 8.9 8.9
Total capital ratio 14.2 11.0 11.0
Tier 1 leverage ratio 10.2 7.5 7.5
Supplementary leverage ratio n/a
1 The capital ratios are calculated using capital action assumptions provided
within the Dodd-Frank Act stress testing rule. See 12 CFR 252.56(b). These
projections represent hypothetical estimates that involve an economic outcome
that is more adverse than expected. The minimum capital ratios, other than the
supplementary leverage ratio, are for the period 2017:Q1 to 2019:Q1. The
minimum supplementary leverage ratio is for the period 2018:Q1 to 2019:Q1.
Supplementary leverage ratio projections only include estimates for firms
subject to the advanced approaches.
n/a Not applicable.
Projected loan losses, by type of loan, 2017:Q1–2019:Q1
Loan type Billions of
dollars Portfolio loss
rates (percent)1
Loan losses 5.1 6.1
First-lien mortgages, domestic 0.5 3.2
Junior liens and HELOCs, domestic 0.4 4.9
Commercial and industrial2 1.7 7.2
Commercial real estate, domestic 1.5 10.4
Credit cards 0.2 15.2
Other consumer3 0.4 7.1
Other loans4 0.4 2.7
1 Average loan balances used to calculate portfolio loss rates exclude loans held
for sale and loans held for investment under the fair-value option, and are
calculated over nine quarters.2 Commercial and industrial loans include small- and medium-enterprise loans
and corporate cards.3 Other consumer loans include student loans and automobile loans.4 Other loans include international real estate loans.
Risk-weighted assets, actual 2016:Q4 and projected 2019:Q1
Billions of dollars
Item Actual 2016:Q4 Projected 2019:Q1
Risk-weighted assets1 102.5 110.6
1 For each quarter, risk-weighted assets are calculated under the Board's
standardized capital risk-based approach in 12 CFR part 217, subpart D.
Projected losses, revenue, and net income before taxes through 2019:Q1
Item Billions of
dollars Percent of
average assets1
Pre-provision net revenue2 3.8 2.9
Other revenue3 0.0
less
Provisions 5.6
Realized losses/gains on securities (AFS/HTM) 0.0
Trading and counterparty losses4 0.0
Other losses/gains5 0.0
equals
Net income before taxes -1.8 -1.4
Memo items
Other comprehensive income6 0.0
Other effects on capital Actual 2016:Q4 2019:Q1
AOCI included in capital (billions of dollars)7 0.0 0.0
1 Average assets is the nine-quarter average of total assets.2 Pre-provision net revenue includes losses from operational-risk events and
other real estate owned (OREO) costs.3 Other revenue includes one-time income and (expense) items not included in
pre-provision net revenue.4 Trading and counterparty losses include mark-to-market and credit valuation
adjustments (CVA) losses and losses arising from the counterparty default
scenario component applied to derivatives, securities lending, and repurchase
agreement activities.5 Other losses/gains includes projected change in fair value of loans held for sale
and loans held for investment measured under the fair-value option, and
goodwill impairment losses.6 Other comprehensive income (OCI) is only calculated for advanced approaches
BHCs, and other BHCs that opt into the advanced approaches treatment of
AOCI.7 Certain aspects of AOCI are subject to transition arrangements for inclusion in
projected regulatory capital. The transition arrangements are 80 percent
included in projected regulatory capital for 2017 and 100 percent included in
projected regulatory capital starting in 2018. See 12 CFR 217.300(b)(3).
130 Supervisory Stress Test Methodology and Results

Table C.27.B. Regions Financial Corporation
Projected stressed capital ratios, risk-weighted assets, losses, revenues, net income before taxes, and loan lossesFederal Reserve estimates: Adverse scenario
Capital ratios, actual 2016:Q4 and projected 2017:Q1–2019:Q1
Percent
Regulatory ratio Actual
2016:Q4
Stressed capital ratios1
Ending Minimum
Common equity tier 1 capital ratio 11.2 10.1 10.1
Tier 1 capital ratio 12.0 10.8 10.8
Total capital ratio 14.2 12.6 12.6
Tier 1 leverage ratio 10.2 9.0 9.0
Supplementary leverage ratio n/a
1 The capital ratios are calculated using capital action assumptions provided
within the Dodd-Frank Act stress testing rule. See 12 CFR 252.56(b). These
projections represent hypothetical estimates that involve an economic outcome
that is more adverse than expected. The minimum capital ratios, other than the
supplementary leverage ratio, are for the period 2017:Q1 to 2019:Q1. The
minimum supplementary leverage ratio is for the period 2018:Q1 to 2019:Q1.
Supplementary leverage ratio projections only include estimates for firms
subject to the advanced approaches.
n/a Not applicable.
Projected loan losses, by type of loan, 2017:Q1–2019:Q1
Loan type Billions of
dollars Portfolio loss
rates (percent)1
Loan losses 3.3 3.9
First-lien mortgages, domestic 0.3 2.0
Junior liens and HELOCs, domestic 0.3 3.6
Commercial and industrial2 1.1 4.7
Commercial real estate, domestic 0.8 5.5
Credit cards 0.1 11.5
Other consumer3 0.4 5.6
Other loans4 0.2 1.7
1 Average loan balances used to calculate portfolio loss rates exclude loans held
for sale and loans held for investment under the fair-value option, and are
calculated over nine quarters.2 Commercial and industrial loans include small- and medium-enterprise loans
and corporate cards.3 Other consumer loans include student loans and automobile loans.4 Other loans include international real estate loans.
Risk-weighted assets, actual 2016:Q4 and projected 2019:Q1
Billions of dollars
Item Actual 2016:Q4 Projected 2019:Q1
Risk-weighted assets1 102.5 113.2
1 For each quarter, risk-weighted assets are calculated under the Board's
standardized capital risk-based approach in 12 CFR part 217, subpart D.
Projected losses, revenue, and net income before taxes through 2019:Q1
Item Billions of
dollars Percent of
average assets1
Pre-provision net revenue2 4.8 3.5
Other revenue3 0.0
less
Provisions 3.3
Realized losses/gains on securities (AFS/HTM) 0.0
Trading and counterparty losses4 0.0
Other losses/gains5 0.0
equals
Net income before taxes 1.4 1.0
Memo items
Other comprehensive income6 0.0
Other effects on capital Actual 2016:Q4 2019:Q1
AOCI included in capital (billions of dollars)7 0.0 0.0
1 Average assets is the nine-quarter average of total assets.2 Pre-provision net revenue includes losses from operational-risk events and
other real estate owned (OREO) costs.3 Other revenue includes one-time income and (expense) items not included in
pre-provision net revenue.4 Trading and counterparty losses include mark-to-market and credit valuation
adjustments (CVA) losses and losses arising from the counterparty default
scenario component applied to derivatives, securities lending, and repurchase
agreement activities.5 Other losses/gains includes projected change in fair value of loans held for sale
and loans held for investment measured under the fair-value option, and
goodwill impairment losses.6 Other comprehensive income (OCI) is only calculated for advanced approaches
BHCs, and other BHCs that opt into the advanced approaches treatment of
AOCI.7 Certain aspects of AOCI are subject to transition arrangements for inclusion in
projected regulatory capital. The transition arrangements are 80 percent
included in projected regulatory capital for 2017 and 100 percent included in
projected regulatory capital starting in 2018. See 12 CFR 217.300(b)(3).
June 2017 131

Table C.28.A. Santander Holdings USA, Inc.
Projected stressed capital ratios, risk-weighted assets, losses, revenues, net income before taxes, and loan lossesFederal Reserve estimates: Severely adverse scenario
Capital ratios, actual 2016:Q4 and projected 2017:Q1–2019:Q1
Percent
Regulatory ratio Actual
2016:Q4
Stressed capital ratios1
Ending Minimum
Common equity tier 1 capital ratio 14.5 12.4 12.4
Tier 1 capital ratio 16.1 13.6 13.6
Total capital ratio 18.0 15.3 15.3
Tier 1 leverage ratio 12.5 10.5 10.5
Supplementary leverage ratio n/a
1 The capital ratios are calculated using capital action assumptions provided
within the Dodd-Frank Act stress testing rule. See 12 CFR 252.56(b). These
projections represent hypothetical estimates that involve an economic outcome
that is more adverse than expected. The minimum capital ratios, other than the
supplementary leverage ratio, are for the period 2017:Q1 to 2019:Q1. The
minimum supplementary leverage ratio is for the period 2018:Q1 to 2019:Q1.
Supplementary leverage ratio projections only include estimates for firms
subject to the advanced approaches.
n/a Not applicable.
Projected loan losses, by type of loan, 2017:Q1–2019:Q1
Loan type Billions of
dollars Portfolio loss
rates (percent)1
Loan losses 8.1 9.1
First-lien mortgages, domestic 0.2 2.7
Junior liens and HELOCs, domestic 0.2 3.7
Commercial and industrial2 0.8 4.0
Commercial real estate, domestic 1.0 5.7
Credit cards 0.1 13.2
Other consumer3 4.9 17.5
Other loans4 0.8 10.0
1 Average loan balances used to calculate portfolio loss rates exclude loans held
for sale and loans held for investment under the fair-value option, and are
calculated over nine quarters.2 Commercial and industrial loans include small- and medium-enterprise loans
and corporate cards.3 Other consumer loans include student loans and automobile loans.4 Other loans include international real estate loans.
Risk-weighted assets, actual 2016:Q4 and projected 2019:Q1
Billions of dollars
Item Actual 2016:Q4 Projected 2019:Q1
Risk-weighted assets1 104.3 113.7
1 For each quarter, risk-weighted assets are calculated under the Board's
standardized capital risk-based approach in 12 CFR part 217, subpart D.
Projected losses, revenue, and net income before taxes through 2019:Q1
Item Billions of
dollars Percent of
average assets1
Pre-provision net revenue2 7.0 4.8
Other revenue3 0.0
less
Provisions 7.0
Realized losses/gains on securities (AFS/HTM) 0.0
Trading and counterparty losses4 0.0
Other losses/gains5 0.2
equals
Net income before taxes -0.2 -0.1
Memo items
Other comprehensive income6 0.0
Other effects on capital Actual 2016:Q4 2019:Q1
AOCI included in capital (billions of dollars)7 0.0 0.0
1 Average assets is the nine-quarter average of total assets.2 Pre-provision net revenue includes losses from operational-risk events and
other real estate owned (OREO) costs.3 Other revenue includes one-time income and (expense) items not included in
pre-provision net revenue.4 Trading and counterparty losses include mark-to-market and credit valuation
adjustments (CVA) losses and losses arising from the counterparty default
scenario component applied to derivatives, securities lending, and repurchase
agreement activities.5 Other losses/gains includes projected change in fair value of loans held for sale
and loans held for investment measured under the fair-value option, and
goodwill impairment losses.6 Other comprehensive income (OCI) is only calculated for advanced approaches
BHCs, and other BHCs that opt into the advanced approaches treatment of
AOCI.7 Certain aspects of AOCI are subject to transition arrangements for inclusion in
projected regulatory capital. The transition arrangements are 80 percent
included in projected regulatory capital for 2017 and 100 percent included in
projected regulatory capital starting in 2018. See 12 CFR 217.300(b)(3).
132 Supervisory Stress Test Methodology and Results

Table C.28.B. Santander Holdings USA, Inc.
Projected stressed capital ratios, risk-weighted assets, losses, revenues, net income before taxes, and loan lossesFederal Reserve estimates: Adverse scenario
Capital ratios, actual 2016:Q4 and projected 2017:Q1–2019:Q1
Percent
Regulatory ratio Actual
2016:Q4
Stressed capital ratios1
Ending Minimum
Common equity tier 1 capital ratio 14.5 15.9 14.3
Tier 1 capital ratio 16.1 17.3 15.9
Total capital ratio 18.0 19.0 17.8
Tier 1 leverage ratio 12.5 13.4 12.2
Supplementary leverage ratio n/a
1 The capital ratios are calculated using capital action assumptions provided
within the Dodd-Frank Act stress testing rule. See 12 CFR 252.56(b). These
projections represent hypothetical estimates that involve an economic outcome
that is more adverse than expected. The minimum capital ratios, other than the
supplementary leverage ratio, are for the period 2017:Q1 to 2019:Q1. The
minimum supplementary leverage ratio is for the period 2018:Q1 to 2019:Q1.
Supplementary leverage ratio projections only include estimates for firms
subject to the advanced approaches.
n/a Not applicable.
Projected loan losses, by type of loan, 2017:Q1–2019:Q1
Loan type Billions of
dollars Portfolio loss
rates (percent)1
Loan losses 5.6 6.2
First-lien mortgages, domestic 0.1 1.7
Junior liens and HELOCs, domestic 0.2 2.6
Commercial and industrial2 0.5 2.7
Commercial real estate, domestic 0.5 2.8
Credit cards 0.1 10.5
Other consumer3 3.6 12.6
Other loans4 0.6 6.7
1 Average loan balances used to calculate portfolio loss rates exclude loans held
for sale and loans held for investment under the fair-value option, and are
calculated over nine quarters.2 Commercial and industrial loans include small- and medium-enterprise loans
and corporate cards.3 Other consumer loans include student loans and automobile loans.4 Other loans include international real estate loans.
Risk-weighted assets, actual 2016:Q4 and projected 2019:Q1
Billions of dollars
Item Actual 2016:Q4 Projected 2019:Q1
Risk-weighted assets1 104.3 117.7
1 For each quarter, risk-weighted assets are calculated under the Board's
standardized capital risk-based approach in 12 CFR part 217, subpart D.
Projected losses, revenue, and net income before taxes through 2019:Q1
Item Billions of
dollars Percent of
average assets1
Pre-provision net revenue2 8.0 5.4
Other revenue3 0.0
less
Provisions 3.8
Realized losses/gains on securities (AFS/HTM) 0.0
Trading and counterparty losses4 0.0
Other losses/gains5 0.1
equals
Net income before taxes 4.1 2.8
Memo items
Other comprehensive income6 0.0
Other effects on capital Actual 2016:Q4 2019:Q1
AOCI included in capital (billions of dollars)7 0.0 0.0
1 Average assets is the nine-quarter average of total assets.2 Pre-provision net revenue includes losses from operational-risk events and
other real estate owned (OREO) costs.3 Other revenue includes one-time income and (expense) items not included in
pre-provision net revenue.4 Trading and counterparty losses include mark-to-market and credit valuation
adjustments (CVA) losses and losses arising from the counterparty default
scenario component applied to derivatives, securities lending, and repurchase
agreement activities.5 Other losses/gains includes projected change in fair value of loans held for sale
and loans held for investment measured under the fair-value option, and
goodwill impairment losses.6 Other comprehensive income (OCI) is only calculated for advanced approaches
BHCs, and other BHCs that opt into the advanced approaches treatment of
AOCI.7 Certain aspects of AOCI are subject to transition arrangements for inclusion in
projected regulatory capital. The transition arrangements are 80 percent
included in projected regulatory capital for 2017 and 100 percent included in
projected regulatory capital starting in 2018. See 12 CFR 217.300(b)(3).
June 2017 133

Table C.29.A. State Street Corporation
Projected stressed capital ratios, risk-weighted assets, losses, revenues, net income before taxes, and loan lossesFederal Reserve estimates: Severely adverse scenario
Capital ratios, actual 2016:Q4 and projected 2017:Q1–2019:Q1
Percent
Regulatory ratio Actual
2016:Q4
Stressed capital ratios1
Ending Minimum
Common equity tier 1 capital ratio 11.6 8.7 7.4
Tier 1 capital ratio 14.7 11.6 10.4
Total capital ratio 16.0 12.6 11.5
Tier 1 leverage ratio 6.5 5.1 4.6
Supplementary leverage ratio n/a 4.6 4.2
1 The capital ratios are calculated using capital action assumptions provided
within the Dodd-Frank Act stress testing rule. See 12 CFR 252.56(b). These
projections represent hypothetical estimates that involve an economic outcome
that is more adverse than expected. The minimum capital ratios, other than the
supplementary leverage ratio, are for the period 2017:Q1 to 2019:Q1. The
minimum supplementary leverage ratio is for the period 2018:Q1 to 2019:Q1.
Supplementary leverage ratio projections only include estimates for firms
subject to the advanced approaches.
n/a Not applicable.
Projected loan losses, by type of loan, 2017:Q1–2019:Q1
Loan type Billions of
dollars Portfolio loss
rates (percent)1
Loan losses 0.6 3.1
First-lien mortgages, domestic 0.0 0.0
Junior liens and HELOCs, domestic 0.0 0.0
Commercial and industrial2 0.2 6.2
Commercial real estate, domestic 0.0 6.6
Credit cards 0.0 0.0
Other consumer3 0.0 0.6
Other loans4 0.4 2.5
1 Average loan balances used to calculate portfolio loss rates exclude loans held
for sale and loans held for investment under the fair-value option, and are
calculated over nine quarters.2 Commercial and industrial loans include small- and medium-enterprise loans
and corporate cards.3 Other consumer loans include student loans and automobile loans.4 Other loans include international real estate loans.
Risk-weighted assets, actual 2016:Q4 and projected 2019:Q1
Billions of dollars
Item Actual 2016:Q4 Projected 2019:Q1
Risk-weighted assets1 99.9 106.9
1 For each quarter, risk-weighted assets are calculated under the Board's
standardized capital risk-based approach in 12 CFR part 217, subpart D.
Projected losses, revenue, and net income before taxes through 2019:Q1
Item Billions of
dollars Percent of
average assets1
Pre-provision net revenue2 4.2 1.6
Other revenue3 0.0
less
Provisions 0.8
Realized losses/gains on securities (AFS/HTM) 0.4
Trading and counterparty losses4 0.9
Other losses/gains5 0.0
equals
Net income before taxes 2.1 0.8
Memo items
Other comprehensive income6 -1.0
Other effects on capital Actual 2016:Q4 2019:Q1
AOCI included in capital (billions of dollars)7 -1.9 -3.0
1 Average assets is the nine-quarter average of total assets.2 Pre-provision net revenue includes losses from operational-risk events and
other real estate owned (OREO) costs.3 Other revenue includes one-time income and (expense) items not included in
pre-provision net revenue.4 Trading and counterparty losses include mark-to-market and credit valuation
adjustments (CVA) losses and losses arising from the counterparty default
scenario component applied to derivatives, securities lending, and repurchase
agreement activities.5 Other losses/gains includes projected change in fair value of loans held for sale
and loans held for investment measured under the fair-value option, and
goodwill impairment losses.6 Other comprehensive income (OCI) is only calculated for advanced approaches
BHCs, and other BHCs that opt into the advanced approaches treatment of
AOCI.7 Certain aspects of AOCI are subject to transition arrangements for inclusion in
projected regulatory capital. The transition arrangements are 80 percent
included in projected regulatory capital for 2017 and 100 percent included in
projected regulatory capital starting in 2018. See 12 CFR 217.300(b)(3).
134 Supervisory Stress Test Methodology and Results

Table C.29.B. State Street Corporation
Projected stressed capital ratios, risk-weighted assets, losses, revenues, net income before taxes, and loan lossesFederal Reserve estimates: Adverse scenario
Capital ratios, actual 2016:Q4 and projected 2017:Q1–2019:Q1
Percent
Regulatory ratio Actual
2016:Q4
Stressed capital ratios1
Ending Minimum
Common equity tier 1 capital ratio 11.6 9.9 8.6
Tier 1 capital ratio 14.7 12.8 11.6
Total capital ratio 16.0 13.7 12.7
Tier 1 leverage ratio 6.5 5.5 5.1
Supplementary leverage ratio n/a 5.0 4.6
1 The capital ratios are calculated using capital action assumptions provided
within the Dodd-Frank Act stress testing rule. See 12 CFR 252.56(b). These
projections represent hypothetical estimates that involve an economic outcome
that is more adverse than expected. The minimum capital ratios, other than the
supplementary leverage ratio, are for the period 2017:Q1 to 2019:Q1. The
minimum supplementary leverage ratio is for the period 2018:Q1 to 2019:Q1.
Supplementary leverage ratio projections only include estimates for firms
subject to the advanced approaches.
n/a Not applicable.
Projected loan losses, by type of loan, 2017:Q1–2019:Q1
Loan type Billions of
dollars Portfolio loss
rates (percent)1
Loan losses 0.4 2.1
First-lien mortgages, domestic 0.0 0.0
Junior liens and HELOCs, domestic 0.0 0.0
Commercial and industrial2 0.1 3.7
Commercial real estate, domestic 0.0 2.9
Credit cards 0.0 0.0
Other consumer3 0.0 0.6
Other loans4 0.3 1.8
1 Average loan balances used to calculate portfolio loss rates exclude loans held
for sale and loans held for investment under the fair-value option, and are
calculated over nine quarters.2 Commercial and industrial loans include small- and medium-enterprise loans
and corporate cards.3 Other consumer loans include student loans and automobile loans.4 Other loans include international real estate loans.
Risk-weighted assets, actual 2016:Q4 and projected 2019:Q1
Billions of dollars
Item Actual 2016:Q4 Projected 2019:Q1
Risk-weighted assets1 99.9 109.4
1 For each quarter, risk-weighted assets are calculated under the Board's
standardized capital risk-based approach in 12 CFR part 217, subpart D.
Projected losses, revenue, and net income before taxes through 2019:Q1
Item Billions of
dollars Percent of
average assets1
Pre-provision net revenue2 6.1 2.3
Other revenue3 0.0
less
Provisions 0.5
Realized losses/gains on securities (AFS/HTM) 0.2
Trading and counterparty losses4 0.5
Other losses/gains5 0.0
equals
Net income before taxes 4.8 1.9
Memo items
Other comprehensive income6 -1.2
Other effects on capital Actual 2016:Q4 2019:Q1
AOCI included in capital (billions of dollars)7 -1.9 -3.3
1 Average assets is the nine-quarter average of total assets.2 Pre-provision net revenue includes losses from operational-risk events and
other real estate owned (OREO) costs.3 Other revenue includes one-time income and (expense) items not included in
pre-provision net revenue.4 Trading and counterparty losses include mark-to-market and credit valuation
adjustments (CVA) losses and losses arising from the counterparty default
scenario component applied to derivatives, securities lending, and repurchase
agreement activities.5 Other losses/gains includes projected change in fair value of loans held for sale
and loans held for investment measured under the fair-value option, and
goodwill impairment losses.6 Other comprehensive income (OCI) is only calculated for advanced approaches
BHCs, and other BHCs that opt into the advanced approaches treatment of
AOCI.7 Certain aspects of AOCI are subject to transition arrangements for inclusion in
projected regulatory capital. The transition arrangements are 80 percent
included in projected regulatory capital for 2017 and 100 percent included in
projected regulatory capital starting in 2018. See 12 CFR 217.300(b)(3).
June 2017 135

Table C.30.A. SunTrust Banks, Inc.
Projected stressed capital ratios, risk-weighted assets, losses, revenues, net income before taxes, and loan lossesFederal Reserve estimates: Severely adverse scenario
Capital ratios, actual 2016:Q4 and projected 2017:Q1–2019:Q1
Percent
Regulatory ratio Actual
2016:Q4
Stressed capital ratios1
Ending Minimum
Common equity tier 1 capital ratio 9.6 7.1 7.1
Tier 1 capital ratio 10.3 7.7 7.7
Total capital ratio 12.3 9.8 9.8
Tier 1 leverage ratio 9.2 7.0 7.0
Supplementary leverage ratio n/a
1 The capital ratios are calculated using capital action assumptions provided
within the Dodd-Frank Act stress testing rule. See 12 CFR 252.56(b). These
projections represent hypothetical estimates that involve an economic outcome
that is more adverse than expected. The minimum capital ratios, other than the
supplementary leverage ratio, are for the period 2017:Q1 to 2019:Q1. The
minimum supplementary leverage ratio is for the period 2018:Q1 to 2019:Q1.
Supplementary leverage ratio projections only include estimates for firms
subject to the advanced approaches.
n/a Not applicable.
Projected loan losses, by type of loan, 2017:Q1–2019:Q1
Loan type Billions of
dollars Portfolio loss
rates (percent)1
Loan losses 6.7 4.5
First-lien mortgages, domestic 0.8 2.9
Junior liens and HELOCs, domestic 0.5 4.4
Commercial and industrial2 2.2 4.7
Commercial real estate, domestic 1.3 6.9
Credit cards 0.2 14.1
Other consumer3 1.3 4.9
Other loans4 0.3 2.1
1 Average loan balances used to calculate portfolio loss rates exclude loans held
for sale and loans held for investment under the fair-value option, and are
calculated over nine quarters.2 Commercial and industrial loans include small- and medium-enterprise loans
and corporate cards.3 Other consumer loans include student loans and automobile loans.4 Other loans include international real estate loans.
Risk-weighted assets, actual 2016:Q4 and projected 2019:Q1
Billions of dollars
Item Actual 2016:Q4 Projected 2019:Q1
Risk-weighted assets1 176.8 194.5
1 For each quarter, risk-weighted assets are calculated under the Board's
standardized capital risk-based approach in 12 CFR part 217, subpart D.
Projected losses, revenue, and net income before taxes through 2019:Q1
Item Billions of
dollars Percent of
average assets1
Pre-provision net revenue2 5.7 2.6
Other revenue3 0.0
less
Provisions 7.4
Realized losses/gains on securities (AFS/HTM) 0.0
Trading and counterparty losses4 0.0
Other losses/gains5 1.1
equals
Net income before taxes -2.8 -1.3
Memo items
Other comprehensive income6 0.0
Other effects on capital Actual 2016:Q4 2019:Q1
AOCI included in capital (billions of dollars)7 0.0 0.0
1 Average assets is the nine-quarter average of total assets.2 Pre-provision net revenue includes losses from operational-risk events and
other real estate owned (OREO) costs.3 Other revenue includes one-time income and (expense) items not included in
pre-provision net revenue.4 Trading and counterparty losses include mark-to-market and credit valuation
adjustments (CVA) losses and losses arising from the counterparty default
scenario component applied to derivatives, securities lending, and repurchase
agreement activities.5 Other losses/gains includes projected change in fair value of loans held for sale
and loans held for investment measured under the fair-value option, and
goodwill impairment losses.6 Other comprehensive income (OCI) is only calculated for advanced approaches
BHCs, and other BHCs that opt into the advanced approaches treatment of
AOCI.7 Certain aspects of AOCI are subject to transition arrangements for inclusion in
projected regulatory capital. The transition arrangements are 80 percent
included in projected regulatory capital for 2017 and 100 percent included in
projected regulatory capital starting in 2018. See 12 CFR 217.300(b)(3).
136 Supervisory Stress Test Methodology and Results

Table C.30.B. SunTrust Banks, Inc.
Projected stressed capital ratios, risk-weighted assets, losses, revenues, net income before taxes, and loan lossesFederal Reserve estimates: Adverse scenario
Capital ratios, actual 2016:Q4 and projected 2017:Q1–2019:Q1
Percent
Regulatory ratio Actual
2016:Q4
Stressed capital ratios1
Ending Minimum
Common equity tier 1 capital ratio 9.6 8.6 8.5
Tier 1 capital ratio 10.3 9.2 9.1
Total capital ratio 12.3 10.9 10.9
Tier 1 leverage ratio 9.2 8.2 8.2
Supplementary leverage ratio n/a
1 The capital ratios are calculated using capital action assumptions provided
within the Dodd-Frank Act stress testing rule. See 12 CFR 252.56(b). These
projections represent hypothetical estimates that involve an economic outcome
that is more adverse than expected. The minimum capital ratios, other than the
supplementary leverage ratio, are for the period 2017:Q1 to 2019:Q1. The
minimum supplementary leverage ratio is for the period 2018:Q1 to 2019:Q1.
Supplementary leverage ratio projections only include estimates for firms
subject to the advanced approaches.
n/a Not applicable.
Projected loan losses, by type of loan, 2017:Q1–2019:Q1
Loan type Billions of
dollars Portfolio loss
rates (percent)1
Loan losses 4.2 2.8
First-lien mortgages, domestic 0.5 1.7
Junior liens and HELOCs, domestic 0.4 3.1
Commercial and industrial2 1.4 2.9
Commercial real estate, domestic 0.6 3.3
Credit cards 0.2 10.5
Other consumer3 1.0 3.7
Other loans4 0.2 1.3
1 Average loan balances used to calculate portfolio loss rates exclude loans held
for sale and loans held for investment under the fair-value option, and are
calculated over nine quarters.2 Commercial and industrial loans include small- and medium-enterprise loans
and corporate cards.3 Other consumer loans include student loans and automobile loans.4 Other loans include international real estate loans.
Risk-weighted assets, actual 2016:Q4 and projected 2019:Q1
Billions of dollars
Item Actual 2016:Q4 Projected 2019:Q1
Risk-weighted assets1 176.8 199.2
1 For each quarter, risk-weighted assets are calculated under the Board's
standardized capital risk-based approach in 12 CFR part 217, subpart D.
Projected losses, revenue, and net income before taxes through 2019:Q1
Item Billions of
dollars Percent of
average assets1
Pre-provision net revenue2 7.8 3.6
Other revenue3 0.0
less
Provisions 4.3
Realized losses/gains on securities (AFS/HTM) 0.0
Trading and counterparty losses4 0.0
Other losses/gains5 0.8
equals
Net income before taxes 2.7 1.2
Memo items
Other comprehensive income6 0.0
Other effects on capital Actual 2016:Q4 2019:Q1
AOCI included in capital (billions of dollars)7 0.0 0.0
1 Average assets is the nine-quarter average of total assets.2 Pre-provision net revenue includes losses from operational-risk events and
other real estate owned (OREO) costs.3 Other revenue includes one-time income and (expense) items not included in
pre-provision net revenue.4 Trading and counterparty losses include mark-to-market and credit valuation
adjustments (CVA) losses and losses arising from the counterparty default
scenario component applied to derivatives, securities lending, and repurchase
agreement activities.5 Other losses/gains includes projected change in fair value of loans held for sale
and loans held for investment measured under the fair-value option, and
goodwill impairment losses.6 Other comprehensive income (OCI) is only calculated for advanced approaches
BHCs, and other BHCs that opt into the advanced approaches treatment of
AOCI.7 Certain aspects of AOCI are subject to transition arrangements for inclusion in
projected regulatory capital. The transition arrangements are 80 percent
included in projected regulatory capital for 2017 and 100 percent included in
projected regulatory capital starting in 2018. See 12 CFR 217.300(b)(3).
June 2017 137

Table C.31.A. TD Group US Holdings LLC
Projected stressed capital ratios, risk-weighted assets, losses, revenues, net income before taxes, and loan lossesFederal Reserve estimates: Severely adverse scenario
Capital ratios, actual 2016:Q4 and projected 2017:Q1–2019:Q1
Percent
Regulatory ratio Actual
2016:Q4
Stressed capital ratios1
Ending Minimum
Common equity tier 1 capital ratio 13.6 11.9 11.3
Tier 1 capital ratio 13.7 11.9 11.3
Total capital ratio 14.8 13.1 12.7
Tier 1 leverage ratio 7.8 6.6 6.4
Supplementary leverage ratio n/a 6.0 5.8
1 The capital ratios are calculated using capital action assumptions provided
within the Dodd-Frank Act stress testing rule. See 12 CFR 252.56(b). These
projections represent hypothetical estimates that involve an economic outcome
that is more adverse than expected. The minimum capital ratios, other than the
supplementary leverage ratio, are for the period 2017:Q1 to 2019:Q1. The
minimum supplementary leverage ratio is for the period 2018:Q1 to 2019:Q1.
Supplementary leverage ratio projections only include estimates for firms
subject to the advanced approaches.
n/a Not applicable.
Projected loan losses, by type of loan, 2017:Q1–2019:Q1
Loan type Billions of
dollars Portfolio loss
rates (percent)1
Loan losses 8.8 5.5
First-lien mortgages, domestic 0.7 2.7
Junior liens and HELOCs, domestic 0.5 5.1
Commercial and industrial2 2.1 5.8
Commercial real estate, domestic 1.8 6.7
Credit cards 2.3 18.9
Other consumer3 0.6 2.5
Other loans4 0.8 3.2
1 Average loan balances used to calculate portfolio loss rates exclude loans held
for sale and loans held for investment under the fair-value option, and are
calculated over nine quarters.2 Commercial and industrial loans include small- and medium-enterprise loans
and corporate cards.3 Other consumer loans include student loans and automobile loans.4 Other loans include international real estate loans.
Risk-weighted assets, actual 2016:Q4 and projected 2019:Q1
Billions of dollars
Item Actual 2016:Q4 Projected 2019:Q1
Risk-weighted assets1 188.7 218.4
1 For each quarter, risk-weighted assets are calculated under the Board's
standardized capital risk-based approach in 12 CFR part 217, subpart D.
Projected losses, revenue, and net income before taxes through 2019:Q1
Item Billions of
dollars Percent of
average assets1
Pre-provision net revenue2 6.7 1.7
Other revenue3 0.0
less
Provisions 9.5
Realized losses/gains on securities (AFS/HTM) 0.0
Trading and counterparty losses4 0.0
Other losses/gains5 0.0
equals
Net income before taxes -2.8 -0.7
Memo items
Other comprehensive income6 -0.8
Other effects on capital Actual 2016:Q4 2019:Q1
AOCI included in capital (billions of dollars)7 0.0 -0.8
1 Average assets is the nine-quarter average of total assets.2 Pre-provision net revenue includes losses from operational-risk events and
other real estate owned (OREO) costs.3 Other revenue includes one-time income and (expense) items not included in
pre-provision net revenue.4 Trading and counterparty losses include mark-to-market and credit valuation
adjustments (CVA) losses and losses arising from the counterparty default
scenario component applied to derivatives, securities lending, and repurchase
agreement activities.5 Other losses/gains includes projected change in fair value of loans held for sale
and loans held for investment measured under the fair-value option, and
goodwill impairment losses.6 Other comprehensive income (OCI) is only calculated for advanced approaches
BHCs, and other BHCs that opt into the advanced approaches treatment of
AOCI.7 Certain aspects of AOCI are subject to transition arrangements for inclusion in
projected regulatory capital. The transition arrangements are 80 percent
included in projected regulatory capital for 2017 and 100 percent included in
projected regulatory capital starting in 2018. See 12 CFR 217.300(b)(3).
138 Supervisory Stress Test Methodology and Results

Table C.31.B. TD Group US Holdings LLC
Projected stressed capital ratios, risk-weighted assets, losses, revenues, net income before taxes, and loan lossesFederal Reserve estimates: Adverse scenario
Capital ratios, actual 2016:Q4 and projected 2017:Q1–2019:Q1
Percent
Regulatory ratio Actual
2016:Q4
Stressed capital ratios1
Ending Minimum
Common equity tier 1 capital ratio 13.6 13.9 13.2
Tier 1 capital ratio 13.7 13.9 13.2
Total capital ratio 14.8 14.8 14.3
Tier 1 leverage ratio 7.8 7.6 7.4
Supplementary leverage ratio n/a 7.0 6.8
1 The capital ratios are calculated using capital action assumptions provided
within the Dodd-Frank Act stress testing rule. See 12 CFR 252.56(b). These
projections represent hypothetical estimates that involve an economic outcome
that is more adverse than expected. The minimum capital ratios, other than the
supplementary leverage ratio, are for the period 2017:Q1 to 2019:Q1. The
minimum supplementary leverage ratio is for the period 2018:Q1 to 2019:Q1.
Supplementary leverage ratio projections only include estimates for firms
subject to the advanced approaches.
n/a Not applicable.
Projected loan losses, by type of loan, 2017:Q1–2019:Q1
Loan type Billions of
dollars Portfolio loss
rates (percent)1
Loan losses 5.9 3.6
First-lien mortgages, domestic 0.5 1.8
Junior liens and HELOCs, domestic 0.4 3.9
Commercial and industrial2 1.3 3.7
Commercial real estate, domestic 0.9 3.3
Credit cards 1.8 15.2
Other consumer3 0.4 1.7
Other loans4 0.5 2.0
1 Average loan balances used to calculate portfolio loss rates exclude loans held
for sale and loans held for investment under the fair-value option, and are
calculated over nine quarters.2 Commercial and industrial loans include small- and medium-enterprise loans
and corporate cards.3 Other consumer loans include student loans and automobile loans.4 Other loans include international real estate loans.
Risk-weighted assets, actual 2016:Q4 and projected 2019:Q1
Billions of dollars
Item Actual 2016:Q4 Projected 2019:Q1
Risk-weighted assets1 188.7 223.8
1 For each quarter, risk-weighted assets are calculated under the Board's
standardized capital risk-based approach in 12 CFR part 217, subpart D.
Projected losses, revenue, and net income before taxes through 2019:Q1
Item Billions of
dollars Percent of
average assets1
Pre-provision net revenue2 9.0 2.3
Other revenue3 0.0
less
Provisions 5.9
Realized losses/gains on securities (AFS/HTM) 0.0
Trading and counterparty losses4 0.0
Other losses/gains5 0.0
equals
Net income before taxes 3.1 0.8
Memo items
Other comprehensive income6 -0.7
Other effects on capital Actual 2016:Q4 2019:Q1
AOCI included in capital (billions of dollars)7 0.0 -0.7
1 Average assets is the nine-quarter average of total assets.2 Pre-provision net revenue includes losses from operational-risk events and
other real estate owned (OREO) costs.3 Other revenue includes one-time income and (expense) items not included in
pre-provision net revenue.4 Trading and counterparty losses include mark-to-market and credit valuation
adjustments (CVA) losses and losses arising from the counterparty default
scenario component applied to derivatives, securities lending, and repurchase
agreement activities.5 Other losses/gains includes projected change in fair value of loans held for sale
and loans held for investment measured under the fair-value option, and
goodwill impairment losses.6 Other comprehensive income (OCI) is only calculated for advanced approaches
BHCs, and other BHCs that opt into the advanced approaches treatment of
AOCI.7 Certain aspects of AOCI are subject to transition arrangements for inclusion in
projected regulatory capital. The transition arrangements are 80 percent
included in projected regulatory capital for 2017 and 100 percent included in
projected regulatory capital starting in 2018. See 12 CFR 217.300(b)(3).
June 2017 139

Table C.32.A. U.S. Bancorp
Projected stressed capital ratios, risk-weighted assets, losses, revenues, net income before taxes, and loan lossesFederal Reserve estimates: Severely adverse scenario
Capital ratios, actual 2016:Q4 and projected 2017:Q1–2019:Q1
Percent
Regulatory ratio Actual
2016:Q4
Stressed capital ratios1
Ending Minimum
Common equity tier 1 capital ratio 9.4 7.6 7.6
Tier 1 capital ratio 11.0 9.0 9.0
Total capital ratio 13.2 11.0 11.0
Tier 1 leverage ratio 9.0 7.4 7.4
Supplementary leverage ratio n/a 6.0 6.0
1 The capital ratios are calculated using capital action assumptions provided
within the Dodd-Frank Act stress testing rule. See 12 CFR 252.56(b). These
projections represent hypothetical estimates that involve an economic outcome
that is more adverse than expected. The minimum capital ratios, other than the
supplementary leverage ratio, are for the period 2017:Q1 to 2019:Q1. The
minimum supplementary leverage ratio is for the period 2018:Q1 to 2019:Q1.
Supplementary leverage ratio projections only include estimates for firms
subject to the advanced approaches.
n/a Not applicable.
Projected loan losses, by type of loan, 2017:Q1–2019:Q1
Loan type Billions of
dollars Portfolio loss
rates (percent)1
Loan losses 17.9 6.3
First-lien mortgages, domestic 1.0 1.7
Junior liens and HELOCs, domestic 0.8 4.6
Commercial and industrial2 5.9 7.9
Commercial real estate, domestic 4.0 9.7
Credit cards 3.4 15.2
Other consumer3 1.4 3.6
Other loans4 1.3 4.9
1 Average loan balances used to calculate portfolio loss rates exclude loans held
for sale and loans held for investment under the fair-value option, and are
calculated over nine quarters.2 Commercial and industrial loans include small- and medium-enterprise loans
and corporate cards.3 Other consumer loans include student loans and automobile loans.4 Other loans include international real estate loans.
Risk-weighted assets, actual 2016:Q4 and projected 2019:Q1
Billions of dollars
Item Actual 2016:Q4 Projected 2019:Q1
Risk-weighted assets1 358.2 392.5
1 For each quarter, risk-weighted assets are calculated under the Board's
standardized capital risk-based approach in 12 CFR part 217, subpart D.
Projected losses, revenue, and net income before taxes through 2019:Q1
Item Billions of
dollars Percent of
average assets1
Pre-provision net revenue2 20.8 4.4
Other revenue3 0.0
less
Provisions 19.4
Realized losses/gains on securities (AFS/HTM) 0.1
Trading and counterparty losses4 0.0
Other losses/gains5 0.0
equals
Net income before taxes 1.3 0.3
Memo items
Other comprehensive income6 1.1
Other effects on capital Actual 2016:Q4 2019:Q1
AOCI included in capital (billions of dollars)7 -1.0 -0.5
1 Average assets is the nine-quarter average of total assets.2 Pre-provision net revenue includes losses from operational-risk events and
other real estate owned (OREO) costs.3 Other revenue includes one-time income and (expense) items not included in
pre-provision net revenue.4 Trading and counterparty losses include mark-to-market and credit valuation
adjustments (CVA) losses and losses arising from the counterparty default
scenario component applied to derivatives, securities lending, and repurchase
agreement activities.5 Other losses/gains includes projected change in fair value of loans held for sale
and loans held for investment measured under the fair-value option, and
goodwill impairment losses.6 Other comprehensive income (OCI) is only calculated for advanced approaches
BHCs, and other BHCs that opt into the advanced approaches treatment of
AOCI.7 Certain aspects of AOCI are subject to transition arrangements for inclusion in
projected regulatory capital. The transition arrangements are 80 percent
included in projected regulatory capital for 2017 and 100 percent included in
projected regulatory capital starting in 2018. See 12 CFR 217.300(b)(3).
140 Supervisory Stress Test Methodology and Results

Table C.32.B. U.S. Bancorp
Projected stressed capital ratios, risk-weighted assets, losses, revenues, net income before taxes, and loan lossesFederal Reserve estimates: Adverse scenario
Capital ratios, actual 2016:Q4 and projected 2017:Q1–2019:Q1
Percent
Regulatory ratio Actual
2016:Q4
Stressed capital ratios1
Ending Minimum
Common equity tier 1 capital ratio 9.4 9.0 8.7
Tier 1 capital ratio 11.0 10.4 10.1
Total capital ratio 13.2 12.1 12.0
Tier 1 leverage ratio 9.0 8.4 8.3
Supplementary leverage ratio n/a 6.8 6.7
1 The capital ratios are calculated using capital action assumptions provided
within the Dodd-Frank Act stress testing rule. See 12 CFR 252.56(b). These
projections represent hypothetical estimates that involve an economic outcome
that is more adverse than expected. The minimum capital ratios, other than the
supplementary leverage ratio, are for the period 2017:Q1 to 2019:Q1. The
minimum supplementary leverage ratio is for the period 2018:Q1 to 2019:Q1.
Supplementary leverage ratio projections only include estimates for firms
subject to the advanced approaches.
n/a Not applicable.
Projected loan losses, by type of loan, 2017:Q1–2019:Q1
Loan type Billions of
dollars Portfolio loss
rates (percent)1
Loan losses 11.6 4.0
First-lien mortgages, domestic 0.5 0.9
Junior liens and HELOCs, domestic 0.5 3.0
Commercial and industrial2 4.0 5.3
Commercial real estate, domestic 1.9 4.7
Credit cards 2.7 11.9
Other consumer3 1.0 2.6
Other loans4 0.8 3.2
1 Average loan balances used to calculate portfolio loss rates exclude loans held
for sale and loans held for investment under the fair-value option, and are
calculated over nine quarters.2 Commercial and industrial loans include small- and medium-enterprise loans
and corporate cards.3 Other consumer loans include student loans and automobile loans.4 Other loans include international real estate loans.
Risk-weighted assets, actual 2016:Q4 and projected 2019:Q1
Billions of dollars
Item Actual 2016:Q4 Projected 2019:Q1
Risk-weighted assets1 358.2 402.7
1 For each quarter, risk-weighted assets are calculated under the Board's
standardized capital risk-based approach in 12 CFR part 217, subpart D.
Projected losses, revenue, and net income before taxes through 2019:Q1
Item Billions of
dollars Percent of
average assets1
Pre-provision net revenue2 25.1 5.2
Other revenue3 0.0
less
Provisions 11.8
Realized losses/gains on securities (AFS/HTM) 0.0
Trading and counterparty losses4 0.0
Other losses/gains5 0.0
equals
Net income before taxes 13.3 2.8
Memo items
Other comprehensive income6 -0.2
Other effects on capital Actual 2016:Q4 2019:Q1
AOCI included in capital (billions of dollars)7 -1.0 -1.8
1 Average assets is the nine-quarter average of total assets.2 Pre-provision net revenue includes losses from operational-risk events and
other real estate owned (OREO) costs.3 Other revenue includes one-time income and (expense) items not included in
pre-provision net revenue.4 Trading and counterparty losses include mark-to-market and credit valuation
adjustments (CVA) losses and losses arising from the counterparty default
scenario component applied to derivatives, securities lending, and repurchase
agreement activities.5 Other losses/gains includes projected change in fair value of loans held for sale
and loans held for investment measured under the fair-value option, and
goodwill impairment losses.6 Other comprehensive income (OCI) is only calculated for advanced approaches
BHCs, and other BHCs that opt into the advanced approaches treatment of
AOCI.7 Certain aspects of AOCI are subject to transition arrangements for inclusion in
projected regulatory capital. The transition arrangements are 80 percent
included in projected regulatory capital for 2017 and 100 percent included in
projected regulatory capital starting in 2018. See 12 CFR 217.300(b)(3).
June 2017 141

Table C.33.A. Wells Fargo & Company
Projected stressed capital ratios, risk-weighted assets, losses, revenues, net income before taxes, and loan lossesFederal Reserve estimates: Severely adverse scenario
Capital ratios, actual 2016:Q4 and projected 2017:Q1–2019:Q1
Percent
Regulatory ratio Actual
2016:Q4
Stressed capital ratios1
Ending Minimum
Common equity tier 1 capital ratio 11.1 8.8 8.6
Tier 1 capital ratio 12.8 10.4 10.2
Total capital ratio 16.1 13.4 13.4
Tier 1 leverage ratio 8.9 7.2 7.2
Supplementary leverage ratio n/a 6.2 6.1
1 The capital ratios are calculated using capital action assumptions provided
within the Dodd-Frank Act stress testing rule. See 12 CFR 252.56(b). These
projections represent hypothetical estimates that involve an economic outcome
that is more adverse than expected. The minimum capital ratios, other than the
supplementary leverage ratio, are for the period 2017:Q1 to 2019:Q1. The
minimum supplementary leverage ratio is for the period 2018:Q1 to 2019:Q1.
Supplementary leverage ratio projections only include estimates for firms
subject to the advanced approaches.
n/a Not applicable.
Projected loan losses, by type of loan, 2017:Q1–2019:Q1
Loan type Billions of
dollars Portfolio loss
rates (percent)1
Loan losses 50.4 5.0
First-lien mortgages, domestic 4.9 1.8
Junior liens and HELOCs, domestic 2.8 4.3
Commercial and industrial2 12.4 6.4
Commercial real estate, domestic 11.4 7.7
Credit cards 5.9 15.3
Other consumer3 6.8 6.9
Other loans4 6.4 3.4
1 Average loan balances used to calculate portfolio loss rates exclude loans held
for sale and loans held for investment under the fair-value option, and are
calculated over nine quarters.2 Commercial and industrial loans include small- and medium-enterprise loans
and corporate cards.3 Other consumer loans include student loans and automobile loans.4 Other loans include international real estate loans.
Risk-weighted assets, actual 2016:Q4 and projected 2019:Q1
Billions of dollars
Item Actual 2016:Q4 Projected 2019:Q1
Risk-weighted assets1 1,336.2 1,456.4
1 For each quarter, risk-weighted assets are calculated under the Board's
standardized capital risk-based approach in 12 CFR part 217, subpart D.
Projected losses, revenue, and net income before taxes through 2019:Q1
Item Billions of
dollars Percent of
average assets1
Pre-provision net revenue2 71.2 3.5
Other revenue3 0.0
less
Provisions 55.9
Realized losses/gains on securities (AFS/HTM) 1.6
Trading and counterparty losses4 7.7
Other losses/gains5 1.1
equals
Net income before taxes 4.8 0.2
Memo items
Other comprehensive income6 -3.5
Other effects on capital Actual 2016:Q4 2019:Q1
AOCI included in capital (billions of dollars)7 -2.0 -6.8
1 Average assets is the nine-quarter average of total assets.2 Pre-provision net revenue includes losses from operational-risk events and
other real estate owned (OREO) costs.3 Other revenue includes one-time income and (expense) items not included in
pre-provision net revenue.4 Trading and counterparty losses include mark-to-market and credit valuation
adjustments (CVA) losses and losses arising from the counterparty default
scenario component applied to derivatives, securities lending, and repurchase
agreement activities.5 Other losses/gains includes projected change in fair value of loans held for sale
and loans held for investment measured under the fair-value option, and
goodwill impairment losses.6 Other comprehensive income (OCI) is only calculated for advanced approaches
BHCs, and other BHCs that opt into the advanced approaches treatment of
AOCI.7 Certain aspects of AOCI are subject to transition arrangements for inclusion in
projected regulatory capital. The transition arrangements are 80 percent
included in projected regulatory capital for 2017 and 100 percent included in
projected regulatory capital starting in 2018. See 12 CFR 217.300(b)(3).
142 Supervisory Stress Test Methodology and Results

Table C.33.B. Wells Fargo & Company
Projected stressed capital ratios, risk-weighted assets, losses, revenues, net income before taxes, and loan lossesFederal Reserve estimates: Adverse scenario
Capital ratios, actual 2016:Q4 and projected 2017:Q1–2019:Q1
Percent
Regulatory ratio Actual
2016:Q4
Stressed capital ratios1
Ending Minimum
Common equity tier 1 capital ratio 11.1 10.5 9.9
Tier 1 capital ratio 12.8 12.0 11.4
Total capital ratio 16.1 14.7 14.5
Tier 1 leverage ratio 8.9 8.3 8.0
Supplementary leverage ratio n/a 7.1 6.8
1 The capital ratios are calculated using capital action assumptions provided
within the Dodd-Frank Act stress testing rule. See 12 CFR 252.56(b). These
projections represent hypothetical estimates that involve an economic outcome
that is more adverse than expected. The minimum capital ratios, other than the
supplementary leverage ratio, are for the period 2017:Q1 to 2019:Q1. The
minimum supplementary leverage ratio is for the period 2018:Q1 to 2019:Q1.
Supplementary leverage ratio projections only include estimates for firms
subject to the advanced approaches.
n/a Not applicable.
Projected loan losses, by type of loan, 2017:Q1–2019:Q1
Loan type Billions of
dollars Portfolio loss
rates (percent)1
Loan losses 31.1 3.1
First-lien mortgages, domestic 2.2 0.8
Junior liens and HELOCs, domestic 1.5 2.3
Commercial and industrial2 8.3 4.2
Commercial real estate, domestic 5.3 3.5
Credit cards 4.7 12.0
Other consumer3 5.2 5.2
Other loans4 3.9 2.1
1 Average loan balances used to calculate portfolio loss rates exclude loans held
for sale and loans held for investment under the fair-value option, and are
calculated over nine quarters.2 Commercial and industrial loans include small- and medium-enterprise loans
and corporate cards.3 Other consumer loans include student loans and automobile loans.4 Other loans include international real estate loans.
Risk-weighted assets, actual 2016:Q4 and projected 2019:Q1
Billions of dollars
Item Actual 2016:Q4 Projected 2019:Q1
Risk-weighted assets1 1,336.2 1,491.0
1 For each quarter, risk-weighted assets are calculated under the Board's
standardized capital risk-based approach in 12 CFR part 217, subpart D.
Projected losses, revenue, and net income before taxes through 2019:Q1
Item Billions of
dollars Percent of
average assets1
Pre-provision net revenue2 90.4 4.4
Other revenue3 0.0
less
Provisions 31.7
Realized losses/gains on securities (AFS/HTM) 0.7
Trading and counterparty losses4 3.4
Other losses/gains5 0.9
equals
Net income before taxes 53.8 2.6
Memo items
Other comprehensive income6 -6.9
Other effects on capital Actual 2016:Q4 2019:Q1
AOCI included in capital (billions of dollars)7 -2.0 -10.1
1 Average assets is the nine-quarter average of total assets.2 Pre-provision net revenue includes losses from operational-risk events and
other real estate owned (OREO) costs.3 Other revenue includes one-time income and (expense) items not included in
pre-provision net revenue.4 Trading and counterparty losses include mark-to-market and credit valuation
adjustments (CVA) losses and losses arising from the counterparty default
scenario component applied to derivatives, securities lending, and repurchase
agreement activities.5 Other losses/gains includes projected change in fair value of loans held for sale
and loans held for investment measured under the fair-value option, and
goodwill impairment losses.6 Other comprehensive income (OCI) is only calculated for advanced approaches
BHCs, and other BHCs that opt into the advanced approaches treatment of
AOCI.7 Certain aspects of AOCI are subject to transition arrangements for inclusion in
projected regulatory capital. The transition arrangements are 80 percent
included in projected regulatory capital for 2017 and 100 percent included in
projected regulatory capital starting in 2018. See 12 CFR 217.300(b)(3).
June 2017 143

Table C.34.A. Zions Bancorporation
Projected stressed capital ratios, risk-weighted assets, losses, revenues, net income before taxes, and loan lossesFederal Reserve estimates: Severely adverse scenario
Capital ratios, actual 2016:Q4 and projected 2017:Q1–2019:Q1
Percent
Regulatory ratio Actual
2016:Q4
Stressed capital ratios1
Ending Minimum
Common equity tier 1 capital ratio 12.1 8.5 8.5
Tier 1 capital ratio 13.5 9.9 9.9
Total capital ratio 15.2 11.5 11.5
Tier 1 leverage ratio 11.1 8.1 8.1
Supplementary leverage ratio n/a
1 The capital ratios are calculated using capital action assumptions provided
within the Dodd-Frank Act stress testing rule. See 12 CFR 252.56(b). These
projections represent hypothetical estimates that involve an economic outcome
that is more adverse than expected. The minimum capital ratios, other than the
supplementary leverage ratio, are for the period 2017:Q1 to 2019:Q1. The
minimum supplementary leverage ratio is for the period 2018:Q1 to 2019:Q1.
Supplementary leverage ratio projections only include estimates for firms
subject to the advanced approaches.
n/a Not applicable.
Projected loan losses, by type of loan, 2017:Q1–2019:Q1
Loan type Billions of
dollars Portfolio loss
rates (percent)1
Loan losses 2.9 6.4
First-lien mortgages, domestic 0.0 0.6
Junior liens and HELOCs, domestic 0.1 2.6
Commercial and industrial2 1.0 8.6
Commercial real estate, domestic 1.4 7.3
Credit cards 0.0 13.5
Other consumer3 0.0 9.5
Other loans4 0.2 7.5
1 Average loan balances used to calculate portfolio loss rates exclude loans held
for sale and loans held for investment under the fair-value option, and are
calculated over nine quarters.2 Commercial and industrial loans include small- and medium-enterprise loans
and corporate cards.3 Other consumer loans include student loans and automobile loans.4 Other loans include international real estate loans.
Risk-weighted assets, actual 2016:Q4 and projected 2019:Q1
Billions of dollars
Item Actual 2016:Q4 Projected 2019:Q1
Risk-weighted assets1 49.9 54.4
1 For each quarter, risk-weighted assets are calculated under the Board's
standardized capital risk-based approach in 12 CFR part 217, subpart D.
Projected losses, revenue, and net income before taxes through 2019:Q1
Item Billions of
dollars Percent of
average assets1
Pre-provision net revenue2 1.7 2.5
Other revenue3 0.0
less
Provisions 3.0
Realized losses/gains on securities (AFS/HTM) 0.0
Trading and counterparty losses4 0.0
Other losses/gains5 0.0
equals
Net income before taxes -1.4 -2.1
Memo items
Other comprehensive income6 0.0
Other effects on capital Actual 2016:Q4 2019:Q1
AOCI included in capital (billions of dollars)7 0.0 0.0
1 Average assets is the nine-quarter average of total assets.2 Pre-provision net revenue includes losses from operational-risk events and
other real estate owned (OREO) costs.3 Other revenue includes one-time income and (expense) items not included in
pre-provision net revenue.4 Trading and counterparty losses include mark-to-market and credit valuation
adjustments (CVA) losses and losses arising from the counterparty default
scenario component applied to derivatives, securities lending, and repurchase
agreement activities.5 Other losses/gains includes projected change in fair value of loans held for sale
and loans held for investment measured under the fair-value option, and
goodwill impairment losses.6 Other comprehensive income (OCI) is only calculated for advanced approaches
BHCs, and other BHCs that opt into the advanced approaches treatment of
AOCI.7 Certain aspects of AOCI are subject to transition arrangements for inclusion in
projected regulatory capital. The transition arrangements are 80 percent
included in projected regulatory capital for 2017 and 100 percent included in
projected regulatory capital starting in 2018. See 12 CFR 217.300(b)(3).
144 Supervisory Stress Test Methodology and Results
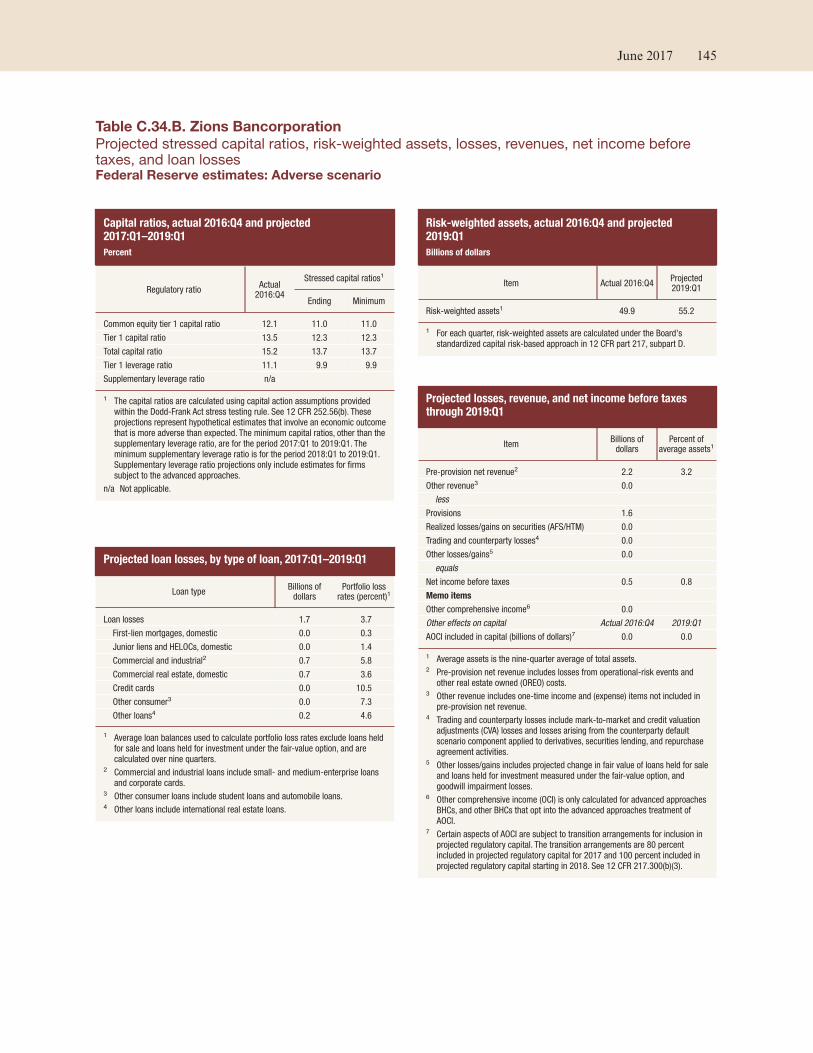
Table C.34.B. Zions Bancorporation
Projected stressed capital ratios, risk-weighted assets, losses, revenues, net income before taxes, and loan lossesFederal Reserve estimates: Adverse scenario
Capital ratios, actual 2016:Q4 and projected 2017:Q1–2019:Q1
Percent
Regulatory ratio Actual
2016:Q4
Stressed capital ratios1
Ending Minimum
Common equity tier 1 capital ratio 12.1 11.0 11.0
Tier 1 capital ratio 13.5 12.3 12.3
Total capital ratio 15.2 13.7 13.7
Tier 1 leverage ratio 11.1 9.9 9.9
Supplementary leverage ratio n/a
1 The capital ratios are calculated using capital action assumptions provided
within the Dodd-Frank Act stress testing rule. See 12 CFR 252.56(b). These
projections represent hypothetical estimates that involve an economic outcome
that is more adverse than expected. The minimum capital ratios, other than the
supplementary leverage ratio, are for the period 2017:Q1 to 2019:Q1. The
minimum supplementary leverage ratio is for the period 2018:Q1 to 2019:Q1.
Supplementary leverage ratio projections only include estimates for firms
subject to the advanced approaches.
n/a Not applicable.
Projected loan losses, by type of loan, 2017:Q1–2019:Q1
Loan type Billions of
dollars Portfolio loss
rates (percent)1
Loan losses 1.7 3.7
First-lien mortgages, domestic 0.0 0.3
Junior liens and HELOCs, domestic 0.0 1.4
Commercial and industrial2 0.7 5.8
Commercial real estate, domestic 0.7 3.6
Credit cards 0.0 10.5
Other consumer3 0.0 7.3
Other loans4 0.2 4.6
1 Average loan balances used to calculate portfolio loss rates exclude loans held
for sale and loans held for investment under the fair-value option, and are
calculated over nine quarters.2 Commercial and industrial loans include small- and medium-enterprise loans
and corporate cards.3 Other consumer loans include student loans and automobile loans.4 Other loans include international real estate loans.
Risk-weighted assets, actual 2016:Q4 and projected 2019:Q1
Billions of dollars
Item Actual 2016:Q4 Projected 2019:Q1
Risk-weighted assets1 49.9 55.2
1 For each quarter, risk-weighted assets are calculated under the Board's
standardized capital risk-based approach in 12 CFR part 217, subpart D.
Projected losses, revenue, and net income before taxes through 2019:Q1
Item Billions of
dollars Percent of
average assets1
Pre-provision net revenue2 2.2 3.2
Other revenue3 0.0
less
Provisions 1.6
Realized losses/gains on securities (AFS/HTM) 0.0
Trading and counterparty losses4 0.0
Other losses/gains5 0.0
equals
Net income before taxes 0.5 0.8
Memo items
Other comprehensive income6 0.0
Other effects on capital Actual 2016:Q4 2019:Q1
AOCI included in capital (billions of dollars)7 0.0 0.0
1 Average assets is the nine-quarter average of total assets.2 Pre-provision net revenue includes losses from operational-risk events and
other real estate owned (OREO) costs.3 Other revenue includes one-time income and (expense) items not included in
pre-provision net revenue.4 Trading and counterparty losses include mark-to-market and credit valuation
adjustments (CVA) losses and losses arising from the counterparty default
scenario component applied to derivatives, securities lending, and repurchase
agreement activities.5 Other losses/gains includes projected change in fair value of loans held for sale
and loans held for investment measured under the fair-value option, and
goodwill impairment losses.6 Other comprehensive income (OCI) is only calculated for advanced approaches
BHCs, and other BHCs that opt into the advanced approaches treatment of
AOCI.7 Certain aspects of AOCI are subject to transition arrangements for inclusion in
projected regulatory capital. The transition arrangements are 80 percent
included in projected regulatory capital for 2017 and 100 percent included in
projected regulatory capital starting in 2018. See 12 CFR 217.300(b)(3).
June 2017 145

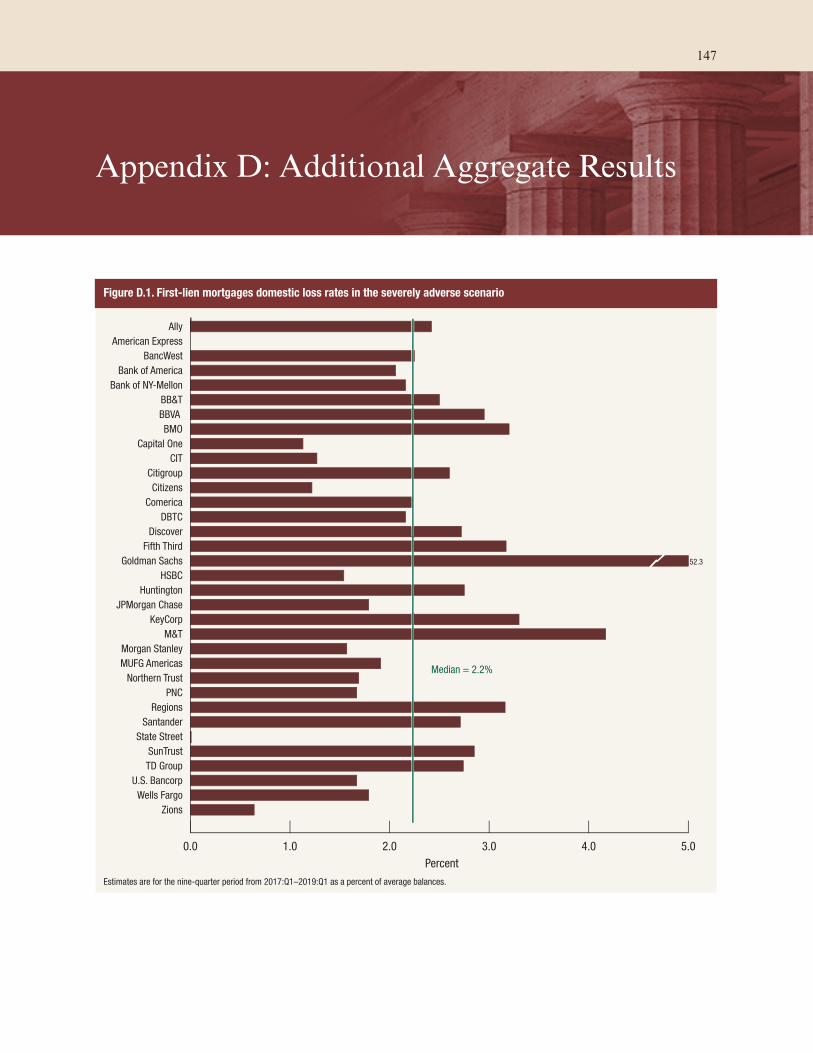
Appendix D: Additional Aggregate Results
Figure D.1. First-lien mortgages domestic loss rates in the severely adverse scenario
0.0 1.0 2.0 3.0 4.0 5.0
Zions
Wells Fargo
U.S. Bancorp
TD Group
SunTrust
State Street
Santander
Regions
PNC
Northern Trust
MUFG Americas
Morgan Stanley
M&T
KeyCorp
JPMorgan Chase
Huntington
HSBC
Goldman Sachs
Fifth Third
Discover
DBTC
Comerica
Citizens
Citigroup
CIT
Capital One
BMO
BBVA
BB&T
Bank of NY-Mellon
Bank of America
BancWest
American Express
Ally
Percent
Median = 2.2%
52.3
Estimates are for the nine-quarter period from 2017:Q1–2019:Q1 as a percent of average balances.
147
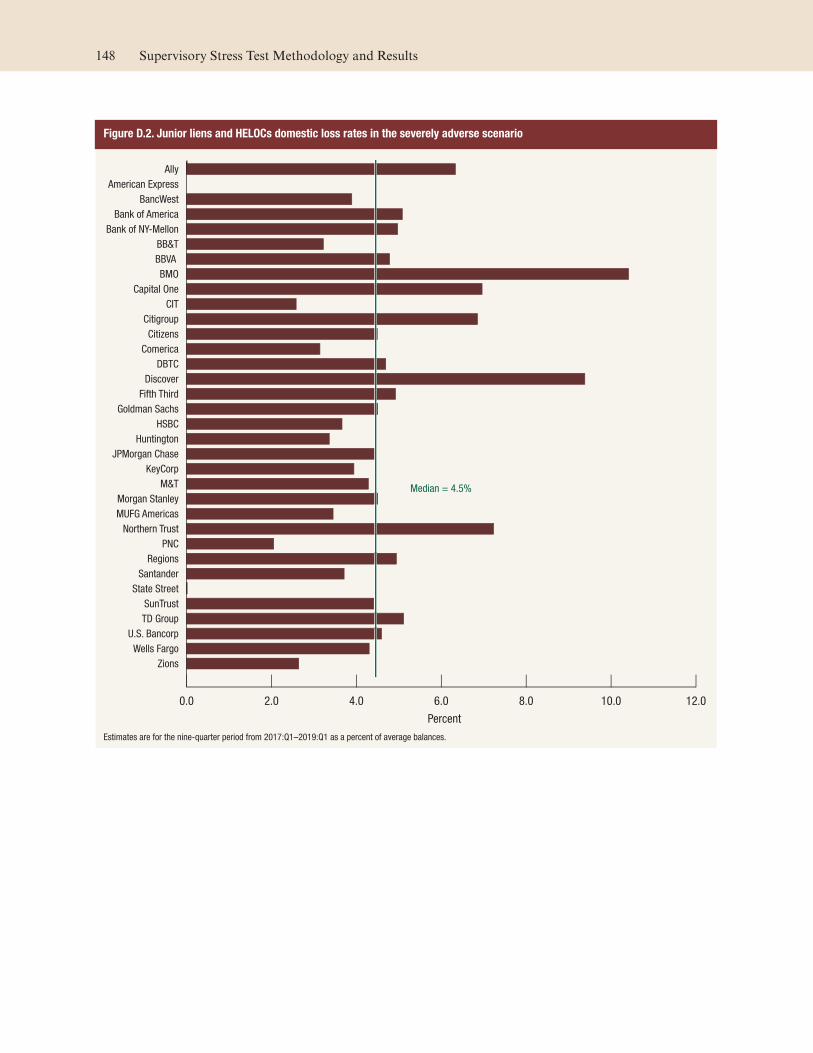
Figure D.2. Junior liens and HELOCs domestic loss rates in the severely adverse scenario
0.0 2.0 4.0 6.0 8.0 10.0 12.0
Zions
Wells Fargo
U.S. Bancorp
TD Group
SunTrust
State Street
Santander
Regions
PNC
Northern Trust
MUFG Americas
Morgan Stanley
M&T
KeyCorp
JPMorgan Chase
Huntington
HSBC
Goldman Sachs
Fifth Third
Discover
DBTC
Comerica
Citizens
Citigroup
CIT
Capital One
BMO
BBVA
BB&T
Bank of NY-Mellon
Bank of America
BancWest
American Express
Ally
Percent
Median = 4.5%
Estimates are for the nine-quarter period from 2017:Q1–2019:Q1 as a percent of average balances.
148 Supervisory Stress Test Methodology and Results
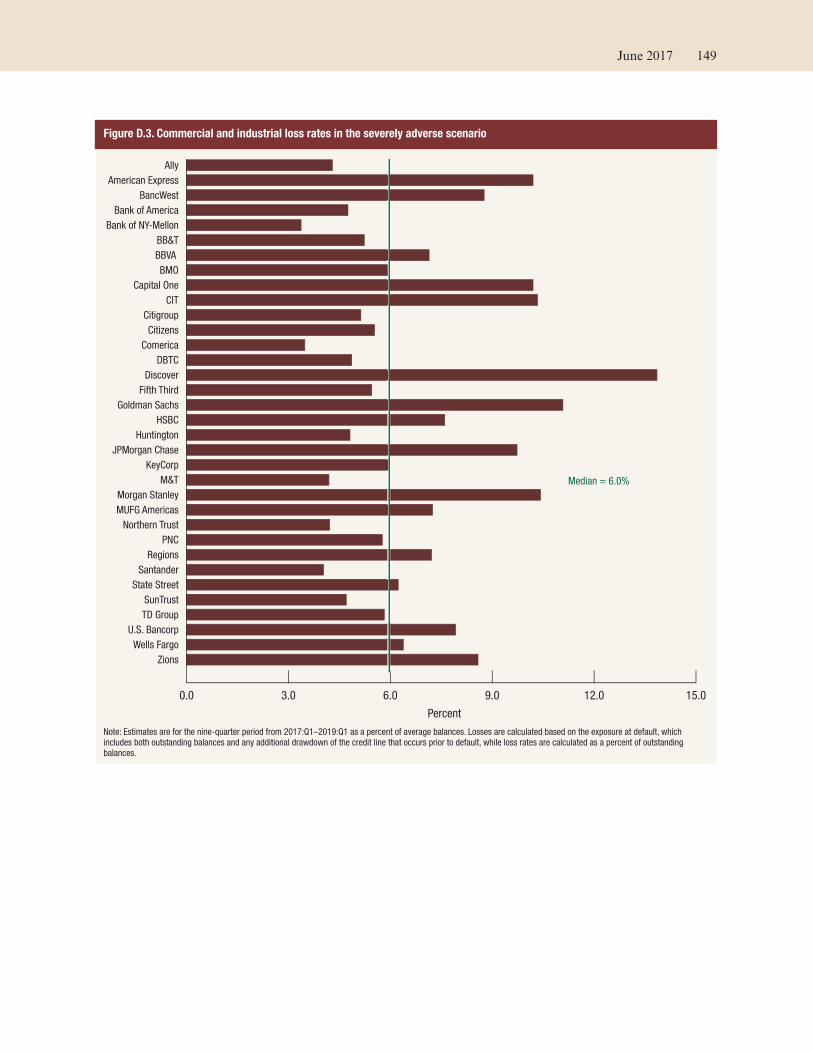
Figure D.3. Commercial and industrial loss rates in the severely adverse scenario
0.0 3.0 6.0 9.0 12.0 15.0
Zions
Wells Fargo
U.S. Bancorp
TD Group
SunTrust
State Street
Santander
Regions
PNC
Northern Trust
MUFG Americas
Morgan Stanley
M&T
KeyCorp
JPMorgan Chase
Huntington
HSBC
Goldman Sachs
Fifth Third
Discover
DBTC
Comerica
Citizens
Citigroup
CIT
Capital One
BMO
BBVA
BB&T
Bank of NY-Mellon
Bank of America
BancWest
American Express
Ally
Percent
Median = 6.0%
Note: Estimates are for the nine-quarter period from 2017:Q1–2019:Q1 as a percent of average balances. Losses are calculated based on the exposure at default, which
includes both outstanding balances and any additional drawdown of the credit line that occurs prior to default, while loss rates are calculated as a percent of outstanding
balances.
June 2017 149
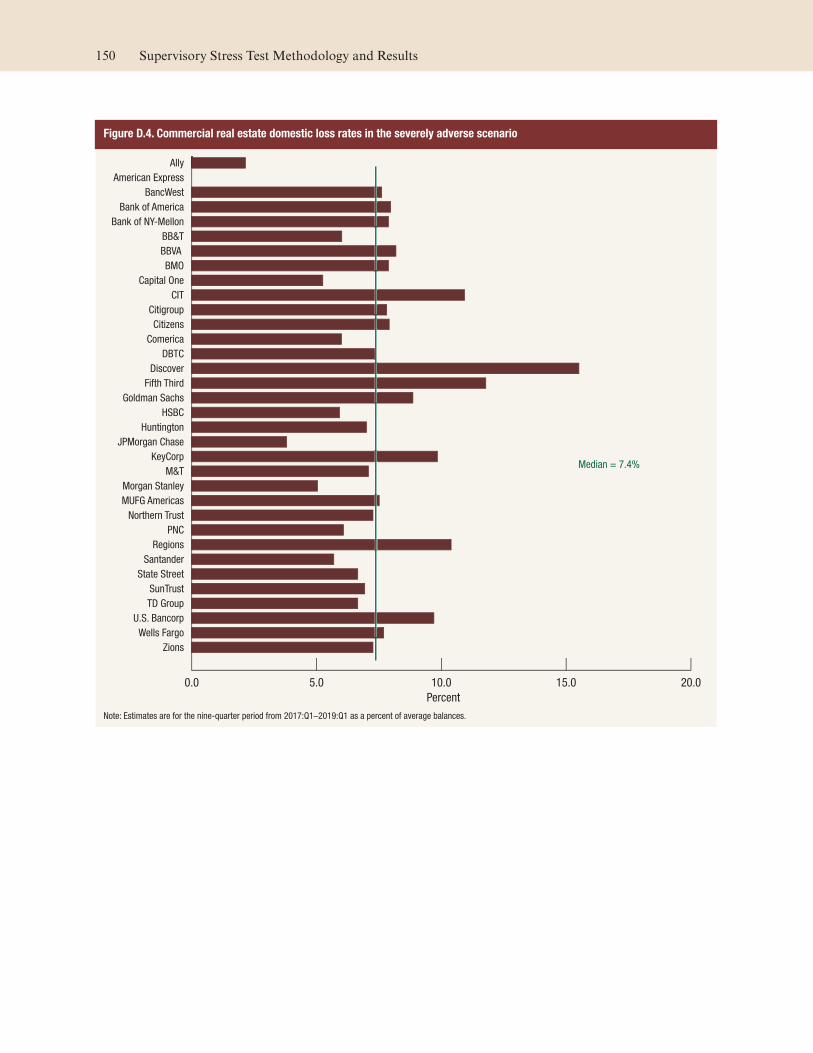
Figure D.4. Commercial real estate domestic loss rates in the severely adverse scenario
0.0 5.0 10.0 15.0 20.0
Zions
Wells Fargo
U.S. Bancorp
TD Group
SunTrust
State Street
Santander
Regions
PNC
Northern Trust
MUFG Americas
Morgan Stanley
M&T
KeyCorp
JPMorgan Chase
Huntington
HSBC
Goldman Sachs
Fifth Third
Discover
DBTC
Comerica
Citizens
Citigroup
CIT
Capital One
BMO
BBVA
BB&T
Bank of NY-Mellon
Bank of America
BancWest
American Express
Ally
Percent
Median = 7.4%
Note: Estimates are for the nine-quarter period from 2017:Q1–2019:Q1 as a percent of average balances.
150 Supervisory Stress Test Methodology and Results
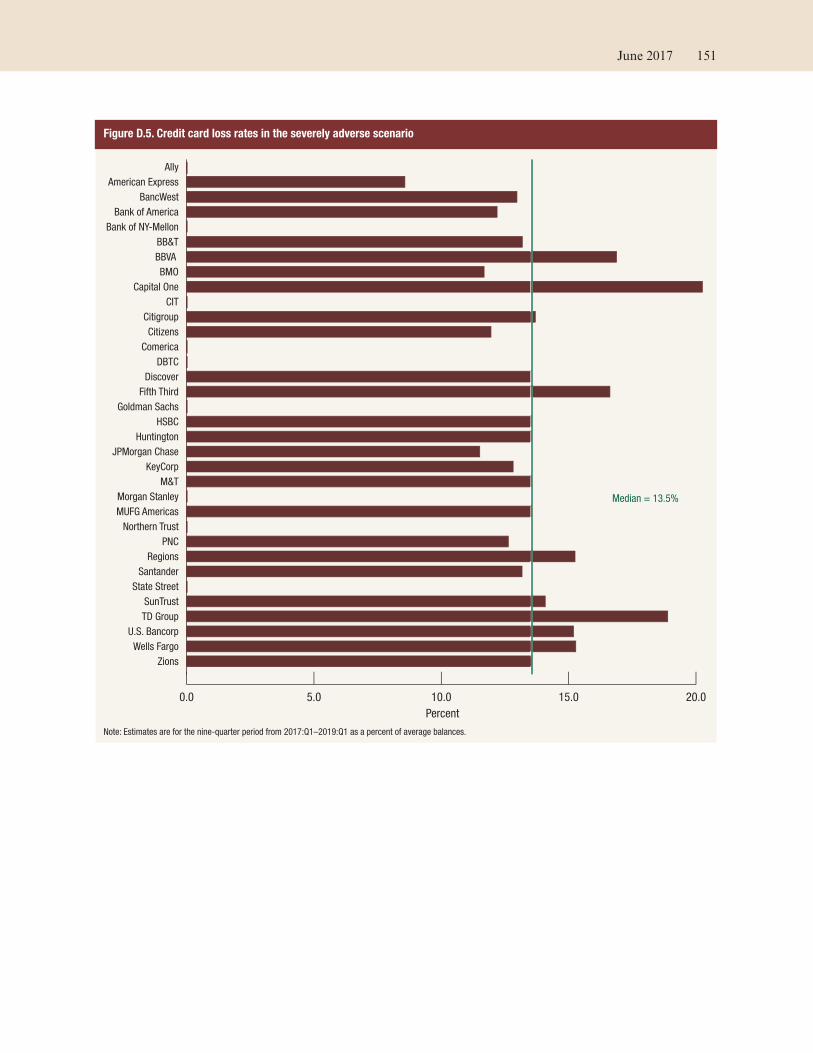
Figure D.5. Credit card loss rates in the severely adverse scenario
0.0 5.0 10.0 15.0 20.0
Zions
Wells Fargo
U.S. Bancorp
TD Group
SunTrust
State Street
Santander
Regions
PNC
Northern Trust
MUFG Americas
Morgan Stanley
M&T
KeyCorp
JPMorgan Chase
Huntington
HSBC
Goldman Sachs
Fifth Third
Discover
DBTC
Comerica
Citizens
Citigroup
CIT
Capital One
BMO
BBVA
BB&T
Bank of NY-Mellon
Bank of America
BancWest
American Express
Ally
Percent
Median = 13.5%
Note: Estimates are for the nine-quarter period from 2017:Q1–2019:Q1 as a percent of average balances.
June 2017 151
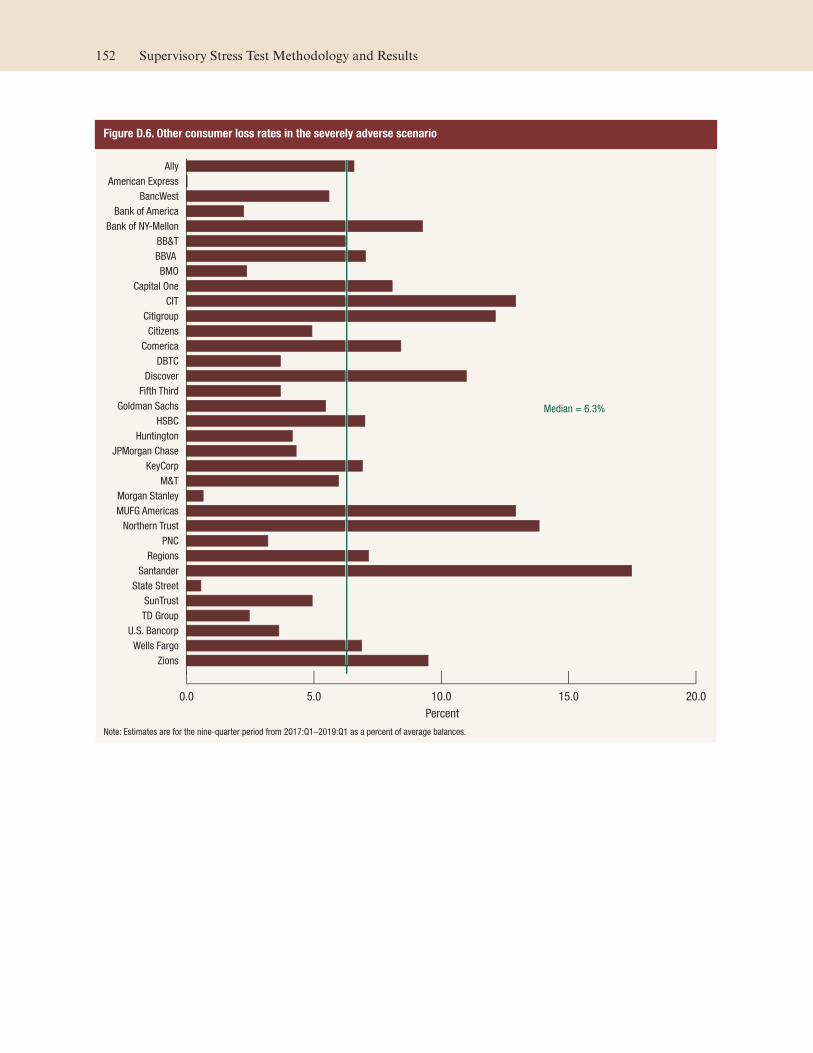
Figure D.6. Other consumer loss rates in the severely adverse scenario
0.0 5.0 10.0 15.0 20.0
Zions
Wells Fargo
U.S. Bancorp
TD Group
SunTrust
State Street
Santander
Regions
PNC
Northern Trust
MUFG Americas
Morgan Stanley
M&T
KeyCorp
JPMorgan Chase
Huntington
HSBC
Goldman Sachs
Fifth Third
Discover
DBTC
Comerica
Citizens
Citigroup
CIT
Capital One
BMO
BBVA
BB&T
Bank of NY-Mellon
Bank of America
BancWest
American Express
Ally
Percent
Median = 6.3%
Note: Estimates are for the nine-quarter period from 2017:Q1–2019:Q1 as a percent of average balances.
152 Supervisory Stress Test Methodology and Results
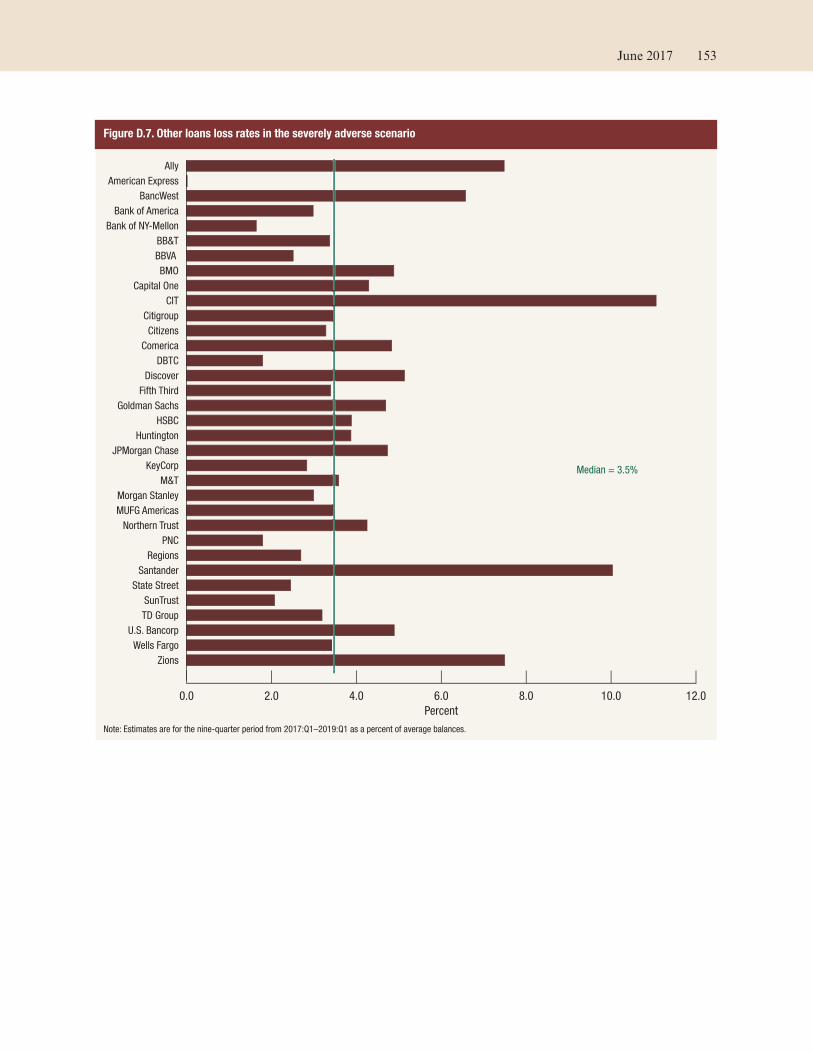
Figure D.7. Other loans loss rates in the severely adverse scenario
0.0 2.0 4.0 6.0 8.0 10.0 12.0
Zions
Wells Fargo
U.S. Bancorp
TD Group
SunTrust
State Street
Santander
Regions
PNC
Northern Trust
MUFG Americas
Morgan Stanley
M&T
KeyCorp
JPMorgan Chase
Huntington
HSBC
Goldman Sachs
Fifth Third
Discover
DBTC
Comerica
Citizens
Citigroup
CIT
Capital One
BMO
BBVA
BB&T
Bank of NY-Mellon
Bank of America
BancWest
American Express
Ally
Percent
Median = 3.5%
Note: Estimates are for the nine-quarter period from 2017:Q1–2019:Q1 as a percent of average balances.
June 2017 153
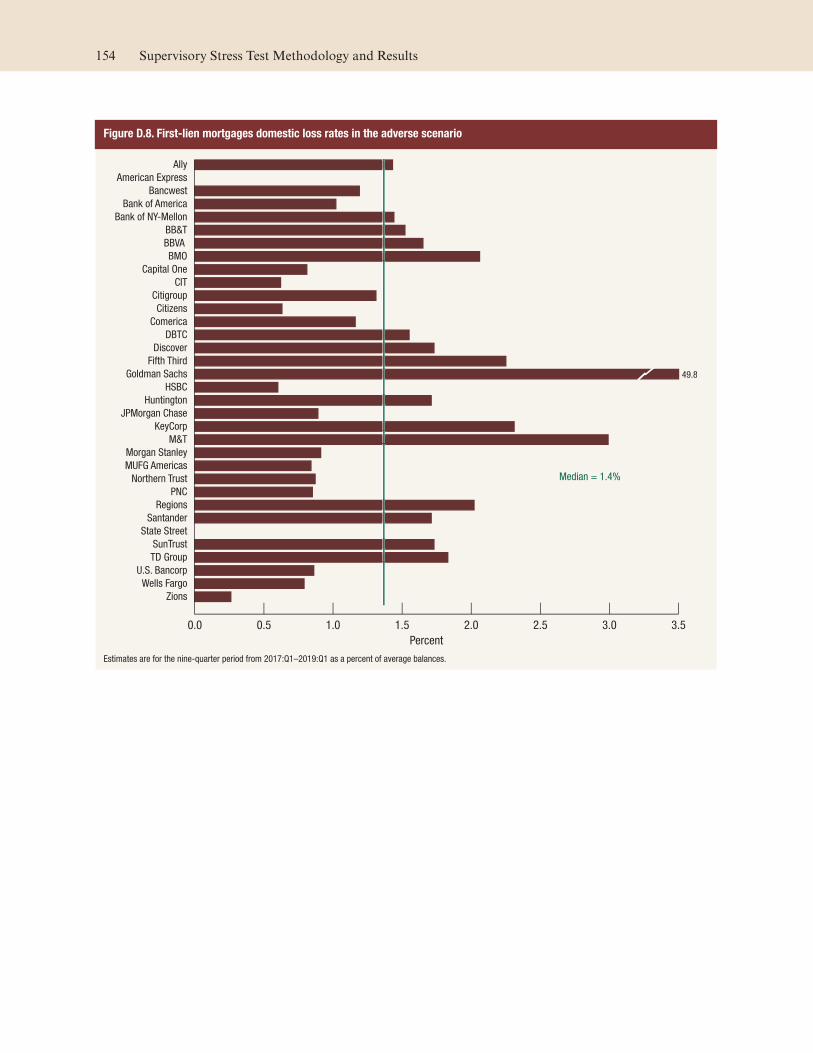
Figure D.8. First-lien mortgages domestic loss rates in the adverse scenario
Percent
Median = 1.4%
0.0 0.5 1.0 1.5 2.0 2.5 3.0 3.5
Zions
Wells Fargo
U.S. Bancorp
TD Group
SunTrust
State Street
Santander
Regions
PNC
Northern Trust
MUFG Americas
Morgan Stanley
M&T
KeyCorp
JPMorgan Chase
Huntington
HSBC
Goldman Sachs
Fifth Third
Discover
DBTC
Comerica
Citizens
Citigroup
CIT
Capital One
BMO
BBVA
BB&T
Bank of NY-Mellon
Bank of America
Bancwest
American Express
Ally
49.8
Estimates are for the nine-quarter period from 2017:Q1–2019:Q1 as a percent of average balances.
154 Supervisory Stress Test Methodology and Results
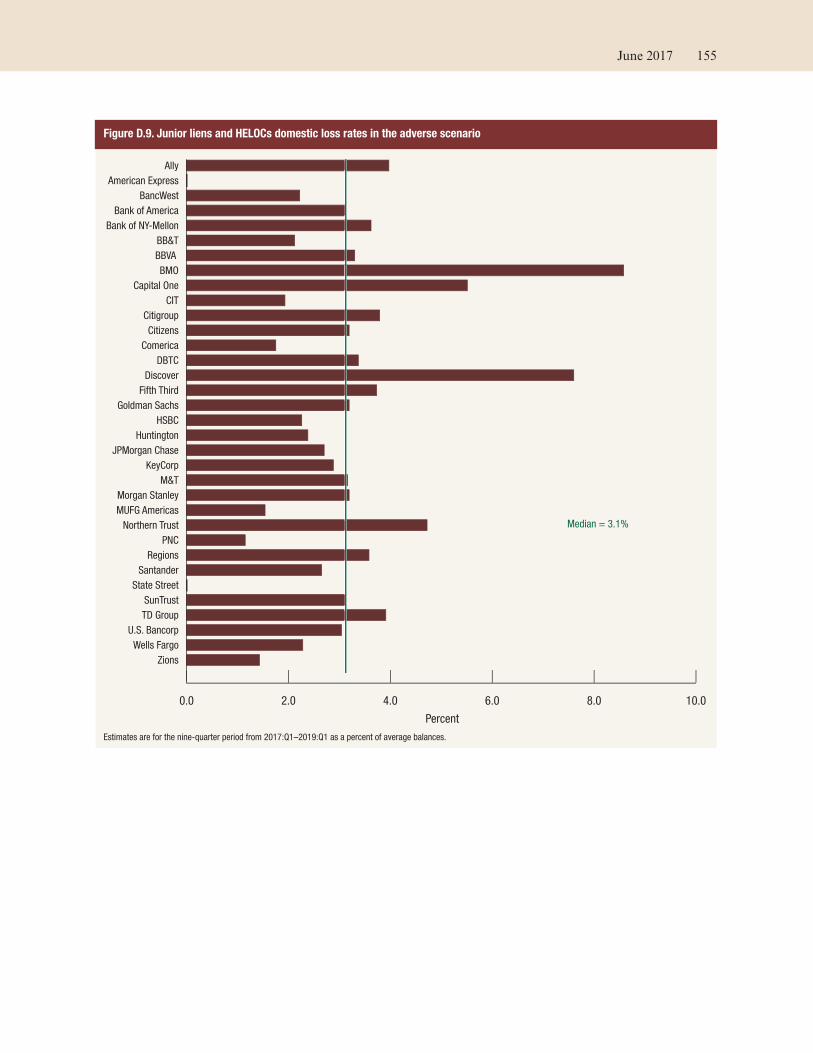
Figure D.9. Junior liens and HELOCs domestic loss rates in the adverse scenario
0.0 2.0 4.0 6.0 8.0 10.0
Zions
Wells Fargo
U.S. Bancorp
TD Group
SunTrust
State Street
Santander
Regions
PNC
Northern Trust
MUFG Americas
Morgan Stanley
M&T
KeyCorp
JPMorgan Chase
Huntington
HSBC
Goldman Sachs
Fifth Third
Discover
DBTC
Comerica
Citizens
Citigroup
CIT
Capital One
BMO
BBVA
BB&T
Bank of NY-Mellon
Bank of America
BancWest
American Express
Ally
Percent
Median = 3.1%
Estimates are for the nine-quarter period from 2017:Q1–2019:Q1 as a percent of average balances.
June 2017 155
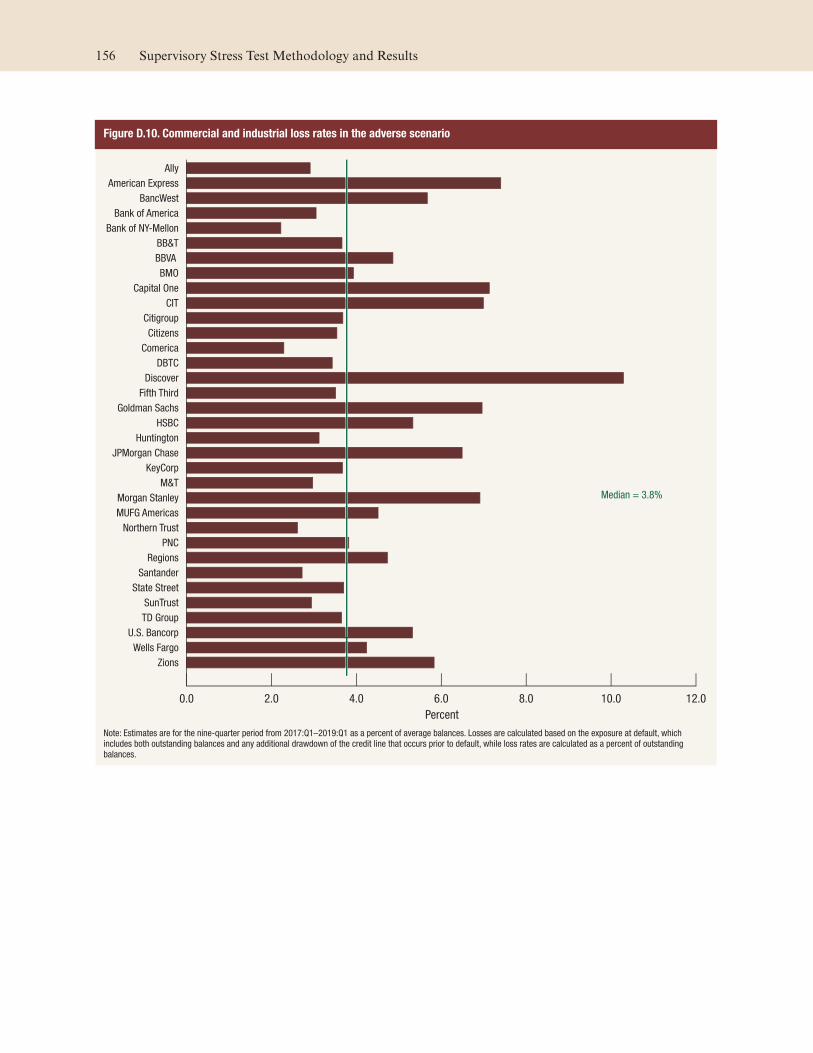
Figure D.10. Commercial and industrial loss rates in the adverse scenario
0.0 2.0 4.0 6.0 8.0 10.0 12.0
Zions
Wells Fargo
U.S. Bancorp
TD Group
SunTrust
State Street
Santander
Regions
PNC
Northern Trust
MUFG Americas
Morgan Stanley
M&T
KeyCorp
JPMorgan Chase
Huntington
HSBC
Goldman Sachs
Fifth Third
Discover
DBTC
Comerica
Citizens
Citigroup
CIT
Capital One
BMO
BBVA
BB&T
Bank of NY-Mellon
Bank of America
BancWest
American Express
Ally
Percent
Median = 3.8%
Note: Estimates are for the nine-quarter period from 2017:Q1–2019:Q1 as a percent of average balances. Losses are calculated based on the exposure at default, which
includes both outstanding balances and any additional drawdown of the credit line that occurs prior to default, while loss rates are calculated as a percent of outstanding
balances.
156 Supervisory Stress Test Methodology and Results
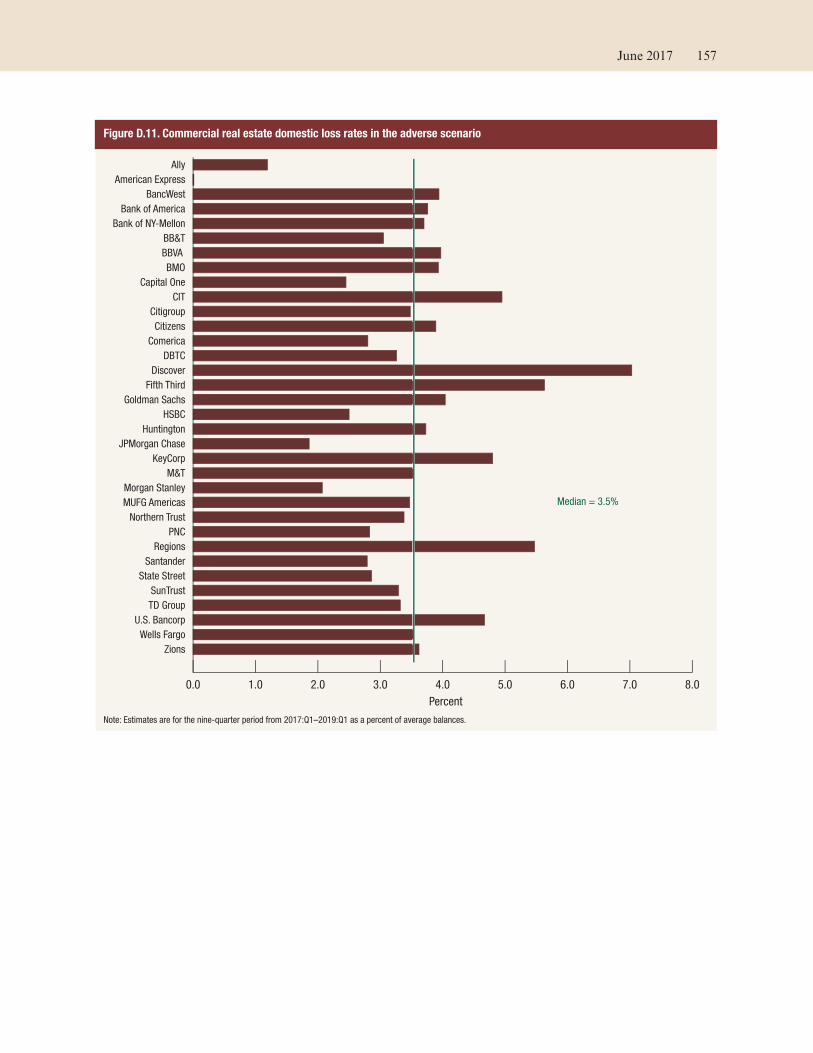
Figure D.11. Commercial real estate domestic loss rates in the adverse scenario
0.0 1.0 2.0 3.0 4.0 5.0 6.0 7.0 8.0
Zions
Wells Fargo
U.S. Bancorp
TD Group
SunTrust
State Street
Santander
Regions
PNC
Northern Trust
MUFG Americas
Morgan Stanley
M&T
KeyCorp
JPMorgan Chase
Huntington
HSBC
Goldman Sachs
Fifth Third
Discover
DBTC
Comerica
Citizens
Citigroup
CIT
Capital One
BMO
BBVA
BB&T
Bank of NY-Mellon
Bank of America
BancWest
American Express
Ally
Percent
Median = 3.5%
Note: Estimates are for the nine-quarter period from 2017:Q1–2019:Q1 as a percent of average balances.
June 2017 157
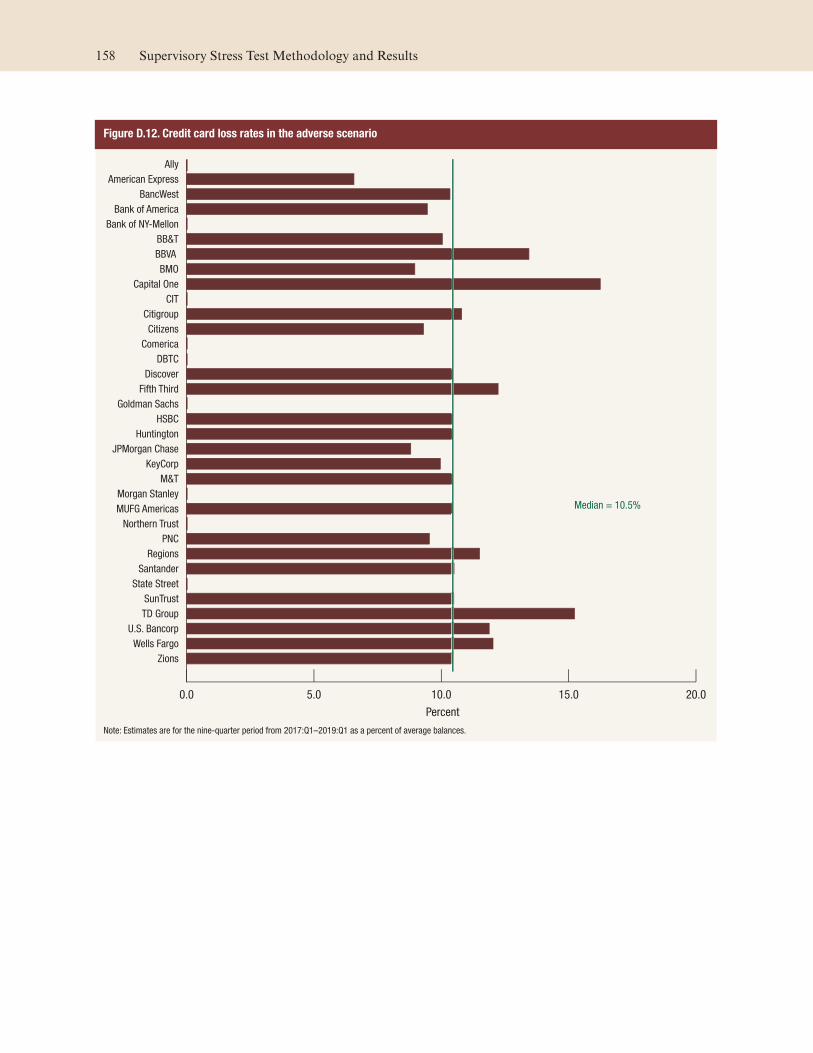
Figure D.12. Credit card loss rates in the adverse scenario
0.0 5.0 10.0 15.0 20.0
Zions
Wells Fargo
U.S. Bancorp
TD Group
SunTrust
State Street
Santander
Regions
PNC
Northern Trust
MUFG Americas
Morgan Stanley
M&T
KeyCorp
JPMorgan Chase
Huntington
HSBC
Goldman Sachs
Fifth Third
Discover
DBTC
Comerica
Citizens
Citigroup
CIT
Capital One
BMO
BBVA
BB&T
Bank of NY-Mellon
Bank of America
BancWest
American Express
Ally
Percent
Median = 10.5%
Note: Estimates are for the nine-quarter period from 2017:Q1–2019:Q1 as a percent of average balances.
158 Supervisory Stress Test Methodology and Results
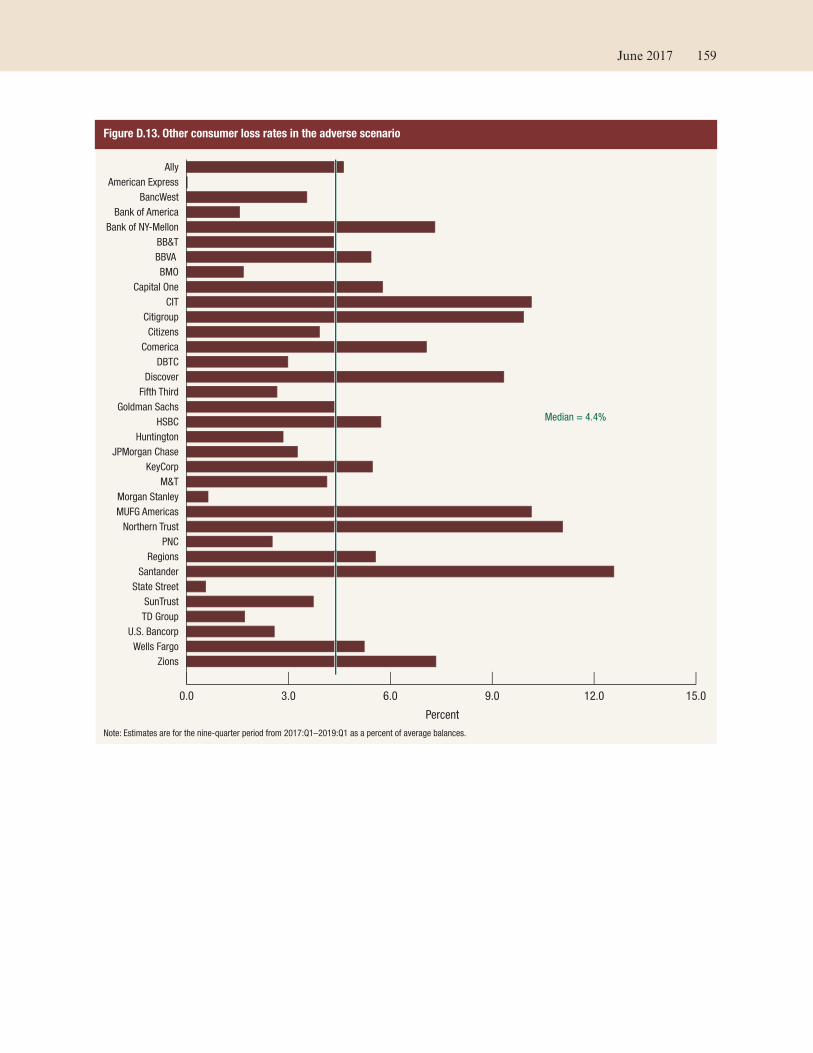
Figure D.13. Other consumer loss rates in the adverse scenario
0.0 3.0 6.0 9.0 12.0 15.0
Zions
Wells Fargo
U.S. Bancorp
TD Group
SunTrust
State Street
Santander
Regions
PNC
Northern Trust
MUFG Americas
Morgan Stanley
M&T
KeyCorp
JPMorgan Chase
Huntington
HSBC
Goldman Sachs
Fifth Third
Discover
DBTC
Comerica
Citizens
Citigroup
CIT
Capital One
BMO
BBVA
BB&T
Bank of NY-Mellon
Bank of America
BancWest
American Express
Ally
Percent
Median = 4.4%
Note: Estimates are for the nine-quarter period from 2017:Q1–2019:Q1 as a percent of average balances.
June 2017 159

Figure D.14. Other loans loss rates in the adverse scenario
0.0 1.0 2.0 3.0 4.0 5.0 6.0 7.0 8.0
Zions
Wells Fargo
U.S. Bancorp
TD Group
SunTrust
State Street
Santander
Regions
PNC
Northern Trust
MUFG Americas
Morgan Stanley
M&T
KeyCorp
JPMorgan Chase
Huntington
HSBC
Goldman Sachs
Fifth Third
Discover
DBTC
Comerica
Citizens
Citigroup
CIT
Capital One
BMO
BBVA
BB&T
Bank of NY-Mellon
Bank of America
BancWest
American Express
Ally
Percent
Median = 2.2%
Note: Estimates are for the nine-quarter period from 2017:Q1–2019:Q1 as a percent of average balances.
160 Supervisory Stress Test Methodology and Results