174
Dodd-Frank Act Stress Test 2018: Supervisory Stress Test Methodology and Results June 2018 B O A R D O F G O V E R N O R S O F T H E F EDERAL R ESERVE S YSTEM

Dodd-Frank Act Stress Test 2018:Supervisory Stress Test
Methodology and Results
June 2018
B O A R D O F G O V E R N O R S O F T H E F E D E R A L R E S E R V E S Y S T E M


Dodd-Frank Act Stress Test 2018:Supervisory Stress Test
Methodology and Results
June 2018
B O A R D O F G O V E R N O R S O F T H E F E D E R A L R E S E R V E S Y S T E M

This and other Federal Reserve Board reports and publications are available online at
www.federalreserve.gov/publications/default.htm.
To order copies of Federal Reserve Board publications offered in print,
see the Board’s Publication Order Form (www.federalreserve.gov/files/orderform.pdf)
or contact:
Printing and Fulfillment
Mail Stop K1-120
Board of Governors of the Federal Reserve System
Washington, DC 20551
(ph) 202-452-3245
(fax) 202-728-5886
(email) [email protected]

Preface
The Federal Reserve promotes a safe, sound, and
efficient banking and financial system that supports
the growth and stability of the U.S. economy
through its supervision of bank holding companies
(BHCs), U.S. intermediate holding companies
(IHCs), savings and loan holding companies, state
member banks, and nonbank financial institutions
that the Financial Stability Oversight Council
(FSOC) has determined shall be supervised by the
Board of Governors of the Federal Reserve System
(Board).1
The Federal Reserve has established frameworks and
programs for the supervision of its largest and most
complex financial institutions to achieve its supervi-
sory objectives, incorporating the lessons learned
from the 2007 to 2009 financial crisis and in the
period since. As part of these supervisory frame-
works and programs, the Federal Reserve assesses
whether BHCs with $100 billion or more in total
consolidated assets and U.S. IHCs (together, firms)
are sufficiently capitalized to absorb losses during
stressful conditions, while meeting obligations to
creditors and counterparties and continuing to be
able to lend to households and businesses.2 The Fed-
eral Reserve’s expectations for capital planning prac-
tices are tailored to the size, scope of operations,
activities, and systemic importance of a particular
firm. In particular, the Federal Reserve has height-
ened expectations for BHCs and U.S. IHCs super-
vised by the Large Institution Supervision Coordi-
nating Committee (LISCC firms) and “large and
complex firms.”3
This annual assessment includes two related
programs:
• Dodd-Frank Act supervisory stress testing is a
forward-looking quantitative evaluation of the
impact of stressful economic and financial market
conditions on firms’ capital. The supervisory stress
test that is carried out pursuant to the Dodd-
Frank Wall Street Reform and Consumer Protec-
tion Act (Dodd-Frank Act) and the Board's rules4
serves to inform the Federal Reserve, firms, and
the general public of how institutions’ capital
ratios might change under a hypothetical set of
stressful economic conditions developed by the
Federal Reserve. The supervisory stress test results,
after incorporating firms’ planned capital actions,
are also used for the quantitative assessment in the
Comprehensive Capital Analysis and Review
(CCAR). All BHCs with $100 billion or more in
total consolidated assets and U.S. IHCs are cur-
rently subject to Dodd-Frank supervisory stress
testing.5
• The Comprehensive Capital Analysis and Review
(CCAR) consists of a quantitative assessment for
all firms, and a qualitative assessment for firms
that are LISCC or large and complex firms. The
quantitative assessment evaluates a firm’s capital
adequacy and planned capital distributions, such
as any dividend payments and common stock
repurchases. The Federal Reserve assesses whether
firms have sufficient capital to continue operating
and lending to creditworthy households and busi-1 Information on the Federal Reserve’s regulation and supervi-sion function, including more detail on stress testing and capitalplanning assessment, is available on the Federal Reserve websiteat www.federalreserve.gov/supervisionreg.htm.
2 Enacted on May 24, 2018, the Economic Growth, RegulatoryRelief, and Consumer Protection Act (EGRRCPA) raised theasset thresholds for application of section 165 of the Dodd-Frank Wall Street Reform and Consumer Protection Act. TheBoard will not disclose the current supervisory stress test resultsfor BHCs with greater than or equal to $50 billion but less than$100 billion in total consolidated assets. This document reflectsthose changes.
3 Large and complex firms are BHCs or U.S. IHCs that (1) haveaverage total consolidated assets over $250 billion or (2) haveaverage total nonbank assets of $75 billion or more, and (3) arenot LISCC firms.
4 Pub. L. No. 111-203, 124 Stat. 1376 (2010); 12 CFR part 252,subpart E.
5 Currently, no nonbank financial companies supervised by theBoard are subject to the capital planning or stress testrequirements.
iii

nesses throughout times of economic and financial
market stress, even after making all planned capital
distributions. CCAR also includes a qualitative
assessment of capital planning practices at the
largest and most complex firms. As part of the
qualitative assessment, the Federal Reserve evalu-
ates the reliability of each firm’s analyses and
other processes for capital planning, focusing on
the areas that are most critical to sound capital
planning—namely, how a firm identifies, measures,
and determines capital needs for its material
risks—and a firm’s controls and governance
around those practices. At the conclusion of the
process, the Federal Reserve either does not object
or objects to a firm’s capital plan. If the Federal
Reserve objects to a firm’s capital plan, the firm
may only make capital distributions that the Fed-
eral Reserve has not objected to in writing.
iv Supervisory Stress Test Methodology and Results

Executive Summary ................................................................................................................ 1
Background on Dodd-Frank ActStress Testing ............................................................................................................................. 3
Supervisory Scenarios ............................................................................................................ 5
Severely Adverse Scenario .......................................................................................................... 5
Adverse Scenario ....................................................................................................................... 7
Global Market Shock and Counterparty Default Components ........................................................ 8
Supervisory Stress Test Framework and Model Methodology .............................. 11
Analytical Framework ................................................................................................................ 11
Model Methodology .................................................................................................................. 12
Model Risk Management, Governance, and Validation ................................................................ 15
Data Inputs ............................................................................................................................... 19
Capital Action Assumptions and Regulatory Capital Ratios ......................................................... 20
Supervisory Stress Test Results ......................................................................................... 23
Severely Adverse Scenario ........................................................................................................ 23
Adverse Scenario ...................................................................................................................... 38
Appendix A: Supervisory Scenarios ................................................................................ 53
Appendix B: Models to Project Net Income and Stressed Capital ........................ 63
Losses on the Accrual Loan Portfolio ......................................................................................... 63
Loan-Loss Provisions for the Accrual Loan Portfolio ................................................................... 69
Other Losses ............................................................................................................................ 69
PPNR ....................................................................................................................................... 72
Balance-Sheet Items and Risk-Weighted Assets ......................................................................... 74
Regulatory Capital .................................................................................................................... 75
Modeling Approaches for IHCs Newly Subject to the Supervisory Stress Test .............................. 76
Appendix C: Firm-Specific Results .................................................................................. 79
Appendix D: Additional Aggregate Results ................................................................ 151
v
Contents


Executive Summary
The Dodd-Frank Act requires the Federal Reserve to
conduct an annual stress test of BHCs with $100 bil-
lion or more in total consolidated assets, U.S. IHCs,6
and any nonbank financial company that the FSOC
has determined shall be supervised by the Board.7
The Board first adopted rules implementing this
requirement in October 2012 and most recently
modified these rules in February 2017.8
For this year’s stress test cycle (DFAST 2018), which
began January 1, 2018, the Federal Reserve con-
ducted supervisory stress tests of 35 firms.
This report provides
• background on Dodd-Frank Act stress testing;
• details of the adverse and severely adverse supervi-
sory scenarios used in DFAST 2018;
• an overview of the analytical framework and meth-
ods used to generate the Federal Reserve’s projec-
tions, highlighting notable changes from last year’s
program; and
• the results of the supervisory stress tests under
adverse and severely adverse scenarios for the
firms that participated in the DFAST 2018 pro-
gram, presented both in the aggregate and for indi-
vidual institutions.
The adverse and severely adverse supervisory sce-
narios used in DFAST 2018 feature U.S. and global
recessions. In particular, the severely adverse sce-
nario is characterized by a severe global recession in
which the U.S. unemployment rate rises by almost
6 percentage points to 10 percent, accompanied by a
global aversion to long-term fixed-income assets. The
adverse scenario features a moderate recession in the
United States, as well as weakening economic activ-
ity across all countries included in the scenario.
In conducting its supervisory stress tests, the Federal
Reserve calculated its projections of each firm’s bal-
ance sheet, risk-weighted assets (RWAs), net income,
and resulting regulatory capital ratios under these
scenarios using data on firms’ financial conditions
and risk characteristics provided by the firms and a
set of models developed or selected by the Federal
Reserve. For DFAST 2018, the Federal Reserve
updated the calculation of projected capital to reflect
changes in the tax code associated with the passage
of the Tax Cuts and Jobs Act (TCJA) in Decem-
ber 2017. As in past years, the Federal Reserve also
enhanced some of the supervisory models to incor-
porate new data, where available, and to improve
model stability and performance. The enhanced
models generally exhibit an increased sensitivity to
economic conditions compared to past years’ mod-
els. These changes are highlighted in box 1. A
description of modifications to the calculation of
projected capital is included in box 2. A description
of a recent proposal to increase the transparency of
the supervisory stress test, including a notice of
enhanced disclosure, is included in box 3. Specific
descriptions of the supervisory models and related
assumptions can be found in appendix B.
The results of the DFAST 2018 projections suggest
that, in the aggregate, the 35 firms would experience
substantial losses under both the adverse and the
severely adverse scenarios but could continue lending
to businesses and households, due to the substantial
accretion of capital since the financial crisis.
Over the nine quarters of the planning horizon,
which for DFAST 2018 begins in the first quarter of
2018 and ends in the first quarter of 2020, aggregate
losses at the 35 firms under the severely adverse sce-
nario are projected to be $578 billion. This includes
losses across loan portfolios, losses from credit
impairment on securities held in the firms’ invest-
ment portfolios, trading and counterparty credit
6 U.S. IHCs of foreign banking organizations are subject to theannual stress test in accordance with the transition provisionsunder the capital plan rule and subpart O of the FederalReserve’s Regulation YY (12 CFR part 252).
7 12 USC 5365(i)(1).8 See 82 Fed. Reg. 9308 (February 3, 2017).
1

losses from a global market shock, and other losses.
Projected aggregate pre-provision net revenue
(PPNR) is $492 billion, and net income before taxes
is projected to be −$139 billion.
In the severely adverse scenario, the aggregate Com-
mon Equity Tier 1 (CET1) capital ratio would fall
from an actual 12.3 percent in the fourth quarter of
2017 to its minimum of 7.9 percent over the planning
horizon. As illustrated in figure 1, the aggregate
CET1 ratio is projected to rise to 8.7 percent by the
end of the planning horizon.
In the adverse scenario, aggregate projected losses,
PPNR, and net income before taxes are $333 billion,
$467 billion, and $125 billion, respectively. The
aggregate CET1 capital ratio under the adverse sce-
nario would fall to its minimum of 10.9 percent over
the planning horizon. Details of the results are pro-
vided in the Supervisory Stress Test Results section
of this report.
Figure 1. Historical and stressed tier 1 common ratio andcommon equity tier 1 ratio
Percent
0
3
6
9
12
15
Str
esse
d, Q
1 2
02
0
Act
ual
, Q4
20
17
Act
ual
, Q4
20
16
Act
ual
, Q4
20
15
Act
ual
, Q3
20
14
Act
ual
, Q4
20
13
Act
ual
, Q1
20
13
Act
ual
, Q1
20
12
Act
ual
, Q1
20
11
Stressed CET1Actual tier 1 common Actual CET1
Source: FR Y-9C, FR Y-14A, and supervisory estimates under the severely adverse
scenario.
2 Supervisory Stress Test Methodology and Results

Background on Dodd-Frank ActStress Testing
In the wake of the financial crisis, Congress enacted
the Dodd-Frank Act,9 which, among other provi-
sions, requires the Federal Reserve to conduct an
annual supervisory stress test. The Dodd-Frank
Act supervisory stress test applies to LISCC firms,
large and complex firms,10 and large and noncom-
plex firms.11
In conducting the supervisory stress tests, the Fed-
eral Reserve projects balance sheets, RWAs, net
income, and resulting post-stress capital levels and
regulatory capital ratios over a nine-quarter planning
horizon, generally using a set of capital action
assumptions prescribed in the Dodd-Frank Act
stress test rules (see Capital Action Assumptions and
Regulatory Capital Ratios). The projections are
based on three macroeconomic scenarios required by
the Dodd-Frank Act (baseline, adverse, and severely
adverse) and developed annually by the Federal
Reserve.12
Together, the Dodd-Frank Act supervisory stress
tests are intended to provide company management
and boards of directors, the public, and supervisors
with forward-looking information to help gauge the
potential effect of stressful conditions on the ability
of these large banking organizations to absorb
losses, while meeting obligations to creditors and
other counterparties and continuing to lend. The
Dodd-Frank Act requires the Federal Reserve to dis-
close a summary of its supervisory stress test results.
The Federal Reserve must publicly disclose supervi-
sory stress test results by June 30 of the calendar
year in which the stress test was conducted.
9 Pub. L. No. 111-203, 124 Stat. 1376 (2010).10 The LISCC or large and complex firms required to participate
in DFAST 2018 are Bank of America Corporation; The Bankof New York Mellon Corporation; Barclays US LLC; CapitalOne Financial Corporation; Citigroup Inc.; Credit Suisse Hold-ings (USA) LLC; Deutsche Bank USA Corp; The GoldmanSachs Group, Inc.; HSBC North America Holdings Inc.; JPM-organ Chase & Co.; Morgan Stanley; The PNC Financial Ser-vices Group, Inc.; RBC USA Holdco Corporation; State StreetCorporation; TD Group US Holdings LLC; UBS AmericasHoldings LLC; U.S. Bancorp; and Wells Fargo & Company.
11 The large and noncomplex firms participating in DFAST 2018are Ally Financial Inc.; American Express Company; BB&TCorporation; BBVA Compass Bancshares, Inc.; BMO Finan-cial Corp.; BNP Paribas USA, Inc.; Citizens Financial Group,Inc.; Discover Financial Services; Fifth Third Bancorp; Hun-tington Bancshares Incorporated; KeyCorp; M&T Bank Cor-poration; MUFG Americas Holdings Corporation; NorthernTrust Corporation; Regions Financial Corporation; SantanderHoldings USA, Inc.; and SunTrust Banks, Inc.
12 The Board has issued a policy statement regarding its processfor designing the scenarios. See Policy Statement on the Sce-nario Design Framework for Stress Testing, 78 Fed. Reg. 71435(November 29, 2013), www.gpo.gov/fdsys/pkg/FR-2013-11-29/pdf/2013-27009.pdf (12 CFR part 252, appendix A).
3


Supervisory Scenarios
On February 1, 2018, the Federal Reserve released
the three supervisory scenarios: baseline, adverse,
and severely adverse.13 This section describes the
adverse and severely adverse scenarios that were used
for the projections contained in this report. These
scenarios were developed using the approach
described in the Board’s Policy Statement on the
Scenario Design Framework for Stress Testing.14
The adverse and severely adverse scenarios are not
forecasts, but rather hypothetical scenarios designed
to assess the strength of banking organizations and
their resilience to an unfavorable economic
environment.
Supervisory scenarios include trajectories for 28 vari-
ables. These include 16 variables that capture eco-
nomic activity, asset prices, and interest rates in the
U.S. economy and financial markets and three vari-
ables (real gross domestic product (GDP) growth,
inflation, and the U.S./foreign currency exchange
rate) in each of the four countries/country blocks.
Similar to DFAST 2017, the Federal Reserve applied
a global market shock to the trading portfolio of six
firms with large trading and private equity exposures
and a counterparty default scenario component to
eight firms with substantial trading, processing, or
custodial operations (see Global Market Shock and
Counterparty Default Components). In addition, the
Federal Reserve applied a supervisory market risk
component, a simplified version of the global market
shock and large counterparty default scenario com-
ponent, to the six IHCs with trading activity that will
be subject to the global market shock beginning
in 2019.
Severely Adverse Scenario
Figures 2 through 7 illustrate the hypothetical trajec-
tories for some of the key variables describing U.S.
economic activity and asset prices under the severely
adverse scenario.
The severely adverse scenario is characterized by a
severe global recession that is accompanied by a
global aversion to long-term fixed-income assets. As
a result, long-term rates do not fall and yield curves
steepen in the United States and the four countries/
country blocks in the scenario. In turn, these devel-
opments lead to a broad-based and deep correction
in asset prices—including in the corporate bond and
real estate markets.
In this scenario, the level of U.S. real GDP begins to
decline in the first quarter of 2018 and reaches a
trough in the third quarter of 2019 that is 7½ percent
below the pre-recession peak. The unemployment
13 See Board of Governors of the Federal Reserve System (2018),“2018 Supervisory Scenarios for Annual Stress Tests Requiredunder the Dodd-Frank Act Stress Testing Rules and the CapitalPlan Rule” (Washington, DC: Board of Governors, Febru-ary 2018), https://www.federalreserve.gov/newsevents/pressreleases/files/bcreg20180201a1.pdf for additional informa-tion and for the details of the supervisory scenarios.
14 12 CFR part 252, appendix A.
Figure 2. Unemployment rate in the severely adverse andadverse scenarios, 2013:Q1–2021:Q1
4
6
8
10Percent
Adverse
Severely adverse
20
21
:Q1
20
20
:Q1
20
19
:Q1
20
18
:Q1
20
17
:Q1
20
16
:Q1
20
15
:Q1
20
14
:Q1
20
13
:Q1
Source: Bureau of Labor Statistics and Federal Reserve assumptions in the super-
visory scenarios.
5
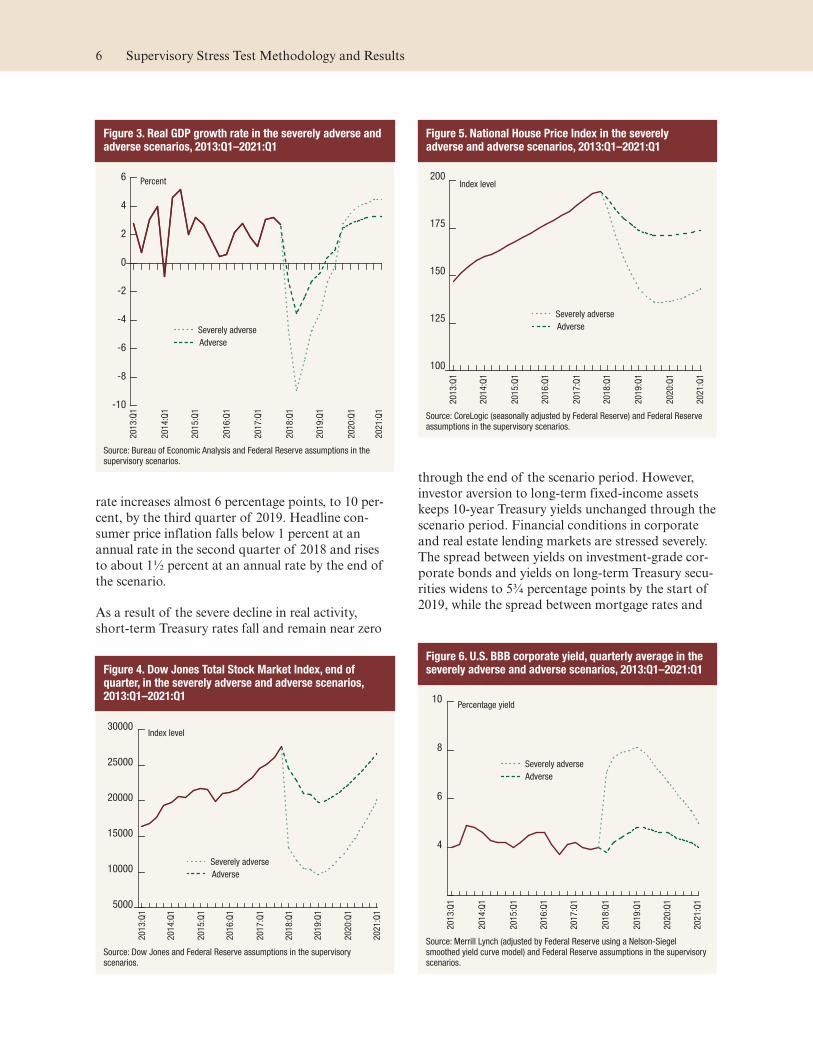
rate increases almost 6 percentage points, to 10 per-
cent, by the third quarter of 2019. Headline con-
sumer price inflation falls below 1 percent at an
annual rate in the second quarter of 2018 and rises
to about 1½ percent at an annual rate by the end of
the scenario.
As a result of the severe decline in real activity,
short-term Treasury rates fall and remain near zero
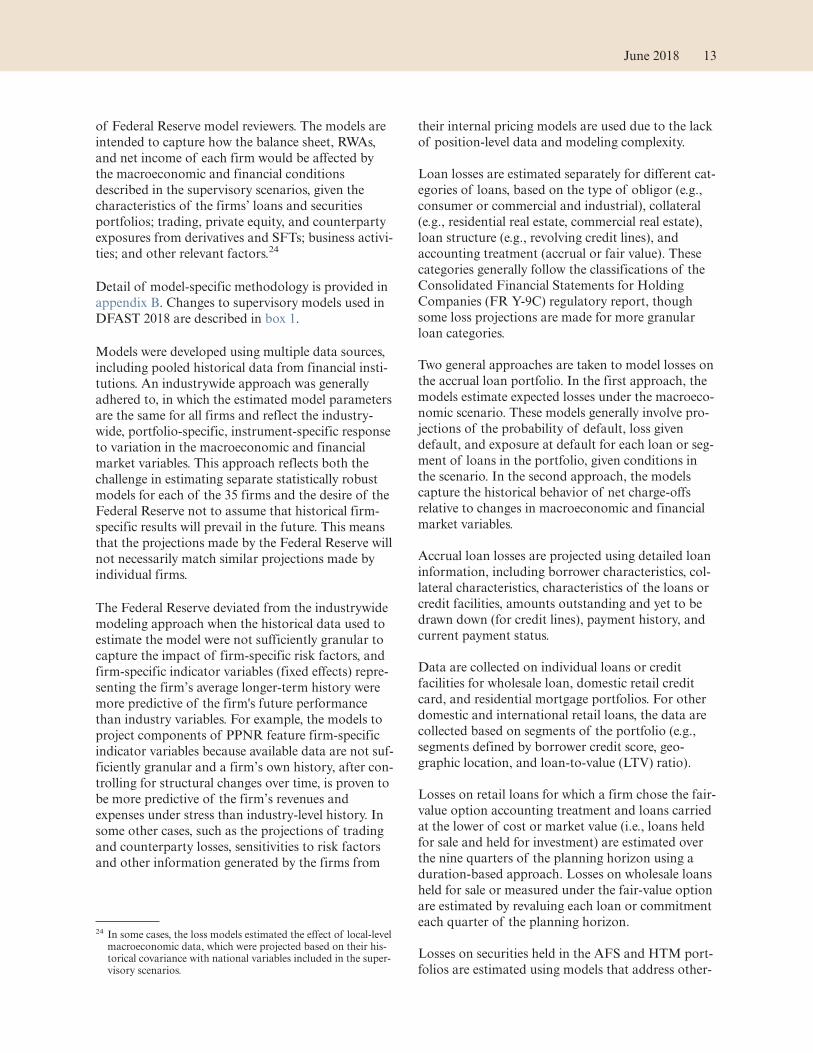
through the end of the scenario period. However,
investor aversion to long-term fixed-income assets
keeps 10-year Treasury yields unchanged through the
scenario period. Financial conditions in corporate
and real estate lending markets are stressed severely.
The spread between yields on investment-grade cor-
porate bonds and yields on long-term Treasury secu-
rities widens to 5¾ percentage points by the start of
2019, while the spread between mortgage rates and
Figure 3. Real GDP growth rate in the severely adverse andadverse scenarios, 2013:Q1–2021:Q1
-10
-8
-6
-4
-2
0
2
4
6 Percent
Adverse
Severely adverse
2021:Q
1
2020:Q
1
2019:Q
1
2018:Q
1
2017:Q
1
2016:Q
1
2015:Q
1
2014:Q
1
2013:Q
1
Source: Bureau of Economic Analysis and Federal Reserve assumptions in the
supervisory scenarios.
Figure 4. Dow Jones Total Stock Market Index, end ofquarter, in the severely adverse and adverse scenarios,2013:Q1–2021:Q1
5000
10000
15000
20000
25000
30000Index level
Adverse
Severely adverse
20
21
:Q1
20
20
:Q1
20
19
:Q1
20
18
:Q1
20
17
:Q1
20
16
:Q1
20
15
:Q1
20
14
:Q1
20
13
:Q1
Source: Dow Jones and Federal Reserve assumptions in the supervisory
scenarios.
Figure 5. National House Price Index in the severelyadverse and adverse scenarios, 2013:Q1–2021:Q1
100
125
150
175
200Index level
Adverse
Severely adverse
2021:Q
1
2020:Q
1
2019:Q
1
2018:Q
1
2017:Q
1
2016:Q
1
2015:Q
1
2014:Q
1
2013:Q
1
Source: CoreLogic (seasonally adjusted by Federal Reserve) and Federal Reserve
assumptions in the supervisory scenarios.
Figure 6. U.S. BBB corporate yield, quarterly average in theseverely adverse and adverse scenarios, 2013:Q1–2021:Q1
4
6
8
10Percentage yield
Adverse
Severely adverse
20
21
:Q1
20
20
:Q1
20
19
:Q1
20
18
:Q1
20
17
:Q1
20
16
:Q1
20
15
:Q1
20
14
:Q1
20
13
:Q1
Source: Merrill Lynch (adjusted by Federal Reserve using a Nelson-Siegel
smoothed yield curve model) and Federal Reserve assumptions in the supervisory
scenarios.
6 Supervisory Stress Test Methodology and Results

10-year Treasury yields widens to about 3½ percent-
age points over the same time period.
Asset prices drop sharply in this scenario. Equity
prices fall 65 percent by early 2019, accompanied by
a surge in equity market volatility. The U.S. market
volatility index (VIX) moves above 60 percent in the
first half of 2018. Real estate prices also experience
large declines, with house prices and commercial real
estate prices falling 30 percent and 40 percent,
respectively, by the third quarter of 2019.
The international component of this scenario fea-
tures a sharp global downturn, with severe recessions
in the euro area, the United Kingdom, and Japan,
and a shallow and brief recession in developing Asia.
As a result of the sharp contraction in economic
activity, all foreign economies included in the sce-
nario experience a decline in consumer prices, with
Japan experiencing a more significant deflation that
persists through the end of the scenario period. As in
this year’s adverse scenario, the U.S. dollar appreci-
ates against the euro, the pound sterling, and the
currencies of developing Asia but depreciates mod-
estly against the yen because of flight-to-safety
capital flows.
The severely adverse scenario used in the 2018 stress
test cycle features a more severe downturn in the U.S.
economy as compared to the 2017 scenario. This
increase in severity reflects the Federal Reserve’s sce-
nario design framework for stress testing, which
includes elements that create a more severe test of
the resilience of large firms when current economic
conditions are especially strong. Under this frame-
work, the unemployment rate in the severely adverse
scenario will reach a peak of at least 10 percent,
which leads to a progressively greater increase in the
unemployment rate if the starting unemployment
rate is below 6 percent. Furthermore, the 2018 sce-
nario incorporates a steepening of the yield curve
and a deeper correction in prices for a broad set of
assets, including equities, housing, and commercial
real estate. The international dimension of the sce-
nario shows a recessionary episode that, relative to
last year’s scenario, is more severe in developing Asia
and Japan but less severe in the euro area and the
United Kingdom.
Adverse Scenario
The adverse scenario is characterized by weakening
economic activity across all of the economies
included in the scenario. This economic downturn is
accompanied by rapid declines in long-term rates
and flattening yield curves in the United States and
the four countries/country blocks in the scenario.
In the adverse scenario, the U.S. economy experi-
ences a moderate recession that begins in the first
quarter of 2018. Real GDP falls slightly more than
2¼ percent from the pre-recession peak in the fourth
quarter of 2017 to the recession trough in the first
quarter of 2019, while the unemployment rate rises
steadily, peaking at 7 percent in the third quarter of
2019. The U.S. recession is accompanied by an initial
fall in inflation in the first two quarters of 2018. The
rate of increase in consumer prices then rises steadily
before leveling off at around 2 percent by the second
half of 2019.
Reflecting weak economic conditions, short-term
interest rates in the United States decline to nearly
zero, where they remain for the rest of the scenario
period. Yields on 10-year Treasury securities drop to
around ¾ of a percent in the first quarter of 2018 as
the yield curve flattens, and then gradually rise to
slightly less than 2 percent by the end of the sce-
nario. Financial conditions tighten for corporations
and households during the recession. Spreads
between investment-grade corporate bond yields and
10-year Treasury yields gradually rise to about
3¾ percentage points by early 2019, while spreads
Figure 7. U.S. Market Volatility Index (VIX) in the severelyadverse and adverse scenarios, 2013:Q1–2021:Q1
10
20
30
40
50
60
70Index level
Adverse
Severely adverse
2021:Q
1
2020:Q
1
2019:Q
1
2018:Q
1
2017:Q
1
2016:Q
1
2015:Q
1
2014:Q
1
2013:Q
1
Source: Chicago Board Options Exchange (converted to quarterly by Federal
Reserve using the maximum quarterly close-of-day value) and Federal Reserve
assumptions in the supervisory scenarios.
June 2018 7

between mortgage rates and 10-year Treasury yields
widen to about 2¾ percentage points over the
same period.
Asset prices decline in the adverse scenario. Equity
prices fall approximately 30 percent by early 2019,
accompanied by a rise in equity market volatility.
Nominal house prices and commercial real estate
prices experience sustained declines; house prices fall
12 percent and commercial real estate prices fall
15 percent by the first quarter of 2020.
Following the recession, U.S. real activity picks up
slowly at first and then gains momentum; growth in
U.S. real GDP increases from ¾ of a percent in
2019 to about 3 percent in 2020. The unemployment
rate declines modestly, to about 6¼ percent by the
end of the scenario period. Consumer price inflation
remains at roughly 2 percent through the end of the
scenario period. Yields on 10-year Treasury securi-
ties continue to rise gradually to slightly less than
2 percent by the end of the scenario period.
Outside of the United States, the adverse scenario
features moderate recessions in the euro area and the
United Kingdom, a pronounced and protracted
recession in Japan, and below-trend growth in devel-
oping Asia. Weakness in global demand results in
slowing inflation in all of the foreign economies
under consideration and the onset of deflationary
episodes in Japan and—more modestly—developing
Asia. Reflecting flight-to-safety capital flows, the
U.S. dollar appreciates against the euro, the pound
sterling, and the currencies of developing Asia. The
dollar depreciates modestly against the yen, also in
line with flight-to-safety capital flows.
The main difference relative to the 2017 adverse sce-
nario is that the 2018 adverse scenario features lower
long-term interest rates and a flatter yield curve
across all of the economies included in the scenario.
This different profile of interest rates is associated
with a less pronounced decline in the U.S. equity
price index in the 2018 scenario.
Global Market Shock andCounterparty Default Components
The Federal Reserve applied a global market shock
to the trading portfolios of six firms with large trad-
ing and private equity exposures.15 In addition, the
Federal Reserve applied a counterparty default com-
ponent, which assumes the default of a firm’s largest
counterparty under the global market shock, to the
same six firms and two other firms with substantial
trading, processing, or custodial operations.16 These
components are an add-on to the economic condi-
tions and financial market environment specified in
the adverse and severely adverse scenarios.
The global market shock is a set of instantaneous,
hypothetical shocks to a large set of risk factors.
Generally, these shocks involve large and sudden
changes in asset prices, interest rates, and spreads,
reflecting general market dislocation and heightened
uncertainty.17 The Federal Reserve published the
global market shock for the adverse and severely
adverse scenarios on February 1, 2018; the as-of date
for the global market shock and the counterparty
default is December 4, 2017.
The global market shock component for the severely
adverse scenario is designed around three main ele-
ments: a sudden sharp increase in general risk premi-
ums and credit risk, a rise and steepening of the U.S.
yield curve, and a general selloff of U.S. assets rela-
tive to other developed countries. Markets that are
more tightly linked to interest rates are more acutely
affected. As an example, in general, corporate debt,
residential mortgage-backed securities (RMBS), and
commercial mortgage-backed securities (CMBS)
markets are more severely affected than U.S. equities.
Some markets less closely linked to interest rates
experience conditions that are generally comparable
to the second half of 2008.
Globally, yield curves for government bonds of most
developed countries undergo moderate tightening
due to outflows from U.S. asset markets. The U.S.
yield curve rises across the term structure, particu-
larly at the long end. Emerging market yield curves
generally rise due to heightened risk premiums. The
U.S. dollar depreciates relative to other developed
market currencies due to investor outflows.
15 The six firms subject to the global market shock are Bank ofAmerica Corporation; Citigroup Inc.; The Goldman Sachs
Group, Inc.; JPMorgan Chase & Co.; Morgan Stanley; andWells Fargo & Co. See 12 CFR 252.54(b)(2).
16 The eight LISCC firms subject to the counterparty defaultcomponent are Bank of America Corporation; The Bank ofNew York Mellon Corporation; Citigroup Inc.; The GoldmanSachs Group, Inc.; JPMorgan Chase & Co.; Morgan Stanley;State Street Corporation; and Wells Fargo & Co. See 12 CFR252.54(b)(2)(ii).
17 See CCAR 2018: Severely Adverse Global Market Shocks athttps://www.federalreserve.gov/supervisionreg/files/ccar-2018-severely-adverse-market-shocks.xlsx, and CCAR 2018: AdverseGlobal Market Shocks at https://www.federalreserve.gov/supervisionreg/files/ccar-2018-adverse-market-shocks.xlsx.
8 Supervisory Stress Test Methodology and Results

The major differences relative to the 2017 severely
adverse scenario include a rise and steepening of the
U.S. yield curve; greater depreciation of the U.S. dol-
lar relative to other advanced currencies; and more
muted shocks to some credit-sensitive assets, such as
non-agency RMBS. These differences are intended to
reflect a general sell-off in U.S. markets—combined
with a less severe stress to illiquid assets.
The eight firms with substantial trading or custodial
operations were required to incorporate a counter-
party default scenario component into their supervi-
sory adverse and severely adverse stress scenarios for
CCAR 2018. The counterparty default scenario
component involves the instantaneous and unex-
pected default of the firm’s largest counterparty.18
In connection with the counterparty default scenario
component, these firms were required to estimate
and report the potential losses and related effects on
capital associated with the instantaneous and unex-
pected default of the counterparty that would gener-
ate the largest losses across their derivatives and
securities financing activities, including securities
lending and repurchase or reverse repurchase agree-
ment activities. The counterparty default scenario
component is an add-on to the macroeconomic con-
ditions and financial market environment specified
in the Federal Reserve’s adverse and severely adverse
stress scenarios.
Each firm’s largest counterparty is determined by
net stressed losses, estimated by applying the global
market shock to revalue non-cash securities financ-
ing activity assets (securities or collateral) posted or
received; and for derivatives, to the value of the trade
position and non-cash collateral exchanged. The
as-of date for the counterparty default scenario com-
ponent is December 4, 2017—the same date as the
global market shock.19
The global market shock component for the adverse
scenario simulates a marked decline in the economic
outlook for developing Asian markets. As a result,
sovereign credit spreads widen and currencies gener-
ally depreciate significantly in these markets. This
shock spreads to other global markets, which results
in increases in general risk premiums and credit risk.
U.S. interest rates move lower across the term struc-
ture. Due to a sharp reduction in demand from
developing Asia, most global commodity prices and
currencies of commodity exporters decline signifi-
cantly. Equity markets decline broadly.
The major difference relative to the 2017 adverse sce-
nario is a regional focus on developing Asian mar-
kets. In general, the 2018 adverse scenario includes
larger changes in price, spread, and volatility levels
across most markets.
In addition, the Federal Reserve applied a supervi-
sory market risk component to the six IHCs with sig-
nificant trading activity20 that will be subject to the
full global market shock component starting in 2019.
For this simplified version, the Federal Reserve
applied exposure-level loss rates based on the losses
used in the global market shock and large counter-
party default components in 2014–17.
18 In selecting its largest counterparty, a firm subject to the coun-terparty default component will not consider certain sovereignentities (Canada, France, Germany, Italy, Japan, the UnitedKingdom, and the United States) or designated central clearingcounterparties.
19 As with the global market shock, a firm subject to the counter-party default component may use data as of the date that corre-sponds to its weekly internal risk reporting cycle as long as itfalls during the business week of the as-of date for the counter-party default scenario component (i.e., December 4–8, 2017).Losses will be assumed to occur in the first quarter of the plan-ning horizon.
20 The six firms subject to the supervisory market risk componentare Barclays US LLC; Credit Suisse Holdings (USA), Inc.; DBUSA Corporation; HSBC North America Holdings Inc.; RBCUSA Holdco Corporation; and UBS Americas Holdings LLC.See 12 CFR 252.54(b)(2)(ii).
June 2018 9


Supervisory Stress Test Framework andModel Methodology
Analytical Framework
The Federal Reserve estimated the effect of the
supervisory scenarios on the regulatory capital ratios
of the 35 firms participating in DFAST 2018 by pro-
jecting the balance sheet, RWAs, net income, and
resulting capital for each firm over a nine-quarter
planning horizon, which for DFAST 2018 begins in
the first quarter of 2018 and ends in the first quarter
of 2020. Projected net income, adjusted for the effect
of taxes, is combined with capital action assump-
tions to project changes in equity capital. The
approach followed U.S. generally accepted account-
ing principles (GAAP) and regulatory revised capital
framework.21 Figure 8 illustrates the framework
used to calculate changes in net income and
regulatory capital.
Projected net income for the 35 firms is generated
from projections of revenue, expenses, and various
types of losses and provisions that flow into pre-tax
net income, including
• pre-provision net revenue (PPNR);
• loan losses and changes in the allowance for loan
and lease losses (ALLL);
• losses on loans held for sale (HFS) or for invest-
ment and measured under the fair-value option
(FVO);
• other-than-temporary impairment (OTTI) losses
on investment securities in the available-for-sale
(AFS) and held-to-maturity (HTM) portfolios;
• losses on exposures resulting from a global market
shock for firms with large trading and private
equity exposures; and
• losses from the default of the largest counterparty
of firms with substantial trading, processing, or
custodial operations.
PPNR equals net interest income plus noninterest
income minus noninterest expense. Consistent with
U.S. GAAP, the projection of noninterest expense
includes projected losses due to operational-risk
events such as fraud, computer system or other oper-
ating disruptions, and litigation-related costs and
expenses related to the disposition of foreclosed
properties (other real estate owned (OREO)
expenses).
Provisions for loan and lease losses equal projected
loan losses for the quarter plus the amount needed
for the ending ALLL to be at an appropriate level to21 CFR part 217.
Figure 8. Projecting net income and regulatory capital
Net interest income + noninterest income – noninterest expense
= pre-provision net revenue (PPNR)
PPNR + other revenue – provisions – AFS/HTM securities losses –
HFS/FVO loan losses – trading and counterparty losses
= pre-tax net income
Pre-tax net income – taxes – income attributable to minority interest
– change in the valuation allowance
= after-tax net income
After-tax net income – net distributions to common and preferred shareholders
and other net reductions to shareholder's equity from DFAST assumptions +
other comprehensive income
= change in equity capital
Change in equity capital –
change in adjustments and deductions from regulatory capital +
other additions to regulatory capital
= change in regulatory capital
Note: Change in the allowance for loan and lease losses + net charge-offs
= provisions
Note: PPNR includes income from mortgage servicing rights and
losses from operational-risk events and OREO costs.
11

account for projected future loan losses. The amount
of provisions over and above loan losses may be
negative, representing a drawdown of the ALLL (an
ALLL release, increasing net income), or positive,
representing a need to build the ALLL (an addi-
tional provision, decreasing net income).
Because the loss projections follow U.S. GAAP and
the Board’s capital adequacy rules, they incorporate
any differences in the way these guidelines recognize
income and losses based on where assets are held on
the firms’ balance sheets. As a result, losses projected
for similar or identical assets held in different portfo-
lios can sometimes differ. For example, losses on
loans held in the accrual portfolio equal credit losses
due to failure to pay obligations (cash flow losses
resulting in net charge-offs). For similar loans that
are held for sale or held for investment and classified
as fair value loans, projected losses represent the
change in fair value of the underlying assets in the
supervisory scenario.
Following this approach, changes in the fair value of
AFS securities and OTTI losses on securities are
separately projected over the nine-quarter planning
horizon. Under U.S. GAAP, changes in the fair value
of AFS securities are reflected in changes in accumu-
lated other comprehensive income (AOCI) but do
not flow through net income. In addition, if a secu-
rity becomes subject to OTTI, all or a portion of the
difference between the fair value and amortized cost
of the security must be recognized in earnings.22
Consistent with U.S. GAAP, OTTI projections incor-
porate other-than-temporary differences between
book value and fair value due to credit impairment
but generally do not incorporate differences reflect-
ing changes in liquidity or market conditions.
For the six firms subject to the full global market
shock, the losses on trading and private equity posi-
tions as well as the credit valuation adjustment are
projected assuming an instantaneous re-pricing of
these positions under the global market shock (see
Global Market Shock and Counterparty Default
Components). Losses from the global market shock
are assumed to occur in the first quarter of the plan-
ning horizon. No subsequent recoveries on these
positions are assumed, nor are there offsetting
changes such as reductions in compensation or other
expenses in reaction to the global market shock. In
addition, incremental losses from potential defaults
of obligors underlying firms’ trading positions are
projected over the planning horizon.
For the eight firms subject to the counterparty
default component, the losses associated with the
instantaneous and unexpected default of the largest
counterparty across derivatives and securities financ-
ing transaction (SFT) activities are projected. These
losses are assumed to occur in the first quarter of the
planning horizon.
For the six IHCs subject to the supervisory market
risk component in 2018, losses associated with the
supervisory market risk component are treated as an
add-on to losses associated with the macroeconomic
scenarios and are assumed to occur in the first quar-
ter of the planning horizon.
Over the planning horizon, the Federal Reserve proj-
ects quarter-end amounts for the components of the
balance sheet. These projections are made under the
assumption that firms maintain their willingness to
lend while demand for credit changes in response to
conditions in the scenario. Firms are assumed to use
lending standards in line with their long-run behav-
ior. Any new balances implied by these projections
are assumed to have the same risk characteristics as
those held by the firm at the start of the planning
horizon except for loan age. Where applicable, new
loans are assumed to be current, and firms are
assumed not to originate types of loans that are no
longer allowed under various regulations. The Fed-
eral Reserve also incorporates material changes in a
firm’s business plan, such as a planned merger,
acquisition, consolidation, or divestiture.23 Only
divestitures that had been completed or contractually
agreed to prior to April 5, 2018, are incorporated.
Once adjusted, assets are assumed to grow at the
same rate as the pre-adjusted balance sheet.
Model Methodology
The Federal Reserve’s projections of revenue,
expenses, and various types of losses and provisions
that flow into pre-tax net income are based on data
provided by the 35 firms participating in DFAST
2018 and on models developed or selected by Federal
Reserve staff and evaluated by an independent team
22 A security is considered impaired when the fair value of thesecurity falls below its amortized cost.
23 The inclusion of the effects of such expected changes to afirm’s business plan does not—and is not intended to—expressa view on the merits of such proposals and is not an approvalor non-objection to such plans.
12 Supervisory Stress Test Methodology and Results
of Federal Reserve model reviewers. The models are
intended to capture how the balance sheet, RWAs,
and net income of each firm would be affected by
the macroeconomic and financial conditions
described in the supervisory scenarios, given the
characteristics of the firms’ loans and securities
portfolios; trading, private equity, and counterparty
exposures from derivatives and SFTs; business activi-
ties; and other relevant factors.24
Detail of model-specific methodology is provided in
appendix B. Changes to supervisory models used in
DFAST 2018 are described in box 1.
Models were developed using multiple data sources,
including pooled historical data from financial insti-
tutions. An industrywide approach was generally
adhered to, in which the estimated model parameters
are the same for all firms and reflect the industry-
wide, portfolio-specific, instrument-specific response
to variation in the macroeconomic and financial
market variables. This approach reflects both the
challenge in estimating separate statistically robust
models for each of the 35 firms and the desire of the
Federal Reserve not to assume that historical firm-
specific results will prevail in the future. This means
that the projections made by the Federal Reserve will
not necessarily match similar projections made by
individual firms.
The Federal Reserve deviated from the industrywide
modeling approach when the historical data used to
estimate the model were not sufficiently granular to
capture the impact of firm-specific risk factors, and
firm-specific indicator variables (fixed effects) repre-
senting the firm’s average longer-term history were
more predictive of the firm's future performance
than industry variables. For example, the models to
project components of PPNR feature firm-specific
indicator variables because available data are not suf-
ficiently granular and a firm’s own history, after con-
trolling for structural changes over time, is proven to
be more predictive of the firm’s revenues and
expenses under stress than industry-level history. In
some other cases, such as the projections of trading
and counterparty losses, sensitivities to risk factors
and other information generated by the firms from
their internal pricing models are used due to the lack
of position-level data and modeling complexity.
Loan losses are estimated separately for different cat-
egories of loans, based on the type of obligor (e.g.,
consumer or commercial and industrial), collateral
(e.g., residential real estate, commercial real estate),
loan structure (e.g., revolving credit lines), and
accounting treatment (accrual or fair value). These
categories generally follow the classifications of the
Consolidated Financial Statements for Holding
Companies (FR Y-9C) regulatory report, though
some loss projections are made for more granular
loan categories.
Two general approaches are taken to model losses on
the accrual loan portfolio. In the first approach, the
models estimate expected losses under the macroeco-
nomic scenario. These models generally involve pro-
jections of the probability of default, loss given
default, and exposure at default for each loan or seg-
ment of loans in the portfolio, given conditions in
the scenario. In the second approach, the models
capture the historical behavior of net charge-offs
relative to changes in macroeconomic and financial
market variables.
Accrual loan losses are projected using detailed loan
information, including borrower characteristics, col-
lateral characteristics, characteristics of the loans or
credit facilities, amounts outstanding and yet to be
drawn down (for credit lines), payment history, and
current payment status.
Data are collected on individual loans or credit
facilities for wholesale loan, domestic retail credit
card, and residential mortgage portfolios. For other
domestic and international retail loans, the data are
collected based on segments of the portfolio (e.g.,
segments defined by borrower credit score, geo-
graphic location, and loan-to-value (LTV) ratio).
Losses on retail loans for which a firm chose the fair-
value option accounting treatment and loans carried
at the lower of cost or market value (i.e., loans held
for sale and held for investment) are estimated over
the nine quarters of the planning horizon using a
duration-based approach. Losses on wholesale loans
held for sale or measured under the fair-value option
are estimated by revaluing each loan or commitment
each quarter of the planning horizon.
Losses on securities held in the AFS and HTM port-
folios are estimated using models that address other-
24 In some cases, the loss models estimated the effect of local-levelmacroeconomic data, which were projected based on their his-torical covariance with national variables included in the super-visory scenarios.
June 2018 13

than-temporary differences between amortized cost
and fair market value due to credit impairment but
generally do not intend to reflect temporary differ-
ences reflecting changes in liquidity or market condi-
tions. Some securities, including U.S. Treasury and
U.S. government agency obligations and U.S. gov-
ernment agency mortgage-backed securities, are
assumed not to be at risk for the kind of credit
impairment that results in OTTI charges. For all
other debt securities, OTTI charges are projected
using the statistical relationship between historically
observed OTTI write-downs and measures of the
fair value of the securities. The models use securities
data collected at the individual security level, includ-
ing the amortized cost, market value, and any OTTI
taken on the security to date.
Losses related to the global market shock and the
counterparty default components are estimated
based on firm-estimated sensitivities to various mar-
ket risk factors, market values, and revaluations of
counterparty exposures and credit valuation adjust-
ment under the global market shock.
PPNR is generally projected using a series of models
that relate the components of a firm’s revenues and
non-credit-related expenses, expressed as a share of
relevant asset or liability balances, to firm character-
istics and to macroeconomic variables. Most compo-
nents are projected using data on historical revenues
and operating and other non-credit-related expenses
reported on the FR Y-9C report. Separate data are
collected about firms’ historical losses related to
Box 1. Model Changes for DFAST 2018 Box 1. Model Changes for DFAST 2018—continued
Each year, the Federal Reserve has refined both thesubstance and process of the Dodd-Frank Act super-visory stress tests, including its development andenhancement of independent supervisory models.The supervisory stress test models may be revised toreflect advances in modeling techniques, enhance-ments in response to model validation findings, incor-poration of richer and more detailed data, and identi-fication of more stable models or models withimproved performance, particularly under stressfuleconomic conditions.
For DFAST 2018, the Federal Reserve enhanced themodels that project other-than-temporary impair-ments (OTTI) for debt securities and losses on autoloans, first-lien mortgages, home equity loans, andcredit cards. In addition, the Federal Reserve com-pleted the phase-in of material enhancements to themodel that estimates certain components of pre-provision net revenue (PPNR), updated the PPNRmodel to include a more granular model of depositexpenses, and made changes to the calculation ofprojected post-stress capital to account for the pas-sage of the Tax Cuts and Jobs Act (see box 2).
In addition to the model changes described below,overall changes in securities, auto, first-lien, homeequity, and credit card losses are attributable to sev-eral other factors, including portfolio compositionchanges, changes in the macroeconomic scenario,and changes in the historical data used to estimatethe models.
Enhancements to the PPNR Models
The Federal Reserve began a two-year transition toan updated PPNR model in DFAST 2017, and theupdated model was fully in effect for DFAST 2018.The two-year phase-in policy was employed because
the PPNR model enhancement materially affectedthe PPNR projections and post-stress capital ratiosfor a number of firms.1
The PPNR model for DFAST 2018 was also updatedto include a more granular model of depositexpenses. The deposit expense model used in prioryears was estimated on aggregate deposit data thatincluded time, non-time, and foreign deposits. Themore granular model adopted for DFAST 2018 esti-mates separate models for the three types of depos-its (time, non-time, and foreign), allowing for differentrelationships with the macroeconomic variables. Formost firms, the more granular deposit expense modelresulted in lower deposit expenses and slightly higherPPNR.
Re-estimation of and Refinements to theDomestic Credit Card Model
The Federal Reserve regularly re-estimates modelparameters and makes other model refinementsresulting from ongoing model validation and perfor-mance monitoring. The frequency of model param-eter re-estimation is informed by data availability andthe results of performance monitoring. Although inmost cases model re-estimations and refinements donot materially change projections, in some casesthey can have material effects. For example, largechanges in the data sample used for model estima-tion can result in material changes in projections.
For DFAST 2018, there were changes to the estima-tion sample for the probability of default component
of the domestic credit card model and a number ofother refinements were made to each of the threecomponents of the model—probability of default,loss-given-default, and exposure-at-default. Collec-tively, the re-estimation and other refinementsresulted in materially higher projected losses for firmswith large bank card exposures. Consistent withstated policy, credit card loss estimates for the 2018stress test reflect the average of the model used dur-ing DFAST 2017 and the updated model. Credit cardloss estimates for the 2019 stress test will reflect theupdated model only.2
Enhancements to the Model ofOther-than-Temporary Impairments for DebtSecurities
The model to project OTTI for debt securities wasrevised to increase simplicity and consistency acrosssecurity types. Under the approach used in prioryears, a number of different models were used toproject OTTI for different types of debt securities,creating conceptual inconsistency. Under theapproach used in DFAST 2018, a single conceptualframework is used to project OTTI on all debt securi-ties.3 The new framework is based on the historicalrelationship between OTTI write-downs on securitiesand measures of the fair value of the securities. Thatrelationship is estimated on a comprehensive set ofdata on OTTI write-downs.4 Projections of OTTI
write-downs are made using this estimated relation-ship and projections of the fair value of securitiesfrom the supervisory fair value model.
The new OTTI framework represents a significantconceptual change to the Federal Reserve’sapproach to project OTTI on debt securities. Therevised approach more consistently captures theOTTI response to the economic scenarios across thedifferent asset types. This change resulted in smallchanges to post-stress capital ratios, both in theaggregate and for individual firms.
Re-estimation of and Refinements to OtherSupervisory Models
In addition to the domestic credit card model, therewere changes to the estimation samples for the autoloan, first-lien residential mortgage, and home equitymodels, and a number of other refinements weremade to those models. Collectively, the re-estimationand other refinements resulted in higher projectedlosses for firms with large auto loan exposures, par-ticularly exposures to subprime auto loans. For first-lien residential mortgages and home equity loans andlines of credit, the effects of the model changes aremodest—model changes result in a small increase inthe first-lien loss rate and a small decrease in theportfolio loss rate for home equity loans and lines ofcredit.
Both operational-risk models—the historical simula-tion model and the regression model—werere-estimated on updated operational-risk historicaldata. The model re-estimation and enhancementsresult in moderately higher operational-risk losses.
(continued on next page)
1 Starting in DFAST 2017, the Federal Reserve began to adhere toa policy of phasing in the most material model enhancementsover two stress test cycles to smooth the effect on post-stresscapital ratios. See 82 Fed. Reg. 59528 (Dec. 15, 2017).
2 See footnote 1 above.3 Losses on equity securities continue to be based on the pro-
jected fair value of each security as determined by the path of theU.S. equities index and the sensitivity of each security’s returns tothe overall returns of the index.
4 The dataset of OTTI write-downs is comprised of data from theFR Y-14Q as well as data from U.S. life insurance companies.
14 Supervisory Stress Test Methodology and Results

operational-risk events, which are modeled sepa-
rately from other components of PPNR.
The balance sheet projections are derived using a com-
mon framework for determining the effect of the sce-
narios on balance sheet growth, and, as noted, incor-
porate assumptions about credit supply that limit
aggregate credit contraction. These sets of projections
are based on historical data from the Federal Reserve’s
Financial Accounts of the United States (Z.1) statisti-
cal release, which is a quarterly publication by the Fed-
eral Reserve of national flow of funds, consolidated
balance sheet information for each firm, and addi-
tional data collected by the Federal Reserve.25
Once pre-tax net income is determined using the
above components, a consistent tax rate is applied to
calculate after-tax net income. After-tax net income
also includes other tax effects, such as changes in the
valuation allowance applied to deferred tax assets
(DTAs) and income attributable to minority inter-
ests. See box 2 for an explanation of modifications to
the calculation of projected capital to account for the
passage of the TCJA in December 2017.
Model Risk Management,Governance, and Validation
The Federal Reserve places great emphasis on the
credibility of its supervisory stress testing process,
25 Financial Accounts of the United States (Z.1) is available on theFederal Reserve website at www.federalreserve.gov/releases/z1/.
Box 1. Model Changes for DFAST 2018 Box 1. Model Changes for DFAST 2018—continued
Each year, the Federal Reserve has refined both thesubstance and process of the Dodd-Frank Act super-visory stress tests, including its development andenhancement of independent supervisory models.The supervisory stress test models may be revised toreflect advances in modeling techniques, enhance-ments in response to model validation findings, incor-poration of richer and more detailed data, and identi-fication of more stable models or models withimproved performance, particularly under stressfuleconomic conditions.
For DFAST 2018, the Federal Reserve enhanced themodels that project other-than-temporary impair-ments (OTTI) for debt securities and losses on autoloans, first-lien mortgages, home equity loans, andcredit cards. In addition, the Federal Reserve com-pleted the phase-in of material enhancements to themodel that estimates certain components of pre-provision net revenue (PPNR), updated the PPNRmodel to include a more granular model of depositexpenses, and made changes to the calculation ofprojected post-stress capital to account for the pas-sage of the Tax Cuts and Jobs Act (see box 2).
In addition to the model changes described below,overall changes in securities, auto, first-lien, homeequity, and credit card losses are attributable to sev-eral other factors, including portfolio compositionchanges, changes in the macroeconomic scenario,and changes in the historical data used to estimatethe models.
Enhancements to the PPNR Models
The Federal Reserve began a two-year transition toan updated PPNR model in DFAST 2017, and theupdated model was fully in effect for DFAST 2018.The two-year phase-in policy was employed because
the PPNR model enhancement materially affectedthe PPNR projections and post-stress capital ratiosfor a number of firms.1
The PPNR model for DFAST 2018 was also updatedto include a more granular model of depositexpenses. The deposit expense model used in prioryears was estimated on aggregate deposit data thatincluded time, non-time, and foreign deposits. Themore granular model adopted for DFAST 2018 esti-mates separate models for the three types of depos-its (time, non-time, and foreign), allowing for differentrelationships with the macroeconomic variables. Formost firms, the more granular deposit expense modelresulted in lower deposit expenses and slightly higherPPNR.
Re-estimation of and Refinements to theDomestic Credit Card Model
The Federal Reserve regularly re-estimates modelparameters and makes other model refinementsresulting from ongoing model validation and perfor-mance monitoring. The frequency of model param-eter re-estimation is informed by data availability andthe results of performance monitoring. Although inmost cases model re-estimations and refinements donot materially change projections, in some casesthey can have material effects. For example, largechanges in the data sample used for model estima-tion can result in material changes in projections.
For DFAST 2018, there were changes to the estima-tion sample for the probability of default component
of the domestic credit card model and a number ofother refinements were made to each of the threecomponents of the model—probability of default,loss-given-default, and exposure-at-default. Collec-tively, the re-estimation and other refinementsresulted in materially higher projected losses for firmswith large bank card exposures. Consistent withstated policy, credit card loss estimates for the 2018stress test reflect the average of the model used dur-ing DFAST 2017 and the updated model. Credit cardloss estimates for the 2019 stress test will reflect theupdated model only.2
Enhancements to the Model ofOther-than-Temporary Impairments for DebtSecurities
The model to project OTTI for debt securities wasrevised to increase simplicity and consistency acrosssecurity types. Under the approach used in prioryears, a number of different models were used toproject OTTI for different types of debt securities,creating conceptual inconsistency. Under theapproach used in DFAST 2018, a single conceptualframework is used to project OTTI on all debt securi-ties.3 The new framework is based on the historicalrelationship between OTTI write-downs on securitiesand measures of the fair value of the securities. Thatrelationship is estimated on a comprehensive set ofdata on OTTI write-downs.4 Projections of OTTI
write-downs are made using this estimated relation-ship and projections of the fair value of securitiesfrom the supervisory fair value model.
The new OTTI framework represents a significantconceptual change to the Federal Reserve’sapproach to project OTTI on debt securities. Therevised approach more consistently captures theOTTI response to the economic scenarios across thedifferent asset types. This change resulted in smallchanges to post-stress capital ratios, both in theaggregate and for individual firms.
Re-estimation of and Refinements to OtherSupervisory Models
In addition to the domestic credit card model, therewere changes to the estimation samples for the autoloan, first-lien residential mortgage, and home equitymodels, and a number of other refinements weremade to those models. Collectively, the re-estimationand other refinements resulted in higher projectedlosses for firms with large auto loan exposures, par-ticularly exposures to subprime auto loans. For first-lien residential mortgages and home equity loans andlines of credit, the effects of the model changes aremodest—model changes result in a small increase inthe first-lien loss rate and a small decrease in theportfolio loss rate for home equity loans and lines ofcredit.
Both operational-risk models—the historical simula-tion model and the regression model—werere-estimated on updated operational-risk historicaldata. The model re-estimation and enhancementsresult in moderately higher operational-risk losses.
(continued on next page)
1 Starting in DFAST 2017, the Federal Reserve began to adhere toa policy of phasing in the most material model enhancementsover two stress test cycles to smooth the effect on post-stresscapital ratios. See 82 Fed. Reg. 59528 (Dec. 15, 2017).
2 See footnote 1 above.3 Losses on equity securities continue to be based on the pro-
jected fair value of each security as determined by the path of theU.S. equities index and the sensitivity of each security’s returns tothe overall returns of the index.
4 The dataset of OTTI write-downs is comprised of data from theFR Y-14Q as well as data from U.S. life insurance companies.
June 2018 15

which is supported by a rigorous program of super-
visory model risk management. The Federal
Reserve’s supervisory model risk management pro-
gram includes effective oversight of model develop-
ment to ensure adherence to consistent development
principles; rigorous and independent model valida-
tion; a strong supervisory model governance struc-
ture; and annual communication of the state of
model risk in the overall program to the Board of
Governors. Several aspects of the Federal Reserve’s
supervisory stress testing program, including its
model risk management framework, have been
reviewed by external parties.
Most of the models used for supervisory stress test-
ing were developed by Federal Reserve staff,
although certain models were developed by third
Box 2. Changes to the Capital Calculation to Account for the Tax Cuts andJobs Act
The Tax Cuts and Jobs Act (TCJA), signed into lawon December 22, 2017, contained a number ofchanges to the tax code that were incorporated intothe projections of post-stress capital for DFAST2018. The banking agencies have previously summa-rized the accounting and reporting requirement impli-cations of the TCJA.1 Certain elements of theTCJA—particularly those relating to taxes on foreignoperations and earnings and deferred tax assetrevaluation—had the immediate effect of reducingthe amount of regulatory capital many firms held asof December 31, 2017.
The supervisory capital calculation was amended toconform to changes in the tax code that directlyaffect the supervisory post-stress capital projections.In prior years, supervisory projections applied a stan-dard effective tax rate of 35 percent, consistent withthe prevailing corporate tax rate, and incorporatednet operating loss (NOL) carrybacks as well as NOLcarryforwards. For DFAST 2018, the standard effec-tive tax rate used in supervisory projections was low-ered to 21 percent, to be consistent with the currentcorporate tax rate. In addition, supervisory calcula-tions were changed to reflect the elimination of NOLcarrybacks,2 the new 80 percent limit on carryfor-ward utilization, and the grandfathering of tax ben-efits resulting from pre-2018 NOLs.3
Effect of Capital Calculation Changes onPost-Stress Capital Ratios
The reduction in the corporate tax rate directlyaffects supervisory projections of after-tax netincome. The lower corporate tax rate generallyresults in higher after-tax income and higher capital
ratios for firms with positive pre-tax net income overthe projection horizon. Conversely, a lower tax rateresults in lower (more negative) after-tax income andlower capital ratios for firms with negative pre-tax netincome over the projection horizon.
Under the pre-TCJA tax code, a firm with negativetaxable income could recover its past two years oftaxes paid (NOL carrybacks) before it began to gen-erate new deferred tax assets from NOL carryfor-wards, which are fully deducted from regulatory capi-tal. Consistent with the TCJA, NOL carrybacks areeliminated from the supervisory capital calculation.The elimination of NOL carrybacks generally resultsin higher DTAs from NOL and lower post-stress capi-tal ratios for firms with positive taxes paid in the twoyears leading to the start of the stress test.
Similarly, the TCJA limitations on NOL carryforwardsleads to a slower reduction of DTAs from NOLs whena firm is projected to earn positive net income in thestress test. Under the pre-TCJA tax code, a firmcould offset up to 100 percent of taxable incomeusing NOLs carried-forward from prior years, thusproviding a net income boost as firms entered arecovery period. Under TCJA, a firm can only offset80 percent of taxable income using NOLcarryforwards.
Figure A depicts a hypothetical example of theimpacts described above for two firms with the samepre-tax net income path in the stress test but differ-ent taxes paid leading up to it. As discussed above,prior to incurring losses, both firms exhibit higherafter-tax net income resulting from the lower tax ratein the new tax code. During stressful conditions, theelimination of NOL carrybacks leads to lower after-tax income for both firms; however, when comparedto the pre-TCJA tax code, the elimination of NOL car-rybacks has a bigger impact on the firm with hightaxes paid prior to the stress test. Finally, underTCJA, in the recovery period both firms have lowerafter-tax net income due to the 80 percent cap onNOL carryforwards. In total, under the pre-TCJA taxcode, between two firms with same projected losses
(continued on next page)
1 See SR letter 18-2, “Interagency Statement on Accounting andReporting Implications of the New Tax Law,” January 18, 2018,https://www.federalreserve.gov/supervisionreg/srletters/sr1802.htm.
2 Note that a firm may still consider the hypothetical reversal oftemporary difference deferred tax assets (DTAs) based on taxespaid during a given year when determining the temporary differ-ence DTAs subject to threshold deduction.
3 Prior to the TCJA, NOLs could be carried forward to offset100 percent of taxable income for up to 20 years. The TCJA low-ered the offset percentage to 80 percent with no expiration.
16 Supervisory Stress Test Methodology and Results

parties.26 In developing the supervisory models, Fed-
eral Reserve staff draws on economic research as well
as industry practice in modeling the effects of bor-
rower, instrument, collateral characteristics, and
macroeconomic factors on revenues, expenses, and
losses. Three groups are collectively responsible for
managing and validating the Federal Reserve’s super-
visory stress testing models: the Model Oversight
26 A list of providers of the proprietary models and data used bythe Federal Reserve in connection with DFAST 2018 is avail-able in appendix B. In some instances, the Federal Reserve relieson firm-provided estimates in place of model output.
Box 2. Changes to the Capital Calculation to Account for the Tax Cuts andJobs Act—continued
over the planning horizon, the firm with higher taxespaid in the two years leading up to the start of thestress test had significantly higher after-tax netincome in the stress period than the firm with lowtaxes paid. Under TCJA, the two firms have identicalpaths of after-tax net income in the stress test.
In DFAST 2018, changes resulting from the TCJA hada negative effect on many firms’ post-stress capitalratios, with the effects being material for some firms.On average, the impact of the changes was approxi-mately −30 bps.
Figure A. Hypothetical example of pre-tax and post-tax net income before and after the passage of TCJA
75 75 75
(150)
(100)
(80)
(50)
0
25 30
50 50
-200
-150
-100
-50
0
50
100
T-2 T-1 T0 T1 T2 T3 T4 T5 T6 T7 T8 T9
Pre-tax net income
After-tax net income (pre-TCJA)
After-tax net income (under TCJA)
(301)
(146)
(380)
(232)
(54)
(400)
(350)
(300)
(250)
(200)
(150)
(100)
(50)
0
Loss periods
(T1–T4)
Loss periods
through recovery
(T1–T9)
All periods
(T2–T9)
25 25 25
(150)
(100)
(80)
(50)
0
25 30
50 50
T-2 T-1 T0 T1 T2 T3 T4 T5 T6 T7 T8 T9
Path of pre-tax and after-tax net income
Pre-tax net income
After-tax net income (pre-TCJA)
After-tax net income (under TCJA)
-200
-150
-100
-50
0
50
100
(354)
(199)
(150)
(380)
(232)
(172)
(400)
(350)
(300)
(250)
(200)
(150)
(100)
(50)
0Cumulative after-tax net income
Path of pre-tax and after-tax net income Cumulative after-tax net income
Pre-TCJA
Under TCJA
Loss periods
(T1–T4)
Loss periods
through recovery
(T1–T9)
All periods
(T2–T9)
Pre-TCJA
Under TCJA
1. Firm with high taxes paid leading up to stress test
2. Firm with low taxes paid leading up to stress test
June 2018 17

Group (MOG), the System Model Validation unit,
and the Supervisory Stress Test Model Governance
Committee.
Supervisory model development, implementation,
and use is overseen by the MOG, a national commit-
tee of senior staff drawn from across the Federal
Reserve System. The MOG strives to produce super-
visory stress test results that reflect likely outcomes
under the supervisory scenarios and ensures that
model design across the system of supervisory stress
testing models result in projections that are
• from an independent supervisory perspective;
• forward-looking and may incorporate outcomes
outside of historical experience, where appropriate;
• based on the same set of models and assumptions
across firms;
• generated from simpler and more transparent
approaches, where appropriate;
• stable such that changes in model projections over
time reflect underlying risk factors, scenarios, and
model enhancements, rather than transitory
factors;
• appropriately conservative; and
• consistent with the purpose of a stress testing
exercise.
In overseeing the development of supervisory mod-
els, the MOG considers whether modeling choices
and structures adhere to the above principles, reviews
the results of common model risk management
tools,27 and assesses potential model limitations and
sources of uncertainty surrounding final outputs.
Assisting the MOG in these efforts is the Model Risk
Management Group, which reviews, assesses, and
implements industry standards and best practices for
model risk management in stress testing operations.
This group is composed of Federal Reserve staff and
helps set internal policies, procedures, and standards
related to the management of model risk stemming
from individual models as well as the system of
supervisory models used to project post-stress capital
ratios. In this way, the Federal Reserve’s approach
reflects the same standards for model risk manage-
ment to which banking organizations are expected
to adhere.
Each year, the supervisory stress testing models are
validated by an independent System Model Valida-
tion unit comprised of dedicated full-time staff
members not involved in supervisory modeling,
supplemented by subject matter experts from across
the Federal Reserve System. This group’s model vali-
dation process includes reviews of model perfor-
mance and conceptual soundness and reviews of the
processes, procedures, and controls used in model
development, implementation, and the production of
results. For each model, the group assesses, on an
annual basis, the model’s reliability, based on its
underlying assumptions, theory, and methods, and
determines whether there are any issues requiring
remediation as a result of that assessment. The
Model Validation Council, a group of academic
experts not affiliated with the Federal Reserve, pro-
vides advice to the Federal Reserve on the validation
program and activities.28
The MOG and the System Model Validation unit are
overseen by the Director of the Federal Reserve
Board’s Division of Supervision and Regulation.
The Supervisory Stress Test Model Governance
Committee—a committee of senior Federal Reserve
staff that includes representatives from model devel-
opment, implementation, validation, and scenario
design—advises the Director on matters related to
the governance of supervisory stress test models and
facilitates the Director’s oversight role by providing a
regular forum to present and discuss relevant issues.
This committee also identifies key model risk issues
in the supervisory stress testing program and elevates
these issues to the Director and the Board of Gover-
nors. In 2016, the committee initiated an annual for-
mal communication to the Board of Governors on
the structure of the supervisory stress test model risk
management program and the state of model risk as
determined by each year's model validation process.
The development and validation of the supervisory
stress testing models have been subject to rigorous
review by both internal and external parties. In 2015,
the Federal Reserve Office of the Inspector General
(OIG) reviewed supervisory stress testing model vali-
dation activities and recommended improvements in
staffing, model inventories, and communication with
management.29 Each of the suggested improvements
27 Those tools include the use of benchmark models, where appli-cable, performance testing, and sensitivity analysis, which iso-lates the effect of a change in one model input on the eventualmodel output.
28 See “Federal Reserve Board announces the formation of theModel Validation Council,” April 20, 2012, https://www.federalreserve.gov/newsevents/pressreleases/bcreg20120420a.htm.
29 See The Board Identified Areas of Improvement for Its Supervi-sory Stress Testing Model Validation Activities, and Opportuni-
18 Supervisory Stress Test Methodology and Results

recommended by the OIG has been implemented,
and the OIG has formally closed its findings. In
2016, the Government Accountability Office (GAO)
issued a report on the Federal Reserve’s stress testing
and capital planning programs.30 The GAO’s report
recognized that the Federal Reserve’s stress testing
program has played a key role in evaluating and
maintaining the stability of the U.S. financial system
during and since the most recent financial crisis. The
GAO report included five recommendations as to
how the Federal Reserve could improve its manage-
ment of model risk and ensure that decisions based
on supervisory stress test results are informed by an
understanding of model risk. The Federal Reserve
has already addressed a number of recommendations
and continues to enhance the program consistent
with other GAO recommendations.
To further enhance the credibility of the supervisory
stress test, the Federal Reserve invited comment on a
proposal to increase the transparency of the stress
testing program in December 2017 (see box 3).
Data Inputs
The models are developed and implemented with data
collected by the Federal Reserve on regulatory reports
as well as proprietary third-party industry data.
Certain projections rely on aggregate information
from the Financial Accounts of the United States
(Z.1) statistical release. Others rely on the FR Y-9C
report, which contains consolidated income state-
ment and balance sheet information for each firm.
Additionally, FR Y-9C includes off-balance sheet
items and other supporting schedules, such as the
components of RWAs and regulatory capital.
Most of the data used in the Federal Reserve’s stress
test projections are collected through the Capital
Assessments and Stress Testing (FR Y-14A/Q/M)
information collection, which include a set of
annual, quarterly, or monthly schedules.31 These
reports collect detailed data on PPNR, loans, securi-
ties, trading and counterparty risk, losses related to
operational-risk events, and business plan changes.
Each of the 35 firms participating in DFAST 2018
submitted data as of December 31, 2017, through
the FR Y-14M and FR Y-14Q reports in February,
March, and April 2018. The same firms submitted
the FR Y-14A reports, which also include projected
data, on April 5, 2018.
Firms were required to submit detailed loan and
securities information for all material portfolios,
where the portfolio is deemed to be material if the
size of the portfolio exceeds either 5 percent of the
firm’s tier 1 capital or $5 billion for LISCC and large
and complex firms. Portfolios are deemed to be
material for large and noncomplex firms if the size of
the portfolio exceeds either 10 percent of the firm’s
tier 1 capital or $5 billion.32 The portfolio categories
are defined in the FR Y-14M and Y-14Q instruc-
tions. Each firm has the option to either submit or
not submit the relevant data schedule for a given
portfolio that does not meet the materiality threshold
(as defined in the FR Y-14Q and FR Y-14M instruc-
tions). If the firm does not submit data on its imma-
terial portfolio(s), the Federal Reserve will assign the
median loss rate estimated across the set of firms
with material portfolios.
While firms are responsible for ensuring the com-
pleteness and accuracy of data reported in the
FR Y-14 information collection, the Federal Reserve
made considerable efforts to validate firm-reported
data and requested resubmissions of data where
errors were identified. If data quality remained defi-
cient after resubmissions, conservative assumptions
were applied to a particular portfolio or specific
data, depending on the severity of deficiencies. If the
quality of a firm’s submitted data was deemed too
deficient to produce a supervisory model estimate for
a particular portfolio, the Federal Reserve assigned a
high loss rate (e.g., 90th percentile) or a conservative
PPNR rate (e.g., 10th percentile) to the portfolio bal-
ances based on supervisory projections of portfolio
losses or PPNR estimated for other firms. If data
that are direct inputs to supervisory models were
missing or reported erroneously but the problem was
isolated in such a way that the existing supervisory
framework could still be used, a conservative value
(e.g., 10th percentile PPNR rate or 90th percentile
loss rate) based on all available data reported byties Exist for Further Enhancement, October 29, 2015, https://oig.federalreserve.gov/reports/board-supervisory-stress-testing-model-validation-reissue-oct2015.pdf.
30 See Additional Actions Could Help Ensure the Achievement ofStress Test Goals, GAO-17-48, November 2016, https://www.gao.gov/assets/690/681020.pdf.
31 The FR Y-14 reports are available on the Federal Reserve web-site at www.federalreserve.gov/apps/reportforms/default.aspx.
32 The Federal Reserve raised the immateriality threshold for largeand noncomplex firms from 5 percent of tier 1 capital or $5 bil-lion to 10 percent of tier 1 capital or $5 billion. See Amend-ments to the Capital Plan and Stress Test Rules, 82 Fed. Reg.9308 (February 3, 2017), https://www.gpo.gov/fdsys/pkg/FR-2017-02-03/pdf/2017-02257.pdf.
June 2018 19

firms was assigned to the specific data. These
assumptions are intended to reflect a conservative
view of the risk characteristics of the portfolios
given insufficient information to make more risk-
sensitive projections.
Capital Action Assumptions andRegulatory Capital Ratios
After-tax net income and AOCI are combined with
prescribed capital actions to estimate components of
regulatory capital. Changes in the regulatory capital
components are the primary drivers in changes in
capital levels and ratios over the planning horizon. In
addition to the regulatory capital components, the
calculation of regulatory capital ratios accounts for
taxes and items subject to adjustment or deduction
in regulatory capital, limits the recognition of certain
assets that are less loss-absorbing, and imposes other
restrictions as specified in the Board’s regulatory
revised capital framework.
To project post-stress capital ratios for the Dodd-
Frank Act supervisory stress tests, the Federal
Reserve uses a standardized set of capital action
assumptions that are specified in the Dodd-Frank
Act stress test rules. Generally, common stock divi-
dend payments are assumed to continue at the same
level as the previous year. Scheduled dividend, inter-
est, or principal payments on any other capital
instrument eligible for inclusion in the numerator of
Box 3. Notice of Proposed Rulemaking to Increase Transparency of StressTesting Program
Through the Dodd-Frank Act supervisory stress testexercise, among other supervisory programs, theFederal Reserve promotes soundness and stability inthe financial system and the U.S. economy. Regular,public disclosure of the supervisory stress test mod-els, methodologies, and results enhances the cred-ibility of the stress test. In addition, more transpar-ency around the results and processes can lead toimprovements in the Federal Reserve’s approachesand provide information to the public that furthers thegoal of maintaining market and public confidence inthe financial system. For these reasons, the FederalReserve publishes detailed information about itsstress tests every year.
The annual disclosures of the stress test results andsupervisory models represent a significant increase inthe public transparency of large bank supervision inthe United States when compared to the pre-crisisperiod. In addition to those public disclosures, theFederal Reserve has published information about itsscenario design framework and annual letters detail-ing material model changes, and it hosts an annualsymposium in which supervisors and financial indus-try practitioners share best practices in stress testmodeling, model risk management, and governance.
The Federal Reserve is committed to finding addi-tional ways to increase the transparency of its stresstest to help the public better understand the work-ings of the stress test and thereby increase the cred-ibility of the stress testing process and output. InDecember 2017, the Federal Reserve Board invitedcomment on a proposal designed to increase thetransparency of the supervisory stress test while
maintaining the Federal Reserve’s ability to test theresilience of the nation’s largest and most complexbanks.1
The proposal has three elements. First, the proposedenhanced model disclosure would include therelease of more detailed information about supervi-sory models, including the publication of portfolios ofhypothetical loans and loss rates for those portfolios.Second, a proposed “Stress Testing Policy State-ment” describes the Board’s approach to the devel-opment, implementation, use, and validation of thesupervisory stress test models and methodologies.Third, proposed amendments to the Scenario DesignPolicy Statement (originally published in Novem-ber 2013) would increase counter-cyclicality in sce-nario design, clarify the Board’s approach to settingthe path of the unemployment rate and house pricesin the macroeconomic scenarios, and provide noticethat the Federal Reserve is exploring the possibility ofincorporating stress to the cost of wholesale fundingin the supervisory stress test scenarios. Together,these three elements of the proposal represent anotable increase in the transparency of the FederalReserve’s stress test.
The Federal Reserve Board received comments onthe proposal in the first quarter of 2018 and is cur-rently reviewing comments and considering ways toamend the proposals to be responsive to thosecomments.
1 See https://www.federalreserve.gov/newsevents/pressreleases/bcreg20171207a.htm.
20 Supervisory Stress Test Methodology and Results
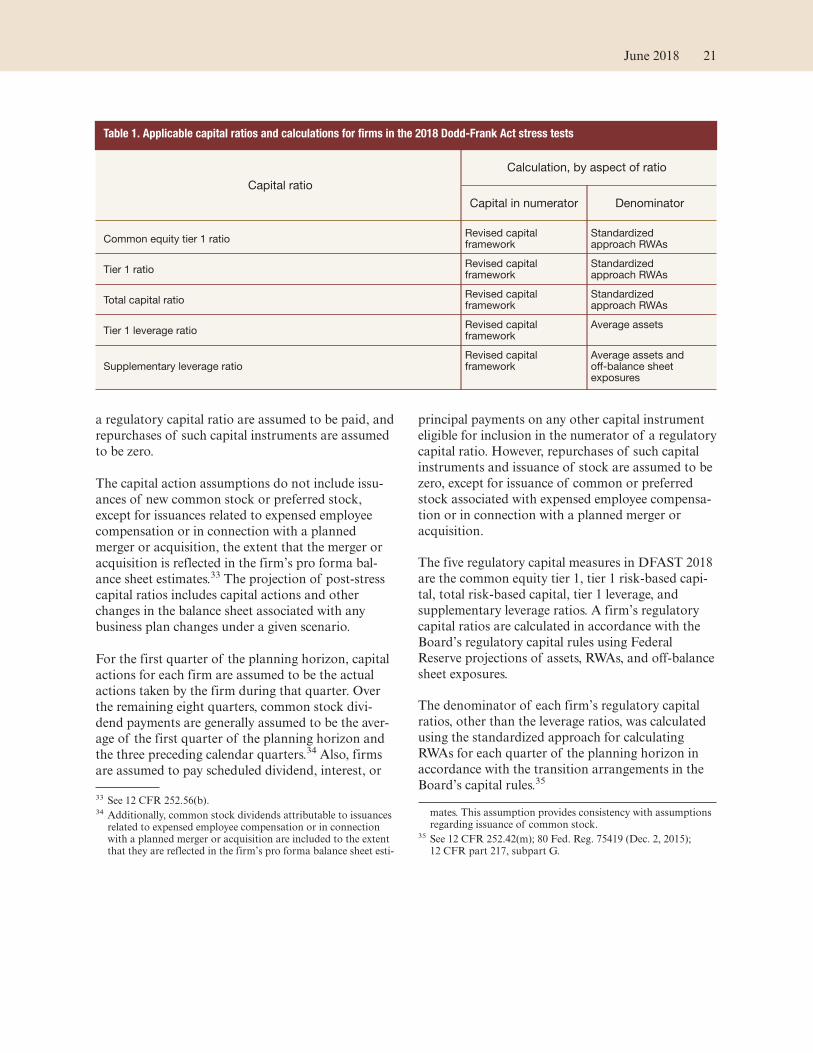
a regulatory capital ratio are assumed to be paid, and
repurchases of such capital instruments are assumed
to be zero.
The capital action assumptions do not include issu-
ances of new common stock or preferred stock,
except for issuances related to expensed employee
compensation or in connection with a planned
merger or acquisition, the extent that the merger or
acquisition is reflected in the firm’s pro forma bal-
ance sheet estimates.33 The projection of post-stress
capital ratios includes capital actions and other
changes in the balance sheet associated with any
business plan changes under a given scenario.
For the first quarter of the planning horizon, capital
actions for each firm are assumed to be the actual
actions taken by the firm during that quarter. Over
the remaining eight quarters, common stock divi-
dend payments are generally assumed to be the aver-
age of the first quarter of the planning horizon and
the three preceding calendar quarters.34 Also, firms
are assumed to pay scheduled dividend, interest, or
principal payments on any other capital instrument
eligible for inclusion in the numerator of a regulatory
capital ratio. However, repurchases of such capital
instruments and issuance of stock are assumed to be
zero, except for issuance of common or preferred
stock associated with expensed employee compensa-
tion or in connection with a planned merger or
acquisition.
The five regulatory capital measures in DFAST 2018
are the common equity tier 1, tier 1 risk-based capi-
tal, total risk-based capital, tier 1 leverage, and
supplementary leverage ratios. A firm’s regulatory
capital ratios are calculated in accordance with the
Board’s regulatory capital rules using Federal
Reserve projections of assets, RWAs, and off-balance
sheet exposures.
The denominator of each firm’s regulatory capital
ratios, other than the leverage ratios, was calculated
using the standardized approach for calculating
RWAs for each quarter of the planning horizon in
accordance with the transition arrangements in the
Board’s capital rules.35
33 See 12 CFR 252.56(b).34 Additionally, common stock dividends attributable to issuances
related to expensed employee compensation or in connectionwith a planned merger or acquisition are included to the extentthat they are reflected in the firm’s pro forma balance sheet esti-
mates. This assumption provides consistency with assumptionsregarding issuance of common stock.
35 See 12 CFR 252.42(m); 80 Fed. Reg. 75419 (Dec. 2, 2015);12 CFR part 217, subpart G.
Table 1. Applicable capital ratios and calculations for firms in the 2018 Dodd-Frank Act stress tests
Capital ratio
Calculation, by aspect of ratio
Capital in numerator Denominator
Common equity tier 1 ratio Revised capitalframework
Standardizedapproach RWAs
Tier 1 ratio Revised capitalframework
Standardizedapproach RWAs
Total capital ratio Revised capitalframework
Standardizedapproach RWAs
Tier 1 leverage ratio Revised capitalframework
Average assets
Supplementary leverage ratio Revised capitalframework
Average assets andoff-balance sheetexposures
June 2018 21

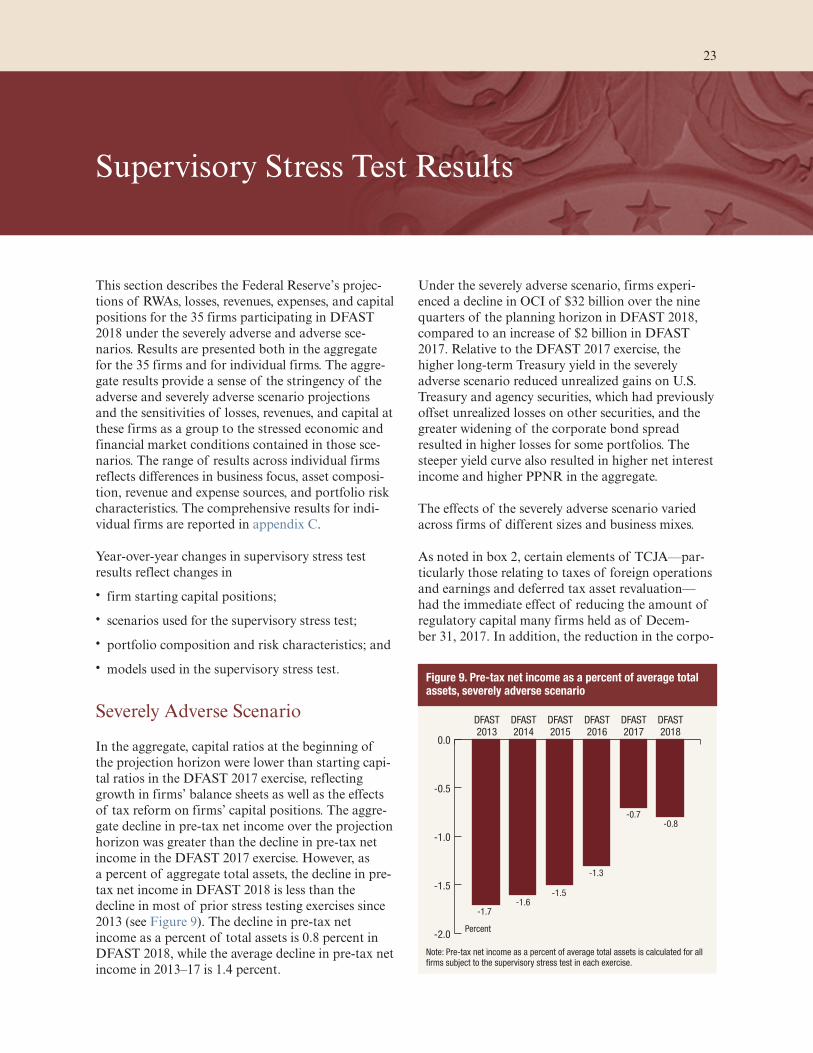
Supervisory Stress Test Results
This section describes the Federal Reserve’s projec-
tions of RWAs, losses, revenues, expenses, and capital
positions for the 35 firms participating in DFAST
2018 under the severely adverse and adverse sce-
narios. Results are presented both in the aggregate
for the 35 firms and for individual firms. The aggre-
gate results provide a sense of the stringency of the
adverse and severely adverse scenario projections
and the sensitivities of losses, revenues, and capital at
these firms as a group to the stressed economic and
financial market conditions contained in those sce-
narios. The range of results across individual firms
reflects differences in business focus, asset composi-
tion, revenue and expense sources, and portfolio risk
characteristics. The comprehensive results for indi-
vidual firms are reported in appendix C.
Year-over-year changes in supervisory stress test
results reflect changes in
• firm starting capital positions;
• scenarios used for the supervisory stress test;
• portfolio composition and risk characteristics; and
• models used in the supervisory stress test.
Severely Adverse Scenario
In the aggregate, capital ratios at the beginning of
the projection horizon were lower than starting capi-
tal ratios in the DFAST 2017 exercise, reflecting
growth in firms’ balance sheets as well as the effects
of tax reform on firms’ capital positions. The aggre-
gate decline in pre-tax net income over the projection
horizon was greater than the decline in pre-tax net
income in the DFAST 2017 exercise. However, as
a percent of aggregate total assets, the decline in pre-
tax net income in DFAST 2018 is less than the
decline in most of prior stress testing exercises since
2013 (see Figure 9). The decline in pre-tax net
income as a percent of total assets is 0.8 percent in
DFAST 2018, while the average decline in pre-tax net
income in 2013–17 is 1.4 percent.
Under the severely adverse scenario, firms experi-
enced a decline in OCI of $32 billion over the nine
quarters of the planning horizon in DFAST 2018,
compared to an increase of $2 billion in DFAST
2017. Relative to the DFAST 2017 exercise, the
higher long-term Treasury yield in the severely
adverse scenario reduced unrealized gains on U.S.
Treasury and agency securities, which had previously
offset unrealized losses on other securities, and the
greater widening of the corporate bond spread
resulted in higher losses for some portfolios. The
steeper yield curve also resulted in higher net interest
income and higher PPNR in the aggregate.
The effects of the severely adverse scenario varied
across firms of different sizes and business mixes.
As noted in box 2, certain elements of TCJA—par-
ticularly those relating to taxes of foreign operations
and earnings and deferred tax asset revaluation—
had the immediate effect of reducing the amount of
regulatory capital many firms held as of Decem-
ber 31, 2017. In addition, the reduction in the corpo-
Figure 9. Pre-tax net income as a percent of average totalassets, severely adverse scenario
-2.0
-1.5
-1.0
-0.5
0.0
DFAST2018
DFAST2017
DFAST2016
DFAST2015
DFAST2014
DFAST2013
Percent
-1.7-1.6
-1.5
-1.3
-0.7-0.8
Note: Pre-tax net income as a percent of average total assets is calculated for all
firms subject to the supervisory stress test in each exercise.
23
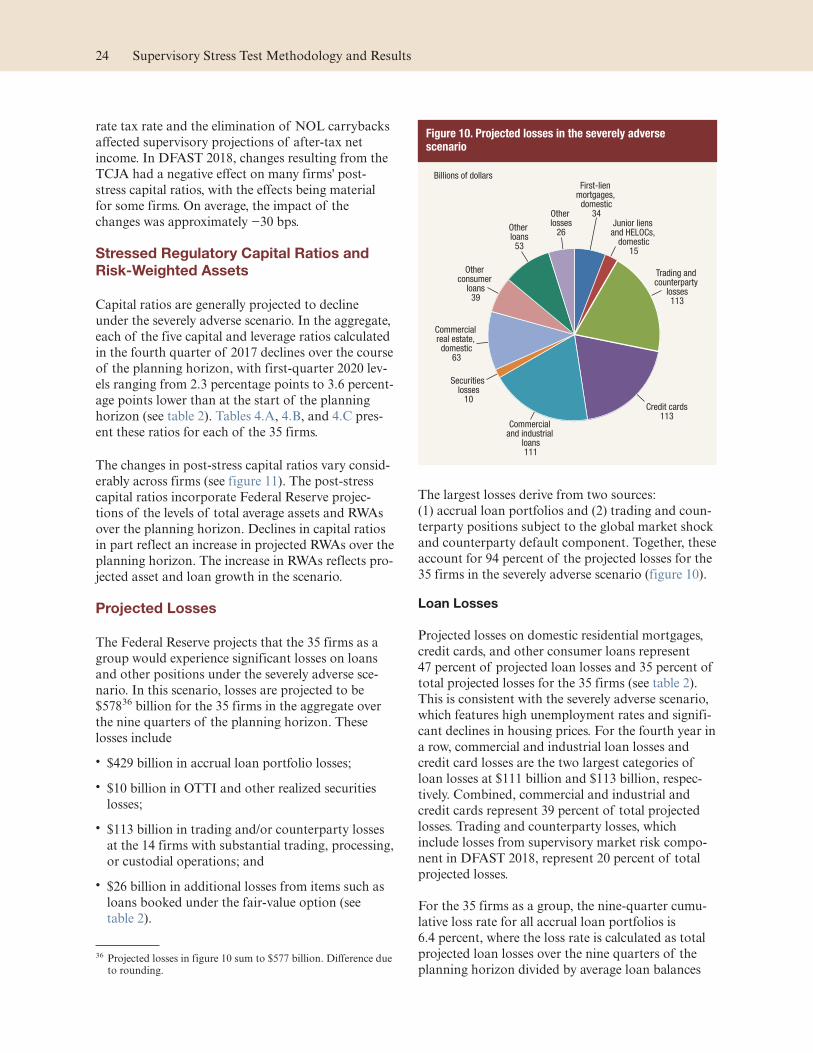
rate tax rate and the elimination of NOL carrybacks
affected supervisory projections of after-tax net
income. In DFAST 2018, changes resulting from the
TCJA had a negative effect on many firms' post-
stress capital ratios, with the effects being material
for some firms. On average, the impact of the
changes was approximately −30 bps.
Stressed Regulatory Capital Ratios and
Risk-Weighted Assets
Capital ratios are generally projected to decline
under the severely adverse scenario. In the aggregate,
each of the five capital and leverage ratios calculated
in the fourth quarter of 2017 declines over the course
of the planning horizon, with first-quarter 2020 lev-
els ranging from 2.3 percentage points to 3.6 percent-
age points lower than at the start of the planning
horizon (see table 2). Tables 4.A, 4.B, and 4.C pres-
ent these ratios for each of the 35 firms.
The changes in post-stress capital ratios vary consid-
erably across firms (see figure 11). The post-stress
capital ratios incorporate Federal Reserve projec-
tions of the levels of total average assets and RWAs
over the planning horizon. Declines in capital ratios
in part reflect an increase in projected RWAs over the
planning horizon. The increase in RWAs reflects pro-
jected asset and loan growth in the scenario.
Projected Losses
The Federal Reserve projects that the 35 firms as a
group would experience significant losses on loans
and other positions under the severely adverse sce-
nario. In this scenario, losses are projected to be
$57836 billion for the 35 firms in the aggregate over
the nine quarters of the planning horizon. These
losses include
• $429 billion in accrual loan portfolio losses;
• $10 billion in OTTI and other realized securities
losses;
• $113 billion in trading and/or counterparty losses
at the 14 firms with substantial trading, processing,
or custodial operations; and
• $26 billion in additional losses from items such as
loans booked under the fair-value option (see
table 2).
The largest losses derive from two sources:
(1) accrual loan portfolios and (2) trading and coun-
terparty positions subject to the global market shock
and counterparty default component. Together, these
account for 94 percent of the projected losses for the
35 firms in the severely adverse scenario (figure 10).
Loan Losses
Projected losses on domestic residential mortgages,
credit cards, and other consumer loans represent
47 percent of projected loan losses and 35 percent of
total projected losses for the 35 firms (see table 2).
This is consistent with the severely adverse scenario,
which features high unemployment rates and signifi-
cant declines in housing prices. For the fourth year in
a row, commercial and industrial loan losses and
credit card losses are the two largest categories of
loan losses at $111 billion and $113 billion, respec-
tively. Combined, commercial and industrial and
credit cards represent 39 percent of total projected
losses. Trading and counterparty losses, which
include losses from supervisory market risk compo-
nent in DFAST 2018, represent 20 percent of total
projected losses.
For the 35 firms as a group, the nine-quarter cumu-
lative loss rate for all accrual loan portfolios is
6.4 percent, where the loss rate is calculated as total
projected loan losses over the nine quarters of the
planning horizon divided by average loan balances
36 Projected losses in figure 10 sum to $577 billion. Difference dueto rounding.
Figure 10. Projected losses in the severely adversescenario
Billions of dollars
Other losses
26Other loans
53
Other consumer
loans39
Commercial real estate,
domestic63
Securities losses
10
Commercial and industrial
loans111
Credit cards113
Trading and counterparty
losses113
Junior liens and HELOCs,
domestic15
First-lien mortgages,
domestic34
24 Supervisory Stress Test Methodology and Results
over the horizon. Total loan loss rates vary signifi-
cantly across firms, ranging between 0.6 percent and
14.2 percent across these institutions (see table 7 and
figure 12).
The differences in total loan loss rates across the
firms reflect differences in the risk characteristics of
the portfolios held by each firm with regard to both
the type of lending of each portfolio and the loans
within each portfolio. Loan portfolio composition
matters because projected loss rates vary signifi-
cantly by loan type. In the aggregate, nine-quarter
cumulative loss rates vary between 2.7 percent on
domestic first-lien mortgages and 14.4 percent on
credit cards, reflecting both differences in typical per-
formance of these loans—some loan types tend to
generate higher losses, though generally also higher
revenue—and differences in the sensitivity of differ-
ent types of lending to the severely adverse scenario.
In particular, lending categories for which perfor-
mance is sensitive to credit spreads or housing prices
may experience high stressed loss rates due to the
considerable stress on these factors in the severely
adverse scenario.
Projected loss rates on most loan categories show simi-
lar dispersion across firms (see table 7 and figures D.1
through D.7).37 There are significant differences
across firms in the projected loan loss rates for simi-
lar types of loans. For example, while the median
projected loss rate on commercial and industrial
loans is 7.3 percent, the rates among firms with com-
mercial and industrial loans vary from a low of
2.4 percent to a high of 24.4 percent. For credit card
loans, the range of projected loss rates is from
9.1 percent to 21.2 percent, with a median of
14.7 percent.
Differences in projected loss rates across firms pri-
marily reflect differences in loan and borrower char-
acteristics. The composition of firms’ loan portfolios
shifted since the DFAST 2017 exercise, with corpo-
rate lending experiencing the most rapid growth. In
the aggregate, risk in bank holdings declined mod-
estly relative to DFAST 2017, due in part to
improved macroeconomic conditions. However,
pockets of risk grew in certain loan portfolios, such
as corporate loan portfolios, and certain individual
firms have increased risk in their holdings.
In addition, some firms have taken write-downs on
portfolios of impaired loans either purchased or
acquired through mergers. Losses on these loans are
projected using the same loss models used for loans
of the same type, and the resulting loss projections
are in general reduced by the amount of such write-
downs. For these firms, projected loss rates will be
lower than for firms that hold similar loans that have
not been subject to purchase-related write-downs.
Losses on Trading, Private Equity, SFT, and
Derivatives Positions
The severely adverse scenario results include
$113 billion in trading losses from the global market
shock at the 12 firms with large trading and private-
equity exposures and losses from the counterparty
default component at the 14 firms with substantial
trading, processing, or custodial operations. Trading
and counterparty losses range between $0.6 billion
and $29 billion across the 14 firms (see table 5) sub-
ject to the full global market shock and the supervi-
sory market risk component.
The relative size of losses across firms depends not
on nominal portfolio size but rather on the specific
risk characteristics of each firm’s trading positions,
inclusive of hedges. Importantly, these projected
losses are based on the trading positions and coun-
terparty exposures held by these firms on a single
date (December 4, 2017) and could have differed if
they had been based on a different date.
Projected Pre-provision Net Revenue and
Net Income
In the aggregate, the 35 firms are projected to gener-
ate $492 billion in PPNR cumulatively over the nine
quarters of the planning horizon, equal to 3.0 per-
cent of their combined average assets (see table 2).
PPNR projections reflect low levels of noninterest
income, consistent with the falling asset prices, rising
equity market volatility, and sharply contracting eco-
nomic activity in the severely adverse scenario. In
addition, the PPNR projections incorporate
expenses stemming from estimates of elevated levels
of losses from operational-risk events such as fraud,
employee lawsuits, litigation-related expenses, or
37 Losses are calculated based on the exposure at default, whichincludes both outstanding balances and any additional draw-down of the credit line that occurs prior to default, while lossrates are calculated as a percent of average outstanding bal-ances over the planning horizon. See appendix B for moredetail on the models used to project net income and stressedcapital.
June 2018 25

computer system or other operating disruptions.38 In
aggregate for the 35 firms, those operational risk
losses of almost $135 billion this year are $26 billion
higher this year than last year, but remain within the
range of what has been projected in previous
DFAST exercises.
The ratio of projected cumulative PPNR to average
assets varies across firms (see figure 13). A signifi-
cant portion of this variation reflects differences in
business focus across the institutions. For instance,
the ratio of PPNR to assets tends to be higher at
firms focusing on credit card lending, reflecting the
higher net interest income that credit cards generally
produce relative to other forms of lending.39 Impor-
tantly, lower PPNR rates do not necessarily imply
lower net income, because the same business focus
and revenue risk characteristics determining differ-
ences in PPNR across firms could also result in off-
setting differences in projected losses across firms.
Projected PPNR and losses are the primary determi-
nants of projected pre-tax net income. Table 5 pres-
ents projections of the components of pre-tax net
income, including provisions into the ALLL and
one-time income and expense and extraordinary
items, under the severely adverse scenario for each of
the 35 firms (see table 2 for aggregate). The projec-
tions are cumulative for the nine quarters of the
planning horizon.
Of note, following U.S. GAAP, the net income pro-
jections incorporate loan losses indirectly through
provisions, which equal projected loan losses plus the
amount needed for the ALLL to be at an appropri-
ate level at the end of each quarter. The $482 billion
in total provisions includes $429 billion in net
charge-offs, with the remainder being the reserve
build. These amounts are cumulative over the plan-
ning horizon and mask variation in the ALLL dur-
ing the course of the nine quarters. Specifically, the
projected ALLL increases during the early quarters
of the planning horizon, given the increased eco-
nomic stress in the severely adverse scenario, and
then declines as the economic stress abates.
The Federal Reserve’s projections of pre-tax net
income under the severely adverse scenario imply
negative net income at most of the 35 firms individu-
ally and for the firms as a group over the nine-
quarter planning horizon. Projected net income
before taxes (pre-tax net income) is an aggregate net
loss of $139 billion over the planning horizon for the
35 firms.
The ratio of pre-tax net income to average assets for
each of the 35 firms ranges from −2.9 percent to
2.8 percent (see figure 14). Projected cumulative net
income for most of the firms (26 of 35) is negative
over the planning horizon. Differences across the
firms reflect differences in the sensitivity of the vari-
ous components of net income to the economic and
financial market conditions in the supervisory sce-
narios. Projected net income for the 14 firms subject
to the global market shock, the supervisory market
risk component, and/or the counterparty default
component includes the effect of those additional
scenario components in the adverse and severely
adverse scenarios, introducing some additional varia-
tion in projected net income between these firms and
the other firms participating in DFAST 2018.
Final capital ratios for advanced approaches firms
and other firms that opt into advanced approaches
treatment for AOCI are also impacted by other com-
prehensive income (OCI) (Table 5), which is driven
by unrealized gains and losses on securities in the
supervisory stress test.
The interest rate path and credit spreads assumed in
the scenario result in −$32 billion of OCI over the
nine quarters of the planning horizon for advanced
approaches firms and other firms that opt into
advanced approaches treatment for AOCI. Reflect-
ing the complete phase-in of portions of AOCI in
the revised regulatory capital framework, −$89 bil-
lion in AOCI is included in post-stress regulatory
capital in the severely adverse scenario as of the first
quarter of 2020.
38 These estimates are conditional on the hypothetical adverse andseverely adverse scenario and on conservative assumptions.They are not a supervisory estimate of the firms’ current orexpected legal liability.
39 As noted, credit card lending also tends to generate relativelyhigh loss rates, so the higher PPNR rates at these firms do notnecessarily indicate higher profitability.
26 Supervisory Stress Test Methodology and Results

Table 2. 35 participating firms
Projected stressed capital ratios, risk-weighted assets, losses, revenues, net income beforetaxes, and loan lossesFederal Reserve estimates: Severely adverse scenario
Capital ratios, actual 2017:Q4 and projected2018:Q1–2020:Q1
Percent
Regulatory ratio Actual
2017:Q4
Stressed capital ratios1
Ending Minimum
Common equity tier 1 capital ratio 12.3 8.7 7.9
Tier 1 capital ratio 13.9 10.3 9.5
Total capital ratio 16.3 12.8 12.1
Tier 1 leverage ratio 8.8 6.5 6.1
Supplementary leverage ratio n/a 5.1 4.7
1 The capital ratios are calculated using capital action assumptions provided
within the Dodd-Frank Act stress testing rule. See 12 CFR 252.56(b). These
projections represent hypothetical estimates that involve an economic outcome
that is more adverse than expected. The minimum capital ratios are for the
period 2018:Q1 to 2020:Q1. Supplementary leverage ratio projections only
include estimates for firms subject to the advanced approaches.
n/a Not applicable.
Projected loan losses, by type of loan, 2018:Q1–2020:Q1
Loan type Billions of
dollars Portfolio loss
rates (percent)1
Loan losses 429.3 6.4
First-lien mortgages, domestic 34.3 2.7
Junior liens and HELOCs, domestic 15.4 4.9
Commercial and industrial2 111.3 7.3
Commercial real estate, domestic 63.4 8.3
Credit cards 112.7 14.4
Other consumer3 39.3 5.5
Other loans4 52.9 4.0
1 Average loan balances used to calculate portfolio loss rates exclude loans held
for sale and loans held for investment under the fair-value option, and are
calculated over nine quarters.2 Commercial and industrial loans include small- and medium-enterprise loans
and corporate cards.3 Other consumer loans include student loans and automobile loans.4 Other loans include international real estate loans.
Risk-weighted assets, actual 2017:Q4 and projected2020:Q1
Billions of dollars
Item Actual
2017:Q4 Projected2020:Q1
Risk-weighted assets1 10,044.8 10,553.8
1 For each quarter, risk-weighted assets are calculated under the Board’s
standardized capital risk-based approach in 12 CFR part 217, subpart D.
Projected losses, revenue, and net income before taxesthrough 2020:Q1
Item Billions of
dollars Percent of
average assets1
Pre-provision net revenue2 492.3 3.0
Other revenue3 0.0
less
Provisions 481.7
Realized losses/gains on securities (AFS/HTM) 10.0
Trading and counterparty losses4 113.0
Other losses/gains5 26.1
equals
Net income before taxes -138.5 -0.8
Memo items
Other comprehensive income6 -31.8
Other effects on capital Actual 2017:Q4 2020:Q1
AOCI included in capital (billions of dollars)7 -53.2 -88.8
1 Average assets is the nine-quarter average of total assets.2 Pre-provision net revenue includes losses from operational-risk events and
other real estate owned (OREO) costs.3 Other revenue includes one-time income and (expense) items not included in
pre-provision net revenue.4 Trading and counterparty losses include mark-to-market and credit valuation
adjustment (CVA) losses and losses arising from the counterparty default
scenario component applied to derivatives, securities lending, and repurchase
agreement activities.5 Other losses/gains include projected change in fair value of loans held for sale
and loans held for investment measured under the fair-value option, and
goodwill impairment losses.6 Other comprehensive income (OCI) is only calculated for advanced approaches
firms, and other firms that opt into the advanced approaches treatment of
accumulated other comprehensive income (AOCI).7 Certain aspects of AOCI are subject to transition arrangements for inclusion in
projected regulatory capital. Those transitions are 100 percent included in
projected regulatory capital starting in 2018. See 12 CFR 217.300(b)(3).
June 2018 27
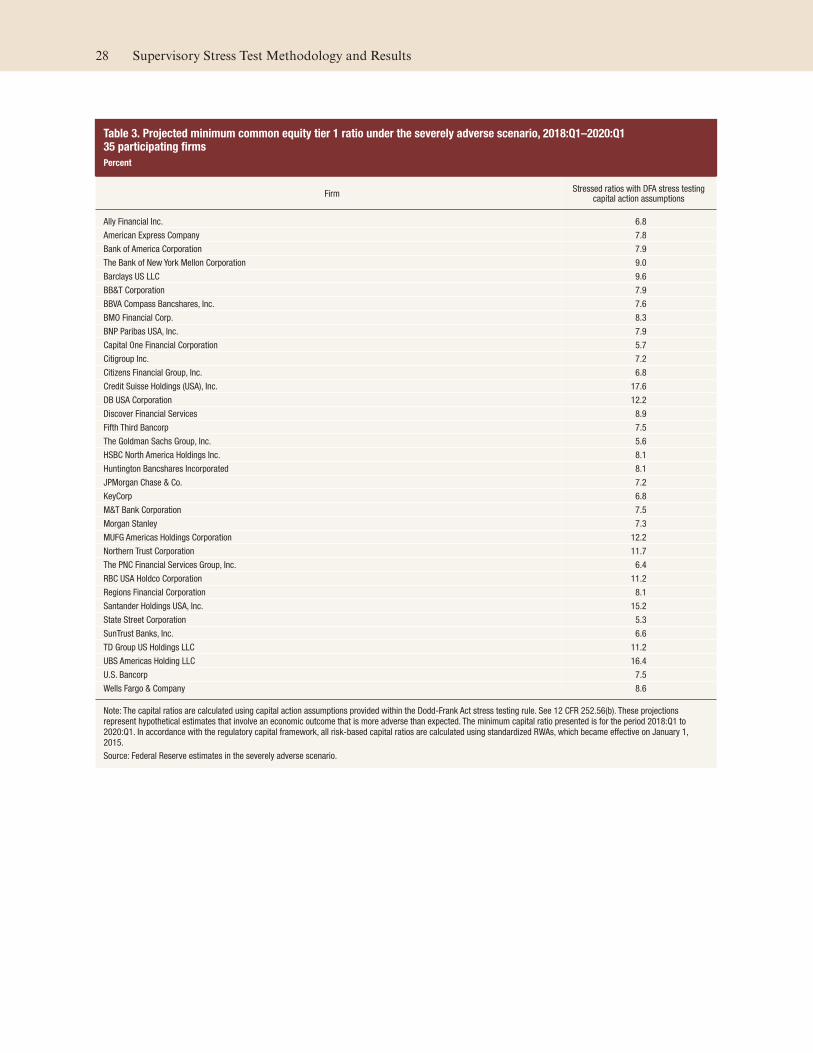
Table 3. Projected minimum common equity tier 1 ratio under the severely adverse scenario, 2018:Q1–2020:Q135 participating firms
Percent
Firm Stressed ratios with DFA stress testing
capital action assumptions
Ally Financial Inc. 6.8
American Express Company 7.8
Bank of America Corporation 7.9
The Bank of New York Mellon Corporation 9.0
Barclays US LLC 9.6
BB&T Corporation 7.9
BBVA Compass Bancshares, Inc. 7.6
BMO Financial Corp. 8.3
BNP Paribas USA, Inc. 7.9
Capital One Financial Corporation 5.7
Citigroup Inc. 7.2
Citizens Financial Group, Inc. 6.8
Credit Suisse Holdings (USA), Inc. 17.6
DB USA Corporation 12.2
Discover Financial Services 8.9
Fifth Third Bancorp 7.5
The Goldman Sachs Group, Inc. 5.6
HSBC North America Holdings Inc. 8.1
Huntington Bancshares Incorporated 8.1
JPMorgan Chase & Co. 7.2
KeyCorp 6.8
M&T Bank Corporation 7.5
Morgan Stanley 7.3
MUFG Americas Holdings Corporation 12.2
Northern Trust Corporation 11.7
The PNC Financial Services Group, Inc. 6.4
RBC USA Holdco Corporation 11.2
Regions Financial Corporation 8.1
Santander Holdings USA, Inc. 15.2
State Street Corporation 5.3
SunTrust Banks, Inc. 6.6
TD Group US Holdings LLC 11.2
UBS Americas Holding LLC 16.4
U.S. Bancorp 7.5
Wells Fargo & Company 8.6
Note: The capital ratios are calculated using capital action assumptions provided within the Dodd-Frank Act stress testing rule. See 12 CFR 252.56(b). These projections
represent hypothetical estimates that involve an economic outcome that is more adverse than expected. The minimum capital ratio presented is for the period 2018:Q1 to
2020:Q1. In accordance with the regulatory capital framework, all risk-based capital ratios are calculated using standardized RWAs, which became effective on January 1,
2015.
Source: Federal Reserve estimates in the severely adverse scenario.
28 Supervisory Stress Test Methodology and Results

Table 4.A. Capital ratios, actual 2017:Q4 and projected 2018:Q1–2020:Q1 under the severely adverse scenario:Advanced approaches firms
Percent
Firm
Common equitytier 1 capital ratio
Tier 1 capital ratio Total capital ratio Tier 1 leverage ratio Supplementaryleverage ratio1
Actual2017:Q4
Ending Mini-mum
Actual2017:Q4
Ending Mini-mum
Actual2017:Q4
Ending Mini-mum
Actual2017:Q4
Ending Mini-mum
Actual2017:Q4
Ending Mini-mum
American ExpressCompany 9.0 8.7 7.8 10.1 9.7 8.8 11.8 11.3 10.5 8.6 8.3 7.6 n/a 7.1 6.6
Bank of AmericaCorporation 11.9 8.3 7.9 13.4 9.9 9.5 15.9 12.4 12.3 8.6 6.3 6.1 n/a 5.0 4.9
The Bank of New YorkMellon Corporation 11.9 12.5 9.0 14.2 14.6 11.2 15.1 15.8 12.3 6.6 6.7 5.3 n/a 6.2 4.8
Barclays US LLC 13.1 11.3 9.6 15.7 13.8 12.1 18.8 16.7 14.8 8.2 7.1 6.5 n/a 5.7 5.3
Capital One FinancialCorporation 10.3 5.8 5.7 11.8 7.1 7.1 14.4 9.6 9.6 9.9 6.0 6.0 n/a 5.1 5.1
Citigroup Inc. 13.0 9.2 7.2 14.5 10.8 8.8 17.8 14.0 12.1 8.8 6.5 5.4 n/a 5.0 4.2
Credit Suisse Holdings(USA), Inc.2 24.7 20.4 17.6 24.7 21.0 18.2 24.8 21.1 18.3 7.3 7.6 6.7 n/a 7.4 6.6
DB USA Corporation 16.5 12.7 12.2 25.9 22.2 21.7 25.9 22.5 22.0 7.2 5.7 5.7 n/a 5.2 5.2
The Goldman SachsGroup, Inc. 12.1 6.9 5.6 14.1 8.7 7.3 16.8 11.4 10.2 8.4 5.1 4.4 n/a 3.5 3.1
HSBC North AmericaHoldings Inc. 15.5 8.1 8.1 18.3 10.9 10.9 22.8 15.3 15.3 8.9 5.2 5.2 n/a 4.0 4.0
JPMorgan Chase & Co. 12.2 7.9 7.2 13.9 9.5 8.8 15.9 11.9 11.0 8.3 5.6 5.3 n/a 4.4 4.2
Morgan Stanley 16.5 8.9 7.3 18.9 11.1 9.4 21.7 13.6 12.2 8.3 4.7 4.3 n/a 3.7 3.3
Northern Trust Corporation 12.6 12.5 11.7 13.8 13.7 12.9 15.8 16.1 15.4 7.8 7.6 7.3 n/a 6.7 6.4
The PNC Financial ServicesGroup, Inc. 10.4 7.1 6.4 11.6 8.2 7.6 13.7 10.6 10.1 9.9 7.0 6.5 n/a 5.9 5.5
State Street Corporation 11.9 8.4 5.3 15.0 11.9 9.0 16.0 12.7 10.0 7.3 5.5 4.2 n/a 4.9 3.7
TD Group US Holdings LLC 16.0 13.3 11.2 16.0 13.3 11.2 17.0 14.5 12.4 8.8 7.4 6.4 n/a 6.6 5.6
U.S. Bancorp 9.3 7.7 7.5 10.8 9.1 8.9 12.9 11.0 10.8 8.9 7.5 7.4 n/a 6.0 5.9
Wells Fargo & Company 12.3 9.9 8.6 14.1 11.6 10.4 17.5 14.9 13.8 9.4 7.6 6.9 n/a 6.5 5.9
Note: The capital ratios are calculated using capital action assumptions provided within the Dodd-Frank Act stress testing rule. See 12 CFR 252.56(b). These projections
represent hypothetical estimates that involve an economic outcome that is more adverse than expected. The minimum capital ratios are for the period 2018:Q1 to 2020:Q1. In
accordance with the regulatory capital framework, all risk-based capital ratios are calculated using standardized RWAs, which became effective on January 1, 2015.1 The supplementary leverage ratio is calculated only for firms subject to the advanced approaches.2 The minimum and ending leverage ratios and supplementary leverage ratios for Credit Suisse Holdings (USA), Inc., reflect an adjustment to average consolidated assets and
to total leverage exposure, respectively, to account for asset migrations completed at the end of 2017:Q4.
n/a Not applicable.
Source: Federal Reserve estimates in the severely adverse scenario.
June 2018 29

Table 4.B. Capital ratios, actual 2017:Q4 and projected 2018:Q1–2020:Q1 under the severely adverse scenario:Non-advanced approaches firms
Percent
Firm
Common equitytier 1 capital ratio
Tier 1 capital ratio Total capital ratio Tier 1 leverage ratio
Actual2017:Q4
Ending Minimum Actual
2017:Q4 Ending Minimum
Actual2017:Q4
Ending Minimum Actual
2017:Q4 Ending Minimum
Ally Financial Inc. 9.5 6.8 6.8 11.2 8.5 8.5 12.9 10.4 10.4 9.5 7.0 7.0
BB&T Corporation 10.2 8.0 7.9 11.9 9.6 9.5 13.9 12.0 11.9 9.9 7.8 7.8
BBVA Compass Bancshares, Inc. 11.8 7.6 7.6 12.1 8.0 8.0 14.4 10.3 10.3 10.0 6.4 6.4
BMO Financial Corp. 12.1 8.3 8.3 12.6 8.9 8.9 15.3 12.0 12.0 9.8 6.8 6.8
BNP Paribas USA, Inc. 12.4 7.9 7.9 12.8 8.4 8.4 15.0 10.9 10.9 9.3 5.9 5.9
Citizens Financial Group, Inc. 11.2 6.8 6.8 11.4 6.9 6.9 13.9 9.4 9.4 10.0 5.9 5.9
Discover Financial Services 11.6 9.5 8.9 12.3 10.1 9.5 13.8 11.8 11.3 10.8 8.8 8.5
Fifth Third Bancorp 10.6 7.5 7.5 11.7 8.5 8.5 15.2 11.8 11.8 10.0 7.1 7.1
Huntington BancsharesIncorporated 10.0 8.1 8.1 11.3 9.6 9.6 13.4 11.5 11.5 9.1 7.5 7.5
KeyCorp 10.2 6.8 6.8 11.0 7.6 7.6 12.9 9.8 9.8 9.7 6.6 6.6
M&T Bank Corporation 11.0 7.6 7.5 12.3 8.8 8.8 14.8 11.1 11.0 10.3 7.2 7.2
MUFG Americas HoldingsCorporation 16.3 12.2 12.2 16.3 12.2 12.2 17.8 14.0 14.0 10.1 7.3 7.3
RBC USA Holdco Corporation 15.6 11.6 11.2 15.6 11.6 11.2 16.8 12.9 12.6 7.9 6.2 6.0
Regions Financial Corporation 11.1 8.1 8.1 11.9 8.9 8.9 13.8 11.0 11.0 10.0 7.3 7.3
Santander Holdings USA, Inc. 16.4 15.9 15.2 17.8 17.0 16.5 19.5 18.6 18.2 14.2 13.2 13.0
SunTrust Banks, Inc. 9.7 6.6 6.6 11.2 7.7 7.7 13.1 9.8 9.8 9.8 6.7 6.7
UBS Americas Holding LLC 21.9 17.4 16.4 24.3 21.6 20.6 25.8 24.0 22.9 8.9 7.8 7.5
Note: The capital ratios are calculated using capital action assumptions provided within the Dodd-Frank Act stress testing rule. See 12 CFR 252.56(b). These projections
represent hypothetical estimates that involve an economic outcome that is more adverse than expected. The minimum capital ratios are for the period 2018:Q1 to 2020:Q1.
Source: Federal Reserve estimates in the severely adverse scenario.
Table 4.C. Capital ratios, actual 2017:Q4 and projected 2018:Q1–2020:Q1 under the severely adverse scenario:35 participating firms
Percent
Firm
Common equitytier 1 capital ratio
Tier 1 capital ratio Total capital ratio Tier 1 leverage ratio Supplementaryleverage ratio1
Actual2017:Q4
Ending Mini-mum
Actual2017:Q4
Ending Mini-mum
Actual2017:Q4
Ending Mini-mum
Actual2017:Q4
Ending Mini-mum
Actual2017:Q4
Ending Mini-mum
35 participating firms 12.3 8.7 7.9 13.9 10.3 9.5 16.3 12.8 12.1 8.8 6.5 6.1 n/a 5.1 4.7
Note: The capital ratios are calculated using capital action assumptions provided within the Dodd-Frank Act stress testing rule. See 12 CFR 252.56(b). These projections
represent hypothetical estimates that involve an economic outcome that is more adverse than expected. The minimum capital ratios are for the period 2018:Q1 to 2020:Q1. In
accordance with the regulatory capital framework, all risk-based capital ratios are calculated using standardized RWAs, which became effective on January 1, 2015.1 The supplementary leverage ratio is calculated only for firms subject to the advanced approaches.
n/a Not applicable.
Source: Federal Reserve estimates in the severely adverse scenario.
30 Supervisory Stress Test Methodology and Results

Figure 11. Change from 2017:Q4 to minimum CET1 ratio in the severely adverse scenario
0.0 2.0 4.0 6.0 8.0 10.0
Wells Fargo
U.S. Bancorp
UBS Americas
TD Group
SunTrust
State Street
Santander
Regions
RBC USA
PNC
Northern Trust
MUFG Americas
Morgan Stanley
M&T
KeyCorp
JPMorgan Chase
Huntington
HSBC
Goldman Sachs
Fifth Third
Discover
DB USA
Credit Suisse USA
Citizens
Citigroup
Capital One
BNP Paribas USA
BMO
BBVA
BB&T
Barclays US
Bank of NY-Mellon
Bank of America
American Express
Ally
Percent
Median=4.0%
Note: Estimates are for the nine-quarter period from 2018:Q1–2020:Q1 as a percent of risk-weighted assets.
June 2018 31

Figure 12. Total loan loss rates in the severely adverse scenario
0.0 3.0 6.0 9.0 12.0 15.0
Wells Fargo
U.S. Bancorp
UBS Americas
TD Group
SunTrust
State Street
Santander
Regions
RBC USA
PNC
Northern Trust
MUFG Americas
Morgan Stanley
M&T
KeyCorp
JPMorgan Chase
Huntington
HSBC
Goldman Sachs
Fifth Third
Discover
DB USA
Credit Suisse USA
Citizens
Citigroup
Capital One
BNP Paribas USA
BMO
BBVA
BB&T
Barclays US
Bank of NY-Mellon
Bank of America
American Express
Ally
Percent
Median = 6.1%
Note: Estimates are for nine quarter period from 2018:Q1–2020:Q1 as a percent of average balances.
32 Supervisory Stress Test Methodology and Results
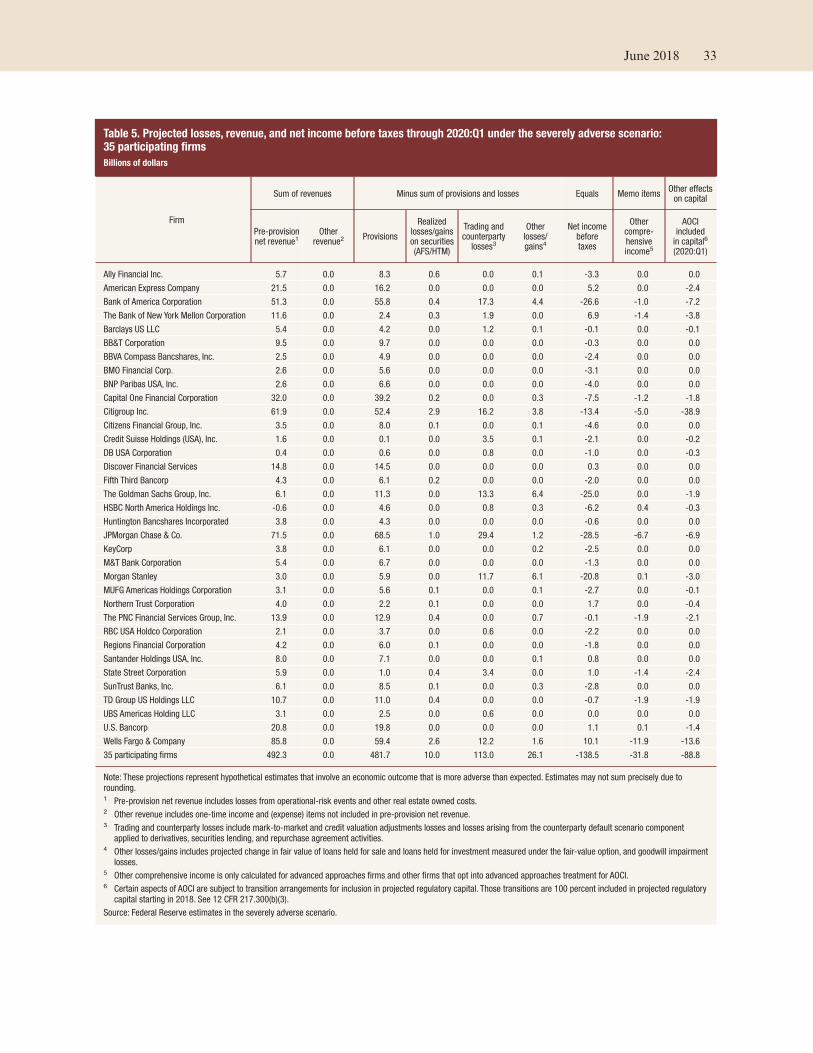
Table 5. Projected losses, revenue, and net income before taxes through 2020:Q1 under the severely adverse scenario:35 participating firms
Billions of dollars
Firm
Sum of revenues Minus sum of provisions and losses Equals Memo items Other effects
on capital
Pre-provisionnet revenue1
Otherrevenue2 Provisions
Realizedlosses/gainson securities(AFS/HTM)
Trading andcounterparty
losses3
Otherlosses/gains4
Net incomebeforetaxes
Othercompre-hensiveincome5
AOCIincluded
in capital6
(2020:Q1)
Ally Financial Inc. 5.7 0.0 8.3 0.6 0.0 0.1 -3.3 0.0 0.0
American Express Company 21.5 0.0 16.2 0.0 0.0 0.0 5.2 0.0 -2.4
Bank of America Corporation 51.3 0.0 55.8 0.4 17.3 4.4 -26.6 -1.0 -7.2
The Bank of New York Mellon Corporation 11.6 0.0 2.4 0.3 1.9 0.0 6.9 -1.4 -3.8
Barclays US LLC 5.4 0.0 4.2 0.0 1.2 0.1 -0.1 0.0 -0.1
BB&T Corporation 9.5 0.0 9.7 0.0 0.0 0.0 -0.3 0.0 0.0
BBVA Compass Bancshares, Inc. 2.5 0.0 4.9 0.0 0.0 0.0 -2.4 0.0 0.0
BMO Financial Corp. 2.6 0.0 5.6 0.0 0.0 0.0 -3.1 0.0 0.0
BNP Paribas USA, Inc. 2.6 0.0 6.6 0.0 0.0 0.0 -4.0 0.0 0.0
Capital One Financial Corporation 32.0 0.0 39.2 0.2 0.0 0.3 -7.5 -1.2 -1.8
Citigroup Inc. 61.9 0.0 52.4 2.9 16.2 3.8 -13.4 -5.0 -38.9
Citizens Financial Group, Inc. 3.5 0.0 8.0 0.1 0.0 0.1 -4.6 0.0 0.0
Credit Suisse Holdings (USA), Inc. 1.6 0.0 0.1 0.0 3.5 0.1 -2.1 0.0 -0.2
DB USA Corporation 0.4 0.0 0.6 0.0 0.8 0.0 -1.0 0.0 -0.3
Discover Financial Services 14.8 0.0 14.5 0.0 0.0 0.0 0.3 0.0 0.0
Fifth Third Bancorp 4.3 0.0 6.1 0.2 0.0 0.0 -2.0 0.0 0.0
The Goldman Sachs Group, Inc. 6.1 0.0 11.3 0.0 13.3 6.4 -25.0 0.0 -1.9
HSBC North America Holdings Inc. -0.6 0.0 4.6 0.0 0.8 0.3 -6.2 0.4 -0.3
Huntington Bancshares Incorporated 3.8 0.0 4.3 0.0 0.0 0.0 -0.6 0.0 0.0
JPMorgan Chase & Co. 71.5 0.0 68.5 1.0 29.4 1.2 -28.5 -6.7 -6.9
KeyCorp 3.8 0.0 6.1 0.0 0.0 0.2 -2.5 0.0 0.0
M&T Bank Corporation 5.4 0.0 6.7 0.0 0.0 0.0 -1.3 0.0 0.0
Morgan Stanley 3.0 0.0 5.9 0.0 11.7 6.1 -20.8 0.1 -3.0
MUFG Americas Holdings Corporation 3.1 0.0 5.6 0.1 0.0 0.1 -2.7 0.0 -0.1
Northern Trust Corporation 4.0 0.0 2.2 0.1 0.0 0.0 1.7 0.0 -0.4
The PNC Financial Services Group, Inc. 13.9 0.0 12.9 0.4 0.0 0.7 -0.1 -1.9 -2.1
RBC USA Holdco Corporation 2.1 0.0 3.7 0.0 0.6 0.0 -2.2 0.0 0.0
Regions Financial Corporation 4.2 0.0 6.0 0.1 0.0 0.0 -1.8 0.0 0.0
Santander Holdings USA, Inc. 8.0 0.0 7.1 0.0 0.0 0.1 0.8 0.0 0.0
State Street Corporation 5.9 0.0 1.0 0.4 3.4 0.0 1.0 -1.4 -2.4
SunTrust Banks, Inc. 6.1 0.0 8.5 0.1 0.0 0.3 -2.8 0.0 0.0
TD Group US Holdings LLC 10.7 0.0 11.0 0.4 0.0 0.0 -0.7 -1.9 -1.9
UBS Americas Holding LLC 3.1 0.0 2.5 0.0 0.6 0.0 0.0 0.0 0.0
U.S. Bancorp 20.8 0.0 19.8 0.0 0.0 0.0 1.1 0.1 -1.4
Wells Fargo & Company 85.8 0.0 59.4 2.6 12.2 1.6 10.1 -11.9 -13.6
35 participating firms 492.3 0.0 481.7 10.0 113.0 26.1 -138.5 -31.8 -88.8
Note: These projections represent hypothetical estimates that involve an economic outcome that is more adverse than expected. Estimates may not sum precisely due to
rounding.1 Pre-provision net revenue includes losses from operational-risk events and other real estate owned costs.2 Other revenue includes one-time income and (expense) items not included in pre-provision net revenue.3 Trading and counterparty losses include mark-to-market and credit valuation adjustments losses and losses arising from the counterparty default scenario component
applied to derivatives, securities lending, and repurchase agreement activities.4 Other losses/gains includes projected change in fair value of loans held for sale and loans held for investment measured under the fair-value option, and goodwill impairment
losses.5 Other comprehensive income is only calculated for advanced approaches firms and other firms that opt into advanced approaches treatment for AOCI.6 Certain aspects of AOCI are subject to transition arrangements for inclusion in projected regulatory capital. Those transitions are 100 percent included in projected regulatory
capital starting in 2018. See 12 CFR 217.300(b)(3).
Source: Federal Reserve estimates in the severely adverse scenario.
June 2018 33

Table 6. Projected loan losses by type of loan for 2018:Q1–2020:Q1 under the severely adverse scenario:35 participating firms
Billions of dollars
Firm Loan
losses
First-lienmortgages,domestic
Junior liensand HELOCs,
domestic
Commercialand
industrial1
Commercialreal estate,domestic
Creditcards
Otherconsumer2
Otherloans3
Ally Financial Inc. 6.9 0.3 0.1 2.4 0.1 0.0 3.9 0.0
American Express Company 12.8 0.0 0.0 4.9 0.0 7.8 0.2 0.0
Bank of America Corporation 49.7 4.7 2.8 14.9 5.9 12.9 1.6 6.9
The Bank of New York Mellon Corporation 2.0 0.3 0.0 0.1 0.4 0.0 0.3 0.9
Barclays US LLC 4.0 0.0 0.0 0.0 0.0 3.9 0.0 0.1
BB&T Corporation 8.4 0.9 0.4 1.8 2.9 0.3 1.3 0.9
BBVA Compass Bancshares, Inc. 4.4 0.7 0.2 1.5 1.5 0.1 0.4 0.2
BMO Financial Corp. 4.8 0.3 0.3 2.2 0.9 0.1 0.1 0.9
BNP Paribas USA, Inc. 5.5 0.3 0.2 1.7 1.7 0.1 1.0 0.5
Capital One Financial Corporation 34.8 0.1 0.1 3.8 2.2 23.1 4.6 0.9
Citigroup Inc. 48.4 2.7 1.3 9.0 2.1 22.5 3.2 7.7
Citizens Financial Group, Inc. 6.8 0.4 0.7 2.3 1.5 0.2 1.3 0.3
Credit Suisse Holdings (USA), Inc. 0.1 0.0 0.0 0.0 0.0 0.0 0.0 0.1
DB USA Corporation 0.4 0.1 0.0 0.0 0.2 0.0 0.0 0.1
Discover Financial Services 12.2 0.0 0.0 0.0 0.0 10.3 1.9 0.0
Fifth Third Bancorp 5.7 0.5 0.3 2.2 1.4 0.4 0.4 0.4
The Goldman Sachs Group, Inc. 9.6 1.6 0.0 3.4 0.6 0.0 0.4 3.7
HSBC North America Holdings Inc. 4.1 0.5 0.1 2.0 0.9 0.1 0.0 0.5
Huntington Bancshares Incorporated 3.8 0.4 0.3 1.2 0.9 0.1 0.6 0.2
JPMorgan Chase & Co. 61.8 5.8 1.9 18.1 5.9 17.3 2.2 10.5
KeyCorp 5.4 0.3 0.4 2.2 1.5 0.1 0.4 0.5
M&T Bank Corporation 6.0 0.8 0.2 1.0 3.1 0.1 0.4 0.3
Morgan Stanley 4.6 0.6 0.0 1.1 1.0 0.0 0.1 1.8
MUFG Americas Holdings Corporation 4.8 1.4 0.1 1.4 1.4 0.0 0.2 0.4
Northern Trust Corporation 1.8 0.2 0.1 0.3 0.3 0.0 0.0 0.9
The PNC Financial Services Group, Inc. 11.6 0.5 0.4 5.6 2.7 0.7 0.7 0.9
RBC USA Holdco Corporation 3.1 0.2 0.1 1.2 0.8 0.0 0.1 0.6
Regions Financial Corporation 5.3 0.6 0.4 1.7 1.5 0.2 0.5 0.4
Santander Holdings USA, Inc. 8.1 0.3 0.3 0.9 1.2 0.1 4.8 0.5
State Street Corporation 0.8 0.0 0.0 0.3 0.0 0.0 0.0 0.6
SunTrust Banks, Inc. 7.5 1.0 0.7 2.3 1.4 0.2 1.5 0.4
TD Group US Holdings LLC 9.9 0.6 0.5 2.5 2.2 2.6 0.6 1.0
UBS Americas Holding LLC 1.8 0.3 0.0 0.6 0.0 0.0 0.1 0.7
U.S. Bancorp 18.3 1.4 0.9 5.5 4.2 3.5 1.4 1.3
Wells Fargo & Company 53.6 6.3 2.6 13.0 12.9 6.0 5.1 7.7
35 participating firms 429.3 34.3 15.4 111.3 63.4 112.7 39.3 52.9
Note: These projections represent hypothetical estimates that involve an economic outcome that is more adverse than expected.1 Commercial and industrial loans include small- and medium-enterprise loans and corporate cards.2 Other consumer loans include student loans and automobile loans.3 Other loans include international real estate loans.
Source: Federal Reserve estimates in the severely adverse scenario.
34 Supervisory Stress Test Methodology and Results

Table 7. Projected loan losses by type of loan for 2018:Q1–2020:Q1 under the severely adverse scenario:35 participating firms
Percent of average balances1
Firm Loan
losses
First-lienmortgages,domestic
Junior liensand HELOCs,
domestic
Commercialand
industrial2
Commercialreal estate,domestic
Credit cards Other
consumer3 Other loans4
Ally Financial Inc. 5.5 2.6 8.7 5.4 3.1 0.0 6.3 7.8
American Express Company 9.7 0.0 0.0 10.6 0.0 9.1 12.9 6.6
Bank of America Corporation 5.0 2.3 4.7 5.6 8.1 13.1 2.0 3.3
The Bank of New York Mellon Corporation 3.1 2.5 5.4 3.1 10.8 0.0 9.6 2.1
Barclays US LLC 10.5 0.0 0.0 24.4 7.1 14.7 12.9 0.9
BB&T Corporation 5.8 3.1 3.8 6.2 7.8 13.8 6.9 4.4
BBVA Compass Bancshares, Inc. 7.1 4.8 5.4 8.1 10.4 16.0 7.9 2.0
BMO Financial Corp. 6.5 3.3 9.6 7.3 8.9 12.5 2.6 5.6
BNP Paribas USA, Inc. 7.0 2.7 5.8 10.4 9.0 14.7 5.6 5.1
Capital One Financial Corporation 13.4 0.7 5.5 12.9 7.3 21.2 8.4 5.0
Citigroup Inc. 7.0 3.6 7.5 5.1 10.6 13.9 10.2 3.6
Citizens Financial Group, Inc. 6.1 2.5 4.8 7.2 9.8 12.3 5.6 4.3
Credit Suisse Holdings (USA), Inc. 0.6 0.0 0.0 0.0 0.0 0.0 12.9 0.6
DB USA Corporation 3.1 2.8 6.9 2.4 7.4 0.0 5.9 1.3
Discover Financial Services 14.2 3.3 14.8 15.1 18.8 15.0 11.1 6.5
Fifth Third Bancorp 6.1 3.3 4.7 5.9 12.8 18.4 3.9 4.3
The Goldman Sachs Group, Inc. 9.7 46.9 5.2 16.9 12.2 0.0 8.5 5.6
HSBC North America Holdings Inc. 6.1 3.0 5.1 7.5 8.8 14.7 7.1 4.6
Huntington Bancshares Incorporated 5.3 3.7 3.6 6.1 8.5 14.7 3.8 4.4
JPMorgan Chase & Co. 6.4 2.4 4.5 11.0 5.1 12.3 3.4 5.3
KeyCorp 6.1 3.9 4.3 6.7 9.3 13.2 5.8 3.2
M&T Bank Corporation 6.7 4.3 4.3 5.8 9.3 14.7 5.8 5.6
Morgan Stanley 3.6 2.2 5.2 11.3 7.3 0.0 0.6 3.1
MUFG Americas Holdings Corporation 5.9 3.7 4.6 8.2 8.3 14.7 15.3 4.6
Northern Trust Corporation 5.3 2.4 9.6 5.5 7.7 0.0 12.9 5.4
The PNC Financial Services Group, Inc. 5.2 1.8 2.0 7.0 7.5 14.4 3.3 2.6
RBC USA Holdco Corporation 6.9 2.5 5.7 12.8 8.2 14.7 11.0 4.6
Regions Financial Corporation 6.5 3.7 5.1 7.5 11.1 14.9 7.9 3.0
Santander Holdings USA, Inc. 9.9 3.4 4.6 5.8 7.4 13.9 18.0 6.6
State Street Corporation 3.5 0.0 0.0 7.3 6.3 0.0 0.6 2.8
SunTrust Banks, Inc. 5.2 3.6 6.7 5.5 7.3 13.8 5.2 2.5
TD Group US Holdings LLC 6.3 2.6 5.4 7.3 7.9 19.2 2.6 3.8
UBS Americas Holding LLC 3.0 2.4 0.0 10.2 5.4 14.7 0.6 4.1
U.S. Bancorp 6.4 2.2 5.3 7.2 11.0 15.6 3.4 5.0
Wells Fargo & Company 5.5 2.3 4.8 6.8 9.4 15.5 5.9 4.2
35 participating firms 6.4 2.7 4.9 7.3 8.3 14.4 5.5 4.0
Note: These projections represent hypothetical estimates that involve an economic outcome that is more adverse than expected.1 Average loan balances used to calculate portfolio loss rates exclude loans held for sale and loans held for investment under the fair-value option, and are calculated over
nine quarters.2 Commercial and industrial loans include small- and medium-enterprise loans and corporate cards.3 Other consumer loans include student loans and automobile loans.4 Other loans include international real estate loans.
Source: Federal Reserve estimates in the severely adverse scenario.
June 2018 35
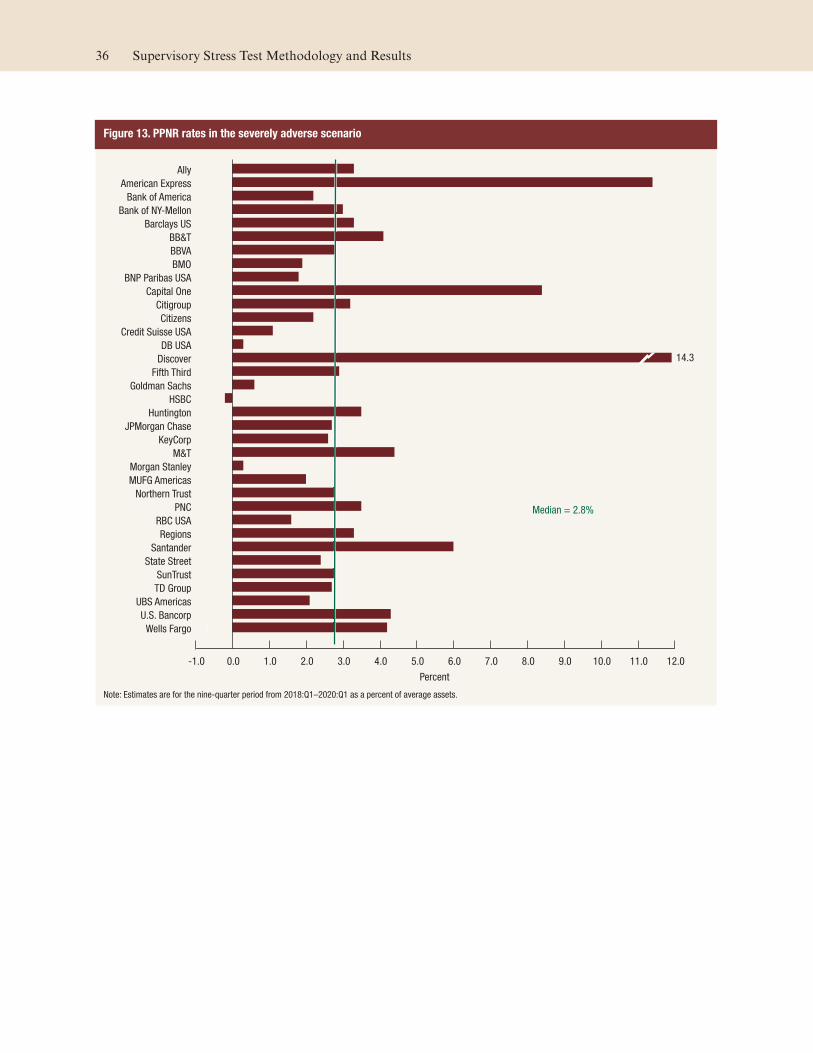
Figure 13. PPNR rates in the severely adverse scenario
-1.0 0.0 1.0 2.0 3.0 4.0 5.0 6.0 7.0 8.0 9.0 10.0 11.0 12.0
Wells Fargo
U.S. Bancorp
UBS Americas
TD Group
SunTrust
State Street
Santander
Regions
RBC USA
PNC
Northern Trust
MUFG Americas
Morgan Stanley
M&T
KeyCorp
JPMorgan Chase
Huntington
HSBC
Goldman Sachs
Fifth Third
Discover
DB USA
Credit Suisse USA
Citizens
Citigroup
Capital One
BNP Paribas USA
BMO
BBVA
BB&T
Barclays US
Bank of NY-Mellon
Bank of America
American Express
Ally
Percent
Median = 2.8%
14.3
Note: Estimates are for the nine-quarter period from 2018:Q1–2020:Q1 as a percent of average assets.
36 Supervisory Stress Test Methodology and Results
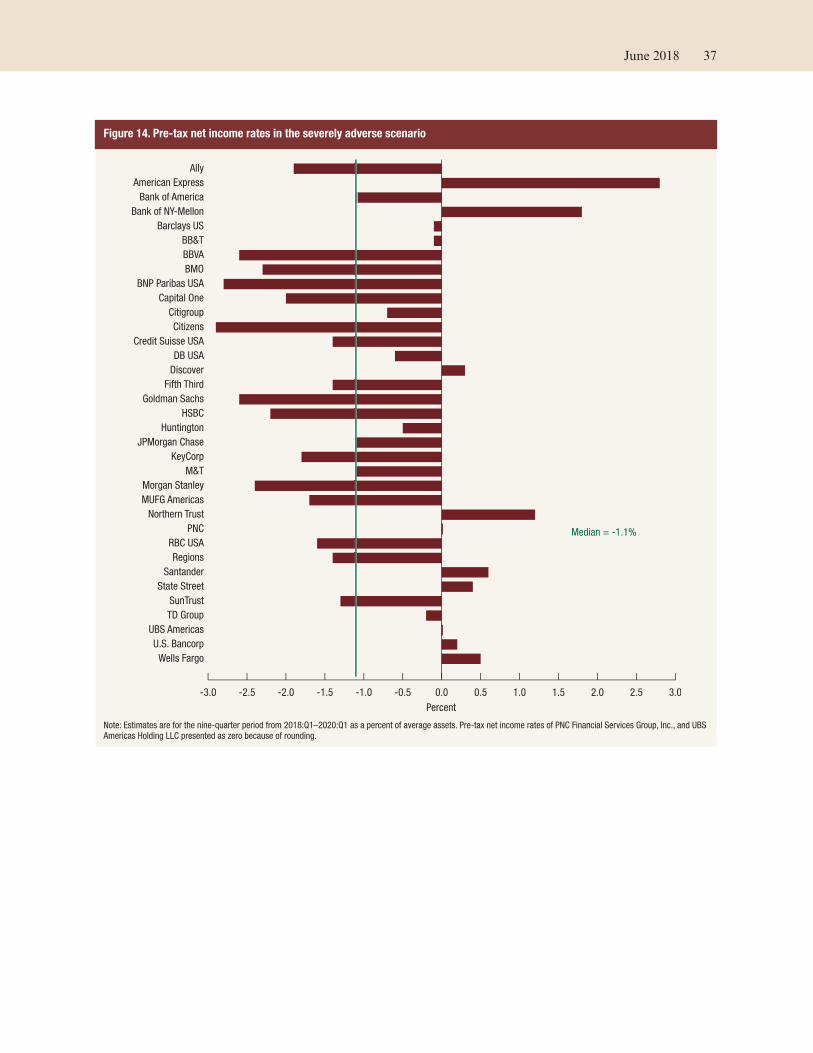
Figure 14. Pre-tax net income rates in the severely adverse scenario
-3.0 -2.5 -2.0 -1.5 -1.0 -0.5 0.0 0.5 1.0 1.5 2.0 2.5 3.0
Wells Fargo
U.S. Bancorp
UBS Americas
TD Group
SunTrust
State Street
Santander
Regions
RBC USA
PNC
Northern Trust
MUFG Americas
Morgan Stanley
M&T
KeyCorp
JPMorgan Chase
Huntington
HSBC
Goldman Sachs
Fifth Third
Discover
DB USA
Credit Suisse USA
Citizens
Citigroup
Capital One
BNP Paribas USA
BMO
BBVA
BB&T
Barclays US
Bank of NY-Mellon
Bank of America
American Express
Ally
Percent
Median = -1.1%
Note: Estimates are for the nine-quarter period from 2018:Q1–2020:Q1 as a percent of average assets. Pre-tax net income rates of PNC Financial Services Group, Inc., and UBS
Americas Holding LLC presented as zero because of rounding.
June 2018 37

Adverse Scenario
Stressed Capital Ratios and
Risk-Weighted Assets
The adverse scenario projections suggest moderate
declines in aggregate capital ratios for the 35 firms.
The aggregate CET1 ratio is projected to fall 1.4 per-
centage points to its minimum over the planning
horizon and to be 1.1 percentage points lower at the
end of the planning horizon (see table 8). In addi-
tion, at the end of the planning horizon, the tier 1
risk-based capital ratio and the total risk-based capi-
tal ratio are 1.1 and 1.4 percentage points lower than
at the start of the planning horizon, respectively. The
tier 1 leverage ratio is projected to decline 0.8 per-
centage points over the planning horizon.
Generally, the projected declines in post-stress capital
ratios are smaller than those under the severely
adverse scenario, reflecting the generally less severe
economic conditions assumed in the adverse sce-
nario. As compared to the severely adverse scenario,
the adverse scenario projections imply higher aggre-
gate net income, driven in part by lower losses. Off-
setting somewhat the effect of aggregate higher net
income on capital, the adverse scenario also features
more robust projected balance sheet and RWA
growth than the severely adverse scenario, which on
net tends to reduce post-stress capital ratios.
Projected Losses
The Federal Reserve’s projections suggest that the 35
firms as a group would face elevated losses under the
adverse scenario, though not as large as the losses
under the severely adverse scenario. In this scenario,
total losses are projected to equal $333 billion for the
35 firms over the nine-quarter planning horizon.
These losses include
• $263 billion in accrual loan losses;
• $3 billion in OTTI and other realized securities
losses;
• $48 billion in losses from the global market shock
and the largest counterparty default compo-
nents; and
• $19 billion in additional losses from items such as
loans booked under the fair-value option.
These results are presented in aggregate (table 8) and
individually for each of the 35 firms (table 11 and
appendix C). Aggregate loss amounts are lower than
those projected under the severely adverse scenario,
once again reflecting the relatively less stressful mac-
roeconomic and financial market conditions
assumed in the adverse scenario.
Loan Losses
As in the severely adverse scenario, the accrual loan
portfolio is the largest source of losses in the adverse
scenario, accounting for $263 billion of projected
losses for the 35 firms. The lower peak unemploy-
ment rate and more moderate residential and com-
mercial real estate price declines in the adverse sce-
nario result in lower projected accrual loan losses on
consumer and real estate–related loans relative to the
severely adverse scenario. In aggregate, the nine-
quarter loan loss rate of the 35 firms is 3.9 percent.
As in the severely adverse scenario results, there is
considerable diversity across firms in projected loan
loss rates, both in the aggregate and by loan type (see
figures 17 and D.8 to D.14).
Losses on Trading, Private Equity, and
Derivatives Positions
Projected losses resulting from the impact of the
global market shock and the supervisory market risk
component at the 12 firms with large trading and
private-equity exposures and losses from the coun-
terparty default component at the 14 firms with sub-
stantial trading, processing, or custodial operations
Figure 15. Projected losses in the adverse scenario
Other losses
19Other loans
32
Other consumer
loans 31
Commercial real estate, domestic
25
Securities losses
3
Commercial and industrial
loans 71
Credit cards 86
Trading and counterparty
losses 48
Junior liens and HELOCs,
domestic 7
First-lien mortgages, domestic
12
Billions of dollars
38 Supervisory Stress Test Methodology and Results

equal $48 billion under the adverse scenario. These
losses are less than half of those projected under the
severely adverse scenario, reflecting the less severe
market shocks assumed in the adverse scenario.
Trading and counterparty losses range between
$0.4 billion and $13 billion across the 14 firms (see
table 11) subject to the full global market shock and
the supervisory market risk component.
Projected PPNR and Net Income
Aggregate PPNR is projected to equal $467 billion
for the 35 firms under the adverse scenario, equal to
2.8 percent of average projected assets for these
firms. Projected PPNR is lower than under the
severely adverse scenario due to a steeper yield curve
in the severely adverse scenario. As a result, net inter-
est income in the adverse scenario is lower than in
the severely adverse scenario. However, projected
operational-risk losses are lower compared to the
severely adverse scenario, the latter being consistent
with the adverse scenario’s more moderate housing
price decline. Projected ratios of PPNR to assets
vary significantly across the 35 firms (see figure 18).
In the aggregate, the 35 firms are projected to have
cumulative pre-tax net income of $125 billion over
the nine-quarter planning horizon under the adverse
scenario. Twenty-three of the firms are projected to
have positive cumulative pre-tax net income, though
24 firms experience at least one quarter of negative
pre-tax net income during the planning horizon. The
$272 billion in total provisions reported in table 8
includes $263 billion in net charge-offs, with the
remainder being the reserve build, or the increase in
loan loss reserves.
Aggregate pre-tax net income under the adverse sce-
nario is positive, with a ratio of income to average
assets of 0.7 percent. Projected nine-quarter return
on assets under the adverse scenario ranges between
−1.3 and 4.6 percent for the 35 firms (see figure 19).
Results reflect $19 billion of OCI over the nine quar-
ters of the planning horizon for advanced
approaches firms and other firms that opt into
advanced approaches treatment for AOCI in the
adverse scenario. In the aggregate, −$38 billion in
AOCI is included in post-stress regulatory capital as
of the first quarter of 2020.
June 2018 39

Table 8. 35 participating firms
Projected stressed capital ratios, risk-weighted assets, losses, revenues, net income beforetaxes, and loan lossesFederal Reserve estimates: Adverse scenario
Capital ratios, actual 2017:Q4 and projected2018:Q1–2020:Q1
Percent
Regulatory ratio Actual
2017:Q4
Stressed capital ratios1
Ending Minimum
Common equity tier 1 capital ratio 12.3 11.2 10.9
Tier 1 capital ratio 13.9 12.8 12.5
Total capital ratio 16.3 14.9 14.8
Tier 1 leverage ratio 8.8 8.0 7.9
Supplementary leverage ratio n/a 6.4 6.3
1 The capital ratios are calculated using capital action assumptions provided
within the Dodd-Frank Act stress testing rule. See 12 CFR 252.56(b). These
projections represent hypothetical estimates that involve an economic outcome
that is more adverse than expected. The minimum capital ratios are for the
period 2018:Q1 to 2020:Q1. Supplementary leverage ratio projections only
include estimates for firms subject to the advanced approaches.
n/a Not applicable.
Projected loan losses, by type of loan, 2018:Q1–2020:Q1
Loan type Billions of
dollars Portfolio loss
rates (percent)1
Loan losses 262.9 3.9
First-lien mortgages, domestic 12.0 0.9
Junior liens and HELOCs, domestic 6.8 2.1
Commercial and industrial2 70.6 4.6
Commercial real estate, domestic 25.2 3.3
Credit cards 85.8 10.9
Other consumer3 30.7 4.3
Other loans4 31.8 2.4
1 Average loan balances used to calculate portfolio loss rates exclude loans held
for sale and loans held for investment under the fair-value option, and are
calculated over nine quarters.2 Commercial and industrial loans include small- and medium-enterprise loans
and corporate cards.3 Other consumer loans include student loans and automobile loans.4 Other loans include international real estate loans.
Risk-weighted assets, actual 2017:Q4 and projected2020:Q1
Billions of dollars
Item Actual
2017:Q4 Projected2020:Q1
Risk-weighted assets1 10,044.8 10,846.0
1 For each quarter, risk-weighted assets are calculated under the Board’s
standardized capital risk-based approach in 12 CFR part 217, subpart D.
Projected losses, revenue, and net income before taxesthrough 2020:Q1
Item Billions of
dollars Percent of
average assets1
Pre-provision net revenue2 466.7 2.8
Other revenue3 0.0
less
Provisions 271.6
Realized losses/gains on securities (AFS/HTM) 2.8
Trading and counterparty losses4 48.2
Other losses/gains5 18.9
equals
Net income before taxes 125.0 0.7
Memo items
Other comprehensive income6 19.0
Other effects on capital Actual 2017:Q4 2020:Q1
AOCI included in capital (billions of dollars)7 -53.2 -38.0
1 Average assets is the nine-quarter average of total assets.2 Pre-provision net revenue includes losses from operational-risk events and
other real estate owned (OREO) costs.3 Other revenue includes one-time income and (expense) items not included in
pre-provision net revenue.4 Trading and counterparty losses include mark-to-market and credit valuation
adjustment (CVA) losses and losses arising from the counterparty default
scenario component applied to derivatives, securities lending, and repurchase
agreement activities.5 Other losses/gains include projected change in fair value of loans held for sale
and loans held for investment measured under the fair-value option, and
goodwill impairment losses.6 Other comprehensive income (OCI) is only calculated for advanced approaches
firms, and other firms that opt into the advanced approaches treatment of
accumulated other comprehensive income (AOCI).7 Certain aspects of AOCI are subject to transition arrangements for inclusion in
projected regulatory capital. Those transitions are 100 percent included in
projected regulatory capital starting in 2018. See 12 CFR 217.300(b)(3).
40 Supervisory Stress Test Methodology and Results
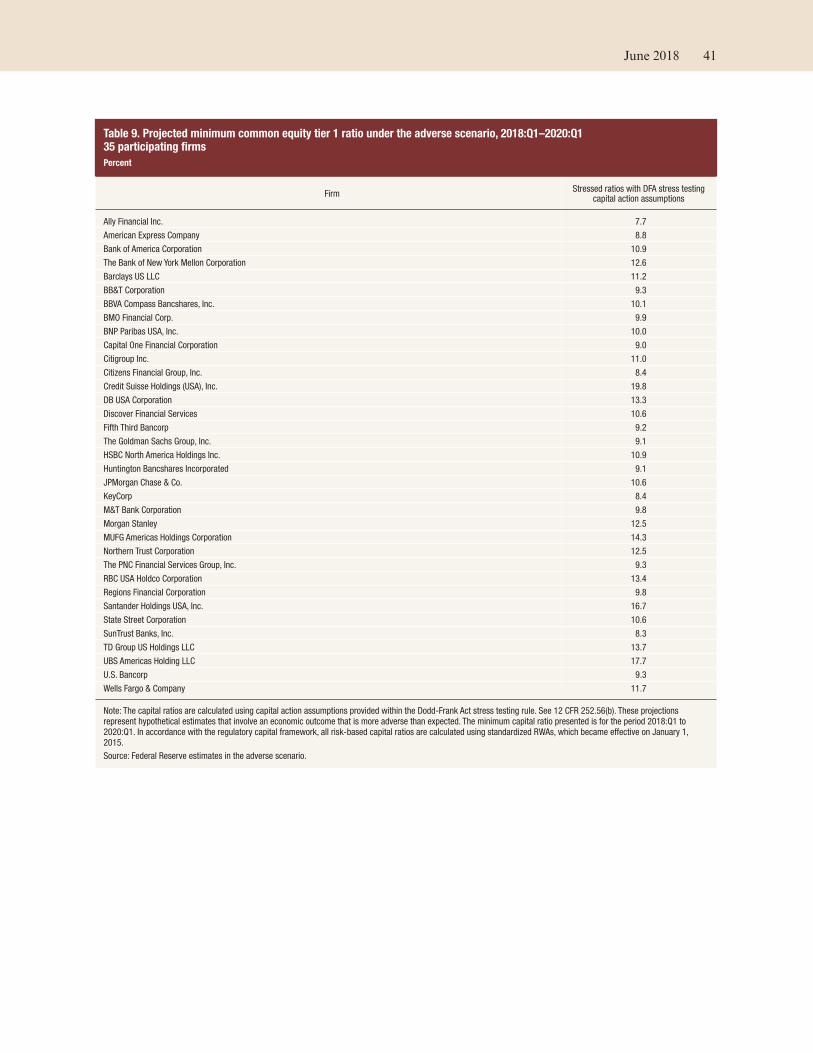
Table 9. Projected minimum common equity tier 1 ratio under the adverse scenario, 2018:Q1–2020:Q135 participating firms
Percent
Firm Stressed ratios with DFA stress testing
capital action assumptions
Ally Financial Inc. 7.7
American Express Company 8.8
Bank of America Corporation 10.9
The Bank of New York Mellon Corporation 12.6
Barclays US LLC 11.2
BB&T Corporation 9.3
BBVA Compass Bancshares, Inc. 10.1
BMO Financial Corp. 9.9
BNP Paribas USA, Inc. 10.0
Capital One Financial Corporation 9.0
Citigroup Inc. 11.0
Citizens Financial Group, Inc. 8.4
Credit Suisse Holdings (USA), Inc. 19.8
DB USA Corporation 13.3
Discover Financial Services 10.6
Fifth Third Bancorp 9.2
The Goldman Sachs Group, Inc. 9.1
HSBC North America Holdings Inc. 10.9
Huntington Bancshares Incorporated 9.1
JPMorgan Chase & Co. 10.6
KeyCorp 8.4
M&T Bank Corporation 9.8
Morgan Stanley 12.5
MUFG Americas Holdings Corporation 14.3
Northern Trust Corporation 12.5
The PNC Financial Services Group, Inc. 9.3
RBC USA Holdco Corporation 13.4
Regions Financial Corporation 9.8
Santander Holdings USA, Inc. 16.7
State Street Corporation 10.6
SunTrust Banks, Inc. 8.3
TD Group US Holdings LLC 13.7
UBS Americas Holding LLC 17.7
U.S. Bancorp 9.3
Wells Fargo & Company 11.7
Note: The capital ratios are calculated using capital action assumptions provided within the Dodd-Frank Act stress testing rule. See 12 CFR 252.56(b). These projections
represent hypothetical estimates that involve an economic outcome that is more adverse than expected. The minimum capital ratio presented is for the period 2018:Q1 to
2020:Q1. In accordance with the regulatory capital framework, all risk-based capital ratios are calculated using standardized RWAs, which became effective on January 1,
2015.
Source: Federal Reserve estimates in the adverse scenario.
June 2018 41
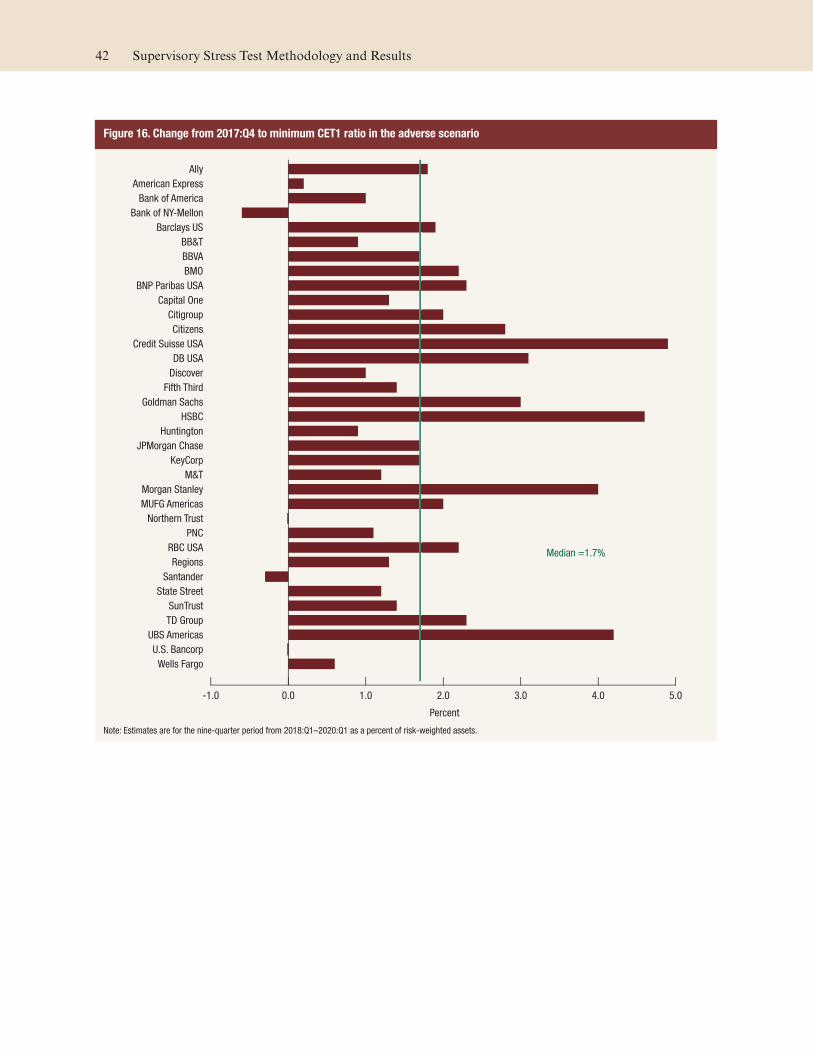
Figure 16. Change from 2017:Q4 to minimum CET1 ratio in the adverse scenario
-1.0 0.0 1.0 2.0 3.0 4.0 5.0
Wells Fargo
U.S. Bancorp
UBS Americas
TD Group
SunTrust
State Street
Santander
Regions
RBC USA
PNC
Northern Trust
MUFG Americas
Morgan Stanley
M&T
KeyCorp
JPMorgan Chase
Huntington
HSBC
Goldman Sachs
Fifth Third
Discover
DB USA
Credit Suisse USA
Citizens
Citigroup
Capital One
BNP Paribas USA
BMO
BBVA
BB&T
Barclays US
Bank of NY-Mellon
Bank of America
American Express
Ally
Percent
Median =1.7%
Note: Estimates are for the nine-quarter period from 2018:Q1–2020:Q1 as a percent of risk-weighted assets.
42 Supervisory Stress Test Methodology and Results

Figure 17. Total loan loss rates in the adverse scenario
0.0 2.0 4.0 6.0 8.0 10.0 12.0
Wells Fargo
U.S. Bancorp
UBS Americas
TD Group
SunTrust
State Street
Santander
Regions
RBC USA
PNC
Northern Trust
MUFG Americas
Morgan Stanley
M&T
KeyCorp
JPMorgan Chase
Huntington
HSBC
Goldman Sachs
Fifth Third
Discover
DB USA
Credit Suisse USA
Citizens
Citigroup
Capital One
BNP Paribas USA
BMO
BBVA
BB&T
Barclays US
Bank of NY-Mellon
Bank of America
American Express
Ally
Percent
Median = 3.5%
Note: Estimates are for the nine-quarter period from 2018:Q1–2020:Q1 as a percent of average balances.
June 2018 43
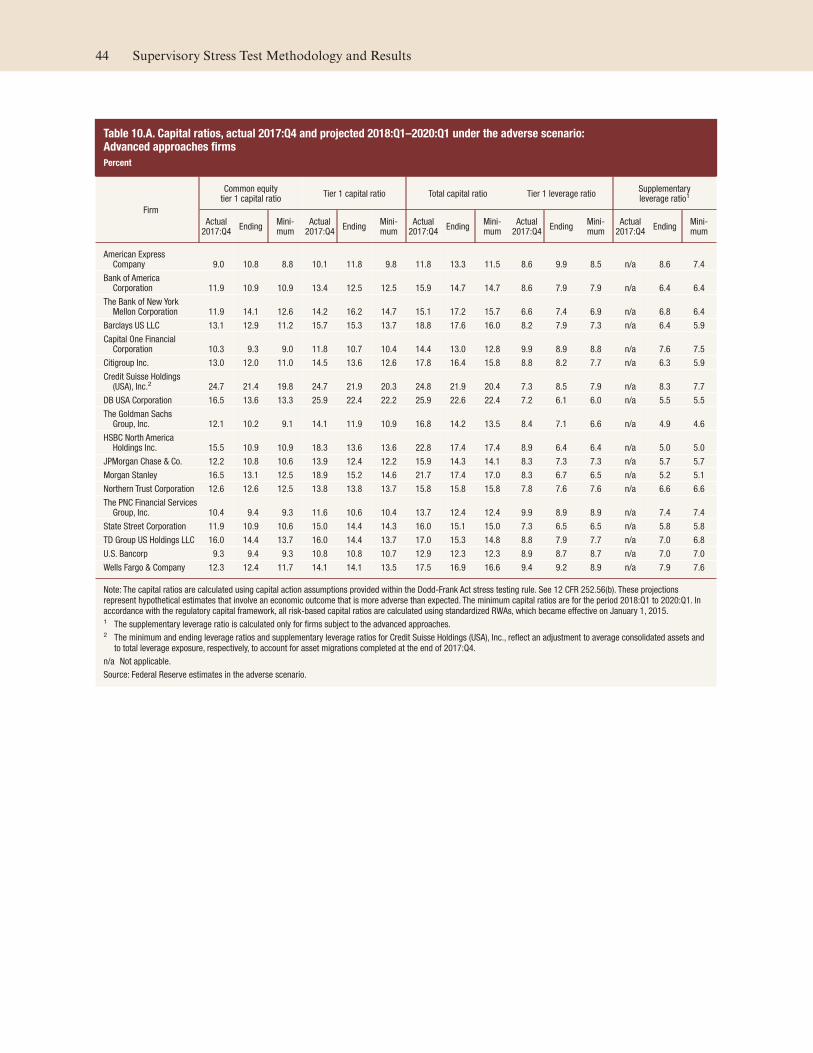
Table 10.A. Capital ratios, actual 2017:Q4 and projected 2018:Q1–2020:Q1 under the adverse scenario:Advanced approaches firms
Percent
Firm
Common equitytier 1 capital ratio
Tier 1 capital ratio Total capital ratio Tier 1 leverage ratio Supplementaryleverage ratio1
Actual2017:Q4
Ending Mini-mum
Actual2017:Q4
Ending Mini-mum
Actual2017:Q4
Ending Mini-mum
Actual2017:Q4
Ending Mini-mum
Actual2017:Q4
Ending Mini-mum
American ExpressCompany 9.0 10.8 8.8 10.1 11.8 9.8 11.8 13.3 11.5 8.6 9.9 8.5 n/a 8.6 7.4
Bank of AmericaCorporation 11.9 10.9 10.9 13.4 12.5 12.5 15.9 14.7 14.7 8.6 7.9 7.9 n/a 6.4 6.4
The Bank of New YorkMellon Corporation 11.9 14.1 12.6 14.2 16.2 14.7 15.1 17.2 15.7 6.6 7.4 6.9 n/a 6.8 6.4
Barclays US LLC 13.1 12.9 11.2 15.7 15.3 13.7 18.8 17.6 16.0 8.2 7.9 7.3 n/a 6.4 5.9
Capital One FinancialCorporation 10.3 9.3 9.0 11.8 10.7 10.4 14.4 13.0 12.8 9.9 8.9 8.8 n/a 7.6 7.5
Citigroup Inc. 13.0 12.0 11.0 14.5 13.6 12.6 17.8 16.4 15.8 8.8 8.2 7.7 n/a 6.3 5.9
Credit Suisse Holdings(USA), Inc.2 24.7 21.4 19.8 24.7 21.9 20.3 24.8 21.9 20.4 7.3 8.5 7.9 n/a 8.3 7.7
DB USA Corporation 16.5 13.6 13.3 25.9 22.4 22.2 25.9 22.6 22.4 7.2 6.1 6.0 n/a 5.5 5.5
The Goldman SachsGroup, Inc. 12.1 10.2 9.1 14.1 11.9 10.9 16.8 14.2 13.5 8.4 7.1 6.6 n/a 4.9 4.6
HSBC North AmericaHoldings Inc. 15.5 10.9 10.9 18.3 13.6 13.6 22.8 17.4 17.4 8.9 6.4 6.4 n/a 5.0 5.0
JPMorgan Chase & Co. 12.2 10.8 10.6 13.9 12.4 12.2 15.9 14.3 14.1 8.3 7.3 7.3 n/a 5.7 5.7
Morgan Stanley 16.5 13.1 12.5 18.9 15.2 14.6 21.7 17.4 17.0 8.3 6.7 6.5 n/a 5.2 5.1
Northern Trust Corporation 12.6 12.6 12.5 13.8 13.8 13.7 15.8 15.8 15.8 7.8 7.6 7.6 n/a 6.6 6.6
The PNC Financial ServicesGroup, Inc. 10.4 9.4 9.3 11.6 10.6 10.4 13.7 12.4 12.4 9.9 8.9 8.9 n/a 7.4 7.4
State Street Corporation 11.9 10.9 10.6 15.0 14.4 14.3 16.0 15.1 15.0 7.3 6.5 6.5 n/a 5.8 5.8
TD Group US Holdings LLC 16.0 14.4 13.7 16.0 14.4 13.7 17.0 15.3 14.8 8.8 7.9 7.7 n/a 7.0 6.8
U.S. Bancorp 9.3 9.4 9.3 10.8 10.8 10.7 12.9 12.3 12.3 8.9 8.7 8.7 n/a 7.0 7.0
Wells Fargo & Company 12.3 12.4 11.7 14.1 14.1 13.5 17.5 16.9 16.6 9.4 9.2 8.9 n/a 7.9 7.6
Note: The capital ratios are calculated using capital action assumptions provided within the Dodd-Frank Act stress testing rule. See 12 CFR 252.56(b). These projections
represent hypothetical estimates that involve an economic outcome that is more adverse than expected. The minimum capital ratios are for the period 2018:Q1 to 2020:Q1. In
accordance with the regulatory capital framework, all risk-based capital ratios are calculated using standardized RWAs, which became effective on January 1, 2015.1 The supplementary leverage ratio is calculated only for firms subject to the advanced approaches.2 The minimum and ending leverage ratios and supplementary leverage ratios for Credit Suisse Holdings (USA), Inc., reflect an adjustment to average consolidated assets and
to total leverage exposure, respectively, to account for asset migrations completed at the end of 2017:Q4.
n/a Not applicable.
Source: Federal Reserve estimates in the adverse scenario.
44 Supervisory Stress Test Methodology and Results
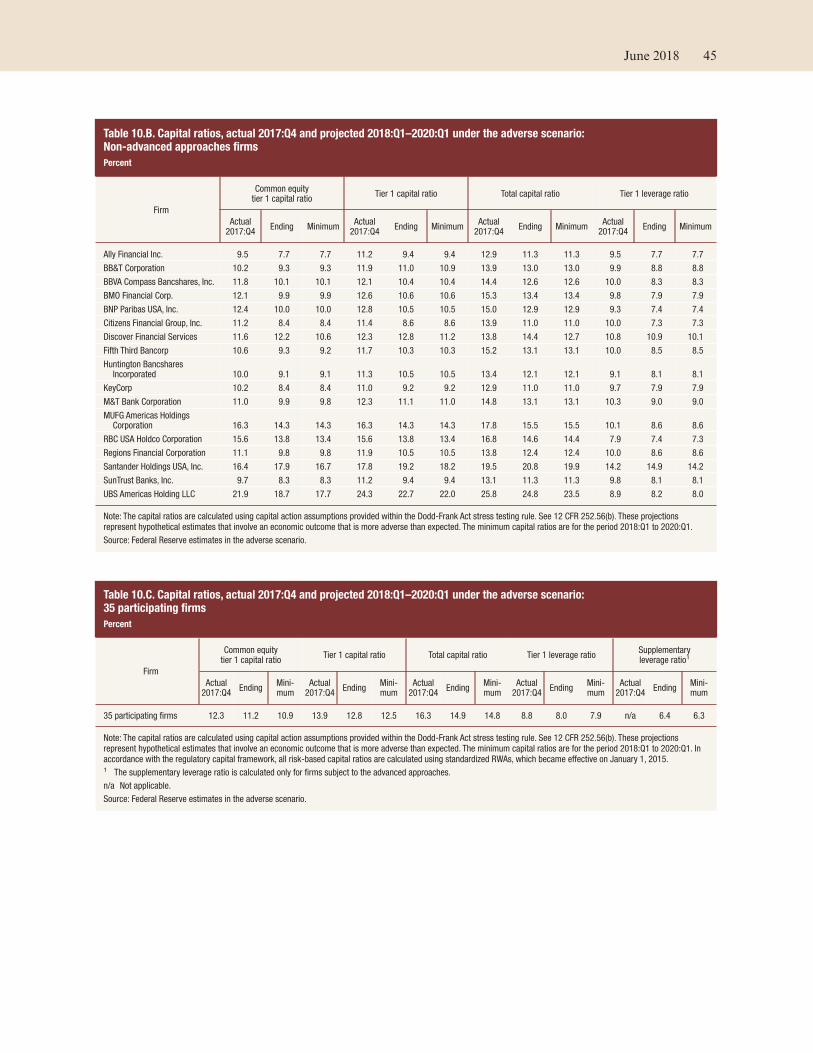
Table 10.B. Capital ratios, actual 2017:Q4 and projected 2018:Q1–2020:Q1 under the adverse scenario:Non-advanced approaches firms
Percent
Firm
Common equitytier 1 capital ratio
Tier 1 capital ratio Total capital ratio Tier 1 leverage ratio
Actual2017:Q4
Ending Minimum Actual
2017:Q4 Ending Minimum
Actual2017:Q4
Ending Minimum Actual
2017:Q4 Ending Minimum
Ally Financial Inc. 9.5 7.7 7.7 11.2 9.4 9.4 12.9 11.3 11.3 9.5 7.7 7.7
BB&T Corporation 10.2 9.3 9.3 11.9 11.0 10.9 13.9 13.0 13.0 9.9 8.8 8.8
BBVA Compass Bancshares, Inc. 11.8 10.1 10.1 12.1 10.4 10.4 14.4 12.6 12.6 10.0 8.3 8.3
BMO Financial Corp. 12.1 9.9 9.9 12.6 10.6 10.6 15.3 13.4 13.4 9.8 7.9 7.9
BNP Paribas USA, Inc. 12.4 10.0 10.0 12.8 10.5 10.5 15.0 12.9 12.9 9.3 7.4 7.4
Citizens Financial Group, Inc. 11.2 8.4 8.4 11.4 8.6 8.6 13.9 11.0 11.0 10.0 7.3 7.3
Discover Financial Services 11.6 12.2 10.6 12.3 12.8 11.2 13.8 14.4 12.7 10.8 10.9 10.1
Fifth Third Bancorp 10.6 9.3 9.2 11.7 10.3 10.3 15.2 13.1 13.1 10.0 8.5 8.5
Huntington BancsharesIncorporated 10.0 9.1 9.1 11.3 10.5 10.5 13.4 12.1 12.1 9.1 8.1 8.1
KeyCorp 10.2 8.4 8.4 11.0 9.2 9.2 12.9 11.0 11.0 9.7 7.9 7.9
M&T Bank Corporation 11.0 9.9 9.8 12.3 11.1 11.0 14.8 13.1 13.1 10.3 9.0 9.0
MUFG Americas HoldingsCorporation 16.3 14.3 14.3 16.3 14.3 14.3 17.8 15.5 15.5 10.1 8.6 8.6
RBC USA Holdco Corporation 15.6 13.8 13.4 15.6 13.8 13.4 16.8 14.6 14.4 7.9 7.4 7.3
Regions Financial Corporation 11.1 9.8 9.8 11.9 10.5 10.5 13.8 12.4 12.4 10.0 8.6 8.6
Santander Holdings USA, Inc. 16.4 17.9 16.7 17.8 19.2 18.2 19.5 20.8 19.9 14.2 14.9 14.2
SunTrust Banks, Inc. 9.7 8.3 8.3 11.2 9.4 9.4 13.1 11.3 11.3 9.8 8.1 8.1
UBS Americas Holding LLC 21.9 18.7 17.7 24.3 22.7 22.0 25.8 24.8 23.5 8.9 8.2 8.0
Note: The capital ratios are calculated using capital action assumptions provided within the Dodd-Frank Act stress testing rule. See 12 CFR 252.56(b). These projections
represent hypothetical estimates that involve an economic outcome that is more adverse than expected. The minimum capital ratios are for the period 2018:Q1 to 2020:Q1.
Source: Federal Reserve estimates in the adverse scenario.
Table 10.C. Capital ratios, actual 2017:Q4 and projected 2018:Q1–2020:Q1 under the adverse scenario:35 participating firms
Percent
Firm
Common equitytier 1 capital ratio
Tier 1 capital ratio Total capital ratio Tier 1 leverage ratio Supplementaryleverage ratio1
Actual2017:Q4
Ending Mini-mum
Actual2017:Q4
Ending Mini-mum
Actual2017:Q4
Ending Mini-mum
Actual2017:Q4
Ending Mini-mum
Actual2017:Q4
Ending Mini-mum
35 participating firms 12.3 11.2 10.9 13.9 12.8 12.5 16.3 14.9 14.8 8.8 8.0 7.9 n/a 6.4 6.3
Note: The capital ratios are calculated using capital action assumptions provided within the Dodd-Frank Act stress testing rule. See 12 CFR 252.56(b). These projections
represent hypothetical estimates that involve an economic outcome that is more adverse than expected. The minimum capital ratios are for the period 2018:Q1 to 2020:Q1. In
accordance with the regulatory capital framework, all risk-based capital ratios are calculated using standardized RWAs, which became effective on January 1, 2015.1 The supplementary leverage ratio is calculated only for firms subject to the advanced approaches.
n/a Not applicable.
Source: Federal Reserve estimates in the adverse scenario.
June 2018 45

Table 11. Projected losses, revenue, and net income before taxes through 2020:Q1 under the adverse scenario:35 participating firms
Billions of dollars
Firm
Sum of revenues Minus sum of provisions and losses Equals Memo items Other effects
on capital
Pre-provisionnet revenue1
Otherrevenue2 Provisions
Realizedlosses/gainson securities(AFS/HTM)
Trading andcounterparty
losses3
Otherlosses/gains4
Net incomebeforetaxes
Othercompre-hensiveincome5
AOCIincluded
in capital6
(2020:Q1)
Ally Financial Inc. 4.2 0.0 5.5 0.2 0.0 0.1 -1.5 0.0 0.0
American Express Company 20.6 0.0 11.8 0.0 0.0 0.0 8.8 0.1 -2.4
Bank of America Corporation 47.8 0.0 28.8 0.2 7.0 3.2 8.6 8.3 2.1
The Bank of New York Mellon Corporation 9.6 0.0 1.4 0.1 0.4 0.0 7.7 1.0 -1.3
Barclays US LLC 5.9 0.0 3.0 0.0 0.8 0.0 2.1 0.0 -0.1
BB&T Corporation 8.4 0.0 5.1 0.0 0.0 0.0 3.2 0.0 0.0
BBVA Compass Bancshares, Inc. 2.0 0.0 2.4 0.0 0.0 0.0 -0.4 0.0 0.0
BMO Financial Corp. 2.1 0.0 3.2 0.0 0.0 0.0 -1.1 0.0 0.0
BNP Paribas USA, Inc. 2.2 0.0 3.5 0.0 0.0 0.0 -1.4 0.0 0.0
Capital One Financial Corporation 29.6 0.0 27.4 0.1 0.0 0.2 1.9 0.4 -0.3
Citigroup Inc. 58.8 0.0 32.9 0.8 7.6 2.5 15.0 3.5 -30.5
Citizens Financial Group, Inc. 2.6 0.0 4.5 0.0 0.0 0.1 -2.0 0.0 0.0
Credit Suisse Holdings (USA), Inc. 2.1 0.0 0.1 0.0 1.9 0.1 0.0 0.0 -0.2
DB USA Corporation 0.7 0.0 0.3 0.0 0.5 0.0 -0.1 0.0 -0.3
Discover Financial Services 14.3 0.0 10.7 0.0 0.0 0.0 3.5 0.0 0.0
Fifth Third Bancorp 3.7 0.0 3.1 0.0 0.0 0.0 0.6 0.0 0.0
The Goldman Sachs Group, Inc. 16.0 0.0 6.9 0.0 6.5 5.4 -2.8 0.5 -1.3
HSBC North America Holdings Inc. -0.6 0.0 2.1 0.0 0.5 0.2 -3.3 1.4 0.7
Huntington Bancshares Incorporated 2.9 0.0 2.3 0.0 0.0 0.0 0.5 0.0 0.0
JPMorgan Chase & Co. 73.0 0.0 37.2 0.4 13.1 0.9 21.5 -0.2 -0.4
KeyCorp 3.2 0.0 3.2 0.0 0.0 0.1 -0.1 0.0 0.0
M&T Bank Corporation 4.7 0.0 3.1 0.0 0.0 0.0 1.5 0.0 0.0
Morgan Stanley 8.1 0.0 3.1 0.0 4.2 4.0 -3.2 1.5 -1.6
MUFG Americas Holdings Corporation 2.3 0.0 2.3 0.0 0.0 0.1 0.0 0.0 -0.1
Northern Trust Corporation 2.7 0.0 1.1 0.1 0.0 0.0 1.4 0.4 0.0
The PNC Financial Services Group, Inc. 12.5 0.0 6.4 0.1 0.0 0.5 5.5 0.7 0.4
RBC USA Holdco Corporation 2.1 0.0 1.9 0.0 0.4 0.0 -0.2 0.0 0.0
Regions Financial Corporation 3.4 0.0 3.2 0.0 0.0 0.0 0.2 0.0 0.0
Santander Holdings USA, Inc. 7.3 0.0 3.6 0.0 0.0 0.1 3.6 0.0 0.0
State Street Corporation 4.3 0.0 0.7 0.1 1.3 0.0 2.2 0.3 -0.7
SunTrust Banks, Inc. 5.6 0.0 4.5 0.0 0.0 0.3 0.8 0.0 0.0
TD Group US Holdings LLC 6.9 0.0 6.1 0.1 0.0 0.0 0.6 -0.6 -0.5
UBS Americas Holding LLC 2.9 0.0 1.5 0.0 0.4 0.0 1.1 0.0 0.0
U.S. Bancorp 18.3 0.0 10.3 0.0 0.0 0.0 8.0 1.7 0.3
Wells Fargo & Company 76.5 0.0 28.4 0.6 3.7 1.1 42.7 0.0 -1.7
35 participating firms 466.7 0.0 271.6 2.8 48.2 18.9 125.0 19.0 -38.0
Note: These projections represent hypothetical estimates that involve an economic outcome that is more adverse than expected. Estimates may not sum precisely due to
rounding.1 Pre-provision net revenue includes losses from operational-risk events and other real estate owned costs.2 Other revenue includes one-time income and (expense) items not included in pre-provision net revenue.3 Trading and counterparty losses include mark-to-market and credit valuation adjustments losses and losses arising from the counterparty default scenario component
applied to derivatives, securities lending, and repurchase agreement activities.4 Other losses/gains includes projected change in fair value of loans held for sale and loans held for investment measured under the fair-value option, and goodwill impairment
losses.5 Other comprehensive income is only calculated for advanced approaches firms and other firms that opt into advanced approaches treatment for AOCI.6 Certain aspects of AOCI are subject to transition arrangements for inclusion in projected regulatory capital. Those transitions are 100 percent included in projected regulatory
capital starting in 2018. See 12 CFR 217.300(b)(3).
Source: Federal Reserve estimates in the adverse scenario.
46 Supervisory Stress Test Methodology and Results
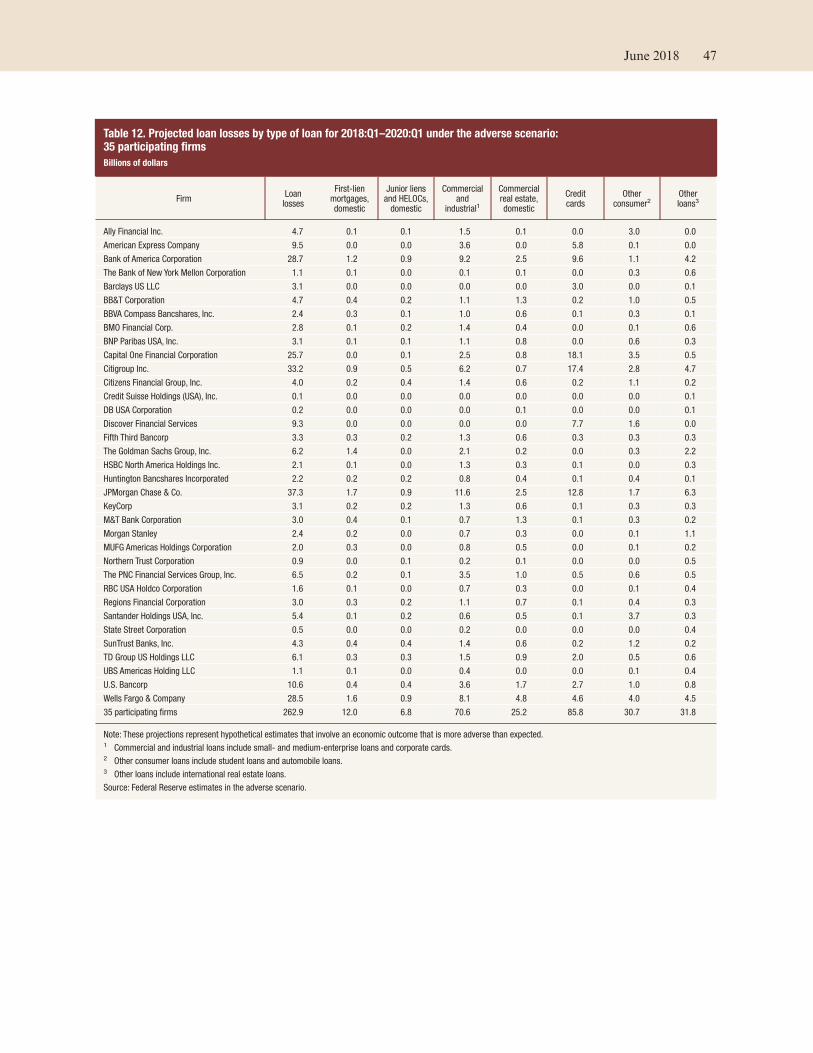
Table 12. Projected loan losses by type of loan for 2018:Q1–2020:Q1 under the adverse scenario:35 participating firms
Billions of dollars
Firm Loan
losses
First-lienmortgages,domestic
Junior liensand HELOCs,
domestic
Commercialand
industrial1
Commercialreal estate,domestic
Creditcards
Otherconsumer2
Otherloans3
Ally Financial Inc. 4.7 0.1 0.1 1.5 0.1 0.0 3.0 0.0
American Express Company 9.5 0.0 0.0 3.6 0.0 5.8 0.1 0.0
Bank of America Corporation 28.7 1.2 0.9 9.2 2.5 9.6 1.1 4.2
The Bank of New York Mellon Corporation 1.1 0.1 0.0 0.1 0.1 0.0 0.3 0.6
Barclays US LLC 3.1 0.0 0.0 0.0 0.0 3.0 0.0 0.1
BB&T Corporation 4.7 0.4 0.2 1.1 1.3 0.2 1.0 0.5
BBVA Compass Bancshares, Inc. 2.4 0.3 0.1 1.0 0.6 0.1 0.3 0.1
BMO Financial Corp. 2.8 0.1 0.2 1.4 0.4 0.0 0.1 0.6
BNP Paribas USA, Inc. 3.1 0.1 0.1 1.1 0.8 0.0 0.6 0.3
Capital One Financial Corporation 25.7 0.0 0.1 2.5 0.8 18.1 3.5 0.5
Citigroup Inc. 33.2 0.9 0.5 6.2 0.7 17.4 2.8 4.7
Citizens Financial Group, Inc. 4.0 0.2 0.4 1.4 0.6 0.2 1.1 0.2
Credit Suisse Holdings (USA), Inc. 0.1 0.0 0.0 0.0 0.0 0.0 0.0 0.1
DB USA Corporation 0.2 0.0 0.0 0.0 0.1 0.0 0.0 0.1
Discover Financial Services 9.3 0.0 0.0 0.0 0.0 7.7 1.6 0.0
Fifth Third Bancorp 3.3 0.3 0.2 1.3 0.6 0.3 0.3 0.3
The Goldman Sachs Group, Inc. 6.2 1.4 0.0 2.1 0.2 0.0 0.3 2.2
HSBC North America Holdings Inc. 2.1 0.1 0.0 1.3 0.3 0.1 0.0 0.3
Huntington Bancshares Incorporated 2.2 0.2 0.2 0.8 0.4 0.1 0.4 0.1
JPMorgan Chase & Co. 37.3 1.7 0.9 11.6 2.5 12.8 1.7 6.3
KeyCorp 3.1 0.2 0.2 1.3 0.6 0.1 0.3 0.3
M&T Bank Corporation 3.0 0.4 0.1 0.7 1.3 0.1 0.3 0.2
Morgan Stanley 2.4 0.2 0.0 0.7 0.3 0.0 0.1 1.1
MUFG Americas Holdings Corporation 2.0 0.3 0.0 0.8 0.5 0.0 0.1 0.2
Northern Trust Corporation 0.9 0.0 0.1 0.2 0.1 0.0 0.0 0.5
The PNC Financial Services Group, Inc. 6.5 0.2 0.1 3.5 1.0 0.5 0.6 0.5
RBC USA Holdco Corporation 1.6 0.1 0.0 0.7 0.3 0.0 0.1 0.4
Regions Financial Corporation 3.0 0.3 0.2 1.1 0.7 0.1 0.4 0.3
Santander Holdings USA, Inc. 5.4 0.1 0.2 0.6 0.5 0.1 3.7 0.3
State Street Corporation 0.5 0.0 0.0 0.2 0.0 0.0 0.0 0.4
SunTrust Banks, Inc. 4.3 0.4 0.4 1.4 0.6 0.2 1.2 0.2
TD Group US Holdings LLC 6.1 0.3 0.3 1.5 0.9 2.0 0.5 0.6
UBS Americas Holding LLC 1.1 0.1 0.0 0.4 0.0 0.0 0.1 0.4
U.S. Bancorp 10.6 0.4 0.4 3.6 1.7 2.7 1.0 0.8
Wells Fargo & Company 28.5 1.6 0.9 8.1 4.8 4.6 4.0 4.5
35 participating firms 262.9 12.0 6.8 70.6 25.2 85.8 30.7 31.8
Note: These projections represent hypothetical estimates that involve an economic outcome that is more adverse than expected.1 Commercial and industrial loans include small- and medium-enterprise loans and corporate cards.2 Other consumer loans include student loans and automobile loans.3 Other loans include international real estate loans.
Source: Federal Reserve estimates in the adverse scenario.
June 2018 47

Table 13. Projected loan losses by type of loan for 2018:Q1–2020:Q1 under the adverse scenario:35 participating firms
Percent of average balances1
Firm Loan
losses
First-lienmortgages,domestic
Junior liensand HELOCs,
domestic
Commercialand
industrial2
Commercialreal estate,domestic
Credit cards Other
consumer3 Other loans4
Ally Financial Inc. 3.7 1.0 4.8 3.3 1.6 0.0 4.7 4.6
American Express Company 7.1 0.0 0.0 7.7 0.0 6.8 10.2 3.7
Bank of America Corporation 2.9 0.6 1.6 3.4 3.3 9.7 1.4 2.0
The Bank of New York Mellon Corporation 1.8 0.9 3.0 1.9 3.8 0.0 7.6 1.4
Barclays US LLC 8.0 0.0 0.0 20.3 2.4 11.2 10.2 0.6
BB&T Corporation 3.2 1.4 1.9 3.9 3.4 10.0 4.9 2.5
BBVA Compass Bancshares, Inc. 3.8 2.0 2.7 5.1 4.2 12.4 6.4 1.2
BMO Financial Corp. 3.8 1.4 7.0 4.7 3.7 9.2 1.9 3.4
BNP Paribas USA, Inc. 3.9 0.9 2.6 6.5 4.1 10.6 3.6 3.3
Capital One Financial Corporation 9.8 0.3 3.3 8.6 2.7 16.5 6.4 2.9
Citigroup Inc. 4.8 1.2 2.7 3.5 3.6 10.7 9.1 2.2
Citizens Financial Group, Inc. 3.6 1.1 2.7 4.3 4.0 9.3 4.6 2.4
Credit Suisse Holdings (USA), Inc. 0.5 0.0 0.0 0.0 0.0 0.0 10.2 0.5
DB USA Corporation 1.4 1.1 3.0 1.4 2.3 0.0 4.7 0.9
Discover Financial Services 10.7 1.4 7.1 11.2 6.7 11.1 9.4 3.7
Fifth Third Bancorp 3.5 2.0 2.9 3.6 5.0 12.8 3.0 2.5
The Goldman Sachs Group, Inc. 6.2 40.4 2.8 10.3 4.1 0.0 6.9 3.3
HSBC North America Holdings Inc. 3.2 0.8 2.5 4.8 2.9 10.6 5.9 2.7
Huntington Bancshares Incorporated 3.0 1.7 2.1 3.8 3.9 10.6 2.7 2.5
JPMorgan Chase & Co. 3.8 0.7 2.0 7.0 2.1 9.0 2.5 3.1
KeyCorp 3.4 2.2 2.6 3.9 3.9 9.7 4.6 1.9
M&T Bank Corporation 3.4 2.1 2.6 3.8 3.7 10.6 4.1 3.1
Morgan Stanley 1.9 0.7 2.8 6.8 2.3 0.0 0.6 1.9
MUFG Americas Holdings Corporation 2.5 0.8 1.1 4.8 3.1 10.6 12.6 2.7
Northern Trust Corporation 2.7 0.6 4.4 3.2 2.9 0.0 10.2 3.1
The PNC Financial Services Group, Inc. 2.9 0.7 0.8 4.3 2.8 10.4 2.6 1.6
RBC USA Holdco Corporation 3.6 0.7 1.9 7.5 3.1 10.6 8.3 2.8
Regions Financial Corporation 3.6 1.7 2.8 4.6 5.0 10.9 6.3 1.8
Santander Holdings USA, Inc. 6.5 1.4 2.7 3.7 2.7 10.8 13.8 3.9
State Street Corporation 2.3 0.0 0.0 4.2 2.1 0.0 0.6 1.9
SunTrust Banks, Inc. 2.9 1.6 3.4 3.2 2.9 9.8 4.1 1.5
TD Group US Holdings LLC 3.9 1.3 3.3 4.4 3.2 14.9 1.9 2.3
UBS Americas Holding LLC 1.8 0.8 0.0 5.9 1.8 10.6 0.6 2.5
U.S. Bancorp 3.7 0.7 2.6 4.6 4.4 11.7 2.4 3.1
Wells Fargo & Company 2.9 0.6 1.6 4.2 3.5 11.8 4.7 2.4
35 participating firms 3.9 0.9 2.1 4.6 3.3 10.9 4.3 2.4
Note: These projections represent hypothetical estimates that involve an economic outcome that is more adverse than expected.1 Average loan balances used to calculate portfolio loss rates exclude loans held for sale and loans held for investment under the fair-value option, and are calculated over
nine quarters.2 Commercial and industrial loans include small- and medium-enterprise loans and corporate cards.3 Other consumer loans include student loans and automobile loans.4 Other loans include international real estate loans.
Source: Federal Reserve estimates in the adverse scenario.
48 Supervisory Stress Test Methodology and Results

Figure 18. PPNR rates in the adverse scenario
-1.0 0.0 1.0 2.0 3.0 4.0 5.0 6.0 7.0 8.0 9.0 10.0 11.0 12.0
Wells Fargo
U.S. Bancorp
UBS Americas
TD Group
SunTrust
State Street
Santander
Regions
RBC USA
PNC
Northern Trust
MUFG Americas
Morgan Stanley
M&T
KeyCorp
JPMorgan Chase
Huntington
HSBC
Goldman Sachs
Fifth Third
Discover
DB USA
Credit Suisse USA
Citizens
Citigroup
Capital One
BNP Paribas USA
BMO
BBVA
BB&T
Barclays US
Bank of NY-Mellon
Bank of America
American Express
Ally
13.5
Percent
Median = 2.4%
Note: Estimates are for the nine-quarter period from 2018:Q1–2020:Q1 as a percent of average assets.
June 2018 49
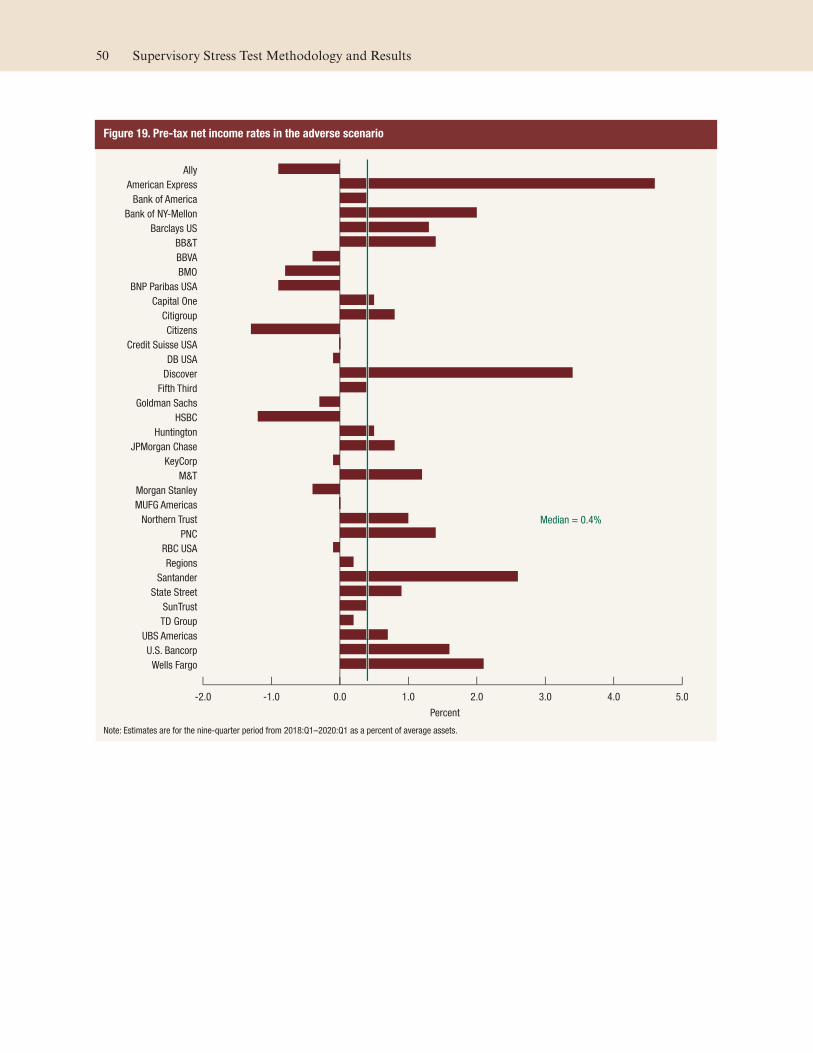
Figure 19. Pre-tax net income rates in the adverse scenario
-2.0 -1.0 0.0 1.0 2.0 3.0 4.0 5.0
Wells Fargo
U.S. Bancorp
UBS Americas
TD Group
SunTrust
State Street
Santander
Regions
RBC USA
PNC
Northern Trust
MUFG Americas
Morgan Stanley
M&T
KeyCorp
JPMorgan Chase
Huntington
HSBC
Goldman Sachs
Fifth Third
Discover
DB USA
Credit Suisse USA
Citizens
Citigroup
Capital One
BNP Paribas USA
BMO
BBVA
BB&T
Barclays US
Bank of NY-Mellon
Bank of America
American Express
Ally
Percent
Median = 0.4%
Note: Estimates are for the nine-quarter period from 2018:Q1–2020:Q1 as a percent of average assets.
50 Supervisory Stress Test Methodology and Results

Table 14. Mapping of loan categories to disclosure categories
Disclosure category Loan type
First-lien mortgages, domestic Domestic first-lien mortgages
Junior liens and HELOCs, domestic Domestic second-lien mortgagesDomestic HELOCs
Credit cards Domestic cardsInternational cards
Commercial and industrial Commercial and industrial loansCorporate and business cardsSmall business loans
Commercial real estate, domestic Domestic owner-occupied CRE loansDomestic construction loansDomestic multifamily loansDomestic non-owner occupied CRE loans
Other consumer Student loansDomestic auto loansInternational auto loansDomestic other consumer loansInternational other consumer loans
Other loans Agricultural loansDomestic farm loansInternational farm loansInternational owner-occupied CRE loansInternational construction loansInternational multifamily loansInternational non-owner occupied CRE loansInternational first-lien mortgagesInternational second-lien mortgagesLoans to foreign governmentsLoans to financial institutionsLoans for purchasing and carrying securitiesOther non-consumer loansOther leases
June 2018 51


Appendix A: Supervisory Scenarios
This appendix includes the adverse and severely
adverse scenarios provided by the Federal Reserve.
It is important to note that the adverse and severely
adverse scenarios are not forecasts but rather are
hypothetical scenarios designed to assess the strength
of banking organizations and their resilience to
adverse economic environments.
Table A.1. Historical data: Domestic variables, Q1:2000–Q4:2017
Percent, unless otherwise indicated.
DateReal GDPgrowth
NominalGDP
growth
Realdispo-sable
incomegrowth
Nominaldispo-sable
incomegrowth
Unem-ployment
rate
CPIinflation
rate
3-monthTreasury
rate
5-yearTreasury
yield
10-yearTreasury
yield
BBBcorporate
yield
Mortgagerate
Primerate
Level
DowJonesTotalStock
MarketIndex
HousePriceIndex
Com-mercial
RealEstatePriceIndex
MarketVolatility
Index
Q1 2000 1.2 4.3 8.1 11.8 4.0 4.0 5.5 6.6 6.7 8.2 8.3 8.7 14,296 102 127 27.0
Q2 2000 7.8 10.2 4.2 6.1 3.9 3.2 5.7 6.5 6.4 8.5 8.3 9.2 13,619 105 125 33.5
Q3 2000 0.5 3.1 4.8 7.4 4.0 3.7 6.0 6.1 6.1 8.1 8.0 9.5 13,613 107 139 21.9
Q4 2000 2.3 4.5 1.4 3.6 3.9 2.9 6.0 5.6 5.8 7.9 7.6 9.5 12,176 110 144 31.7
Q1 2001 -1.1 1.4 3.5 6.3 4.2 3.9 4.8 4.9 5.3 7.4 7.0 8.6 10,646 112 143 32.8
Q2 2001 2.1 5.1 -0.3 1.6 4.4 2.8 3.7 4.9 5.5 7.5 7.1 7.3 11,407 114 142 34.7
Q3 2001 -1.3 0.0 9.8 10.1 4.8 1.1 3.2 4.6 5.3 7.3 7.0 6.6 9,563 116 143 43.7
Q4 2001 1.1 2.3 -4.9 -4.6 5.5 -0.3 1.9 4.2 5.1 7.2 6.8 5.2 10,708 118 139 35.3
Q1 2002 3.7 5.1 10.1 10.9 5.7 1.3 1.7 4.5 5.4 7.6 7.0 4.8 10,776 120 140 26.1
Q2 2002 2.2 3.8 2.0 5.2 5.8 3.2 1.7 4.5 5.4 7.6 6.8 4.8 9,384 123 140 28.4
Q3 2002 2.0 3.8 -0.5 1.5 5.7 2.2 1.6 3.4 4.5 7.3 6.3 4.8 7,774 127 142 45.1
Q4 2002 0.3 2.4 1.9 3.8 5.9 2.4 1.3 3.1 4.3 7.0 6.1 4.5 8,343 129 144 42.6
Q1 2003 2.1 4.6 1.1 4.0 5.9 4.2 1.2 2.9 4.2 6.5 5.8 4.3 8,052 132 151 34.7
Q2 2003 3.8 5.1 5.9 6.3 6.1 -0.7 1.0 2.6 3.8 5.7 5.5 4.2 9,342 135 151 29.1
Q3 2003 6.9 9.3 6.7 9.3 6.1 3.0 0.9 3.1 4.4 6.0 6.0 4.0 9,650 139 149 22.7
Q4 2003 4.8 6.8 1.6 3.3 5.8 1.5 0.9 3.2 4.4 5.8 5.9 4.0 10,800 143 147 21.1
Q1 2004 2.3 5.9 2.9 6.1 5.7 3.4 0.9 3.0 4.1 5.5 5.6 4.0 11,039 148 153 21.6
Q2 2004 3.0 6.6 4.0 7.0 5.6 3.2 1.1 3.7 4.7 6.1 6.1 4.0 11,145 154 164 20.0
Q3 2004 3.7 6.3 2.1 4.5 5.4 2.6 1.5 3.5 4.4 5.8 5.9 4.4 10,894 159 175 19.3
Q4 2004 3.5 6.4 5.1 8.5 5.4 4.4 2.0 3.5 4.3 5.4 5.7 4.9 11,951 165 178 16.6
Q1 2005 4.3 8.3 -3.8 -1.8 5.3 2.0 2.5 3.9 4.4 5.4 5.8 5.4 11,637 172 179 14.7
Q2 2005 2.1 5.1 3.2 6.0 5.1 2.7 2.9 3.9 4.2 5.5 5.7 5.9 11,857 179 185 17.7
Q3 2005 3.4 7.3 2.1 6.6 5.0 6.2 3.4 4.0 4.3 5.5 5.8 6.4 12,283 185 190 14.2
Q4 2005 2.3 5.4 3.4 6.6 5.0 3.8 3.8 4.4 4.6 5.9 6.2 7.0 12,497 191 199 16.5
Q1 2006 4.9 8.2 9.5 11.5 4.7 2.1 4.4 4.6 4.7 6.0 6.2 7.4 13,122 194 204 14.6
Q2 2006 1.2 4.5 0.6 3.7 4.6 3.7 4.7 5.0 5.2 6.5 6.6 7.9 12,809 193 213 23.8
Q3 2006 0.4 3.2 1.2 4.1 4.6 3.8 4.9 4.8 5.0 6.4 6.6 8.3 13,322 192 220 18.6
Q4 2006 3.2 4.6 5.3 4.6 4.4 -1.6 4.9 4.6 4.7 6.1 6.2 8.3 14,216 191 222 12.7
Q1 2007 0.2 4.8 2.6 6.5 4.5 4.0 5.0 4.6 4.8 6.1 6.2 8.3 14,354 189 230 19.6
Q2 2007 3.1 5.4 0.8 4.0 4.5 4.6 4.7 4.7 4.9 6.3 6.4 8.3 15,163 184 239 18.9
Q3 2007 2.7 4.2 1.1 3.4 4.7 2.6 4.3 4.5 4.8 6.5 6.6 8.2 15,318 178 247 30.8
(continued)
53
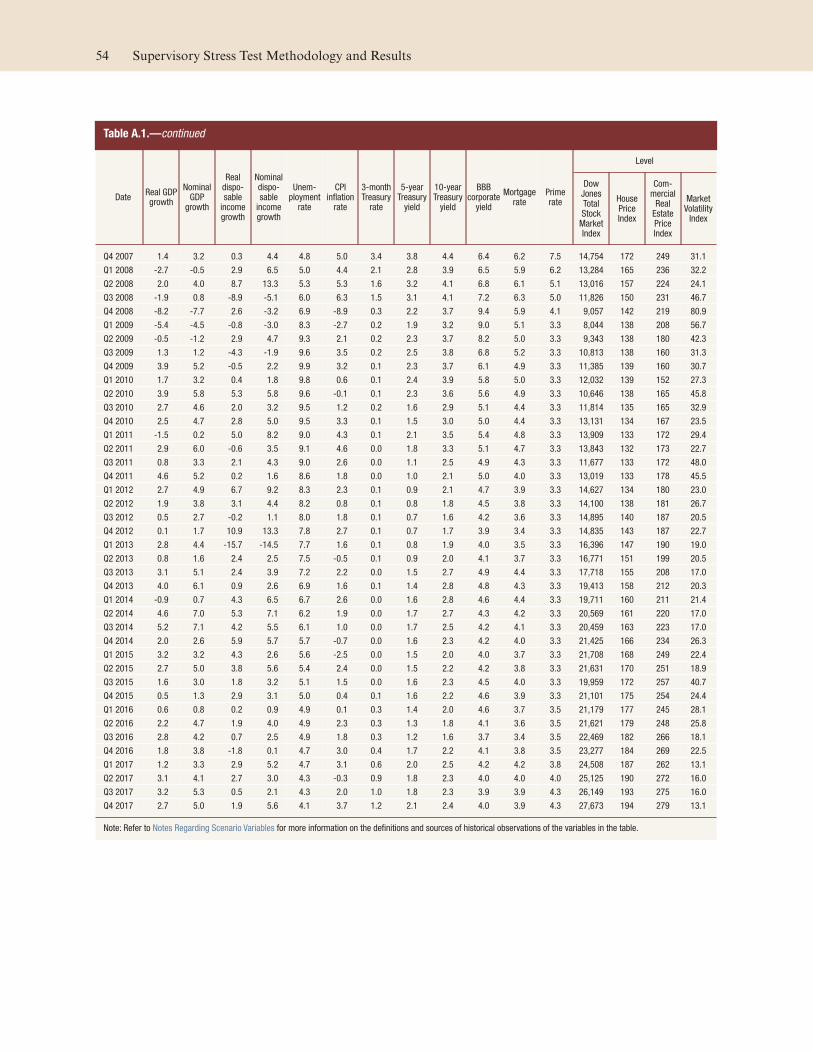
Table A.1.—continued
DateReal GDPgrowth
NominalGDP
growth
Realdispo-sable
incomegrowth
Nominaldispo-sable
incomegrowth
Unem-ployment
rate
CPIinflation
rate
3-monthTreasury
rate
5-yearTreasury
yield
10-yearTreasury
yield
BBBcorporate
yield
Mortgagerate
Primerate
Level
DowJonesTotalStock
MarketIndex
HousePriceIndex
Com-mercial
RealEstatePriceIndex
MarketVolatility
Index
Q4 2007 1.4 3.2 0.3 4.4 4.8 5.0 3.4 3.8 4.4 6.4 6.2 7.5 14,754 172 249 31.1
Q1 2008 -2.7 -0.5 2.9 6.5 5.0 4.4 2.1 2.8 3.9 6.5 5.9 6.2 13,284 165 236 32.2
Q2 2008 2.0 4.0 8.7 13.3 5.3 5.3 1.6 3.2 4.1 6.8 6.1 5.1 13,016 157 224 24.1
Q3 2008 -1.9 0.8 -8.9 -5.1 6.0 6.3 1.5 3.1 4.1 7.2 6.3 5.0 11,826 150 231 46.7
Q4 2008 -8.2 -7.7 2.6 -3.2 6.9 -8.9 0.3 2.2 3.7 9.4 5.9 4.1 9,057 142 219 80.9
Q1 2009 -5.4 -4.5 -0.8 -3.0 8.3 -2.7 0.2 1.9 3.2 9.0 5.1 3.3 8,044 138 208 56.7
Q2 2009 -0.5 -1.2 2.9 4.7 9.3 2.1 0.2 2.3 3.7 8.2 5.0 3.3 9,343 138 180 42.3
Q3 2009 1.3 1.2 -4.3 -1.9 9.6 3.5 0.2 2.5 3.8 6.8 5.2 3.3 10,813 138 160 31.3
Q4 2009 3.9 5.2 -0.5 2.2 9.9 3.2 0.1 2.3 3.7 6.1 4.9 3.3 11,385 139 160 30.7
Q1 2010 1.7 3.2 0.4 1.8 9.8 0.6 0.1 2.4 3.9 5.8 5.0 3.3 12,032 139 152 27.3
Q2 2010 3.9 5.8 5.3 5.8 9.6 -0.1 0.1 2.3 3.6 5.6 4.9 3.3 10,646 138 165 45.8
Q3 2010 2.7 4.6 2.0 3.2 9.5 1.2 0.2 1.6 2.9 5.1 4.4 3.3 11,814 135 165 32.9
Q4 2010 2.5 4.7 2.8 5.0 9.5 3.3 0.1 1.5 3.0 5.0 4.4 3.3 13,131 134 167 23.5
Q1 2011 -1.5 0.2 5.0 8.2 9.0 4.3 0.1 2.1 3.5 5.4 4.8 3.3 13,909 133 172 29.4
Q2 2011 2.9 6.0 -0.6 3.5 9.1 4.6 0.0 1.8 3.3 5.1 4.7 3.3 13,843 132 173 22.7
Q3 2011 0.8 3.3 2.1 4.3 9.0 2.6 0.0 1.1 2.5 4.9 4.3 3.3 11,677 133 172 48.0
Q4 2011 4.6 5.2 0.2 1.6 8.6 1.8 0.0 1.0 2.1 5.0 4.0 3.3 13,019 133 178 45.5
Q1 2012 2.7 4.9 6.7 9.2 8.3 2.3 0.1 0.9 2.1 4.7 3.9 3.3 14,627 134 180 23.0
Q2 2012 1.9 3.8 3.1 4.4 8.2 0.8 0.1 0.8 1.8 4.5 3.8 3.3 14,100 138 181 26.7
Q3 2012 0.5 2.7 -0.2 1.1 8.0 1.8 0.1 0.7 1.6 4.2 3.6 3.3 14,895 140 187 20.5
Q4 2012 0.1 1.7 10.9 13.3 7.8 2.7 0.1 0.7 1.7 3.9 3.4 3.3 14,835 143 187 22.7
Q1 2013 2.8 4.4 -15.7 -14.5 7.7 1.6 0.1 0.8 1.9 4.0 3.5 3.3 16,396 147 190 19.0
Q2 2013 0.8 1.6 2.4 2.5 7.5 -0.5 0.1 0.9 2.0 4.1 3.7 3.3 16,771 151 199 20.5
Q3 2013 3.1 5.1 2.4 3.9 7.2 2.2 0.0 1.5 2.7 4.9 4.4 3.3 17,718 155 208 17.0
Q4 2013 4.0 6.1 0.9 2.6 6.9 1.6 0.1 1.4 2.8 4.8 4.3 3.3 19,413 158 212 20.3
Q1 2014 -0.9 0.7 4.3 6.5 6.7 2.6 0.0 1.6 2.8 4.6 4.4 3.3 19,711 160 211 21.4
Q2 2014 4.6 7.0 5.3 7.1 6.2 1.9 0.0 1.7 2.7 4.3 4.2 3.3 20,569 161 220 17.0
Q3 2014 5.2 7.1 4.2 5.5 6.1 1.0 0.0 1.7 2.5 4.2 4.1 3.3 20,459 163 223 17.0
Q4 2014 2.0 2.6 5.9 5.7 5.7 -0.7 0.0 1.6 2.3 4.2 4.0 3.3 21,425 166 234 26.3
Q1 2015 3.2 3.2 4.3 2.6 5.6 -2.5 0.0 1.5 2.0 4.0 3.7 3.3 21,708 168 249 22.4
Q2 2015 2.7 5.0 3.8 5.6 5.4 2.4 0.0 1.5 2.2 4.2 3.8 3.3 21,631 170 251 18.9
Q3 2015 1.6 3.0 1.8 3.2 5.1 1.5 0.0 1.6 2.3 4.5 4.0 3.3 19,959 172 257 40.7
Q4 2015 0.5 1.3 2.9 3.1 5.0 0.4 0.1 1.6 2.2 4.6 3.9 3.3 21,101 175 254 24.4
Q1 2016 0.6 0.8 0.2 0.9 4.9 0.1 0.3 1.4 2.0 4.6 3.7 3.5 21,179 177 245 28.1
Q2 2016 2.2 4.7 1.9 4.0 4.9 2.3 0.3 1.3 1.8 4.1 3.6 3.5 21,621 179 248 25.8
Q3 2016 2.8 4.2 0.7 2.5 4.9 1.8 0.3 1.2 1.6 3.7 3.4 3.5 22,469 182 266 18.1
Q4 2016 1.8 3.8 -1.8 0.1 4.7 3.0 0.4 1.7 2.2 4.1 3.8 3.5 23,277 184 269 22.5
Q1 2017 1.2 3.3 2.9 5.2 4.7 3.1 0.6 2.0 2.5 4.2 4.2 3.8 24,508 187 262 13.1
Q2 2017 3.1 4.1 2.7 3.0 4.3 -0.3 0.9 1.8 2.3 4.0 4.0 4.0 25,125 190 272 16.0
Q3 2017 3.2 5.3 0.5 2.1 4.3 2.0 1.0 1.8 2.3 3.9 3.9 4.3 26,149 193 275 16.0
Q4 2017 2.7 5.0 1.9 5.6 4.1 3.7 1.2 2.1 2.4 4.0 3.9 4.3 27,673 194 279 13.1
Note: Refer to Notes Regarding Scenario Variables for more information on the definitions and sources of historical observations of the variables in the table.
54 Supervisory Stress Test Methodology and Results

Table A.2. Historical data: International variables, Q1:2000–Q4:2017
Percent, unless otherwise indicated.
Date Euro areareal GDPgrowth
Euro areainflation
Euro areabilateraldollar
exchangerate
(USD/euro)
DevelopingAsia
real GDPgrowth
DevelopingAsia
inflation
DevelopingAsia
bilateraldollar
exchangerate
(F/USD,index)
Japanreal GDPgrowth
Japaninflation
Japanbilateraldollar
exchangerate
(yen/USD)
U.K.real GDPgrowth
U.K.inflation
U.K.bilateraldollar
exchangerate
(USD/pound)
Q1 2000 4.6 2.6 0.957 7.0 1.5 100.0 8.0 -0.5 102.7 3.8 0.3 1.592
Q2 2000 3.6 0.9 0.955 7.1 -0.3 100.7 0.9 -1.1 106.1 2.9 0.5 1.513
Q3 2000 2.2 3.4 0.884 8.1 2.2 101.5 0.3 -0.3 107.9 1.2 1.0 1.479
Q4 2000 3.1 2.8 0.939 3.0 2.4 105.1 3.8 -1.1 114.4 0.8 1.9 1.496
Q1 2001 3.4 1.2 0.879 4.9 1.7 106.0 2.3 0.7 125.5 4.1 -0.1 1.419
Q2 2001 0.6 4.0 0.847 5.5 2.1 106.1 -1.9 -2.3 124.7 3.4 3.2 1.408
Q3 2001 0.3 1.4 0.910 4.7 1.3 106.4 -4.4 -0.5 119.2 2.6 1.0 1.469
Q4 2001 0.9 1.7 0.890 8.5 0.0 106.9 -1.0 -1.9 131.0 1.3 -0.1 1.454
Q1 2002 0.5 3.1 0.872 7.7 0.5 107.3 0.4 -1.1 132.7 1.9 2.0 1.425
Q2 2002 1.9 2.0 0.986 8.1 1.1 104.8 3.2 0.1 119.9 2.9 0.9 1.525
Q3 2002 1.6 1.6 0.988 7.2 1.5 105.5 1.6 -0.4 121.7 3.3 1.3 1.570
Q4 2002 0.6 2.3 1.049 6.5 0.7 104.5 1.1 -0.8 118.8 3.8 1.9 1.610
Q1 2003 -1.0 3.3 1.090 6.7 3.6 105.5 -0.5 0.0 118.1 2.5 1.7 1.579
Q2 2003 0.2 0.5 1.150 2.1 1.1 104.0 3.3 0.3 119.9 3.7 0.2 1.653
Q3 2003 2.1 2.1 1.165 14.3 0.1 102.6 1.6 -0.5 111.4 4.0 1.7 1.662
Q4 2003 3.1 2.3 1.260 13.0 5.5 103.4 4.5 -1.0 107.1 3.1 1.7 1.784
Q1 2004 2.3 2.2 1.229 5.6 4.0 101.4 3.1 0.8 104.2 2.1 1.4 1.840
Q2 2004 2.1 2.6 1.218 6.9 4.1 102.8 -0.1 -0.4 109.4 1.7 0.8 1.813
Q3 2004 1.2 2.0 1.242 8.2 4.1 102.7 2.1 -0.1 110.2 0.9 1.1 1.809
Q4 2004 1.5 2.4 1.354 6.4 0.8 98.9 -1.1 1.9 102.7 1.5 2.4 1.916
Q1 2005 0.7 1.4 1.297 10.6 2.9 98.6 1.9 -1.2 107.2 3.4 2.6 1.889
Q2 2005 2.7 2.2 1.210 8.6 1.5 98.9 3.2 -1.0 110.9 4.4 1.8 1.793
Q3 2005 3.0 3.1 1.206 9.3 2.4 98.6 3.9 -1.0 113.3 4.3 2.8 1.770
Q4 2005 2.4 2.4 1.184 11.7 1.6 98.1 0.8 0.1 117.9 6.0 1.4 1.719
Q1 2006 3.7 1.7 1.214 11.0 2.4 96.8 0.3 1.2 117.5 1.1 1.9 1.739
Q2 2006 4.3 2.5 1.278 7.0 3.2 96.7 1.4 0.4 114.5 0.8 3.0 1.849
Q3 2006 2.6 2.1 1.269 10.3 2.2 96.4 -0.7 0.4 118.0 0.3 3.3 1.872
Q4 2006 4.5 0.9 1.320 11.2 3.6 94.6 4.9 -0.5 119.0 1.5 2.6 1.959
Q1 2007 3.0 2.3 1.337 13.9 3.6 94.0 3.0 -0.7 117.6 3.7 2.5 1.969
Q2 2007 2.6 2.3 1.352 10.5 4.9 91.9 0.5 0.4 123.4 2.9 1.8 2.006
Q3 2007 2.0 2.1 1.422 8.7 7.6 90.6 -1.8 0.3 115.0 2.7 0.3 2.039
Q4 2007 2.1 4.8 1.460 12.8 5.9 89.4 2.0 2.2 111.7 3.3 4.0 1.984
Q1 2008 2.2 4.3 1.581 7.2 8.1 88.0 1.2 1.2 99.9 1.1 3.4 1.986
Q2 2008 -1.5 3.2 1.575 6.0 6.3 88.7 -2.0 1.8 106.2 -2.7 5.8 1.991
Q3 2008 -2.3 3.2 1.408 3.1 2.9 91.5 -5.0 3.4 105.9 -6.3 5.9 1.780
Q4 2008 -6.7 -1.4 1.392 0.3 -1.1 92.2 -8.8 -2.1 90.8 -8.4 0.4 1.462
Q1 2009 -11.2 -1.1 1.326 4.4 -1.4 94.2 -18.2 -3.6 99.2 -6.2 -0.2 1.430
Q2 2009 -1.1 0.0 1.402 15.1 2.3 92.2 8.7 -1.6 96.4 -0.9 2.3 1.645
Q3 2009 1.2 1.1 1.463 12.7 4.1 91.3 0.1 -1.4 89.5 0.6 3.6 1.600
Q4 2009 2.2 1.6 1.433 9.2 5.0 90.6 5.9 -1.5 93.1 1.1 2.8 1.617
Q1 2010 1.7 1.8 1.353 9.8 4.4 89.8 3.5 1.0 93.4 2.2 4.2 1.519
Q2 2010 3.8 2.0 1.229 9.7 3.4 91.0 5.1 -1.4 88.5 3.6 3.3 1.495
Q3 2010 1.8 1.6 1.360 8.8 4.2 88.4 7.5 -1.9 83.5 1.9 2.2 1.573
Q4 2010 2.4 2.6 1.327 9.2 7.5 87.4 -2.9 1.3 81.7 0.3 3.9 1.539
Q1 2011 3.4 3.7 1.418 9.8 6.2 86.4 -6.1 -0.1 82.8 2.4 7.0 1.605
Q2 2011 0.0 3.2 1.452 6.5 5.4 85.3 -1.9 -0.7 80.6 0.6 4.6 1.607
Q3 2011 0.0 1.3 1.345 5.4 5.3 87.3 10.1 0.3 77.0 1.5 3.5 1.562
Q4 2011 -1.4 3.5 1.297 6.7 3.0 87.3 -0.6 -0.6 77.0 0.8 3.4 1.554
Q1 2012 -0.6 2.8 1.333 7.4 3.2 86.2 4.6 2.2 82.4 2.6 2.3 1.599
Q2 2012 -1.4 2.3 1.267 5.9 3.9 88.0 -2.4 -1.4 79.8 -0.4 1.9 1.569
(continued)
June 2018 55

Table A.2.—continued
Date Euro areareal GDPgrowth
Euro areainflation
Euro areabilateraldollar
exchangerate
(USD/euro)
DevelopingAsia
real GDPgrowth
DevelopingAsia
inflation
DevelopingAsia
bilateraldollar
exchangerate
(F/USD,index)
Japanreal GDPgrowth
Japaninflation
Japanbilateraldollar
exchangerate
(yen/USD)
U.K.real GDPgrowth
U.K.inflation
U.K.bilateraldollar
exchangerate
(USD/pound)
Q3 2012 -0.6 1.6 1.286 6.6 2.2 86.1 -1.5 -1.9 77.9 4.7 2.1 1.613
Q4 2012 -1.7 2.4 1.319 7.2 3.5 86.0 0.9 0.1 86.6 -0.6 4.2 1.626
Q1 2013 -1.3 1.2 1.282 6.5 4.3 86.2 4.5 0.7 94.2 2.6 3.0 1.519
Q2 2013 1.9 0.4 1.301 6.4 3.0 87.1 3.8 -0.1 99.2 2.2 1.5 1.521
Q3 2013 1.4 1.3 1.354 7.7 3.7 86.5 3.1 2.7 98.3 3.4 2.1 1.618
Q4 2013 1.0 0.3 1.378 6.7 4.0 85.8 0.0 2.6 105.3 2.1 1.7 1.657
Q1 2014 1.7 0.8 1.378 6.0 1.4 86.8 3.3 1.1 103.0 3.5 1.8 1.668
Q2 2014 0.5 0.0 1.369 7.4 2.6 86.6 -6.6 8.2 101.3 3.5 1.4 1.711
Q3 2014 1.7 0.3 1.263 6.7 2.3 86.9 -0.2 1.6 109.7 3.1 0.8 1.622
Q4 2014 2.0 -0.4 1.210 5.7 1.2 88.1 2.8 -0.5 119.9 3.1 -0.4 1.558
Q1 2015 3.0 -0.9 1.074 6.1 0.8 87.9 5.1 0.4 120.0 1.4 -1.3 1.485
Q2 2015 1.3 1.9 1.115 6.9 2.8 88.3 0.5 0.5 122.1 2.3 0.8 1.573
Q3 2015 1.7 -0.2 1.116 6.5 2.7 90.9 0.3 0.1 119.8 1.7 0.8 1.512
Q4 2015 1.9 -0.1 1.086 5.4 1.5 92.2 -0.9 -0.4 120.3 2.9 0.0 1.475
Q1 2016 2.0 -1.3 1.139 6.6 2.8 91.7 2.2 0.0 112.4 0.8 -0.1 1.438
Q2 2016 1.4 1.2 1.103 6.6 2.8 94.0 1.6 -1.1 102.8 1.9 0.7 1.324
Q3 2016 1.6 1.2 1.124 6.1 1.2 93.6 0.9 -0.5 101.2 2.2 2.2 1.302
Q4 2016 2.7 1.8 1.055 5.7 2.3 97.5 1.4 3.0 116.8 3.0 2.0 1.234
Q1 2017 2.5 2.8 1.070 6.7 0.6 95.2 1.5 -0.1 111.4 1.2 3.7 1.254
Q2 2017 2.9 0.2 1.141 6.0 2.0 94.5 2.9 -0.8 112.4 1.2 3.0 1.300
Q3 2017 2.9 1.0 1.181 6.6 2.4 93.5 2.5 0.4 112.6 1.6 2.4 1.340
Q4 2017 2.3 1.7 1.202 5.9 2.6 91.0 1.8 0.9 112.7 1.4 2.9 1.353
Note: Refer to Notes Regarding Scenario Variables for more information on the definitions and sources of historical observations of the variables in the table.
56 Supervisory Stress Test Methodology and Results

Table A.3. Supervisory baseline scenario: Domestic variables, Q1:2018–Q1:2021
Percent, unless otherwise indicated.
DateReal GDPgrowth
NominalGDP
growth
Realdispo-sable
incomegrowth
Nominaldispo-sable
incomegrowth
Unem-ployment
rate
CPIinflation
rate
3-monthTreasury
rate
5-yearTreasury
yield
10-yearTreasury
yield
BBBcorporate
yield
Mortgagerate
Primerate
Level
DowJonesTotalStock
MarketIndex
HousePriceIndex
Com-mercial
RealEstatePriceIndex
MarketVolatility
Index
Q1 2018 2.5 4.6 4.0 6.1 4.0 2.1 1.4 2.2 2.6 4.1 4.1 4.6 28,019 196 282 15.3
Q2 2018 2.8 4.8 2.9 4.8 4.0 1.9 1.7 2.4 2.7 4.3 4.3 4.8 28,382 197 286 17.5
Q3 2018 2.6 4.7 2.9 4.9 3.9 2.1 1.9 2.5 2.8 4.4 4.4 5.0 28,747 198 289 18.7
Q4 2018 2.5 4.6 2.8 4.8 3.8 2.1 2.1 2.7 2.9 4.5 4.5 5.2 29,110 199 293 20.0
Q1 2019 2.3 4.5 2.9 5.0 3.8 2.2 2.2 2.8 3.1 4.6 4.7 5.3 29,472 201 297 20.9
Q2 2019 2.3 4.4 2.5 4.5 3.8 2.2 2.4 2.8 3.1 4.7 4.8 5.5 29,830 202 300 21.5
Q3 2019 2.1 4.3 2.4 4.4 3.8 2.2 2.5 2.9 3.2 4.8 4.9 5.6 30,187 203 304 22.1
Q4 2019 2.0 4.2 2.3 4.4 3.7 2.4 2.6 2.9 3.3 4.9 4.9 5.7 30,538 204 308 22.1
Q1 2020 2.1 4.2 2.2 4.3 3.8 2.3 2.7 3.0 3.5 5.1 5.1 5.7 30,892 206 310 23.5
Q2 2020 2.1 4.2 2.3 4.4 3.9 2.3 2.7 3.0 3.5 5.1 5.2 5.7 31,255 207 313 23.6
Q3 2020 2.1 4.2 2.3 4.4 4.0 2.3 2.7 3.1 3.5 5.2 5.2 5.7 31,623 209 315 23.8
Q4 2020 2.1 4.2 2.3 4.4 4.0 2.3 2.7 3.1 3.6 5.2 5.2 5.8 31,995 211 317 23.8
Q1 2021 2.1 4.2 2.3 4.4 4.1 2.3 2.7 3.1 3.6 5.2 5.3 5.8 32,371 212 320 23.9
Note: Refer to Notes Regarding Scenario Variables for more information on the definitions and sources of historical observations of the variables in the table.
Table A.4. Supervisory baseline scenario: International variables, Q1:2018–Q1:2021
Percent, unless otherwise indicated.
Date Euro areareal GDPgrowth
Euro areainflation
Euro areabilateraldollar
exchangerate
(USD/euro)
DevelopingAsia
real GDPgrowth
DevelopingAsia
inflation
DevelopingAsia
bilateraldollar
exchangerate
(F/USD,index)
Japanreal GDPgrowth
Japaninflation
Japanbilateraldollar
exchangerate
(yen/USD)
U.K.real GDPgrowth
U.K.inflation
U.K.bilateraldollar
exchangerate
(USD/pound)
Q1 2018 2.1 1.5 1.201 6.0 2.5 91.5 1.5 0.9 112.7 1.4 2.6 1.350
Q2 2018 2.1 1.5 1.199 6.0 2.5 92.0 1.4 1.0 112.8 1.4 2.5 1.347
Q3 2018 2.0 1.6 1.198 6.0 2.5 92.5 1.2 1.0 112.8 1.4 2.4 1.344
Q4 2018 2.0 1.6 1.197 5.9 2.6 93.0 1.1 1.1 112.8 1.4 2.3 1.341
Q1 2019 1.9 1.6 1.202 5.8 2.7 93.2 1.1 1.2 112.6 1.4 2.2 1.344
Q2 2019 1.9 1.6 1.208 5.8 2.8 93.5 1.0 1.2 112.3 1.4 2.1 1.347
Q3 2019 1.8 1.7 1.213 5.7 2.9 93.7 1.0 1.3 112.0 1.4 2.1 1.351
Q4 2019 1.8 1.7 1.219 5.8 2.8 94.0 0.9 1.4 111.8 1.4 2.0 1.354
Q1 2020 1.8 1.8 1.219 5.8 2.8 94.0 0.8 1.4 111.8 1.5 2.0 1.354
Q2 2020 1.7 1.8 1.219 5.9 2.7 94.0 0.8 1.5 111.8 1.5 1.9 1.354
Q3 2020 1.7 1.9 1.219 5.9 2.7 94.0 0.8 1.5 111.8 1.5 1.9 1.354
Q4 2020 1.7 1.9 1.219 5.8 2.7 94.0 0.8 1.6 111.8 1.5 1.9 1.354
Q1 2021 1.6 1.9 1.219 5.7 2.8 94.0 0.8 1.6 111.8 1.6 1.9 1.354
Note: Refer to Notes Regarding Scenario Variables for more information on the definitions and sources of historical observations of the variables in the table.
June 2018 57
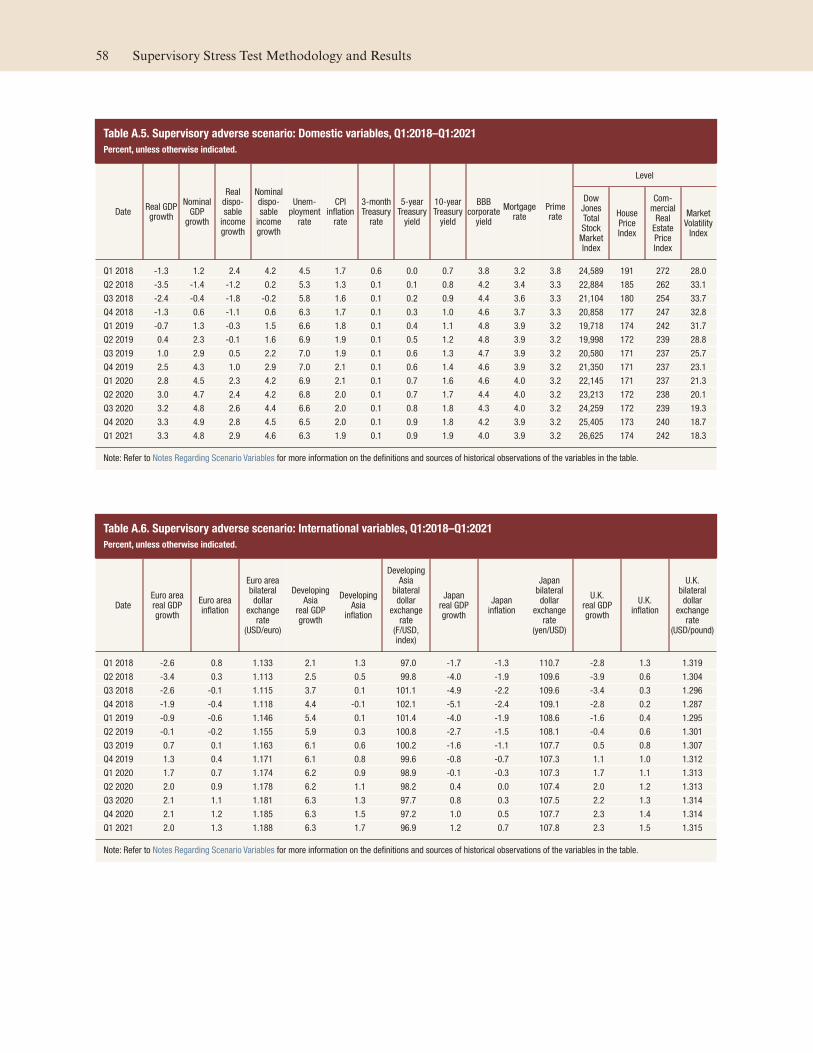
Table A.5. Supervisory adverse scenario: Domestic variables, Q1:2018–Q1:2021
Percent, unless otherwise indicated.
DateReal GDPgrowth
NominalGDP
growth
Realdispo-sable
incomegrowth
Nominaldispo-sable
incomegrowth
Unem-ployment
rate
CPIinflation
rate
3-monthTreasury
rate
5-yearTreasury
yield
10-yearTreasury
yield
BBBcorporate
yield
Mortgagerate
Primerate
Level
DowJonesTotalStock
MarketIndex
HousePriceIndex
Com-mercial
RealEstatePriceIndex
MarketVolatility
Index
Q1 2018 -1.3 1.2 2.4 4.2 4.5 1.7 0.6 0.0 0.7 3.8 3.2 3.8 24,589 191 272 28.0
Q2 2018 -3.5 -1.4 -1.2 0.2 5.3 1.3 0.1 0.1 0.8 4.2 3.4 3.3 22,884 185 262 33.1
Q3 2018 -2.4 -0.4 -1.8 -0.2 5.8 1.6 0.1 0.2 0.9 4.4 3.6 3.3 21,104 180 254 33.7
Q4 2018 -1.3 0.6 -1.1 0.6 6.3 1.7 0.1 0.3 1.0 4.6 3.7 3.3 20,858 177 247 32.8
Q1 2019 -0.7 1.3 -0.3 1.5 6.6 1.8 0.1 0.4 1.1 4.8 3.9 3.2 19,718 174 242 31.7
Q2 2019 0.4 2.3 -0.1 1.6 6.9 1.9 0.1 0.5 1.2 4.8 3.9 3.2 19,998 172 239 28.8
Q3 2019 1.0 2.9 0.5 2.2 7.0 1.9 0.1 0.6 1.3 4.7 3.9 3.2 20,580 171 237 25.7
Q4 2019 2.5 4.3 1.0 2.9 7.0 2.1 0.1 0.6 1.4 4.6 3.9 3.2 21,350 171 237 23.1
Q1 2020 2.8 4.5 2.3 4.2 6.9 2.1 0.1 0.7 1.6 4.6 4.0 3.2 22,145 171 237 21.3
Q2 2020 3.0 4.7 2.4 4.2 6.8 2.0 0.1 0.7 1.7 4.4 4.0 3.2 23,213 172 238 20.1
Q3 2020 3.2 4.8 2.6 4.4 6.6 2.0 0.1 0.8 1.8 4.3 4.0 3.2 24,259 172 239 19.3
Q4 2020 3.3 4.9 2.8 4.5 6.5 2.0 0.1 0.9 1.8 4.2 3.9 3.2 25,405 173 240 18.7
Q1 2021 3.3 4.8 2.9 4.6 6.3 1.9 0.1 0.9 1.9 4.0 3.9 3.2 26,625 174 242 18.3
Note: Refer to Notes Regarding Scenario Variables for more information on the definitions and sources of historical observations of the variables in the table.
Table A.6. Supervisory adverse scenario: International variables, Q1:2018–Q1:2021
Percent, unless otherwise indicated.
Date Euro areareal GDPgrowth
Euro areainflation
Euro areabilateraldollar
exchangerate
(USD/euro)
DevelopingAsia
real GDPgrowth
DevelopingAsia
inflation
DevelopingAsia
bilateraldollar
exchangerate
(F/USD,index)
Japanreal GDPgrowth
Japaninflation
Japanbilateraldollar
exchangerate
(yen/USD)
U.K.real GDPgrowth
U.K.inflation
U.K.bilateraldollar
exchangerate
(USD/pound)
Q1 2018 -2.6 0.8 1.133 2.1 1.3 97.0 -1.7 -1.3 110.7 -2.8 1.3 1.319
Q2 2018 -3.4 0.3 1.113 2.5 0.5 99.8 -4.0 -1.9 109.6 -3.9 0.6 1.304
Q3 2018 -2.6 -0.1 1.115 3.7 0.1 101.1 -4.9 -2.2 109.6 -3.4 0.3 1.296
Q4 2018 -1.9 -0.4 1.118 4.4 -0.1 102.1 -5.1 -2.4 109.1 -2.8 0.2 1.287
Q1 2019 -0.9 -0.6 1.146 5.4 0.1 101.4 -4.0 -1.9 108.6 -1.6 0.4 1.295
Q2 2019 -0.1 -0.2 1.155 5.9 0.3 100.8 -2.7 -1.5 108.1 -0.4 0.6 1.301
Q3 2019 0.7 0.1 1.163 6.1 0.6 100.2 -1.6 -1.1 107.7 0.5 0.8 1.307
Q4 2019 1.3 0.4 1.171 6.1 0.8 99.6 -0.8 -0.7 107.3 1.1 1.0 1.312
Q1 2020 1.7 0.7 1.174 6.2 0.9 98.9 -0.1 -0.3 107.3 1.7 1.1 1.313
Q2 2020 2.0 0.9 1.178 6.2 1.1 98.2 0.4 0.0 107.4 2.0 1.2 1.313
Q3 2020 2.1 1.1 1.181 6.3 1.3 97.7 0.8 0.3 107.5 2.2 1.3 1.314
Q4 2020 2.1 1.2 1.185 6.3 1.5 97.2 1.0 0.5 107.7 2.3 1.4 1.314
Q1 2021 2.0 1.3 1.188 6.3 1.7 96.9 1.2 0.7 107.8 2.3 1.5 1.315
Note: Refer to Notes Regarding Scenario Variables for more information on the definitions and sources of historical observations of the variables in the table.
58 Supervisory Stress Test Methodology and Results
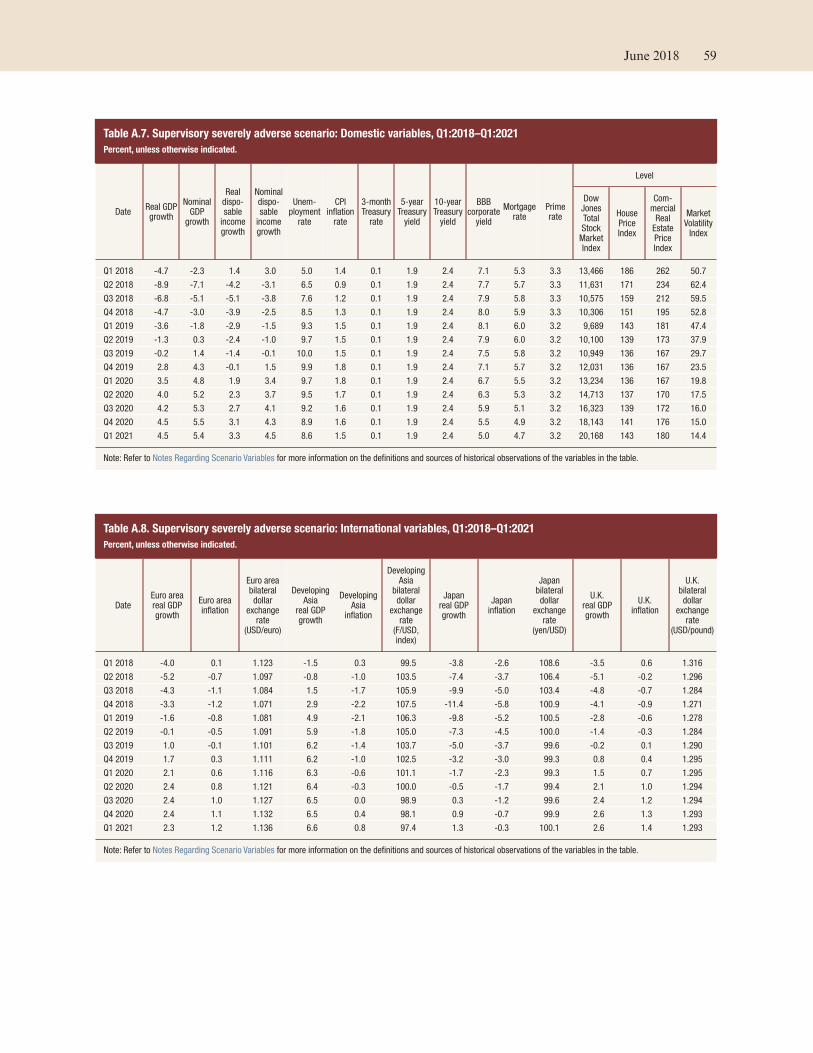
Table A.7. Supervisory severely adverse scenario: Domestic variables, Q1:2018–Q1:2021
Percent, unless otherwise indicated.
DateReal GDPgrowth
NominalGDP
growth
Realdispo-sable
incomegrowth
Nominaldispo-sable
incomegrowth
Unem-ployment
rate
CPIinflation
rate
3-monthTreasury
rate
5-yearTreasury
yield
10-yearTreasury
yield
BBBcorporate
yield
Mortgagerate
Primerate
Level
DowJonesTotalStock
MarketIndex
HousePriceIndex
Com-mercial
RealEstatePriceIndex
MarketVolatility
Index
Q1 2018 -4.7 -2.3 1.4 3.0 5.0 1.4 0.1 1.9 2.4 7.1 5.3 3.3 13,466 186 262 50.7
Q2 2018 -8.9 -7.1 -4.2 -3.1 6.5 0.9 0.1 1.9 2.4 7.7 5.7 3.3 11,631 171 234 62.4
Q3 2018 -6.8 -5.1 -5.1 -3.8 7.6 1.2 0.1 1.9 2.4 7.9 5.8 3.3 10,575 159 212 59.5
Q4 2018 -4.7 -3.0 -3.9 -2.5 8.5 1.3 0.1 1.9 2.4 8.0 5.9 3.3 10,306 151 195 52.8
Q1 2019 -3.6 -1.8 -2.9 -1.5 9.3 1.5 0.1 1.9 2.4 8.1 6.0 3.2 9,689 143 181 47.4
Q2 2019 -1.3 0.3 -2.4 -1.0 9.7 1.5 0.1 1.9 2.4 7.9 6.0 3.2 10,100 139 173 37.9
Q3 2019 -0.2 1.4 -1.4 -0.1 10.0 1.5 0.1 1.9 2.4 7.5 5.8 3.2 10,949 136 167 29.7
Q4 2019 2.8 4.3 -0.1 1.5 9.9 1.8 0.1 1.9 2.4 7.1 5.7 3.2 12,031 136 167 23.5
Q1 2020 3.5 4.8 1.9 3.4 9.7 1.8 0.1 1.9 2.4 6.7 5.5 3.2 13,234 136 167 19.8
Q2 2020 4.0 5.2 2.3 3.7 9.5 1.7 0.1 1.9 2.4 6.3 5.3 3.2 14,713 137 170 17.5
Q3 2020 4.2 5.3 2.7 4.1 9.2 1.6 0.1 1.9 2.4 5.9 5.1 3.2 16,323 139 172 16.0
Q4 2020 4.5 5.5 3.1 4.3 8.9 1.6 0.1 1.9 2.4 5.5 4.9 3.2 18,143 141 176 15.0
Q1 2021 4.5 5.4 3.3 4.5 8.6 1.5 0.1 1.9 2.4 5.0 4.7 3.2 20,168 143 180 14.4
Note: Refer to Notes Regarding Scenario Variables for more information on the definitions and sources of historical observations of the variables in the table.
Table A.8. Supervisory severely adverse scenario: International variables, Q1:2018–Q1:2021
Percent, unless otherwise indicated.
Date Euro areareal GDPgrowth
Euro areainflation
Euro areabilateraldollar
exchangerate
(USD/euro)
DevelopingAsia
real GDPgrowth
DevelopingAsia
inflation
DevelopingAsia
bilateraldollar
exchangerate
(F/USD,index)
Japanreal GDPgrowth
Japaninflation
Japanbilateraldollar
exchangerate
(yen/USD)
U.K.real GDPgrowth
U.K.inflation
U.K.bilateraldollar
exchangerate
(USD/pound)
Q1 2018 -4.0 0.1 1.123 -1.5 0.3 99.5 -3.8 -2.6 108.6 -3.5 0.6 1.316
Q2 2018 -5.2 -0.7 1.097 -0.8 -1.0 103.5 -7.4 -3.7 106.4 -5.1 -0.2 1.296
Q3 2018 -4.3 -1.1 1.084 1.5 -1.7 105.9 -9.9 -5.0 103.4 -4.8 -0.7 1.284
Q4 2018 -3.3 -1.2 1.071 2.9 -2.2 107.5 -11.4 -5.8 100.9 -4.1 -0.9 1.271
Q1 2019 -1.6 -0.8 1.081 4.9 -2.1 106.3 -9.8 -5.2 100.5 -2.8 -0.6 1.278
Q2 2019 -0.1 -0.5 1.091 5.9 -1.8 105.0 -7.3 -4.5 100.0 -1.4 -0.3 1.284
Q3 2019 1.0 -0.1 1.101 6.2 -1.4 103.7 -5.0 -3.7 99.6 -0.2 0.1 1.290
Q4 2019 1.7 0.3 1.111 6.2 -1.0 102.5 -3.2 -3.0 99.3 0.8 0.4 1.295
Q1 2020 2.1 0.6 1.116 6.3 -0.6 101.1 -1.7 -2.3 99.3 1.5 0.7 1.295
Q2 2020 2.4 0.8 1.121 6.4 -0.3 100.0 -0.5 -1.7 99.4 2.1 1.0 1.294
Q3 2020 2.4 1.0 1.127 6.5 0.0 98.9 0.3 -1.2 99.6 2.4 1.2 1.294
Q4 2020 2.4 1.1 1.132 6.5 0.4 98.1 0.9 -0.7 99.9 2.6 1.3 1.293
Q1 2021 2.3 1.2 1.136 6.6 0.8 97.4 1.3 -0.3 100.1 2.6 1.4 1.293
Note: Refer to Notes Regarding Scenario Variables for more information on the definitions and sources of historical observations of the variables in the table.
June 2018 59
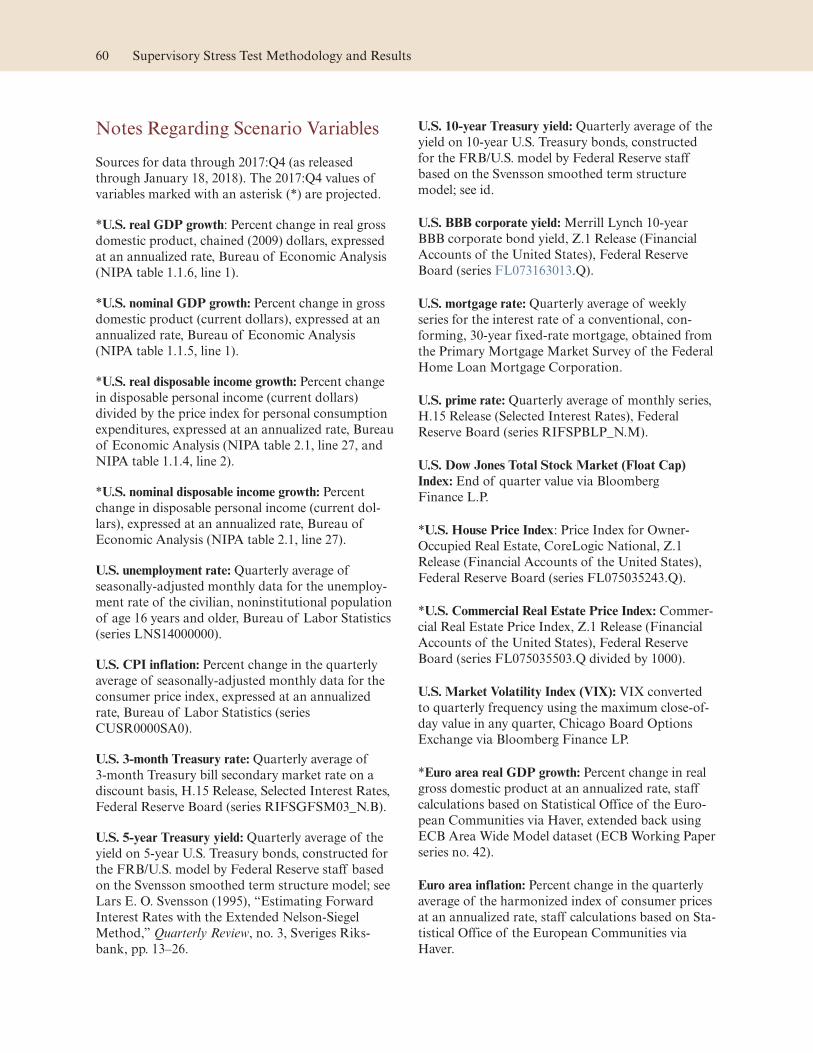
Notes Regarding Scenario Variables
Sources for data through 2017:Q4 (as released
through January 18, 2018). The 2017:Q4 values of
variables marked with an asterisk (*) are projected.
*U.S. real GDP growth: Percent change in real gross
domestic product, chained (2009) dollars, expressed
at an annualized rate, Bureau of Economic Analysis
(NIPA table 1.1.6, line 1).
*U.S. nominal GDP growth: Percent change in gross
domestic product (current dollars), expressed at an
annualized rate, Bureau of Economic Analysis
(NIPA table 1.1.5, line 1).
*U.S. real disposable income growth: Percent change
in disposable personal income (current dollars)
divided by the price index for personal consumption
expenditures, expressed at an annualized rate, Bureau
of Economic Analysis (NIPA table 2.1, line 27, and
NIPA table 1.1.4, line 2).
*U.S. nominal disposable income growth: Percent
change in disposable personal income (current dol-
lars), expressed at an annualized rate, Bureau of
Economic Analysis (NIPA table 2.1, line 27).
U.S. unemployment rate: Quarterly average of
seasonally-adjusted monthly data for the unemploy-
ment rate of the civilian, noninstitutional population
of age 16 years and older, Bureau of Labor Statistics
(series LNS14000000).
U.S. CPI inflation: Percent change in the quarterly
average of seasonally-adjusted monthly data for the
consumer price index, expressed at an annualized
rate, Bureau of Labor Statistics (series
CUSR0000SA0).
U.S. 3-month Treasury rate: Quarterly average of
3-month Treasury bill secondary market rate on a
discount basis, H.15 Release, Selected Interest Rates,
Federal Reserve Board (series RIFSGFSM03_N.B).
U.S. 5-year Treasury yield: Quarterly average of the
yield on 5-year U.S. Treasury bonds, constructed for
the FRB/U.S. model by Federal Reserve staff based
on the Svensson smoothed term structure model; see
Lars E. O. Svensson (1995), “Estimating Forward
Interest Rates with the Extended Nelson-Siegel
Method,” Quarterly Review, no. 3, Sveriges Riks-
bank, pp. 13–26.
U.S. 10-year Treasury yield: Quarterly average of the
yield on 10-year U.S. Treasury bonds, constructed
for the FRB/U.S. model by Federal Reserve staff
based on the Svensson smoothed term structure
model; see id.
U.S. BBB corporate yield: Merrill Lynch 10-year
BBB corporate bond yield, Z.1 Release (Financial
Accounts of the United States), Federal Reserve
Board (series FL073163013.Q).
U.S. mortgage rate: Quarterly average of weekly
series for the interest rate of a conventional, con-
forming, 30-year fixed-rate mortgage, obtained from
the Primary Mortgage Market Survey of the Federal
Home Loan Mortgage Corporation.
U.S. prime rate: Quarterly average of monthly series,
H.15 Release (Selected Interest Rates), Federal
Reserve Board (series RIFSPBLP_N.M).
U.S. Dow Jones Total Stock Market (Float Cap)
Index: End of quarter value via Bloomberg
Finance L.P.
*U.S. House Price Index: Price Index for Owner-
Occupied Real Estate, CoreLogic National, Z.1
Release (Financial Accounts of the United States),
Federal Reserve Board (series FL075035243.Q).
*U.S. Commercial Real Estate Price Index: Commer-
cial Real Estate Price Index, Z.1 Release (Financial
Accounts of the United States), Federal Reserve
Board (series FL075035503.Q divided by 1000).
U.S. Market Volatility Index (VIX): VIX converted
to quarterly frequency using the maximum close-of-
day value in any quarter, Chicago Board Options
Exchange via Bloomberg Finance LP.
*Euro area real GDP growth: Percent change in real
gross domestic product at an annualized rate, staff
calculations based on Statistical Office of the Euro-
pean Communities via Haver, extended back using
ECB Area Wide Model dataset (ECB Working Paper
series no. 42).
Euro area inflation: Percent change in the quarterly
average of the harmonized index of consumer prices
at an annualized rate, staff calculations based on Sta-
tistical Office of the European Communities via
Haver.
60 Supervisory Stress Test Methodology and Results

*Developing Asia real GDP growth: Percent change
in real gross domestic product at an annualized rate,
staff calculations based on data from Bank of Korea
via Haver; National Bureau of Statistics of China via
Haver; Indian Central Statistics Office via Haver;
Census and Statistics Department of Hong Kong via
Haver; and Taiwan Directorate-General of Budget,
Accounting and Statistics via Haver.
*Developing Asia inflation: Percent change in the
quarterly average of the consumer price index, or
local equivalent, at an annualized rate, staff calcula-
tions based on data from National Bureau of Statis-
tics of China via Haver; Indian Ministry of Statistics
and Programme Implementation via Haver; Labour
Bureau of India via Haver; National Statistical
Office of the Republic of Korea via Haver; Census
and Statistics Department of Hong Kong via Haver;
and Taiwan Directorate-General of Budget,
Accounting and Statistics via Haver.
*Japan real GDP growth: Percent change in gross
domestic product at an annualized rate from 1980 to
present and percent change in gross domestic expen-
diture at an annualized rate prior to 1980, Cabinet
Office of Japan via Haver.
*Japan inflation: Percent change in the quarterly
average of the consumer price index at an annualized
rate, based on data from the Ministry of Internal
Affairs and Communications via Haver.
*U.K. real GDP growth: Percent change in gross
domestic product at an annualized rate, U.K. Office
for National Statistics via Haver.
U.K. inflation: Percent change in the quarterly aver-
age of the consumer price index at an annualized
rate from 1988 to present and percent change in the
quarterly average of the retail prices index prior to
1988, staff calculations based on data from the U.K.
Office for National Statistics via Haver.
Exchange rates: End-of-quarter exchange rates, H.10
Release (Foreign Exchange Rates), Federal Reserve
Board.
June 2018 61


Appendix B: Models to Project Net Incomeand Stressed Capital
This appendix describes the models used to project
stressed capital ratios and pre-tax net income and its
components for the 35 firms subject to DFAST
2018.40 The models fall into five broad categories:
1. Models to project losses on loans held in the
accrual loan portfolio; loans in the accrual loan
portfolio are those measured under accrual
accounting, rather than fair-value accounting.
2. Models to project other types of losses, including
those from changes in fair value on loans held for
sale or measured under the fair-value option;
losses on securities, trading, and counterparty
exposures.
3. Models to project the components of PPNR (rev-
enues and non-credit-related expenses) and losses
related to operational-risk events that are part of
PPNR.
4. Models to project balance sheet items and risk-
weighted assets (RWAs).
5. The calculations to project capital ratios, given
projections of pre-tax net income, assumptions
for determining provisions into the allowance for
loan and lease losses (ALLL), and prescribed
capital actions.
For DFAST 2018, the Federal Reserve materially
enhanced its models for projecting PPNR and other-
than-temporary impairments for debt securities. The
Federal Reserve re-estimated and refined models for
projecting domestic credit card losses, auto loan
losses, first-lien residential mortgage losses, and
home equity losses. The Federal Reserve also made
material changes to its capital calculations to account
for changes in the tax law due to the Tax Cuts and
Jobs Act. See box 1 for more details on material
model changes for DFAST 2018.
Losses on the Accrual Loan Portfolio
More than a dozen individual models are used to
project losses on loans held in the accrual loan port-
folio. The individual loan types modeled can broadly
be divided into wholesale loans, such as commercial
and industrial (C&I) loans and commercial real
estate loans, and retail loans, including various types
of residential mortgages, credit cards, student loans,
auto loans, small business loans, and other consumer
loans.
The models project losses using detailed loan portfo-
lio data provided by the firms on the FR Y-14 infor-
mation collection.
Within larger loan categories, loan portfolios may be
subcategorized by loan type, each with their own
specific loss projection model. Generally, the loss
models for all loan portfolios belonging to a larger
category are similar. For example, losses on first-lien
mortgage loans, home equity loans, and home equity
lines of credit are each estimated by separate models,
but each model follows the same structural form.
Two general approaches are taken to model losses on
the accrual loan portfolio. In the first approach—an
approach broadly used for DFAST 2018—the mod-
els estimate expected losses under the macroeco-
nomic scenario; that is, they project the probability
of default (PD), loss given default (LGD), and expo-
40 In connection with DFAST 2018, and in addition to the modelsdeveloped and data collected by federal banking regulators, theFederal Reserve used proprietary models or data licensed fromthe following providers: Andrew Davidson & Co., Inc.; ICEData Services; Bloomberg L.P.; CB Richard Ellis, Inc.; CoreL-ogic Inc.; CoStar Group, Inc.; Equifax Information ServicesLLC; Fitch Ratings, Inc.; Haver Analytics; Kenneth French;IDC Financial Publishing, Inc.; Intex Solutions, Inc.; BlackKnight McDash Data from Black Knight IP Holding Com-pany, LLC; Markit Group; Moody’s Analytics, Inc.; Moody’sInvestors Service, Inc.; Mergent, Inc.; Morningstar, Inc.; MSCI,Inc.; Municipal Securities Rulemaking Board; SNL Financial;StataCorp LP; S&P Global Market Intelligence: S&P CapitalIQ Estimates; Standard & Poor’s Financial Services LLC; andWorld Bank Group. In addition, with respect to the global mar-ket shock component of the adverse and severely adverse sce-narios, the Federal Reserve used proprietary data licensed fromthe following providers: Bloomberg L.P.; IntercontinentalExchange; JPMorgan Chase & Co.; Markit Group; andMSCI, Inc.
63

sure at default (EAD) for each quarter of the plan-
ning horizon. Expected losses in quarter t are the
product of these three components:
Losst= PDt * LGDt * EADt
PD is generally modeled as part of a transition pro-
cess in which loans move from one payment status to
another (e.g., from current to delinquent) in response
to economic conditions. Default is a terminal transi-
tion, and PD represents the likelihood that a loan
will default during a given period. The number of
payment statuses and the transition paths modeled
differ by loan type.
LGD is typically defined as a percentage of EAD
and is modeled based on historical data. For some
loan types, LGD is modeled as a function of bor-
rower, collateral, or loan characteristics and the mac-
roeconomic variables from the supervisory scenarios.
For other loan types, LGD is assumed to be a
fixed percentage for all loans in a category. Finally,
the approach to modeling EAD varies by loan type
and depends on whether the outstanding loan
amount can change between the current period and
the period in which the loan defaults (e.g., for lines
of credit).
In the second approach, the models capture the his-
torical behavior of net charge-offs relative to changes
in macroeconomic and financial market variables
and loan portfolio characteristics.
The loss models primarily focus on losses arising
from loans in the accrual loan portfolio as of
December 31, 2017. The loss projections also incor-
porate losses on loans originated after the planning
horizon begins. These incremental loan balances are
calculated based on the Federal Reserve’s projections
of loan balances over the planning horizon. These
new balances are assumed to have the same risk
characteristics as those of the loan portfolio as of
December 31, 2017, with the exception of loan age in
the retail and CRE portfolios, where seasoning is
incorporated. Where applicable, new loans are
assumed to be current, and firms are assumed not to
originate types of loans that are no longer permitted
under various regulations. Loss projections also
incorporate losses on loans acquired through merg-
ers or purchase after the planning horizon begins.
Additional information provided by the firms about
the size and composition of acquired loan portfolios
is used to estimate losses on acquired portfolios.
Loss projections generated by the models are
adjusted to take account of purchase accounting
treatment, which recognizes discounts on impaired
loans acquired during mergers and any other write-
downs already taken on loans held in the accrual
loan portfolio. This latter adjustment ensures that
losses related to these loans are not double counted
in the projections. Loss projections do not take pri-
vate loss-sharing agreements into account, reflecting
the complexity and heterogeneity of such agreements
and their uncertainty under stress.
Wholesale Loans: Corporate Loans41
Losses stemming from default on corporate loans are
projected at the loan level using an expected loss
modeling framework. Corporate loans consist of a
number of different categories of loans, as defined
by the Consolidated Financial Statements for Hold-
ing Companies—FR Y-9C report (FR Y-9C). The
largest group of these loans includes C&I loans,
which are generally defined as loans to corporate or
commercial borrowers with more than $1 million in
committed balances that are “graded” using a firm’s
corporate loan rating process.42 Small business loans
with less than $1 million in committed balances are
included in other retail loans and are modeled
separately.
The PD for a C&I loan is projected over the plan-
ning horizon by first calculating the loan’s PD at the
beginning of the planning horizon and then project-
ing it forward using an equation that relates histori-
cal changes in PD to changes in the macroeconomic
environment. The PD as of December 31, 2017, is
calculated for every C&I loan in a firm’s portfolio
using detailed, loan-level information submitted by
the firm. For publicly traded borrowers, a borrower-
specific PD, based on the expected default frequency,
is used. For other borrowers, the PD is calculated
based on the borrower’s industry category and the
firm’s internal credit rating for the borrower, which is
converted to a standardized rating scale and then
41 This description is consistent with the more detailed descriptionof the DFAST 2017 corporate loan model provided in 82 Fed.Reg. 59547 (December 15, 2017) because the corporate loanmodel did not change between DFAST 2017 and DFAST 2018.The more detailed description is part of a rulemaking that hasyet to be finalized. For more on the status of that rulemakingsee box 3.
42 All definitions of loan categories and default in this appendixare definitions used for the purposes of the supervisory stresstest models and do not necessarily align with general industrydefinitions or classifications.
64 Supervisory Stress Test Methodology and Results

mapped to a PD. Loans that are 90 days past due, in
non-accrual status, or that have a Financial Account-
ing Standards Board Accounting Standards Codifi-
cation Subtopic 310-10 (ASC 310-10) reserve as of
December 31, 2017, are considered in default.
PDs are projected over the planning horizon using a
series of equations fitted to the historical relation-
ship between changes in the PD and macroeconomic
variables, including growth in real gross domestic
product (GDP), changes in the unemployment rate,
and changes in the spread on BBB-rated corporate
bonds. The equations are estimated separately by
borrower industries, credit quality categories, and
whether the borrower is foreign or domestic.
The LGD for a C&I loan at the beginning of the
planning horizon is determined by the line of busi-
ness, seniority of lien (if secured), country, and ASC
310-10 reserve, if applicable. The LGD is then pro-
jected forward by relating the change in the LGD to
changes in the PD. In the model, the PD is used as a
proxy for economic conditions, and, by construct,
increases in PD generally lead to higher LGDs.
The EAD for C&I lines of credit and other revolving
commitments equals the sum of the funded balance
and a portion of the unfunded commitment, which
reflects the amount that is likely to be drawn down
by the borrower in advance of a future default. This
drawdown amount is calibrated to the historical
drawdown experience for defaulted U.S. syndicated
revolving lines of credit that are in the Shared
National Credit (SNC) database.43 In the case of
closed-end C&I loans, the funded balance and the
corresponding EAD equals the outstanding balance.
The EAD for standby letters of credit and trade
finance credit are conservatively assumed to equal
the total commitment.
Other corporate loans that are similar in some
respects to C&I loans are modeled using the same
framework. These loans include owner-occupied
CRE loans, capital equipment leases, loans to
depositories, syndication pipeline loans, non-purpose
margin loans (net of loans to purchase and carry
securities), and other loans.44 Projected losses on
owner-occupied CRE loans are disclosed in total
CRE losses, while projected losses for the remaining
other corporate loans are disclosed in the other loans
category.
Wholesale Loans: CRE
CRE loans are loans collateralized by domestic and
international non-owner occupied multifamily or
nonfarm, nonresidential properties, and construction
and land development loans (C&LD), as defined by
the FR Y-9C report. Losses stemming from default
on CRE loans are projected at the loan level using an
expected-loss modeling framework.
The PD model for CRE loans is a hazard model of
the probability that a loan transitions from current
to default status, given the characteristics of the loan
as well as macroeconomic variables, including com-
mercial and residential property price indices and
unemployment rates, at both the geographic market
and national level. Once defaulted, the model
assumes the loan does not re-perform; the effect of
re-performance on the estimated loan loss is cap-
tured in the LGD model. A CRE loan is considered
in default if it is 90 days past due, in non-accrual sta-
tus, has an ASC 310-10 reserve, or had a very low
internal credit rating at the most recent time its
maturity was extended. The PD model also incorpo-
rates a nonlinear increase in PD as the loan maturity
nears. The effect of loan age on the PD is calculated
jointly for income-producing and C&LD loans.
However, controls are included for income-
producing and C&LD loans, and the effect of reach-
ing loan maturity on the PD is allowed to vary for
each type of loan. The model is estimated using the
historical FR Y-14Q information collection and his-
torical commercial mortgage-backed security
(CMBS) data pooled together. The model also
includes controls for the types of property (for
example, multifamily) to account for differences in
risk characteristics.
The LGD for CRE loans is calculated using
FR Y-14Q report data on ASC 310-10 reserves. The
model first estimates the probability that a defaulted
loan will have losses as a function of loan character-
istics and macroeconomic variables, including com-
mercial property prices, residential house prices, and
the unemployment rate. Then, using loans with
losses, the model estimates the loss on the CRE
43 SNCs have commitments of greater than $20 million and areheld by three or more regulated participating entities. For addi-tional information, see “Shared National Credit Program,”Board of Governors of the Federal Reserve System, www.federalreserve.gov/supervisionreg/snc.htm.
44 The corporate loan category also includes loans that are dis-similar from typical corporate loans, such as securities lending
and farmland loans, which are generally a small share of firmportfolios. For these loans, a conservative and uniform loss ratebased on analysis of historical data is assigned.
June 2018 65
mortgage as a function of the expected probability of
loss, characteristics of the loan, and residential house
prices and the unemployment rate. Finally, the EAD
for CRE loans is assumed to equal the loan’s full
committed balance for both income producing and
C&LD loans.
Retail Loans: Residential Mortgages
Residential mortgages held in firm portfolios include
first and junior liens—both closed-end loans and
revolving credits—that are secured by one- to four-
family residential real estate as defined by the
FR Y-9C report. Losses stemming from default on
residential mortgages are projected at the loan level
using an expected-loss modeling framework.45
The PD model for first-lien residential mortgages
estimates the probability that a loan transitions to
different payment statuses, including current, delin-
quent, servicing transfer, default, and paid off. Sepa-
rate PD models are estimated for closed-end fixed-
rate mortgages and adjustable-rate mortgages. The
PD model specification varies somewhat by loan
type; however, in general, each model estimates the
probability that a loan transitions from one payment
state to another (e.g., from current to delinquent or
from delinquent to default) over a single quarter,
given the characteristics of the loan, borrower, and
underlying property as well as macroeconomic vari-
ables, including local house prices, the statewide
unemployment rate, and interest rates.46 Origination
vintage effects are also included in the estimation in
part to capture unobserved characteristics of loan
quality.
The historical data used to estimate this model are
industrywide, loan-level data from many banks and
mortgage loan originators. These estimated PD mod-
els are used to predict default for each loan reported
by each firm under the supervisory scenarios. Resi-
dential mortgage loans are considered in default
when they are 180 days or more past due.
The LGD for residential mortgages is estimated
using two models. One model estimates the amount
of time that elapses between default and real estate
owned (REO) disposition (timeline model), while the
other relates characteristics of the defaulted loan,
such as the property value at default, to loss severity
(in the case of prime loans) or dollars of losses (in
the case of subprime and alt-A loans).47
For prime loans, loss amounts and severities are cal-
culated from historical data on loan balances, ser-
vicer advances, and losses from defaulted loans in
both private-label, residential mortgage-backed secu-
rities (RMBS) and Freddie Mac securities. For sub-
prime and alt-A loans, only RMBS data are used.48
Finally, using the elapsed time between default and
REO disposition estimated in the timeline model,
total estimated losses are allocated into credit losses
on the defaulted loans, which are fully written down
at the time of default, or net losses arising from the
eventual sale of the underlying property (other real
estate owned—or OREO—expenses), which flow
through PPNR. House price changes from the time
of default to foreclosure completion (REO acquisi-
tion) are captured in LGD, while house price
changes after foreclosure completion and before sale
of the property are captured in OREO expenses. The
LGD for loans already in default as of December 31,
2017, includes further home price declines through
the point of foreclosure.
Home equity loans (HELs) are junior-lien, closed-
end loans, and home equity lines of credit
(HELOCs) are revolving open-end loans extended
under lines of credit. Both are secured by one- to
four-family residential real estate as defined by the
FR Y-9C report. Losses stemming from default on
HELs and HELOCs are projected at the loan level in
an expected loss framework that is similar to first-
lien mortgages, with a few differences. The PD model
for HELOCs estimates the probability that a loan
transitions to different payment statuses, including
current, impaired, default, and paid off. At each
point in time, each transition model is a function of
account characteristics, customer characteristics,
economic environment, and past delinquency his-
45 To predict losses on new originations over the planning hori-zon, newly originated loans are assumed to have the same riskcharacteristics as the existing portfolio, with the exception ofloan age and delinquency status.
46 The effects of loan modification and evolving modificationpractices are captured in the probability that a delinquent loantransitions back to current status (re-performing loans).
47 Private mortgage insurance is not incorporated into the LGDmodels. Industry data suggest that insurance coverage on port-folio loans is infrequent and cancellation or nullification ofguarantees was a common occurrence during the recentdownturn.
48 The differences between characteristics of mortgages in MBSand mortgages in firm portfolios, such as loan-to-value (LTV)ratio, are controlled for by including various risk characteristicsin the LGD model, such as original LTV ratio, credit score, andcredit quality segment (prime, alt-A, and subprime).
66 Supervisory Stress Test Methodology and Results

tory. Economic drivers include interest rates, home
prices, and the unemployment rate.
For second-lien HELs and HELOCs that are current
as of December 31, 2017, but are junior to a seri-
ously delinquent first-lien mortgage, the model
assumes elevated default rates under the supervisory
scenarios. In addition, most HELOC contracts
require only payment of interest on the outstanding
line balance during the period when the line can be
drawn upon (draw period). When the line reaches the
end of its draw period (end-of-draw), the outstand-
ing line balance either becomes immediately payable
or converts to a fully amortizing loan. HELOCs that
reach the end-of-draw period are assumed to prepay
at a higher rate just prior to end-of-draw and to
default at a higher rate just after end-of-draw than
HELOCs that are still in their draw period.
The LGD for HELs and HELOCs is estimated using
data from private-label mortgage-backed securities,
using models used for closed-end first-lien mort-
gages, but the estimated total mortgage losses for
properties with a defaulted HEL or HELOC are
allocated based on the lien position. Finally, for
HELOCs, EAD is assumed to equal the maximum of
the outstanding line balance and the credit limit for
lines that are open and have not reached the end-of-
draw period, and equal to the outstanding line bal-
ance for loans that have been closed by the servicer
or are past the end-of-draw period.
Retail Loans: Credit Cards
Credit cards include both general purpose and
private-label credit cards, as well as charge cards, as
defined by the FR Y-9C report. Credit card loans
extended to individuals are included in retail credit
cards, while credit cards loans extended to businesses
and corporations are included in other retail lending
and are modeled separately. Losses stemming from
defaults on credit cards are projected at the loan level
using an expected-loss modeling framework.
The PD model for credit cards estimates the prob-
ability that a loan transitions from delinquency sta-
tus to default status, given the characteristics of the
account and borrower as well as macroeconomic
conditions, including the level and changes in the
unemployment rate. When an account defaults, it is
assumed to be closed and does not return to current
status. Credit card loans are considered in default
when they are 120 days or more past due. Because
the relationship between the PD and its determinants
can vary with the initial status of the account, sepa-
rate transition models are estimated for accounts
that are current and active, current and inactive
accounts, and delinquent accounts. In addition,
because this relationship can also vary by time hori-
zon, separate transition models are estimated for
short-, medium-, and long-term horizons. The his-
torical data used to estimate this model are industry-
wide, loan-level data from many banks, and separate
models were estimated for bank cards and charge
cards. The PD model is used to forecast the PD for
each loan reported by each firm in the FR Y-14
information collection.
The LGD for credit cards is assumed to be a
fixed percentage of EAD and is calculated separately
for bank cards and charge cards based on historical
industry data on LGD during the most recent eco-
nomic downturn. The EAD for credit cards equals
the sum of the amount outstanding on the account
and the estimated amount of the available credit line
that is likely to be drawn down by the borrower
between the beginning of the planning horizon and
the time of default. This drawdown amount is esti-
mated as a function of account and borrower char-
acteristics. Because this relationship can vary with
the initial status of the account and time to default,
separate models are used to estimate the drawdown
amount for current and delinquent accounts and for
accounts with short-, medium-, and long-term tran-
sition to default. For accounts that are current, sepa-
rate models were also estimated for different credit-
line-size segments. The estimated EAD is further
adjusted to better reflect typical accounting practice
for accrued, unpaid interest and fees.
For DFAST 2018, the estimation sample for the PD
model was expanded, and the historical data used to
estimate LGD were updated to include a larger set of
firms and a slightly longer downturn period to better
capture lags in the recovery of credit card losses. For
DFAST 2018, credit card loss projections are calcu-
lated as the arithmetic average of the projection from
the models used in DFAST 2017 and the enhanced
models, consistent with the Federal Reserve’s policy
of phasing in the most material model enhancements
over two stress test cycles to smooth the effect on
post-stress capital ratios.49
49 For more information on the Federal Reserve’s policy regardingmaterial model changes, see the proposed Stress Testing PolicyStatement (82 Fed. Reg. 59528, December 15, 2017). Projec-tions of credit card losses in DFAST 2019 will reflect theenhanced models only.
June 2018 67
Retail Loans: Auto
Auto loans are consumer loans extended for the pur-
pose of purchasing new and used automobiles and
light motor vehicles as defined by the FR Y-9C
report. Losses stemming from default in auto retail
loan portfolios are projected at the portfolio segment
level using an expected loss framework.
The PD model for auto loans estimates the probabil-
ity that a loan transitions from either a current or
delinquent status to default status, given the charac-
teristics of the loan and borrower as well as macro-
economic variables, including house prices and the
unemployment rate. Auto loans are defined as being
in default based on either the payment status
(120 days or more past due), actions of the borrower
(bankruptcy), or actions of the lender (repossession).
Because the relationship between the PD and its
determinants can vary with the initial status of the
account, separate transition models are estimated for
accounts that are current and for those that are
delinquent. The historical data used to estimate this
model are loan-level, credit bureau data.
The LGD for auto loans is modeled as a function of
the characteristics of the loan as well as macroeco-
nomic variables, such as the unemployment rate and
used car prices. The historical data used to estimate
this model are pooled, segment-level data provided
by the firms on the FR Y-14 information collection.
The EAD for auto loans is based on the typical pat-
tern of amortization of loans that ultimately
defaulted in historical credit bureau data. The esti-
mated EAD model captures the average amortization
by loan age for current and delinquent loans over
nine quarters.
Retail Loans: Other Retail Loans
The other retail loans category includes the small
business loan portfolio, the other consumer loan
portfolio, the student loan portfolio, the business
and corporate credit card portfolio, and interna-
tional retail portfolio. Losses due to default on other
retail loans are forecast by modeling as a function of
portfolio risk characteristics and macroeconomic
variables. This model is then used to predict future
charge-offs consistent with the evolution of eco-
nomic conditions under the supervisory scenarios.50
The predicted net charge-off rate is applied to bal-
ances projected by the Federal Reserve to estimate
projected losses.
The net charge-off rate is projected using a system of
equations that also generates projections of the
delinquency rate and the default rate. Default is
defined as 90 days or more past due for domestic and
international other consumer loans and 120 days or
more past due for student loans, small business
loans, corporate cards, and international retail port-
folios. In general, each rate is modeled in an autore-
gressive specification that also includes the rate in the
previous delinquency state, characteristics of the
underlying loans, macroeconomic variables, such as
changes in the unemployment rate and disposable
personal income growth, and, in some cases, seasonal
factors. The models are specified to implicitly cap-
ture roll-rate dynamics.51 Each retail product type is
modeled separately, and, for each product type, eco-
nomic theory and the institutional characteristics of
the product guide the inclusion and lag structure of
the macroeconomic variables in the model.
Because of data limitations and the relatively small
size of these portfolios, the net charge-off rate for
each loan type is modeled using industry-
wide, monthly data at the segment level. For most
portfolios, these data are collected on the FR Y-14Q
Retail schedule, which segments each portfolio by
characteristics such as borrower credit score; loan
vintage; type of facility (e.g., installment versus
revolving); and, for international portfolios, geo-
graphic region.52
Charge-off rates are projected by applying the esti-
mated system of equations to each segment of the
firm’s loan portfolio as of December 31, 2017. The
portfolio-level charge-off rate equals the dollar-
weighted average of the segment-level charge-off
rates.53
50 For the government-guaranteed portion of firms’ student loanportfolios, an assumption of low PD and LGD is applied.
51 “Roll-rate dynamics” refers to how delinquent loans in oneperiod transition to defaulted loans in the next, and howdefaulted loans in a period transition to net charge-offs in thenext.
52 Business and corporate credit card portfolio data, which werepreviously collected on the FR Y-14Q Retail schedule, are nowcollected at the loan level on the FR Y-14M Credit Card sched-ule and subsequently aggregated to the segment level.
53 The dollar weights used are based on the distribution reportedduring the previous observation period. This method assumesthat the distribution of loans across risk segments, other thandelinquency status segments, remains constant over the projec-tion period.
68 Supervisory Stress Test Methodology and Results

Loan-Loss Provisions for the AccrualLoan Portfolio
Losses on the accrual loan portfolio flow into net
income through provisions for loan and lease losses.
Provisions for loan and lease losses equal projected
loan losses for the quarter plus the amount needed
for the ALLL to be at an appropriate level at the end
of the quarter, which is a function of projected
future loan losses. The appropriate level of ALLL at
the end of a given quarter is generally assumed to be
the amount needed to cover projected loan losses
over the next four quarters.54 Because this calcula-
tion of ALLL is based on projected losses under the
adverse or severely adverse scenarios, it may differ
from a firm’s actual level of ALLL at the beginning
of the planning horizon, which is based on the firm’s
estimate of incurred losses as of the balance sheet
date.55 Any difference between these two measures of
ALLL is smoothed into the provisions projection
over the nine quarters of the planning horizon.
Because projected loan losses include off-balance
sheet commitments, the firm’s allowance at the
beginning of the planning horizon for credit losses
on off-balance sheet exposures (as reported on the
FR Y-9C report) is subtracted from the provisions
projection in equal amounts each quarter.
Other Losses
Loans Held for Sale or Measured under the
Fair-Value Option
Certain loans are not accounted for on an accrual
basis. Loans to which the fair-value option (FVO) is
applied are valued as mark-to-market assets. Loans
that are held-for-sale (HFS) are carried at the lower
of cost or market value.
FVO/HFS loan portfolios are identified by firms and
reported on the FR Y-14Q report. Losses related to
FVO/HFS loans are recognized in earnings on the
income statement at the time of the devaluation and
are calculated by applying scenario-specific interest
rate and credit spread projections.
Losses on C&I and CRE loans and commitments are
calculated by revaluing each loan or commitment
each quarter using a stressed discount yield. The ini-
tial discount yield is based on the loan or commit-
ment’s initial fair value, settlement date, maturity
date, and interest rate. Quarterly movements in the
discount yield over the planning horizon are
assumed to equal the stressed change in corporate
bond yields of the same credit rating and maturity,
adjusted for potential changes in credit ratings. The
models estimate changes in the fair value of the loan
in a given scenario on a committed-balance basis.
Losses on retail loans held under FVO/HFS
accounting are calculated over the nine quarters of
the planning horizon using a duration-based
approach. This approach uses balances on these
loans reported on the FR Y-14Q report, estimates of
portfolio-weighted duration, and quarterly changes
in stressed spreads from the macroeconomic sce-
nario. Estimates are calculated separately by vintage
and loan type. No losses are assumed for residential
mortgage loans under forward contract with the
government-sponsored enterprises (GSEs).
Gains and losses on FVO loan hedges are modeled
on a quarterly basis, using a set of scenario-specific
factor projections and factor sensitivities submitted
by firms. Profits and losses are calculated for a vari-
ety of hedge types, including corporate credit, rates,
equities, and CMBS. These profits and losses are net-
ted from estimated losses on the FVO loans.
Projections of fair value losses assume that each
position has a constant maturity over the projection
horizon. Aggregate gains and losses on hedges at the
firm level are netted against projected gains and
losses on wholesale and retail exposures in order to
arrive at final estimates.
Securities in the Available-for-Sale and
Held-to-Maturity Portfolios
Securities in the available-for-sale and held-to-
maturity (AFS/HTM) portfolios include U.S. Treas-
ury, U.S. Agency, municipal, mortgage-backed, asset-
backed, corporate debt, sovereign debt, collateralized
loan obligation, collateralized debt obligation, and
equity securities. The AFS/HTM portfolio does not
include securities held for trading; losses on these
54 For loan types modeled in a charge-off framework, the appro-priate level of ALLL is adjusted to reflect the difference in tim-ing between the recognition of expected losses and that ofcharge-offs.
55 With regard to Accounting Standards Update No. 2016-13,Financial Instruments – Credit Losses (Topic 326): Measure-ment of Credit Losses on Financial Instruments (CECL), theFederal Reserve has not included the potential effect of CECLin the 2018 stress testing exercise. Covered banking organiza-tions that have adopted ASU 2016-13 would not include theeffect of ASU 2016-13 on their provisioning for purposes ofstress testing until the 2020 stress testing cycle.
June 2018 69

securities are projected separately. Changes in the
value of the AFS/HTM portfolio can potentially
impact a firm’s capital in two ways. First, other-
than-temporary impairment (OTTI) losses on AFS/
HTM securities, realized gains and losses on sold
securities, and unrealized gains and losses on equity
securities are recognized in the net income of all
firms. Second, under regulatory capital rules, accu-
mulated other comprehensive income (AOCI) that
arises from unrealized changes in the value of AFS
securities must be incorporated into the Common
Equity Tier 1 (CET1) for advanced approaches firms
(and other firms that do not opt out of including
AOCI in regulatory capital). Both OTTI and unreal-
ized gains and losses on securities are projected at
the security level, based on FR Y-14Q data, and
aggregated up to the firm-level.
Other comprehensive income (OCI) associated with
AFS securities arises from changes in their unreal-
ized gains and losses, which are calculated as the dif-
ference between each security’s fair value and its
amortized cost. The amortized cost of each AFS
security is collected by the Federal Reserve and
equals the purchase price of a debt security that is
periodically adjusted if the debt security (1) was pur-
chased at a price other than par or face value or
(2) has had a prior impairment recognized in earn-
ings. The fair value of each AFS security is projected
over the nine-quarter planning horizon using one of
three methods: a present-value calculation, a full
revaluation, or a duration-based approach. The
simple present-value calculation is used to directly
re-price U.S. Treasury securities. This calculation
incorporates both the timing and amount of con-
tractual cash flows and quarterly Treasury yields
from the macroeconomic scenario. Full revaluation
uses a security-specific discounted cash flow model
to re-price agency MBS. Finally, the duration-based
approach is used for all other debt securities. The
duration-based approach forecasts the quarterly
price path based on an approximation of the rela-
tionship between the securities price and its yield,
taking into account security-specific information.
Separate spread projections are calculated for securi-
ties in each asset class using projections of interest
rates, corporate credit spreads, volatility, and asset
prices included in the supervisory scenarios. Final
projections of OCI take into account applicable
interest rate hedges on the securities.
Securities experiencing an impairment over the fore-
cast horizon may be at risk of an OTTI, which
affects earnings and regulatory capital.56 An impair-
ment occurs when the fair value of a security falls
below its amortized cost. If the firm intends to sell a
security, or if it is more likely than not that the firm
will have to sell without recovering its investment,
then any impairment on that security will flow
through the firm’s earnings. The full write-down to
fair value is recognized periodically as OTTI until the
quarter in which the security is sold. Otherwise, a
firm must recognize as a charge to earnings only the
credit component of OTTI, which reflects a non-
temporary decline in present value below amortized
cost. The supervisory OTTI models are designed to
incorporate the credit component only.
U.S. Treasury and U.S. government agency obliga-
tions and U.S. government agency or GSE mortgage-
backed securities are assumed not to be at risk for
the kind of credit impairment that results in credit-
related OTTI charges. The supervisory OTTI model
estimates OTTI for all other debt securities under the
stress scenario. For all securities at risk for impair-
ment that would result in credit-related OTTI
charges, future balances are assumed to have risk
characteristics similar to those of the initial balances.
Securities at risk of an impairment that would result
in credit-related OTTI charges consist of securitiza-
tions and direct debt obligations. Securitized obliga-
tions include mortgage-backed, asset-backed, collat-
eralized loan obligation, and collateralized debt obli-
gation securities. Direct debt obligations are issued
by a single issuer with recourse and include munici-
pal, corporate, and sovereign debt securities.
As described in box 1, the model used to project
OTTI charges for securitizations and direct debt
obligations has changed for DFAST 2018. For all
debt securities, OTTI charges for these securities are
projected using the statistical relationship between
historically observed OTTI write-downs and meas-
ures of the fair value of the securities. The model
estimates this relationship separately for securitized
obligations and direct debt obligations and accounts
for each security’s current amortized cost basis. His-
torical data on securities’ amortized cost, fair values,
and OTTI write-downs are obtained from the
FR Y-14Q report and additional data from filings by
56 Recognition and Presentation of Other-Than-Temporary-Impairments, Financial Accounting Standards Board, StaffPosition No. FAS 115-2 and FAS 124-2 (April 9, 2009), www.fasb.org/jsp/FASB/Document_C/DocumentPage?cid=1176154545419&acceptedDisclaimer=true.
70 Supervisory Stress Test Methodology and Results
U.S. life insurance companies. OTTI charges for each
security are projected using this estimated relation-
ship, the security’s current amortized cost, current
fair value, and projected fair value over the scenario
from the supervisory fair value model.
Fair value losses and gains on equity securities are
based on the projected fair value of each security as
determined by the U.S. equities index in the scenario
and the sensitivity of each security’s returns to the
overall returns of the index. Unrealized losses and
gains for equity securities are recognized in net
income and affect capital directly for all firms.57
Balances at risk of OTTI are assumed not to
decrease. After a security is written down as OTTI,
the difference between its original value and its post-
OTTI value is assumed to be invested in securities
with the same risk characteristics. Similarly, the fair
value projections assume that duration and remain-
ing life remain constant. Net increases projected by
the Federal Reserve in a firm’s securities portfolio
after December 31, 2017, are assumed to be in short-
term, riskless assets, and no OTTI or OCI are pro-
jected on these securities.
Trading and Private Equity
Losses related to trading positions that are included
in the supervisory stress test are of two primary
types. The first type arises from changes in the mark-
to-market value of the trading positions. The second
type is associated with either the potential or the
realized default of obligors and counterparties. The
models used to project losses on trading positions
under the global market shock account for both
types of losses and rely on the market values and
stressed revaluation of positions provided by firms
on the FR Y-14Q report.
Mark-to-market gains and losses on trading posi-
tions are calculated by applying the movements in
the global market shock factors to the associated
market values or market value movements provided
by firms. The global market shock specifies move-
ments in numerous market factors, such as equity
prices, foreign exchange rates, interest rates and
spreads, commodity prices, securitized product
prices, and private equity values. Firms provide the
market value of their securitized products and pri-
vate equity positions. For all other market factors,
firms provide the estimated market value change (i.e.,
the profit or loss) across the trading book associated
with a single, limited movement in a market factor
(e.g., +1 basis point movement in a foreign exchange
rate) or a range of positive and negative movements
in a market factor (e.g., –30 percent, –25 percent,
+30 percent for a foreign exchange rate). These mar-
ket values and market value changes are collected for
the same factors specified in the global market
shock. The computation of gains and losses is per-
formed by applying the market factor movements
specified in the global market shock to the informa-
tion reported by firms. For securitized products and
private equity positions, the market values are multi-
plied by the global market shock market value move-
ments. For all other market factors the gains and
losses are computed by either multiplication of the
global market shock movement and a single associ-
ated market value change or by interpolation using
the range of associated market value changes. The
ranges are used to capture the non-linear market
value changes associated with certain assets.
Credit Valuation Adjustments
Losses that are related to the potential adverse
changes in credit quality of a counterparty to deriva-
tives positions are captured through credit valuation
adjustments (CVA). CVA is an adjustment to the
mark-to-market valuation of a firm’s trading posi-
tion that accounts for the risk of adverse changes in
a counterparty’s credit quality. Firms report their
baseline and stressed CVA at the counterparty-level
on the FR Y-14Q report as well as the associated
baseline and stressed values of the components of
CVA (i.e., counterparty expected exposure, probabil-
ity of default (PD), and loss given default (LGD).
The loss estimate is computed as the difference
between the baseline and the stressed CVA aggre-
gated across all counterparties.
Incremental Default Risk
In addition to mark-to-market and CVA losses on
trading positions, the losses associated with the
explicit default of issuers of credit instruments are
captured through an incremental default risk (IDR)
model. The IDR model estimates the credit losses in
excess of mark-to-market losses subsequent to
default of an issuer. The exposure types captured
through this issuer default-loss estimate include
single-name products (e.g., corporate bonds and
single name CDS), index and index-tranche prod-57 Financial Accounting Standards Board Accounting Standards
Update No. 2016-01.
June 2018 71

ucts, and securitized products.58 A distribution of
simulated sets of issuer defaults is created through a
random jump-to-default framework that is based on
factors such as PD and obligor correlations. Default
distributions are simulated at the level of individual
obligors or at the instrument and rating level,
depending on exposure type. Losses associated with
each default are derived from exposure at default,
which is based on position information reported on
the FR Y-14Q report, and loss given default (LGD),
which is based on historical information. The loss
estimate is the loss associated with a tail percentile of
the distribution, which is calibrated to the severity of
the macroeconomic scenario.
Largest Counterparty Default
To estimate losses from the default of counterparties
to derivatives and securities financing transactions,
the Federal Reserve applied a counterparty default
scenario component to the eight firms that have sub-
stantial trading or custodial operations. The loss is
based on the assumed instantaneous and unexpected
default of a firm’s largest counterparty, defined as
the counterparty that would produce the largest total
net stressed loss if it were to default on all of its
derivatives and securities financing transactions. Net
stressed loss was calculated using net stressed current
exposure (CE), which is derived by applying the
global market shock to the unstressed positions as
well as any collateral posted or received and reported
by firms. For derivative agreements, net stressed cur-
rent exposure was calculated net of any stressed
credit valuation adjustment (CVA) losses and any
gains from CVA hedges not included in the calcula-
tion of trading gains or losses. A recovery rate of
10 percent is assumed for both net stressed CE and
applicable CDS hedges.
Similar to the global market shock component, the
loss associated with the counterparty default compo-
nent occurs in the first quarter of the projection and
is an add-on to the economic conditions and finan-
cial market environment in the supervisory scenarios.
Certain sovereign entities (Canada, France, Ger-
many, Italy, Japan, the United Kingdom, and the
United States) and designated clearing counterpar-
ties were excluded when selecting the largest
counterparty.
PPNR
PPNR is the sum of net interest income (interest
income minus interest expense) plus noninterest
income less noninterest expense, including losses
from operational risk events and OREO expenses.
PPNR does not include provisions for credit losses
on loans or losses from other than temporary
impairments on securities.
Core components of PPNR
Core components of PPNR are forecast separately,
using autoregressive models, aggregate models,
simple nonparametric models, or structural models.
Significant efforts are made to eliminate or minimize
potential double-counting of losses. For example, in
estimating certain components of PPNR, historical
data series are adjusted, where appropriate, to
exclude losses from operational-risk events and
OREO expenses, which are modeled separately, as
described below. In addition, the modeling approach
for trading revenue (described below) limits the influ-
ence of severe market events captured in the global
market shock. Finally, PPNR projections do not
include debt valuation adjustments (DVA), which is
not included in regulatory capital.
When choosing the level of detail at which to model
the components of PPNR, consideration is given
both to firms’ business models and the ability to
model the individual income or expense component
accurately. Separate models are estimated for 24 dif-
ferent components of PPNR:
• The eight components of interest income modeled
include income on loans, interest bearing balances,
Treasury securities, mortgage-backed securities,
federal funds and repurchase agreements, other
securities, trading assets, and all other interest
income.
• The seven components of interest expense modeled
include interest expense on domestic time deposits,
non-time deposits, foreign deposits, federal funds
and repurchase agreements, trading liabilities and
other borrowed money, subordinated debt, and all
other interest expenses.
• The six components of noninterest income include
trading revenue, and five components of noninter-
est, non-trading income: service charges on depos-
its, fiduciary income and insurance and annuity
58 These exposures are distinct from the bilateral derivatives agree-ments and securities financing transactions included in the larg-est counterparty default scenario component (described below).
72 Supervisory Stress Test Methodology and Results

fees, investment banking fees, net servicing fees,
and all other noninterest income.
• Finally, the three components of noninterest
expense include compensation expense, fixed asset
expense, and all other noninterest expense (exclud-
ing losses from operational-risk events or OREO
expenses).
Each model generates projections of the PPNR com-
ponent scaled by a relevant asset or liability balance
(e.g., interest income on Treasury securities as a ratio
of the book value of Treasury securities). The ratio
forecast is then multiplied by the firm’s projected
asset or liability balance to generate a projection of
the dollars of PPNR for that component.
The types of models used to forecast various compo-
nents of PPNR include:
• autoregressive models that relate the components
of a firm’s revenues and non-provision-related
expenses, expressed as a share of relevant asset or
liability balances, to firm characteristics and to
macroeconomic variables;
• aggregate models in which the revenue or expense
is allocated to each firm based on a measure of the
firm’s market share;
• simple nonparametric models based on recent
firm-level performance; and
• structural models that use granular data on indi-
vidual positions.
The specific macroeconomic variables included in
the models differ across equations based on statisti-
cal predictive power and economic theory. Macro-
economic variables used to project interest income
and interest expense include yields on short- and
long-term Treasury securities and corporate bond
spreads. Noninterest non-trading income and nonin-
terest expense are projected as a function of GDP
growth, stock market volatility, stock returns, and
home price growth.
Trading revenues are volatile because they include
both changes in the market value of trading assets
and fees from market-making activities. Forecasts of
PPNR from trading activities at the firms subject to
the global market shock are modeled in the aggre-
gate, as a function of stock market returns and
changes in stock market volatility, and then allocated
to each firm based on a measure of the firm’s market
share. Net trading revenue is modeled using a
median regression approach to lessen the influence
of extreme movements in trading revenue, and,
thereby, to avoid double-counting of trading losses
that are captured under the global market shock.
Trading revenues for the remaining firms are mod-
eled as a function of corporate bond yields and long-
term Treasury yields, in an autoregressive framework
similar to that of other PPNR components. Some
noninterest income and noninterest expense compo-
nents are highly volatile quarter-to-quarter but do
not exhibit a clear cyclical pattern. As a result, these
components are modeled as a constant forecast ratio
to reflect median performance over the past eight
quarters.
The estimate of interest expenses on subordinated
debt is based on security-level information and takes
into account differences in the maturity schedule and
debt pricing across firms. The estimate also reflects
yields on short-term and long-term Treasury securi-
ties, and corporate bond spreads under various
scenarios.
In the autoregressive models, projections for PPNR
components (expressed as a share of a relevant asset
or liability balance) converge over time towards the
firm’s own post-crisis average performance for that
revenue or expense category, while still varying in
response to changes in macroeconomic conditions.
The post-crisis period in this context is defined as the
time period from 2009:Q4 onwards. This enhanced
modeling approach was introduced in DFAST 2017.
For DFAST 2018, PPNR projections reflect only the
enhanced models. For DFAST 2017, PPNR projec-
tions were calculated as the arithmetic average of the
enhanced models and the prior modeling
approach.59
Losses Related to Operational-Risk Events
Losses related to operational-risk events are a com-
ponent of PPNR and include losses stemming from
events such as fraud, computer system failures, pro-
cess errors, and lawsuits by employees, customers or
other parties. Operational-risk loss estimates include
the average of loss estimates from two modeling
approaches and estimates of potential costs from
unfavorable litigation outcomes.
Both modeling approaches—a historical simulation
approach and a regression model—project opera-
59 For more details, see box 1 and box 2 of the disclosure docu-ment: Dodd-Frank Act Stress Test 2017: Supervisory Stress TestMethodology and Results.
June 2018 73

tional losses for the 35 firms and are based on his-
torical operational-loss data submitted by the firms
on the FR Y-14A/Q reports.
In the historical simulation model, losses at differ-
ent percentiles of simulated, nine-quarter loss distri-
butions are used as a proxy for the expected opera-
tional losses conditional on the macroeconomic sce-
narios. Losses are modeled for each firm and each of
the seven operational-risk categories identified in the
Board’s regulatory capital rule.60 The historical simu-
lation approach models the loss frequency and loss
severity separately. The tails of the loss severity and
frequency distributions are informed by historical
industry loss severity and frequency scaled to the
assets of individual firms, while the bodies of these
distributions are informed by each firm’s historical
loss severity and frequency. The distribution of
aggregate losses is then simulated by repeatedly
drawing the nine-quarter event frequency from this
frequency distribution, and the severity of those
events from the severity distribution. The percentiles
of loss distributions, which are used to estimate
stressed losses, are tied to the frequency of severe
recessions for the severely adverse scenario and to
the frequency of all recessions for the adverse sce-
nario. Loss forecasts for an individual firm are the
sum of the firm’s loss estimates for each event type.
The regression model is a two-step model. The first
step projects the industry aggregate operational
losses conditional on macroeconomic factors over
the nine-quarter horizon.61 A regression approach is
used to model industry operational losses as a func-
tion of macroeconomic variables, including measures
of economic activity, financial conditions, and inter-
est rate environment, and to produce industry aggre-
gate projected losses for each of the different sce-
narios. Finally, the second step estimates weights to
distribute industry losses to individual firms based
on each firm’s size.
Balance-Sheet Items andRisk-Weighted Assets
The size of each firm’s balance sheet is projected
based on a model that relates industrywide loan and
non-loan asset growth to each other and to broader
economic variables, including a proxy for loan sup-
ply. The model allows for both long-run relationships
between the industry aggregates and macroeconomic
variables, as well as short-term dynamics that cause
deviations from these relationships. It is calculated
using aggregate data from the Federal Reserve’s
Financial Accounts of the United States and the
Bureau of Economic Analysis.
Industry loan and asset growth rates are projected
over the planning horizon using the macroeconomic
variables prescribed in the supervisory scenario. The
growth rates embed the assumption that the industry
will continue to lend using standards that are consis-
tent with long-run behavior. This tends to raise the
projected growth of lending by removing the effects
of firm tightening that often occur in stressful peri-
ods. Over this horizon, each firm is assumed to
maintain a constant share of the industry’s total
assets, total loans, and total trading assets. In addi-
tion, each firm is assumed to maintain a constant
mix within their loan and trading asset categories.
These assumptions are applied as follows:
• Each category of loans at a firm is assumed to
grow at the projected rate of total loans in the
industry.
• Each category of trading assets at a firm is
assumed to grow as a function of both the pro-
jected rate of total assets and the projected market
value of trading assets in the industry.
• All other assets of a firm, including securities, are
assumed to grow at the projected rate of non-loan
assets in the industry.
• A firm’s cash holdings level, the residual category,
is set such that the sum of cash and noncash assets
grows at the projected rate of total assets.
• Growth in securities is assumed to be in short-
term, riskless assets.
Balance sheet projections incorporate expected
changes to a firm’s business plan, such as mergers,
acquisitions, and divestitures that are likely to have a
material impact on its capital adequacy and funding
profile. Firm-submitted data are used to adjust the
projected balance sheet in the quarter when the
60 The seven operational-loss event type categories identified inthe Federal Reserve’s regulatory capital rule are internal fraud;external fraud; employment practices and workplace safety; cli-ents, products, and business practices; damage to physicalassets; business disruption and system failures; and execution,delivery, and process management. See 12 CFR 217.101(b).
61 Losses are aggregated for six of the seven operational-risk cat-egories. Operational-risk losses due to damage to physical assetsare the exception. These losses are not expected to be depen-dent on the macroeconomic environment and therefore aremodeled separately only as a function of size, but not of mac-roeconomic variables.
74 Supervisory Stress Test Methodology and Results

change is expected to occur. Once adjusted, assets
are assumed to grow at the same rate as the pre-
adjusted balance sheet. Only submitted divestitures
that are either completed or contractually agreed
upon before April 5, 2018, are incorporated.
The projection of RWAs is accomplished in two
parts and is based on the tenets of the standardized
approach and market-risk rule in the Board’s regula-
tory capital rule.62 The first part requires estimating
the path of credit RWAs based on exposures from
loans and securities.63 The second requires estimat-
ing the path of market risk-weighted assets
(MRWAs) based on exposures under the market-risk
rule.64
Credit RWA projection is a straightforward imple-
mentation of the standardized approach. Most risk
weights are imputed from the FR Y-9C report and
held fixed throughout the projection horizon. Risk
weights are applied to appropriate balance paths and
summed across categories. This treatment is consis-
tent with the assumption that the general features of
the credit portfolio and non-trading book assets
remain constant during the projection period.
MRWA projections incorporate the assumption that
market risk is sensitive to the economic scenario. In
particular, the path of MRWAs is sensitive to
changes in the projected volatility of the underlying
mix of trading assets. While the underlying mix of
exposures subject to the market-risk rule is assumed
to remain constant throughout the scenario, some
elements of MRWAs are affected by changes in mar-
ket conditions assumed in supervisory scenarios. For
example, projected value-at-risk (VaR) calcula-
tions—an important element of MRWAs—rise as
the volatility of the portfolio’s underlying assets
increases. Similarly, a firm’s incremental risk charge
and its comprehensive risk measure are affected by
the volatility of credit products. The remaining cat-
egories of MRWAs are assumed to evolve according
to projections of a firm’s trading assets. These prop-
erties make the trajectory of MRWAs more dynamic
than credit RWAs because both the underlying path
of trading assets and the volatility associated with
the portfolio evolve.
Regulatory Capital
The final modeling step translates the projections of
revenues, expenses, losses, provisions, balances, and
RWAs from the models described above into calcula-
tions of regulatory capital for each firm under the
supervisory scenarios. Regulatory capital is calcu-
lated using the definitions of capital in the Board’s
regulatory capital rule.65 Regulatory capital is calcu-
lated consistent with the requirements that will be in
effect during the projected quarter of the planning
horizon.66 The definition of regulatory capital
changes throughout the planning horizon in accor-
dance with the transition arrangements in the revised
regulatory capital framework, where applicable.67
Regulatory capital incorporates estimates of net
income from supervisory projections of revenues,
total losses, and tax expense. Current and deferred
tax expenses, and related changes to net deferred tax
assets (DTAs), are calculated by applying a consis-
tent tax rate of 21 percent68 to pretax income or loss.
The tax expense includes changes to DTA valuation
allowance, which is comprised of a calculation that
evaluates whether a firm will have sufficient taxable
income to realize its DTAs. Finally, projected after-
tax income adjusts for income attributable to minor-
ity interests.
For DFAST 2018, the quarterly change in CET1
capital before adjustments and deductions equals
projected after-tax net income minus capital distribu-
tions (dividends and any other actions that disperse
equity), plus any issuance or other corporate actions
that increase equity, plus other changes in equity
capital such as other comprehensive income, and
changes incident to business combinations.69
62 12 CFR part 217, subparts D and F. The use of the advancedapproaches for calculating risk-based capital ratios under thecapital plan and stress test rules has been deferred indefinitely.See 80 Fed. Reg. 75419 (Dec. 2, 2015); 12 CFR 225.8(d)(10);and 252.42(m).
63 CFR part 217, subpart D.64 CFR part 217, subpart F.
65 See 12 CFR part 217.66 See 12 CFR 225.8(e)(2)(i)(A) and 12 CFR 252.56(a)(2).67 See 12 CFR part 217, subpart G.68 For a discussion of the effect of changing this tax rate assump-
tion, see Board of Governors of the Federal Reserve System,Dodd-Frank Act Stress Test 2013: Supervisory Stress Test Meth-odology and Results, (Washington, DC: Board of Governors,March 2013), www.federalreserve.gov/newsevents/press/bcreg/dfast_2013_results_20130314.pdf, box 2.
69 The Federal Reserve used the following capital action assump-tions in projecting post-stress capital levels and ratios: (1) forthe first quarter of 2018, each company’s actual capital actionsas of the end of that quarter; and (2) for each quarter from thesecond quarter of 2018 through the first quarter of 2020, eachcompany’s projections of capital included (i) common stockdividends equal to the quarterly average dollar amount of com-mon stock dividends that the company paid in the previousyear (that is, from the second quarter of 2017 through the firstquarter of 2018) plus common stock dividends attributable to
June 2018 75

Projected regulatory capital levels are calculated
under the applicable regulatory capital framework to
incorporate, as appropriate, projected levels of non-
common capital and certain items that are subject to
adjustment or deduction in capital. Some items, such
as debt valuation adjustments (DVA), goodwill, and
intangible assets (other than mortgage servicing
assets), and components of accumulated other com-
prehensive income (AOCI) other than unrealized
gains (losses) on available-for-sale (AFS) securities,
are generally assumed to remain constant at their
starting value over the planning horizon. For other
items, firm projections—with supervisory adjust-
ments—are factored into the regulatory capital cal-
culation. Those items include the reported path of
additional tier 1 and tier 2 capital and significant
investments in the capital of unconsolidated finan-
cial institutions in the form of common stock. Other
items subject to deduction, including DTAs and
mortgage servicing assets, are projected under each
supervisory scenario. The Federal Reserve also
includes the effects of certain planned mergers,
acquisitions, or divestitures in its projections of capi-
tal and the components of capital.
The projections of regulatory capital levels are com-
bined with Federal Reserve projections of total assets
for the leverage ratio, total assets and off-balance
sheet exposures for the supplementary leverage ratio,
and RWAs to calculate regulatory capital ratios. The
risk-based regulatory capital ratios use RWAs calcu-
lated under the standardized approach.70 RWAs and
on-balance sheet total assets for the leverage ratio are
projected based on supervisory projections of each
firm’s balance sheet. Off-balance sheet items are pro-
jected based on the bank-reported off-balance sheet
SLR exposure and are assumed to grow at the super-
visory model-projected total asset growth rate. The
capital ratio denominators are adjusted for items
subject to adjustment or deduction from capital,
consistent with the projection of each item in the
numerator of the regulatory capital ratios and the
regulatory capital requirements. Projected capital lev-
els and ratios are not adjusted to account for any dif-
ferences between projected and actual performance
of the firms observed at the time the supervisory
stress test results were being produced in the second
quarter of 2018.
Modeling Approaches for IHCsNewly Subject to the SupervisoryStress Test
Six IHCs (new entrant IHCs) became subject to the
supervisory stress test for the first time in 2018.71 For
these firms, the Federal Reserve modified its
approach for modeling revenues and certain types of
losses when the data required to produce a modeled
estimate were not available from the firms. Specifi-
cally, the estimates of PPNR, trading and counter-
party losses, and operational risk losses reflect differ-
ent treatment of these IHCs compared to the other
firms subject to the supervisory stress test. In each
case, the modified approach utilized estimates pro-
duced by these models for the remaining firms in the
stress test. The Federal Reserve used the same mod-
els it uses for all other firms to estimate loan losses
for new entrant IHCs, based on the data the firms
provided.
Since the new entrant IHCs were formed as of
July 1, 2016, the historical data reported for the legal
entity are insufficient to apply the supervisory mod-
els of core PPNR components to those firms. The
modified PPNR projection for the new entrant IHCs
is based on the industry aggregate performance for
each revenue and expense component. The ratio for
each PPNR component to the relevant asset or liabil-
ity balance as of December 31, 2017, is generally set
equal to its median historical value between the first
and fourth quarters of 2017. Over the projection
horizon, this ratio is assumed to move by the same
number of basis points as the aggregate ratio for the
industry excluding the six new entrant IHCs.
issuances related to expensed employee compensation or inconnection with a planned merger or acquisition to the extentthat the merger or acquisition is reflected in the covered compa-ny’s pro forma balance sheet estimates; (ii) payments on anyother instrument that is eligible for inclusion in the numeratorof a regulatory capital ratio equal to the stated dividend, inter-est, or principal due on such instrument during the quarter; (iii)an assumption of no redemption or repurchase of any capitalinstrument that is eligible for inclusion in the numerator of aregulatory capital ratio; and (iv) an assumption of no issuancesof common stock or preferred stock, except for issuancesrelated to expensed employee compensation or in connectionwith a planned merger or acquisition to the extent that themerger or acquisition is reflected in the covered company’s proforma balance sheet estimates.
70 See 12 CFR part 217.
71 The firms that are newly subject to the supervisory stress test in2018 are Barclays US LLC; BNP Paribas USA, Inc.; CreditSuisse Holdings (USA), Inc.; Deutsche Bank USA Corp; RBCUSA Holdco Corporation; and UBS Americas Holding LLC.These firms became subject to the capital plan rule and wererequired to submit capital plans to the Federal Reserve for thefirst time in 2017. The Board’s decisions regarding the capitalplans of these firms and the results of these firms’ company-run stress tests were not disclosed.
76 Supervisory Stress Test Methodology and Results
Aggregate PPNR exclusive of operational risk in the
severely adverse scenario was $20.2 billion for the six
IHCs newly subject to the supervisory stress test.
Five of the new entrant IHCs have significant trad-
ing activity and will be subject to the full global mar-
ket shock component in DFAST 2019.72 In DFAST
2018, the Federal Reserve applied a supervisory mar-
ket risk component to the five new entrant IHCs and
HSBC. Specifically, the Federal Reserve applied loss
rates to certain exposures, based on the losses result-
ing from the global market shock and large counter-
party default components for the six domestic firms
in 2014–17. The following loss rates were applied to
the applicable measure of exposures as of Decem-
ber 31, 2017:
• Securitized products losses: 22.1 percent loss rate
in the adverse scenario and 46.4 percent loss rate in
the severely adverse scenario to certain loans and
credits held for trading.73
• Trading mark-to-market and trading incremental
default risk losses: 1.4 percent loss rate in the
adverse scenario and 1.8 percent loss rate in the
severely adverse scenario to market risk-weighted
assets.74
• Credit valuation adjustments: 1.3 percent loss rate
in the adverse scenario and 2.8 percent loss rate in
the severely adverse scenario to over-the-counter
derivatives risk-weighted assets.75
• Large counterparty default losses: 1.0 percent loss
rate in the adverse scenario and 1.5 percent loss
rate in the severely adverse scenario to repo-style
transactions and over-the-counter derivatives risk-
weighted assets.76
Operational-risk losses were also projected using a
modified approach for the six new entrant IHCs,
given the lack of a historical measure of total assets
that is consistent over time and across firms. The his-
torical simulation model applied to firms with suffi-
cient historical operational-loss data submitted on
the FR Y-14A and FR Y-14Q reports cannot be
applied to these firms. In the place of the historical
simulation model, a modified model assigned each
IHC newly subject to the supervisory stress test the
average projected loss produced by the historical
simulation model, normalized by total assets. This
modified model scales the average projected loss by
these firms’ total assets as of December 31, 2017.
Instead of calculating each firm’s projected losses as
the average of the regression model and historical
simulation approach described earlier, projected
operational-risk losses for these firms are calculated
as the average of the regression model and the modi-
fied model described above.
72 BNP Paribas USA, Inc., was not subject to the supervisorymarket risk component. HSBC North America Holdings Inc.will be subject to the global market shock component and wassubject to the supervisory market risk component in DFAST2018.
73 Securitized products exposure equals the sum of FR Y-9CHC-D Column A, lines 4.c.; 4.e.; 5.a.(1); 5.a.(2); 5.a.(3); 6.a;6.c.(1); 6.c.(2); 6.c.(3); and 6.c.(4).
74 Trading mark-to-market and trading incremental default riskexposures equals FR Y-9C HC-R.II line 27.
75 Credit valuation adjustment exposure equals the risk-weightedamounts of FR Y-9C HC-R.II line 20.
76 Large counterparty default exposure will equal the risk-weighted amounts of FR Y-9C HC-R.II lines 16 and 20.
June 2018 77


Appendix C: Firm-Specific Results
Tables begin on next page.
79

Table C.1.A. Ally Financial Inc.
Projected stressed capital ratios, risk-weighted assets, losses, revenues, net income beforetaxes, and loan lossesFederal Reserve estimates: Severely adverse scenario
Capital ratios, actual 2017:Q4 and projected2018:Q1–2020:Q1
Percent
Regulatory ratio Actual
2017:Q4
Stressed capital ratios1
Ending Minimum
Common equity tier 1 capital ratio 9.5 6.8 6.8
Tier 1 capital ratio 11.2 8.5 8.5
Total capital ratio 12.9 10.4 10.4
Tier 1 leverage ratio 9.5 7.0 7.0
Supplementary leverage ratio n/a n/a n/a
1 The capital ratios are calculated using capital action assumptions provided
within the Dodd-Frank Act stress testing rule. See 12 CFR 252.56(b). These
projections represent hypothetical estimates that involve an economic outcome
that is more adverse than expected. The minimum capital ratios are for the
period 2018:Q1 to 2020:Q1. Supplementary leverage ratio projections only
include estimates for firms subject to the advanced approaches.
n/a Not applicable.
Projected loan losses, by type of loan, 2018:Q1–2020:Q1
Loan type Billions of
dollars Portfolio loss
rates (percent)1
Loan losses 6.9 5.5
First-lien mortgages, domestic 0.3 2.6
Junior liens and HELOCs, domestic 0.1 8.7
Commercial and industrial2 2.4 5.4
Commercial real estate, domestic 0.1 3.1
Credit cards 0.0 0.0
Other consumer3 3.9 6.3
Other loans4 0.0 7.8
1 Average loan balances used to calculate portfolio loss rates exclude loans held
for sale and loans held for investment under the fair-value option, and are
calculated over nine quarters.2 Commercial and industrial loans include small- and medium-enterprise loans
and corporate cards.3 Other consumer loans include student loans and automobile loans.4 Other loans include international real estate loans.
Risk-weighted assets, actual 2017:Q4 and projected2020:Q1
Billions of dollars
Item Actual
2017:Q4 Projected2020:Q1
Risk-weighted assets1 138.9 144.4
1 For each quarter, risk-weighted assets are calculated under the Board’s
standardized capital risk-based approach in 12 CFR part 217, subpart D.
Projected losses, revenue, and net income before taxesthrough 2020:Q1
Item Billions of
dollars Percent of
average assets1
Pre-provision net revenue2 5.7 3.3
Other revenue3 0.0
less
Provisions 8.3
Realized losses/gains on securities (AFS/HTM) 0.6
Trading and counterparty losses4 0.0
Other losses/gains5 0.1
equals
Net income before taxes -3.3 -1.9
Memo items
Other comprehensive income6 0.0
Other effects on capital Actual 2017:Q4 2020:Q1
AOCI included in capital (billions of dollars)7 0.0 0.0
1 Average assets is the nine-quarter average of total assets.2 Pre-provision net revenue includes losses from operational-risk events and
other real estate owned (OREO) costs.3 Other revenue includes one-time income and (expense) items not included in
pre-provision net revenue.4 Trading and counterparty losses include mark-to-market and credit valuation
adjustment (CVA) losses and losses arising from the counterparty default
scenario component applied to derivatives, securities lending, and repurchase
agreement activities.5 Other losses/gains include projected change in fair value of loans held for sale
and loans held for investment measured under the fair-value option, and
goodwill impairment losses.6 Other comprehensive income (OCI) is only calculated for advanced approaches
firms, and other firms that opt into the advanced approaches treatment of
accumulated other comprehensive income (AOCI).7 Certain aspects of AOCI are subject to transition arrangements for inclusion in
projected regulatory capital. The transition arrangements are 100 percent
included in projected regulatory capital starting in 2018. See 12 CFR
217.300(b)(3).
80 Supervisory Stress Test Methodology and Results

Table C.1.B. Ally Financial Inc.
Projected stressed capital ratios, risk-weighted assets, losses, revenues, net income beforetaxes, and loan lossesFederal Reserve estimates: Adverse scenario
Capital ratios, actual 2017:Q4 and projected2018:Q1–2020:Q1
Percent
Regulatory ratio Actual
2017:Q4
Stressed capital ratios1
Ending Minimum
Common equity tier 1 capital ratio 9.5 7.7 7.7
Tier 1 capital ratio 11.2 9.4 9.4
Total capital ratio 12.9 11.3 11.3
Tier 1 leverage ratio 9.5 7.7 7.7
Supplementary leverage ratio n/a n/a n/a
1 The capital ratios are calculated using capital action assumptions provided
within the Dodd-Frank Act stress testing rule. See 12 CFR 252.56(b). These
projections represent hypothetical estimates that involve an economic outcome
that is more adverse than expected. The minimum capital ratios are for the
period 2018:Q1 to 2020:Q1. Supplementary leverage ratio projections only
include estimates for firms subject to the advanced approaches.
n/a Not applicable.
Projected loan losses, by type of loan, 2018:Q1–2020:Q1
Loan type Billions of
dollars Portfolio loss
rates (percent)1
Loan losses 4.7 3.7
First-lien mortgages, domestic 0.1 1.0
Junior liens and HELOCs, domestic 0.1 4.8
Commercial and industrial2 1.5 3.3
Commercial real estate, domestic 0.1 1.6
Credit cards 0.0 0.0
Other consumer3 3.0 4.7
Other loans4 0.0 4.6
1 Average loan balances used to calculate portfolio loss rates exclude loans held
for sale and loans held for investment under the fair-value option, and are
calculated over nine quarters.2 Commercial and industrial loans include small- and medium-enterprise loans
and corporate cards.3 Other consumer loans include student loans and automobile loans.4 Other loans include international real estate loans.
Risk-weighted assets, actual 2017:Q4 and projected2020:Q1
Billions of dollars
Item Actual
2017:Q4 Projected2020:Q1
Risk-weighted assets1 138.9 147.1
1 For each quarter, risk-weighted assets are calculated under the Board’s
standardized capital risk-based approach in 12 CFR part 217, subpart D.
Projected losses, revenue, and net income before taxesthrough 2020:Q1
Item Billions of
dollars Percent of
average assets1
Pre-provision net revenue2 4.2 2.4
Other revenue3 0.0
less
Provisions 5.5
Realized losses/gains on securities (AFS/HTM) 0.2
Trading and counterparty losses4 0.0
Other losses/gains5 0.1
equals
Net income before taxes -1.5 -0.9
Memo items
Other comprehensive income6 0.0
Other effects on capital Actual 2017:Q4 2020:Q1
AOCI included in capital (billions of dollars)7 0.0 0.0
1 Average assets is the nine-quarter average of total assets.2 Pre-provision net revenue includes losses from operational-risk events and
other real estate owned (OREO) costs.3 Other revenue includes one-time income and (expense) items not included in
pre-provision net revenue.4 Trading and counterparty losses include mark-to-market and credit valuation
adjustment (CVA) losses and losses arising from the counterparty default
scenario component applied to derivatives, securities lending, and repurchase
agreement activities.5 Other losses/gains include projected change in fair value of loans held for sale
and loans held for investment measured under the fair-value option, and
goodwill impairment losses.6 Other comprehensive income (OCI) is only calculated for advanced approaches
firms, and other firms that opt into the advanced approaches treatment of
accumulated other comprehensive income (AOCI).7 Certain aspects of AOCI are subject to transition arrangements for inclusion in
projected regulatory capital. The transition arrangements are 100 percent
included in projected regulatory capital starting in 2018. See 12 CFR
217.300(b)(3).
June 2018 81

Table C.2.A. American Express Company
Projected stressed capital ratios, risk-weighted assets, losses, revenues, net income beforetaxes, and loan lossesFederal Reserve estimates: Severely adverse scenario
Capital ratios, actual 2017:Q4 and projected2018:Q1–2020:Q1
Percent
Regulatory ratio Actual
2017:Q4
Stressed capital ratios1
Ending Minimum
Common equity tier 1 capital ratio 9.0 8.7 7.8
Tier 1 capital ratio 10.1 9.7 8.8
Total capital ratio 11.8 11.3 10.5
Tier 1 leverage ratio 8.6 8.3 7.6
Supplementary leverage ratio n/a 7.1 6.6
1 The capital ratios are calculated using capital action assumptions provided
within the Dodd-Frank Act stress testing rule. See 12 CFR 252.56(b). These
projections represent hypothetical estimates that involve an economic outcome
that is more adverse than expected. The minimum capital ratios are for the
period 2018:Q1 to 2020:Q1. Supplementary leverage ratio projections only
include estimates for firms subject to the advanced approaches.
n/a Not applicable.
Projected loan losses, by type of loan, 2018:Q1–2020:Q1
Loan type Billions of
dollars Portfolio loss
rates (percent)1
Loan losses 12.8 9.7
First-lien mortgages, domestic 0.0 0.0
Junior liens and HELOCs, domestic 0.0 0.0
Commercial and industrial2 4.9 10.6
Commercial real estate, domestic 0.0 0.0
Credit cards 7.8 9.1
Other consumer3 0.2 12.9
Other loans4 0.0 6.6
1 Average loan balances used to calculate portfolio loss rates exclude loans held
for sale and loans held for investment under the fair-value option, and are
calculated over nine quarters.2 Commercial and industrial loans include small- and medium-enterprise loans
and corporate cards.3 Other consumer loans include student loans and automobile loans.4 Other loans include international real estate loans.
Risk-weighted assets, actual 2017:Q4 and projected2020:Q1
Billions of dollars
Item Actual
2017:Q4 Projected2020:Q1
Risk-weighted assets1 145.9 156.5
1 For each quarter, risk-weighted assets are calculated under the Board’s
standardized capital risk-based approach in 12 CFR part 217, subpart D.
Projected losses, revenue, and net income before taxesthrough 2020:Q1
Item Billions of
dollars Percent of
average assets1
Pre-provision net revenue2 21.5 11.4
Other revenue3 0.0
less
Provisions 16.2
Realized losses/gains on securities (AFS/HTM) 0.0
Trading and counterparty losses4 0.0
Other losses/gains5 0.0
equals
Net income before taxes 5.2 2.8
Memo items
Other comprehensive income6 0.0
Other effects on capital Actual 2017:Q4 2020:Q1
AOCI included in capital (billions of dollars)7 -2.3 -2.4
1 Average assets is the nine-quarter average of total assets.2 Pre-provision net revenue includes losses from operational-risk events and
other real estate owned (OREO) costs.3 Other revenue includes one-time income and (expense) items not included in
pre-provision net revenue.4 Trading and counterparty losses include mark-to-market and credit valuation
adjustment (CVA) losses and losses arising from the counterparty default
scenario component applied to derivatives, securities lending, and repurchase
agreement activities.5 Other losses/gains include projected change in fair value of loans held for sale
and loans held for investment measured under the fair-value option, and
goodwill impairment losses.6 Other comprehensive income (OCI) is only calculated for advanced approaches
firms, and other firms that opt into the advanced approaches treatment of
accumulated other comprehensive income (AOCI).7 Certain aspects of AOCI are subject to transition arrangements for inclusion in
projected regulatory capital. The transition arrangements are 100 percent
included in projected regulatory capital starting in 2018. See 12 CFR
217.300(b)(3).
82 Supervisory Stress Test Methodology and Results

Table C.2.B. American Express Company
Projected stressed capital ratios, risk-weighted assets, losses, revenues, net income beforetaxes, and loan lossesFederal Reserve estimates: Adverse scenario
Capital ratios, actual 2017:Q4 and projected2018:Q1–2020:Q1
Percent
Regulatory ratio Actual
2017:Q4
Stressed capital ratios1
Ending Minimum
Common equity tier 1 capital ratio 9.0 10.8 8.8
Tier 1 capital ratio 10.1 11.8 9.8
Total capital ratio 11.8 13.3 11.5
Tier 1 leverage ratio 8.6 9.9 8.5
Supplementary leverage ratio n/a 8.6 7.4
1 The capital ratios are calculated using capital action assumptions provided
within the Dodd-Frank Act stress testing rule. See 12 CFR 252.56(b). These
projections represent hypothetical estimates that involve an economic outcome
that is more adverse than expected. The minimum capital ratios are for the
period 2018:Q1 to 2020:Q1. Supplementary leverage ratio projections only
include estimates for firms subject to the advanced approaches.
n/a Not applicable.
Projected loan losses, by type of loan, 2018:Q1–2020:Q1
Loan type Billions of
dollars Portfolio loss
rates (percent)1
Loan losses 9.5 7.1
First-lien mortgages, domestic 0.0 0.0
Junior liens and HELOCs, domestic 0.0 0.0
Commercial and industrial2 3.6 7.7
Commercial real estate, domestic 0.0 0.0
Credit cards 5.8 6.8
Other consumer3 0.1 10.2
Other loans4 0.0 3.7
1 Average loan balances used to calculate portfolio loss rates exclude loans held
for sale and loans held for investment under the fair-value option, and are
calculated over nine quarters.2 Commercial and industrial loans include small- and medium-enterprise loans
and corporate cards.3 Other consumer loans include student loans and automobile loans.4 Other loans include international real estate loans.
Risk-weighted assets, actual 2017:Q4 and projected2020:Q1
Billions of dollars
Item Actual
2017:Q4 Projected2020:Q1
Risk-weighted assets1 145.9 159.5
1 For each quarter, risk-weighted assets are calculated under the Board’s
standardized capital risk-based approach in 12 CFR part 217, subpart D.
Projected losses, revenue, and net income before taxesthrough 2020:Q1
Item Billions of
dollars Percent of
average assets1
Pre-provision net revenue2 20.6 10.8
Other revenue3 0.0
less
Provisions 11.8
Realized losses/gains on securities (AFS/HTM) 0.0
Trading and counterparty losses4 0.0
Other losses/gains5 0.0
equals
Net income before taxes 8.8 4.6
Memo items
Other comprehensive income6 0.1
Other effects on capital Actual 2017:Q4 2020:Q1
AOCI included in capital (billions of dollars)7 -2.3 -2.4
1 Average assets is the nine-quarter average of total assets.2 Pre-provision net revenue includes losses from operational-risk events and
other real estate owned (OREO) costs.3 Other revenue includes one-time income and (expense) items not included in
pre-provision net revenue.4 Trading and counterparty losses include mark-to-market and credit valuation
adjustment (CVA) losses and losses arising from the counterparty default
scenario component applied to derivatives, securities lending, and repurchase
agreement activities.5 Other losses/gains include projected change in fair value of loans held for sale
and loans held for investment measured under the fair-value option, and
goodwill impairment losses.6 Other comprehensive income (OCI) is only calculated for advanced approaches
firms, and other firms that opt into the advanced approaches treatment of
accumulated other comprehensive income (AOCI).7 Certain aspects of AOCI are subject to transition arrangements for inclusion in
projected regulatory capital. The transition arrangements are 100 percent
included in projected regulatory capital starting in 2018. See 12 CFR
217.300(b)(3).
June 2018 83

Table C.3.A. Bank of America Corporation
Projected stressed capital ratios, risk-weighted assets, losses, revenues, net income beforetaxes, and loan lossesFederal Reserve estimates: Severely adverse scenario
Capital ratios, actual 2017:Q4 and projected2018:Q1–2020:Q1
Percent
Regulatory ratio Actual
2017:Q4
Stressed capital ratios1
Ending Minimum
Common equity tier 1 capital ratio 11.9 8.3 7.9
Tier 1 capital ratio 13.4 9.9 9.5
Total capital ratio 15.9 12.4 12.3
Tier 1 leverage ratio 8.6 6.3 6.1
Supplementary leverage ratio n/a 5.0 4.9
1 The capital ratios are calculated using capital action assumptions provided
within the Dodd-Frank Act stress testing rule. See 12 CFR 252.56(b). These
projections represent hypothetical estimates that involve an economic outcome
that is more adverse than expected. The minimum capital ratios are for the
period 2018:Q1 to 2020:Q1. Supplementary leverage ratio projections only
include estimates for firms subject to the advanced approaches.
n/a Not applicable.
Projected loan losses, by type of loan, 2018:Q1–2020:Q1
Loan type Billions of
dollars Portfolio loss
rates (percent)1
Loan losses 49.7 5.0
First-lien mortgages, domestic 4.7 2.3
Junior liens and HELOCs, domestic 2.8 4.7
Commercial and industrial2 14.9 5.6
Commercial real estate, domestic 5.9 8.1
Credit cards 12.9 13.1
Other consumer3 1.6 2.0
Other loans4 6.9 3.3
1 Average loan balances used to calculate portfolio loss rates exclude loans held
for sale and loans held for investment under the fair-value option, and are
calculated over nine quarters.2 Commercial and industrial loans include small- and medium-enterprise loans
and corporate cards.3 Other consumer loans include student loans and automobile loans.4 Other loans include international real estate loans.
Risk-weighted assets, actual 2017:Q4 and projected2020:Q1
Billions of dollars
Item Actual
2017:Q4 Projected2020:Q1
Risk-weighted assets1 1,433.5 1,501.6
1 For each quarter, risk-weighted assets are calculated under the Board’s
standardized capital risk-based approach in 12 CFR part 217, subpart D.
Projected losses, revenue, and net income before taxesthrough 2020:Q1
Item Billions of
dollars Percent of
average assets1
Pre-provision net revenue2 51.3 2.2
Other revenue3 0.0
less
Provisions 55.8
Realized losses/gains on securities (AFS/HTM) 0.4
Trading and counterparty losses4 17.3
Other losses/gains5 4.4
equals
Net income before taxes -26.6 -1.1
Memo items
Other comprehensive income6 -1.0
Other effects on capital Actual 2017:Q4 2020:Q1
AOCI included in capital (billions of dollars)7 -5.4 -7.2
1 Average assets is the nine-quarter average of total assets.2 Pre-provision net revenue includes losses from operational-risk events and
other real estate owned (OREO) costs.3 Other revenue includes one-time income and (expense) items not included in
pre-provision net revenue.4 Trading and counterparty losses include mark-to-market and credit valuation
adjustment (CVA) losses and losses arising from the counterparty default
scenario component applied to derivatives, securities lending, and repurchase
agreement activities.5 Other losses/gains include projected change in fair value of loans held for sale
and loans held for investment measured under the fair-value option, and
goodwill impairment losses.6 Other comprehensive income (OCI) is only calculated for advanced approaches
firms, and other firms that opt into the advanced approaches treatment of
accumulated other comprehensive income (AOCI).7 Certain aspects of AOCI are subject to transition arrangements for inclusion in
projected regulatory capital. The transition arrangements are 100 percent
included in projected regulatory capital starting in 2018. See 12 CFR
217.300(b)(3).
84 Supervisory Stress Test Methodology and Results

Table C.3.B. Bank of America Corporation
Projected stressed capital ratios, risk-weighted assets, losses, revenues, net income beforetaxes, and loan lossesFederal Reserve estimates: Adverse scenario
Capital ratios, actual 2017:Q4 and projected2018:Q1–2020:Q1
Percent
Regulatory ratio Actual
2017:Q4
Stressed capital ratios1
Ending Minimum
Common equity tier 1 capital ratio 11.9 10.9 10.9
Tier 1 capital ratio 13.4 12.5 12.5
Total capital ratio 15.9 14.7 14.7
Tier 1 leverage ratio 8.6 7.9 7.9
Supplementary leverage ratio n/a 6.4 6.4
1 The capital ratios are calculated using capital action assumptions provided
within the Dodd-Frank Act stress testing rule. See 12 CFR 252.56(b). These
projections represent hypothetical estimates that involve an economic outcome
that is more adverse than expected. The minimum capital ratios are for the
period 2018:Q1 to 2020:Q1. Supplementary leverage ratio projections only
include estimates for firms subject to the advanced approaches.
n/a Not applicable.
Projected loan losses, by type of loan, 2018:Q1–2020:Q1
Loan type Billions of
dollars Portfolio loss
rates (percent)1
Loan losses 28.7 2.9
First-lien mortgages, domestic 1.2 0.6
Junior liens and HELOCs, domestic 0.9 1.6
Commercial and industrial2 9.2 3.4
Commercial real estate, domestic 2.5 3.3
Credit cards 9.6 9.7
Other consumer3 1.1 1.4
Other loans4 4.2 2.0
1 Average loan balances used to calculate portfolio loss rates exclude loans held
for sale and loans held for investment under the fair-value option, and are
calculated over nine quarters.2 Commercial and industrial loans include small- and medium-enterprise loans
and corporate cards.3 Other consumer loans include student loans and automobile loans.4 Other loans include international real estate loans.
Risk-weighted assets, actual 2017:Q4 and projected2020:Q1
Billions of dollars
Item Actual
2017:Q4 Projected2020:Q1
Risk-weighted assets1 1,433.5 1,542.5
1 For each quarter, risk-weighted assets are calculated under the Board’s
standardized capital risk-based approach in 12 CFR part 217, subpart D.
Projected losses, revenue, and net income before taxesthrough 2020:Q1
Item Billions of
dollars Percent of
average assets1
Pre-provision net revenue2 47.8 2.0
Other revenue3 0.0
less
Provisions 28.8
Realized losses/gains on securities (AFS/HTM) 0.2
Trading and counterparty losses4 7.0
Other losses/gains5 3.2
equals
Net income before taxes 8.6 0.4
Memo items
Other comprehensive income6 8.3
Other effects on capital Actual 2017:Q4 2020:Q1
AOCI included in capital (billions of dollars)7 -5.4 2.1
1 Average assets is the nine-quarter average of total assets.2 Pre-provision net revenue includes losses from operational-risk events and
other real estate owned (OREO) costs.3 Other revenue includes one-time income and (expense) items not included in
pre-provision net revenue.4 Trading and counterparty losses include mark-to-market and credit valuation
adjustment (CVA) losses and losses arising from the counterparty default
scenario component applied to derivatives, securities lending, and repurchase
agreement activities.5 Other losses/gains include projected change in fair value of loans held for sale
and loans held for investment measured under the fair-value option, and
goodwill impairment losses.6 Other comprehensive income (OCI) is only calculated for advanced approaches
firms, and other firms that opt into the advanced approaches treatment of
accumulated other comprehensive income (AOCI).7 Certain aspects of AOCI are subject to transition arrangements for inclusion in
projected regulatory capital. The transition arrangements are 100 percent
included in projected regulatory capital starting in 2018. See 12 CFR
217.300(b)(3).
June 2018 85

Table C.4.A. The Bank of New York Mellon Corporation
Projected stressed capital ratios, risk-weighted assets, losses, revenues, net income beforetaxes, and loan lossesFederal Reserve estimates: Severely adverse scenario
Capital ratios, actual 2017:Q4 and projected2018:Q1–2020:Q1
Percent
Regulatory ratio Actual
2017:Q4
Stressed capital ratios1
Ending Minimum
Common equity tier 1 capital ratio 11.9 12.5 9.0
Tier 1 capital ratio 14.2 14.6 11.2
Total capital ratio 15.1 15.8 12.3
Tier 1 leverage ratio 6.6 6.7 5.3
Supplementary leverage ratio n/a 6.2 4.8
1 The capital ratios are calculated using capital action assumptions provided
within the Dodd-Frank Act stress testing rule. See 12 CFR 252.56(b). These
projections represent hypothetical estimates that involve an economic outcome
that is more adverse than expected. The minimum capital ratios are for the
period 2018:Q1 to 2020:Q1. Supplementary leverage ratio projections only
include estimates for firms subject to the advanced approaches.
n/a Not applicable.
Projected loan losses, by type of loan, 2018:Q1–2020:Q1
Loan type Billions of
dollars Portfolio loss
rates (percent)1
Loan losses 2.0 3.1
First-lien mortgages, domestic 0.3 2.5
Junior liens and HELOCs, domestic 0.0 5.4
Commercial and industrial2 0.1 3.1
Commercial real estate, domestic 0.4 10.8
Credit cards 0.0 0.0
Other consumer3 0.3 9.6
Other loans4 0.9 2.1
1 Average loan balances used to calculate portfolio loss rates exclude loans held
for sale and loans held for investment under the fair-value option, and are
calculated over nine quarters.2 Commercial and industrial loans include small- and medium-enterprise loans
and corporate cards.3 Other consumer loans include student loans and automobile loans.4 Other loans include international real estate loans.
Risk-weighted assets, actual 2017:Q4 and projected2020:Q1
Billions of dollars
Item Actual
2017:Q4 Projected2020:Q1
Risk-weighted assets1 155.6 161.7
1 For each quarter, risk-weighted assets are calculated under the Board’s
standardized capital risk-based approach in 12 CFR part 217, subpart D.
Projected losses, revenue, and net income before taxesthrough 2020:Q1
Item Billions of
dollars Percent of
average assets1
Pre-provision net revenue2 11.6 3.0
Other revenue3 0.0
less
Provisions 2.4
Realized losses/gains on securities (AFS/HTM) 0.3
Trading and counterparty losses4 1.9
Other losses/gains5 0.0
equals
Net income before taxes 6.9 1.8
Memo items
Other comprehensive income6 -1.4
Other effects on capital Actual 2017:Q4 2020:Q1
AOCI included in capital (billions of dollars)7 -2.2 -3.8
1 Average assets is the nine-quarter average of total assets.2 Pre-provision net revenue includes losses from operational-risk events and
other real estate owned (OREO) costs.3 Other revenue includes one-time income and (expense) items not included in
pre-provision net revenue.4 Trading and counterparty losses include mark-to-market and credit valuation
adjustment (CVA) losses and losses arising from the counterparty default
scenario component applied to derivatives, securities lending, and repurchase
agreement activities.5 Other losses/gains include projected change in fair value of loans held for sale
and loans held for investment measured under the fair-value option, and
goodwill impairment losses.6 Other comprehensive income (OCI) is only calculated for advanced approaches
firms, and other firms that opt into the advanced approaches treatment of
accumulated other comprehensive income (AOCI).7 Certain aspects of AOCI are subject to transition arrangements for inclusion in
projected regulatory capital. The transition arrangements are 100 percent
included in projected regulatory capital starting in 2018. See 12 CFR
217.300(b)(3).
86 Supervisory Stress Test Methodology and Results

Table C.4.B. The Bank of New York Mellon Corporation
Projected stressed capital ratios, risk-weighted assets, losses, revenues, net income beforetaxes, and loan lossesFederal Reserve estimates: Adverse scenario
Capital ratios, actual 2017:Q4 and projected2018:Q1–2020:Q1
Percent
Regulatory ratio Actual
2017:Q4
Stressed capital ratios1
Ending Minimum
Common equity tier 1 capital ratio 11.9 14.1 12.6
Tier 1 capital ratio 14.2 16.2 14.7
Total capital ratio 15.1 17.2 15.7
Tier 1 leverage ratio 6.6 7.4 6.9
Supplementary leverage ratio n/a 6.8 6.4
1 The capital ratios are calculated using capital action assumptions provided
within the Dodd-Frank Act stress testing rule. See 12 CFR 252.56(b). These
projections represent hypothetical estimates that involve an economic outcome
that is more adverse than expected. The minimum capital ratios are for the
period 2018:Q1 to 2020:Q1. Supplementary leverage ratio projections only
include estimates for firms subject to the advanced approaches.
n/a Not applicable.
Projected loan losses, by type of loan, 2018:Q1–2020:Q1
Loan type Billions of
dollars Portfolio loss
rates (percent)1
Loan losses 1.1 1.8
First-lien mortgages, domestic 0.1 0.9
Junior liens and HELOCs, domestic 0.0 3.0
Commercial and industrial2 0.1 1.9
Commercial real estate, domestic 0.1 3.8
Credit cards 0.0 0.0
Other consumer3 0.3 7.6
Other loans4 0.6 1.4
1 Average loan balances used to calculate portfolio loss rates exclude loans held
for sale and loans held for investment under the fair-value option, and are
calculated over nine quarters.2 Commercial and industrial loans include small- and medium-enterprise loans
and corporate cards.3 Other consumer loans include student loans and automobile loans.4 Other loans include international real estate loans.
Risk-weighted assets, actual 2017:Q4 and projected2020:Q1
Billions of dollars
Item Actual
2017:Q4 Projected2020:Q1
Risk-weighted assets1 155.6 165.1
1 For each quarter, risk-weighted assets are calculated under the Board’s
standardized capital risk-based approach in 12 CFR part 217, subpart D.
Projected losses, revenue, and net income before taxesthrough 2020:Q1
Item Billions of
dollars Percent of
average assets1
Pre-provision net revenue2 9.6 2.5
Other revenue3 0.0
less
Provisions 1.4
Realized losses/gains on securities (AFS/HTM) 0.1
Trading and counterparty losses4 0.4
Other losses/gains5 0.0
equals
Net income before taxes 7.7 2.0
Memo items
Other comprehensive income6 1.0
Other effects on capital Actual 2017:Q4 2020:Q1
AOCI included in capital (billions of dollars)7 -2.2 -1.3
1 Average assets is the nine-quarter average of total assets.2 Pre-provision net revenue includes losses from operational-risk events and
other real estate owned (OREO) costs.3 Other revenue includes one-time income and (expense) items not included in
pre-provision net revenue.4 Trading and counterparty losses include mark-to-market and credit valuation
adjustment (CVA) losses and losses arising from the counterparty default
scenario component applied to derivatives, securities lending, and repurchase
agreement activities.5 Other losses/gains include projected change in fair value of loans held for sale
and loans held for investment measured under the fair-value option, and
goodwill impairment losses.6 Other comprehensive income (OCI) is only calculated for advanced approaches
firms, and other firms that opt into the advanced approaches treatment of
accumulated other comprehensive income (AOCI).7 Certain aspects of AOCI are subject to transition arrangements for inclusion in
projected regulatory capital. The transition arrangements are 100 percent
included in projected regulatory capital starting in 2018. See 12 CFR
217.300(b)(3).
June 2018 87

Table C.5.A. Barclays US LLC
Projected stressed capital ratios, risk-weighted assets, losses, revenues, net income beforetaxes, and loan lossesFederal Reserve estimates: Severely adverse scenario
Capital ratios, actual 2017:Q4 and projected2018:Q1–2020:Q1
Percent
Regulatory ratio Actual
2017:Q4
Stressed capital ratios1
Ending Minimum
Common equity tier 1 capital ratio 13.1 11.3 9.6
Tier 1 capital ratio 15.7 13.8 12.1
Total capital ratio 18.8 16.7 14.8
Tier 1 leverage ratio 8.2 7.1 6.5
Supplementary leverage ratio n/a 5.7 5.3
1 The capital ratios are calculated using capital action assumptions provided
within the Dodd-Frank Act stress testing rule. See 12 CFR 252.56(b). These
projections represent hypothetical estimates that involve an economic outcome
that is more adverse than expected. The minimum capital ratios are for the
period 2018:Q1 to 2020:Q1. Supplementary leverage ratio projections only
include estimates for firms subject to the advanced approaches.
n/a Not applicable.
Projected loan losses, by type of loan, 2018:Q1–2020:Q1
Loan type Billions of
dollars Portfolio loss
rates (percent)1
Loan losses 4.0 10.5
First-lien mortgages, domestic 0.0 0.0
Junior liens and HELOCs, domestic 0.0 0.0
Commercial and industrial2 0.0 24.4
Commercial real estate, domestic 0.0 7.1
Credit cards 3.9 14.7
Other consumer3 0.0 12.9
Other loans4 0.1 0.9
1 Average loan balances used to calculate portfolio loss rates exclude loans held
for sale and loans held for investment under the fair-value option, and are
calculated over nine quarters.2 Commercial and industrial loans include small- and medium-enterprise loans
and corporate cards.3 Other consumer loans include student loans and automobile loans.4 Other loans include international real estate loans.
Risk-weighted assets, actual 2017:Q4 and projected2020:Q1
Billions of dollars
Item Actual
2017:Q4 Projected2020:Q1
Risk-weighted assets1 99.2 103.6
1 For each quarter, risk-weighted assets are calculated under the Board’s
standardized capital risk-based approach in 12 CFR part 217, subpart D.
Projected losses, revenue, and net income before taxesthrough 2020:Q1
Item Billions of
dollars Percent of
average assets1
Pre-provision net revenue2 5.4 3.3
Other revenue3 0.0
less
Provisions 4.2
Realized losses/gains on securities (AFS/HTM) 0.0
Trading and counterparty losses4 1.2
Other losses/gains5 0.1
equals
Net income before taxes -0.1 -0.1
Memo items
Other comprehensive income6 0.0
Other effects on capital Actual 2017:Q4 2020:Q1
AOCI included in capital (billions of dollars)7 -0.1 -0.1
1 Average assets is the nine-quarter average of total assets.2 Pre-provision net revenue includes losses from operational-risk events and
other real estate owned (OREO) costs.3 Other revenue includes one-time income and (expense) items not included in
pre-provision net revenue.4 Trading and counterparty losses include mark-to-market and credit valuation
adjustment (CVA) losses and losses arising from the counterparty default
scenario component applied to derivatives, securities lending, and repurchase
agreement activities.5 Other losses/gains include projected change in fair value of loans held for sale
and loans held for investment measured under the fair-value option, and
goodwill impairment losses.6 Other comprehensive income (OCI) is only calculated for advanced approaches
firms, and other firms that opt into the advanced approaches treatment of
accumulated other comprehensive income (AOCI).7 Certain aspects of AOCI are subject to transition arrangements for inclusion in
projected regulatory capital. The transition arrangements are 100 percent
included in projected regulatory capital starting in 2018. See 12 CFR
217.300(b)(3).
88 Supervisory Stress Test Methodology and Results

Table C.5.B. Barclays US LLC
Projected stressed capital ratios, risk-weighted assets, losses, revenues, net income beforetaxes, and loan lossesFederal Reserve estimates: Adverse scenario
Capital ratios, actual 2017:Q4 and projected2018:Q1–2020:Q1
Percent
Regulatory ratio Actual
2017:Q4
Stressed capital ratios1
Ending Minimum
Common equity tier 1 capital ratio 13.1 12.9 11.2
Tier 1 capital ratio 15.7 15.3 13.7
Total capital ratio 18.8 17.6 16.0
Tier 1 leverage ratio 8.2 7.9 7.3
Supplementary leverage ratio n/a 6.4 5.9
1 The capital ratios are calculated using capital action assumptions provided
within the Dodd-Frank Act stress testing rule. See 12 CFR 252.56(b). These
projections represent hypothetical estimates that involve an economic outcome
that is more adverse than expected. The minimum capital ratios are for the
period 2018:Q1 to 2020:Q1. Supplementary leverage ratio projections only
include estimates for firms subject to the advanced approaches.
n/a Not applicable.
Projected loan losses, by type of loan, 2018:Q1–2020:Q1
Loan type Billions of
dollars Portfolio loss
rates (percent)1
Loan losses 3.1 8.0
First-lien mortgages, domestic 0.0 0.0
Junior liens and HELOCs, domestic 0.0 0.0
Commercial and industrial2 0.0 20.3
Commercial real estate, domestic 0.0 2.4
Credit cards 3.0 11.2
Other consumer3 0.0 10.2
Other loans4 0.1 0.6
1 Average loan balances used to calculate portfolio loss rates exclude loans held
for sale and loans held for investment under the fair-value option, and are
calculated over nine quarters.2 Commercial and industrial loans include small- and medium-enterprise loans
and corporate cards.3 Other consumer loans include student loans and automobile loans.4 Other loans include international real estate loans.
Risk-weighted assets, actual 2017:Q4 and projected2020:Q1
Billions of dollars
Item Actual
2017:Q4 Projected2020:Q1
Risk-weighted assets1 99.2 107.3
1 For each quarter, risk-weighted assets are calculated under the Board’s
standardized capital risk-based approach in 12 CFR part 217, subpart D.
Projected losses, revenue, and net income before taxesthrough 2020:Q1
Item Billions of
dollars Percent of
average assets1
Pre-provision net revenue2 5.9 3.6
Other revenue3 0.0
less
Provisions 3.0
Realized losses/gains on securities (AFS/HTM) 0.0
Trading and counterparty losses4 0.8
Other losses/gains5 0.0
equals
Net income before taxes 2.1 1.3
Memo items
Other comprehensive income6 0.0
Other effects on capital Actual 2017:Q4 2020:Q1
AOCI included in capital (billions of dollars)7 -0.1 -0.1
1 Average assets is the nine-quarter average of total assets.2 Pre-provision net revenue includes losses from operational-risk events and
other real estate owned (OREO) costs.3 Other revenue includes one-time income and (expense) items not included in
pre-provision net revenue.4 Trading and counterparty losses include mark-to-market and credit valuation
adjustment (CVA) losses and losses arising from the counterparty default
scenario component applied to derivatives, securities lending, and repurchase
agreement activities.5 Other losses/gains include projected change in fair value of loans held for sale
and loans held for investment measured under the fair-value option, and
goodwill impairment losses.6 Other comprehensive income (OCI) is only calculated for advanced approaches
firms, and other firms that opt into the advanced approaches treatment of
accumulated other comprehensive income (AOCI).7 Certain aspects of AOCI are subject to transition arrangements for inclusion in
projected regulatory capital. The transition arrangements are 100 percent
included in projected regulatory capital starting in 2018. See 12 CFR
217.300(b)(3).
June 2018 89
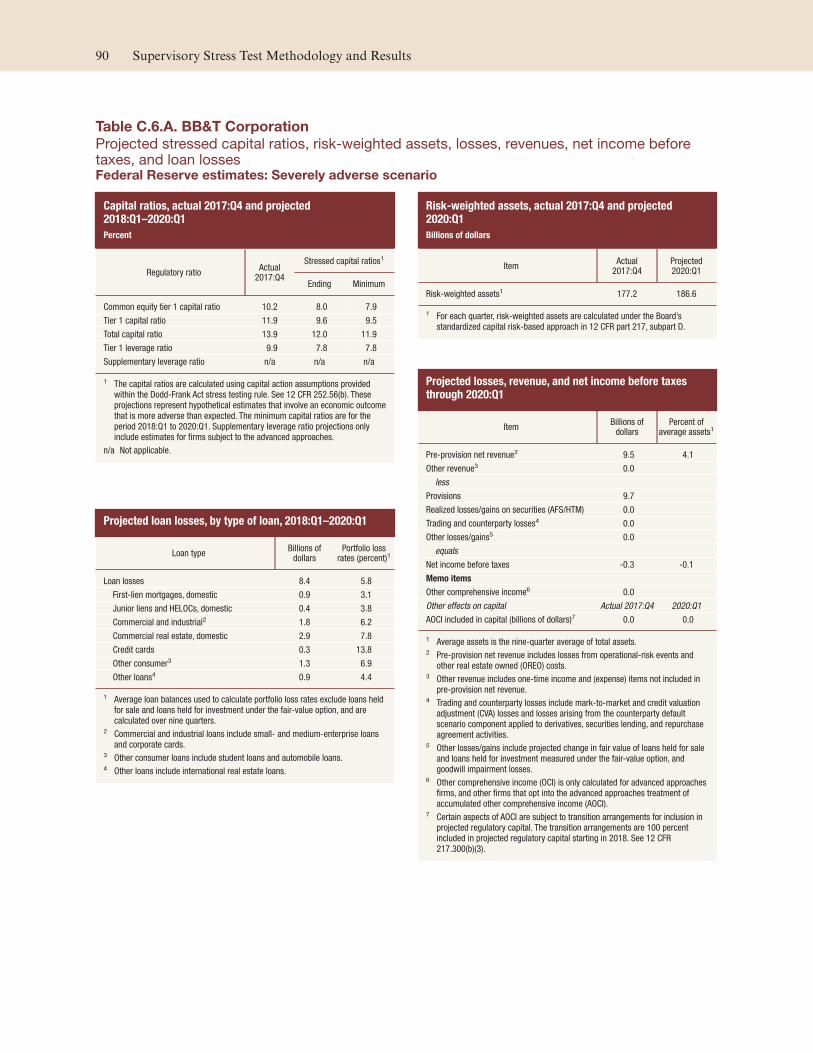
Table C.6.A. BB&T Corporation
Projected stressed capital ratios, risk-weighted assets, losses, revenues, net income beforetaxes, and loan lossesFederal Reserve estimates: Severely adverse scenario
Capital ratios, actual 2017:Q4 and projected2018:Q1–2020:Q1
Percent
Regulatory ratio Actual
2017:Q4
Stressed capital ratios1
Ending Minimum
Common equity tier 1 capital ratio 10.2 8.0 7.9
Tier 1 capital ratio 11.9 9.6 9.5
Total capital ratio 13.9 12.0 11.9
Tier 1 leverage ratio 9.9 7.8 7.8
Supplementary leverage ratio n/a n/a n/a
1 The capital ratios are calculated using capital action assumptions provided
within the Dodd-Frank Act stress testing rule. See 12 CFR 252.56(b). These
projections represent hypothetical estimates that involve an economic outcome
that is more adverse than expected. The minimum capital ratios are for the
period 2018:Q1 to 2020:Q1. Supplementary leverage ratio projections only
include estimates for firms subject to the advanced approaches.
n/a Not applicable.
Projected loan losses, by type of loan, 2018:Q1–2020:Q1
Loan type Billions of
dollars Portfolio loss
rates (percent)1
Loan losses 8.4 5.8
First-lien mortgages, domestic 0.9 3.1
Junior liens and HELOCs, domestic 0.4 3.8
Commercial and industrial2 1.8 6.2
Commercial real estate, domestic 2.9 7.8
Credit cards 0.3 13.8
Other consumer3 1.3 6.9
Other loans4 0.9 4.4
1 Average loan balances used to calculate portfolio loss rates exclude loans held
for sale and loans held for investment under the fair-value option, and are
calculated over nine quarters.2 Commercial and industrial loans include small- and medium-enterprise loans
and corporate cards.3 Other consumer loans include student loans and automobile loans.4 Other loans include international real estate loans.
Risk-weighted assets, actual 2017:Q4 and projected2020:Q1
Billions of dollars
Item Actual
2017:Q4 Projected2020:Q1
Risk-weighted assets1 177.2 186.6
1 For each quarter, risk-weighted assets are calculated under the Board’s
standardized capital risk-based approach in 12 CFR part 217, subpart D.
Projected losses, revenue, and net income before taxesthrough 2020:Q1
Item Billions of
dollars Percent of
average assets1
Pre-provision net revenue2 9.5 4.1
Other revenue3 0.0
less
Provisions 9.7
Realized losses/gains on securities (AFS/HTM) 0.0
Trading and counterparty losses4 0.0
Other losses/gains5 0.0
equals
Net income before taxes -0.3 -0.1
Memo items
Other comprehensive income6 0.0
Other effects on capital Actual 2017:Q4 2020:Q1
AOCI included in capital (billions of dollars)7 0.0 0.0
1 Average assets is the nine-quarter average of total assets.2 Pre-provision net revenue includes losses from operational-risk events and
other real estate owned (OREO) costs.3 Other revenue includes one-time income and (expense) items not included in
pre-provision net revenue.4 Trading and counterparty losses include mark-to-market and credit valuation
adjustment (CVA) losses and losses arising from the counterparty default
scenario component applied to derivatives, securities lending, and repurchase
agreement activities.5 Other losses/gains include projected change in fair value of loans held for sale
and loans held for investment measured under the fair-value option, and
goodwill impairment losses.6 Other comprehensive income (OCI) is only calculated for advanced approaches
firms, and other firms that opt into the advanced approaches treatment of
accumulated other comprehensive income (AOCI).7 Certain aspects of AOCI are subject to transition arrangements for inclusion in
projected regulatory capital. The transition arrangements are 100 percent
included in projected regulatory capital starting in 2018. See 12 CFR
217.300(b)(3).
90 Supervisory Stress Test Methodology and Results

Table C.6.B. BB&T Corporation
Projected stressed capital ratios, risk-weighted assets, losses, revenues, net income beforetaxes, and loan lossesFederal Reserve estimates: Adverse scenario
Capital ratios, actual 2017:Q4 and projected2018:Q1–2020:Q1
Percent
Regulatory ratio Actual
2017:Q4
Stressed capital ratios1
Ending Minimum
Common equity tier 1 capital ratio 10.2 9.3 9.3
Tier 1 capital ratio 11.9 11.0 10.9
Total capital ratio 13.9 13.0 13.0
Tier 1 leverage ratio 9.9 8.8 8.8
Supplementary leverage ratio n/a n/a n/a
1 The capital ratios are calculated using capital action assumptions provided
within the Dodd-Frank Act stress testing rule. See 12 CFR 252.56(b). These
projections represent hypothetical estimates that involve an economic outcome
that is more adverse than expected. The minimum capital ratios are for the
period 2018:Q1 to 2020:Q1. Supplementary leverage ratio projections only
include estimates for firms subject to the advanced approaches.
n/a Not applicable.
Projected loan losses, by type of loan, 2018:Q1–2020:Q1
Loan type Billions of
dollars Portfolio loss
rates (percent)1
Loan losses 4.7 3.2
First-lien mortgages, domestic 0.4 1.4
Junior liens and HELOCs, domestic 0.2 1.9
Commercial and industrial2 1.1 3.9
Commercial real estate, domestic 1.3 3.4
Credit cards 0.2 10.0
Other consumer3 1.0 4.9
Other loans4 0.5 2.5
1 Average loan balances used to calculate portfolio loss rates exclude loans held
for sale and loans held for investment under the fair-value option, and are
calculated over nine quarters.2 Commercial and industrial loans include small- and medium-enterprise loans
and corporate cards.3 Other consumer loans include student loans and automobile loans.4 Other loans include international real estate loans.
Risk-weighted assets, actual 2017:Q4 and projected2020:Q1
Billions of dollars
Item Actual
2017:Q4 Projected2020:Q1
Risk-weighted assets1 177.2 189.3
1 For each quarter, risk-weighted assets are calculated under the Board’s
standardized capital risk-based approach in 12 CFR part 217, subpart D.
Projected losses, revenue, and net income before taxesthrough 2020:Q1
Item Billions of
dollars Percent of
average assets1
Pre-provision net revenue2 8.4 3.6
Other revenue3 0.0
less
Provisions 5.1
Realized losses/gains on securities (AFS/HTM) 0.0
Trading and counterparty losses4 0.0
Other losses/gains5 0.0
equals
Net income before taxes 3.2 1.4
Memo items
Other comprehensive income6 0.0
Other effects on capital Actual 2017:Q4 2020:Q1
AOCI included in capital (billions of dollars)7 0.0 0.0
1 Average assets is the nine-quarter average of total assets.2 Pre-provision net revenue includes losses from operational-risk events and
other real estate owned (OREO) costs.3 Other revenue includes one-time income and (expense) items not included in
pre-provision net revenue.4 Trading and counterparty losses include mark-to-market and credit valuation
adjustment (CVA) losses and losses arising from the counterparty default
scenario component applied to derivatives, securities lending, and repurchase
agreement activities.5 Other losses/gains include projected change in fair value of loans held for sale
and loans held for investment measured under the fair-value option, and
goodwill impairment losses.6 Other comprehensive income (OCI) is only calculated for advanced approaches
firms, and other firms that opt into the advanced approaches treatment of
accumulated other comprehensive income (AOCI).7 Certain aspects of AOCI are subject to transition arrangements for inclusion in
projected regulatory capital. The transition arrangements are 100 percent
included in projected regulatory capital starting in 2018. See 12 CFR
217.300(b)(3).
June 2018 91

Table C.7.A. BBVA Compass Bancshares, Inc.
Projected stressed capital ratios, risk-weighted assets, losses, revenues, net income beforetaxes, and loan lossesFederal Reserve estimates: Severely adverse scenario
Capital ratios, actual 2017:Q4 and projected2018:Q1–2020:Q1
Percent
Regulatory ratio Actual
2017:Q4
Stressed capital ratios1
Ending Minimum
Common equity tier 1 capital ratio 11.8 7.6 7.6
Tier 1 capital ratio 12.1 8.0 8.0
Total capital ratio 14.4 10.3 10.3
Tier 1 leverage ratio 10.0 6.4 6.4
Supplementary leverage ratio n/a n/a n/a
1 The capital ratios are calculated using capital action assumptions provided
within the Dodd-Frank Act stress testing rule. See 12 CFR 252.56(b). These
projections represent hypothetical estimates that involve an economic outcome
that is more adverse than expected. The minimum capital ratios are for the
period 2018:Q1 to 2020:Q1. Supplementary leverage ratio projections only
include estimates for firms subject to the advanced approaches.
n/a Not applicable.
Projected loan losses, by type of loan, 2018:Q1–2020:Q1
Loan type Billions of
dollars Portfolio loss
rates (percent)1
Loan losses 4.4 7.1
First-lien mortgages, domestic 0.7 4.8
Junior liens and HELOCs, domestic 0.2 5.4
Commercial and industrial2 1.5 8.1
Commercial real estate, domestic 1.5 10.4
Credit cards 0.1 16.0
Other consumer3 0.4 7.9
Other loans4 0.2 2.0
1 Average loan balances used to calculate portfolio loss rates exclude loans held
for sale and loans held for investment under the fair-value option, and are
calculated over nine quarters.2 Commercial and industrial loans include small- and medium-enterprise loans
and corporate cards.3 Other consumer loans include student loans and automobile loans.4 Other loans include international real estate loans.
Risk-weighted assets, actual 2017:Q4 and projected2020:Q1
Billions of dollars
Item Actual
2017:Q4 Projected2020:Q1
Risk-weighted assets1 67.5 70.2
1 For each quarter, risk-weighted assets are calculated under the Board’s
standardized capital risk-based approach in 12 CFR part 217, subpart D.
Projected losses, revenue, and net income before taxesthrough 2020:Q1
Item Billions of
dollars Percent of
average assets1
Pre-provision net revenue2 2.5 2.8
Other revenue3 0.0
less
Provisions 4.9
Realized losses/gains on securities (AFS/HTM) 0.0
Trading and counterparty losses4 0.0
Other losses/gains5 0.0
equals
Net income before taxes -2.4 -2.6
Memo items
Other comprehensive income6 0.0
Other effects on capital Actual 2017:Q4 2020:Q1
AOCI included in capital (billions of dollars)7 0.0 0.0
1 Average assets is the nine-quarter average of total assets.2 Pre-provision net revenue includes losses from operational-risk events and
other real estate owned (OREO) costs.3 Other revenue includes one-time income and (expense) items not included in
pre-provision net revenue.4 Trading and counterparty losses include mark-to-market and credit valuation
adjustment (CVA) losses and losses arising from the counterparty default
scenario component applied to derivatives, securities lending, and repurchase
agreement activities.5 Other losses/gains include projected change in fair value of loans held for sale
and loans held for investment measured under the fair-value option, and
goodwill impairment losses.6 Other comprehensive income (OCI) is only calculated for advanced approaches
firms, and other firms that opt into the advanced approaches treatment of
accumulated other comprehensive income (AOCI).7 Certain aspects of AOCI are subject to transition arrangements for inclusion in
projected regulatory capital. The transition arrangements are 100 percent
included in projected regulatory capital starting in 2018. See 12 CFR
217.300(b)(3).
92 Supervisory Stress Test Methodology and Results

Table C.7.B. BBVA Compass Bancshares, Inc.
Projected stressed capital ratios, risk-weighted assets, losses, revenues, net income beforetaxes, and loan lossesFederal Reserve estimates: Adverse scenario
Capital ratios, actual 2017:Q4 and projected2018:Q1–2020:Q1
Percent
Regulatory ratio Actual
2017:Q4
Stressed capital ratios1
Ending Minimum
Common equity tier 1 capital ratio 11.8 10.1 10.1
Tier 1 capital ratio 12.1 10.4 10.4
Total capital ratio 14.4 12.6 12.6
Tier 1 leverage ratio 10.0 8.3 8.3
Supplementary leverage ratio n/a n/a n/a
1 The capital ratios are calculated using capital action assumptions provided
within the Dodd-Frank Act stress testing rule. See 12 CFR 252.56(b). These
projections represent hypothetical estimates that involve an economic outcome
that is more adverse than expected. The minimum capital ratios are for the
period 2018:Q1 to 2020:Q1. Supplementary leverage ratio projections only
include estimates for firms subject to the advanced approaches.
n/a Not applicable.
Projected loan losses, by type of loan, 2018:Q1–2020:Q1
Loan type Billions of
dollars Portfolio loss
rates (percent)1
Loan losses 2.4 3.8
First-lien mortgages, domestic 0.3 2.0
Junior liens and HELOCs, domestic 0.1 2.7
Commercial and industrial2 1.0 5.1
Commercial real estate, domestic 0.6 4.2
Credit cards 0.1 12.4
Other consumer3 0.3 6.4
Other loans4 0.1 1.2
1 Average loan balances used to calculate portfolio loss rates exclude loans held
for sale and loans held for investment under the fair-value option, and are
calculated over nine quarters.2 Commercial and industrial loans include small- and medium-enterprise loans
and corporate cards.3 Other consumer loans include student loans and automobile loans.4 Other loans include international real estate loans.
Risk-weighted assets, actual 2017:Q4 and projected2020:Q1
Billions of dollars
Item Actual
2017:Q4 Projected2020:Q1
Risk-weighted assets1 67.5 71.6
1 For each quarter, risk-weighted assets are calculated under the Board’s
standardized capital risk-based approach in 12 CFR part 217, subpart D.
Projected losses, revenue, and net income before taxesthrough 2020:Q1
Item Billions of
dollars Percent of
average assets1
Pre-provision net revenue2 2.0 2.2
Other revenue3 0.0
less
Provisions 2.4
Realized losses/gains on securities (AFS/HTM) 0.0
Trading and counterparty losses4 0.0
Other losses/gains5 0.0
equals
Net income before taxes -0.4 -0.4
Memo items
Other comprehensive income6 0.0
Other effects on capital Actual 2017:Q4 2020:Q1
AOCI included in capital (billions of dollars)7 0.0 0.0
1 Average assets is the nine-quarter average of total assets.2 Pre-provision net revenue includes losses from operational-risk events and
other real estate owned (OREO) costs.3 Other revenue includes one-time income and (expense) items not included in
pre-provision net revenue.4 Trading and counterparty losses include mark-to-market and credit valuation
adjustment (CVA) losses and losses arising from the counterparty default
scenario component applied to derivatives, securities lending, and repurchase
agreement activities.5 Other losses/gains include projected change in fair value of loans held for sale
and loans held for investment measured under the fair-value option, and
goodwill impairment losses.6 Other comprehensive income (OCI) is only calculated for advanced approaches
firms, and other firms that opt into the advanced approaches treatment of
accumulated other comprehensive income (AOCI).7 Certain aspects of AOCI are subject to transition arrangements for inclusion in
projected regulatory capital. The transition arrangements are 100 percent
included in projected regulatory capital starting in 2018. See 12 CFR
217.300(b)(3).
June 2018 93

Table C.8.A. BMO Financial Corp.
Projected stressed capital ratios, risk-weighted assets, losses, revenues, net income beforetaxes, and loan lossesFederal Reserve estimates: Severely adverse scenario
Capital ratios, actual 2017:Q4 and projected2018:Q1–2020:Q1
Percent
Regulatory ratio Actual
2017:Q4
Stressed capital ratios1
Ending Minimum
Common equity tier 1 capital ratio 12.1 8.3 8.3
Tier 1 capital ratio 12.6 8.9 8.9
Total capital ratio 15.3 12.0 12.0
Tier 1 leverage ratio 9.8 6.8 6.8
Supplementary leverage ratio n/a n/a n/a
1 The capital ratios are calculated using capital action assumptions provided
within the Dodd-Frank Act stress testing rule. See 12 CFR 252.56(b). These
projections represent hypothetical estimates that involve an economic outcome
that is more adverse than expected. The minimum capital ratios are for the
period 2018:Q1 to 2020:Q1. Supplementary leverage ratio projections only
include estimates for firms subject to the advanced approaches.
n/a Not applicable.
Projected loan losses, by type of loan, 2018:Q1–2020:Q1
Loan type Billions of
dollars Portfolio loss
rates (percent)1
Loan losses 4.8 6.5
First-lien mortgages, domestic 0.3 3.3
Junior liens and HELOCs, domestic 0.3 9.6
Commercial and industrial2 2.2 7.3
Commercial real estate, domestic 0.9 8.9
Credit cards 0.1 12.5
Other consumer3 0.1 2.6
Other loans4 0.9 5.6
1 Average loan balances used to calculate portfolio loss rates exclude loans held
for sale and loans held for investment under the fair-value option, and are
calculated over nine quarters.2 Commercial and industrial loans include small- and medium-enterprise loans
and corporate cards.3 Other consumer loans include student loans and automobile loans.4 Other loans include international real estate loans.
Risk-weighted assets, actual 2017:Q4 and projected2020:Q1
Billions of dollars
Item Actual
2017:Q4 Projected2020:Q1
Risk-weighted assets1 99.9 103.6
1 For each quarter, risk-weighted assets are calculated under the Board’s
standardized capital risk-based approach in 12 CFR part 217, subpart D.
Projected losses, revenue, and net income before taxesthrough 2020:Q1
Item Billions of
dollars Percent of
average assets1
Pre-provision net revenue2 2.6 1.9
Other revenue3 0.0
less
Provisions 5.6
Realized losses/gains on securities (AFS/HTM) 0.0
Trading and counterparty losses4 0.0
Other losses/gains5 0.0
equals
Net income before taxes -3.1 -2.3
Memo items
Other comprehensive income6 0.0
Other effects on capital Actual 2017:Q4 2020:Q1
AOCI included in capital (billions of dollars)7 0.0 0.0
1 Average assets is the nine-quarter average of total assets.2 Pre-provision net revenue includes losses from operational-risk events and
other real estate owned (OREO) costs.3 Other revenue includes one-time income and (expense) items not included in
pre-provision net revenue.4 Trading and counterparty losses include mark-to-market and credit valuation
adjustment (CVA) losses and losses arising from the counterparty default
scenario component applied to derivatives, securities lending, and repurchase
agreement activities.5 Other losses/gains include projected change in fair value of loans held for sale
and loans held for investment measured under the fair-value option, and
goodwill impairment losses.6 Other comprehensive income (OCI) is only calculated for advanced approaches
firms, and other firms that opt into the advanced approaches treatment of
accumulated other comprehensive income (AOCI).7 Certain aspects of AOCI are subject to transition arrangements for inclusion in
projected regulatory capital. The transition arrangements are 100 percent
included in projected regulatory capital starting in 2018. See 12 CFR
217.300(b)(3).
94 Supervisory Stress Test Methodology and Results

Table C.8.B. BMO Financial Corp.
Projected stressed capital ratios, risk-weighted assets, losses, revenues, net income beforetaxes, and loan lossesFederal Reserve estimates: Adverse scenario
Capital ratios, actual 2017:Q4 and projected2018:Q1–2020:Q1
Percent
Regulatory ratio Actual
2017:Q4
Stressed capital ratios1
Ending Minimum
Common equity tier 1 capital ratio 12.1 9.9 9.9
Tier 1 capital ratio 12.6 10.6 10.6
Total capital ratio 15.3 13.4 13.4
Tier 1 leverage ratio 9.8 7.9 7.9
Supplementary leverage ratio n/a n/a n/a
1 The capital ratios are calculated using capital action assumptions provided
within the Dodd-Frank Act stress testing rule. See 12 CFR 252.56(b). These
projections represent hypothetical estimates that involve an economic outcome
that is more adverse than expected. The minimum capital ratios are for the
period 2018:Q1 to 2020:Q1. Supplementary leverage ratio projections only
include estimates for firms subject to the advanced approaches.
n/a Not applicable.
Projected loan losses, by type of loan, 2018:Q1–2020:Q1
Loan type Billions of
dollars Portfolio loss
rates (percent)1
Loan losses 2.8 3.8
First-lien mortgages, domestic 0.1 1.4
Junior liens and HELOCs, domestic 0.2 7.0
Commercial and industrial2 1.4 4.7
Commercial real estate, domestic 0.4 3.7
Credit cards 0.0 9.2
Other consumer3 0.1 1.9
Other loans4 0.6 3.4
1 Average loan balances used to calculate portfolio loss rates exclude loans held
for sale and loans held for investment under the fair-value option, and are
calculated over nine quarters.2 Commercial and industrial loans include small- and medium-enterprise loans
and corporate cards.3 Other consumer loans include student loans and automobile loans.4 Other loans include international real estate loans.
Risk-weighted assets, actual 2017:Q4 and projected2020:Q1
Billions of dollars
Item Actual
2017:Q4 Projected2020:Q1
Risk-weighted assets1 99.9 105.7
1 For each quarter, risk-weighted assets are calculated under the Board’s
standardized capital risk-based approach in 12 CFR part 217, subpart D.
Projected losses, revenue, and net income before taxesthrough 2020:Q1
Item Billions of
dollars Percent of
average assets1
Pre-provision net revenue2 2.1 1.5
Other revenue3 0.0
less
Provisions 3.2
Realized losses/gains on securities (AFS/HTM) 0.0
Trading and counterparty losses4 0.0
Other losses/gains5 0.0
equals
Net income before taxes -1.1 -0.8
Memo items
Other comprehensive income6 0.0
Other effects on capital Actual 2017:Q4 2020:Q1
AOCI included in capital (billions of dollars)7 0.0 0.0
1 Average assets is the nine-quarter average of total assets.2 Pre-provision net revenue includes losses from operational-risk events and
other real estate owned (OREO) costs.3 Other revenue includes one-time income and (expense) items not included in
pre-provision net revenue.4 Trading and counterparty losses include mark-to-market and credit valuation
adjustment (CVA) losses and losses arising from the counterparty default
scenario component applied to derivatives, securities lending, and repurchase
agreement activities.5 Other losses/gains include projected change in fair value of loans held for sale
and loans held for investment measured under the fair-value option, and
goodwill impairment losses.6 Other comprehensive income (OCI) is only calculated for advanced approaches
firms, and other firms that opt into the advanced approaches treatment of
accumulated other comprehensive income (AOCI).7 Certain aspects of AOCI are subject to transition arrangements for inclusion in
projected regulatory capital. The transition arrangements are 100 percent
included in projected regulatory capital starting in 2018. See 12 CFR
217.300(b)(3).
June 2018 95

Table C.9.A. BNP Paribas USA, Inc.
Projected stressed capital ratios, risk-weighted assets, losses, revenues, net income beforetaxes, and loan lossesFederal Reserve estimates: Severely adverse scenario
Capital ratios, actual 2017:Q4 and projected2018:Q1–2020:Q1
Percent
Regulatory ratio Actual
2017:Q4
Stressed capital ratios1
Ending Minimum
Common equity tier 1 capital ratio 12.4 7.9 7.9
Tier 1 capital ratio 12.8 8.4 8.4
Total capital ratio 15.0 10.9 10.9
Tier 1 leverage ratio 9.3 5.9 5.9
Supplementary leverage ratio n/a n/a n/a
1 The capital ratios are calculated using capital action assumptions provided
within the Dodd-Frank Act stress testing rule. See 12 CFR 252.56(b). These
projections represent hypothetical estimates that involve an economic outcome
that is more adverse than expected. The minimum capital ratios are for the
period 2018:Q1 to 2020:Q1. Supplementary leverage ratio projections only
include estimates for firms subject to the advanced approaches.
n/a Not applicable.
Projected loan losses, by type of loan, 2018:Q1–2020:Q1
Loan type Billions of
dollars Portfolio loss
rates (percent)1
Loan losses 5.5 7.0
First-lien mortgages, domestic 0.3 2.7
Junior liens and HELOCs, domestic 0.2 5.8
Commercial and industrial2 1.7 10.4
Commercial real estate, domestic 1.7 9.0
Credit cards 0.1 14.7
Other consumer3 1.0 5.6
Other loans4 0.5 5.1
1 Average loan balances used to calculate portfolio loss rates exclude loans held
for sale and loans held for investment under the fair-value option, and are
calculated over nine quarters.2 Commercial and industrial loans include small- and medium-enterprise loans
and corporate cards.3 Other consumer loans include student loans and automobile loans.4 Other loans include international real estate loans.
Risk-weighted assets, actual 2017:Q4 and projected2020:Q1
Billions of dollars
Item Actual
2017:Q4 Projected2020:Q1
Risk-weighted assets1 100.8 104.4
1 For each quarter, risk-weighted assets are calculated under the Board’s
standardized capital risk-based approach in 12 CFR part 217, subpart D.
Projected losses, revenue, and net income before taxesthrough 2020:Q1
Item Billions of
dollars Percent of
average assets1
Pre-provision net revenue2 2.6 1.8
Other revenue3 0.0
less
Provisions 6.6
Realized losses/gains on securities (AFS/HTM) 0.0
Trading and counterparty losses4 0.0
Other losses/gains5 0.0
equals
Net income before taxes -4.0 -2.8
Memo items
Other comprehensive income6 0.0
Other effects on capital Actual 2017:Q4 2020:Q1
AOCI included in capital (billions of dollars)7 0.0 0.0
1 Average assets is the nine-quarter average of total assets.2 Pre-provision net revenue includes losses from operational-risk events and
other real estate owned (OREO) costs.3 Other revenue includes one-time income and (expense) items not included in
pre-provision net revenue.4 Trading and counterparty losses include mark-to-market and credit valuation
adjustment (CVA) losses and losses arising from the counterparty default
scenario component applied to derivatives, securities lending, and repurchase
agreement activities.5 Other losses/gains include projected change in fair value of loans held for sale
and loans held for investment measured under the fair-value option, and
goodwill impairment losses.6 Other comprehensive income (OCI) is only calculated for advanced approaches
firms, and other firms that opt into the advanced approaches treatment of
accumulated other comprehensive income (AOCI).7 Certain aspects of AOCI are subject to transition arrangements for inclusion in
projected regulatory capital. The transition arrangements are 100 percent
included in projected regulatory capital starting in 2018. See 12 CFR
217.300(b)(3).
96 Supervisory Stress Test Methodology and Results

Table C.9.B. BNP Paribas USA, Inc.
Projected stressed capital ratios, risk-weighted assets, losses, revenues, net income beforetaxes, and loan lossesFederal Reserve estimates: Adverse scenario
Capital ratios, actual 2017:Q4 and projected2018:Q1–2020:Q1
Percent
Regulatory ratio Actual
2017:Q4
Stressed capital ratios1
Ending Minimum
Common equity tier 1 capital ratio 12.4 10.0 10.0
Tier 1 capital ratio 12.8 10.5 10.5
Total capital ratio 15.0 12.9 12.9
Tier 1 leverage ratio 9.3 7.4 7.4
Supplementary leverage ratio n/a n/a n/a
1 The capital ratios are calculated using capital action assumptions provided
within the Dodd-Frank Act stress testing rule. See 12 CFR 252.56(b). These
projections represent hypothetical estimates that involve an economic outcome
that is more adverse than expected. The minimum capital ratios are for the
period 2018:Q1 to 2020:Q1. Supplementary leverage ratio projections only
include estimates for firms subject to the advanced approaches.
n/a Not applicable.
Projected loan losses, by type of loan, 2018:Q1–2020:Q1
Loan type Billions of
dollars Portfolio loss
rates (percent)1
Loan losses 3.1 3.9
First-lien mortgages, domestic 0.1 0.9
Junior liens and HELOCs, domestic 0.1 2.6
Commercial and industrial2 1.1 6.5
Commercial real estate, domestic 0.8 4.1
Credit cards 0.0 10.6
Other consumer3 0.6 3.6
Other loans4 0.3 3.3
1 Average loan balances used to calculate portfolio loss rates exclude loans held
for sale and loans held for investment under the fair-value option, and are
calculated over nine quarters.2 Commercial and industrial loans include small- and medium-enterprise loans
and corporate cards.3 Other consumer loans include student loans and automobile loans.4 Other loans include international real estate loans.
Risk-weighted assets, actual 2017:Q4 and projected2020:Q1
Billions of dollars
Item Actual
2017:Q4 Projected2020:Q1
Risk-weighted assets1 100.8 107.6
1 For each quarter, risk-weighted assets are calculated under the Board’s
standardized capital risk-based approach in 12 CFR part 217, subpart D.
Projected losses, revenue, and net income before taxesthrough 2020:Q1
Item Billions of
dollars Percent of
average assets1
Pre-provision net revenue2 2.2 1.5
Other revenue3 0.0
less
Provisions 3.5
Realized losses/gains on securities (AFS/HTM) 0.0
Trading and counterparty losses4 0.0
Other losses/gains5 0.0
equals
Net income before taxes -1.4 -0.9
Memo items
Other comprehensive income6 0.0
Other effects on capital Actual 2017:Q4 2020:Q1
AOCI included in capital (billions of dollars)7 0.0 0.0
1 Average assets is the nine-quarter average of total assets.2 Pre-provision net revenue includes losses from operational-risk events and
other real estate owned (OREO) costs.3 Other revenue includes one-time income and (expense) items not included in
pre-provision net revenue.4 Trading and counterparty losses include mark-to-market and credit valuation
adjustment (CVA) losses and losses arising from the counterparty default
scenario component applied to derivatives, securities lending, and repurchase
agreement activities.5 Other losses/gains include projected change in fair value of loans held for sale
and loans held for investment measured under the fair-value option, and
goodwill impairment losses.6 Other comprehensive income (OCI) is only calculated for advanced approaches
firms, and other firms that opt into the advanced approaches treatment of
accumulated other comprehensive income (AOCI).7 Certain aspects of AOCI are subject to transition arrangements for inclusion in
projected regulatory capital. The transition arrangements are 100 percent
included in projected regulatory capital starting in 2018. See 12 CFR
217.300(b)(3).
June 2018 97

Table C.10.A. Capital One Financial Corporation
Projected stressed capital ratios, risk-weighted assets, losses, revenues, net income beforetaxes, and loan lossesFederal Reserve estimates: Severely adverse scenario
Capital ratios, actual 2017:Q4 and projected2018:Q1–2020:Q1
Percent
Regulatory ratio Actual
2017:Q4
Stressed capital ratios1
Ending Minimum
Common equity tier 1 capital ratio 10.3 5.8 5.7
Tier 1 capital ratio 11.8 7.1 7.1
Total capital ratio 14.4 9.6 9.6
Tier 1 leverage ratio 9.9 6.0 6.0
Supplementary leverage ratio n/a 5.1 5.1
1 The capital ratios are calculated using capital action assumptions provided
within the Dodd-Frank Act stress testing rule. See 12 CFR 252.56(b). These
projections represent hypothetical estimates that involve an economic outcome
that is more adverse than expected. The minimum capital ratios are for the
period 2018:Q1 to 2020:Q1. Supplementary leverage ratio projections only
include estimates for firms subject to the advanced approaches.
n/a Not applicable.
Projected loan losses, by type of loan, 2018:Q1–2020:Q1
Loan type Billions of
dollars Portfolio loss
rates (percent)1
Loan losses 34.8 13.4
First-lien mortgages, domestic 0.1 0.7
Junior liens and HELOCs, domestic 0.1 5.5
Commercial and industrial2 3.8 12.9
Commercial real estate, domestic 2.2 7.3
Credit cards 23.1 21.2
Other consumer3 4.6 8.4
Other loans4 0.9 5.0
1 Average loan balances used to calculate portfolio loss rates exclude loans held
for sale and loans held for investment under the fair-value option, and are
calculated over nine quarters.2 Commercial and industrial loans include small- and medium-enterprise loans
and corporate cards.3 Other consumer loans include student loans and automobile loans.4 Other loans include international real estate loans.
Risk-weighted assets, actual 2017:Q4 and projected2020:Q1
Billions of dollars
Item Actual
2017:Q4 Projected2020:Q1
Risk-weighted assets1 292.2 313.0
1 For each quarter, risk-weighted assets are calculated under the Board’s
standardized capital risk-based approach in 12 CFR part 217, subpart D.
Projected losses, revenue, and net income before taxesthrough 2020:Q1
Item Billions of
dollars Percent of
average assets1
Pre-provision net revenue2 32.0 8.4
Other revenue3 0.0
less
Provisions 39.2
Realized losses/gains on securities (AFS/HTM) 0.2
Trading and counterparty losses4 0.0
Other losses/gains5 0.3
equals
Net income before taxes -7.5 -2.0
Memo items
Other comprehensive income6 -1.2
Other effects on capital Actual 2017:Q4 2020:Q1
AOCI included in capital (billions of dollars)7 -0.6 -1.8
1 Average assets is the nine-quarter average of total assets.2 Pre-provision net revenue includes losses from operational-risk events and
other real estate owned (OREO) costs.3 Other revenue includes one-time income and (expense) items not included in
pre-provision net revenue.4 Trading and counterparty losses include mark-to-market and credit valuation
adjustment (CVA) losses and losses arising from the counterparty default
scenario component applied to derivatives, securities lending, and repurchase
agreement activities.5 Other losses/gains include projected change in fair value of loans held for sale
and loans held for investment measured under the fair-value option, and
goodwill impairment losses.6 Other comprehensive income (OCI) is only calculated for advanced approaches
firms, and other firms that opt into the advanced approaches treatment of
accumulated other comprehensive income (AOCI).7 Certain aspects of AOCI are subject to transition arrangements for inclusion in
projected regulatory capital. The transition arrangements are 100 percent
included in projected regulatory capital starting in 2018. See 12 CFR
217.300(b)(3).
98 Supervisory Stress Test Methodology and Results

Table C.10.B. Capital One Financial Corporation
Projected stressed capital ratios, risk-weighted assets, losses, revenues, net income beforetaxes, and loan lossesFederal Reserve estimates: Adverse scenario
Capital ratios, actual 2017:Q4 and projected2018:Q1–2020:Q1
Percent
Regulatory ratio Actual
2017:Q4
Stressed capital ratios1
Ending Minimum
Common equity tier 1 capital ratio 10.3 9.3 9.0
Tier 1 capital ratio 11.8 10.7 10.4
Total capital ratio 14.4 13.0 12.8
Tier 1 leverage ratio 9.9 8.9 8.8
Supplementary leverage ratio n/a 7.6 7.5
1 The capital ratios are calculated using capital action assumptions provided
within the Dodd-Frank Act stress testing rule. See 12 CFR 252.56(b). These
projections represent hypothetical estimates that involve an economic outcome
that is more adverse than expected. The minimum capital ratios are for the
period 2018:Q1 to 2020:Q1. Supplementary leverage ratio projections only
include estimates for firms subject to the advanced approaches.
n/a Not applicable.
Projected loan losses, by type of loan, 2018:Q1–2020:Q1
Loan type Billions of
dollars Portfolio loss
rates (percent)1
Loan losses 25.7 9.8
First-lien mortgages, domestic 0.0 0.3
Junior liens and HELOCs, domestic 0.1 3.3
Commercial and industrial2 2.5 8.6
Commercial real estate, domestic 0.8 2.7
Credit cards 18.1 16.5
Other consumer3 3.5 6.4
Other loans4 0.5 2.9
1 Average loan balances used to calculate portfolio loss rates exclude loans held
for sale and loans held for investment under the fair-value option, and are
calculated over nine quarters.2 Commercial and industrial loans include small- and medium-enterprise loans
and corporate cards.3 Other consumer loans include student loans and automobile loans.4 Other loans include international real estate loans.
Risk-weighted assets, actual 2017:Q4 and projected2020:Q1
Billions of dollars
Item Actual
2017:Q4 Projected2020:Q1
Risk-weighted assets1 292.2 319.8
1 For each quarter, risk-weighted assets are calculated under the Board’s
standardized capital risk-based approach in 12 CFR part 217, subpart D.
Projected losses, revenue, and net income before taxesthrough 2020:Q1
Item Billions of
dollars Percent of
average assets1
Pre-provision net revenue2 29.6 7.7
Other revenue3 0.0
less
Provisions 27.4
Realized losses/gains on securities (AFS/HTM) 0.1
Trading and counterparty losses4 0.0
Other losses/gains5 0.2
equals
Net income before taxes 1.9 0.5
Memo items
Other comprehensive income6 0.4
Other effects on capital Actual 2017:Q4 2020:Q1
AOCI included in capital (billions of dollars)7 -0.6 -0.3
1 Average assets is the nine-quarter average of total assets.2 Pre-provision net revenue includes losses from operational-risk events and
other real estate owned (OREO) costs.3 Other revenue includes one-time income and (expense) items not included in
pre-provision net revenue.4 Trading and counterparty losses include mark-to-market and credit valuation
adjustment (CVA) losses and losses arising from the counterparty default
scenario component applied to derivatives, securities lending, and repurchase
agreement activities.5 Other losses/gains include projected change in fair value of loans held for sale
and loans held for investment measured under the fair-value option, and
goodwill impairment losses.6 Other comprehensive income (OCI) is only calculated for advanced approaches
firms, and other firms that opt into the advanced approaches treatment of
accumulated other comprehensive income (AOCI).7 Certain aspects of AOCI are subject to transition arrangements for inclusion in
projected regulatory capital. The transition arrangements are 100 percent
included in projected regulatory capital starting in 2018. See 12 CFR
217.300(b)(3).
June 2018 99
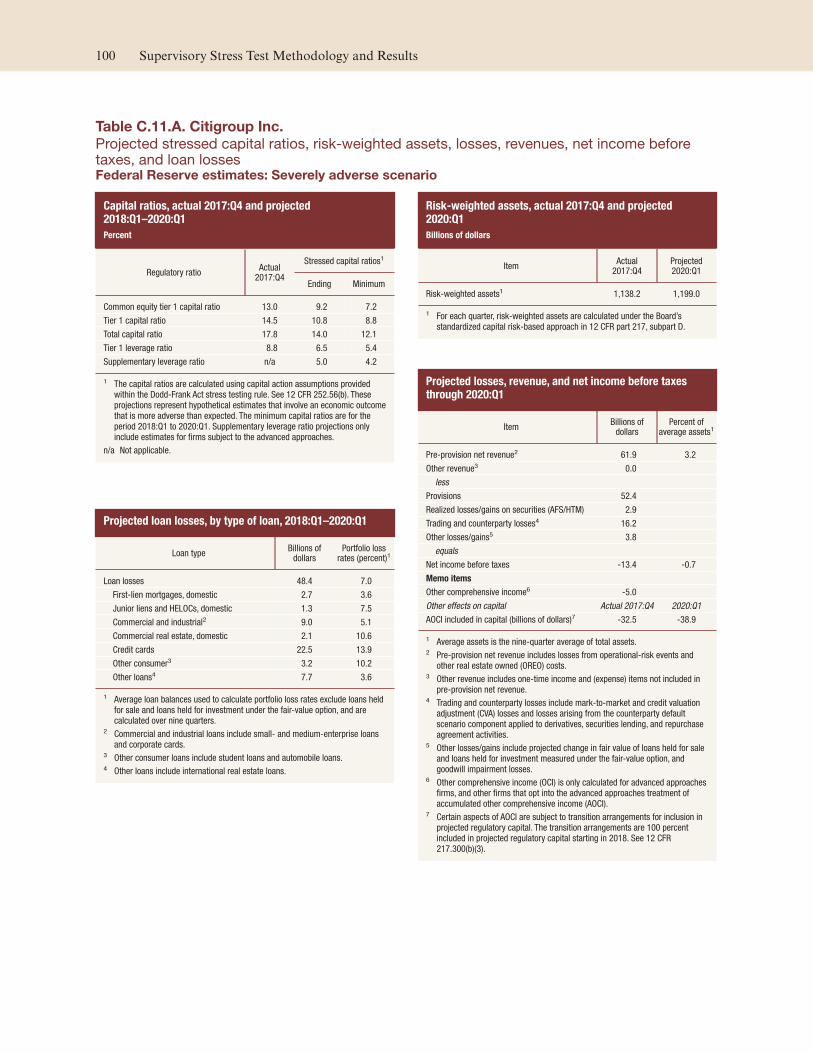
Table C.11.A. Citigroup Inc.
Projected stressed capital ratios, risk-weighted assets, losses, revenues, net income beforetaxes, and loan lossesFederal Reserve estimates: Severely adverse scenario
Capital ratios, actual 2017:Q4 and projected2018:Q1–2020:Q1
Percent
Regulatory ratio Actual
2017:Q4
Stressed capital ratios1
Ending Minimum
Common equity tier 1 capital ratio 13.0 9.2 7.2
Tier 1 capital ratio 14.5 10.8 8.8
Total capital ratio 17.8 14.0 12.1
Tier 1 leverage ratio 8.8 6.5 5.4
Supplementary leverage ratio n/a 5.0 4.2
1 The capital ratios are calculated using capital action assumptions provided
within the Dodd-Frank Act stress testing rule. See 12 CFR 252.56(b). These
projections represent hypothetical estimates that involve an economic outcome
that is more adverse than expected. The minimum capital ratios are for the
period 2018:Q1 to 2020:Q1. Supplementary leverage ratio projections only
include estimates for firms subject to the advanced approaches.
n/a Not applicable.
Projected loan losses, by type of loan, 2018:Q1–2020:Q1
Loan type Billions of
dollars Portfolio loss
rates (percent)1
Loan losses 48.4 7.0
First-lien mortgages, domestic 2.7 3.6
Junior liens and HELOCs, domestic 1.3 7.5
Commercial and industrial2 9.0 5.1
Commercial real estate, domestic 2.1 10.6
Credit cards 22.5 13.9
Other consumer3 3.2 10.2
Other loans4 7.7 3.6
1 Average loan balances used to calculate portfolio loss rates exclude loans held
for sale and loans held for investment under the fair-value option, and are
calculated over nine quarters.2 Commercial and industrial loans include small- and medium-enterprise loans
and corporate cards.3 Other consumer loans include student loans and automobile loans.4 Other loans include international real estate loans.
Risk-weighted assets, actual 2017:Q4 and projected2020:Q1
Billions of dollars
Item Actual
2017:Q4 Projected2020:Q1
Risk-weighted assets1 1,138.2 1,199.0
1 For each quarter, risk-weighted assets are calculated under the Board’s
standardized capital risk-based approach in 12 CFR part 217, subpart D.
Projected losses, revenue, and net income before taxesthrough 2020:Q1
Item Billions of
dollars Percent of
average assets1
Pre-provision net revenue2 61.9 3.2
Other revenue3 0.0
less
Provisions 52.4
Realized losses/gains on securities (AFS/HTM) 2.9
Trading and counterparty losses4 16.2
Other losses/gains5 3.8
equals
Net income before taxes -13.4 -0.7
Memo items
Other comprehensive income6 -5.0
Other effects on capital Actual 2017:Q4 2020:Q1
AOCI included in capital (billions of dollars)7 -32.5 -38.9
1 Average assets is the nine-quarter average of total assets.2 Pre-provision net revenue includes losses from operational-risk events and
other real estate owned (OREO) costs.3 Other revenue includes one-time income and (expense) items not included in
pre-provision net revenue.4 Trading and counterparty losses include mark-to-market and credit valuation
adjustment (CVA) losses and losses arising from the counterparty default
scenario component applied to derivatives, securities lending, and repurchase
agreement activities.5 Other losses/gains include projected change in fair value of loans held for sale
and loans held for investment measured under the fair-value option, and
goodwill impairment losses.6 Other comprehensive income (OCI) is only calculated for advanced approaches
firms, and other firms that opt into the advanced approaches treatment of
accumulated other comprehensive income (AOCI).7 Certain aspects of AOCI are subject to transition arrangements for inclusion in
projected regulatory capital. The transition arrangements are 100 percent
included in projected regulatory capital starting in 2018. See 12 CFR
217.300(b)(3).
100 Supervisory Stress Test Methodology and Results

Table C.11.B. Citigroup Inc.
Projected stressed capital ratios, risk-weighted assets, losses, revenues, net income beforetaxes, and loan lossesFederal Reserve estimates: Adverse scenario
Capital ratios, actual 2017:Q4 and projected2018:Q1–2020:Q1
Percent
Regulatory ratio Actual
2017:Q4
Stressed capital ratios1
Ending Minimum
Common equity tier 1 capital ratio 13.0 12.0 11.0
Tier 1 capital ratio 14.5 13.6 12.6
Total capital ratio 17.8 16.4 15.8
Tier 1 leverage ratio 8.8 8.2 7.7
Supplementary leverage ratio n/a 6.3 5.9
1 The capital ratios are calculated using capital action assumptions provided
within the Dodd-Frank Act stress testing rule. See 12 CFR 252.56(b). These
projections represent hypothetical estimates that involve an economic outcome
that is more adverse than expected. The minimum capital ratios are for the
period 2018:Q1 to 2020:Q1. Supplementary leverage ratio projections only
include estimates for firms subject to the advanced approaches.
n/a Not applicable.
Projected loan losses, by type of loan, 2018:Q1–2020:Q1
Loan type Billions of
dollars Portfolio loss
rates (percent)1
Loan losses 33.2 4.8
First-lien mortgages, domestic 0.9 1.2
Junior liens and HELOCs, domestic 0.5 2.7
Commercial and industrial2 6.2 3.5
Commercial real estate, domestic 0.7 3.6
Credit cards 17.4 10.7
Other consumer3 2.8 9.1
Other loans4 4.7 2.2
1 Average loan balances used to calculate portfolio loss rates exclude loans held
for sale and loans held for investment under the fair-value option, and are
calculated over nine quarters.2 Commercial and industrial loans include small- and medium-enterprise loans
and corporate cards.3 Other consumer loans include student loans and automobile loans.4 Other loans include international real estate loans.
Risk-weighted assets, actual 2017:Q4 and projected2020:Q1
Billions of dollars
Item Actual
2017:Q4 Projected2020:Q1
Risk-weighted assets1 1,138.2 1,233.8
1 For each quarter, risk-weighted assets are calculated under the Board’s
standardized capital risk-based approach in 12 CFR part 217, subpart D.
Projected losses, revenue, and net income before taxesthrough 2020:Q1
Item Billions of
dollars Percent of
average assets1
Pre-provision net revenue2 58.8 3.0
Other revenue3 0.0
less
Provisions 32.9
Realized losses/gains on securities (AFS/HTM) 0.8
Trading and counterparty losses4 7.6
Other losses/gains5 2.5
equals
Net income before taxes 15.0 0.8
Memo items
Other comprehensive income6 3.5
Other effects on capital Actual 2017:Q4 2020:Q1
AOCI included in capital (billions of dollars)7 -32.5 -30.5
1 Average assets is the nine-quarter average of total assets.2 Pre-provision net revenue includes losses from operational-risk events and
other real estate owned (OREO) costs.3 Other revenue includes one-time income and (expense) items not included in
pre-provision net revenue.4 Trading and counterparty losses include mark-to-market and credit valuation
adjustment (CVA) losses and losses arising from the counterparty default
scenario component applied to derivatives, securities lending, and repurchase
agreement activities.5 Other losses/gains include projected change in fair value of loans held for sale
and loans held for investment measured under the fair-value option, and
goodwill impairment losses.6 Other comprehensive income (OCI) is only calculated for advanced approaches
firms, and other firms that opt into the advanced approaches treatment of
accumulated other comprehensive income (AOCI).7 Certain aspects of AOCI are subject to transition arrangements for inclusion in
projected regulatory capital. The transition arrangements are 100 percent
included in projected regulatory capital starting in 2018. See 12 CFR
217.300(b)(3).
June 2018 101

Table C.12.A. Citizens Financial Group, Inc.
Projected stressed capital ratios, risk-weighted assets, losses, revenues, net income beforetaxes, and loan lossesFederal Reserve estimates: Severely adverse scenario
Capital ratios, actual 2017:Q4 and projected2018:Q1–2020:Q1
Percent
Regulatory ratio Actual
2017:Q4
Stressed capital ratios1
Ending Minimum
Common equity tier 1 capital ratio 11.2 6.8 6.8
Tier 1 capital ratio 11.4 6.9 6.9
Total capital ratio 13.9 9.4 9.4
Tier 1 leverage ratio 10.0 5.9 5.9
Supplementary leverage ratio n/a n/a n/a
1 The capital ratios are calculated using capital action assumptions provided
within the Dodd-Frank Act stress testing rule. See 12 CFR 252.56(b). These
projections represent hypothetical estimates that involve an economic outcome
that is more adverse than expected. The minimum capital ratios are for the
period 2018:Q1 to 2020:Q1. Supplementary leverage ratio projections only
include estimates for firms subject to the advanced approaches.
n/a Not applicable.
Projected loan losses, by type of loan, 2018:Q1–2020:Q1
Loan type Billions of
dollars Portfolio loss
rates (percent)1
Loan losses 6.8 6.1
First-lien mortgages, domestic 0.4 2.5
Junior liens and HELOCs, domestic 0.7 4.8
Commercial and industrial2 2.3 7.2
Commercial real estate, domestic 1.5 9.8
Credit cards 0.2 12.3
Other consumer3 1.3 5.6
Other loans4 0.3 4.3
1 Average loan balances used to calculate portfolio loss rates exclude loans held
for sale and loans held for investment under the fair-value option, and are
calculated over nine quarters.2 Commercial and industrial loans include small- and medium-enterprise loans
and corporate cards.3 Other consumer loans include student loans and automobile loans.4 Other loans include international real estate loans.
Risk-weighted assets, actual 2017:Q4 and projected2020:Q1
Billions of dollars
Item Actual
2017:Q4 Projected2020:Q1
Risk-weighted assets1 127.7 132.8
1 For each quarter, risk-weighted assets are calculated under the Board’s
standardized capital risk-based approach in 12 CFR part 217, subpart D.
Projected losses, revenue, and net income before taxesthrough 2020:Q1
Item Billions of
dollars Percent of
average assets1
Pre-provision net revenue2 3.5 2.2
Other revenue3 0.0
less
Provisions 8.0
Realized losses/gains on securities (AFS/HTM) 0.1
Trading and counterparty losses4 0.0
Other losses/gains5 0.1
equals
Net income before taxes -4.6 -2.9
Memo items
Other comprehensive income6 0.0
Other effects on capital Actual 2017:Q4 2020:Q1
AOCI included in capital (billions of dollars)7 0.0 0.0
1 Average assets is the nine-quarter average of total assets.2 Pre-provision net revenue includes losses from operational-risk events and
other real estate owned (OREO) costs.3 Other revenue includes one-time income and (expense) items not included in
pre-provision net revenue.4 Trading and counterparty losses include mark-to-market and credit valuation
adjustment (CVA) losses and losses arising from the counterparty default
scenario component applied to derivatives, securities lending, and repurchase
agreement activities.5 Other losses/gains include projected change in fair value of loans held for sale
and loans held for investment measured under the fair-value option, and
goodwill impairment losses.6 Other comprehensive income (OCI) is only calculated for advanced approaches
firms, and other firms that opt into the advanced approaches treatment of
accumulated other comprehensive income (AOCI).7 Certain aspects of AOCI are subject to transition arrangements for inclusion in
projected regulatory capital. The transition arrangements are 100 percent
included in projected regulatory capital starting in 2018. See 12 CFR
217.300(b)(3).
102 Supervisory Stress Test Methodology and Results

Table C.12.B. Citizens Financial Group, Inc.
Projected stressed capital ratios, risk-weighted assets, losses, revenues, net income beforetaxes, and loan lossesFederal Reserve estimates: Adverse scenario
Capital ratios, actual 2017:Q4 and projected2018:Q1–2020:Q1
Percent
Regulatory ratio Actual
2017:Q4
Stressed capital ratios1
Ending Minimum
Common equity tier 1 capital ratio 11.2 8.4 8.4
Tier 1 capital ratio 11.4 8.6 8.6
Total capital ratio 13.9 11.0 11.0
Tier 1 leverage ratio 10.0 7.3 7.3
Supplementary leverage ratio n/a n/a n/a
1 The capital ratios are calculated using capital action assumptions provided
within the Dodd-Frank Act stress testing rule. See 12 CFR 252.56(b). These
projections represent hypothetical estimates that involve an economic outcome
that is more adverse than expected. The minimum capital ratios are for the
period 2018:Q1 to 2020:Q1. Supplementary leverage ratio projections only
include estimates for firms subject to the advanced approaches.
n/a Not applicable.
Projected loan losses, by type of loan, 2018:Q1–2020:Q1
Loan type Billions of
dollars Portfolio loss
rates (percent)1
Loan losses 4.0 3.6
First-lien mortgages, domestic 0.2 1.1
Junior liens and HELOCs, domestic 0.4 2.7
Commercial and industrial2 1.4 4.3
Commercial real estate, domestic 0.6 4.0
Credit cards 0.2 9.3
Other consumer3 1.1 4.6
Other loans4 0.2 2.4
1 Average loan balances used to calculate portfolio loss rates exclude loans held
for sale and loans held for investment under the fair-value option, and are
calculated over nine quarters.2 Commercial and industrial loans include small- and medium-enterprise loans
and corporate cards.3 Other consumer loans include student loans and automobile loans.4 Other loans include international real estate loans.
Risk-weighted assets, actual 2017:Q4 and projected2020:Q1
Billions of dollars
Item Actual
2017:Q4 Projected2020:Q1
Risk-weighted assets1 127.7 135.5
1 For each quarter, risk-weighted assets are calculated under the Board’s
standardized capital risk-based approach in 12 CFR part 217, subpart D.
Projected losses, revenue, and net income before taxesthrough 2020:Q1
Item Billions of
dollars Percent of
average assets1
Pre-provision net revenue2 2.6 1.6
Other revenue3 0.0
less
Provisions 4.5
Realized losses/gains on securities (AFS/HTM) 0.0
Trading and counterparty losses4 0.0
Other losses/gains5 0.1
equals
Net income before taxes -2.0 -1.3
Memo items
Other comprehensive income6 0.0
Other effects on capital Actual 2017:Q4 2020:Q1
AOCI included in capital (billions of dollars)7 0.0 0.0
1 Average assets is the nine-quarter average of total assets.2 Pre-provision net revenue includes losses from operational-risk events and
other real estate owned (OREO) costs.3 Other revenue includes one-time income and (expense) items not included in
pre-provision net revenue.4 Trading and counterparty losses include mark-to-market and credit valuation
adjustment (CVA) losses and losses arising from the counterparty default
scenario component applied to derivatives, securities lending, and repurchase
agreement activities.5 Other losses/gains include projected change in fair value of loans held for sale
and loans held for investment measured under the fair-value option, and
goodwill impairment losses.6 Other comprehensive income (OCI) is only calculated for advanced approaches
firms, and other firms that opt into the advanced approaches treatment of
accumulated other comprehensive income (AOCI).7 Certain aspects of AOCI are subject to transition arrangements for inclusion in
projected regulatory capital. The transition arrangements are 100 percent
included in projected regulatory capital starting in 2018. See 12 CFR
217.300(b)(3).
June 2018 103

Table C.13.A. Credit Suisse Holdings (USA), Inc.
Projected stressed capital ratios, risk-weighted assets, losses, revenues, net income beforetaxes, and loan lossesFederal Reserve estimates: Severely adverse scenario
Capital ratios, actual 2017:Q4 and projected2018:Q1–2020:Q1
Percent
Regulatory ratio Actual
2017:Q4
Stressed capital ratios1
Ending Minimum
Common equity tier 1 capital ratio 24.7 20.4 17.6
Tier 1 capital ratio 24.7 21.0 18.2
Total capital ratio 24.8 21.1 18.3
Tier 1 leverage ratio 7.3 7.6 6.7
Supplementary leverage ratio n/a 7.4 6.6
1 The capital ratios are calculated using capital action assumptions provided
within the Dodd-Frank Act stress testing rule. See 12 CFR 252.56(b). These
projections represent hypothetical estimates that involve an economic outcome
that is more adverse than expected. The minimum capital ratios are for the
period 2018:Q1 to 2020:Q1. Supplementary leverage ratio projections only
include estimates for firms subject to the advanced approaches.
n/a Not applicable.
Projected loan losses, by type of loan, 2018:Q1–2020:Q1
Loan type Billions of
dollars Portfolio loss
rates (percent)1
Loan losses 0.1 0.6
First-lien mortgages, domestic 0.0 0.0
Junior liens and HELOCs, domestic 0.0 0.0
Commercial and industrial2 0.0 0.0
Commercial real estate, domestic 0.0 0.0
Credit cards 0.0 0.0
Other consumer3 0.0 12.9
Other loans4 0.1 0.6
1 Average loan balances used to calculate portfolio loss rates exclude loans held
for sale and loans held for investment under the fair-value option, and are
calculated over nine quarters.2 Commercial and industrial loans include small- and medium-enterprise loans
and corporate cards.3 Other consumer loans include student loans and automobile loans.4 Other loans include international real estate loans.
Risk-weighted assets, actual 2017:Q4 and projected2020:Q1
Billions of dollars
Item Actual
2017:Q4 Projected2020:Q1
Risk-weighted assets1 65.3 63.5
1 For each quarter, risk-weighted assets are calculated under the Board’s
standardized capital risk-based approach in 12 CFR part 217, subpart D.
Projected losses, revenue, and net income before taxesthrough 2020:Q1
Item Billions of
dollars Percent of
average assets1
Pre-provision net revenue2 1.6 1.1
Other revenue3 0.0
less
Provisions 0.1
Realized losses/gains on securities (AFS/HTM) 0.0
Trading and counterparty losses4 3.5
Other losses/gains5 0.1
equals
Net income before taxes -2.1 -1.4
Memo items
Other comprehensive income6 0.0
Other effects on capital Actual 2017:Q4 2020:Q1
AOCI included in capital (billions of dollars)7 -0.2 -0.2
1 Average assets is the nine-quarter average of total assets.2 Pre-provision net revenue includes losses from operational-risk events and
other real estate owned (OREO) costs.3 Other revenue includes one-time income and (expense) items not included in
pre-provision net revenue.4 Trading and counterparty losses include mark-to-market and credit valuation
adjustment (CVA) losses and losses arising from the counterparty default
scenario component applied to derivatives, securities lending, and repurchase
agreement activities.5 Other losses/gains include projected change in fair value of loans held for sale
and loans held for investment measured under the fair-value option, and
goodwill impairment losses.6 Other comprehensive income (OCI) is only calculated for advanced approaches
firms, and other firms that opt into the advanced approaches treatment of
accumulated other comprehensive income (AOCI).7 Certain aspects of AOCI are subject to transition arrangements for inclusion in
projected regulatory capital. The transition arrangements are 100 percent
included in projected regulatory capital starting in 2018. See 12 CFR
217.300(b)(3).
104 Supervisory Stress Test Methodology and Results

Table C.13.B. Credit Suisse Holdings (USA), Inc.
Projected stressed capital ratios, risk-weighted assets, losses, revenues, net income beforetaxes, and loan lossesFederal Reserve estimates: Adverse scenario
Capital ratios, actual 2017:Q4 and projected2018:Q1–2020:Q1
Percent
Regulatory ratio Actual
2017:Q4
Stressed capital ratios1
Ending Minimum
Common equity tier 1 capital ratio 24.7 21.4 19.8
Tier 1 capital ratio 24.7 21.9 20.3
Total capital ratio 24.8 21.9 20.4
Tier 1 leverage ratio 7.3 8.5 7.9
Supplementary leverage ratio n/a 8.3 7.7
1 The capital ratios are calculated using capital action assumptions provided
within the Dodd-Frank Act stress testing rule. See 12 CFR 252.56(b). These
projections represent hypothetical estimates that involve an economic outcome
that is more adverse than expected. The minimum capital ratios are for the
period 2018:Q1 to 2020:Q1. Supplementary leverage ratio projections only
include estimates for firms subject to the advanced approaches.
n/a Not applicable.
Projected loan losses, by type of loan, 2018:Q1–2020:Q1
Loan type Billions of
dollars Portfolio loss
rates (percent)1
Loan losses 0.1 0.5
First-lien mortgages, domestic 0.0 0.0
Junior liens and HELOCs, domestic 0.0 0.0
Commercial and industrial2 0.0 0.0
Commercial real estate, domestic 0.0 0.0
Credit cards 0.0 0.0
Other consumer3 0.0 10.2
Other loans4 0.1 0.5
1 Average loan balances used to calculate portfolio loss rates exclude loans held
for sale and loans held for investment under the fair-value option, and are
calculated over nine quarters.2 Commercial and industrial loans include small- and medium-enterprise loans
and corporate cards.3 Other consumer loans include student loans and automobile loans.4 Other loans include international real estate loans.
Risk-weighted assets, actual 2017:Q4 and projected2020:Q1
Billions of dollars
Item Actual
2017:Q4 Projected2020:Q1
Risk-weighted assets1 65.3 70.2
1 For each quarter, risk-weighted assets are calculated under the Board’s
standardized capital risk-based approach in 12 CFR part 217, subpart D.
Projected losses, revenue, and net income before taxesthrough 2020:Q1
Item Billions of
dollars Percent of
average assets1
Pre-provision net revenue2 2.1 1.4
Other revenue3 0.0
less
Provisions 0.1
Realized losses/gains on securities (AFS/HTM) 0.0
Trading and counterparty losses4 1.9
Other losses/gains5 0.1
equals
Net income before taxes 0.0 0.0
Memo items
Other comprehensive income6 0.0
Other effects on capital Actual 2017:Q4 2020:Q1
AOCI included in capital (billions of dollars)7 -0.2 -0.2
1 Average assets is the nine-quarter average of total assets.2 Pre-provision net revenue includes losses from operational-risk events and
other real estate owned (OREO) costs.3 Other revenue includes one-time income and (expense) items not included in
pre-provision net revenue.4 Trading and counterparty losses include mark-to-market and credit valuation
adjustment (CVA) losses and losses arising from the counterparty default
scenario component applied to derivatives, securities lending, and repurchase
agreement activities.5 Other losses/gains include projected change in fair value of loans held for sale
and loans held for investment measured under the fair-value option, and
goodwill impairment losses.6 Other comprehensive income (OCI) is only calculated for advanced approaches
firms, and other firms that opt into the advanced approaches treatment of
accumulated other comprehensive income (AOCI).7 Certain aspects of AOCI are subject to transition arrangements for inclusion in
projected regulatory capital. The transition arrangements are 100 percent
included in projected regulatory capital starting in 2018. See 12 CFR
217.300(b)(3).
June 2018 105

Table C.14.A. DB USA Corporation
Projected stressed capital ratios, risk-weighted assets, losses, revenues, net income beforetaxes, and loan lossesFederal Reserve estimates: Severely adverse scenario
Capital ratios, actual 2017:Q4 and projected2018:Q1–2020:Q1
Percent
Regulatory ratio Actual
2017:Q4
Stressed capital ratios1
Ending Minimum
Common equity tier 1 capital ratio 16.5 12.7 12.2
Tier 1 capital ratio 25.9 22.2 21.7
Total capital ratio 25.9 22.5 22.0
Tier 1 leverage ratio 7.2 5.7 5.7
Supplementary leverage ratio n/a 5.2 5.2
1 The capital ratios are calculated using capital action assumptions provided
within the Dodd-Frank Act stress testing rule. See 12 CFR 252.56(b). These
projections represent hypothetical estimates that involve an economic outcome
that is more adverse than expected. The minimum capital ratios are for the
period 2018:Q1 to 2020:Q1. Supplementary leverage ratio projections only
include estimates for firms subject to the advanced approaches.
n/a Not applicable.
Projected loan losses, by type of loan, 2018:Q1–2020:Q1
Loan type Billions of
dollars Portfolio loss
rates (percent)1
Loan losses 0.4 3.1
First-lien mortgages, domestic 0.1 2.8
Junior liens and HELOCs, domestic 0.0 6.9
Commercial and industrial2 0.0 2.4
Commercial real estate, domestic 0.2 7.4
Credit cards 0.0 0.0
Other consumer3 0.0 5.9
Other loans4 0.1 1.3
1 Average loan balances used to calculate portfolio loss rates exclude loans held
for sale and loans held for investment under the fair-value option, and are
calculated over nine quarters.2 Commercial and industrial loans include small- and medium-enterprise loans
and corporate cards.3 Other consumer loans include student loans and automobile loans.4 Other loans include international real estate loans.
Risk-weighted assets, actual 2017:Q4 and projected2020:Q1
Billions of dollars
Item Actual
2017:Q4 Projected2020:Q1
Risk-weighted assets1 44.1 43.9
1 For each quarter, risk-weighted assets are calculated under the Board’s
standardized capital risk-based approach in 12 CFR part 217, subpart D.
Projected losses, revenue, and net income before taxesthrough 2020:Q1
Item Billions of
dollars Percent of
average assets1
Pre-provision net revenue2 0.4 0.3
Other revenue3 0.0
less
Provisions 0.6
Realized losses/gains on securities (AFS/HTM) 0.0
Trading and counterparty losses4 0.8
Other losses/gains5 0.0
equals
Net income before taxes -1.0 -0.6
Memo items
Other comprehensive income6 0.0
Other effects on capital Actual 2017:Q4 2020:Q1
AOCI included in capital (billions of dollars)7 -0.3 -0.3
1 Average assets is the nine-quarter average of total assets.2 Pre-provision net revenue includes losses from operational-risk events and
other real estate owned (OREO) costs.3 Other revenue includes one-time income and (expense) items not included in
pre-provision net revenue.4 Trading and counterparty losses include mark-to-market and credit valuation
adjustment (CVA) losses and losses arising from the counterparty default
scenario component applied to derivatives, securities lending, and repurchase
agreement activities.5 Other losses/gains include projected change in fair value of loans held for sale
and loans held for investment measured under the fair-value option, and
goodwill impairment losses.6 Other comprehensive income (OCI) is only calculated for advanced approaches
firms, and other firms that opt into the advanced approaches treatment of
accumulated other comprehensive income (AOCI).7 Certain aspects of AOCI are subject to transition arrangements for inclusion in
projected regulatory capital. The transition arrangements are 100 percent
included in projected regulatory capital starting in 2018. See 12 CFR
217.300(b)(3).
106 Supervisory Stress Test Methodology and Results

Table C.14.B. DB USA Corporation
Projected stressed capital ratios, risk-weighted assets, losses, revenues, net income beforetaxes, and loan lossesFederal Reserve estimates: Adverse scenario
Capital ratios, actual 2017:Q4 and projected2018:Q1–2020:Q1
Percent
Regulatory ratio Actual
2017:Q4
Stressed capital ratios1
Ending Minimum
Common equity tier 1 capital ratio 16.5 13.6 13.3
Tier 1 capital ratio 25.9 22.4 22.2
Total capital ratio 25.9 22.6 22.4
Tier 1 leverage ratio 7.2 6.1 6.0
Supplementary leverage ratio n/a 5.5 5.5
1 The capital ratios are calculated using capital action assumptions provided
within the Dodd-Frank Act stress testing rule. See 12 CFR 252.56(b). These
projections represent hypothetical estimates that involve an economic outcome
that is more adverse than expected. The minimum capital ratios are for the
period 2018:Q1 to 2020:Q1. Supplementary leverage ratio projections only
include estimates for firms subject to the advanced approaches.
n/a Not applicable.
Projected loan losses, by type of loan, 2018:Q1–2020:Q1
Loan type Billions of
dollars Portfolio loss
rates (percent)1
Loan losses 0.2 1.4
First-lien mortgages, domestic 0.0 1.1
Junior liens and HELOCs, domestic 0.0 3.0
Commercial and industrial2 0.0 1.4
Commercial real estate, domestic 0.1 2.3
Credit cards 0.0 0.0
Other consumer3 0.0 4.7
Other loans4 0.1 0.9
1 Average loan balances used to calculate portfolio loss rates exclude loans held
for sale and loans held for investment under the fair-value option, and are
calculated over nine quarters.2 Commercial and industrial loans include small- and medium-enterprise loans
and corporate cards.3 Other consumer loans include student loans and automobile loans.4 Other loans include international real estate loans.
Risk-weighted assets, actual 2017:Q4 and projected2020:Q1
Billions of dollars
Item Actual
2017:Q4 Projected2020:Q1
Risk-weighted assets1 44.1 47.2
1 For each quarter, risk-weighted assets are calculated under the Board’s
standardized capital risk-based approach in 12 CFR part 217, subpart D.
Projected losses, revenue, and net income before taxesthrough 2020:Q1
Item Billions of
dollars Percent of
average assets1
Pre-provision net revenue2 0.7 0.4
Other revenue3 0.0
less
Provisions 0.3
Realized losses/gains on securities (AFS/HTM) 0.0
Trading and counterparty losses4 0.5
Other losses/gains5 0.0
equals
Net income before taxes -0.1 -0.1
Memo items
Other comprehensive income6 0.0
Other effects on capital Actual 2017:Q4 2020:Q1
AOCI included in capital (billions of dollars)7 -0.3 -0.3
1 Average assets is the nine-quarter average of total assets.2 Pre-provision net revenue includes losses from operational-risk events and
other real estate owned (OREO) costs.3 Other revenue includes one-time income and (expense) items not included in
pre-provision net revenue.4 Trading and counterparty losses include mark-to-market and credit valuation
adjustment (CVA) losses and losses arising from the counterparty default
scenario component applied to derivatives, securities lending, and repurchase
agreement activities.5 Other losses/gains include projected change in fair value of loans held for sale
and loans held for investment measured under the fair-value option, and
goodwill impairment losses.6 Other comprehensive income (OCI) is only calculated for advanced approaches
firms, and other firms that opt into the advanced approaches treatment of
accumulated other comprehensive income (AOCI).7 Certain aspects of AOCI are subject to transition arrangements for inclusion in
projected regulatory capital. The transition arrangements are 100 percent
included in projected regulatory capital starting in 2018. See 12 CFR
217.300(b)(3).
June 2018 107

Table C.15.A. Discover Financial Services
Projected stressed capital ratios, risk-weighted assets, losses, revenues, net income beforetaxes, and loan lossesFederal Reserve estimates: Severely adverse scenario
Capital ratios, actual 2017:Q4 and projected2018:Q1–2020:Q1
Percent
Regulatory ratio Actual
2017:Q4
Stressed capital ratios1
Ending Minimum
Common equity tier 1 capital ratio 11.6 9.5 8.9
Tier 1 capital ratio 12.3 10.1 9.5
Total capital ratio 13.8 11.8 11.3
Tier 1 leverage ratio 10.8 8.8 8.5
Supplementary leverage ratio n/a n/a n/a
1 The capital ratios are calculated using capital action assumptions provided
within the Dodd-Frank Act stress testing rule. See 12 CFR 252.56(b). These
projections represent hypothetical estimates that involve an economic outcome
that is more adverse than expected. The minimum capital ratios are for the
period 2018:Q1 to 2020:Q1. Supplementary leverage ratio projections only
include estimates for firms subject to the advanced approaches.
n/a Not applicable.
Projected loan losses, by type of loan, 2018:Q1–2020:Q1
Loan type Billions of
dollars Portfolio loss
rates (percent)1
Loan losses 12.2 14.2
First-lien mortgages, domestic 0.0 3.3
Junior liens and HELOCs, domestic 0.0 14.8
Commercial and industrial2 0.0 15.1
Commercial real estate, domestic 0.0 18.8
Credit cards 10.3 15.0
Other consumer3 1.9 11.1
Other loans4 0.0 6.5
1 Average loan balances used to calculate portfolio loss rates exclude loans held
for sale and loans held for investment under the fair-value option, and are
calculated over nine quarters.2 Commercial and industrial loans include small- and medium-enterprise loans
and corporate cards.3 Other consumer loans include student loans and automobile loans.4 Other loans include international real estate loans.
Risk-weighted assets, actual 2017:Q4 and projected2020:Q1
Billions of dollars
Item Actual
2017:Q4 Projected2020:Q1
Risk-weighted assets1 86.8 91.9
1 For each quarter, risk-weighted assets are calculated under the Board’s
standardized capital risk-based approach in 12 CFR part 217, subpart D.
Projected losses, revenue, and net income before taxesthrough 2020:Q1
Item Billions of
dollars Percent of
average assets1
Pre-provision net revenue2 14.8 14.3
Other revenue3 0.0
less
Provisions 14.5
Realized losses/gains on securities (AFS/HTM) 0.0
Trading and counterparty losses4 0.0
Other losses/gains5 0.0
equals
Net income before taxes 0.3 0.3
Memo items
Other comprehensive income6 0.0
Other effects on capital Actual 2017:Q4 2020:Q1
AOCI included in capital (billions of dollars)7 0.0 0.0
1 Average assets is the nine-quarter average of total assets.2 Pre-provision net revenue includes losses from operational-risk events and
other real estate owned (OREO) costs.3 Other revenue includes one-time income and (expense) items not included in
pre-provision net revenue.4 Trading and counterparty losses include mark-to-market and credit valuation
adjustment (CVA) losses and losses arising from the counterparty default
scenario component applied to derivatives, securities lending, and repurchase
agreement activities.5 Other losses/gains include projected change in fair value of loans held for sale
and loans held for investment measured under the fair-value option, and
goodwill impairment losses.6 Other comprehensive income (OCI) is only calculated for advanced approaches
firms, and other firms that opt into the advanced approaches treatment of
accumulated other comprehensive income (AOCI).7 Certain aspects of AOCI are subject to transition arrangements for inclusion in
projected regulatory capital. The transition arrangements are 100 percent
included in projected regulatory capital starting in 2018. See 12 CFR
217.300(b)(3).
108 Supervisory Stress Test Methodology and Results

Table C.15.B. Discover Financial Services
Projected stressed capital ratios, risk-weighted assets, losses, revenues, net income beforetaxes, and loan lossesFederal Reserve estimates: Adverse scenario
Capital ratios, actual 2017:Q4 and projected2018:Q1–2020:Q1
Percent
Regulatory ratio Actual
2017:Q4
Stressed capital ratios1
Ending Minimum
Common equity tier 1 capital ratio 11.6 12.2 10.6
Tier 1 capital ratio 12.3 12.8 11.2
Total capital ratio 13.8 14.4 12.7
Tier 1 leverage ratio 10.8 10.9 10.1
Supplementary leverage ratio n/a n/a n/a
1 The capital ratios are calculated using capital action assumptions provided
within the Dodd-Frank Act stress testing rule. See 12 CFR 252.56(b). These
projections represent hypothetical estimates that involve an economic outcome
that is more adverse than expected. The minimum capital ratios are for the
period 2018:Q1 to 2020:Q1. Supplementary leverage ratio projections only
include estimates for firms subject to the advanced approaches.
n/a Not applicable.
Projected loan losses, by type of loan, 2018:Q1–2020:Q1
Loan type Billions of
dollars Portfolio loss
rates (percent)1
Loan losses 9.3 10.7
First-lien mortgages, domestic 0.0 1.4
Junior liens and HELOCs, domestic 0.0 7.1
Commercial and industrial2 0.0 11.2
Commercial real estate, domestic 0.0 6.7
Credit cards 7.7 11.1
Other consumer3 1.6 9.4
Other loans4 0.0 3.7
1 Average loan balances used to calculate portfolio loss rates exclude loans held
for sale and loans held for investment under the fair-value option, and are
calculated over nine quarters.2 Commercial and industrial loans include small- and medium-enterprise loans
and corporate cards.3 Other consumer loans include student loans and automobile loans.4 Other loans include international real estate loans.
Risk-weighted assets, actual 2017:Q4 and projected2020:Q1
Billions of dollars
Item Actual
2017:Q4 Projected2020:Q1
Risk-weighted assets1 86.8 92.6
1 For each quarter, risk-weighted assets are calculated under the Board’s
standardized capital risk-based approach in 12 CFR part 217, subpart D.
Projected losses, revenue, and net income before taxesthrough 2020:Q1
Item Billions of
dollars Percent of
average assets1
Pre-provision net revenue2 14.3 13.5
Other revenue3 0.0
less
Provisions 10.7
Realized losses/gains on securities (AFS/HTM) 0.0
Trading and counterparty losses4 0.0
Other losses/gains5 0.0
equals
Net income before taxes 3.5 3.4
Memo items
Other comprehensive income6 0.0
Other effects on capital Actual 2017:Q4 2020:Q1
AOCI included in capital (billions of dollars)7 0.0 0.0
1 Average assets is the nine-quarter average of total assets.2 Pre-provision net revenue includes losses from operational-risk events and
other real estate owned (OREO) costs.3 Other revenue includes one-time income and (expense) items not included in
pre-provision net revenue.4 Trading and counterparty losses include mark-to-market and credit valuation
adjustment (CVA) losses and losses arising from the counterparty default
scenario component applied to derivatives, securities lending, and repurchase
agreement activities.5 Other losses/gains include projected change in fair value of loans held for sale
and loans held for investment measured under the fair-value option, and
goodwill impairment losses.6 Other comprehensive income (OCI) is only calculated for advanced approaches
firms, and other firms that opt into the advanced approaches treatment of
accumulated other comprehensive income (AOCI).7 Certain aspects of AOCI are subject to transition arrangements for inclusion in
projected regulatory capital. The transition arrangements are 100 percent
included in projected regulatory capital starting in 2018. See 12 CFR
217.300(b)(3).
June 2018 109

Table C.16.A. Fifth Third Bancorp
Projected stressed capital ratios, risk-weighted assets, losses, revenues, net income beforetaxes, and loan lossesFederal Reserve estimates: Severely adverse scenario
Capital ratios, actual 2017:Q4 and projected2018:Q1–2020:Q1
Percent
Regulatory ratio Actual
2017:Q4
Stressed capital ratios1
Ending Minimum
Common equity tier 1 capital ratio 10.6 7.5 7.5
Tier 1 capital ratio 11.7 8.5 8.5
Total capital ratio 15.2 11.8 11.8
Tier 1 leverage ratio 10.0 7.1 7.1
Supplementary leverage ratio n/a n/a n/a
1 The capital ratios are calculated using capital action assumptions provided
within the Dodd-Frank Act stress testing rule. See 12 CFR 252.56(b). These
projections represent hypothetical estimates that involve an economic outcome
that is more adverse than expected. The minimum capital ratios are for the
period 2018:Q1 to 2020:Q1. Supplementary leverage ratio projections only
include estimates for firms subject to the advanced approaches.
n/a Not applicable.
Projected loan losses, by type of loan, 2018:Q1–2020:Q1
Loan type Billions of
dollars Portfolio loss
rates (percent)1
Loan losses 5.7 6.1
First-lien mortgages, domestic 0.5 3.3
Junior liens and HELOCs, domestic 0.3 4.7
Commercial and industrial2 2.2 5.9
Commercial real estate, domestic 1.4 12.8
Credit cards 0.4 18.4
Other consumer3 0.4 3.9
Other loans4 0.4 4.3
1 Average loan balances used to calculate portfolio loss rates exclude loans held
for sale and loans held for investment under the fair-value option, and are
calculated over nine quarters.2 Commercial and industrial loans include small- and medium-enterprise loans
and corporate cards.3 Other consumer loans include student loans and automobile loans.4 Other loans include international real estate loans.
Risk-weighted assets, actual 2017:Q4 and projected2020:Q1
Billions of dollars
Item Actual
2017:Q4 Projected2020:Q1
Risk-weighted assets1 118.0 123.9
1 For each quarter, risk-weighted assets are calculated under the Board’s
standardized capital risk-based approach in 12 CFR part 217, subpart D.
Projected losses, revenue, and net income before taxesthrough 2020:Q1
Item Billions of
dollars Percent of
average assets1
Pre-provision net revenue2 4.3 2.9
Other revenue3 0.0
less
Provisions 6.1
Realized losses/gains on securities (AFS/HTM) 0.2
Trading and counterparty losses4 0.0
Other losses/gains5 0.0
equals
Net income before taxes -2.0 -1.4
Memo items
Other comprehensive income6 0.0
Other effects on capital Actual 2017:Q4 2020:Q1
AOCI included in capital (billions of dollars)7 0.0 0.0
1 Average assets is the nine-quarter average of total assets.2 Pre-provision net revenue includes losses from operational-risk events and
other real estate owned (OREO) costs.3 Other revenue includes one-time income and (expense) items not included in
pre-provision net revenue.4 Trading and counterparty losses include mark-to-market and credit valuation
adjustment (CVA) losses and losses arising from the counterparty default
scenario component applied to derivatives, securities lending, and repurchase
agreement activities.5 Other losses/gains include projected change in fair value of loans held for sale
and loans held for investment measured under the fair-value option, and
goodwill impairment losses.6 Other comprehensive income (OCI) is only calculated for advanced approaches
firms, and other firms that opt into the advanced approaches treatment of
accumulated other comprehensive income (AOCI).7 Certain aspects of AOCI are subject to transition arrangements for inclusion in
projected regulatory capital. The transition arrangements are 100 percent
included in projected regulatory capital starting in 2018. See 12 CFR
217.300(b)(3).
110 Supervisory Stress Test Methodology and Results

Table C.16.B. Fifth Third Bancorp
Projected stressed capital ratios, risk-weighted assets, losses, revenues, net income beforetaxes, and loan lossesFederal Reserve estimates: Adverse scenario
Capital ratios, actual 2017:Q4 and projected2018:Q1–2020:Q1
Percent
Regulatory ratio Actual
2017:Q4
Stressed capital ratios1
Ending Minimum
Common equity tier 1 capital ratio 10.6 9.3 9.2
Tier 1 capital ratio 11.7 10.3 10.3
Total capital ratio 15.2 13.1 13.1
Tier 1 leverage ratio 10.0 8.5 8.5
Supplementary leverage ratio n/a n/a n/a
1 The capital ratios are calculated using capital action assumptions provided
within the Dodd-Frank Act stress testing rule. See 12 CFR 252.56(b). These
projections represent hypothetical estimates that involve an economic outcome
that is more adverse than expected. The minimum capital ratios are for the
period 2018:Q1 to 2020:Q1. Supplementary leverage ratio projections only
include estimates for firms subject to the advanced approaches.
n/a Not applicable.
Projected loan losses, by type of loan, 2018:Q1–2020:Q1
Loan type Billions of
dollars Portfolio loss
rates (percent)1
Loan losses 3.3 3.5
First-lien mortgages, domestic 0.3 2.0
Junior liens and HELOCs, domestic 0.2 2.9
Commercial and industrial2 1.3 3.6
Commercial real estate, domestic 0.6 5.0
Credit cards 0.3 12.8
Other consumer3 0.3 3.0
Other loans4 0.3 2.5
1 Average loan balances used to calculate portfolio loss rates exclude loans held
for sale and loans held for investment under the fair-value option, and are
calculated over nine quarters.2 Commercial and industrial loans include small- and medium-enterprise loans
and corporate cards.3 Other consumer loans include student loans and automobile loans.4 Other loans include international real estate loans.
Risk-weighted assets, actual 2017:Q4 and projected2020:Q1
Billions of dollars
Item Actual
2017:Q4 Projected2020:Q1
Risk-weighted assets1 118.0 125.9
1 For each quarter, risk-weighted assets are calculated under the Board’s
standardized capital risk-based approach in 12 CFR part 217, subpart D.
Projected losses, revenue, and net income before taxesthrough 2020:Q1
Item Billions of
dollars Percent of
average assets1
Pre-provision net revenue2 3.7 2.5
Other revenue3 0.0
less
Provisions 3.1
Realized losses/gains on securities (AFS/HTM) 0.0
Trading and counterparty losses4 0.0
Other losses/gains5 0.0
equals
Net income before taxes 0.6 0.4
Memo items
Other comprehensive income6 0.0
Other effects on capital Actual 2017:Q4 2020:Q1
AOCI included in capital (billions of dollars)7 0.0 0.0
1 Average assets is the nine-quarter average of total assets.2 Pre-provision net revenue includes losses from operational-risk events and
other real estate owned (OREO) costs.3 Other revenue includes one-time income and (expense) items not included in
pre-provision net revenue.4 Trading and counterparty losses include mark-to-market and credit valuation
adjustment (CVA) losses and losses arising from the counterparty default
scenario component applied to derivatives, securities lending, and repurchase
agreement activities.5 Other losses/gains include projected change in fair value of loans held for sale
and loans held for investment measured under the fair-value option, and
goodwill impairment losses.6 Other comprehensive income (OCI) is only calculated for advanced approaches
firms, and other firms that opt into the advanced approaches treatment of
accumulated other comprehensive income (AOCI).7 Certain aspects of AOCI are subject to transition arrangements for inclusion in
projected regulatory capital. The transition arrangements are 100 percent
included in projected regulatory capital starting in 2018. See 12 CFR
217.300(b)(3).
June 2018 111

Table C.17.A. The Goldman Sachs Group, Inc.
Projected stressed capital ratios, risk-weighted assets, losses, revenues, net income beforetaxes, and loan lossesFederal Reserve estimates: Severely adverse scenario
Capital ratios, actual 2017:Q4 and projected2018:Q1–2020:Q1
Percent
Regulatory ratio Actual
2017:Q4
Stressed capital ratios1
Ending Minimum
Common equity tier 1 capital ratio 12.1 6.9 5.6
Tier 1 capital ratio 14.1 8.7 7.3
Total capital ratio 16.8 11.4 10.2
Tier 1 leverage ratio 8.4 5.1 4.4
Supplementary leverage ratio n/a 3.5 3.1
1 The capital ratios are calculated using capital action assumptions provided
within the Dodd-Frank Act stress testing rule. See 12 CFR 252.56(b). These
projections represent hypothetical estimates that involve an economic outcome
that is more adverse than expected. The minimum capital ratios are for the
period 2018:Q1 to 2020:Q1. Supplementary leverage ratio projections only
include estimates for firms subject to the advanced approaches.
n/a Not applicable.
Projected loan losses, by type of loan, 2018:Q1–2020:Q1
Loan type Billions of
dollars Portfolio loss
rates (percent)1
Loan losses 9.6 9.7
First-lien mortgages, domestic 1.6 46.9
Junior liens and HELOCs, domestic 0.0 5.2
Commercial and industrial2 3.4 16.9
Commercial real estate, domestic 0.6 12.2
Credit cards 0.0 0.0
Other consumer3 0.4 8.5
Other loans4 3.7 5.6
1 Average loan balances used to calculate portfolio loss rates exclude loans held
for sale and loans held for investment under the fair-value option, and are
calculated over nine quarters.2 Commercial and industrial loans include small- and medium-enterprise loans
and corporate cards.3 Other consumer loans include student loans and automobile loans.4 Other loans include international real estate loans.
Risk-weighted assets, actual 2017:Q4 and projected2020:Q1
Billions of dollars
Item Actual
2017:Q4 Projected2020:Q1
Risk-weighted assets1 555.6 574.1
1 For each quarter, risk-weighted assets are calculated under the Board’s
standardized capital risk-based approach in 12 CFR part 217, subpart D.
Projected losses, revenue, and net income before taxesthrough 2020:Q1
Item Billions of
dollars Percent of
average assets1
Pre-provision net revenue2 6.1 0.6
Other revenue3 0.0
less
Provisions 11.3
Realized losses/gains on securities (AFS/HTM) 0.0
Trading and counterparty losses4 13.3
Other losses/gains5 6.4
equals
Net income before taxes -25.0 -2.6
Memo items
Other comprehensive income6 0.0
Other effects on capital Actual 2017:Q4 2020:Q1
AOCI included in capital (billions of dollars)7 -1.8 -1.9
1 Average assets is the nine-quarter average of total assets.2 Pre-provision net revenue includes losses from operational-risk events and
other real estate owned (OREO) costs.3 Other revenue includes one-time income and (expense) items not included in
pre-provision net revenue.4 Trading and counterparty losses include mark-to-market and credit valuation
adjustment (CVA) losses and losses arising from the counterparty default
scenario component applied to derivatives, securities lending, and repurchase
agreement activities.5 Other losses/gains include projected change in fair value of loans held for sale
and loans held for investment measured under the fair-value option, and
goodwill impairment losses.6 Other comprehensive income (OCI) is only calculated for advanced approaches
firms, and other firms that opt into the advanced approaches treatment of
accumulated other comprehensive income (AOCI).7 Certain aspects of AOCI are subject to transition arrangements for inclusion in
projected regulatory capital. The transition arrangements are 100 percent
included in projected regulatory capital starting in 2018. See 12 CFR
217.300(b)(3).
112 Supervisory Stress Test Methodology and Results

Table C.17.B. The Goldman Sachs Group, Inc.
Projected stressed capital ratios, risk-weighted assets, losses, revenues, net income beforetaxes, and loan lossesFederal Reserve estimates: Adverse scenario
Capital ratios, actual 2017:Q4 and projected2018:Q1–2020:Q1
Percent
Regulatory ratio Actual
2017:Q4
Stressed capital ratios1
Ending Minimum
Common equity tier 1 capital ratio 12.1 10.2 9.1
Tier 1 capital ratio 14.1 11.9 10.9
Total capital ratio 16.8 14.2 13.5
Tier 1 leverage ratio 8.4 7.1 6.6
Supplementary leverage ratio n/a 4.9 4.6
1 The capital ratios are calculated using capital action assumptions provided
within the Dodd-Frank Act stress testing rule. See 12 CFR 252.56(b). These
projections represent hypothetical estimates that involve an economic outcome
that is more adverse than expected. The minimum capital ratios are for the
period 2018:Q1 to 2020:Q1. Supplementary leverage ratio projections only
include estimates for firms subject to the advanced approaches.
n/a Not applicable.
Projected loan losses, by type of loan, 2018:Q1–2020:Q1
Loan type Billions of
dollars Portfolio loss
rates (percent)1
Loan losses 6.2 6.2
First-lien mortgages, domestic 1.4 40.4
Junior liens and HELOCs, domestic 0.0 2.8
Commercial and industrial2 2.1 10.3
Commercial real estate, domestic 0.2 4.1
Credit cards 0.0 0.0
Other consumer3 0.3 6.9
Other loans4 2.2 3.3
1 Average loan balances used to calculate portfolio loss rates exclude loans held
for sale and loans held for investment under the fair-value option, and are
calculated over nine quarters.2 Commercial and industrial loans include small- and medium-enterprise loans
and corporate cards.3 Other consumer loans include student loans and automobile loans.4 Other loans include international real estate loans.
Risk-weighted assets, actual 2017:Q4 and projected2020:Q1
Billions of dollars
Item Actual
2017:Q4 Projected2020:Q1
Risk-weighted assets1 555.6 611.0
1 For each quarter, risk-weighted assets are calculated under the Board’s
standardized capital risk-based approach in 12 CFR part 217, subpart D.
Projected losses, revenue, and net income before taxesthrough 2020:Q1
Item Billions of
dollars Percent of
average assets1
Pre-provision net revenue2 16.0 1.7
Other revenue3 0.0
less
Provisions 6.9
Realized losses/gains on securities (AFS/HTM) 0.0
Trading and counterparty losses4 6.5
Other losses/gains5 5.4
equals
Net income before taxes -2.8 -0.3
Memo items
Other comprehensive income6 0.5
Other effects on capital Actual 2017:Q4 2020:Q1
AOCI included in capital (billions of dollars)7 -1.8 -1.3
1 Average assets is the nine-quarter average of total assets.2 Pre-provision net revenue includes losses from operational-risk events and
other real estate owned (OREO) costs.3 Other revenue includes one-time income and (expense) items not included in
pre-provision net revenue.4 Trading and counterparty losses include mark-to-market and credit valuation
adjustment (CVA) losses and losses arising from the counterparty default
scenario component applied to derivatives, securities lending, and repurchase
agreement activities.5 Other losses/gains include projected change in fair value of loans held for sale
and loans held for investment measured under the fair-value option, and
goodwill impairment losses.6 Other comprehensive income (OCI) is only calculated for advanced approaches
firms, and other firms that opt into the advanced approaches treatment of
accumulated other comprehensive income (AOCI).7 Certain aspects of AOCI are subject to transition arrangements for inclusion in
projected regulatory capital. The transition arrangements are 100 percent
included in projected regulatory capital starting in 2018. See 12 CFR
217.300(b)(3).
June 2018 113

Table C.18.A. HSBC North America Holdings Inc.
Projected stressed capital ratios, risk-weighted assets, losses, revenues, net income beforetaxes, and loan lossesFederal Reserve estimates: Severely adverse scenario
Capital ratios, actual 2017:Q4 and projected2018:Q1–2020:Q1
Percent
Regulatory ratio Actual
2017:Q4
Stressed capital ratios1
Ending Minimum
Common equity tier 1 capital ratio 15.5 8.1 8.1
Tier 1 capital ratio 18.3 10.9 10.9
Total capital ratio 22.8 15.3 15.3
Tier 1 leverage ratio 8.9 5.2 5.2
Supplementary leverage ratio n/a 4.0 4.0
1 The capital ratios are calculated using capital action assumptions provided
within the Dodd-Frank Act stress testing rule. See 12 CFR 252.56(b). These
projections represent hypothetical estimates that involve an economic outcome
that is more adverse than expected. The minimum capital ratios are for the
period 2018:Q1 to 2020:Q1. Supplementary leverage ratio projections only
include estimates for firms subject to the advanced approaches.
n/a Not applicable.
Projected loan losses, by type of loan, 2018:Q1–2020:Q1
Loan type Billions of
dollars Portfolio loss
rates (percent)1
Loan losses 4.1 6.1
First-lien mortgages, domestic 0.5 3.0
Junior liens and HELOCs, domestic 0.1 5.1
Commercial and industrial2 2.0 7.5
Commercial real estate, domestic 0.9 8.8
Credit cards 0.1 14.7
Other consumer3 0.0 7.1
Other loans4 0.5 4.6
1 Average loan balances used to calculate portfolio loss rates exclude loans held
for sale and loans held for investment under the fair-value option, and are
calculated over nine quarters.2 Commercial and industrial loans include small- and medium-enterprise loans
and corporate cards.3 Other consumer loans include student loans and automobile loans.4 Other loans include international real estate loans.
Risk-weighted assets, actual 2017:Q4 and projected2020:Q1
Billions of dollars
Item Actual
2017:Q4 Projected2020:Q1
Risk-weighted assets1 131.9 136.0
1 For each quarter, risk-weighted assets are calculated under the Board’s
standardized capital risk-based approach in 12 CFR part 217, subpart D.
Projected losses, revenue, and net income before taxesthrough 2020:Q1
Item Billions of
dollars Percent of
average assets1
Pre-provision net revenue2 -0.6 -0.2
Other revenue3 0.0
less
Provisions 4.6
Realized losses/gains on securities (AFS/HTM) 0.0
Trading and counterparty losses4 0.8
Other losses/gains5 0.3
equals
Net income before taxes -6.2 -2.2
Memo items
Other comprehensive income6 0.4
Other effects on capital Actual 2017:Q4 2020:Q1
AOCI included in capital (billions of dollars)7 -0.6 -0.3
1 Average assets is the nine-quarter average of total assets.2 Pre-provision net revenue includes losses from operational-risk events and
other real estate owned (OREO) costs.3 Other revenue includes one-time income and (expense) items not included in
pre-provision net revenue.4 Trading and counterparty losses include mark-to-market and credit valuation
adjustment (CVA) losses and losses arising from the counterparty default
scenario component applied to derivatives, securities lending, and repurchase
agreement activities.5 Other losses/gains include projected change in fair value of loans held for sale
and loans held for investment measured under the fair-value option, and
goodwill impairment losses.6 Other comprehensive income (OCI) is only calculated for advanced approaches
firms, and other firms that opt into the advanced approaches treatment of
accumulated other comprehensive income (AOCI).7 Certain aspects of AOCI are subject to transition arrangements for inclusion in
projected regulatory capital. The transition arrangements are 100 percent
included in projected regulatory capital starting in 2018. See 12 CFR
217.300(b)(3).
114 Supervisory Stress Test Methodology and Results

Table C.18.B. HSBC North America Holdings Inc.
Projected stressed capital ratios, risk-weighted assets, losses, revenues, net income beforetaxes, and loan lossesFederal Reserve estimates: Adverse scenario
Capital ratios, actual 2017:Q4 and projected2018:Q1–2020:Q1
Percent
Regulatory ratio Actual
2017:Q4
Stressed capital ratios1
Ending Minimum
Common equity tier 1 capital ratio 15.5 10.9 10.9
Tier 1 capital ratio 18.3 13.6 13.6
Total capital ratio 22.8 17.4 17.4
Tier 1 leverage ratio 8.9 6.4 6.4
Supplementary leverage ratio n/a 5.0 5.0
1 The capital ratios are calculated using capital action assumptions provided
within the Dodd-Frank Act stress testing rule. See 12 CFR 252.56(b). These
projections represent hypothetical estimates that involve an economic outcome
that is more adverse than expected. The minimum capital ratios are for the
period 2018:Q1 to 2020:Q1. Supplementary leverage ratio projections only
include estimates for firms subject to the advanced approaches.
n/a Not applicable.
Projected loan losses, by type of loan, 2018:Q1–2020:Q1
Loan type Billions of
dollars Portfolio loss
rates (percent)1
Loan losses 2.1 3.2
First-lien mortgages, domestic 0.1 0.8
Junior liens and HELOCs, domestic 0.0 2.5
Commercial and industrial2 1.3 4.8
Commercial real estate, domestic 0.3 2.9
Credit cards 0.1 10.6
Other consumer3 0.0 5.9
Other loans4 0.3 2.7
1 Average loan balances used to calculate portfolio loss rates exclude loans held
for sale and loans held for investment under the fair-value option, and are
calculated over nine quarters.2 Commercial and industrial loans include small- and medium-enterprise loans
and corporate cards.3 Other consumer loans include student loans and automobile loans.4 Other loans include international real estate loans.
Risk-weighted assets, actual 2017:Q4 and projected2020:Q1
Billions of dollars
Item Actual
2017:Q4 Projected2020:Q1
Risk-weighted assets1 131.9 139.6
1 For each quarter, risk-weighted assets are calculated under the Board’s
standardized capital risk-based approach in 12 CFR part 217, subpart D.
Projected losses, revenue, and net income before taxesthrough 2020:Q1
Item Billions of
dollars Percent of
average assets1
Pre-provision net revenue2 -0.6 -0.2
Other revenue3 0.0
less
Provisions 2.1
Realized losses/gains on securities (AFS/HTM) 0.0
Trading and counterparty losses4 0.5
Other losses/gains5 0.2
equals
Net income before taxes -3.3 -1.2
Memo items
Other comprehensive income6 1.4
Other effects on capital Actual 2017:Q4 2020:Q1
AOCI included in capital (billions of dollars)7 -0.6 0.7
1 Average assets is the nine-quarter average of total assets.2 Pre-provision net revenue includes losses from operational-risk events and
other real estate owned (OREO) costs.3 Other revenue includes one-time income and (expense) items not included in
pre-provision net revenue.4 Trading and counterparty losses include mark-to-market and credit valuation
adjustment (CVA) losses and losses arising from the counterparty default
scenario component applied to derivatives, securities lending, and repurchase
agreement activities.5 Other losses/gains include projected change in fair value of loans held for sale
and loans held for investment measured under the fair-value option, and
goodwill impairment losses.6 Other comprehensive income (OCI) is only calculated for advanced approaches
firms, and other firms that opt into the advanced approaches treatment of
accumulated other comprehensive income (AOCI).7 Certain aspects of AOCI are subject to transition arrangements for inclusion in
projected regulatory capital. The transition arrangements are 100 percent
included in projected regulatory capital starting in 2018. See 12 CFR
217.300(b)(3).
June 2018 115

Table C.19.A. Huntington Bancshares Incorporated
Projected stressed capital ratios, risk-weighted assets, losses, revenues, net income beforetaxes, and loan lossesFederal Reserve estimates: Severely adverse scenario
Capital ratios, actual 2017:Q4 and projected2018:Q1–2020:Q1
Percent
Regulatory ratio Actual
2017:Q4
Stressed capital ratios1
Ending Minimum
Common equity tier 1 capital ratio 10.0 8.1 8.1
Tier 1 capital ratio 11.3 9.6 9.6
Total capital ratio 13.4 11.5 11.5
Tier 1 leverage ratio 9.1 7.5 7.5
Supplementary leverage ratio n/a n/a n/a
1 The capital ratios are calculated using capital action assumptions provided
within the Dodd-Frank Act stress testing rule. See 12 CFR 252.56(b). These
projections represent hypothetical estimates that involve an economic outcome
that is more adverse than expected. The minimum capital ratios are for the
period 2018:Q1 to 2020:Q1. Supplementary leverage ratio projections only
include estimates for firms subject to the advanced approaches.
n/a Not applicable.
Projected loan losses, by type of loan, 2018:Q1–2020:Q1
Loan type Billions of
dollars Portfolio loss
rates (percent)1
Loan losses 3.8 5.3
First-lien mortgages, domestic 0.4 3.7
Junior liens and HELOCs, domestic 0.3 3.6
Commercial and industrial2 1.2 6.1
Commercial real estate, domestic 0.9 8.5
Credit cards 0.1 14.7
Other consumer3 0.6 3.8
Other loans4 0.2 4.4
1 Average loan balances used to calculate portfolio loss rates exclude loans held
for sale and loans held for investment under the fair-value option, and are
calculated over nine quarters.2 Commercial and industrial loans include small- and medium-enterprise loans
and corporate cards.3 Other consumer loans include student loans and automobile loans.4 Other loans include international real estate loans.
Risk-weighted assets, actual 2017:Q4 and projected2020:Q1
Billions of dollars
Item Actual
2017:Q4 Projected2020:Q1
Risk-weighted assets1 80.3 84.1
1 For each quarter, risk-weighted assets are calculated under the Board’s
standardized capital risk-based approach in 12 CFR part 217, subpart D.
Projected losses, revenue, and net income before taxesthrough 2020:Q1
Item Billions of
dollars Percent of
average assets1
Pre-provision net revenue2 3.8 3.5
Other revenue3 0.0
less
Provisions 4.3
Realized losses/gains on securities (AFS/HTM) 0.0
Trading and counterparty losses4 0.0
Other losses/gains5 0.0
equals
Net income before taxes -0.6 -0.5
Memo items
Other comprehensive income6 0.0
Other effects on capital Actual 2017:Q4 2020:Q1
AOCI included in capital (billions of dollars)7 0.0 0.0
1 Average assets is the nine-quarter average of total assets.2 Pre-provision net revenue includes losses from operational-risk events and
other real estate owned (OREO) costs.3 Other revenue includes one-time income and (expense) items not included in
pre-provision net revenue.4 Trading and counterparty losses include mark-to-market and credit valuation
adjustment (CVA) losses and losses arising from the counterparty default
scenario component applied to derivatives, securities lending, and repurchase
agreement activities.5 Other losses/gains include projected change in fair value of loans held for sale
and loans held for investment measured under the fair-value option, and
goodwill impairment losses.6 Other comprehensive income (OCI) is only calculated for advanced approaches
firms, and other firms that opt into the advanced approaches treatment of
accumulated other comprehensive income (AOCI).7 Certain aspects of AOCI are subject to transition arrangements for inclusion in
projected regulatory capital. The transition arrangements are 100 percent
included in projected regulatory capital starting in 2018. See 12 CFR
217.300(b)(3).
116 Supervisory Stress Test Methodology and Results

Table C.19.B. Huntington Bancshares Incorporated
Projected stressed capital ratios, risk-weighted assets, losses, revenues, net income beforetaxes, and loan lossesFederal Reserve estimates: Adverse scenario
Capital ratios, actual 2017:Q4 and projected2018:Q1–2020:Q1
Percent
Regulatory ratio Actual
2017:Q4
Stressed capital ratios1
Ending Minimum
Common equity tier 1 capital ratio 10.0 9.1 9.1
Tier 1 capital ratio 11.3 10.5 10.5
Total capital ratio 13.4 12.1 12.1
Tier 1 leverage ratio 9.1 8.1 8.1
Supplementary leverage ratio n/a n/a n/a
1 The capital ratios are calculated using capital action assumptions provided
within the Dodd-Frank Act stress testing rule. See 12 CFR 252.56(b). These
projections represent hypothetical estimates that involve an economic outcome
that is more adverse than expected. The minimum capital ratios are for the
period 2018:Q1 to 2020:Q1. Supplementary leverage ratio projections only
include estimates for firms subject to the advanced approaches.
n/a Not applicable.
Projected loan losses, by type of loan, 2018:Q1–2020:Q1
Loan type Billions of
dollars Portfolio loss
rates (percent)1
Loan losses 2.2 3.0
First-lien mortgages, domestic 0.2 1.7
Junior liens and HELOCs, domestic 0.2 2.1
Commercial and industrial2 0.8 3.8
Commercial real estate, domestic 0.4 3.9
Credit cards 0.1 10.6
Other consumer3 0.4 2.7
Other loans4 0.1 2.5
1 Average loan balances used to calculate portfolio loss rates exclude loans held
for sale and loans held for investment under the fair-value option, and are
calculated over nine quarters.2 Commercial and industrial loans include small- and medium-enterprise loans
and corporate cards.3 Other consumer loans include student loans and automobile loans.4 Other loans include international real estate loans.
Risk-weighted assets, actual 2017:Q4 and projected2020:Q1
Billions of dollars
Item Actual
2017:Q4 Projected2020:Q1
Risk-weighted assets1 80.3 85.3
1 For each quarter, risk-weighted assets are calculated under the Board’s
standardized capital risk-based approach in 12 CFR part 217, subpart D.
Projected losses, revenue, and net income before taxesthrough 2020:Q1
Item Billions of
dollars Percent of
average assets1
Pre-provision net revenue2 2.9 2.6
Other revenue3 0.0
less
Provisions 2.3
Realized losses/gains on securities (AFS/HTM) 0.0
Trading and counterparty losses4 0.0
Other losses/gains5 0.0
equals
Net income before taxes 0.5 0.5
Memo items
Other comprehensive income6 0.0
Other effects on capital Actual 2017:Q4 2020:Q1
AOCI included in capital (billions of dollars)7 0.0 0.0
1 Average assets is the nine-quarter average of total assets.2 Pre-provision net revenue includes losses from operational-risk events and
other real estate owned (OREO) costs.3 Other revenue includes one-time income and (expense) items not included in
pre-provision net revenue.4 Trading and counterparty losses include mark-to-market and credit valuation
adjustment (CVA) losses and losses arising from the counterparty default
scenario component applied to derivatives, securities lending, and repurchase
agreement activities.5 Other losses/gains include projected change in fair value of loans held for sale
and loans held for investment measured under the fair-value option, and
goodwill impairment losses.6 Other comprehensive income (OCI) is only calculated for advanced approaches
firms, and other firms that opt into the advanced approaches treatment of
accumulated other comprehensive income (AOCI).7 Certain aspects of AOCI are subject to transition arrangements for inclusion in
projected regulatory capital. The transition arrangements are 100 percent
included in projected regulatory capital starting in 2018. See 12 CFR
217.300(b)(3).
June 2018 117

Table C.20.A. JPMorgan Chase & Co.
Projected stressed capital ratios, risk-weighted assets, losses, revenues, net income beforetaxes, and loan lossesFederal Reserve estimates: Severely adverse scenario
Capital ratios, actual 2017:Q4 and projected2018:Q1–2020:Q1
Percent
Regulatory ratio Actual
2017:Q4
Stressed capital ratios1
Ending Minimum
Common equity tier 1 capital ratio 12.2 7.9 7.2
Tier 1 capital ratio 13.9 9.5 8.8
Total capital ratio 15.9 11.9 11.0
Tier 1 leverage ratio 8.3 5.6 5.3
Supplementary leverage ratio n/a 4.4 4.2
1 The capital ratios are calculated using capital action assumptions provided
within the Dodd-Frank Act stress testing rule. See 12 CFR 252.56(b). These
projections represent hypothetical estimates that involve an economic outcome
that is more adverse than expected. The minimum capital ratios are for the
period 2018:Q1 to 2020:Q1. Supplementary leverage ratio projections only
include estimates for firms subject to the advanced approaches.
n/a Not applicable.
Projected loan losses, by type of loan, 2018:Q1–2020:Q1
Loan type Billions of
dollars Portfolio loss
rates (percent)1
Loan losses 61.8 6.4
First-lien mortgages, domestic 5.8 2.4
Junior liens and HELOCs, domestic 1.9 4.5
Commercial and industrial2 18.1 11.0
Commercial real estate, domestic 5.9 5.1
Credit cards 17.3 12.3
Other consumer3 2.2 3.4
Other loans4 10.5 5.3
1 Average loan balances used to calculate portfolio loss rates exclude loans held
for sale and loans held for investment under the fair-value option, and are
calculated over nine quarters.2 Commercial and industrial loans include small- and medium-enterprise loans
and corporate cards.3 Other consumer loans include student loans and automobile loans.4 Other loans include international real estate loans.
Risk-weighted assets, actual 2017:Q4 and projected2020:Q1
Billions of dollars
Item Actual
2017:Q4 Projected2020:Q1
Risk-weighted assets1 1,499.5 1,587.0
1 For each quarter, risk-weighted assets are calculated under the Board’s
standardized capital risk-based approach in 12 CFR part 217, subpart D.
Projected losses, revenue, and net income before taxesthrough 2020:Q1
Item Billions of
dollars Percent of
average assets1
Pre-provision net revenue2 71.5 2.7
Other revenue3 0.0
less
Provisions 68.5
Realized losses/gains on securities (AFS/HTM) 1.0
Trading and counterparty losses4 29.4
Other losses/gains5 1.2
equals
Net income before taxes -28.5 -1.1
Memo items
Other comprehensive income6 -6.7
Other effects on capital Actual 2017:Q4 2020:Q1
AOCI included in capital (billions of dollars)7 -0.3 -6.9
1 Average assets is the nine-quarter average of total assets.2 Pre-provision net revenue includes losses from operational-risk events and
other real estate owned (OREO) costs.3 Other revenue includes one-time income and (expense) items not included in
pre-provision net revenue.4 Trading and counterparty losses include mark-to-market and credit valuation
adjustment (CVA) losses and losses arising from the counterparty default
scenario component applied to derivatives, securities lending, and repurchase
agreement activities.5 Other losses/gains include projected change in fair value of loans held for sale
and loans held for investment measured under the fair-value option, and
goodwill impairment losses.6 Other comprehensive income (OCI) is only calculated for advanced approaches
firms, and other firms that opt into the advanced approaches treatment of
accumulated other comprehensive income (AOCI).7 Certain aspects of AOCI are subject to transition arrangements for inclusion in
projected regulatory capital. The transition arrangements are 100 percent
included in projected regulatory capital starting in 2018. See 12 CFR
217.300(b)(3).
118 Supervisory Stress Test Methodology and Results

Table C.20.B. JPMorgan Chase & Co.
Projected stressed capital ratios, risk-weighted assets, losses, revenues, net income beforetaxes, and loan lossesFederal Reserve estimates: Adverse scenario
Capital ratios, actual 2017:Q4 and projected2018:Q1–2020:Q1
Percent
Regulatory ratio Actual
2017:Q4
Stressed capital ratios1
Ending Minimum
Common equity tier 1 capital ratio 12.2 10.8 10.6
Tier 1 capital ratio 13.9 12.4 12.2
Total capital ratio 15.9 14.3 14.1
Tier 1 leverage ratio 8.3 7.3 7.3
Supplementary leverage ratio n/a 5.7 5.7
1 The capital ratios are calculated using capital action assumptions provided
within the Dodd-Frank Act stress testing rule. See 12 CFR 252.56(b). These
projections represent hypothetical estimates that involve an economic outcome
that is more adverse than expected. The minimum capital ratios are for the
period 2018:Q1 to 2020:Q1. Supplementary leverage ratio projections only
include estimates for firms subject to the advanced approaches.
n/a Not applicable.
Projected loan losses, by type of loan, 2018:Q1–2020:Q1
Loan type Billions of
dollars Portfolio loss
rates (percent)1
Loan losses 37.3 3.8
First-lien mortgages, domestic 1.7 0.7
Junior liens and HELOCs, domestic 0.9 2.0
Commercial and industrial2 11.6 7.0
Commercial real estate, domestic 2.5 2.1
Credit cards 12.8 9.0
Other consumer3 1.7 2.5
Other loans4 6.3 3.1
1 Average loan balances used to calculate portfolio loss rates exclude loans held
for sale and loans held for investment under the fair-value option, and are
calculated over nine quarters.2 Commercial and industrial loans include small- and medium-enterprise loans
and corporate cards.3 Other consumer loans include student loans and automobile loans.4 Other loans include international real estate loans.
Risk-weighted assets, actual 2017:Q4 and projected2020:Q1
Billions of dollars
Item Actual
2017:Q4 Projected2020:Q1
Risk-weighted assets1 1,499.5 1,629.2
1 For each quarter, risk-weighted assets are calculated under the Board’s
standardized capital risk-based approach in 12 CFR part 217, subpart D.
Projected losses, revenue, and net income before taxesthrough 2020:Q1
Item Billions of
dollars Percent of
average assets1
Pre-provision net revenue2 73.0 2.7
Other revenue3 0.0
less
Provisions 37.2
Realized losses/gains on securities (AFS/HTM) 0.4
Trading and counterparty losses4 13.1
Other losses/gains5 0.9
equals
Net income before taxes 21.5 0.8
Memo items
Other comprehensive income6 -0.2
Other effects on capital Actual 2017:Q4 2020:Q1
AOCI included in capital (billions of dollars)7 -0.3 -0.4
1 Average assets is the nine-quarter average of total assets.2 Pre-provision net revenue includes losses from operational-risk events and
other real estate owned (OREO) costs.3 Other revenue includes one-time income and (expense) items not included in
pre-provision net revenue.4 Trading and counterparty losses include mark-to-market and credit valuation
adjustment (CVA) losses and losses arising from the counterparty default
scenario component applied to derivatives, securities lending, and repurchase
agreement activities.5 Other losses/gains include projected change in fair value of loans held for sale
and loans held for investment measured under the fair-value option, and
goodwill impairment losses.6 Other comprehensive income (OCI) is only calculated for advanced approaches
firms, and other firms that opt into the advanced approaches treatment of
accumulated other comprehensive income (AOCI).7 Certain aspects of AOCI are subject to transition arrangements for inclusion in
projected regulatory capital. The transition arrangements are 100 percent
included in projected regulatory capital starting in 2018. See 12 CFR
217.300(b)(3).
June 2018 119

Table C.21.A. KeyCorp
Projected stressed capital ratios, risk-weighted assets, losses, revenues, net income beforetaxes, and loan lossesFederal Reserve estimates: Severely adverse scenario
Capital ratios, actual 2017:Q4 and projected2018:Q1–2020:Q1
Percent
Regulatory ratio Actual
2017:Q4
Stressed capital ratios1
Ending Minimum
Common equity tier 1 capital ratio 10.2 6.8 6.8
Tier 1 capital ratio 11.0 7.6 7.6
Total capital ratio 12.9 9.8 9.8
Tier 1 leverage ratio 9.7 6.6 6.6
Supplementary leverage ratio n/a n/a n/a
1 The capital ratios are calculated using capital action assumptions provided
within the Dodd-Frank Act stress testing rule. See 12 CFR 252.56(b). These
projections represent hypothetical estimates that involve an economic outcome
that is more adverse than expected. The minimum capital ratios are for the
period 2018:Q1 to 2020:Q1. Supplementary leverage ratio projections only
include estimates for firms subject to the advanced approaches.
n/a Not applicable.
Projected loan losses, by type of loan, 2018:Q1–2020:Q1
Loan type Billions of
dollars Portfolio loss
rates (percent)1
Loan losses 5.4 6.1
First-lien mortgages, domestic 0.3 3.9
Junior liens and HELOCs, domestic 0.4 4.3
Commercial and industrial2 2.2 6.7
Commercial real estate, domestic 1.5 9.3
Credit cards 0.1 13.2
Other consumer3 0.4 5.8
Other loans4 0.5 3.2
1 Average loan balances used to calculate portfolio loss rates exclude loans held
for sale and loans held for investment under the fair-value option, and are
calculated over nine quarters.2 Commercial and industrial loans include small- and medium-enterprise loans
and corporate cards.3 Other consumer loans include student loans and automobile loans.4 Other loans include international real estate loans.
Risk-weighted assets, actual 2017:Q4 and projected2020:Q1
Billions of dollars
Item Actual
2017:Q4 Projected2020:Q1
Risk-weighted assets1 118.8 124.9
1 For each quarter, risk-weighted assets are calculated under the Board’s
standardized capital risk-based approach in 12 CFR part 217, subpart D.
Projected losses, revenue, and net income before taxesthrough 2020:Q1
Item Billions of
dollars Percent of
average assets1
Pre-provision net revenue2 3.8 2.6
Other revenue3 0.0
less
Provisions 6.1
Realized losses/gains on securities (AFS/HTM) 0.0
Trading and counterparty losses4 0.0
Other losses/gains5 0.2
equals
Net income before taxes -2.5 -1.8
Memo items
Other comprehensive income6 0.0
Other effects on capital Actual 2017:Q4 2020:Q1
AOCI included in capital (billions of dollars)7 0.0 0.0
1 Average assets is the nine-quarter average of total assets.2 Pre-provision net revenue includes losses from operational-risk events and
other real estate owned (OREO) costs.3 Other revenue includes one-time income and (expense) items not included in
pre-provision net revenue.4 Trading and counterparty losses include mark-to-market and credit valuation
adjustment (CVA) losses and losses arising from the counterparty default
scenario component applied to derivatives, securities lending, and repurchase
agreement activities.5 Other losses/gains include projected change in fair value of loans held for sale
and loans held for investment measured under the fair-value option, and
goodwill impairment losses.6 Other comprehensive income (OCI) is only calculated for advanced approaches
firms, and other firms that opt into the advanced approaches treatment of
accumulated other comprehensive income (AOCI).7 Certain aspects of AOCI are subject to transition arrangements for inclusion in
projected regulatory capital. The transition arrangements are 100 percent
included in projected regulatory capital starting in 2018. See 12 CFR
217.300(b)(3).
120 Supervisory Stress Test Methodology and Results

Table C.21.B. KeyCorp
Projected stressed capital ratios, risk-weighted assets, losses, revenues, net income beforetaxes, and loan lossesFederal Reserve estimates: Adverse scenario
Capital ratios, actual 2017:Q4 and projected2018:Q1–2020:Q1
Percent
Regulatory ratio Actual
2017:Q4
Stressed capital ratios1
Ending Minimum
Common equity tier 1 capital ratio 10.2 8.4 8.4
Tier 1 capital ratio 11.0 9.2 9.2
Total capital ratio 12.9 11.0 11.0
Tier 1 leverage ratio 9.7 7.9 7.9
Supplementary leverage ratio n/a n/a n/a
1 The capital ratios are calculated using capital action assumptions provided
within the Dodd-Frank Act stress testing rule. See 12 CFR 252.56(b). These
projections represent hypothetical estimates that involve an economic outcome
that is more adverse than expected. The minimum capital ratios are for the
period 2018:Q1 to 2020:Q1. Supplementary leverage ratio projections only
include estimates for firms subject to the advanced approaches.
n/a Not applicable.
Projected loan losses, by type of loan, 2018:Q1–2020:Q1
Loan type Billions of
dollars Portfolio loss
rates (percent)1
Loan losses 3.1 3.4
First-lien mortgages, domestic 0.2 2.2
Junior liens and HELOCs, domestic 0.2 2.6
Commercial and industrial2 1.3 3.9
Commercial real estate, domestic 0.6 3.9
Credit cards 0.1 9.7
Other consumer3 0.3 4.6
Other loans4 0.3 1.9
1 Average loan balances used to calculate portfolio loss rates exclude loans held
for sale and loans held for investment under the fair-value option, and are
calculated over nine quarters.2 Commercial and industrial loans include small- and medium-enterprise loans
and corporate cards.3 Other consumer loans include student loans and automobile loans.4 Other loans include international real estate loans.
Risk-weighted assets, actual 2017:Q4 and projected2020:Q1
Billions of dollars
Item Actual
2017:Q4 Projected2020:Q1
Risk-weighted assets1 118.8 127.2
1 For each quarter, risk-weighted assets are calculated under the Board’s
standardized capital risk-based approach in 12 CFR part 217, subpart D.
Projected losses, revenue, and net income before taxesthrough 2020:Q1
Item Billions of
dollars Percent of
average assets1
Pre-provision net revenue2 3.2 2.2
Other revenue3 0.0
less
Provisions 3.2
Realized losses/gains on securities (AFS/HTM) 0.0
Trading and counterparty losses4 0.0
Other losses/gains5 0.1
equals
Net income before taxes -0.1 -0.1
Memo items
Other comprehensive income6 0.0
Other effects on capital Actual 2017:Q4 2020:Q1
AOCI included in capital (billions of dollars)7 0.0 0.0
1 Average assets is the nine-quarter average of total assets.2 Pre-provision net revenue includes losses from operational-risk events and
other real estate owned (OREO) costs.3 Other revenue includes one-time income and (expense) items not included in
pre-provision net revenue.4 Trading and counterparty losses include mark-to-market and credit valuation
adjustment (CVA) losses and losses arising from the counterparty default
scenario component applied to derivatives, securities lending, and repurchase
agreement activities.5 Other losses/gains include projected change in fair value of loans held for sale
and loans held for investment measured under the fair-value option, and
goodwill impairment losses.6 Other comprehensive income (OCI) is only calculated for advanced approaches
firms, and other firms that opt into the advanced approaches treatment of
accumulated other comprehensive income (AOCI).7 Certain aspects of AOCI are subject to transition arrangements for inclusion in
projected regulatory capital. The transition arrangements are 100 percent
included in projected regulatory capital starting in 2018. See 12 CFR
217.300(b)(3).
June 2018 121

Table C.22.A. M&T Bank Corporation
Projected stressed capital ratios, risk-weighted assets, losses, revenues, net income beforetaxes, and loan lossesFederal Reserve estimates: Severely adverse scenario
Capital ratios, actual 2017:Q4 and projected2018:Q1–2020:Q1
Percent
Regulatory ratio Actual
2017:Q4
Stressed capital ratios1
Ending Minimum
Common equity tier 1 capital ratio 11.0 7.6 7.5
Tier 1 capital ratio 12.3 8.8 8.8
Total capital ratio 14.8 11.1 11.0
Tier 1 leverage ratio 10.3 7.2 7.2
Supplementary leverage ratio n/a n/a n/a
1 The capital ratios are calculated using capital action assumptions provided
within the Dodd-Frank Act stress testing rule. See 12 CFR 252.56(b). These
projections represent hypothetical estimates that involve an economic outcome
that is more adverse than expected. The minimum capital ratios are for the
period 2018:Q1 to 2020:Q1. Supplementary leverage ratio projections only
include estimates for firms subject to the advanced approaches.
n/a Not applicable.
Projected loan losses, by type of loan, 2018:Q1–2020:Q1
Loan type Billions of
dollars Portfolio loss
rates (percent)1
Loan losses 6.0 6.7
First-lien mortgages, domestic 0.8 4.3
Junior liens and HELOCs, domestic 0.2 4.3
Commercial and industrial2 1.0 5.8
Commercial real estate, domestic 3.1 9.3
Credit cards 0.1 14.7
Other consumer3 0.4 5.8
Other loans4 0.3 5.6
1 Average loan balances used to calculate portfolio loss rates exclude loans held
for sale and loans held for investment under the fair-value option, and are
calculated over nine quarters.2 Commercial and industrial loans include small- and medium-enterprise loans
and corporate cards.3 Other consumer loans include student loans and automobile loans.4 Other loans include international real estate loans.
Risk-weighted assets, actual 2017:Q4 and projected2020:Q1
Billions of dollars
Item Actual
2017:Q4 Projected2020:Q1
Risk-weighted assets1 97.1 101.2
1 For each quarter, risk-weighted assets are calculated under the Board’s
standardized capital risk-based approach in 12 CFR part 217, subpart D.
Projected losses, revenue, and net income before taxesthrough 2020:Q1
Item Billions of
dollars Percent of
average assets1
Pre-provision net revenue2 5.4 4.4
Other revenue3 0.0
less
Provisions 6.7
Realized losses/gains on securities (AFS/HTM) 0.0
Trading and counterparty losses4 0.0
Other losses/gains5 0.0
equals
Net income before taxes -1.3 -1.1
Memo items
Other comprehensive income6 0.0
Other effects on capital Actual 2017:Q4 2020:Q1
AOCI included in capital (billions of dollars)7 0.0 0.0
1 Average assets is the nine-quarter average of total assets.2 Pre-provision net revenue includes losses from operational-risk events and
other real estate owned (OREO) costs.3 Other revenue includes one-time income and (expense) items not included in
pre-provision net revenue.4 Trading and counterparty losses include mark-to-market and credit valuation
adjustment (CVA) losses and losses arising from the counterparty default
scenario component applied to derivatives, securities lending, and repurchase
agreement activities.5 Other losses/gains include projected change in fair value of loans held for sale
and loans held for investment measured under the fair-value option, and
goodwill impairment losses.6 Other comprehensive income (OCI) is only calculated for advanced approaches
firms, and other firms that opt into the advanced approaches treatment of
accumulated other comprehensive income (AOCI).7 Certain aspects of AOCI are subject to transition arrangements for inclusion in
projected regulatory capital. The transition arrangements are 100 percent
included in projected regulatory capital starting in 2018. See 12 CFR
217.300(b)(3).
122 Supervisory Stress Test Methodology and Results

Table C.22.B. M&T Bank Corporation
Projected stressed capital ratios, risk-weighted assets, losses, revenues, net income beforetaxes, and loan lossesFederal Reserve estimates: Adverse scenario
Capital ratios, actual 2017:Q4 and projected2018:Q1–2020:Q1
Percent
Regulatory ratio Actual
2017:Q4
Stressed capital ratios1
Ending Minimum
Common equity tier 1 capital ratio 11.0 9.9 9.8
Tier 1 capital ratio 12.3 11.1 11.0
Total capital ratio 14.8 13.1 13.1
Tier 1 leverage ratio 10.3 9.0 9.0
Supplementary leverage ratio n/a n/a n/a
1 The capital ratios are calculated using capital action assumptions provided
within the Dodd-Frank Act stress testing rule. See 12 CFR 252.56(b). These
projections represent hypothetical estimates that involve an economic outcome
that is more adverse than expected. The minimum capital ratios are for the
period 2018:Q1 to 2020:Q1. Supplementary leverage ratio projections only
include estimates for firms subject to the advanced approaches.
n/a Not applicable.
Projected loan losses, by type of loan, 2018:Q1–2020:Q1
Loan type Billions of
dollars Portfolio loss
rates (percent)1
Loan losses 3.0 3.4
First-lien mortgages, domestic 0.4 2.1
Junior liens and HELOCs, domestic 0.1 2.6
Commercial and industrial2 0.7 3.8
Commercial real estate, domestic 1.3 3.7
Credit cards 0.1 10.6
Other consumer3 0.3 4.1
Other loans4 0.2 3.1
1 Average loan balances used to calculate portfolio loss rates exclude loans held
for sale and loans held for investment under the fair-value option, and are
calculated over nine quarters.2 Commercial and industrial loans include small- and medium-enterprise loans
and corporate cards.3 Other consumer loans include student loans and automobile loans.4 Other loans include international real estate loans.
Risk-weighted assets, actual 2017:Q4 and projected2020:Q1
Billions of dollars
Item Actual
2017:Q4 Projected2020:Q1
Risk-weighted assets1 97.1 102.8
1 For each quarter, risk-weighted assets are calculated under the Board’s
standardized capital risk-based approach in 12 CFR part 217, subpart D.
Projected losses, revenue, and net income before taxesthrough 2020:Q1
Item Billions of
dollars Percent of
average assets1
Pre-provision net revenue2 4.7 3.7
Other revenue3 0.0
less
Provisions 3.1
Realized losses/gains on securities (AFS/HTM) 0.0
Trading and counterparty losses4 0.0
Other losses/gains5 0.0
equals
Net income before taxes 1.5 1.2
Memo items
Other comprehensive income6 0.0
Other effects on capital Actual 2017:Q4 2020:Q1
AOCI included in capital (billions of dollars)7 0.0 0.0
1 Average assets is the nine-quarter average of total assets.2 Pre-provision net revenue includes losses from operational-risk events and
other real estate owned (OREO) costs.3 Other revenue includes one-time income and (expense) items not included in
pre-provision net revenue.4 Trading and counterparty losses include mark-to-market and credit valuation
adjustment (CVA) losses and losses arising from the counterparty default
scenario component applied to derivatives, securities lending, and repurchase
agreement activities.5 Other losses/gains include projected change in fair value of loans held for sale
and loans held for investment measured under the fair-value option, and
goodwill impairment losses.6 Other comprehensive income (OCI) is only calculated for advanced approaches
firms, and other firms that opt into the advanced approaches treatment of
accumulated other comprehensive income (AOCI).7 Certain aspects of AOCI are subject to transition arrangements for inclusion in
projected regulatory capital. The transition arrangements are 100 percent
included in projected regulatory capital starting in 2018. See 12 CFR
217.300(b)(3).
June 2018 123

Table C.23.A. Morgan Stanley
Projected stressed capital ratios, risk-weighted assets, losses, revenues, net income beforetaxes, and loan lossesFederal Reserve estimates: Severely adverse scenario
Capital ratios, actual 2017:Q4 and projected2018:Q1–2020:Q1
Percent
Regulatory ratio Actual
2017:Q4
Stressed capital ratios1
Ending Minimum
Common equity tier 1 capital ratio 16.5 8.9 7.3
Tier 1 capital ratio 18.9 11.1 9.4
Total capital ratio 21.7 13.6 12.2
Tier 1 leverage ratio 8.3 4.7 4.3
Supplementary leverage ratio n/a 3.7 3.3
1 The capital ratios are calculated using capital action assumptions provided
within the Dodd-Frank Act stress testing rule. See 12 CFR 252.56(b). These
projections represent hypothetical estimates that involve an economic outcome
that is more adverse than expected. The minimum capital ratios are for the
period 2018:Q1 to 2020:Q1. Supplementary leverage ratio projections only
include estimates for firms subject to the advanced approaches.
n/a Not applicable.
Projected loan losses, by type of loan, 2018:Q1–2020:Q1
Loan type Billions of
dollars Portfolio loss
rates (percent)1
Loan losses 4.6 3.6
First-lien mortgages, domestic 0.6 2.2
Junior liens and HELOCs, domestic 0.0 5.2
Commercial and industrial2 1.1 11.3
Commercial real estate, domestic 1.0 7.3
Credit cards 0.0 0.0
Other consumer3 0.1 0.6
Other loans4 1.8 3.1
1 Average loan balances used to calculate portfolio loss rates exclude loans held
for sale and loans held for investment under the fair-value option, and are
calculated over nine quarters.2 Commercial and industrial loans include small- and medium-enterprise loans
and corporate cards.3 Other consumer loans include student loans and automobile loans.4 Other loans include international real estate loans.
Risk-weighted assets, actual 2017:Q4 and projected2020:Q1
Billions of dollars
Item Actual
2017:Q4 Projected2020:Q1
Risk-weighted assets1 369.6 382.5
1 For each quarter, risk-weighted assets are calculated under the Board’s
standardized capital risk-based approach in 12 CFR part 217, subpart D.
Projected losses, revenue, and net income before taxesthrough 2020:Q1
Item Billions of
dollars Percent of
average assets1
Pre-provision net revenue2 3.0 0.3
Other revenue3 0.0
less
Provisions 5.9
Realized losses/gains on securities (AFS/HTM) 0.0
Trading and counterparty losses4 11.7
Other losses/gains5 6.1
equals
Net income before taxes -20.8 -2.4
Memo items
Other comprehensive income6 0.1
Other effects on capital Actual 2017:Q4 2020:Q1
AOCI included in capital (billions of dollars)7 -2.8 -3.0
1 Average assets is the nine-quarter average of total assets.2 Pre-provision net revenue includes losses from operational-risk events and
other real estate owned (OREO) costs.3 Other revenue includes one-time income and (expense) items not included in
pre-provision net revenue.4 Trading and counterparty losses include mark-to-market and credit valuation
adjustment (CVA) losses and losses arising from the counterparty default
scenario component applied to derivatives, securities lending, and repurchase
agreement activities.5 Other losses/gains include projected change in fair value of loans held for sale
and loans held for investment measured under the fair-value option, and
goodwill impairment losses.6 Other comprehensive income (OCI) is only calculated for advanced approaches
firms, and other firms that opt into the advanced approaches treatment of
accumulated other comprehensive income (AOCI).7 Certain aspects of AOCI are subject to transition arrangements for inclusion in
projected regulatory capital. The transition arrangements are 100 percent
included in projected regulatory capital starting in 2018. See 12 CFR
217.300(b)(3).
124 Supervisory Stress Test Methodology and Results

Table C.23.B. Morgan Stanley
Projected stressed capital ratios, risk-weighted assets, losses, revenues, net income beforetaxes, and loan lossesFederal Reserve estimates: Adverse scenario
Capital ratios, actual 2017:Q4 and projected2018:Q1–2020:Q1
Percent
Regulatory ratio Actual
2017:Q4
Stressed capital ratios1
Ending Minimum
Common equity tier 1 capital ratio 16.5 13.1 12.5
Tier 1 capital ratio 18.9 15.2 14.6
Total capital ratio 21.7 17.4 17.0
Tier 1 leverage ratio 8.3 6.7 6.5
Supplementary leverage ratio n/a 5.2 5.1
1 The capital ratios are calculated using capital action assumptions provided
within the Dodd-Frank Act stress testing rule. See 12 CFR 252.56(b). These
projections represent hypothetical estimates that involve an economic outcome
that is more adverse than expected. The minimum capital ratios are for the
period 2018:Q1 to 2020:Q1. Supplementary leverage ratio projections only
include estimates for firms subject to the advanced approaches.
n/a Not applicable.
Projected loan losses, by type of loan, 2018:Q1–2020:Q1
Loan type Billions of
dollars Portfolio loss
rates (percent)1
Loan losses 2.4 1.9
First-lien mortgages, domestic 0.2 0.7
Junior liens and HELOCs, domestic 0.0 2.8
Commercial and industrial2 0.7 6.8
Commercial real estate, domestic 0.3 2.3
Credit cards 0.0 0.0
Other consumer3 0.1 0.6
Other loans4 1.1 1.9
1 Average loan balances used to calculate portfolio loss rates exclude loans held
for sale and loans held for investment under the fair-value option, and are
calculated over nine quarters.2 Commercial and industrial loans include small- and medium-enterprise loans
and corporate cards.3 Other consumer loans include student loans and automobile loans.4 Other loans include international real estate loans.
Risk-weighted assets, actual 2017:Q4 and projected2020:Q1
Billions of dollars
Item Actual
2017:Q4 Projected2020:Q1
Risk-weighted assets1 369.6 404.7
1 For each quarter, risk-weighted assets are calculated under the Board’s
standardized capital risk-based approach in 12 CFR part 217, subpart D.
Projected losses, revenue, and net income before taxesthrough 2020:Q1
Item Billions of
dollars Percent of
average assets1
Pre-provision net revenue2 8.1 0.9
Other revenue3 0.0
less
Provisions 3.1
Realized losses/gains on securities (AFS/HTM) 0.0
Trading and counterparty losses4 4.2
Other losses/gains5 4.0
equals
Net income before taxes -3.2 -0.4
Memo items
Other comprehensive income6 1.5
Other effects on capital Actual 2017:Q4 2020:Q1
AOCI included in capital (billions of dollars)7 -2.8 -1.6
1 Average assets is the nine-quarter average of total assets.2 Pre-provision net revenue includes losses from operational-risk events and
other real estate owned (OREO) costs.3 Other revenue includes one-time income and (expense) items not included in
pre-provision net revenue.4 Trading and counterparty losses include mark-to-market and credit valuation
adjustment (CVA) losses and losses arising from the counterparty default
scenario component applied to derivatives, securities lending, and repurchase
agreement activities.5 Other losses/gains include projected change in fair value of loans held for sale
and loans held for investment measured under the fair-value option, and
goodwill impairment losses.6 Other comprehensive income (OCI) is only calculated for advanced approaches
firms, and other firms that opt into the advanced approaches treatment of
accumulated other comprehensive income (AOCI).7 Certain aspects of AOCI are subject to transition arrangements for inclusion in
projected regulatory capital. The transition arrangements are 100 percent
included in projected regulatory capital starting in 2018. See 12 CFR
217.300(b)(3).
June 2018 125

Table C.24.A. MUFG Americas Holdings Corporation
Projected stressed capital ratios, risk-weighted assets, losses, revenues, net income beforetaxes, and loan lossesFederal Reserve estimates: Severely adverse scenario
Capital ratios, actual 2017:Q4 and projected2018:Q1–2020:Q1
Percent
Regulatory ratio Actual
2017:Q4
Stressed capital ratios1
Ending Minimum
Common equity tier 1 capital ratio 16.3 12.2 12.2
Tier 1 capital ratio 16.3 12.2 12.2
Total capital ratio 17.8 14.0 14.0
Tier 1 leverage ratio 10.1 7.3 7.3
Supplementary leverage ratio n/a n/a n/a
1 The capital ratios are calculated using capital action assumptions provided
within the Dodd-Frank Act stress testing rule. See 12 CFR 252.56(b). These
projections represent hypothetical estimates that involve an economic outcome
that is more adverse than expected. The minimum capital ratios are for the
period 2018:Q1 to 2020:Q1. Supplementary leverage ratio projections only
include estimates for firms subject to the advanced approaches.
n/a Not applicable.
Projected loan losses, by type of loan, 2018:Q1–2020:Q1
Loan type Billions of
dollars Portfolio loss
rates (percent)1
Loan losses 4.8 5.9
First-lien mortgages, domestic 1.4 3.7
Junior liens and HELOCs, domestic 0.1 4.6
Commercial and industrial2 1.4 8.2
Commercial real estate, domestic 1.4 8.3
Credit cards 0.0 14.7
Other consumer3 0.2 15.3
Other loans4 0.4 4.6
1 Average loan balances used to calculate portfolio loss rates exclude loans held
for sale and loans held for investment under the fair-value option, and are
calculated over nine quarters.2 Commercial and industrial loans include small- and medium-enterprise loans
and corporate cards.3 Other consumer loans include student loans and automobile loans.4 Other loans include international real estate loans.
Risk-weighted assets, actual 2017:Q4 and projected2020:Q1
Billions of dollars
Item Actual
2017:Q4 Projected2020:Q1
Risk-weighted assets1 96.3 100.1
1 For each quarter, risk-weighted assets are calculated under the Board’s
standardized capital risk-based approach in 12 CFR part 217, subpart D.
Projected losses, revenue, and net income before taxesthrough 2020:Q1
Item Billions of
dollars Percent of
average assets1
Pre-provision net revenue2 3.1 2.0
Other revenue3 0.0
less
Provisions 5.6
Realized losses/gains on securities (AFS/HTM) 0.1
Trading and counterparty losses4 0.0
Other losses/gains5 0.1
equals
Net income before taxes -2.7 -1.7
Memo items
Other comprehensive income6 0.0
Other effects on capital Actual 2017:Q4 2020:Q1
AOCI included in capital (billions of dollars)7 -0.1 -0.1
1 Average assets is the nine-quarter average of total assets.2 Pre-provision net revenue includes losses from operational-risk events and
other real estate owned (OREO) costs.3 Other revenue includes one-time income and (expense) items not included in
pre-provision net revenue.4 Trading and counterparty losses include mark-to-market and credit valuation
adjustment (CVA) losses and losses arising from the counterparty default
scenario component applied to derivatives, securities lending, and repurchase
agreement activities.5 Other losses/gains include projected change in fair value of loans held for sale
and loans held for investment measured under the fair-value option, and
goodwill impairment losses.6 Other comprehensive income (OCI) is only calculated for advanced approaches
firms, and other firms that opt into the advanced approaches treatment of
accumulated other comprehensive income (AOCI).7 Certain aspects of AOCI are subject to transition arrangements for inclusion in
projected regulatory capital. The transition arrangements are 100 percent
included in projected regulatory capital starting in 2018. See 12 CFR
217.300(b)(3).
126 Supervisory Stress Test Methodology and Results

Table C.24.B. MUFG Americas Holdings Corporation
Projected stressed capital ratios, risk-weighted assets, losses, revenues, net income beforetaxes, and loan lossesFederal Reserve estimates: Adverse scenario
Capital ratios, actual 2017:Q4 and projected2018:Q1–2020:Q1
Percent
Regulatory ratio Actual
2017:Q4
Stressed capital ratios1
Ending Minimum
Common equity tier 1 capital ratio 16.3 14.3 14.3
Tier 1 capital ratio 16.3 14.3 14.3
Total capital ratio 17.8 15.5 15.5
Tier 1 leverage ratio 10.1 8.6 8.6
Supplementary leverage ratio n/a n/a n/a
1 The capital ratios are calculated using capital action assumptions provided
within the Dodd-Frank Act stress testing rule. See 12 CFR 252.56(b). These
projections represent hypothetical estimates that involve an economic outcome
that is more adverse than expected. The minimum capital ratios are for the
period 2018:Q1 to 2020:Q1. Supplementary leverage ratio projections only
include estimates for firms subject to the advanced approaches.
n/a Not applicable.
Projected loan losses, by type of loan, 2018:Q1–2020:Q1
Loan type Billions of
dollars Portfolio loss
rates (percent)1
Loan losses 2.0 2.5
First-lien mortgages, domestic 0.3 0.8
Junior liens and HELOCs, domestic 0.0 1.1
Commercial and industrial2 0.8 4.8
Commercial real estate, domestic 0.5 3.1
Credit cards 0.0 10.6
Other consumer3 0.1 12.6
Other loans4 0.2 2.7
1 Average loan balances used to calculate portfolio loss rates exclude loans held
for sale and loans held for investment under the fair-value option, and are
calculated over nine quarters.2 Commercial and industrial loans include small- and medium-enterprise loans
and corporate cards.3 Other consumer loans include student loans and automobile loans.4 Other loans include international real estate loans.
Risk-weighted assets, actual 2017:Q4 and projected2020:Q1
Billions of dollars
Item Actual
2017:Q4 Projected2020:Q1
Risk-weighted assets1 96.3 102.4
1 For each quarter, risk-weighted assets are calculated under the Board’s
standardized capital risk-based approach in 12 CFR part 217, subpart D.
Projected losses, revenue, and net income before taxesthrough 2020:Q1
Item Billions of
dollars Percent of
average assets1
Pre-provision net revenue2 2.3 1.4
Other revenue3 0.0
less
Provisions 2.3
Realized losses/gains on securities (AFS/HTM) 0.0
Trading and counterparty losses4 0.0
Other losses/gains5 0.1
equals
Net income before taxes 0.0 0.0
Memo items
Other comprehensive income6 0.0
Other effects on capital Actual 2017:Q4 2020:Q1
AOCI included in capital (billions of dollars)7 -0.1 -0.1
1 Average assets is the nine-quarter average of total assets.2 Pre-provision net revenue includes losses from operational-risk events and
other real estate owned (OREO) costs.3 Other revenue includes one-time income and (expense) items not included in
pre-provision net revenue.4 Trading and counterparty losses include mark-to-market and credit valuation
adjustment (CVA) losses and losses arising from the counterparty default
scenario component applied to derivatives, securities lending, and repurchase
agreement activities.5 Other losses/gains include projected change in fair value of loans held for sale
and loans held for investment measured under the fair-value option, and
goodwill impairment losses.6 Other comprehensive income (OCI) is only calculated for advanced approaches
firms, and other firms that opt into the advanced approaches treatment of
accumulated other comprehensive income (AOCI).7 Certain aspects of AOCI are subject to transition arrangements for inclusion in
projected regulatory capital. The transition arrangements are 100 percent
included in projected regulatory capital starting in 2018. See 12 CFR
217.300(b)(3).
June 2018 127

Table C.25.A. Northern Trust Corporation
Projected stressed capital ratios, risk-weighted assets, losses, revenues, net income beforetaxes, and loan lossesFederal Reserve estimates: Severely adverse scenario
Capital ratios, actual 2017:Q4 and projected2018:Q1–2020:Q1
Percent
Regulatory ratio Actual
2017:Q4
Stressed capital ratios1
Ending Minimum
Common equity tier 1 capital ratio 12.6 12.5 11.7
Tier 1 capital ratio 13.8 13.7 12.9
Total capital ratio 15.8 16.1 15.4
Tier 1 leverage ratio 7.8 7.6 7.3
Supplementary leverage ratio n/a 6.7 6.4
1 The capital ratios are calculated using capital action assumptions provided
within the Dodd-Frank Act stress testing rule. See 12 CFR 252.56(b). These
projections represent hypothetical estimates that involve an economic outcome
that is more adverse than expected. The minimum capital ratios are for the
period 2018:Q1 to 2020:Q1. Supplementary leverage ratio projections only
include estimates for firms subject to the advanced approaches.
n/a Not applicable.
Projected loan losses, by type of loan, 2018:Q1–2020:Q1
Loan type Billions of
dollars Portfolio loss
rates (percent)1
Loan losses 1.8 5.3
First-lien mortgages, domestic 0.2 2.4
Junior liens and HELOCs, domestic 0.1 9.6
Commercial and industrial2 0.3 5.5
Commercial real estate, domestic 0.3 7.7
Credit cards 0.0 0.0
Other consumer3 0.0 12.9
Other loans4 0.9 5.4
1 Average loan balances used to calculate portfolio loss rates exclude loans held
for sale and loans held for investment under the fair-value option, and are
calculated over nine quarters.2 Commercial and industrial loans include small- and medium-enterprise loans
and corporate cards.3 Other consumer loans include student loans and automobile loans.4 Other loans include international real estate loans.
Risk-weighted assets, actual 2017:Q4 and projected2020:Q1
Billions of dollars
Item Actual
2017:Q4 Projected2020:Q1
Risk-weighted assets1 68.6 72.2
1 For each quarter, risk-weighted assets are calculated under the Board’s
standardized capital risk-based approach in 12 CFR part 217, subpart D.
Projected losses, revenue, and net income before taxesthrough 2020:Q1
Item Billions of
dollars Percent of
average assets1
Pre-provision net revenue2 4.0 2.8
Other revenue3 0.0
less
Provisions 2.2
Realized losses/gains on securities (AFS/HTM) 0.1
Trading and counterparty losses4 0.0
Other losses/gains5 0.0
equals
Net income before taxes 1.7 1.2
Memo items
Other comprehensive income6 0.0
Other effects on capital Actual 2017:Q4 2020:Q1
AOCI included in capital (billions of dollars)7 -0.3 -0.4
1 Average assets is the nine-quarter average of total assets.2 Pre-provision net revenue includes losses from operational-risk events and
other real estate owned (OREO) costs.3 Other revenue includes one-time income and (expense) items not included in
pre-provision net revenue.4 Trading and counterparty losses include mark-to-market and credit valuation
adjustment (CVA) losses and losses arising from the counterparty default
scenario component applied to derivatives, securities lending, and repurchase
agreement activities.5 Other losses/gains include projected change in fair value of loans held for sale
and loans held for investment measured under the fair-value option, and
goodwill impairment losses.6 Other comprehensive income (OCI) is only calculated for advanced approaches
firms, and other firms that opt into the advanced approaches treatment of
accumulated other comprehensive income (AOCI).7 Certain aspects of AOCI are subject to transition arrangements for inclusion in
projected regulatory capital. The transition arrangements are 100 percent
included in projected regulatory capital starting in 2018. See 12 CFR
217.300(b)(3).
128 Supervisory Stress Test Methodology and Results

Table C.25.B. Northern Trust Corporation
Projected stressed capital ratios, risk-weighted assets, losses, revenues, net income beforetaxes, and loan lossesFederal Reserve estimates: Adverse scenario
Capital ratios, actual 2017:Q4 and projected2018:Q1–2020:Q1
Percent
Regulatory ratio Actual
2017:Q4
Stressed capital ratios1
Ending Minimum
Common equity tier 1 capital ratio 12.6 12.6 12.5
Tier 1 capital ratio 13.8 13.8 13.7
Total capital ratio 15.8 15.8 15.8
Tier 1 leverage ratio 7.8 7.6 7.6
Supplementary leverage ratio n/a 6.6 6.6
1 The capital ratios are calculated using capital action assumptions provided
within the Dodd-Frank Act stress testing rule. See 12 CFR 252.56(b). These
projections represent hypothetical estimates that involve an economic outcome
that is more adverse than expected. The minimum capital ratios are for the
period 2018:Q1 to 2020:Q1. Supplementary leverage ratio projections only
include estimates for firms subject to the advanced approaches.
n/a Not applicable.
Projected loan losses, by type of loan, 2018:Q1–2020:Q1
Loan type Billions of
dollars Portfolio loss
rates (percent)1
Loan losses 0.9 2.7
First-lien mortgages, domestic 0.0 0.6
Junior liens and HELOCs, domestic 0.1 4.4
Commercial and industrial2 0.2 3.2
Commercial real estate, domestic 0.1 2.9
Credit cards 0.0 0.0
Other consumer3 0.0 10.2
Other loans4 0.5 3.1
1 Average loan balances used to calculate portfolio loss rates exclude loans held
for sale and loans held for investment under the fair-value option, and are
calculated over nine quarters.2 Commercial and industrial loans include small- and medium-enterprise loans
and corporate cards.3 Other consumer loans include student loans and automobile loans.4 Other loans include international real estate loans.
Risk-weighted assets, actual 2017:Q4 and projected2020:Q1
Billions of dollars
Item Actual
2017:Q4 Projected2020:Q1
Risk-weighted assets1 68.6 73.3
1 For each quarter, risk-weighted assets are calculated under the Board’s
standardized capital risk-based approach in 12 CFR part 217, subpart D.
Projected losses, revenue, and net income before taxesthrough 2020:Q1
Item Billions of
dollars Percent of
average assets1
Pre-provision net revenue2 2.7 1.8
Other revenue3 0.0
less
Provisions 1.1
Realized losses/gains on securities (AFS/HTM) 0.1
Trading and counterparty losses4 0.0
Other losses/gains5 0.0
equals
Net income before taxes 1.4 1.0
Memo items
Other comprehensive income6 0.4
Other effects on capital Actual 2017:Q4 2020:Q1
AOCI included in capital (billions of dollars)7 -0.3 0.0
1 Average assets is the nine-quarter average of total assets.2 Pre-provision net revenue includes losses from operational-risk events and
other real estate owned (OREO) costs.3 Other revenue includes one-time income and (expense) items not included in
pre-provision net revenue.4 Trading and counterparty losses include mark-to-market and credit valuation
adjustment (CVA) losses and losses arising from the counterparty default
scenario component applied to derivatives, securities lending, and repurchase
agreement activities.5 Other losses/gains include projected change in fair value of loans held for sale
and loans held for investment measured under the fair-value option, and
goodwill impairment losses.6 Other comprehensive income (OCI) is only calculated for advanced approaches
firms, and other firms that opt into the advanced approaches treatment of
accumulated other comprehensive income (AOCI).7 Certain aspects of AOCI are subject to transition arrangements for inclusion in
projected regulatory capital. The transition arrangements are 100 percent
included in projected regulatory capital starting in 2018. See 12 CFR
217.300(b)(3).
June 2018 129

Table C.26.A. The PNC Financial Services Group, Inc.
Projected stressed capital ratios, risk-weighted assets, losses, revenues, net income beforetaxes, and loan lossesFederal Reserve estimates: Severely adverse scenario
Capital ratios, actual 2017:Q4 and projected2018:Q1–2020:Q1
Percent
Regulatory ratio Actual
2017:Q4
Stressed capital ratios1
Ending Minimum
Common equity tier 1 capital ratio 10.4 7.1 6.4
Tier 1 capital ratio 11.6 8.2 7.6
Total capital ratio 13.7 10.6 10.1
Tier 1 leverage ratio 9.9 7.0 6.5
Supplementary leverage ratio n/a 5.9 5.5
1 The capital ratios are calculated using capital action assumptions provided
within the Dodd-Frank Act stress testing rule. See 12 CFR 252.56(b). These
projections represent hypothetical estimates that involve an economic outcome
that is more adverse than expected. The minimum capital ratios are for the
period 2018:Q1 to 2020:Q1. Supplementary leverage ratio projections only
include estimates for firms subject to the advanced approaches.
n/a Not applicable.
Projected loan losses, by type of loan, 2018:Q1–2020:Q1
Loan type Billions of
dollars Portfolio loss
rates (percent)1
Loan losses 11.6 5.2
First-lien mortgages, domestic 0.5 1.8
Junior liens and HELOCs, domestic 0.4 2.0
Commercial and industrial2 5.6 7.0
Commercial real estate, domestic 2.7 7.5
Credit cards 0.7 14.4
Other consumer3 0.7 3.3
Other loans4 0.9 2.6
1 Average loan balances used to calculate portfolio loss rates exclude loans held
for sale and loans held for investment under the fair-value option, and are
calculated over nine quarters.2 Commercial and industrial loans include small- and medium-enterprise loans
and corporate cards.3 Other consumer loans include student loans and automobile loans.4 Other loans include international real estate loans.
Risk-weighted assets, actual 2017:Q4 and projected2020:Q1
Billions of dollars
Item Actual
2017:Q4 Projected2020:Q1
Risk-weighted assets1 309.5 328.3
1 For each quarter, risk-weighted assets are calculated under the Board’s
standardized capital risk-based approach in 12 CFR part 217, subpart D.
Projected losses, revenue, and net income before taxesthrough 2020:Q1
Item Billions of
dollars Percent of
average assets1
Pre-provision net revenue2 13.9 3.5
Other revenue3 0.0
less
Provisions 12.9
Realized losses/gains on securities (AFS/HTM) 0.4
Trading and counterparty losses4 0.0
Other losses/gains5 0.7
equals
Net income before taxes -0.1 0.0
Memo items
Other comprehensive income6 -1.9
Other effects on capital Actual 2017:Q4 2020:Q1
AOCI included in capital (billions of dollars)7 -0.3 -2.1
1 Average assets is the nine-quarter average of total assets.2 Pre-provision net revenue includes losses from operational-risk events and
other real estate owned (OREO) costs.3 Other revenue includes one-time income and (expense) items not included in
pre-provision net revenue.4 Trading and counterparty losses include mark-to-market and credit valuation
adjustment (CVA) losses and losses arising from the counterparty default
scenario component applied to derivatives, securities lending, and repurchase
agreement activities.5 Other losses/gains include projected change in fair value of loans held for sale
and loans held for investment measured under the fair-value option, and
goodwill impairment losses.6 Other comprehensive income (OCI) is only calculated for advanced approaches
firms, and other firms that opt into the advanced approaches treatment of
accumulated other comprehensive income (AOCI).7 Certain aspects of AOCI are subject to transition arrangements for inclusion in
projected regulatory capital. The transition arrangements are 100 percent
included in projected regulatory capital starting in 2018. See 12 CFR
217.300(b)(3).
130 Supervisory Stress Test Methodology and Results

Table C.26.B. The PNC Financial Services Group, Inc.
Projected stressed capital ratios, risk-weighted assets, losses, revenues, net income beforetaxes, and loan lossesFederal Reserve estimates: Adverse scenario
Capital ratios, actual 2017:Q4 and projected2018:Q1–2020:Q1
Percent
Regulatory ratio Actual
2017:Q4
Stressed capital ratios1
Ending Minimum
Common equity tier 1 capital ratio 10.4 9.4 9.3
Tier 1 capital ratio 11.6 10.6 10.4
Total capital ratio 13.7 12.4 12.4
Tier 1 leverage ratio 9.9 8.9 8.9
Supplementary leverage ratio n/a 7.4 7.4
1 The capital ratios are calculated using capital action assumptions provided
within the Dodd-Frank Act stress testing rule. See 12 CFR 252.56(b). These
projections represent hypothetical estimates that involve an economic outcome
that is more adverse than expected. The minimum capital ratios are for the
period 2018:Q1 to 2020:Q1. Supplementary leverage ratio projections only
include estimates for firms subject to the advanced approaches.
n/a Not applicable.
Projected loan losses, by type of loan, 2018:Q1–2020:Q1
Loan type Billions of
dollars Portfolio loss
rates (percent)1
Loan losses 6.5 2.9
First-lien mortgages, domestic 0.2 0.7
Junior liens and HELOCs, domestic 0.1 0.8
Commercial and industrial2 3.5 4.3
Commercial real estate, domestic 1.0 2.8
Credit cards 0.5 10.4
Other consumer3 0.6 2.6
Other loans4 0.5 1.6
1 Average loan balances used to calculate portfolio loss rates exclude loans held
for sale and loans held for investment under the fair-value option, and are
calculated over nine quarters.2 Commercial and industrial loans include small- and medium-enterprise loans
and corporate cards.3 Other consumer loans include student loans and automobile loans.4 Other loans include international real estate loans.
Risk-weighted assets, actual 2017:Q4 and projected2020:Q1
Billions of dollars
Item Actual
2017:Q4 Projected2020:Q1
Risk-weighted assets1 309.5 335.9
1 For each quarter, risk-weighted assets are calculated under the Board’s
standardized capital risk-based approach in 12 CFR part 217, subpart D.
Projected losses, revenue, and net income before taxesthrough 2020:Q1
Item Billions of
dollars Percent of
average assets1
Pre-provision net revenue2 12.5 3.1
Other revenue3 0.0
less
Provisions 6.4
Realized losses/gains on securities (AFS/HTM) 0.1
Trading and counterparty losses4 0.0
Other losses/gains5 0.5
equals
Net income before taxes 5.5 1.4
Memo items
Other comprehensive income6 0.7
Other effects on capital Actual 2017:Q4 2020:Q1
AOCI included in capital (billions of dollars)7 -0.3 0.4
1 Average assets is the nine-quarter average of total assets.2 Pre-provision net revenue includes losses from operational-risk events and
other real estate owned (OREO) costs.3 Other revenue includes one-time income and (expense) items not included in
pre-provision net revenue.4 Trading and counterparty losses include mark-to-market and credit valuation
adjustment (CVA) losses and losses arising from the counterparty default
scenario component applied to derivatives, securities lending, and repurchase
agreement activities.5 Other losses/gains include projected change in fair value of loans held for sale
and loans held for investment measured under the fair-value option, and
goodwill impairment losses.6 Other comprehensive income (OCI) is only calculated for advanced approaches
firms, and other firms that opt into the advanced approaches treatment of
accumulated other comprehensive income (AOCI).7 Certain aspects of AOCI are subject to transition arrangements for inclusion in
projected regulatory capital. The transition arrangements are 100 percent
included in projected regulatory capital starting in 2018. See 12 CFR
217.300(b)(3).
June 2018 131

Table C.27.A. RBC USA Holdco Corporation
Projected stressed capital ratios, risk-weighted assets, losses, revenues, net income beforetaxes, and loan lossesFederal Reserve estimates: Severely adverse scenario
Capital ratios, actual 2017:Q4 and projected2018:Q1–2020:Q1
Percent
Regulatory ratio Actual
2017:Q4
Stressed capital ratios1
Ending Minimum
Common equity tier 1 capital ratio 15.6 11.6 11.2
Tier 1 capital ratio 15.6 11.6 11.2
Total capital ratio 16.8 12.9 12.6
Tier 1 leverage ratio 7.9 6.2 6.0
Supplementary leverage ratio n/a n/a n/a
1 The capital ratios are calculated using capital action assumptions provided
within the Dodd-Frank Act stress testing rule. See 12 CFR 252.56(b). These
projections represent hypothetical estimates that involve an economic outcome
that is more adverse than expected. The minimum capital ratios are for the
period 2018:Q1 to 2020:Q1. Supplementary leverage ratio projections only
include estimates for firms subject to the advanced approaches.
n/a Not applicable.
Projected loan losses, by type of loan, 2018:Q1–2020:Q1
Loan type Billions of
dollars Portfolio loss
rates (percent)1
Loan losses 3.1 6.9
First-lien mortgages, domestic 0.2 2.5
Junior liens and HELOCs, domestic 0.1 5.7
Commercial and industrial2 1.2 12.8
Commercial real estate, domestic 0.8 8.2
Credit cards 0.0 14.7
Other consumer3 0.1 11.0
Other loans4 0.6 4.6
1 Average loan balances used to calculate portfolio loss rates exclude loans held
for sale and loans held for investment under the fair-value option, and are
calculated over nine quarters.2 Commercial and industrial loans include small- and medium-enterprise loans
and corporate cards.3 Other consumer loans include student loans and automobile loans.4 Other loans include international real estate loans.
Risk-weighted assets, actual 2017:Q4 and projected2020:Q1
Billions of dollars
Item Actual
2017:Q4 Projected2020:Q1
Risk-weighted assets1 68.6 73.4
1 For each quarter, risk-weighted assets are calculated under the Board’s
standardized capital risk-based approach in 12 CFR part 217, subpart D.
Projected losses, revenue, and net income before taxesthrough 2020:Q1
Item Billions of
dollars Percent of
average assets1
Pre-provision net revenue2 2.1 1.6
Other revenue3 0.0
less
Provisions 3.7
Realized losses/gains on securities (AFS/HTM) 0.0
Trading and counterparty losses4 0.6
Other losses/gains5 0.0
equals
Net income before taxes -2.2 -1.6
Memo items
Other comprehensive income6 0.0
Other effects on capital Actual 2017:Q4 2020:Q1
AOCI included in capital (billions of dollars)7 0.0 0.0
1 Average assets is the nine-quarter average of total assets.2 Pre-provision net revenue includes losses from operational-risk events and
other real estate owned (OREO) costs.3 Other revenue includes one-time income and (expense) items not included in
pre-provision net revenue.4 Trading and counterparty losses include mark-to-market and credit valuation
adjustment (CVA) losses and losses arising from the counterparty default
scenario component applied to derivatives, securities lending, and repurchase
agreement activities.5 Other losses/gains include projected change in fair value of loans held for sale
and loans held for investment measured under the fair-value option, and
goodwill impairment losses.6 Other comprehensive income (OCI) is only calculated for advanced approaches
firms, and other firms that opt into the advanced approaches treatment of
accumulated other comprehensive income (AOCI).7 Certain aspects of AOCI are subject to transition arrangements for inclusion in
projected regulatory capital. The transition arrangements are 100 percent
included in projected regulatory capital starting in 2018. See 12 CFR
217.300(b)(3).
132 Supervisory Stress Test Methodology and Results

Table C.27.B. RBC USA Holdco Corporation
Projected stressed capital ratios, risk-weighted assets, losses, revenues, net income beforetaxes, and loan lossesFederal Reserve estimates: Adverse scenario
Capital ratios, actual 2017:Q4 and projected2018:Q1–2020:Q1
Percent
Regulatory ratio Actual
2017:Q4
Stressed capital ratios1
Ending Minimum
Common equity tier 1 capital ratio 15.6 13.8 13.4
Tier 1 capital ratio 15.6 13.8 13.4
Total capital ratio 16.8 14.6 14.4
Tier 1 leverage ratio 7.9 7.4 7.3
Supplementary leverage ratio n/a n/a n/a
1 The capital ratios are calculated using capital action assumptions provided
within the Dodd-Frank Act stress testing rule. See 12 CFR 252.56(b). These
projections represent hypothetical estimates that involve an economic outcome
that is more adverse than expected. The minimum capital ratios are for the
period 2018:Q1 to 2020:Q1. Supplementary leverage ratio projections only
include estimates for firms subject to the advanced approaches.
n/a Not applicable.
Projected loan losses, by type of loan, 2018:Q1–2020:Q1
Loan type Billions of
dollars Portfolio loss
rates (percent)1
Loan losses 1.6 3.6
First-lien mortgages, domestic 0.1 0.7
Junior liens and HELOCs, domestic 0.0 1.9
Commercial and industrial2 0.7 7.5
Commercial real estate, domestic 0.3 3.1
Credit cards 0.0 10.6
Other consumer3 0.1 8.3
Other loans4 0.4 2.8
1 Average loan balances used to calculate portfolio loss rates exclude loans held
for sale and loans held for investment under the fair-value option, and are
calculated over nine quarters.2 Commercial and industrial loans include small- and medium-enterprise loans
and corporate cards.3 Other consumer loans include student loans and automobile loans.4 Other loans include international real estate loans.
Risk-weighted assets, actual 2017:Q4 and projected2020:Q1
Billions of dollars
Item Actual
2017:Q4 Projected2020:Q1
Risk-weighted assets1 68.6 76.0
1 For each quarter, risk-weighted assets are calculated under the Board’s
standardized capital risk-based approach in 12 CFR part 217, subpart D.
Projected losses, revenue, and net income before taxesthrough 2020:Q1
Item Billions of
dollars Percent of
average assets1
Pre-provision net revenue2 2.1 1.6
Other revenue3 0.0
less
Provisions 1.9
Realized losses/gains on securities (AFS/HTM) 0.0
Trading and counterparty losses4 0.4
Other losses/gains5 0.0
equals
Net income before taxes -0.2 -0.1
Memo items
Other comprehensive income6 0.0
Other effects on capital Actual 2017:Q4 2020:Q1
AOCI included in capital (billions of dollars)7 0.0 0.0
1 Average assets is the nine-quarter average of total assets.2 Pre-provision net revenue includes losses from operational-risk events and
other real estate owned (OREO) costs.3 Other revenue includes one-time income and (expense) items not included in
pre-provision net revenue.4 Trading and counterparty losses include mark-to-market and credit valuation
adjustment (CVA) losses and losses arising from the counterparty default
scenario component applied to derivatives, securities lending, and repurchase
agreement activities.5 Other losses/gains include projected change in fair value of loans held for sale
and loans held for investment measured under the fair-value option, and
goodwill impairment losses.6 Other comprehensive income (OCI) is only calculated for advanced approaches
firms, and other firms that opt into the advanced approaches treatment of
accumulated other comprehensive income (AOCI).7 Certain aspects of AOCI are subject to transition arrangements for inclusion in
projected regulatory capital. The transition arrangements are 100 percent
included in projected regulatory capital starting in 2018. See 12 CFR
217.300(b)(3).
June 2018 133

Table C.28.A. Regions Financial Corporation
Projected stressed capital ratios, risk-weighted assets, losses, revenues, net income beforetaxes, and loan lossesFederal Reserve estimates: Severely adverse scenario
Capital ratios, actual 2017:Q4 and projected2018:Q1–2020:Q1
Percent
Regulatory ratio Actual
2017:Q4
Stressed capital ratios1
Ending Minimum
Common equity tier 1 capital ratio 11.1 8.1 8.1
Tier 1 capital ratio 11.9 8.9 8.9
Total capital ratio 13.8 11.0 11.0
Tier 1 leverage ratio 10.0 7.3 7.3
Supplementary leverage ratio n/a n/a n/a
1 The capital ratios are calculated using capital action assumptions provided
within the Dodd-Frank Act stress testing rule. See 12 CFR 252.56(b). These
projections represent hypothetical estimates that involve an economic outcome
that is more adverse than expected. The minimum capital ratios are for the
period 2018:Q1 to 2020:Q1. Supplementary leverage ratio projections only
include estimates for firms subject to the advanced approaches.
n/a Not applicable.
Projected loan losses, by type of loan, 2018:Q1–2020:Q1
Loan type Billions of
dollars Portfolio loss
rates (percent)1
Loan losses 5.3 6.5
First-lien mortgages, domestic 0.6 3.7
Junior liens and HELOCs, domestic 0.4 5.1
Commercial and industrial2 1.7 7.5
Commercial real estate, domestic 1.5 11.1
Credit cards 0.2 14.9
Other consumer3 0.5 7.9
Other loans4 0.4 3.0
1 Average loan balances used to calculate portfolio loss rates exclude loans held
for sale and loans held for investment under the fair-value option, and are
calculated over nine quarters.2 Commercial and industrial loans include small- and medium-enterprise loans
and corporate cards.3 Other consumer loans include student loans and automobile loans.4 Other loans include international real estate loans.
Risk-weighted assets, actual 2017:Q4 and projected2020:Q1
Billions of dollars
Item Actual
2017:Q4 Projected2020:Q1
Risk-weighted assets1 100.9 105.5
1 For each quarter, risk-weighted assets are calculated under the Board’s
standardized capital risk-based approach in 12 CFR part 217, subpart D.
Projected losses, revenue, and net income before taxesthrough 2020:Q1
Item Billions of
dollars Percent of
average assets1
Pre-provision net revenue2 4.2 3.3
Other revenue3 0.0
less
Provisions 6.0
Realized losses/gains on securities (AFS/HTM) 0.1
Trading and counterparty losses4 0.0
Other losses/gains5 0.0
equals
Net income before taxes -1.8 -1.4
Memo items
Other comprehensive income6 0.0
Other effects on capital Actual 2017:Q4 2020:Q1
AOCI included in capital (billions of dollars)7 0.0 0.0
1 Average assets is the nine-quarter average of total assets.2 Pre-provision net revenue includes losses from operational-risk events and
other real estate owned (OREO) costs.3 Other revenue includes one-time income and (expense) items not included in
pre-provision net revenue.4 Trading and counterparty losses include mark-to-market and credit valuation
adjustment (CVA) losses and losses arising from the counterparty default
scenario component applied to derivatives, securities lending, and repurchase
agreement activities.5 Other losses/gains include projected change in fair value of loans held for sale
and loans held for investment measured under the fair-value option, and
goodwill impairment losses.6 Other comprehensive income (OCI) is only calculated for advanced approaches
firms, and other firms that opt into the advanced approaches treatment of
accumulated other comprehensive income (AOCI).7 Certain aspects of AOCI are subject to transition arrangements for inclusion in
projected regulatory capital. The transition arrangements are 100 percent
included in projected regulatory capital starting in 2018. See 12 CFR
217.300(b)(3).
134 Supervisory Stress Test Methodology and Results
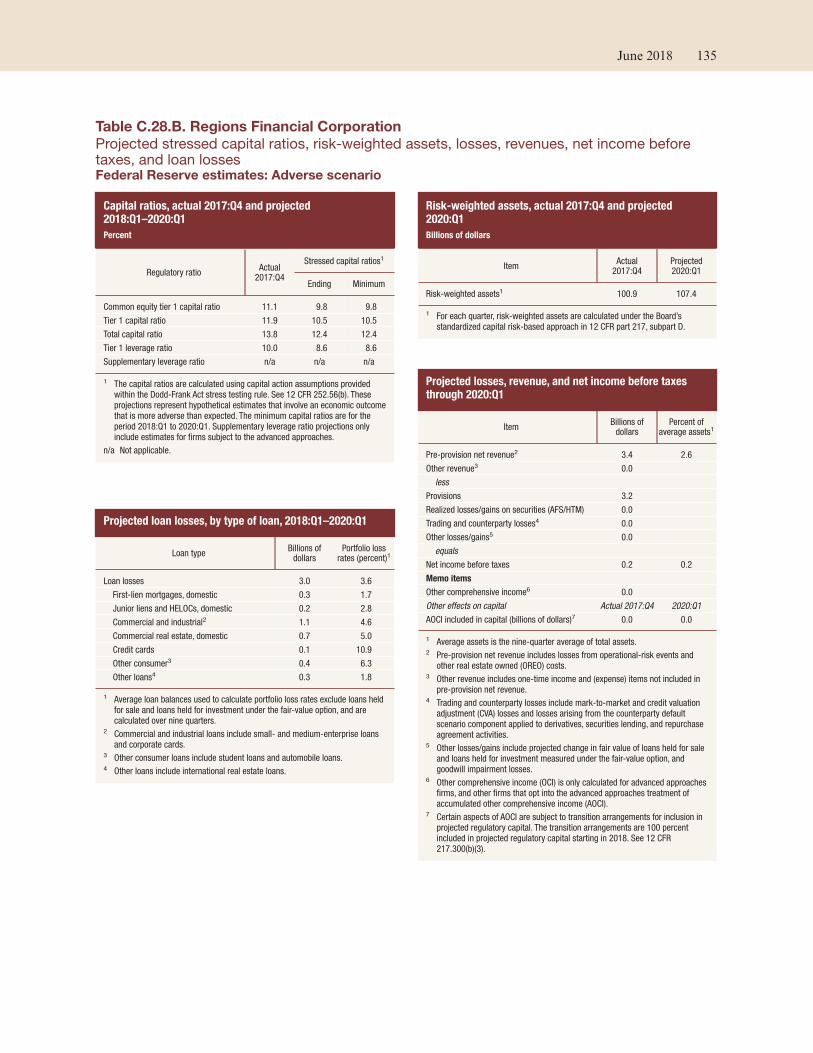
Table C.28.B. Regions Financial Corporation
Projected stressed capital ratios, risk-weighted assets, losses, revenues, net income beforetaxes, and loan lossesFederal Reserve estimates: Adverse scenario
Capital ratios, actual 2017:Q4 and projected2018:Q1–2020:Q1
Percent
Regulatory ratio Actual
2017:Q4
Stressed capital ratios1
Ending Minimum
Common equity tier 1 capital ratio 11.1 9.8 9.8
Tier 1 capital ratio 11.9 10.5 10.5
Total capital ratio 13.8 12.4 12.4
Tier 1 leverage ratio 10.0 8.6 8.6
Supplementary leverage ratio n/a n/a n/a
1 The capital ratios are calculated using capital action assumptions provided
within the Dodd-Frank Act stress testing rule. See 12 CFR 252.56(b). These
projections represent hypothetical estimates that involve an economic outcome
that is more adverse than expected. The minimum capital ratios are for the
period 2018:Q1 to 2020:Q1. Supplementary leverage ratio projections only
include estimates for firms subject to the advanced approaches.
n/a Not applicable.
Projected loan losses, by type of loan, 2018:Q1–2020:Q1
Loan type Billions of
dollars Portfolio loss
rates (percent)1
Loan losses 3.0 3.6
First-lien mortgages, domestic 0.3 1.7
Junior liens and HELOCs, domestic 0.2 2.8
Commercial and industrial2 1.1 4.6
Commercial real estate, domestic 0.7 5.0
Credit cards 0.1 10.9
Other consumer3 0.4 6.3
Other loans4 0.3 1.8
1 Average loan balances used to calculate portfolio loss rates exclude loans held
for sale and loans held for investment under the fair-value option, and are
calculated over nine quarters.2 Commercial and industrial loans include small- and medium-enterprise loans
and corporate cards.3 Other consumer loans include student loans and automobile loans.4 Other loans include international real estate loans.
Risk-weighted assets, actual 2017:Q4 and projected2020:Q1
Billions of dollars
Item Actual
2017:Q4 Projected2020:Q1
Risk-weighted assets1 100.9 107.4
1 For each quarter, risk-weighted assets are calculated under the Board’s
standardized capital risk-based approach in 12 CFR part 217, subpart D.
Projected losses, revenue, and net income before taxesthrough 2020:Q1
Item Billions of
dollars Percent of
average assets1
Pre-provision net revenue2 3.4 2.6
Other revenue3 0.0
less
Provisions 3.2
Realized losses/gains on securities (AFS/HTM) 0.0
Trading and counterparty losses4 0.0
Other losses/gains5 0.0
equals
Net income before taxes 0.2 0.2
Memo items
Other comprehensive income6 0.0
Other effects on capital Actual 2017:Q4 2020:Q1
AOCI included in capital (billions of dollars)7 0.0 0.0
1 Average assets is the nine-quarter average of total assets.2 Pre-provision net revenue includes losses from operational-risk events and
other real estate owned (OREO) costs.3 Other revenue includes one-time income and (expense) items not included in
pre-provision net revenue.4 Trading and counterparty losses include mark-to-market and credit valuation
adjustment (CVA) losses and losses arising from the counterparty default
scenario component applied to derivatives, securities lending, and repurchase
agreement activities.5 Other losses/gains include projected change in fair value of loans held for sale
and loans held for investment measured under the fair-value option, and
goodwill impairment losses.6 Other comprehensive income (OCI) is only calculated for advanced approaches
firms, and other firms that opt into the advanced approaches treatment of
accumulated other comprehensive income (AOCI).7 Certain aspects of AOCI are subject to transition arrangements for inclusion in
projected regulatory capital. The transition arrangements are 100 percent
included in projected regulatory capital starting in 2018. See 12 CFR
217.300(b)(3).
June 2018 135

Table C.29.A. Santander Holdings USA, Inc.
Projected stressed capital ratios, risk-weighted assets, losses, revenues, net income beforetaxes, and loan lossesFederal Reserve estimates: Severely adverse scenario
Capital ratios, actual 2017:Q4 and projected2018:Q1–2020:Q1
Percent
Regulatory ratio Actual
2017:Q4
Stressed capital ratios1
Ending Minimum
Common equity tier 1 capital ratio 16.4 15.9 15.2
Tier 1 capital ratio 17.8 17.0 16.5
Total capital ratio 19.5 18.6 18.2
Tier 1 leverage ratio 14.2 13.2 13.0
Supplementary leverage ratio n/a n/a n/a
1 The capital ratios are calculated using capital action assumptions provided
within the Dodd-Frank Act stress testing rule. See 12 CFR 252.56(b). These
projections represent hypothetical estimates that involve an economic outcome
that is more adverse than expected. The minimum capital ratios are for the
period 2018:Q1 to 2020:Q1. Supplementary leverage ratio projections only
include estimates for firms subject to the advanced approaches.
n/a Not applicable.
Projected loan losses, by type of loan, 2018:Q1–2020:Q1
Loan type Billions of
dollars Portfolio loss
rates (percent)1
Loan losses 8.1 9.9
First-lien mortgages, domestic 0.3 3.4
Junior liens and HELOCs, domestic 0.3 4.6
Commercial and industrial2 0.9 5.8
Commercial real estate, domestic 1.2 7.4
Credit cards 0.1 13.9
Other consumer3 4.8 18.0
Other loans4 0.5 6.6
1 Average loan balances used to calculate portfolio loss rates exclude loans held
for sale and loans held for investment under the fair-value option, and are
calculated over nine quarters.2 Commercial and industrial loans include small- and medium-enterprise loans
and corporate cards.3 Other consumer loans include student loans and automobile loans.4 Other loans include international real estate loans.
Risk-weighted assets, actual 2017:Q4 and projected2020:Q1
Billions of dollars
Item Actual
2017:Q4 Projected2020:Q1
Risk-weighted assets1 99.8 104.3
1 For each quarter, risk-weighted assets are calculated under the Board’s
standardized capital risk-based approach in 12 CFR part 217, subpart D.
Projected losses, revenue, and net income before taxesthrough 2020:Q1
Item Billions of
dollars Percent of
average assets1
Pre-provision net revenue2 8.0 6.0
Other revenue3 0.0
less
Provisions 7.1
Realized losses/gains on securities (AFS/HTM) 0.0
Trading and counterparty losses4 0.0
Other losses/gains5 0.1
equals
Net income before taxes 0.8 0.6
Memo items
Other comprehensive income6 0.0
Other effects on capital Actual 2017:Q4 2020:Q1
AOCI included in capital (billions of dollars)7 0.0 0.0
1 Average assets is the nine-quarter average of total assets.2 Pre-provision net revenue includes losses from operational-risk events and
other real estate owned (OREO) costs.3 Other revenue includes one-time income and (expense) items not included in
pre-provision net revenue.4 Trading and counterparty losses include mark-to-market and credit valuation
adjustment (CVA) losses and losses arising from the counterparty default
scenario component applied to derivatives, securities lending, and repurchase
agreement activities.5 Other losses/gains include projected change in fair value of loans held for sale
and loans held for investment measured under the fair-value option, and
goodwill impairment losses.6 Other comprehensive income (OCI) is only calculated for advanced approaches
firms, and other firms that opt into the advanced approaches treatment of
accumulated other comprehensive income (AOCI).7 Certain aspects of AOCI are subject to transition arrangements for inclusion in
projected regulatory capital. The transition arrangements are 100 percent
included in projected regulatory capital starting in 2018. See 12 CFR
217.300(b)(3).
136 Supervisory Stress Test Methodology and Results

Table C.29.B. Santander Holdings USA, Inc.
Projected stressed capital ratios, risk-weighted assets, losses, revenues, net income beforetaxes, and loan lossesFederal Reserve estimates: Adverse scenario
Capital ratios, actual 2017:Q4 and projected2018:Q1–2020:Q1
Percent
Regulatory ratio Actual
2017:Q4
Stressed capital ratios1
Ending Minimum
Common equity tier 1 capital ratio 16.4 17.9 16.7
Tier 1 capital ratio 17.8 19.2 18.2
Total capital ratio 19.5 20.8 19.9
Tier 1 leverage ratio 14.2 14.9 14.2
Supplementary leverage ratio n/a n/a n/a
1 The capital ratios are calculated using capital action assumptions provided
within the Dodd-Frank Act stress testing rule. See 12 CFR 252.56(b). These
projections represent hypothetical estimates that involve an economic outcome
that is more adverse than expected. The minimum capital ratios are for the
period 2018:Q1 to 2020:Q1. Supplementary leverage ratio projections only
include estimates for firms subject to the advanced approaches.
n/a Not applicable.
Projected loan losses, by type of loan, 2018:Q1–2020:Q1
Loan type Billions of
dollars Portfolio loss
rates (percent)1
Loan losses 5.4 6.5
First-lien mortgages, domestic 0.1 1.4
Junior liens and HELOCs, domestic 0.2 2.7
Commercial and industrial2 0.6 3.7
Commercial real estate, domestic 0.5 2.7
Credit cards 0.1 10.8
Other consumer3 3.7 13.8
Other loans4 0.3 3.9
1 Average loan balances used to calculate portfolio loss rates exclude loans held
for sale and loans held for investment under the fair-value option, and are
calculated over nine quarters.2 Commercial and industrial loans include small- and medium-enterprise loans
and corporate cards.3 Other consumer loans include student loans and automobile loans.4 Other loans include international real estate loans.
Risk-weighted assets, actual 2017:Q4 and projected2020:Q1
Billions of dollars
Item Actual
2017:Q4 Projected2020:Q1
Risk-weighted assets1 99.8 106.7
1 For each quarter, risk-weighted assets are calculated under the Board’s
standardized capital risk-based approach in 12 CFR part 217, subpart D.
Projected losses, revenue, and net income before taxesthrough 2020:Q1
Item Billions of
dollars Percent of
average assets1
Pre-provision net revenue2 7.3 5.4
Other revenue3 0.0
less
Provisions 3.6
Realized losses/gains on securities (AFS/HTM) 0.0
Trading and counterparty losses4 0.0
Other losses/gains5 0.1
equals
Net income before taxes 3.6 2.6
Memo items
Other comprehensive income6 0.0
Other effects on capital Actual 2017:Q4 2020:Q1
AOCI included in capital (billions of dollars)7 0.0 0.0
1 Average assets is the nine-quarter average of total assets.2 Pre-provision net revenue includes losses from operational-risk events and
other real estate owned (OREO) costs.3 Other revenue includes one-time income and (expense) items not included in
pre-provision net revenue.4 Trading and counterparty losses include mark-to-market and credit valuation
adjustment (CVA) losses and losses arising from the counterparty default
scenario component applied to derivatives, securities lending, and repurchase
agreement activities.5 Other losses/gains include projected change in fair value of loans held for sale
and loans held for investment measured under the fair-value option, and
goodwill impairment losses.6 Other comprehensive income (OCI) is only calculated for advanced approaches
firms, and other firms that opt into the advanced approaches treatment of
accumulated other comprehensive income (AOCI).7 Certain aspects of AOCI are subject to transition arrangements for inclusion in
projected regulatory capital. The transition arrangements are 100 percent
included in projected regulatory capital starting in 2018. See 12 CFR
217.300(b)(3).
June 2018 137

Table C.30.A. State Street Corporation
Projected stressed capital ratios, risk-weighted assets, losses, revenues, net income beforetaxes, and loan lossesFederal Reserve estimates: Severely adverse scenario
Capital ratios, actual 2017:Q4 and projected2018:Q1–2020:Q1
Percent
Regulatory ratio Actual
2017:Q4
Stressed capital ratios1
Ending Minimum
Common equity tier 1 capital ratio 11.9 8.4 5.3
Tier 1 capital ratio 15.0 11.9 9.0
Total capital ratio 16.0 12.7 10.0
Tier 1 leverage ratio 7.3 5.5 4.2
Supplementary leverage ratio n/a 4.9 3.7
1 The capital ratios are calculated using capital action assumptions provided
within the Dodd-Frank Act stress testing rule. See 12 CFR 252.56(b). These
projections represent hypothetical estimates that involve an economic outcome
that is more adverse than expected. The minimum capital ratios are for the
period 2018:Q1 to 2020:Q1. Supplementary leverage ratio projections only
include estimates for firms subject to the advanced approaches.
n/a Not applicable.
Projected loan losses, by type of loan, 2018:Q1–2020:Q1
Loan type Billions of
dollars Portfolio loss
rates (percent)1
Loan losses 0.8 3.5
First-lien mortgages, domestic 0.0 0.0
Junior liens and HELOCs, domestic 0.0 0.0
Commercial and industrial2 0.3 7.3
Commercial real estate, domestic 0.0 6.3
Credit cards 0.0 0.0
Other consumer3 0.0 0.6
Other loans4 0.6 2.8
1 Average loan balances used to calculate portfolio loss rates exclude loans held
for sale and loans held for investment under the fair-value option, and are
calculated over nine quarters.2 Commercial and industrial loans include small- and medium-enterprise loans
and corporate cards.3 Other consumer loans include student loans and automobile loans.4 Other loans include international real estate loans.
Risk-weighted assets, actual 2017:Q4 and projected2020:Q1
Billions of dollars
Item Actual
2017:Q4 Projected2020:Q1
Risk-weighted assets1 102.7 104.2
1 For each quarter, risk-weighted assets are calculated under the Board’s
standardized capital risk-based approach in 12 CFR part 217, subpart D.
Projected losses, revenue, and net income before taxesthrough 2020:Q1
Item Billions of
dollars Percent of
average assets1
Pre-provision net revenue2 5.9 2.4
Other revenue3 0.0
less
Provisions 1.0
Realized losses/gains on securities (AFS/HTM) 0.4
Trading and counterparty losses4 3.4
Other losses/gains5 0.0
equals
Net income before taxes 1.0 0.4
Memo items
Other comprehensive income6 -1.4
Other effects on capital Actual 2017:Q4 2020:Q1
AOCI included in capital (billions of dollars)7 -1.0 -2.4
1 Average assets is the nine-quarter average of total assets.2 Pre-provision net revenue includes losses from operational-risk events and
other real estate owned (OREO) costs.3 Other revenue includes one-time income and (expense) items not included in
pre-provision net revenue.4 Trading and counterparty losses include mark-to-market and credit valuation
adjustment (CVA) losses and losses arising from the counterparty default
scenario component applied to derivatives, securities lending, and repurchase
agreement activities.5 Other losses/gains include projected change in fair value of loans held for sale
and loans held for investment measured under the fair-value option, and
goodwill impairment losses.6 Other comprehensive income (OCI) is only calculated for advanced approaches
firms, and other firms that opt into the advanced approaches treatment of
accumulated other comprehensive income (AOCI).7 Certain aspects of AOCI are subject to transition arrangements for inclusion in
projected regulatory capital. The transition arrangements are 100 percent
included in projected regulatory capital starting in 2018. See 12 CFR
217.300(b)(3).
138 Supervisory Stress Test Methodology and Results

Table C.30.B. State Street Corporation
Projected stressed capital ratios, risk-weighted assets, losses, revenues, net income beforetaxes, and loan lossesFederal Reserve estimates: Adverse scenario
Capital ratios, actual 2017:Q4 and projected2018:Q1–2020:Q1
Percent
Regulatory ratio Actual
2017:Q4
Stressed capital ratios1
Ending Minimum
Common equity tier 1 capital ratio 11.9 10.9 10.6
Tier 1 capital ratio 15.0 14.4 14.3
Total capital ratio 16.0 15.1 15.0
Tier 1 leverage ratio 7.3 6.5 6.5
Supplementary leverage ratio n/a 5.8 5.8
1 The capital ratios are calculated using capital action assumptions provided
within the Dodd-Frank Act stress testing rule. See 12 CFR 252.56(b). These
projections represent hypothetical estimates that involve an economic outcome
that is more adverse than expected. The minimum capital ratios are for the
period 2018:Q1 to 2020:Q1. Supplementary leverage ratio projections only
include estimates for firms subject to the advanced approaches.
n/a Not applicable.
Projected loan losses, by type of loan, 2018:Q1–2020:Q1
Loan type Billions of
dollars Portfolio loss
rates (percent)1
Loan losses 0.5 2.3
First-lien mortgages, domestic 0.0 0.0
Junior liens and HELOCs, domestic 0.0 0.0
Commercial and industrial2 0.2 4.2
Commercial real estate, domestic 0.0 2.1
Credit cards 0.0 0.0
Other consumer3 0.0 0.6
Other loans4 0.4 1.9
1 Average loan balances used to calculate portfolio loss rates exclude loans held
for sale and loans held for investment under the fair-value option, and are
calculated over nine quarters.2 Commercial and industrial loans include small- and medium-enterprise loans
and corporate cards.3 Other consumer loans include student loans and automobile loans.4 Other loans include international real estate loans.
Risk-weighted assets, actual 2017:Q4 and projected2020:Q1
Billions of dollars
Item Actual
2017:Q4 Projected2020:Q1
Risk-weighted assets1 102.7 105.0
1 For each quarter, risk-weighted assets are calculated under the Board’s
standardized capital risk-based approach in 12 CFR part 217, subpart D.
Projected losses, revenue, and net income before taxesthrough 2020:Q1
Item Billions of
dollars Percent of
average assets1
Pre-provision net revenue2 4.3 1.7
Other revenue3 0.0
less
Provisions 0.7
Realized losses/gains on securities (AFS/HTM) 0.1
Trading and counterparty losses4 1.3
Other losses/gains5 0.0
equals
Net income before taxes 2.2 0.9
Memo items
Other comprehensive income6 0.3
Other effects on capital Actual 2017:Q4 2020:Q1
AOCI included in capital (billions of dollars)7 -1.0 -0.7
1 Average assets is the nine-quarter average of total assets.2 Pre-provision net revenue includes losses from operational-risk events and
other real estate owned (OREO) costs.3 Other revenue includes one-time income and (expense) items not included in
pre-provision net revenue.4 Trading and counterparty losses include mark-to-market and credit valuation
adjustment (CVA) losses and losses arising from the counterparty default
scenario component applied to derivatives, securities lending, and repurchase
agreement activities.5 Other losses/gains include projected change in fair value of loans held for sale
and loans held for investment measured under the fair-value option, and
goodwill impairment losses.6 Other comprehensive income (OCI) is only calculated for advanced approaches
firms, and other firms that opt into the advanced approaches treatment of
accumulated other comprehensive income (AOCI).7 Certain aspects of AOCI are subject to transition arrangements for inclusion in
projected regulatory capital. The transition arrangements are 100 percent
included in projected regulatory capital starting in 2018. See 12 CFR
217.300(b)(3).
June 2018 139

Table C.31.A. SunTrust Banks, Inc.
Projected stressed capital ratios, risk-weighted assets, losses, revenues, net income beforetaxes, and loan lossesFederal Reserve estimates: Severely adverse scenario
Capital ratios, actual 2017:Q4 and projected2018:Q1–2020:Q1
Percent
Regulatory ratio Actual
2017:Q4
Stressed capital ratios1
Ending Minimum
Common equity tier 1 capital ratio 9.7 6.6 6.6
Tier 1 capital ratio 11.2 7.7 7.7
Total capital ratio 13.1 9.8 9.8
Tier 1 leverage ratio 9.8 6.7 6.7
Supplementary leverage ratio n/a n/a n/a
1 The capital ratios are calculated using capital action assumptions provided
within the Dodd-Frank Act stress testing rule. See 12 CFR 252.56(b). These
projections represent hypothetical estimates that involve an economic outcome
that is more adverse than expected. The minimum capital ratios are for the
period 2018:Q1 to 2020:Q1. Supplementary leverage ratio projections only
include estimates for firms subject to the advanced approaches.
n/a Not applicable.
Projected loan losses, by type of loan, 2018:Q1–2020:Q1
Loan type Billions of
dollars Portfolio loss
rates (percent)1
Loan losses 7.5 5.2
First-lien mortgages, domestic 1.0 3.6
Junior liens and HELOCs, domestic 0.7 6.7
Commercial and industrial2 2.3 5.5
Commercial real estate, domestic 1.4 7.3
Credit cards 0.2 13.8
Other consumer3 1.5 5.2
Other loans4 0.4 2.5
1 Average loan balances used to calculate portfolio loss rates exclude loans held
for sale and loans held for investment under the fair-value option, and are
calculated over nine quarters.2 Commercial and industrial loans include small- and medium-enterprise loans
and corporate cards.3 Other consumer loans include student loans and automobile loans.4 Other loans include international real estate loans.
Risk-weighted assets, actual 2017:Q4 and projected2020:Q1
Billions of dollars
Item Actual
2017:Q4 Projected2020:Q1
Risk-weighted assets1 175.9 184.2
1 For each quarter, risk-weighted assets are calculated under the Board’s
standardized capital risk-based approach in 12 CFR part 217, subpart D.
Projected losses, revenue, and net income before taxesthrough 2020:Q1
Item Billions of
dollars Percent of
average assets1
Pre-provision net revenue2 6.1 2.8
Other revenue3 0.0
less
Provisions 8.5
Realized losses/gains on securities (AFS/HTM) 0.1
Trading and counterparty losses4 0.0
Other losses/gains5 0.3
equals
Net income before taxes -2.8 -1.3
Memo items
Other comprehensive income6 0.0
Other effects on capital Actual 2017:Q4 2020:Q1
AOCI included in capital (billions of dollars)7 0.0 0.0
1 Average assets is the nine-quarter average of total assets.2 Pre-provision net revenue includes losses from operational-risk events and
other real estate owned (OREO) costs.3 Other revenue includes one-time income and (expense) items not included in
pre-provision net revenue.4 Trading and counterparty losses include mark-to-market and credit valuation
adjustment (CVA) losses and losses arising from the counterparty default
scenario component applied to derivatives, securities lending, and repurchase
agreement activities.5 Other losses/gains include projected change in fair value of loans held for sale
and loans held for investment measured under the fair-value option, and
goodwill impairment losses.6 Other comprehensive income (OCI) is only calculated for advanced approaches
firms, and other firms that opt into the advanced approaches treatment of
accumulated other comprehensive income (AOCI).7 Certain aspects of AOCI are subject to transition arrangements for inclusion in
projected regulatory capital. The transition arrangements are 100 percent
included in projected regulatory capital starting in 2018. See 12 CFR
217.300(b)(3).
140 Supervisory Stress Test Methodology and Results

Table C.31.B. SunTrust Banks, Inc.
Projected stressed capital ratios, risk-weighted assets, losses, revenues, net income beforetaxes, and loan lossesFederal Reserve estimates: Adverse scenario
Capital ratios, actual 2017:Q4 and projected2018:Q1–2020:Q1
Percent
Regulatory ratio Actual
2017:Q4
Stressed capital ratios1
Ending Minimum
Common equity tier 1 capital ratio 9.7 8.3 8.3
Tier 1 capital ratio 11.2 9.4 9.4
Total capital ratio 13.1 11.3 11.3
Tier 1 leverage ratio 9.8 8.1 8.1
Supplementary leverage ratio n/a n/a n/a
1 The capital ratios are calculated using capital action assumptions provided
within the Dodd-Frank Act stress testing rule. See 12 CFR 252.56(b). These
projections represent hypothetical estimates that involve an economic outcome
that is more adverse than expected. The minimum capital ratios are for the
period 2018:Q1 to 2020:Q1. Supplementary leverage ratio projections only
include estimates for firms subject to the advanced approaches.
n/a Not applicable.
Projected loan losses, by type of loan, 2018:Q1–2020:Q1
Loan type Billions of
dollars Portfolio loss
rates (percent)1
Loan losses 4.3 2.9
First-lien mortgages, domestic 0.4 1.6
Junior liens and HELOCs, domestic 0.4 3.4
Commercial and industrial2 1.4 3.2
Commercial real estate, domestic 0.6 2.9
Credit cards 0.2 9.8
Other consumer3 1.2 4.1
Other loans4 0.2 1.5
1 Average loan balances used to calculate portfolio loss rates exclude loans held
for sale and loans held for investment under the fair-value option, and are
calculated over nine quarters.2 Commercial and industrial loans include small- and medium-enterprise loans
and corporate cards.3 Other consumer loans include student loans and automobile loans.4 Other loans include international real estate loans.
Risk-weighted assets, actual 2017:Q4 and projected2020:Q1
Billions of dollars
Item Actual
2017:Q4 Projected2020:Q1
Risk-weighted assets1 175.9 188.5
1 For each quarter, risk-weighted assets are calculated under the Board’s
standardized capital risk-based approach in 12 CFR part 217, subpart D.
Projected losses, revenue, and net income before taxesthrough 2020:Q1
Item Billions of
dollars Percent of
average assets1
Pre-provision net revenue2 5.6 2.6
Other revenue3 0.0
less
Provisions 4.5
Realized losses/gains on securities (AFS/HTM) 0.0
Trading and counterparty losses4 0.0
Other losses/gains5 0.3
equals
Net income before taxes 0.8 0.4
Memo items
Other comprehensive income6 0.0
Other effects on capital Actual 2017:Q4 2020:Q1
AOCI included in capital (billions of dollars)7 0.0 0.0
1 Average assets is the nine-quarter average of total assets.2 Pre-provision net revenue includes losses from operational-risk events and
other real estate owned (OREO) costs.3 Other revenue includes one-time income and (expense) items not included in
pre-provision net revenue.4 Trading and counterparty losses include mark-to-market and credit valuation
adjustment (CVA) losses and losses arising from the counterparty default
scenario component applied to derivatives, securities lending, and repurchase
agreement activities.5 Other losses/gains include projected change in fair value of loans held for sale
and loans held for investment measured under the fair-value option, and
goodwill impairment losses.6 Other comprehensive income (OCI) is only calculated for advanced approaches
firms, and other firms that opt into the advanced approaches treatment of
accumulated other comprehensive income (AOCI).7 Certain aspects of AOCI are subject to transition arrangements for inclusion in
projected regulatory capital. The transition arrangements are 100 percent
included in projected regulatory capital starting in 2018. See 12 CFR
217.300(b)(3).
June 2018 141
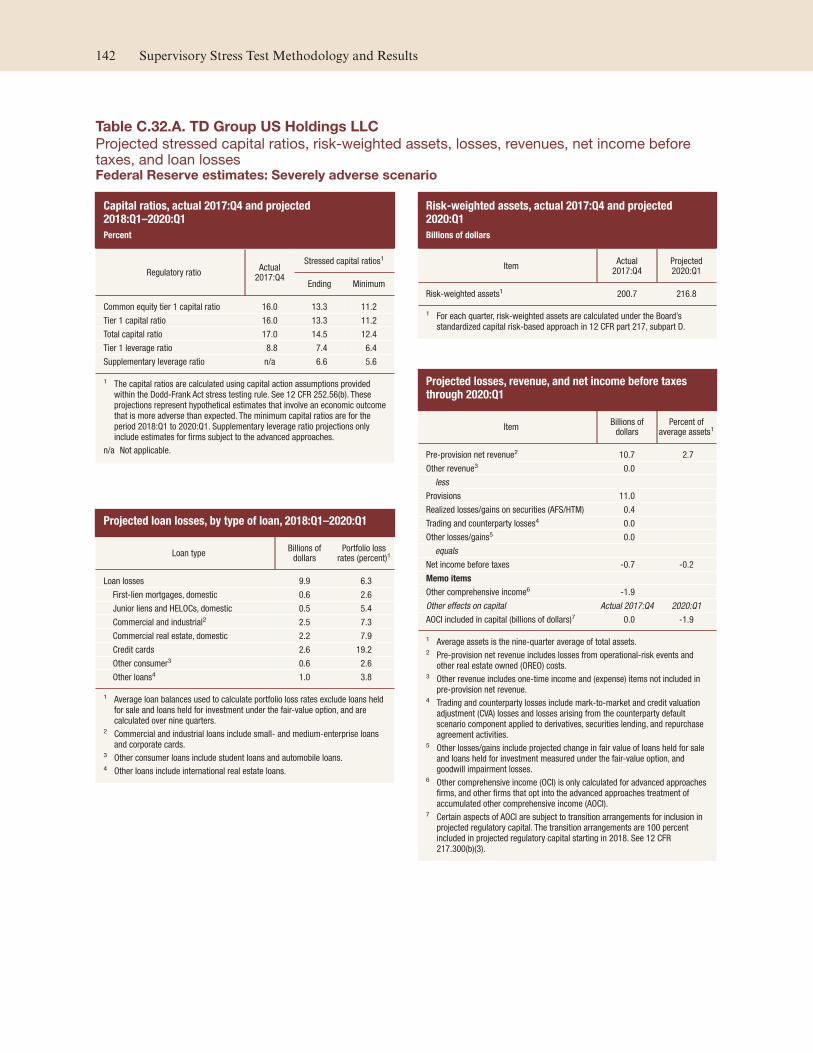
Table C.32.A. TD Group US Holdings LLC
Projected stressed capital ratios, risk-weighted assets, losses, revenues, net income beforetaxes, and loan lossesFederal Reserve estimates: Severely adverse scenario
Capital ratios, actual 2017:Q4 and projected2018:Q1–2020:Q1
Percent
Regulatory ratio Actual
2017:Q4
Stressed capital ratios1
Ending Minimum
Common equity tier 1 capital ratio 16.0 13.3 11.2
Tier 1 capital ratio 16.0 13.3 11.2
Total capital ratio 17.0 14.5 12.4
Tier 1 leverage ratio 8.8 7.4 6.4
Supplementary leverage ratio n/a 6.6 5.6
1 The capital ratios are calculated using capital action assumptions provided
within the Dodd-Frank Act stress testing rule. See 12 CFR 252.56(b). These
projections represent hypothetical estimates that involve an economic outcome
that is more adverse than expected. The minimum capital ratios are for the
period 2018:Q1 to 2020:Q1. Supplementary leverage ratio projections only
include estimates for firms subject to the advanced approaches.
n/a Not applicable.
Projected loan losses, by type of loan, 2018:Q1–2020:Q1
Loan type Billions of
dollars Portfolio loss
rates (percent)1
Loan losses 9.9 6.3
First-lien mortgages, domestic 0.6 2.6
Junior liens and HELOCs, domestic 0.5 5.4
Commercial and industrial2 2.5 7.3
Commercial real estate, domestic 2.2 7.9
Credit cards 2.6 19.2
Other consumer3 0.6 2.6
Other loans4 1.0 3.8
1 Average loan balances used to calculate portfolio loss rates exclude loans held
for sale and loans held for investment under the fair-value option, and are
calculated over nine quarters.2 Commercial and industrial loans include small- and medium-enterprise loans
and corporate cards.3 Other consumer loans include student loans and automobile loans.4 Other loans include international real estate loans.
Risk-weighted assets, actual 2017:Q4 and projected2020:Q1
Billions of dollars
Item Actual
2017:Q4 Projected2020:Q1
Risk-weighted assets1 200.7 216.8
1 For each quarter, risk-weighted assets are calculated under the Board’s
standardized capital risk-based approach in 12 CFR part 217, subpart D.
Projected losses, revenue, and net income before taxesthrough 2020:Q1
Item Billions of
dollars Percent of
average assets1
Pre-provision net revenue2 10.7 2.7
Other revenue3 0.0
less
Provisions 11.0
Realized losses/gains on securities (AFS/HTM) 0.4
Trading and counterparty losses4 0.0
Other losses/gains5 0.0
equals
Net income before taxes -0.7 -0.2
Memo items
Other comprehensive income6 -1.9
Other effects on capital Actual 2017:Q4 2020:Q1
AOCI included in capital (billions of dollars)7 0.0 -1.9
1 Average assets is the nine-quarter average of total assets.2 Pre-provision net revenue includes losses from operational-risk events and
other real estate owned (OREO) costs.3 Other revenue includes one-time income and (expense) items not included in
pre-provision net revenue.4 Trading and counterparty losses include mark-to-market and credit valuation
adjustment (CVA) losses and losses arising from the counterparty default
scenario component applied to derivatives, securities lending, and repurchase
agreement activities.5 Other losses/gains include projected change in fair value of loans held for sale
and loans held for investment measured under the fair-value option, and
goodwill impairment losses.6 Other comprehensive income (OCI) is only calculated for advanced approaches
firms, and other firms that opt into the advanced approaches treatment of
accumulated other comprehensive income (AOCI).7 Certain aspects of AOCI are subject to transition arrangements for inclusion in
projected regulatory capital. The transition arrangements are 100 percent
included in projected regulatory capital starting in 2018. See 12 CFR
217.300(b)(3).
142 Supervisory Stress Test Methodology and Results

Table C.32.B. TD Group US Holdings LLC
Projected stressed capital ratios, risk-weighted assets, losses, revenues, net income beforetaxes, and loan lossesFederal Reserve estimates: Adverse scenario
Capital ratios, actual 2017:Q4 and projected2018:Q1–2020:Q1
Percent
Regulatory ratio Actual
2017:Q4
Stressed capital ratios1
Ending Minimum
Common equity tier 1 capital ratio 16.0 14.4 13.7
Tier 1 capital ratio 16.0 14.4 13.7
Total capital ratio 17.0 15.3 14.8
Tier 1 leverage ratio 8.8 7.9 7.7
Supplementary leverage ratio n/a 7.0 6.8
1 The capital ratios are calculated using capital action assumptions provided
within the Dodd-Frank Act stress testing rule. See 12 CFR 252.56(b). These
projections represent hypothetical estimates that involve an economic outcome
that is more adverse than expected. The minimum capital ratios are for the
period 2018:Q1 to 2020:Q1. Supplementary leverage ratio projections only
include estimates for firms subject to the advanced approaches.
n/a Not applicable.
Projected loan losses, by type of loan, 2018:Q1–2020:Q1
Loan type Billions of
dollars Portfolio loss
rates (percent)1
Loan losses 6.1 3.9
First-lien mortgages, domestic 0.3 1.3
Junior liens and HELOCs, domestic 0.3 3.3
Commercial and industrial2 1.5 4.4
Commercial real estate, domestic 0.9 3.2
Credit cards 2.0 14.9
Other consumer3 0.5 1.9
Other loans4 0.6 2.3
1 Average loan balances used to calculate portfolio loss rates exclude loans held
for sale and loans held for investment under the fair-value option, and are
calculated over nine quarters.2 Commercial and industrial loans include small- and medium-enterprise loans
and corporate cards.3 Other consumer loans include student loans and automobile loans.4 Other loans include international real estate loans.
Risk-weighted assets, actual 2017:Q4 and projected2020:Q1
Billions of dollars
Item Actual
2017:Q4 Projected2020:Q1
Risk-weighted assets1 200.7 219.0
1 For each quarter, risk-weighted assets are calculated under the Board’s
standardized capital risk-based approach in 12 CFR part 217, subpart D.
Projected losses, revenue, and net income before taxesthrough 2020:Q1
Item Billions of
dollars Percent of
average assets1
Pre-provision net revenue2 6.9 1.7
Other revenue3 0.0
less
Provisions 6.1
Realized losses/gains on securities (AFS/HTM) 0.1
Trading and counterparty losses4 0.0
Other losses/gains5 0.0
equals
Net income before taxes 0.6 0.2
Memo items
Other comprehensive income6 -0.6
Other effects on capital Actual 2017:Q4 2020:Q1
AOCI included in capital (billions of dollars)7 0.0 -0.5
1 Average assets is the nine-quarter average of total assets.2 Pre-provision net revenue includes losses from operational-risk events and
other real estate owned (OREO) costs.3 Other revenue includes one-time income and (expense) items not included in
pre-provision net revenue.4 Trading and counterparty losses include mark-to-market and credit valuation
adjustment (CVA) losses and losses arising from the counterparty default
scenario component applied to derivatives, securities lending, and repurchase
agreement activities.5 Other losses/gains include projected change in fair value of loans held for sale
and loans held for investment measured under the fair-value option, and
goodwill impairment losses.6 Other comprehensive income (OCI) is only calculated for advanced approaches
firms, and other firms that opt into the advanced approaches treatment of
accumulated other comprehensive income (AOCI).7 Certain aspects of AOCI are subject to transition arrangements for inclusion in
projected regulatory capital. The transition arrangements are 100 percent
included in projected regulatory capital starting in 2018. See 12 CFR
217.300(b)(3).
June 2018 143

Table C.33.A. UBS Americas Holding LLC
Projected stressed capital ratios, risk-weighted assets, losses, revenues, net income beforetaxes, and loan lossesFederal Reserve estimates: Severely adverse scenario
Capital ratios, actual 2017:Q4 and projected2018:Q1–2020:Q1
Percent
Regulatory ratio Actual
2017:Q4
Stressed capital ratios1
Ending Minimum
Common equity tier 1 capital ratio 21.9 17.4 16.4
Tier 1 capital ratio 24.3 21.6 20.6
Total capital ratio 25.8 24.0 22.9
Tier 1 leverage ratio 8.9 7.8 7.5
Supplementary leverage ratio n/a n/a n/a
1 The capital ratios are calculated using capital action assumptions provided
within the Dodd-Frank Act stress testing rule. See 12 CFR 252.56(b). These
projections represent hypothetical estimates that involve an economic outcome
that is more adverse than expected. The minimum capital ratios are for the
period 2018:Q1 to 2020:Q1. Supplementary leverage ratio projections only
include estimates for firms subject to the advanced approaches.
n/a Not applicable.
Projected loan losses, by type of loan, 2018:Q1–2020:Q1
Loan type Billions of
dollars Portfolio loss
rates (percent)1
Loan losses 1.8 3.0
First-lien mortgages, domestic 0.3 2.4
Junior liens and HELOCs, domestic 0.0 0.0
Commercial and industrial2 0.6 10.2
Commercial real estate, domestic 0.0 5.4
Credit cards 0.0 14.7
Other consumer3 0.1 0.6
Other loans4 0.7 4.1
1 Average loan balances used to calculate portfolio loss rates exclude loans held
for sale and loans held for investment under the fair-value option, and are
calculated over nine quarters.2 Commercial and industrial loans include small- and medium-enterprise loans
and corporate cards.3 Other consumer loans include student loans and automobile loans.4 Other loans include international real estate loans.
Risk-weighted assets, actual 2017:Q4 and projected2020:Q1
Billions of dollars
Item Actual
2017:Q4 Projected2020:Q1
Risk-weighted assets1 49.6 51.9
1 For each quarter, risk-weighted assets are calculated under the Board’s
standardized capital risk-based approach in 12 CFR part 217, subpart D.
Projected losses, revenue, and net income before taxesthrough 2020:Q1
Item Billions of
dollars Percent of
average assets1
Pre-provision net revenue2 3.1 2.1
Other revenue3 0.0
less
Provisions 2.5
Realized losses/gains on securities (AFS/HTM) 0.0
Trading and counterparty losses4 0.6
Other losses/gains5 0.0
equals
Net income before taxes 0.0 0.0
Memo items
Other comprehensive income6 0.0
Other effects on capital Actual 2017:Q4 2020:Q1
AOCI included in capital (billions of dollars)7 0.0 0.0
1 Average assets is the nine-quarter average of total assets.2 Pre-provision net revenue includes losses from operational-risk events and
other real estate owned (OREO) costs.3 Other revenue includes one-time income and (expense) items not included in
pre-provision net revenue.4 Trading and counterparty losses include mark-to-market and credit valuation
adjustment (CVA) losses and losses arising from the counterparty default
scenario component applied to derivatives, securities lending, and repurchase
agreement activities.5 Other losses/gains include projected change in fair value of loans held for sale
and loans held for investment measured under the fair-value option, and
goodwill impairment losses.6 Other comprehensive income (OCI) is only calculated for advanced approaches
firms, and other firms that opt into the advanced approaches treatment of
accumulated other comprehensive income (AOCI).7 Certain aspects of AOCI are subject to transition arrangements for inclusion in
projected regulatory capital. The transition arrangements are 100 percent
included in projected regulatory capital starting in 2018. See 12 CFR
217.300(b)(3).
144 Supervisory Stress Test Methodology and Results

Table C.33.B. UBS Americas Holding LLC
Projected stressed capital ratios, risk-weighted assets, losses, revenues, net income beforetaxes, and loan lossesFederal Reserve estimates: Adverse scenario
Capital ratios, actual 2017:Q4 and projected2018:Q1–2020:Q1
Percent
Regulatory ratio Actual
2017:Q4
Stressed capital ratios1
Ending Minimum
Common equity tier 1 capital ratio 21.9 18.7 17.7
Tier 1 capital ratio 24.3 22.7 22.0
Total capital ratio 25.8 24.8 23.5
Tier 1 leverage ratio 8.9 8.2 8.0
Supplementary leverage ratio n/a n/a n/a
1 The capital ratios are calculated using capital action assumptions provided
within the Dodd-Frank Act stress testing rule. See 12 CFR 252.56(b). These
projections represent hypothetical estimates that involve an economic outcome
that is more adverse than expected. The minimum capital ratios are for the
period 2018:Q1 to 2020:Q1. Supplementary leverage ratio projections only
include estimates for firms subject to the advanced approaches.
n/a Not applicable.
Projected loan losses, by type of loan, 2018:Q1–2020:Q1
Loan type Billions of
dollars Portfolio loss
rates (percent)1
Loan losses 1.1 1.8
First-lien mortgages, domestic 0.1 0.8
Junior liens and HELOCs, domestic 0.0 0.0
Commercial and industrial2 0.4 5.9
Commercial real estate, domestic 0.0 1.8
Credit cards 0.0 10.6
Other consumer3 0.1 0.6
Other loans4 0.4 2.5
1 Average loan balances used to calculate portfolio loss rates exclude loans held
for sale and loans held for investment under the fair-value option, and are
calculated over nine quarters.2 Commercial and industrial loans include small- and medium-enterprise loans
and corporate cards.3 Other consumer loans include student loans and automobile loans.4 Other loans include international real estate loans.
Risk-weighted assets, actual 2017:Q4 and projected2020:Q1
Billions of dollars
Item Actual
2017:Q4 Projected2020:Q1
Risk-weighted assets1 49.6 53.7
1 For each quarter, risk-weighted assets are calculated under the Board’s
standardized capital risk-based approach in 12 CFR part 217, subpart D.
Projected losses, revenue, and net income before taxesthrough 2020:Q1
Item Billions of
dollars Percent of
average assets1
Pre-provision net revenue2 2.9 2.0
Other revenue3 0.0
less
Provisions 1.5
Realized losses/gains on securities (AFS/HTM) 0.0
Trading and counterparty losses4 0.4
Other losses/gains5 0.0
equals
Net income before taxes 1.1 0.7
Memo items
Other comprehensive income6 0.0
Other effects on capital Actual 2017:Q4 2020:Q1
AOCI included in capital (billions of dollars)7 0.0 0.0
1 Average assets is the nine-quarter average of total assets.2 Pre-provision net revenue includes losses from operational-risk events and
other real estate owned (OREO) costs.3 Other revenue includes one-time income and (expense) items not included in
pre-provision net revenue.4 Trading and counterparty losses include mark-to-market and credit valuation
adjustment (CVA) losses and losses arising from the counterparty default
scenario component applied to derivatives, securities lending, and repurchase
agreement activities.5 Other losses/gains include projected change in fair value of loans held for sale
and loans held for investment measured under the fair-value option, and
goodwill impairment losses.6 Other comprehensive income (OCI) is only calculated for advanced approaches
firms, and other firms that opt into the advanced approaches treatment of
accumulated other comprehensive income (AOCI).7 Certain aspects of AOCI are subject to transition arrangements for inclusion in
projected regulatory capital. The transition arrangements are 100 percent
included in projected regulatory capital starting in 2018. See 12 CFR
217.300(b)(3).
June 2018 145

Table C.34.A. U.S. Bancorp
Projected stressed capital ratios, risk-weighted assets, losses, revenues, net income beforetaxes, and loan lossesFederal Reserve estimates: Severely adverse scenario
Capital ratios, actual 2017:Q4 and projected2018:Q1–2020:Q1
Percent
Regulatory ratio Actual
2017:Q4
Stressed capital ratios1
Ending Minimum
Common equity tier 1 capital ratio 9.3 7.7 7.5
Tier 1 capital ratio 10.8 9.1 8.9
Total capital ratio 12.9 11.0 10.8
Tier 1 leverage ratio 8.9 7.5 7.4
Supplementary leverage ratio n/a 6.0 5.9
1 The capital ratios are calculated using capital action assumptions provided
within the Dodd-Frank Act stress testing rule. See 12 CFR 252.56(b). These
projections represent hypothetical estimates that involve an economic outcome
that is more adverse than expected. The minimum capital ratios are for the
period 2018:Q1 to 2020:Q1. Supplementary leverage ratio projections only
include estimates for firms subject to the advanced approaches.
n/a Not applicable.
Projected loan losses, by type of loan, 2018:Q1–2020:Q1
Loan type Billions of
dollars Portfolio loss
rates (percent)1
Loan losses 18.3 6.4
First-lien mortgages, domestic 1.4 2.2
Junior liens and HELOCs, domestic 0.9 5.3
Commercial and industrial2 5.5 7.2
Commercial real estate, domestic 4.2 11.0
Credit cards 3.5 15.6
Other consumer3 1.4 3.4
Other loans4 1.3 5.0
1 Average loan balances used to calculate portfolio loss rates exclude loans held
for sale and loans held for investment under the fair-value option, and are
calculated over nine quarters.2 Commercial and industrial loans include small- and medium-enterprise loans
and corporate cards.3 Other consumer loans include student loans and automobile loans.4 Other loans include international real estate loans.
Risk-weighted assets, actual 2017:Q4 and projected2020:Q1
Billions of dollars
Item Actual
2017:Q4 Projected2020:Q1
Risk-weighted assets1 367.8 392.7
1 For each quarter, risk-weighted assets are calculated under the Board’s
standardized capital risk-based approach in 12 CFR part 217, subpart D.
Projected losses, revenue, and net income before taxesthrough 2020:Q1
Item Billions of
dollars Percent of
average assets1
Pre-provision net revenue2 20.8 4.3
Other revenue3 0.0
less
Provisions 19.8
Realized losses/gains on securities (AFS/HTM) 0.0
Trading and counterparty losses4 0.0
Other losses/gains5 0.0
equals
Net income before taxes 1.1 0.2
Memo items
Other comprehensive income6 0.1
Other effects on capital Actual 2017:Q4 2020:Q1
AOCI included in capital (billions of dollars)7 -1.2 -1.4
1 Average assets is the nine-quarter average of total assets.2 Pre-provision net revenue includes losses from operational-risk events and
other real estate owned (OREO) costs.3 Other revenue includes one-time income and (expense) items not included in
pre-provision net revenue.4 Trading and counterparty losses include mark-to-market and credit valuation
adjustment (CVA) losses and losses arising from the counterparty default
scenario component applied to derivatives, securities lending, and repurchase
agreement activities.5 Other losses/gains include projected change in fair value of loans held for sale
and loans held for investment measured under the fair-value option, and
goodwill impairment losses.6 Other comprehensive income (OCI) is only calculated for advanced approaches
firms, and other firms that opt into the advanced approaches treatment of
accumulated other comprehensive income (AOCI).7 Certain aspects of AOCI are subject to transition arrangements for inclusion in
projected regulatory capital. The transition arrangements are 100 percent
included in projected regulatory capital starting in 2018. See 12 CFR
217.300(b)(3).
146 Supervisory Stress Test Methodology and Results

Table C.34.B. U.S. Bancorp
Projected stressed capital ratios, risk-weighted assets, losses, revenues, net income beforetaxes, and loan lossesFederal Reserve estimates: Adverse scenario
Capital ratios, actual 2017:Q4 and projected2018:Q1–2020:Q1
Percent
Regulatory ratio Actual
2017:Q4
Stressed capital ratios1
Ending Minimum
Common equity tier 1 capital ratio 9.3 9.4 9.3
Tier 1 capital ratio 10.8 10.8 10.7
Total capital ratio 12.9 12.3 12.3
Tier 1 leverage ratio 8.9 8.7 8.7
Supplementary leverage ratio n/a 7.0 7.0
1 The capital ratios are calculated using capital action assumptions provided
within the Dodd-Frank Act stress testing rule. See 12 CFR 252.56(b). These
projections represent hypothetical estimates that involve an economic outcome
that is more adverse than expected. The minimum capital ratios are for the
period 2018:Q1 to 2020:Q1. Supplementary leverage ratio projections only
include estimates for firms subject to the advanced approaches.
n/a Not applicable.
Projected loan losses, by type of loan, 2018:Q1–2020:Q1
Loan type Billions of
dollars Portfolio loss
rates (percent)1
Loan losses 10.6 3.7
First-lien mortgages, domestic 0.4 0.7
Junior liens and HELOCs, domestic 0.4 2.6
Commercial and industrial2 3.6 4.6
Commercial real estate, domestic 1.7 4.4
Credit cards 2.7 11.7
Other consumer3 1.0 2.4
Other loans4 0.8 3.1
1 Average loan balances used to calculate portfolio loss rates exclude loans held
for sale and loans held for investment under the fair-value option, and are
calculated over nine quarters.2 Commercial and industrial loans include small- and medium-enterprise loans
and corporate cards.3 Other consumer loans include student loans and automobile loans.4 Other loans include international real estate loans.
Risk-weighted assets, actual 2017:Q4 and projected2020:Q1
Billions of dollars
Item Actual
2017:Q4 Projected2020:Q1
Risk-weighted assets1 367.8 397.8
1 For each quarter, risk-weighted assets are calculated under the Board’s
standardized capital risk-based approach in 12 CFR part 217, subpart D.
Projected losses, revenue, and net income before taxesthrough 2020:Q1
Item Billions of
dollars Percent of
average assets1
Pre-provision net revenue2 18.3 3.8
Other revenue3 0.0
less
Provisions 10.3
Realized losses/gains on securities (AFS/HTM) 0.0
Trading and counterparty losses4 0.0
Other losses/gains5 0.0
equals
Net income before taxes 8.0 1.6
Memo items
Other comprehensive income6 1.7
Other effects on capital Actual 2017:Q4 2020:Q1
AOCI included in capital (billions of dollars)7 -1.2 0.3
1 Average assets is the nine-quarter average of total assets.2 Pre-provision net revenue includes losses from operational-risk events and
other real estate owned (OREO) costs.3 Other revenue includes one-time income and (expense) items not included in
pre-provision net revenue.4 Trading and counterparty losses include mark-to-market and credit valuation
adjustment (CVA) losses and losses arising from the counterparty default
scenario component applied to derivatives, securities lending, and repurchase
agreement activities.5 Other losses/gains include projected change in fair value of loans held for sale
and loans held for investment measured under the fair-value option, and
goodwill impairment losses.6 Other comprehensive income (OCI) is only calculated for advanced approaches
firms, and other firms that opt into the advanced approaches treatment of
accumulated other comprehensive income (AOCI).7 Certain aspects of AOCI are subject to transition arrangements for inclusion in
projected regulatory capital. The transition arrangements are 100 percent
included in projected regulatory capital starting in 2018. See 12 CFR
217.300(b)(3).
June 2018 147

Table C.35.A. Wells Fargo & Company
Projected stressed capital ratios, risk-weighted assets, losses, revenues, net income beforetaxes, and loan lossesFederal Reserve estimates: Severely adverse scenario
Capital ratios, actual 2017:Q4 and projected2018:Q1–2020:Q1
Percent
Regulatory ratio Actual
2017:Q4
Stressed capital ratios1
Ending Minimum
Common equity tier 1 capital ratio 12.3 9.9 8.6
Tier 1 capital ratio 14.1 11.6 10.4
Total capital ratio 17.5 14.9 13.8
Tier 1 leverage ratio 9.4 7.6 6.9
Supplementary leverage ratio n/a 6.5 5.9
1 The capital ratios are calculated using capital action assumptions provided
within the Dodd-Frank Act stress testing rule. See 12 CFR 252.56(b). These
projections represent hypothetical estimates that involve an economic outcome
that is more adverse than expected. The minimum capital ratios are for the
period 2018:Q1 to 2020:Q1. Supplementary leverage ratio projections only
include estimates for firms subject to the advanced approaches.
n/a Not applicable.
Projected loan losses, by type of loan, 2018:Q1–2020:Q1
Loan type Billions of
dollars Portfolio loss
rates (percent)1
Loan losses 53.6 5.5
First-lien mortgages, domestic 6.3 2.3
Junior liens and HELOCs, domestic 2.6 4.8
Commercial and industrial2 13.0 6.8
Commercial real estate, domestic 12.9 9.4
Credit cards 6.0 15.5
Other consumer3 5.1 5.9
Other loans4 7.7 4.2
1 Average loan balances used to calculate portfolio loss rates exclude loans held
for sale and loans held for investment under the fair-value option, and are
calculated over nine quarters.2 Commercial and industrial loans include small- and medium-enterprise loans
and corporate cards.3 Other consumer loans include student loans and automobile loans.4 Other loans include international real estate loans.
Risk-weighted assets, actual 2017:Q4 and projected2020:Q1
Billions of dollars
Item Actual
2017:Q4 Projected2020:Q1
Risk-weighted assets1 1,260.7 1,329.5
1 For each quarter, risk-weighted assets are calculated under the Board’s
standardized capital risk-based approach in 12 CFR part 217, subpart D.
Projected losses, revenue, and net income before taxesthrough 2020:Q1
Item Billions of
dollars Percent of
average assets1
Pre-provision net revenue2 85.8 4.2
Other revenue3 0.0
less
Provisions 59.4
Realized losses/gains on securities (AFS/HTM) 2.6
Trading and counterparty losses4 12.2
Other losses/gains5 1.6
equals
Net income before taxes 10.1 0.5
Memo items
Other comprehensive income6 -11.9
Other effects on capital Actual 2017:Q4 2020:Q1
AOCI included in capital (billions of dollars)7 -1.4 -13.6
1 Average assets is the nine-quarter average of total assets.2 Pre-provision net revenue includes losses from operational-risk events and
other real estate owned (OREO) costs.3 Other revenue includes one-time income and (expense) items not included in
pre-provision net revenue.4 Trading and counterparty losses include mark-to-market and credit valuation
adjustment (CVA) losses and losses arising from the counterparty default
scenario component applied to derivatives, securities lending, and repurchase
agreement activities.5 Other losses/gains include projected change in fair value of loans held for sale
and loans held for investment measured under the fair-value option, and
goodwill impairment losses.6 Other comprehensive income (OCI) is only calculated for advanced approaches
firms, and other firms that opt into the advanced approaches treatment of
accumulated other comprehensive income (AOCI).7 Certain aspects of AOCI are subject to transition arrangements for inclusion in
projected regulatory capital. The transition arrangements are 100 percent
included in projected regulatory capital starting in 2018. See 12 CFR
217.300(b)(3).
148 Supervisory Stress Test Methodology and Results

Table C.35.B. Wells Fargo & Company
Projected stressed capital ratios, risk-weighted assets, losses, revenues, net income beforetaxes, and loan lossesFederal Reserve estimates: Adverse scenario
Capital ratios, actual 2017:Q4 and projected2018:Q1–2020:Q1
Percent
Regulatory ratio Actual
2017:Q4
Stressed capital ratios1
Ending Minimum
Common equity tier 1 capital ratio 12.3 12.4 11.7
Tier 1 capital ratio 14.1 14.1 13.5
Total capital ratio 17.5 16.9 16.6
Tier 1 leverage ratio 9.4 9.2 8.9
Supplementary leverage ratio n/a 7.9 7.6
1 The capital ratios are calculated using capital action assumptions provided
within the Dodd-Frank Act stress testing rule. See 12 CFR 252.56(b). These
projections represent hypothetical estimates that involve an economic outcome
that is more adverse than expected. The minimum capital ratios are for the
period 2018:Q1 to 2020:Q1. Supplementary leverage ratio projections only
include estimates for firms subject to the advanced approaches.
n/a Not applicable.
Projected loan losses, by type of loan, 2018:Q1–2020:Q1
Loan type Billions of
dollars Portfolio loss
rates (percent)1
Loan losses 28.5 2.9
First-lien mortgages, domestic 1.6 0.6
Junior liens and HELOCs, domestic 0.9 1.6
Commercial and industrial2 8.1 4.2
Commercial real estate, domestic 4.8 3.5
Credit cards 4.6 11.8
Other consumer3 4.0 4.7
Other loans4 4.5 2.4
1 Average loan balances used to calculate portfolio loss rates exclude loans held
for sale and loans held for investment under the fair-value option, and are
calculated over nine quarters.2 Commercial and industrial loans include small- and medium-enterprise loans
and corporate cards.3 Other consumer loans include student loans and automobile loans.4 Other loans include international real estate loans.
Risk-weighted assets, actual 2017:Q4 and projected2020:Q1
Billions of dollars
Item Actual
2017:Q4 Projected2020:Q1
Risk-weighted assets1 1,260.7 1,359.9
1 For each quarter, risk-weighted assets are calculated under the Board’s
standardized capital risk-based approach in 12 CFR part 217, subpart D.
Projected losses, revenue, and net income before taxesthrough 2020:Q1
Item Billions of
dollars Percent of
average assets1
Pre-provision net revenue2 76.5 3.7
Other revenue3 0.0
less
Provisions 28.4
Realized losses/gains on securities (AFS/HTM) 0.6
Trading and counterparty losses4 3.7
Other losses/gains5 1.1
equals
Net income before taxes 42.7 2.1
Memo items
Other comprehensive income6 0.0
Other effects on capital Actual 2017:Q4 2020:Q1
AOCI included in capital (billions of dollars)7 -1.4 -1.7
1 Average assets is the nine-quarter average of total assets.2 Pre-provision net revenue includes losses from operational-risk events and
other real estate owned (OREO) costs.3 Other revenue includes one-time income and (expense) items not included in
pre-provision net revenue.4 Trading and counterparty losses include mark-to-market and credit valuation
adjustment (CVA) losses and losses arising from the counterparty default
scenario component applied to derivatives, securities lending, and repurchase
agreement activities.5 Other losses/gains include projected change in fair value of loans held for sale
and loans held for investment measured under the fair-value option, and
goodwill impairment losses.6 Other comprehensive income (OCI) is only calculated for advanced approaches
firms, and other firms that opt into the advanced approaches treatment of
accumulated other comprehensive income (AOCI).7 Certain aspects of AOCI are subject to transition arrangements for inclusion in
projected regulatory capital. The transition arrangements are 100 percent
included in projected regulatory capital starting in 2018. See 12 CFR
217.300(b)(3).
June 2018 149


Appendix D: Additional Aggregate Results
Figure D.1. First-lien mortgages domestic loss rates in the severely adverse scenario
0.0 1.0 2.0 3.0 4.0 5.0
Wells Fargo
U.S. Bancorp
UBS Americas
TD Group
SunTrust
State Street
Santander
Regions
RBC USA
PNC
Northern Trust
MUFG Americas
Morgan Stanley
M&T
KeyCorp
JPMorgan Chase
Huntington
HSBC
Goldman Sachs
Fifth Third
Discover
DB USA
Credit Suisse USA
Citizens
Citigroup
Capital One
BNP Paribas USA
BMO
BBVA
BB&T
Barclays US
Bank of NY-Mellon
Bank of America
American Express
Ally
Percent
Median = 2.8%
46.9
Estimates are for the nine-quarter period from 2018:Q1–2020:Q1 as a percent of average balances.
151
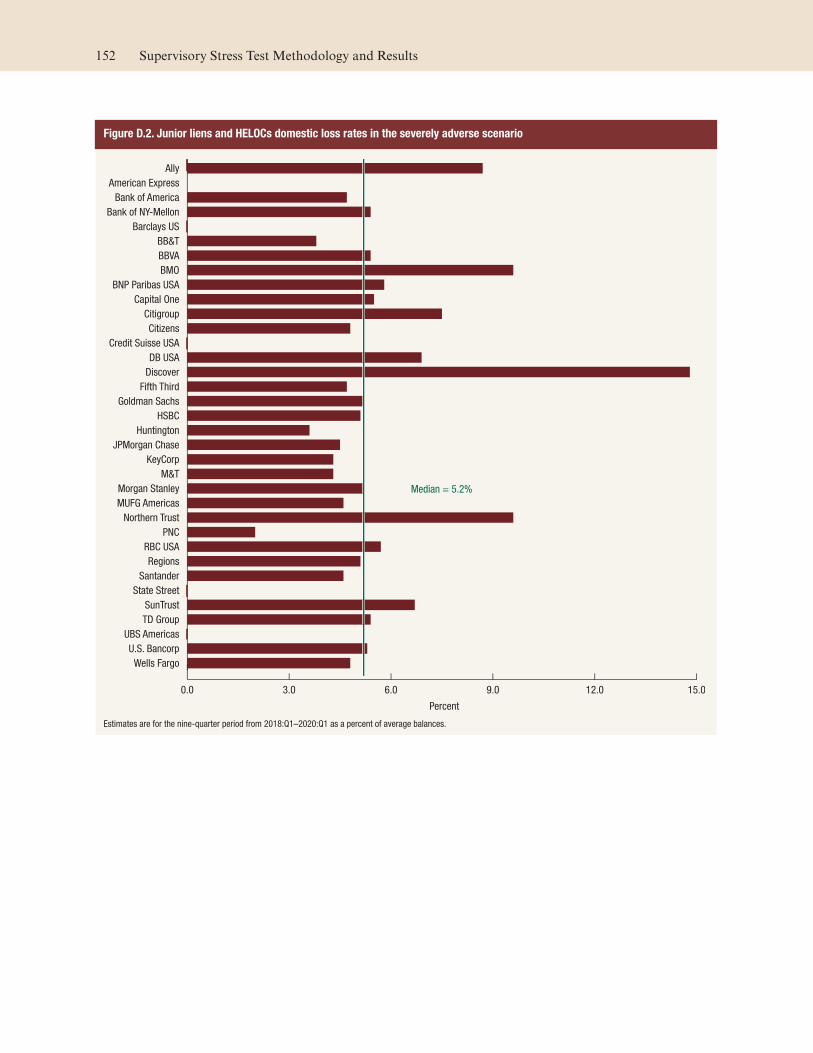
Figure D.2. Junior liens and HELOCs domestic loss rates in the severely adverse scenario
0.0 3.0 6.0 9.0 12.0 15.0
Wells Fargo
U.S. Bancorp
UBS Americas
TD Group
SunTrust
State Street
Santander
Regions
RBC USA
PNC
Northern Trust
MUFG Americas
Morgan Stanley
M&T
KeyCorp
JPMorgan Chase
Huntington
HSBC
Goldman Sachs
Fifth Third
Discover
DB USA
Credit Suisse USA
Citizens
Citigroup
Capital One
BNP Paribas USA
BMO
BBVA
BB&T
Barclays US
Bank of NY-Mellon
Bank of America
American Express
Ally
Median = 5.2%
Percent
Estimates are for the nine-quarter period from 2018:Q1–2020:Q1 as a percent of average balances.
152 Supervisory Stress Test Methodology and Results

Figure D.3. Commercial and industrial loss rates in the severely adverse scenario
0.0 5.0 10.0 15.0 20.0 25.0
Wells Fargo
U.S. Bancorp
UBS Americas
TD Group
SunTrust
State Street
Santander
Regions
RBC USA
PNC
Northern Trust
MUFG Americas
Morgan Stanley
M&T
KeyCorp
JPMorgan Chase
Huntington
HSBC
Goldman Sachs
Fifth Third
Discover
DB USA
Credit Suisse USA
Citizens
Citigroup
Capital One
BNP Paribas USA
BMO
BBVA
BB&T
Barclays US
Bank of NY-Mellon
Bank of America
American Express
Ally
Percent
Median = 7.25%
Note: Estimates are for the nine-quarter period from 2018:Q1–2020:Q1 as a percent of average balances. Losses are calculated based on the exposure at default, which
includes both outstanding balances and any additional drawdown of the credit line that occurs prior to default, while loss rates are calculated as a percent of outstanding
balances.
June 2018 153

Figure D.4. Commercial real estate domestic loss rates in the severely adverse scenario
0.0 5.0 10.0 15.0 20.0
Wells Fargo
U.S. Bancorp
UBS Americas
TD Group
SunTrust
State Street
Santander
Regions
RBC USA
PNC
Northern Trust
MUFG Americas
Morgan Stanley
M&T
KeyCorp
JPMorgan Chase
Huntington
HSBC
Goldman Sachs
Fifth Third
Discover
DB USA
Credit Suisse USA
Citizens
Citigroup
Capital One
BNP Paribas USA
BMO
BBVA
BB&T
Barclays US
Bank of NY-Mellon
Bank of America
American Express
Ally
Percent
Median = 8.3%
Note: Estimates are for the nine-quarter period from 2018:Q1–2020:Q1 as a percent of average balances.
154 Supervisory Stress Test Methodology and Results
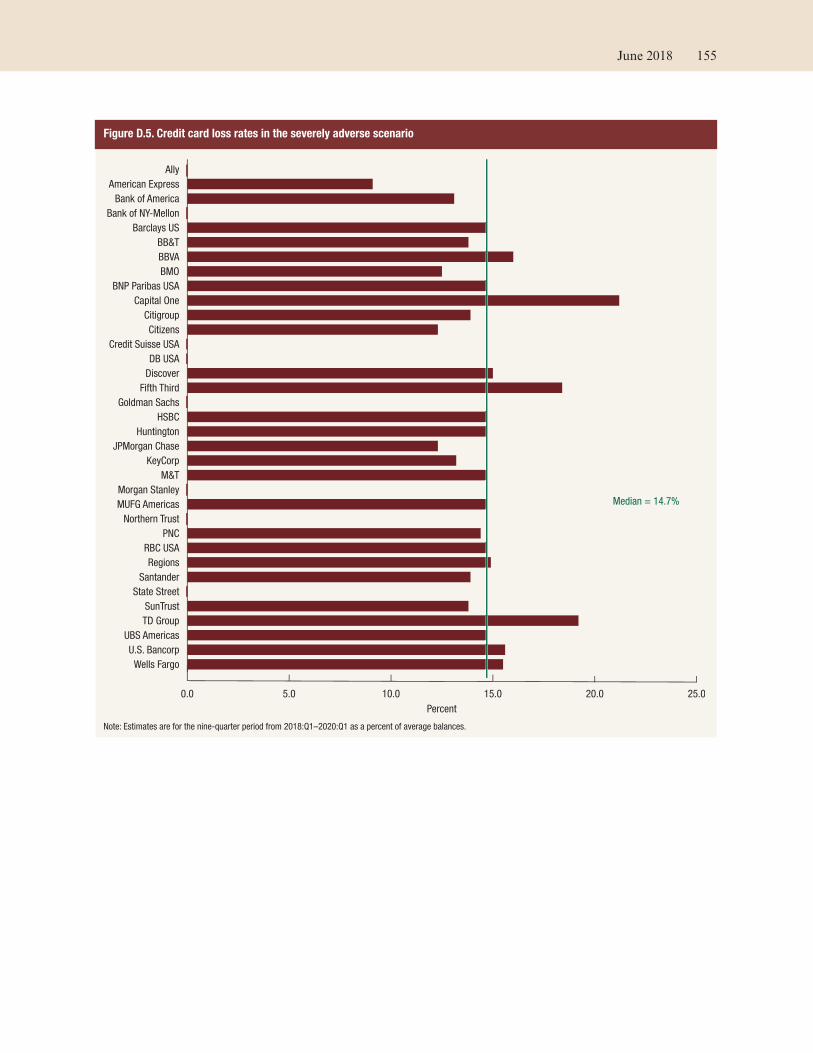
Figure D.5. Credit card loss rates in the severely adverse scenario
0.0 5.0 10.0 15.0 20.0 25.0
Wells Fargo
U.S. Bancorp
UBS Americas
TD Group
SunTrust
State Street
Santander
Regions
RBC USA
PNC
Northern Trust
MUFG Americas
Morgan Stanley
M&T
KeyCorp
JPMorgan Chase
Huntington
HSBC
Goldman Sachs
Fifth Third
Discover
DB USA
Credit Suisse USA
Citizens
Citigroup
Capital One
BNP Paribas USA
BMO
BBVA
BB&T
Barclays US
Bank of NY-Mellon
Bank of America
American Express
Ally
Percent
Median = 14.7%
Note: Estimates are for the nine-quarter period from 2018:Q1–2020:Q1 as a percent of average balances.
June 2018 155

Figure D.6. Other consumer loss rates in the severely adverse scenario
0.0 5.0 10.0 15.0 20.0
Wells Fargo
U.S. Bancorp
UBS Americas
TD Group
SunTrust
State Street
Santander
Regions
RBC USA
PNC
Northern Trust
MUFG Americas
Morgan Stanley
M&T
KeyCorp
JPMorgan Chase
Huntington
HSBC
Goldman Sachs
Fifth Third
Discover
DB USA
Credit Suisse USA
Citizens
Citigroup
Capital One
BNP Paribas USA
BMO
BBVA
BB&T
Barclays US
Bank of NY-Mellon
Bank of America
American Express
Ally
Percent
Median = 5.9%
Note: Estimates are for the nine-quarter period from 2018:Q1–2020:Q1 as a percent of average balances.
156 Supervisory Stress Test Methodology and Results
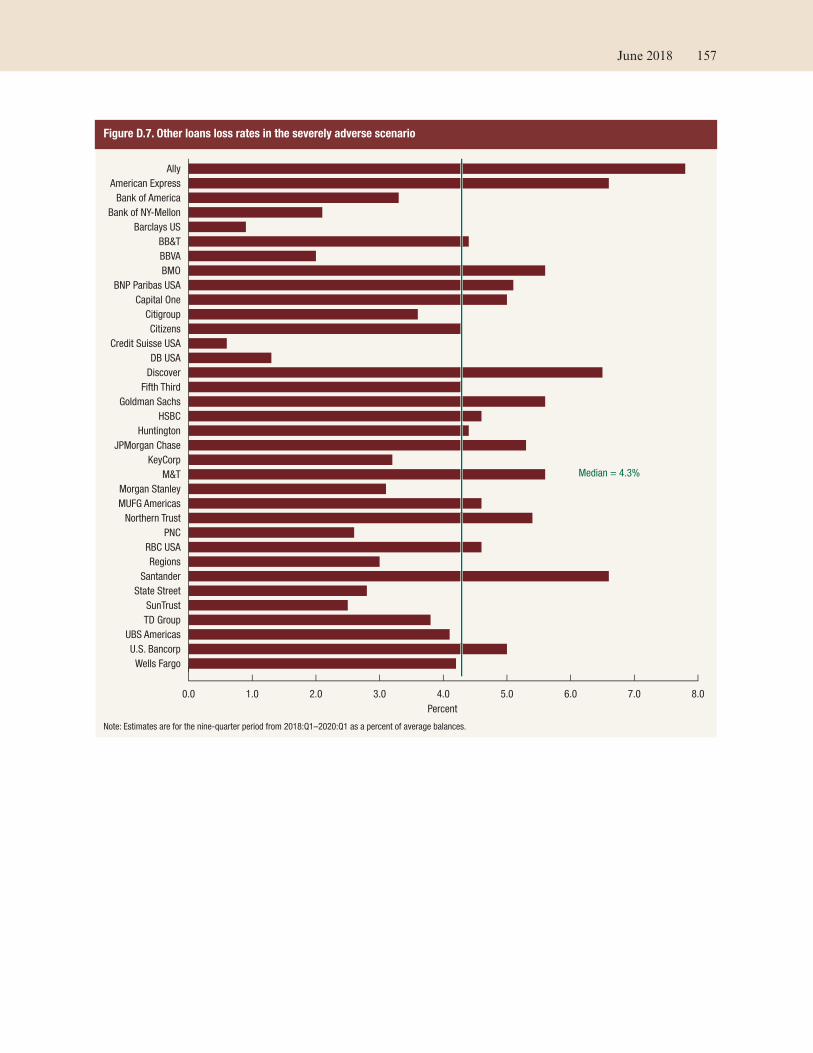
Figure D.7. Other loans loss rates in the severely adverse scenario
0.0 1.0 2.0 3.0 4.0 5.0 6.0 7.0 8.0
Wells Fargo
U.S. Bancorp
UBS Americas
TD Group
SunTrust
State Street
Santander
Regions
RBC USA
PNC
Northern Trust
MUFG Americas
Morgan Stanley
M&T
KeyCorp
JPMorgan Chase
Huntington
HSBC
Goldman Sachs
Fifth Third
Discover
DB USA
Credit Suisse USA
Citizens
Citigroup
Capital One
BNP Paribas USA
BMO
BBVA
BB&T
Barclays US
Bank of NY-Mellon
Bank of America
American Express
Ally
Percent
Median = 4.3%
Note: Estimates are for the nine-quarter period from 2018:Q1–2020:Q1 as a percent of average balances.
June 2018 157

Figure D.8. First-lien mortgages domestic loss rates in the adverse scenario
Percent
Median = 1.1%
0.0 0.5 1.0 1.5 2.0 2.5
Wells Fargo
U.S. Bancorp
UBS Americas
TD Group
SunTrust
State Street
Santander
Regions
RBC USA
PNC
Northern Trust
MUFG Americas
Morgan Stanley
M&T
KeyCorp
JPMorgan Chase
Huntington
HSBC
Goldman Sachs
Fifth Third
Discover
DB USA
Credit Suisse USA
Citizens
Citigroup
Capital One
BNP Paribas USA
BMO
BBVA
BB&T
Barclays US
Bank of NY-Mellon
Bank of America
American Express
Ally
40.4
Estimates are for the nine-quarter period from 2018:Q1–2020:Q1 as a percent of average balances.
158 Supervisory Stress Test Methodology and Results

Figure D.9. Junior liens and HELOCs domestic loss rates in the adverse scenario
0.0 1.0 2.0 3.0 4.0 5.0 6.0 7.0 8.0
Wells Fargo
U.S. Bancorp
UBS Americas
TD Group
SunTrust
State Street
Santander
Regions
RBC USA
PNC
Northern Trust
MUFG Americas
Morgan Stanley
M&T
KeyCorp
JPMorgan Chase
Huntington
HSBC
Goldman Sachs
Fifth Third
Discover
DB USA
Credit Suisse USA
Citizens
Citigroup
Capital One
BNP Paribas USA
BMO
BBVA
BB&T
Barclays US
Bank of NY-Mellon
Bank of America
American Express
Ally
Percent
Median = 2.7%
Estimates are for the nine-quarter period from 2018:Q1–2020:Q1 as a percent of average balances.
June 2018 159

Figure D.10. Commercial and industrial loss rates in the adverse scenario
0.0 5.0 10.0 15.0 20.0 25.0
Wells Fargo
U.S. Bancorp
UBS Americas
TD Group
SunTrust
State Street
Santander
Regions
RBC USA
PNC
Northern Trust
MUFG Americas
Morgan Stanley
M&T
KeyCorp
JPMorgan Chase
Huntington
HSBC
Goldman Sachs
Fifth Third
Discover
DB USA
Credit Suisse USA
Citizens
Citigroup
Capital One
BNP Paribas USA
BMO
BBVA
BB&T
Barclays US
Bank of NY-Mellon
Bank of America
American Express
Ally
Percent
Median = 4.35%
Note: Estimates are for the nine-quarter period from 2018:Q1–2020:Q1 as a percent of average balances. Losses are calculated based on the exposure at default, which
includes both outstanding balances and any additional drawdown of the credit line that occurs prior to default, while loss rates are calculated as a percent of outstanding
balances.
160 Supervisory Stress Test Methodology and Results

Figure D.11. Commercial real estate domestic loss rates in the adverse scenario
0.0 1.0 2.0 3.0 4.0 5.0 6.0 7.0 8.0
Wells Fargo
U.S. Bancorp
UBS Americas
TD Group
SunTrust
State Street
Santander
Regions
RBC USA
PNC
Northern Trust
MUFG Americas
Morgan Stanley
M&T
KeyCorp
JPMorgan Chase
Huntington
HSBC
Goldman Sachs
Fifth Third
Discover
DB USA
Credit Suisse USA
Citizens
Citigroup
Capital One
BNP Paribas USA
BMO
BBVA
BB&T
Barclays US
Bank of NY-Mellon
Bank of America
American Express
Ally
Percent
Median = 3.3%
Note: Estimates are for the nine-quarter period from 2018:Q1–2020:Q1 as a percent of average balances.
June 2018 161

Figure D.12. Credit card loss rates in the adverse scenario
0.0 5.0 10.0 15.0 20.0
Wells Fargo
U.S. Bancorp
UBS Americas
TD Group
SunTrust
State Street
Santander
Regions
RBC USA
PNC
Northern Trust
MUFG Americas
Morgan Stanley
M&T
KeyCorp
JPMorgan Chase
Huntington
HSBC
Goldman Sachs
Fifth Third
Discover
DB USA
Credit Suisse USA
Citizens
Citigroup
Capital One
BNP Paribas USA
BMO
BBVA
BB&T
Barclays US
Bank of NY-Mellon
Bank of America
American Express
Ally
Percent
Median = 10.6%
Note: Estimates are for the nine-quarter period from 2018:Q1–2020:Q1 as a percent of average balances.
162 Supervisory Stress Test Methodology and Results

Figure D.13. Other consumer loss rates in the adverse scenario
0.0 3.0 6.0 9.0 12.0 15.0
Wells Fargo
U.S. Bancorp
UBS Americas
TD Group
SunTrust
State Street
Santander
Regions
RBC USA
PNC
Northern Trust
MUFG Americas
Morgan Stanley
M&T
KeyCorp
JPMorgan Chase
Huntington
HSBC
Goldman Sachs
Fifth Third
Discover
DB USA
Credit Suisse USA
Citizens
Citigroup
Capital One
BNP Paribas USA
BMO
BBVA
BB&T
Barclays US
Bank of NY-Mellon
Bank of America
American Express
Ally
Percent
Median = 4.7%
Note: Estimates are for the nine-quarter period from 2018:Q1–2020:Q1 as a percent of average balances.
June 2018 163

Figure D.14. Other loans loss rates in the adverse scenario
0.0 1.0 2.0 3.0 4.0 5.0
Wells Fargo
U.S. Bancorp
UBS Americas
TD Group
SunTrust
State Street
Santander
Regions
RBC USA
PNC
Northern Trust
MUFG Americas
Morgan Stanley
M&T
KeyCorp
JPMorgan Chase
Huntington
HSBC
Goldman Sachs
Fifth Third
Discover
DB USA
Credit Suisse USA
Citizens
Citigroup
Capital One
BNP Paribas USA
BMO
BBVA
BB&T
Barclays US
Bank of NY-Mellon
Bank of America
American Express
Ally
Percent
Median = 2.5%
Note: Estimates are for the nine-quarter period from 2018:Q1–2020:Q1 as a percent of average balances.
164 Supervisory Stress Test Methodology and Results


