31
DOE IN INDUSTRIES PRESENTED BY GAUTAM MAKESHBABU
| Date post: | 13-Jul-2015 |
| Category: |
Engineering |
| Upload: | gautam-makeshbabu |
| View: | 59 times |
| Download: | 0 times |

DOE IN INDUSTRIESPRESENTED BY GAUTAM MAKESHBABU

OVERVIEW
Why DOE?-The basic goal
How can DOE help industries?
Case studies
• Problems
• Factors and response
• Experimental run
• Conclusions
WHY DOE?
Quality and Reliability
Early stage implementation
Wide use
Not limited to manufacturing industries
DOE IN INDUSTRIES
Comparisons
Variable screenings
Transfer function exploration
System optimization
System robustness

CASE STUDY
EXPERIMENTAL DESIGN IN A PET FOOD MANUFACTURING COMPANY
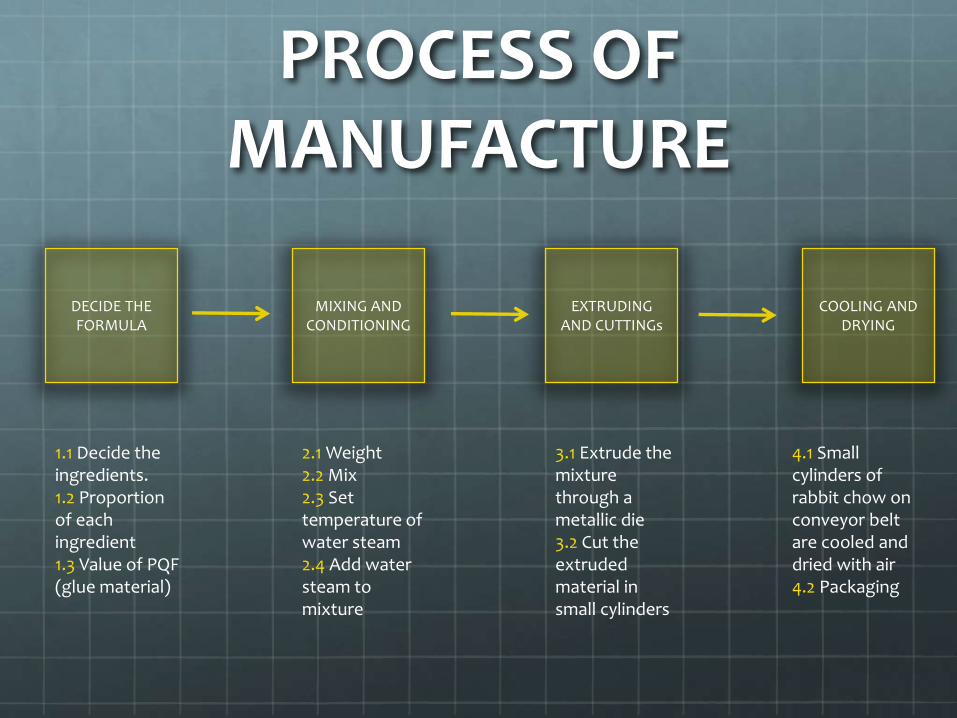
PROCESS OF MANUFACTURE
DECIDE THE FORMULA
MIXING AND CONDITIONING
EXTRUDING AND CUTTINGs
COOLING AND DRYING
1.1 Decide the ingredients.1.2 Proportion of each ingredient1.3 Value of PQF (glue material)
2.1 Weight2.2 Mix2.3 Set temperature of water steam2.4 Add water steam to mixture
3.1 Extrude the mixture through a metallic die3.2 Cut the extruded material in small cylinders
4.1 Small cylinders of rabbit chow on conveyor belt are cooled and dried with air4.2 Packaging

PROBLEMS FACED
During the cooling and drying of the rabbit food cylinders, a loss of product in the form of powder was taking place.
During manipulation and transportation, the cylinders eroded and formed fine powder. This created loss of product and also digestion problems in rabbits.

IN THE PAST
When quality deteriorated, the following steps were taken in order to maintain the quality of the yield.
• Reduce flow of mixture in extrusion. low yield
• Raise conditioning temp in mixture. High energy consumption
• Change compression temp in die. Time consuming
• Last resort- change formula by adding glue material.

FACTORS AND LEVELSLEVELS
FACTOR - +FORMULA (PQF) 10 20
CONDITIONINGTEMPERATURE (T)
80% of T T (max)
FLOW (F) 80% of F F (max)
COMPRESSION ZONE IN DIE
2” 2 ½”
CONSTRAINTS:
All experiments should be performed in a single day.
All activities must be done inside the plant.
Factor 4(compression zone in die) cant be changed easily.
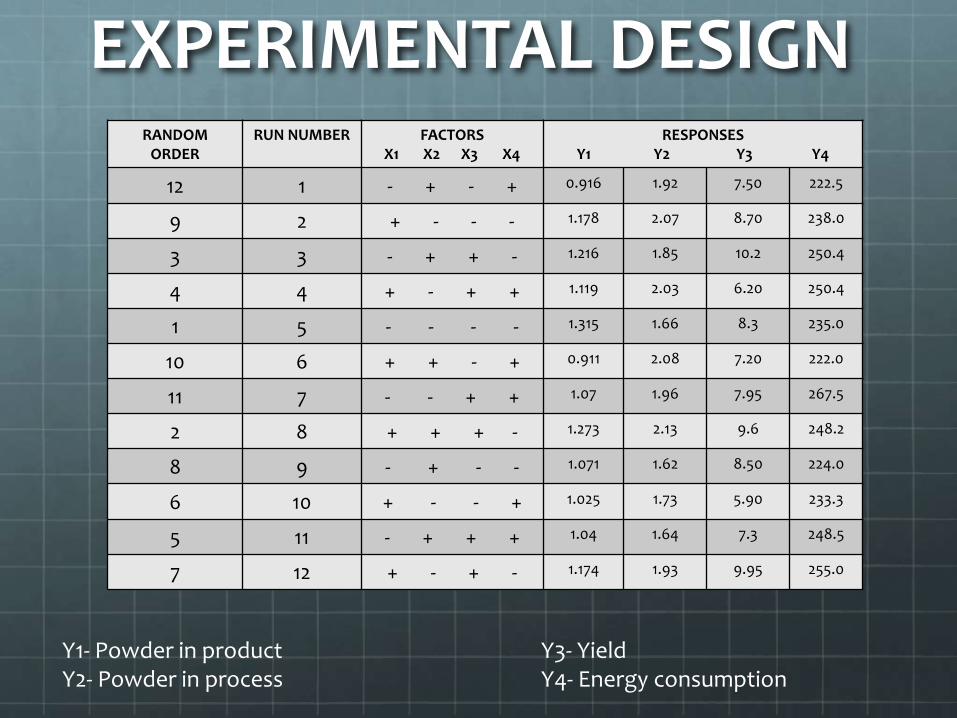
EXPERIMENTAL DESIGN
Y1- Powder in product Y3- YieldY2- Powder in process Y4- Energy consumption
RANDOM ORDER
RUN NUMBER FACTORSX1 X2 X3 X4
RESPONSESY1 Y2 Y3 Y4
12 1 - + - + 0.916 1.92 7.50 222.5
9 2 + - - - 1.178 2.07 8.70 238.0
3 3 - + + - 1.216 1.85 10.2 250.4
4 4 + - + + 1.119 2.03 6.20 250.4
1 5 - - - - 1.315 1.66 8.3 235.0
10 6 + + - + 0.911 2.08 7.20 222.0
11 7 - - + + 1.07 1.96 7.95 267.5
2 8 + + + - 1.273 2.13 9.6 248.2
8 9 - + - - 1.071 1.62 8.50 224.0
6 10 + - - + 1.025 1.73 5.90 233.3
5 11 - + + + 1.04 1.64 7.3 248.5
7 12 + - + - 1.174 1.93 9.95 255.0
0.20.10.0-0.1-0.2
99
95
90
80
70
60
50
40
30
20
10
5
1
Effect
Pe
rce
nt
A x1
B x2
C x3
D x4
Factor Name
Not Significant
Significant
Effect Type
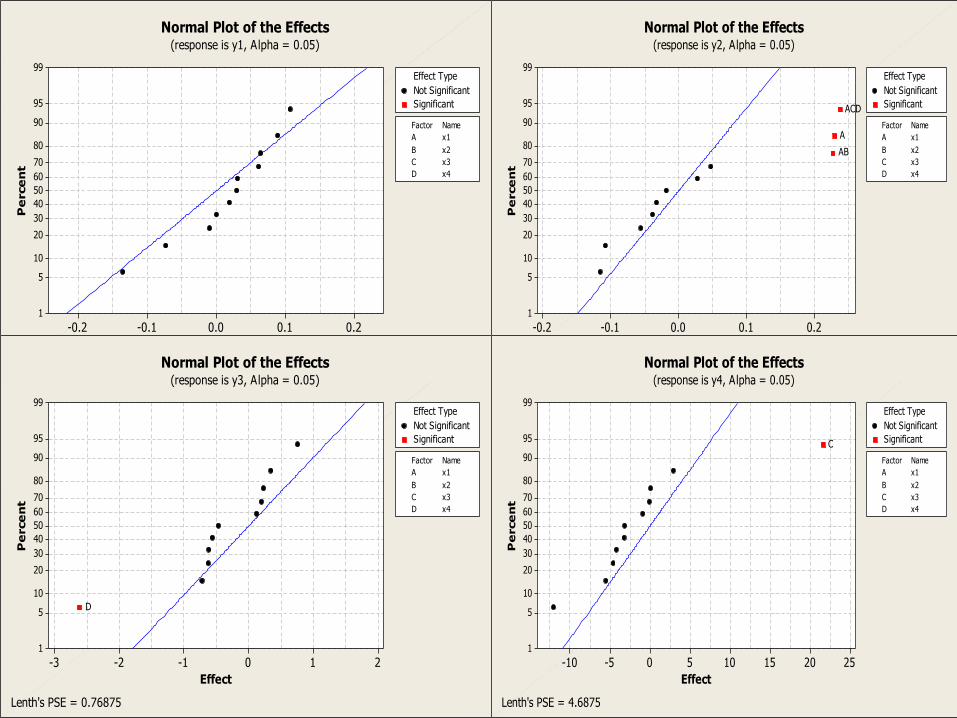
Normal Plot of the Effects(response is y1, Alpha = 0.05)
Lenth's PSE = 0.093
0.20.10.0-0.1-0.2
99
95
90
80
70
60
50
40
30
20
10
5
1
Effect
Pe
rce
nt
A x1
B x2
C x3
D x4
Factor Name
Not Significant
Significant
Effect Type
ACD
AB
A
Normal Plot of the Effects(response is y2, Alpha = 0.05)
Lenth's PSE = 0.06375
210-1-2-3
99
95
90
80
70
60
50
40
30
20
10
5
1
Effect
Pe
rce
nt
A x1
B x2
C x3
D x4
Factor Name
Not Significant
Significant
Effect Type
D
Normal Plot of the Effects(response is y3, Alpha = 0.05)
Lenth's PSE = 0.76875
2520151050-5-10
99
95
90
80
70
60
50
40
30
20
10
5
1
Effect
Pe
rce
nt
A x1
B x2
C x3
D x4
Factor Name
Not Significant
Significant
Effect Type
C
Normal Plot of the Effects(response is y4, Alpha = 0.05)
Lenth's PSE = 4.6875
1-1
1.20
1.15
1.10
1.05
1.00
1-1
1-1
1.20
1.15
1.10
1.05
1.00
1-1
x1
Me
an
x2
x3 x4
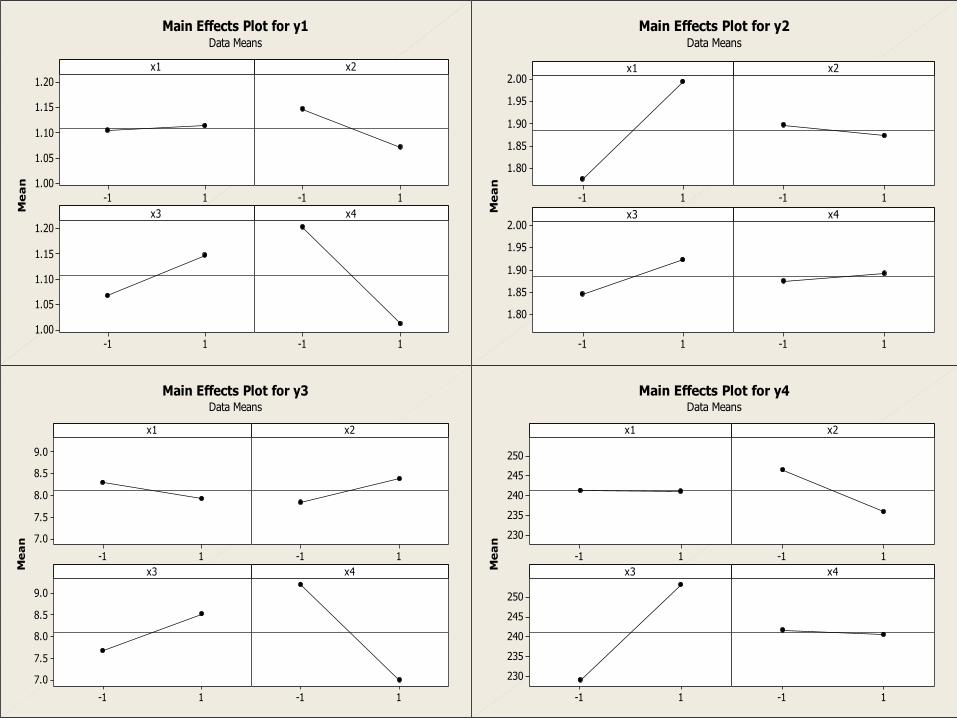
Main Effects Plot for y1Data Means
1-1
2.00
1.95
1.90
1.85
1.80
1-1
1-1
2.00
1.95
1.90
1.85
1.80
1-1
x1
Me
an
x2
x3 x4
Main Effects Plot for y2Data Means
1-1
9.0
8.5
8.0
7.5
7.0
1-1
1-1
9.0
8.5
8.0
7.5
7.0
1-1
x1
Me
an
x2
x3 x4
Main Effects Plot for y3Data Means
1-1
250
245
240
235
230
1-1
1-1
250
245
240
235
230
1-1
x1
Me
an
x2
x3 x4
Main Effects Plot for y4Data Means
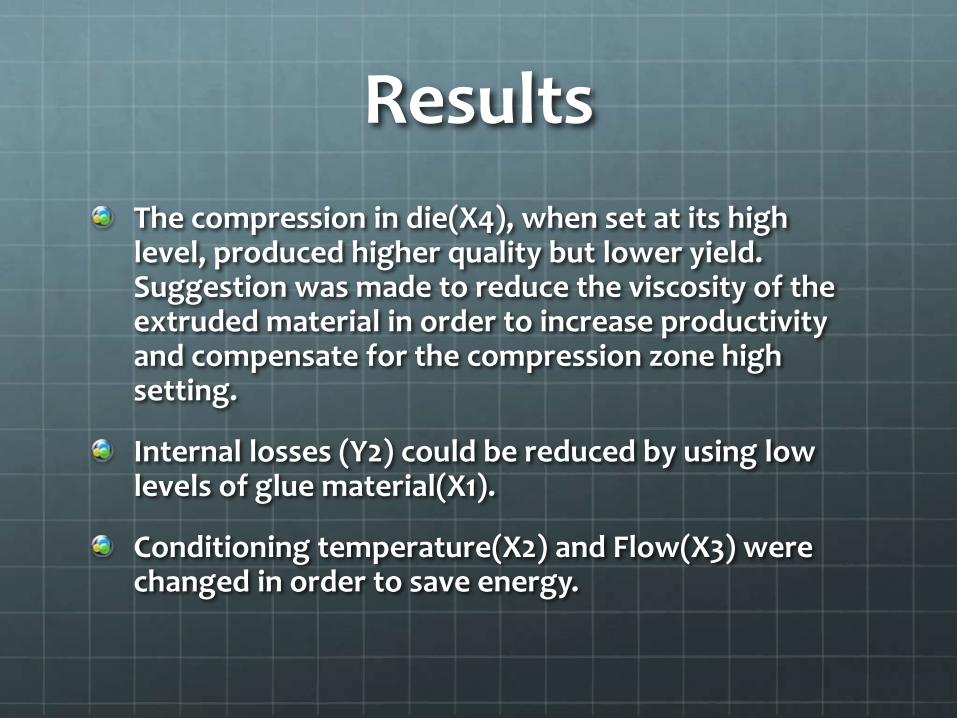
Results
The compression in die(X4), when set at its high level, produced higher quality but lower yield. Suggestion was made to reduce the viscosity of the extruded material in order to increase productivity and compensate for the compression zone high setting.
Internal losses (Y2) could be reduced by using low levels of glue material(X1).
Conditioning temperature(X2) and Flow(X3) were changed in order to save energy.
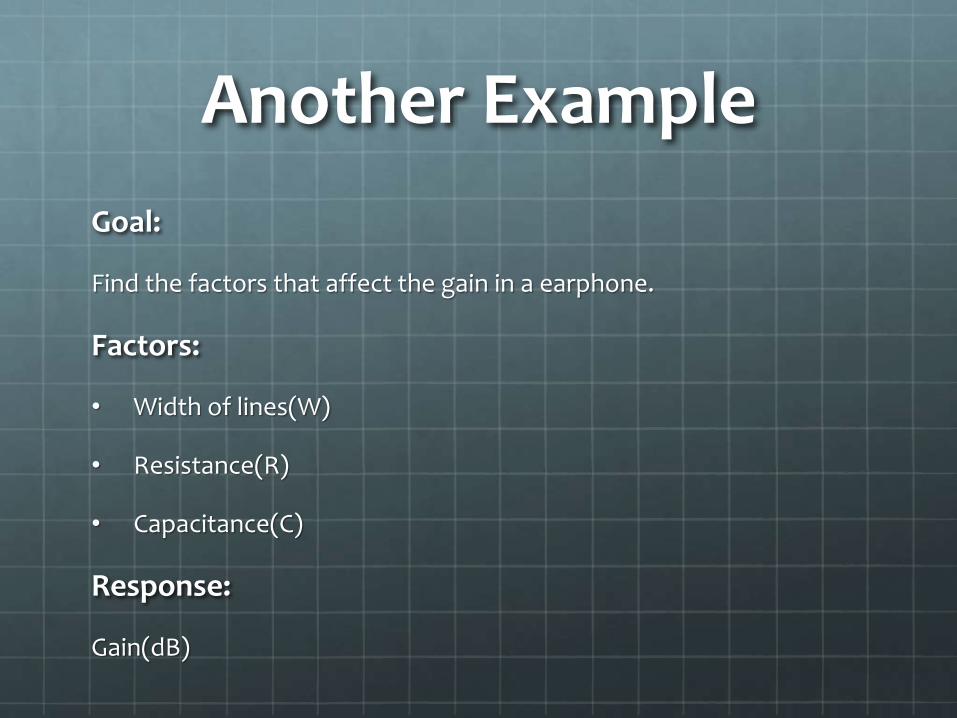
Another Example
Goal:
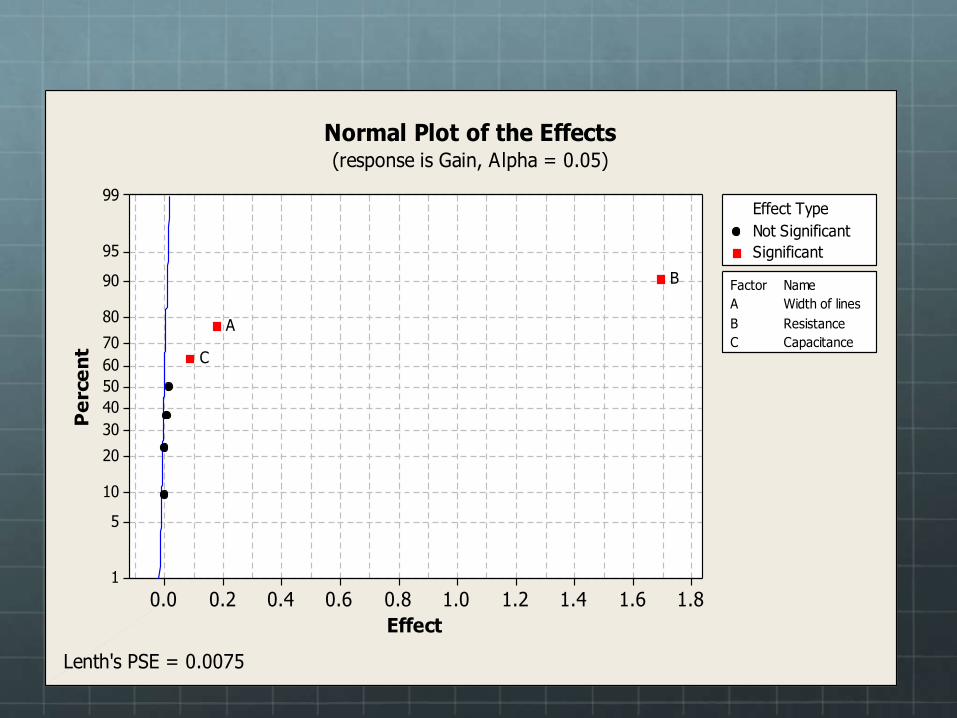
Find the factors that affect the gain in a earphone.
Factors:
• Width of lines(W)
• Resistance(R)
• Capacitance(C)
Response:
Gain(dB)

W R C Gain
0 0 0 13.88
-1 1 -1 14.52
1 -1 -1 13.01
1 -1 1 13.09
-1 1 1 14.61
-1 -1 1 12.93
-1 -1 -1 12.85
1 1 1 14.81
1 1 -1 14.71
Factor Low High
W(um) 9.5o 10.50
R(ohm) 30.4 33.6
C(pF) 19 21
Factors and levelsW= 10±0.5 umR= 32±1.6 ohmC= 20±1 pF
1.81.61.41.21.00.80.60.40.20.0
99
95
90
80
70
60
50
40
30
20
10
5
1
Effect
Pe
rce
nt
A Width of lines
B Resistance
C Capacitance
Factor Name
Not Significant
Significant
Effect Type
C
B
A
Normal Plot of the Effects(response is Gain, Alpha = 0.05)
Lenth's PSE = 0.0075
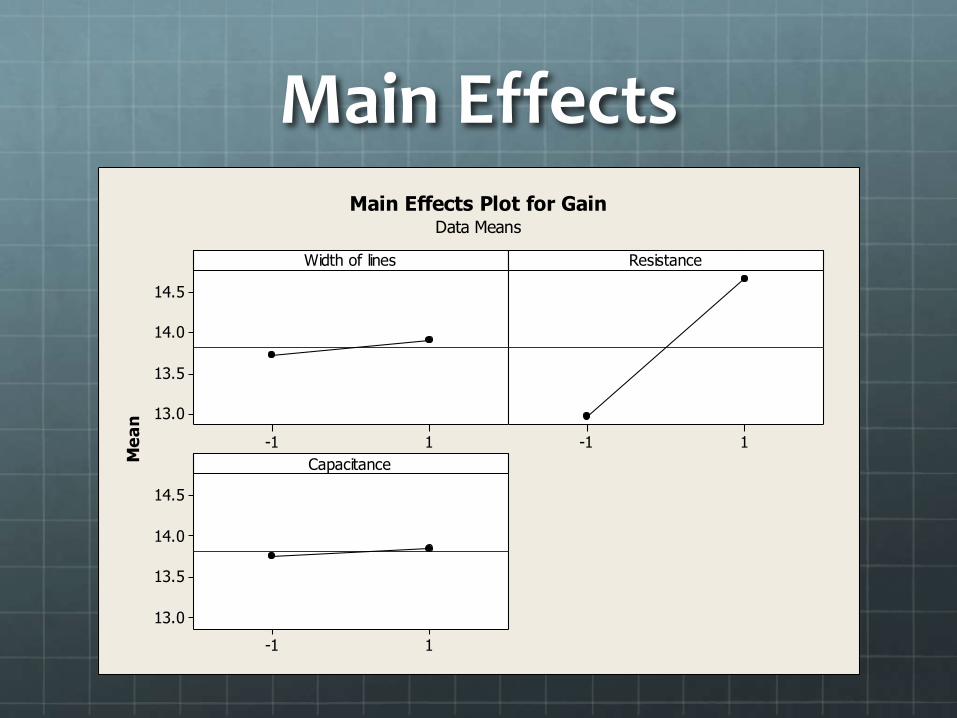
Main Effects
1-1
14.5
14.0
13.5
13.0
1-1
1-1
14.5
14.0
13.5
13.0
Width of lines
Me
an
Resistance
Capacitance
Main Effects Plot for GainData Means
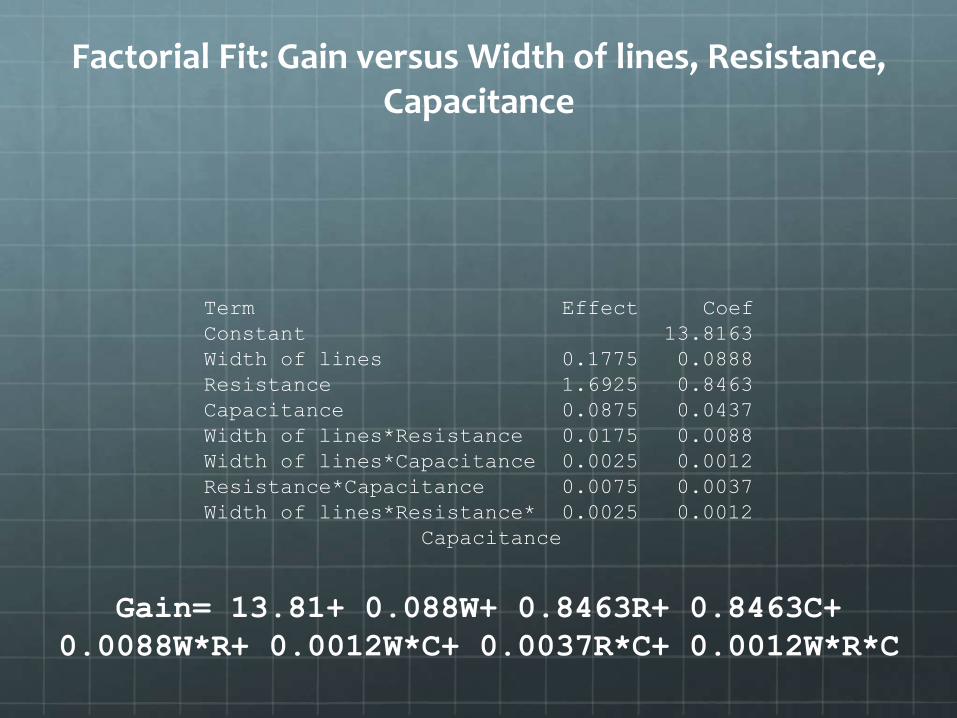
Factorial Fit: Gain versus Width of lines, Resistance, Capacitance
Term Effect Coef
Constant 13.8163
Width of lines 0.1775 0.0888
Resistance 1.6925 0.8463
Capacitance 0.0875 0.0437
Width of lines*Resistance 0.0175 0.0088
Width of lines*Capacitance 0.0025 0.0012
Resistance*Capacitance 0.0075 0.0037
Width of lines*Resistance* 0.0025 0.0012
Capacitance
Gain= 13.81+ 0.088W+ 0.8463R+ 0.8463C+
0.0088W*R+ 0.0012W*C+ 0.0037R*C+ 0.0012W*R*C

Management & Service Industries
Analysis to find the factors that affect the acceptance of presentations.Done by an ISRU(In-site Resource utilization)
Question: How can we improve the showcase in order to make it more resourceful to the members.
Methodology: Questionnaires and ranking.
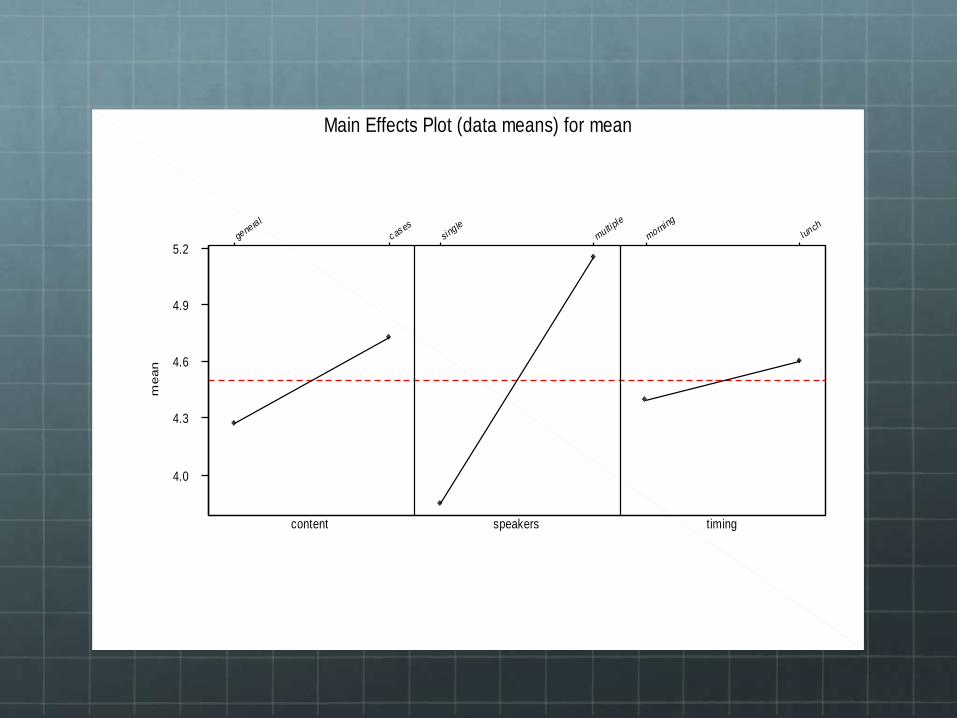
Factors: Presentation Content (General or specific)Number of speakers(Single or Multiple)Timing of showcase(morning or afternoon)
Response:Rank(average rank given by members)
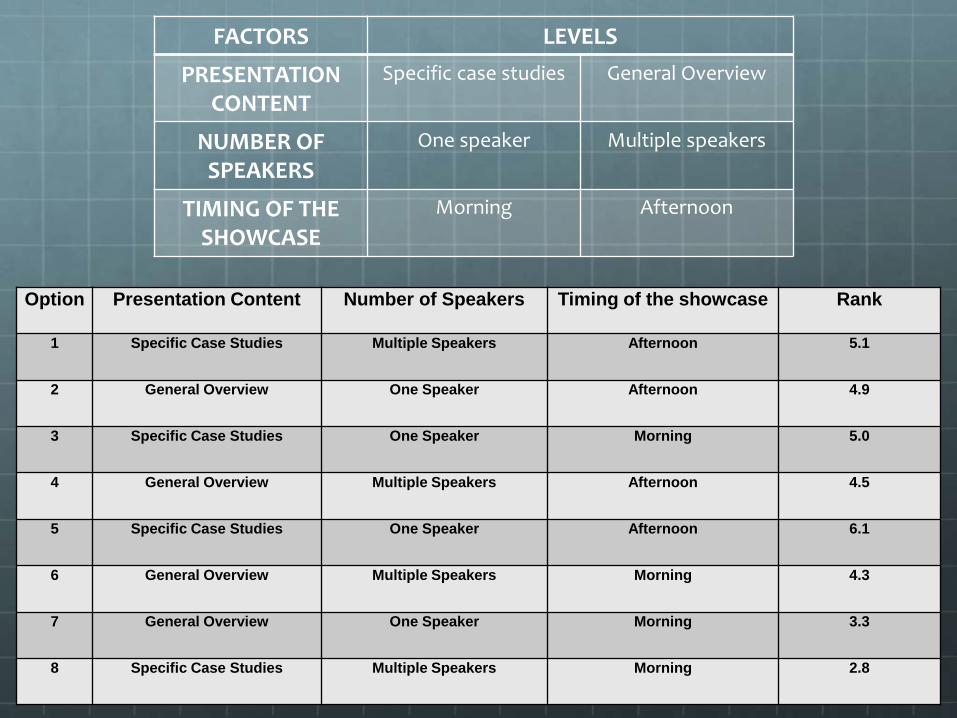
FACTORS LEVELS
PRESENTATION CONTENT
Specific case studies General Overview
NUMBER OF SPEAKERS
One speaker Multiple speakers
TIMING OF THE SHOWCASE
Morning Afternoon
Option Presentation Content Number of Speakers Timing of the showcase Rank
1 Specific Case Studies Multiple Speakers Afternoon 5.1
2 General Overview One Speaker Afternoon 4.9
3 Specific Case Studies One Speaker Morning 5.0
4 General Overview Multiple Speakers Afternoon 4.5
5 Specific Case Studies One Speaker Afternoon 6.1
6 General Overview Multiple Speakers Morning 4.3
7 General Overview One Speaker Morning 3.3
8 Specific Case Studies Multiple Speakers Morning 2.8
timingspeakerscontent
lunch
morning
multiple
single
c ases
gene
ral
5.2
4.9
4.6
4.3
4.0
me
an
Main Effects Plot (data means) for mean

Estimated Effects and Coefficients for rank (coded units)
Term Effect Coef
Constant 4.5000
presentation content -0.7500 -0.3750
no of speakers -1.2000 -0.6000
timing -0.7500 -0.3750
presentation content*no of speakers 0.2500 0.1250
presentation content*timing -0.4000 -0.2000
no of speakers*timing -0.9500 -0.4750
presentation content*no of speakers* 0.4000 0.2000
timing
general
cases
multiplemultiplesinglesingle
5.5
5.0
4.5
4.0
3.5
3.0
speakers
content
Me
an
Interaction Plot (data means) for mean
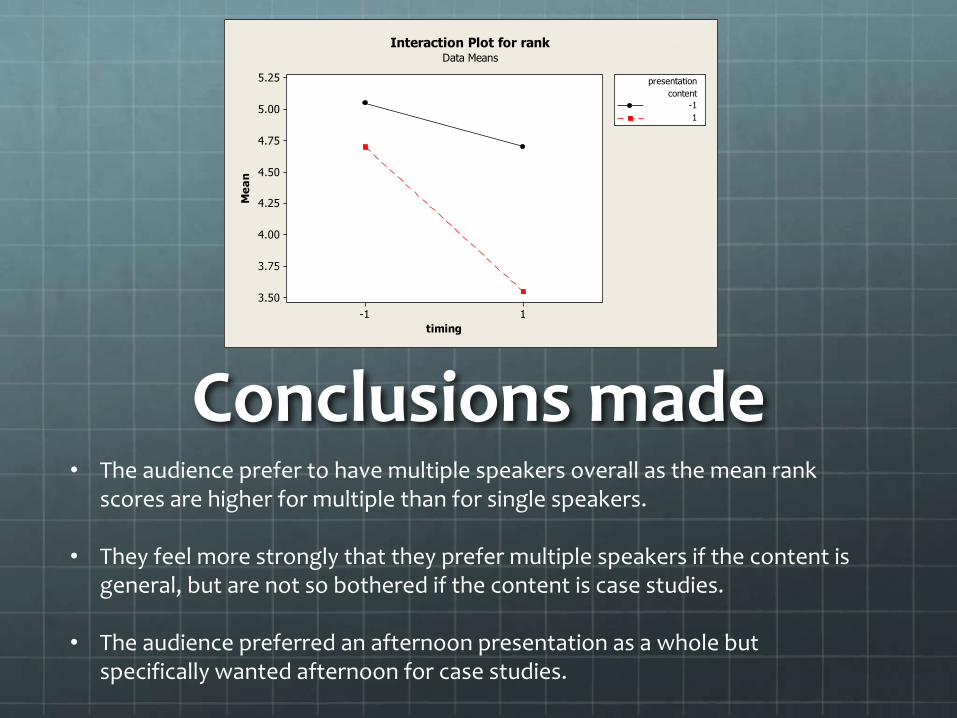
Conclusions made• The audience prefer to have multiple speakers overall as the mean rank
scores are higher for multiple than for single speakers.
• They feel more strongly that they prefer multiple speakers if the content is general, but are not so bothered if the content is case studies.
• The audience preferred an afternoon presentation as a whole but specifically wanted afternoon for case studies.
1-1
5.25
5.00
4.75
4.50
4.25
4.00
3.75
3.50
timing
Me
an
-1
1
content
presentation
Interaction Plot for rankData Means
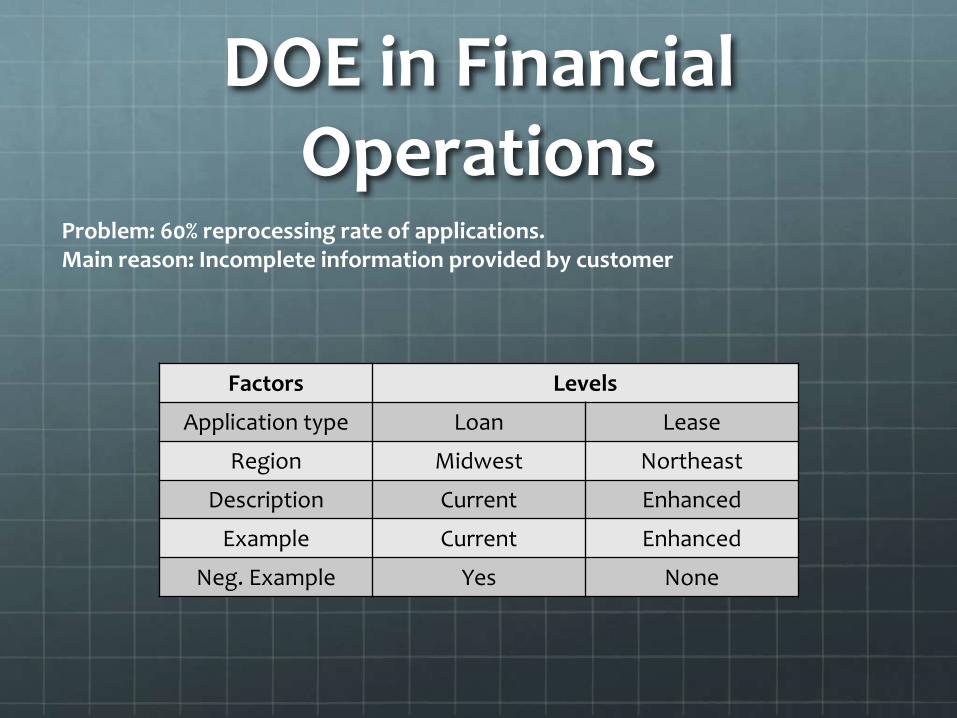
Factors Levels
Application type Loan Lease
Region Midwest Northeast
Description Current Enhanced
Example Current Enhanced
Neg. Example Yes None
DOE in Financial Operations
Problem: 60% reprocessing rate of applications.Main reason: Incomplete information provided by customer

Experimental Design

403020100
99
95
90
80
70
60
50
40
30
20
10
5
1
Effect
Pe
rce
nt
A Application type
B Region
C Description
D Example
E Neg example
Factor Name
Not Significant
Significant
Effect Type
D
C
Normal Plot of the Effects(response is Avg % completed, Alpha = 0.05)
Lenth's PSE = 1.8
LeaseLoan
90
80
70
60
50
NortheastMidwest EnhancedCurrent
EnhancedCurrent
90
80
70
60
50
NoneYes
Application type
Me
an
Region Description
Example Neg example
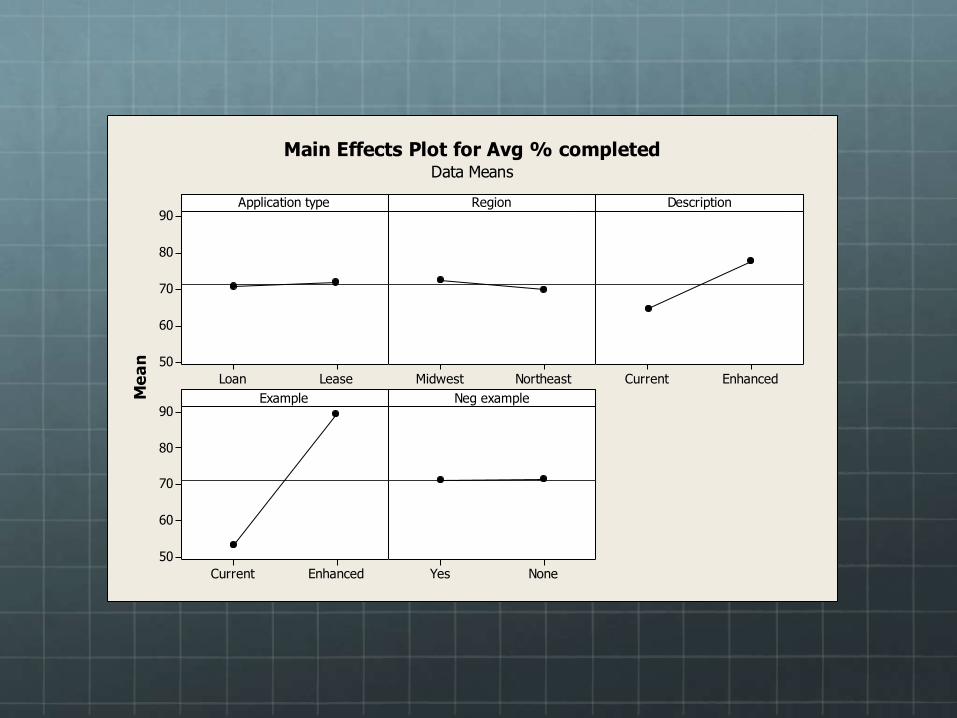
Main Effects Plot for Avg % completedData Means
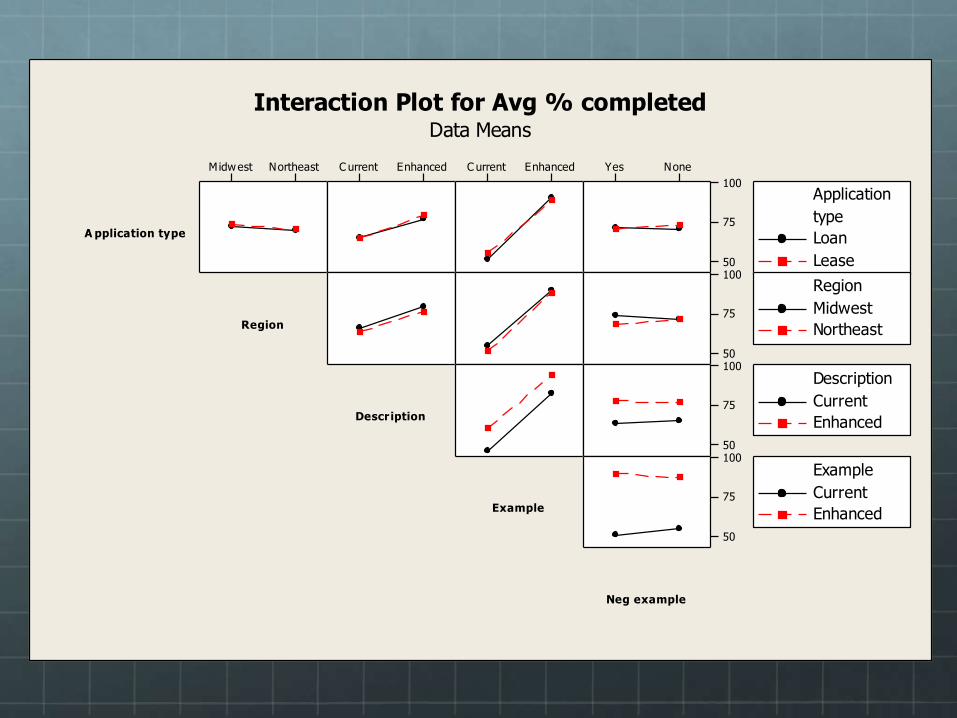
NortheastMidwest EnhancedC urrent EnhancedC urrent NoneYes
100
75
50100
75
50100
75
50100
75
50
A pplication type
Region
Descr iption
Example
Neg example
Loan
Lease
type
Application
Midwest
Northeast
Region
Current
Enhanced
Description
Current
Enhanced
Example
Interaction Plot for Avg % completedData Means
NoneYes
74
73
72
71
70
69
68
Neg example
Me
an
Midwest
Northeast
Region
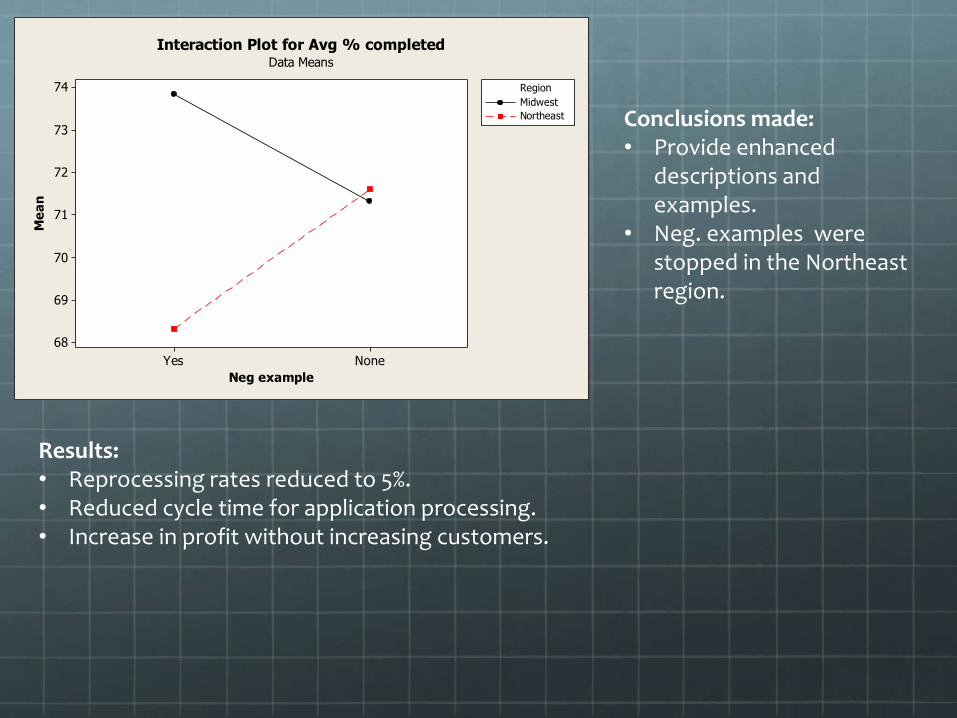
Interaction Plot for Avg % completedData Means
Conclusions made:• Provide enhanced
descriptions and examples.
• Neg. examples were stopped in the Northeast region.
Results:• Reprocessing rates reduced to 5%.• Reduced cycle time for application processing.• Increase in profit without increasing customers.

Reference• http://en.wikipedia.org/wiki/Design_of_experiments
• http://www.ese.wustl.edu/~psm/405quality-control-article.pdf
• http://www.obgyn.cam.ac.uk/cam-only/statsbook/stexdes.html
• http://www.iaeng.org/publication/WCE2007/WCE2007_pp1108-1112.pdf
Thank You


