25
DOE Response to Fukushima Dai-ichi Accident John E. Kelly Deputy Assistant Secretary for Nuclear Reactor Technologies Office of Nuclear Energy U.S. Department of Energy June 15, 2011

DOE Response to Fukushima Dai-ichi
Accident
John E. KellyDeputy Assistant Secretary for Nuclear Reactor Technologies
Office of Nuclear Energy
U.S. Department of Energy
June 15, 2011

Fukushima Dai-ichi Reactors

Fukushima Dai-ichi Reactors
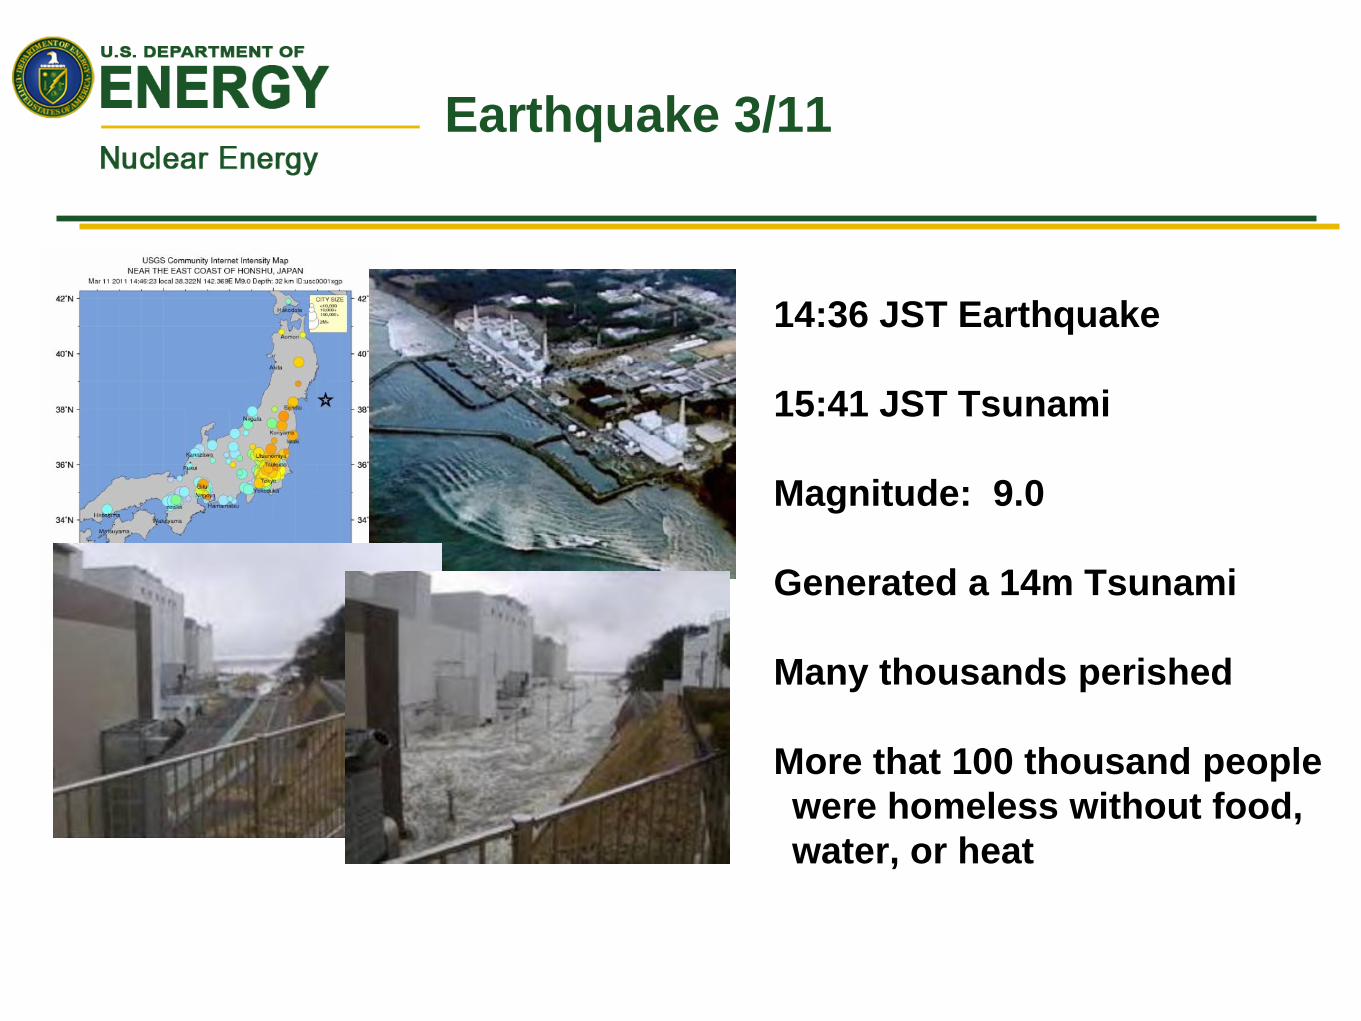
Earthquake 3/11
14:36 JST Earthquake
15:41 JST Tsunami
Magnitude: 9.0
Generated a 14m Tsunami
Many thousands perished
More that 100 thousand people
were homeless without food,
water, or heat

5
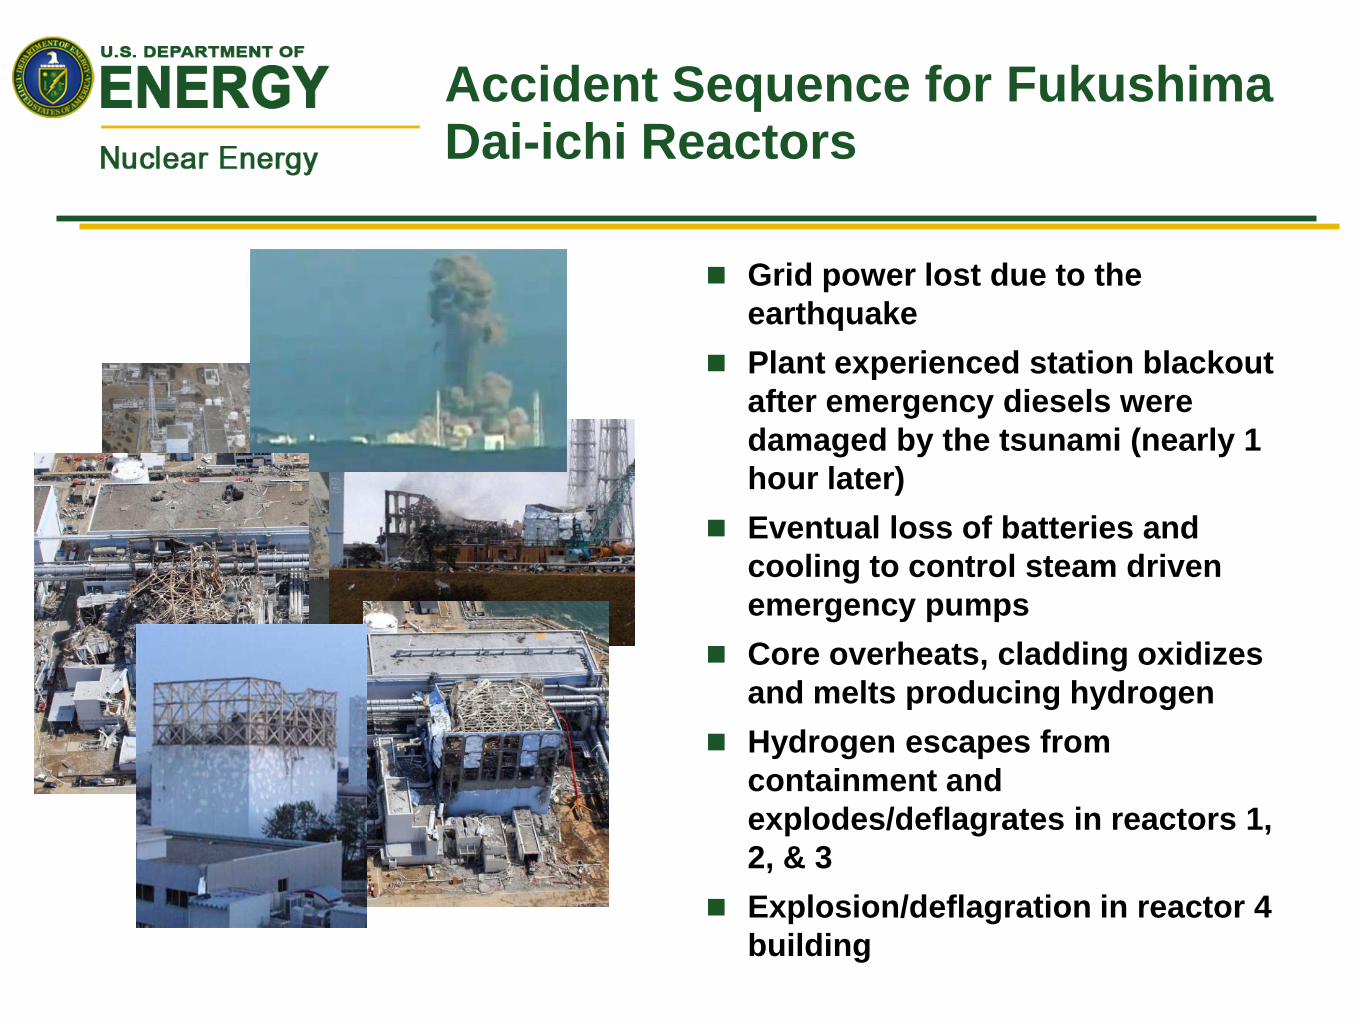
Accident Sequence for Fukushima Dai-ichi Reactors
Grid power lost due to the
earthquake
Plant experienced station blackout
after emergency diesels were
damaged by the tsunami (nearly 1
hour later)
Eventual loss of batteries and
cooling to control steam driven
emergency pumps
Core overheats, cladding oxidizes
and melts producing hydrogen
Hydrogen escapes from
containment and
explodes/deflagrates in reactors 1,
2, & 3
Explosion/deflagration in reactor 4
building
Immediate Coordinated Response
Activated its Emergency Operations Center
Immediately deployed personnel to the U.S.
Embassy in Japan to support the Reactor Safety
Team (RST)
Provided expert advice to the U.S. Ambassador
and Government of Japan ministers
Set up and coordinated consortium call that
involved NRC, INPO, DOE, and Naval Reactors
Organized nuclear industry technical response to
assist TEPCO
Activated its Emergency Operations Center
focused on monitoring radiation release and
impact on U.S. citizens (both in Japan and the
U.S.)
Deployed Airborne Monitoring System aircraft
and Consequence Management Response
Teams
Provided additional DOE Embassy reps to the
two already assigned to the U.S. Embassy
Deployed national laboratory reps from INL,
PNNL and Sandia to provide technical
assistance
Assigned NE personnel to stand watch in the
DOE EOC

DOE Response to Fukushima Events
During the first several weeks following the Japan earthquake and tsunmai, DOE provided a significant and diverse set of analysis to support the events at Fukushima-Daiichi
This response involved a broad set of institutions with over 200 people contributing DOE: Offices of NE, SC, NNSA, EM- Laboratories: ANL, BNL, INL, LANL, ORNL, PNNL, and SNL
- Numerous universities
- Individual consultants – Secretary’s external science experts

Nuclear Energy Response Team
TEPCO/NISAGOJ
Integrator
CONUS
INPO
Industry
DOE
NRC
Lab Tasking
DOE Labs
S-1 Science Experts-
POC
US Embassy – Japan
DART/NRC/DOE/
DoD/INPOPOC
SC
NENNSA
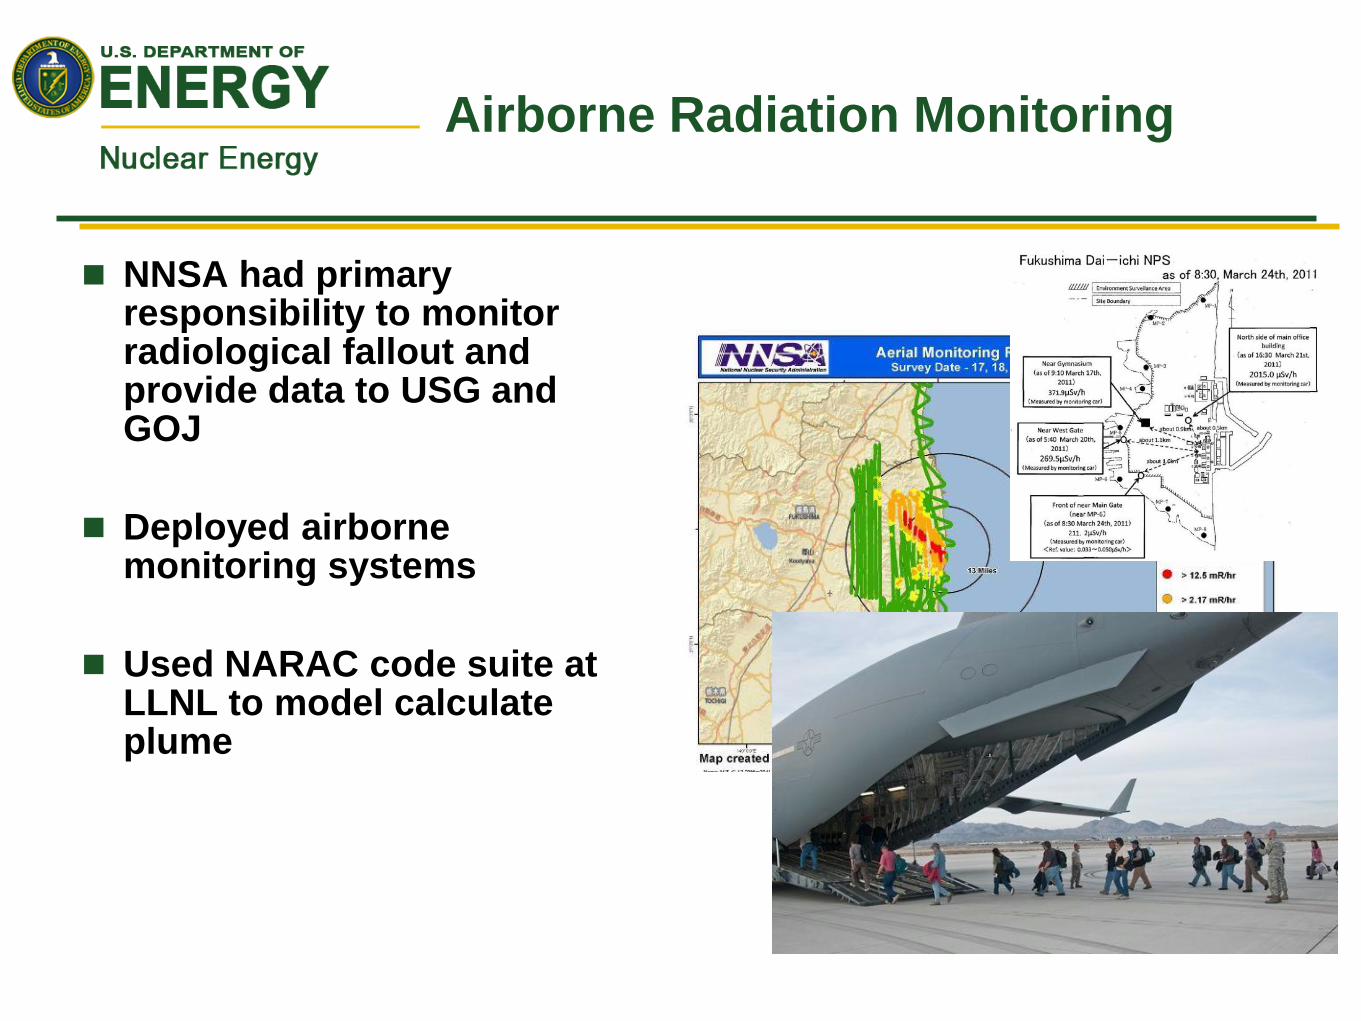
Airborne Radiation Monitoring
NNSA had primary responsibility to monitor radiological fallout and provide data to USG and GOJ
Deployed airborne monitoring systems
Used NARAC code suite at LLNL to model calculate plume

Airborne Radiation Monitoring
Data based on 42 fixed wing and helicopter survey flights at altitudes ranging from 150 to 700 meters between April 6 and April 29

Office of Nuclear Energy
Response Team
Primary mission- Assess and clarify information for DOE and NE leadership concerning the
status of the Fukushima Dai-ichi reactor situation
Provide support to NE EOC watch standers
Organized national laboratory analysis activities to support: - White House and USG
- U.S. Embassy Requests
- DOE and NE Leadership

DOE Analysis for Initial and
Stabilization Phase
Core damage and fuel condition
Collection of daily status data
and events
H2 production and explosions
in reactor buildings
Corrosion in sea water
solutions
N2 inerting options and
processes
Drywell filling options and
water level tracking
Severe accident analysis and
management
Sensor data analysis
Stabilization criteria
Spent Fuel Pool (SFP) water
level analysis
SFP hydrogen production and
analysis
SFP modeling
Isotope and radionuclide
calculations and releases
Structural analysis of RPV after
pressure spikes
Water level calculations
Thermal analysis for SFP fill
options
Robotics tools for stabilization
Shielding advice for on-site
equipment
Gas inventory calculations
Bioaccumulation for water
releases
Potential for further H2
production and explosions
Reactor building and SFP dose
assessments
Decay heat calculations
Criticality determinationsIsotopic analysis of releases

Reactor Building Survey Results
Unit 2
DOE Fukushima Response
Recent (19 May) survey results for Unit 2 shown below; dose rates in the
range of 15 to 45 mSv/hr (1.5 to 4.5 R/hr
Underscores the difficulty in restarting normal RHR equipment

Passive Cooling Assessment
0
1
2
3
4
5
6
0 100 200 300 400
Time after shutdown (days)
De
ca
y H
ea
t P
ow
er
(MW
)
1380 MWt (Unit 1)
2380 MWt (Units 2-3)
Lower-bound
estimate of 250
kW: heat transfer
limited by shielding
concrete around
drywell
Upper-bound estimate
of 1.7 MW: heat
transfer limited by
conduction through
reactor building
exterior walls
Shielding
concrete
Reactor building
exterior walls
Calculated containment passive cooling heat removal
rates compared with decay heat levels for Units 1-3

Long-term Decay Heat Removal
Decay heat cooling would take about 9 months using of passive cooling
Explored options for accelerated cooling
- Capture, treatment and
reuse of cooling water
- Alternate cooling
approaches

Thermal analysis of pool heatup
and boil off
Models of spent fuel pools developed to predict pool boil off time and to understand hydrogen production
Used to perform analysis of pool leakage scenarios
Calculations based on several codes and models to provide range in turn-around time and fidelity
0 9
8642
1 3 5 7
0 9
8642
1 3 5 7
0 9
8642
1 3 5 7CR
CR
CR CR CR
CR CRCRCR
CR30
0
2
4
6
8
9
1
3
5
7
CR
CRCR
CR
CR
CR
CR
CR
C
E F P M W F P M
UNIT 4 SFP HEAT GENERATION RATE DISTRIBUTION POOL LEVEL FOR VARIOUS SCENARIOS FOR UNIT 4
16 0.19 kW
24 0.16 kW
14 0.20 kW
10 0.22 kW
12 0.21 kW
9 0.23 kW
5 0.30 kW
8 0.24 kW
2 0.55 kW
4 0.40 kW
1 1.12 kW
IF 3.60 kW

DOE Analysis for Recovery Phase
Core damage and fuel
condition
Collection of daily status data
and events
Corrosion in sea water
solutions
Passive cooling options
Leak management
Severe accident analysis and
management
SFP modeling
Isotope and radionuclide
calculations and releases
Thermal analysis for SFP fill
options
Robotics tools for stabilization
Shielding advice for on-site
equipment
Bioaccumulation for water
releases
Potential for further H2
production and explosions
Dry-well gap cooling
Clean-up and recycling of
reactor coolant
Corrosion Mitigation Concepts
Water clean-up options
Reactor building and SFP dose
assessments
Decay heat calculations
Criticality determinationsIsotopic analysis of releases
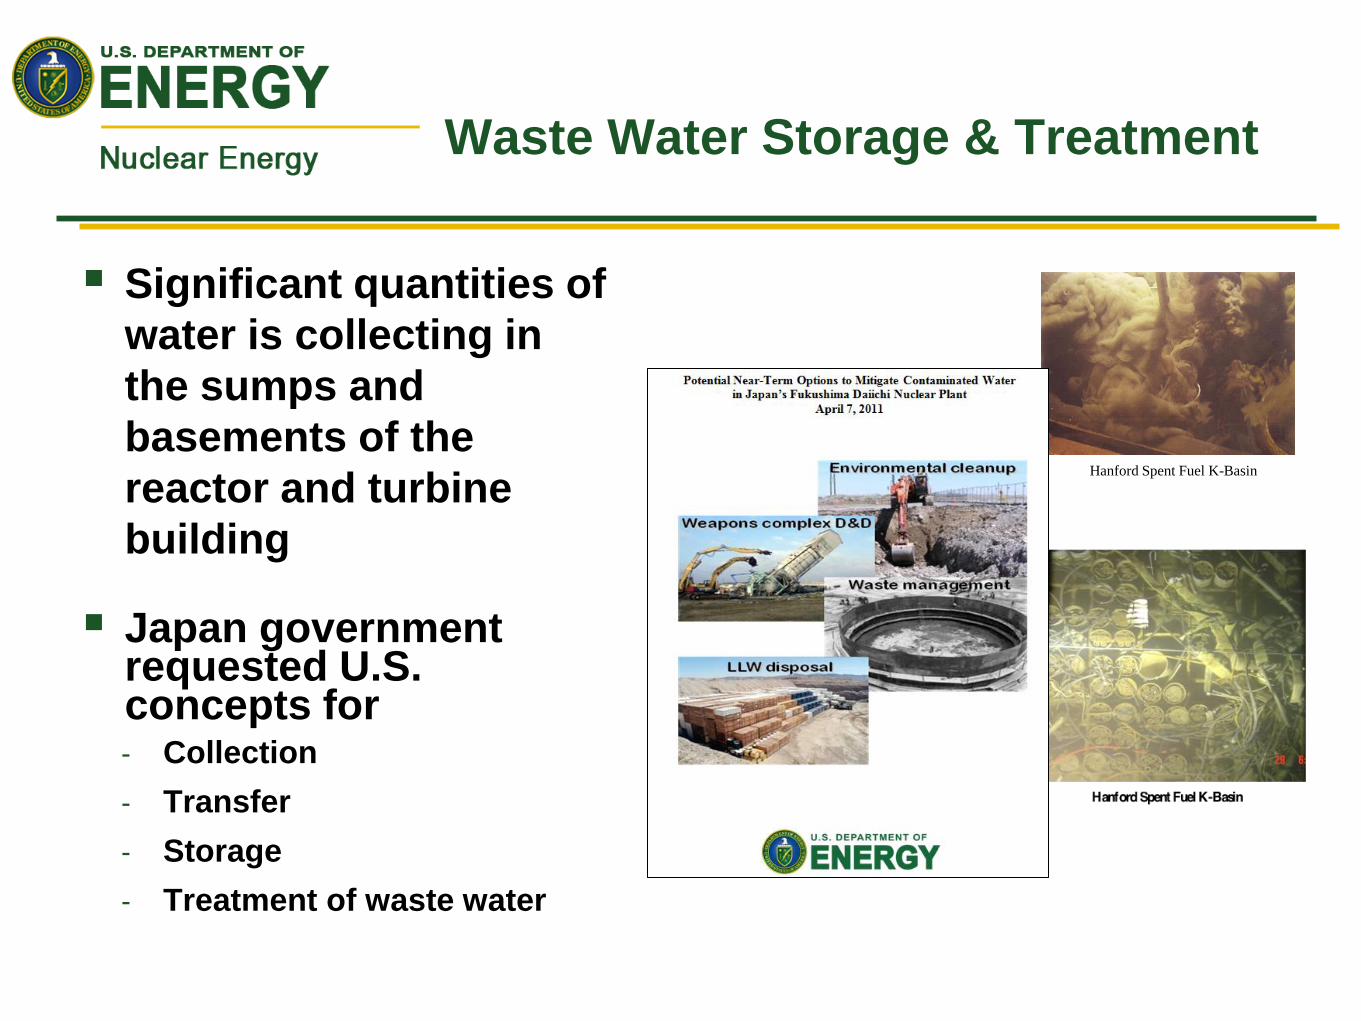
Waste Water Storage & Treatment
Significant quantities of
water is collecting in
the sumps and
basements of the
reactor and turbine
building
Japan government requested U.S. concepts for- Collection
- Transfer
- Storage
- Treatment of waste water
Hanford Spent Fuel K-Basin
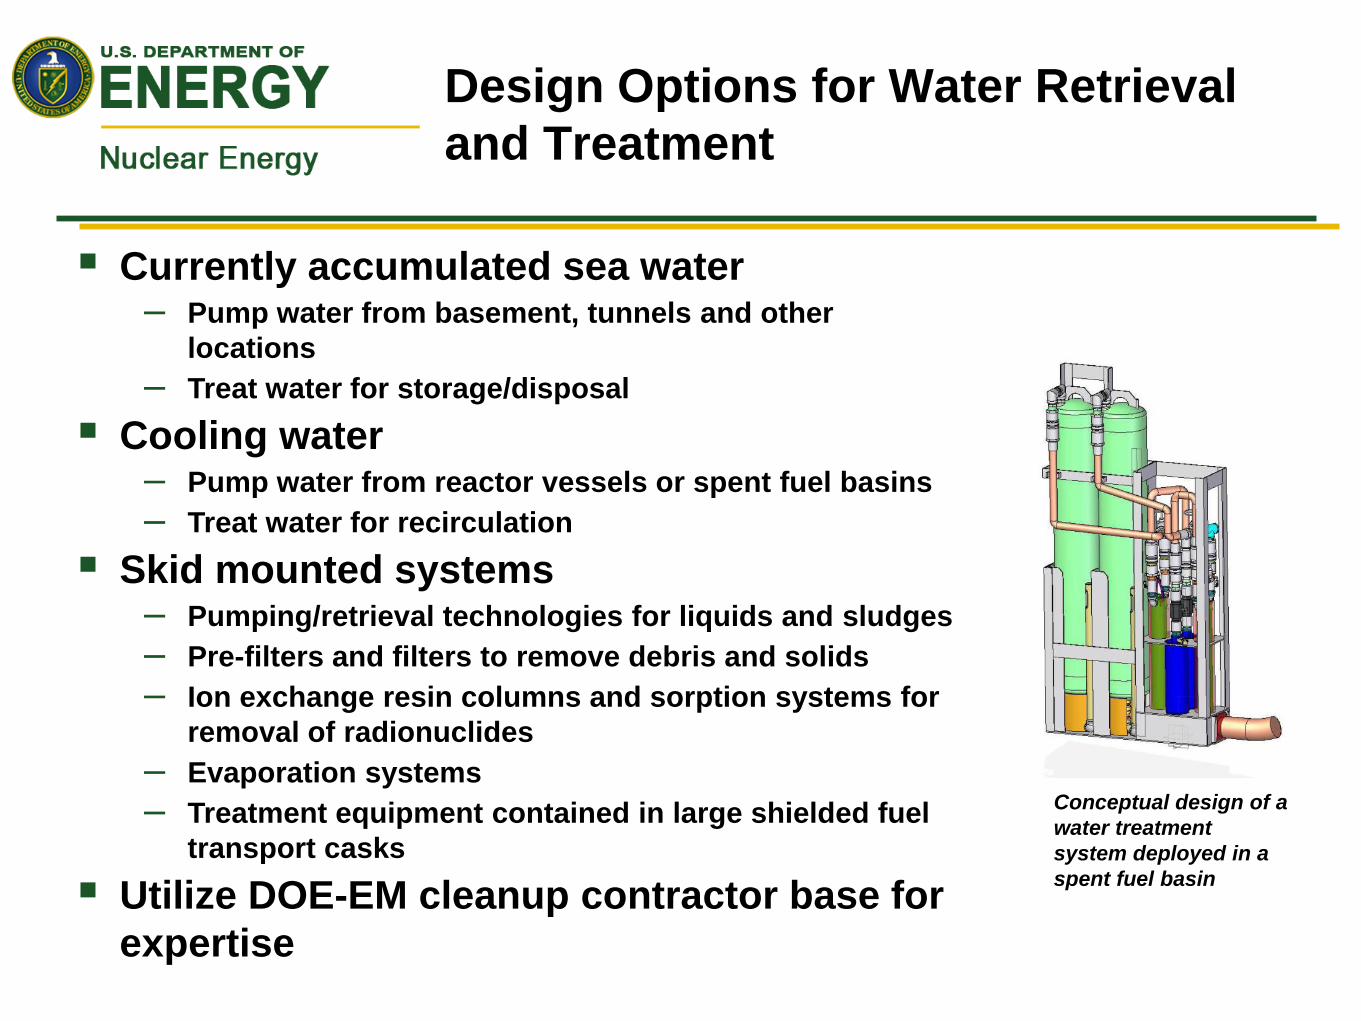
Design Options for Water Retrieval
and Treatment
Conceptual design of a
water treatment
system deployed in a
spent fuel basin
Currently accumulated sea water– Pump water from basement, tunnels and other
locations
– Treat water for storage/disposal
Cooling water– Pump water from reactor vessels or spent fuel basins
– Treat water for recirculation
Skid mounted systems– Pumping/retrieval technologies for liquids and sludges
– Pre-filters and filters to remove debris and solids
– Ion exchange resin columns and sorption systems for
removal of radionuclides
– Evaporation systems
– Treatment equipment contained in large shielded fuel
transport casks
Utilize DOE-EM cleanup contractor base for
expertise

Corrosion rates of RPV steels have
been examined in the open literature
Fukushima-Daiichi plants utilize A533B steel for the pressure vessel (likely based on industry standards, but not confirmed)
There is little data on this class of steels in salt or concentrated salt solutions as it is not a typical choice for any application
Some data has been identified (and the search will continue)
Corrosion experience from Millstone unit 1
Sept. 1, 1972, the Millstone Unit 1 BWR was undergoing routine startup − Sea-water was introduced into full flow demineralizers
− High conductivity water entered the reactor vessel via the condensate/feedwater system
Corrosion effects were observed in a matter of hours− 116/120 of the local power range monitors (with very thin
walls) were damaged by cracking
− Stress corrosion cracking was observed in other reactor components and considered to be “superficial”
− Subsequent tests at GE found tests produced results more severe than in the actual incident.

Implications from Millstone 1 experience to Fukushima
Cracking likely occurred in all units very quickly as seawater was introduced
However, rapid cracking early in the event may not be sustained, consistent with the disposition of cracks that were deemed superficial to subsequent operation in Millstone
The observations on carbon steel testing are consistent with other literature results from other industries for this class of alloys
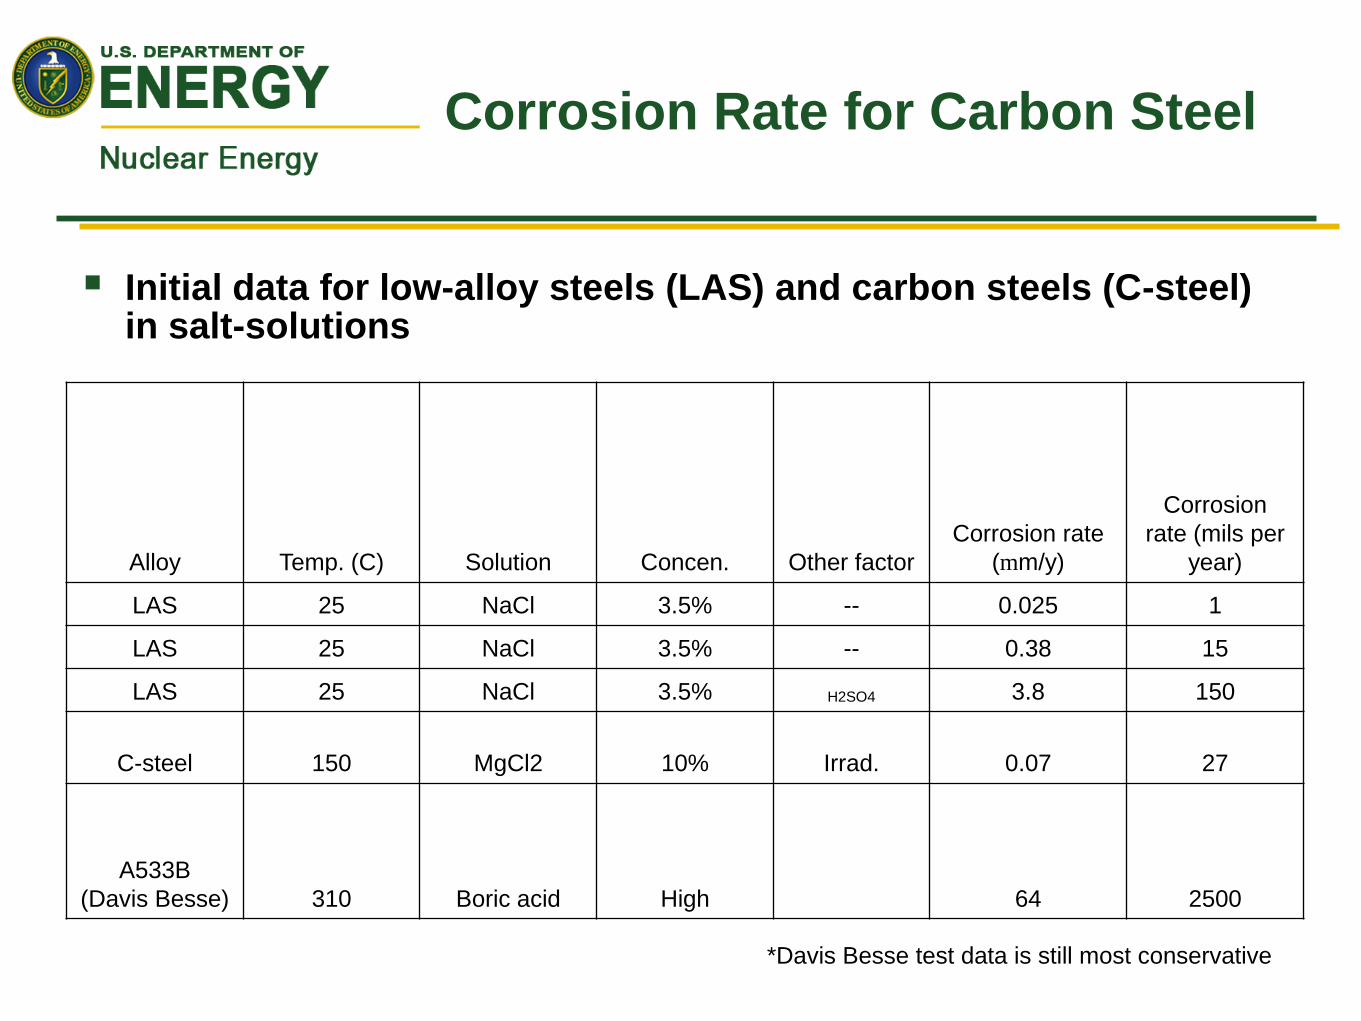
Corrosion Rate for Carbon Steel
Initial data for low-alloy steels (LAS) and carbon steels (C-steel) in salt-solutions
Alloy Temp. (C) Solution Concen. Other factor
Corrosion rate
(mm/y)
Corrosion
rate (mils per
year)
LAS 25 NaCl 3.5% -- 0.025 1
LAS 25 NaCl 3.5% -- 0.38 15
LAS 25 NaCl 3.5% H2SO4 3.8 150
C-steel 150 MgCl2 10% Irrad. 0.07 27
A533B
(Davis Besse) 310 Boric acid High 64 2500
*Davis Besse test data is still most conservative
Next Steps for DOE-NE
Continue our Support for the Government of Japan− Peer reviews and analysis as requested
Data collection and accident forensics to support lessons learned
Continued monitoring of potential accident consequences


