Solar Energy Technologies Program John Bartlett Financial Analyst Solar Energy Technologies Program (SETP) Department of Energy Office of Energy Efficiency and Renewable Energy DOE Solar Energy Technologies Program Accelerating the U.S. Solar Industry Southeast Solar Market Update National Conference of State Legislatures Southeast Solar Energy Institute Washington, DC October 8, 2009
Transcript
Solar Energy Technologies Program
John BartlettFinancial AnalystSolar Energy Technologies Program (SETP)
Department of EnergyOffice of Energy Efficiency and Renewable Energy
DOE Solar Energy Technologies ProgramAccelerating the U.S. Solar Industry
Southeast Solar Market UpdateNational Conference of State LegislaturesSoutheast Solar Energy InstituteWashington, DCOctober 8, 2009
U.S. Department of Energy Solar Energy Technologies Program Slide 2
In the U.S., solar resources significantly outweigh energy use
• Despite the size of the resource, solar currently provides less than 0.1% of the electricity used in the U.S.
• The entire continental U.S. has a solar resource superior to that of Germany, the largest market for solar PV.
U.S. Department of Energy Solar Energy Technologies Program Slide 3
Despite its solar resource, the U.S. has been a comparatively small market for solar
Global cumulative installed PV capacity through 2008 (IEA 2008 and 2009, REN21 2009, EurObserv’ER 2009, Sherwood/IREC 2009)
• With a solar resource similar to that of Alaska, Germany has installed nearly five times the amount of solar PV as the U.S.
U.S. Department of Energy Solar Energy Technologies Program Slide 4
Top five state markets for solar PV in the U.S.
Annual and cumulative grid-connected PV in top state markets, 2004–2008(Sherwood 2009)
• Within the U.S. as well, solar adoption has been driven by state policies as well as the solar resource.
U.S. Department of Energy Solar Energy Technologies Program Slide 5
Southeast Case Study 1: North Carolina Solar Set-Aside in its Renewable Portfolio Standard
0
50
100
150
200
250
300
350
2008 2010 2012 2014 2016 2018 2020 2022 2024
Solar Set-Aside Capacity (MW) Solar Set-Aside Generation (GWh)
Solar capacity and generation needed to meet North Carolina’s solar set-aside within its renewable portfolio standard
(Lawrence Berkeley National Lab 2009)
• With the requirement of generating 0.2% of its electricity from solar by 2018, over 200 MW of solar will be installed within the next 10 years.
U.S. Department of Energy Solar Energy Technologies Program Slide 6
Southeast Case Study 2: Utility Solar Projects in Florida
• The DeSoto Next Generation Solar Energy Center– At 25 MW, it will be the largest
U.S. PV installation– Commenced construction in
late 2008 with expected completion in October 2009
• The Space Coast Next Generation Solar Energy Center– 10 MW of PV, located at
Kennedy Space Center– Commenced construction in
June 2009 with expected completion in early 2010
U.S. Department of Energy Solar Energy Technologies Program Slide 7
Southeast Case Study 2: Utility Solar Projects in Florida
• The Martin Next Generation Solar Energy Center– At 75 MW, it will be the largest
solar installation of any kind outside of California
– The first hybrid solar facility to connect to an existing combined-cycle power plant
– The first U.S. concentrating solar power (CSP) installation outside of the Southwest
– Commenced construction in December 2008 with expected completion by the end of 2010
U.S. Department of Energy Solar Energy Technologies Program Slide 8
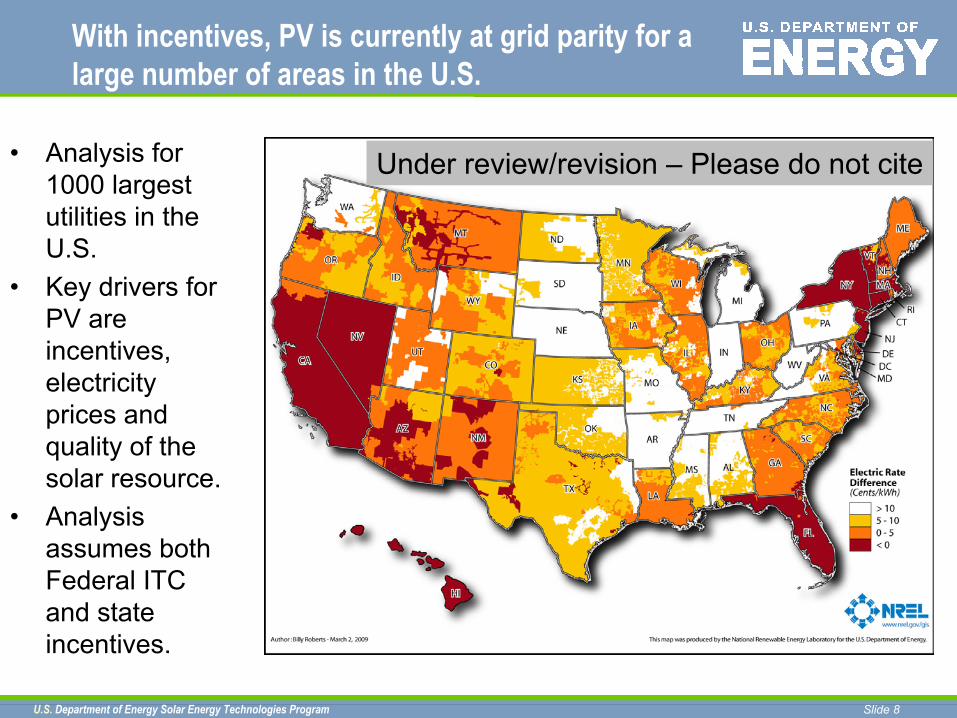
With incentives, PV is currently at grid parity for a large number of areas in the U.S.
• Analysis for 1000 largest utilities in the U.S.
• Key drivers for PV are incentives, electricity prices and quality of the solar resource.
• Analysis assumes both Federal ITC and state incentives.
Under review/revision – Please do not cite
U.S. Department of Energy Solar Energy Technologies Program Slide 9
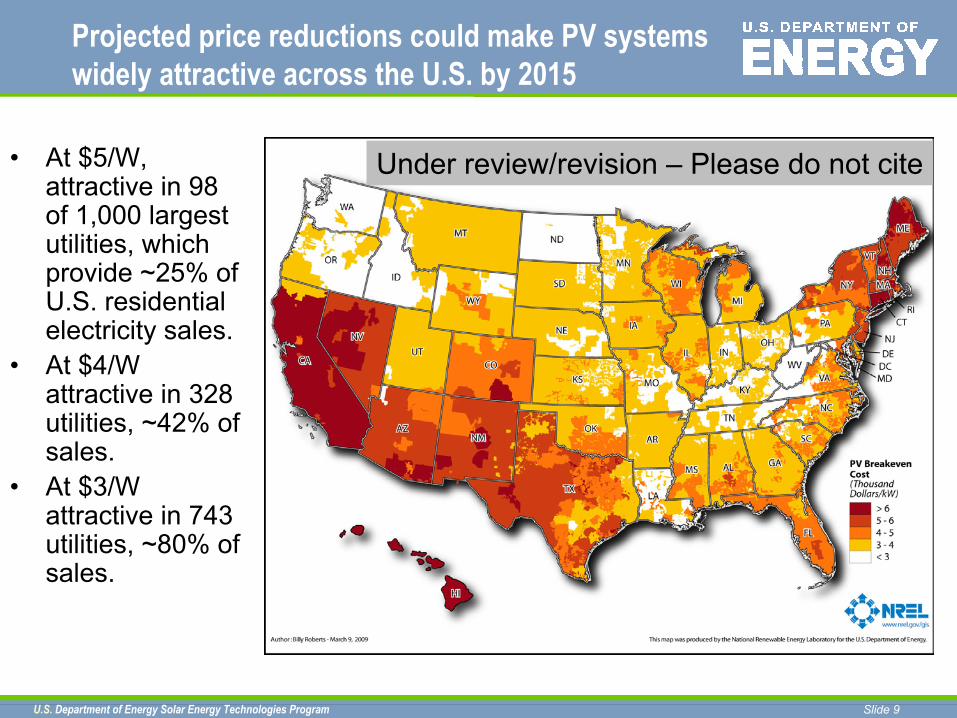
Projected price reductions could make PV systems widely attractive across the U.S. by 2015
• At $5/W, attractive in 98 of 1,000 largest utilities, which provide ~25% of U.S. residential electricity sales.
• At $4/W attractive in 328 utilities, ~42% of sales.
• At $3/W attractive in 743 utilities, ~80% of sales.
Under review/revision – Please do not cite
U.S. Department of Energy Solar Energy Technologies Program Slide 10
PV system price declines from 2008 to 2009
• As a result of increased production capacity and reduced demand due to the financial crisis, PV system prices have dropped significantly
Global average PV system prices, from surveys of industry analysts in Q3 2008 and Q1 2009(Bartlett et al. 2009)
-$1.00
$0.00
$1.00
$2.00
$3.00
$4.00
$5.00
$6.00
$7.00
$8.00
2007 2008 2009 2010
Year
PV
Sys
tem
ASP
($/
W-d
c)
2008E ASP 2009E ASP Estimate Change
U.S. Department of Energy Solar Energy Technologies Program Slide 11
PV module price declines from 2008 to 2009
• More recent estimates have indicated even lower module prices
• Currently: $1.90 -$2.60
• 2010 forecast: $1.60
Global average PV module prices, from surveys of industry analysts in Q3 2008 and Q1 2009(Bartlett et al. 2009)
-$0.50
$0.00
$0.50
$1.00
$1.50
$2.00
$2.50
$3.00
$3.50
$4.00
$4.50
2007 2008 2009 2010
Year
PV
Mod
ule
ASP
($/
W-d
c)
2008E ASP2009E ASP Estimate Change
U.S. Department of Energy Solar Energy Technologies Program Slide 12
The U.S. is rich in solar investments to continue cost reductions and technology improvements
The US is the most diversified in solar technologies receiving VC and PE financing, with substantial investment in thin film PV, as well as CPV and CSP
VC & PE Solar Investments by Region and Technology
$0
$500
$1,000
$1,500
$2,000
$2,500
$3,000
2000
2001
2002
2003
2004
2005
2006
2007
2008
2000
2001
2002
2003
2004
2005
2006
2007
2008
2000
2001
2002
2003
2004
2005
2006
2007
2008
Asia EU* US**
Region / Year
Mil
lion
s of
$
0
10
20
30
40
50
60
70
80
90
Nu
mb
er of Tran
sactions
Thin Film PVSolar Heating & CoolingProject DeveloperPolysiliconOtherNext Generation PVMultijunctionManufacturing EquipmentInvertersCSPCrystalline Silicon PVCPVNumber of Transactions
Source: New Energy Finance*EU includes Israel, Morocco, & South Africa**U.S. includes Australia and Canada
• In Europe, most of the funding has been to polysilicon, c-Si PV and project developers
• In Asia, most of the investment has gone to c-Si PV
U.S. Department of Energy Solar Energy Technologies Program Slide 13
Non-government U.S. investment in solar has grown enormously over the past five years
Between 2004 and 2008, investments in the form of Venture Capital/Private Equity, Debt and Public Equity have grown by over 100% per year on average, reaching almost $4 billion 2008
$0
$500
$1,000
$1,500
$2,000
$2,500
$3,000
$3,500
$4,000
$4,500
2000 2001 2002 2003 2004 2005 2006 2007 2008
Year
$ in
Mil
lion
s
0%
10%
20%
30%
40%
50%
60%
70%
80%
90%
100%
Solar M&A ActivityU.S. Government R&DVC & PE InvestmentsSolar DebtSolar Public Equity ActivityUS Government R&D as a % of Total Investment