1 Paper presented at the World Bank Urban Research Symposium, Urban Development for Economic growth and Poverty Reduction, December 15-17, 2003 Washington, D.C., USA. Does City Structure cause Unemployment ? The case study of Cape Town (PRELIMINARY WORK: DO NOT QUOTE) Sandrine ROSPABE * and Harris SELOD ** December 7, 2003 * CREREG, Université de Rennes I, France. E-mail: [email protected]** INRA-LEA (PARIS-Jourdan) and CREST -INSEE, France. E-mail: [email protected]1 Harris Selod is grateful to the South African Data Archive and the City of Cape Town for providing the data used in this study. His warmest thanks go to Simon Bekker, Jens Kuhn, Saleem Mowzer, Phillip Romanovski, Amanda van Heeden and Rae Wolpe for their much appreciated help. The authors are also grateful to researchers at DPRU, University of Cape Town, and especially Haroon Bhorat and Eckart Naumann for their kind help and advice. All opinions expressed in the present paper are the authors’ only.
Transcript
1
Paper presented at the World Bank Urban Research Symposium,
Urban Development for Economic growth and Poverty Reduction, December 15-17, 2003
** INRA-LEA (PARIS-Jourdan) and CREST -INSEE, France. E-mail: [email protected]
1 Harris Selod is grateful to the South African Data Archive and the City of Cape Town for providing the
data used in this study. His warmest thanks go to Simon Bekker, Jens Kuhn, Saleem Mowzer, Phillip Romanovski, Amanda van Heeden and Rae Wolpe for their much appreciated help. The authors are also grateful to researchers at DPRU, University of Cape Town, and especially Haroon Bhorat and Eckart Naumann for their kind help and advice. All opinions expressed in the present paper are the authors’ only.
2
Summary
Several theoretical and empirical findings suggest that the spatial organization of cities can be a
source of unemployment among unskilled workers and ethnic minorities, stressing either the
role of residential segregation or that of the physical disconnection between work and residence.
The present paper investigates this issue in South Africa by focusing on the example of Cape
Town, a sprawling and highly segregated city. Using the dataset of the 1999 study on the
Migration and Settlement in the Cape Metropolitan Area complemented by local population
statistics extracted from the 1996 Census and local employment statistics extracted from the
City of Cape Town’s 2000 RSC Levy database, we regress the unemployment probability of a
selection of workers in 24 different areas of the city on their individual and household attributes
as well as on the characteristics of their locations. Results obtained so far suggest that (i)
distance to jobs, (ii) rural origin (especially for women) and (iii) the length of time spent in their
present dwelling reduce the employment probability of workers.
Keywords: Local Labor Markets, Segregation, Spatial Mismatch, Unemployment Probability.
3
Introduction
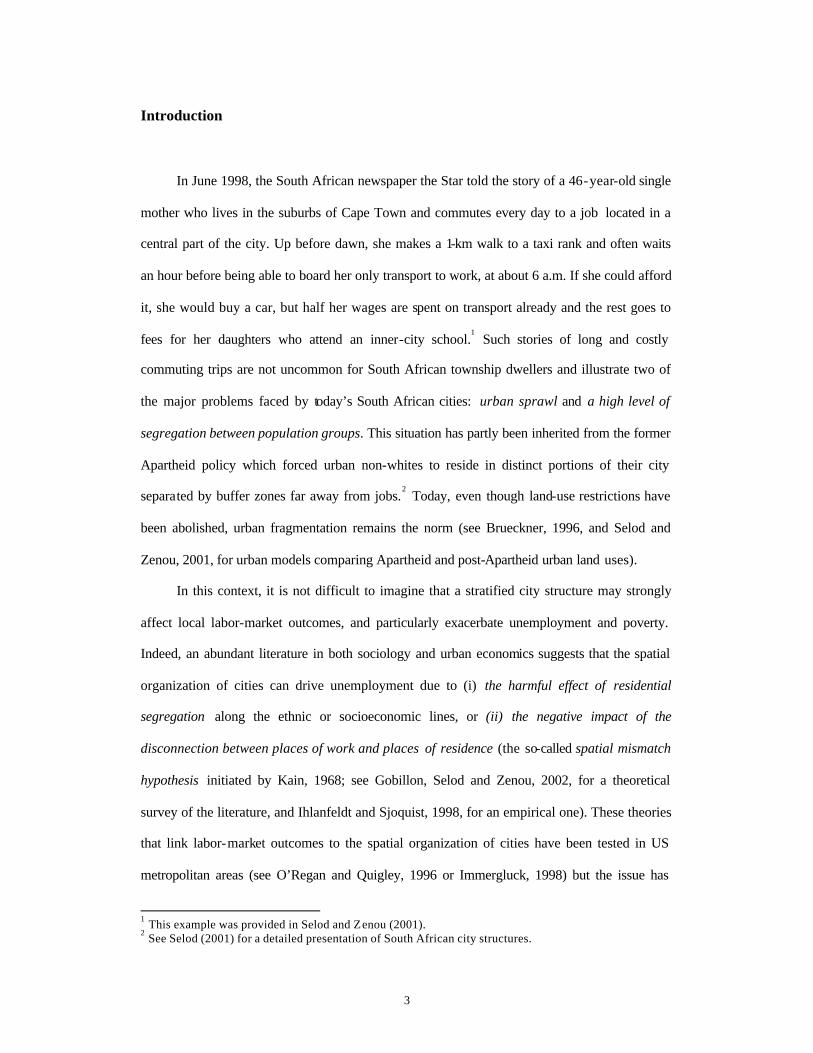
In June 1998, the South African newspaper the Star told the story of a 46-year-old single
mother who lives in the suburbs of Cape Town and commutes every day to a job located in a
central part of the city. Up before dawn, she makes a 1-km walk to a taxi rank and often waits
an hour before being able to board her only transport to work, at about 6 a.m. If she could afford
it, she would buy a car, but half her wages are spent on transport already and the rest goes to
fees for her daughters who attend an inner-city school.1 Such stories of long and costly
commuting trips are not uncommon for South African township dwellers and illustrate two of
the major problems faced by today’s South African cities: urban sprawl and a high level of
segregation between population groups. This situation has partly been inherited from the former
Apartheid policy which forced urban non-whites to reside in distinct portions of their city
separated by buffer zones far away from jobs.2 Today, even though land-use restrictions have
been abolished, urban fragmentation remains the norm (see Brueckner, 1996, and Selod and
Zenou, 2001, for urban models comparing Apartheid and post-Apartheid urban land uses).
In this context, it is not difficult to imagine that a stratified city structure may strongly
affect local labor-market outcomes, and particularly exacerbate unemployment and poverty.
Indeed, an abundant literature in both sociology and urban economics suggests that the spatial
organization of cities can drive unemployment due to (i) the harmful effect of residential
segregation along the ethnic or socioeconomic lines, or (ii) the negative impact of the
disconnection between places of work and places of residence (the so-called spatial mismatch
hypothesis initiated by Kain, 1968; see Gobillon, Selod and Zenou, 2002, for a theoretical
survey of the literature, and Ihlanfeldt and Sjoquist, 1998, for an empirical one). These theories
that link labor-market outcomes to the spatial organization of cities have been tested in US
metropolitan areas (see O’Regan and Quigley, 1996 or Immergluck, 1998) but the issue has
1 This example was provided in Selod and Zenou (2001). 2 See Selod (2001) for a detailed presentation of South African city structures.
4
seldom be investigated in cities in the developing world, although city fragmentation is a major
issue in many developing countries. The objective of the present work is to investigated how
city structure can affect employment prospects in the particular case of Cape Town. Section 1
presents a brief synthesis of the economic literature that links the formation of unemployment to
city structure. Section 2 presents some relevant stylized facts about Cape Town, its population
and its economic structure. Section 3 presents our methodological approach and carries out the
empirical analysis.
1. Urban unemployment and city structure: a brief review of the literature
An abundant literature in sociology and urban economics suggests that the spatial
organization of cities can exacerbate unemployment and deteriorate the income of
disadvantaged communities. In this perspective, labor-market outcomes should depend on
individual characteristics (age, education, ethnicity,…) but also on location within the city. The
present section surveys the two major explanations put forward by economists that underpin this
theory. The first one stresses the role played by the physical distance to job opportunities
(Section 1.1.) whereas the second one underlines the harmful effects of residential segregation
(Section 1.2.).
1.1. The physical disconnection between jobs and residential locations
The first reason why city structure might influence labor-market outcomes is that the
physical disconnection between places of work and places of residence (i.e. spatial mismatch)
can be a source of long and expensive commuting costs, which hinders the mobility of workers.
Moreover, the costs associated with the physical disconnection to jobs may be further
accentuated by congestion and, for those who do not own a car, by the poor quality of public
5
transportation systems (due to an incomplete network coverage, long waits at connection nodes,
or the lack of coordination between transportation modes). Some workers –notably unskilled
ones who are likely to hold part time jobs or start working very early in the morning or late at
night– may be confronted to low public transportation frequencies, if not to the closing of the
network. In this context, unemployed workers residing in neighborhoods disconnected from job
opportunities face temporal and monetary commuting costs that are often very high in
comparison with the wages they are offered. This may lead to very low net wages and deter
workers from accepting any job at all. In this respect, Brueckner and Martin (1997) and
Brueckner and Zenou (2003) propose urban models in which commuting costs are indeed the
main source of both low wages and urban unemployment.
Distance to job opportunities may also discourage job search (when it is too costly) or
even deteriorate its efficiency. In this respect, it has been shown that the quantity and quality of
information workers have about job opportunities within a specific metropolitan area decrease
with distance to jobs, which in turn reduces the efficiency of job search (see Rogers, 1997;
Ihlanfeldt and Sjoquist, 1990; Ihlanfeldt, 1997). The fact that informa tion about jobs decreases
with distance finds several justifications. For instance, many employers resort to spatially -
limited search modes such as posting want-signs in shops or having adds published in local
newspapers (Turner, 1997). Another explanation is that job candidates usually experience
difficulties in identifying potential recruiters in distant zones they are unfamiliar with. In this
respect, Davis and Huff (1972) have shown that job seekers only search efficiently in a
restricted perimeter around their place of residence, even if this zone only hosts poor quality
jobs that pay little. These mechanisms are at the core of theoretical models that aim at
explaining the formation of urban unemployment (see Wasmer and Zenou, 2002, where job
search efficiency decreases with distance to jobs, or, in a different context, Ortega, 2000, where
search costs are higher out of a worker’s zone of residence).
6
1.2. Residential segregation
Physical disconnection between jobs and residential locations is not the only way space
can deteriorate the socioeconomic opportunities of workers. Researchers also stress the role of
socioeconomic and often ethnic segregation (see e.g. Cutler and Glaeser, 1997, and Selod and
Zenou, 2001), which may have four main consequences:
First, residential segregation can be a hindrance to human capital acquisition, which may
in turn deteriorate the employability of segregated workers, and especially that of young
individuals. The links between residential segregation and poor school results are indeed well
documented: residential segregation often concentrates low -skill learners in schools, and this
concentration exerts a negative externality on the learning process (Benabou, 1993). This is
because, as shown by the literature on education production functions, the success of a given
student largely depends on the socioeconomic characteristics of all the other students in the
class (Summers and Wolfe, 1977; Arnott and Rowse, 1987). In other words, in neighborhoods
that concentrate low -ability students, human capital externalities can further deteriorate school
achievements.
A second consequence of residential segregation is that it fuels the emergence of social
problems that also deteriorate the employability of workers. In this respect, Crane (1991)
develops an epidemic theory of ghettos in which the propensity of youngsters to adopt a socially
deviant behavior (for instance dropping out of schools or yielding to criminality) depends on the
proportion of same-behavior individuals in the neighborhood. This contagion is all the more
prevalent as adults are themselves unemployed and do not provide a figure of social success
with which youngsters could identify.
A third consequence of residential segregation is that it can deteriorate social networks in
disadvantaged communities. This is a crucial point since a significant proportion of jobs are
usually found through personal contacts (Mortensen and Vishwanath, 1994) and since low-
7
skilled workers, young adults, and ethnic minorities often resort to such informal search
methods (Holzer, 1987 and 1988). In other words, social network quality is key in the job
acquisition process of unskilled workers and ethnic minorities, but since many of them reside in
disadvantaged neighborhoods, they usually benefit from social networks of poor quality. In
particular, the local unemployment rate in these neighborhoods is usually higher than average,
so that local residents know fewer employed workers that could refer them to their own
employer or provide them with professional contacts. In this respect, Reingold (1999) concludes
that the poor quality of social networks explains a significant portion of unemployment
problems in disadvantaged urban areas in the US. These issues have recently been the focus of
several formalizations: Calvo-Armengól and Zenou (2003) present a non-spatial theoretical
model of social network and unemployment formation, whereas Selod and Zenou (2002)
provide an urban model in which residential segregation can exacerbate unemployment through
low-quality social networks.
Finally, a fourth mechanism that links bad labor-market outcomes to segregation involves
the reluctance of employers to hire workers residing in disadvantaged communities. The
stigmatization of these neighborhoods is at the root of redlining , a practice in which employers
draw an imaginary red line around a stigmatized neighborhood and beyond which they
discriminate against residents (see Zenou and Boccard, 2000, for a formalization in an urban
model).
To sum up, several theoretical mechanisms have been put forward so as to explain how
city structure can have harmful effects on the labor market. The rest of the paper tries to
confront these elements of theory to the particular case of Cape Town.
8
2. The city of Cape Town: racial segregation, the disconnection between places
of work and places of residence, and labor-market outcomes
In the present section, we provide descriptive statistics for Cape Town., an urban area that
expands beyond 25 km and encompasses almost 2.7 millio ns inhabitants.3
Figure 1: The “Cape Town Urban Area”
Ca pe Cen tral
Fish Ho ek
Simons Town
W yn be rg
Milnert on
Go odwood
EppingLa ng a
Gug uleth u
M it ch ells Plain
Kh ayelitsh a
Be llville
S tran d
G ordo ns B ay
So me rs et W e st
C larem on t
W ood st ock
Ho ut Bay
Kuilsr iv ier
0
The Cape Town Extended Area
3 Official data is usually given for the Cape Metropolitan Area (CMA), an aggregation of several hundred
suburbs which, in the recent past, were grouped into six local municipalities. In the subsequent econometric analysis however (see section 3) we use a somewhat different definition of the metropolitan area which in our minds better corresponds to a functional definition of Cape Town in terms of economic integration. In our definition, we have excluded from the CMA the suburbs that belong to the northern part of the Blaauberwg municipality such as Atlantis which, in our opinion, should be viewed as a town by itself. We have labeled our working definition of Cape Town the “Cape Town Urban Area” (CTUA). Like the CMA, the CTUA does not include far places to the east and north-east such as Stellenbosch or Paarl. It extends south-east as far as Strand or Gordons Bay (see Figure 1).
9
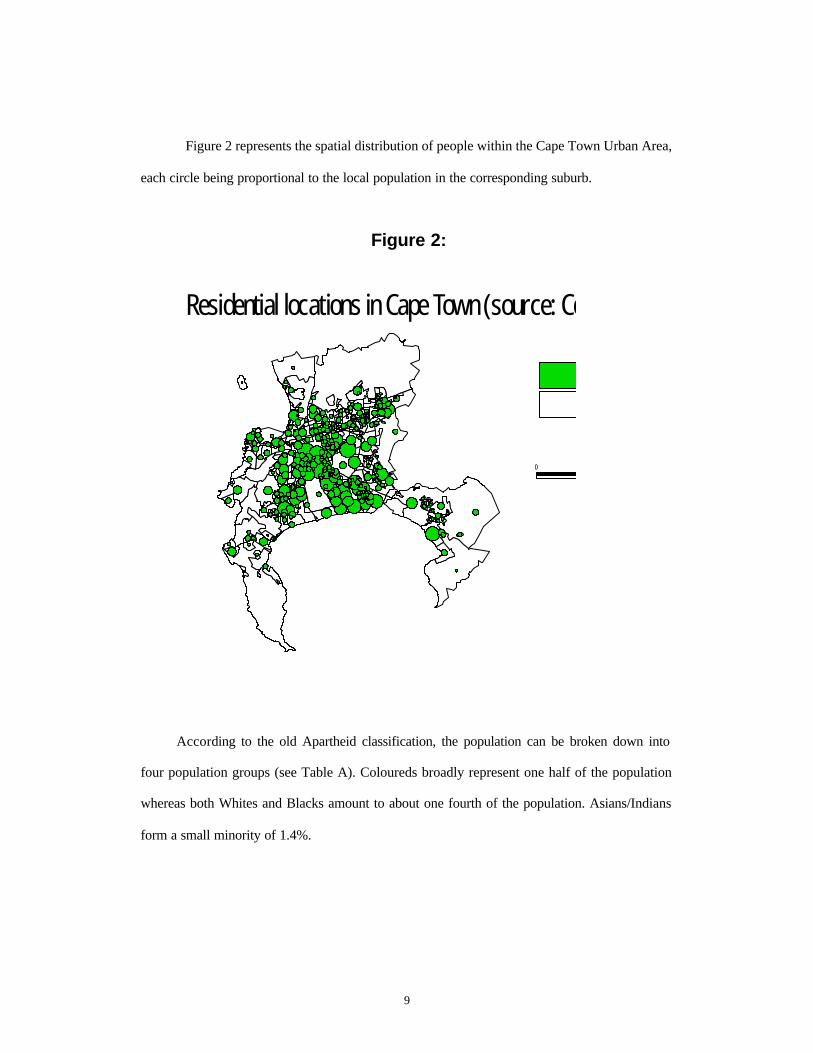
Figure 2 represents the spatial distribution of people within the Cape Town Urban Area,
each circle being proportional to the local population in the corresponding suburb.
Figure 2:
0
Residential locations in Cape Town (source: Ce
According to the old Apartheid classification, the population can be broken down into
four population groups (see Table A). Coloureds broadly represent one half of the population
whereas both Whites and Blacks amount to about one fourth of the population. Asians/Indians
form a small minority of 1.4%.
10
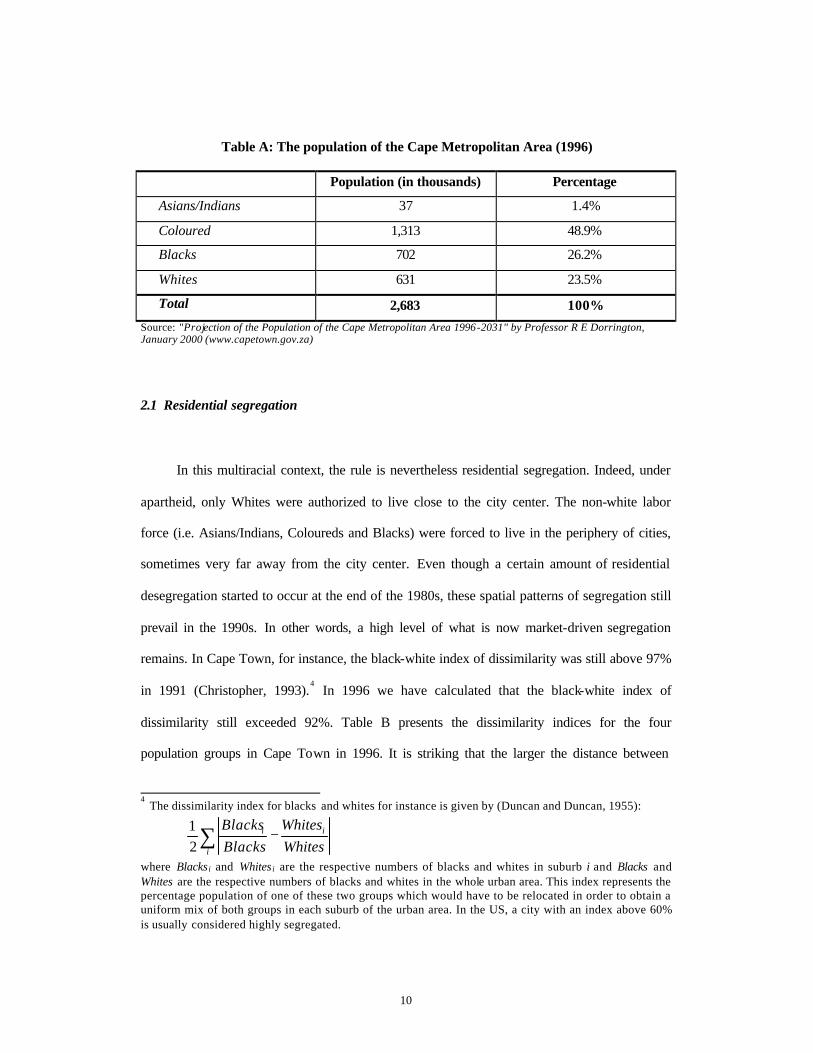
Table A: The population of the Cape Metropolitan Area (1996)
Population (in thousands) Percentage
Asians/Indians 37 1.4%
Coloured 1,313 48.9%
Blacks 702 26.2%
Whites 631 23.5%
Total 2,683 100%
Source: "Projection of the Population of the Cape Metropolitan Area 1996-2031" by Professor R E Dorrington, January 2000 (www.capetown.gov.za)
2.1 Residential segregation
In this multiracial context, the rule is nevertheless residential segregation. Indeed, under
apartheid, only Whites were authorized to live close to the city center. The non-white labor
force (i.e. Asians/Indians, Coloureds and Blacks) were forced to live in the periphery of cities,
sometimes very far away from the city center. Even though a certain amount of residential
desegregation started to occur at the end of the 1980s, these spatial patterns of segregation still
prevail in the 1990s. In other words, a high level of what is now market-driven segregation
remains. In Cape Town, for instance, the black-white index of dissimilarity was still above 97%
in 1991 (Christopher, 1993).4 In 1996 we have calculated that the black-white index of
dissimilarity still exceeded 92%. Table B presents the dissimilarity indices for the four
population groups in Cape Town in 1996. It is striking that the larger the distance between
4 The dissimilarity index for blacks and whites for instance is given by (Duncan and Duncan, 1955):
∑ −i
ii
Whites
Whites
Blacks
Blacks
21
where Blacks i and Whites i are the respective numbers of blacks and whites in suburb i and Blacks and Whites are the respective numbers of blacks and whites in the whole urban area. This index represents the percentage population of one of these two groups which would have to be relocated in order to obtain a uniform mix of both groups in each suburb of the urban area. In the US, a city with an index above 60% is usually considered highly segregated.
11
groups in the old Apartheid classification, the higher the residential segregation between the
population groups. In particular Whites are less segregated from Indians than from Coloureds or
Blacks. Blacks are almost completely segregated from all other groups.
Table B: Dissimilarity Indices (Cape Town Urban Area, 1996)
92.8% 94.5% 93.5% 76.3% 86.1% 63.3% Source: calculated by the authors from Census 1996 data.
2.2 The disconnection between places of work and places of residence
In Cape Town, jobs occupy central locations and most jobs are located around one edge
of the city: the central business district and its close surroundings (Mail and Guardian, 1999).
The central areas comprise centers of employment laid out along corridors extending outward
from the port and city center (see Figure 3).5
5 The location of salaried jobs has been obtain by our treatment of the RSC Levy database which we will explain in section 3 of the present paper.
12
Figure 3:
0
Job locations in Cape Town (source: RSC Levy 20
When one compares residential and job locations, it is clear that there exists a major
disconnection between places of work and places of residence (see Figure 4). This problem has
long been identified by Cape Town’s urban planners (see for instance the Cape Metropolitan
Council’s Spatial Development Framework, 1996).
13
Figure 4:
0
Population and jobs in Cape Town
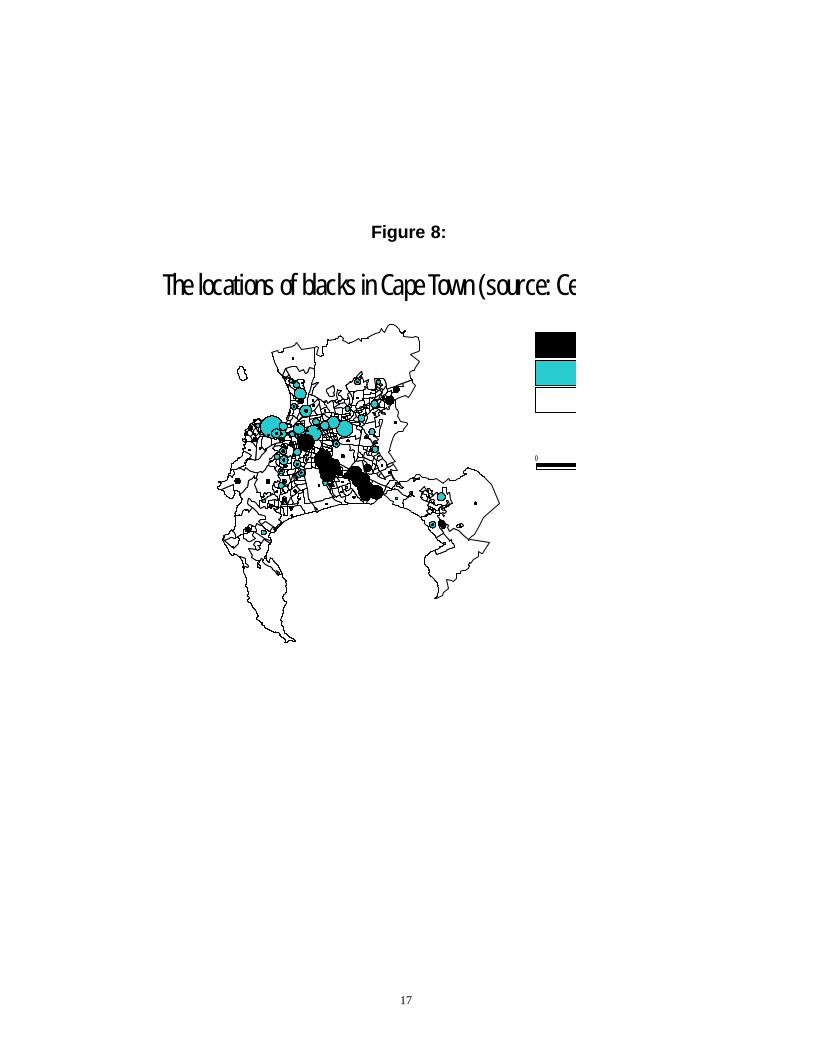
This physical disconnection or spatial mismatch does not affect the four population
groups equally. In fact Whites and Asians/Indians reside relatively close to jobs, whereas
Coloureds and especially Blacks are much distant from job locations (see Figures 5 to 8).
14
Figure 5:
0
The locations of whites in Cape Town (source: C
15
Figure 6:
0
The locations of asians in Cape Town (source: Ce
16
Figure 7:
0
The location of coloureds in Cape Town (source: C
17
Figure 8:
0
The locations of blacks in Cape Town (source: Ce
18
This situation results in very different job accessibilities across population groups --all
the more since mode choices also differ across population groups --. The 1999 study on
Migration and Settlement in the Cape Metropolitan Area (see Section 3) provides interesting
statistics with respect to commuting that we summarize in Table C. It is striking that Whites and
Asians/Indians mainly drive their cars to go to work whereas Coloureds and Blacks mainly
resort to public transportation.
TABLE C: Transport modes by population group (Cape Town, 1999)
Walk/ Bicycle
Public (minibus,
train)
Private (car)
Provided by employer
Other Total
Blacks 12% 58% 6% 13% 11% 100%
Coloureds 23% 39% 25% 11% 2% 100%
Asians 19% 14% 53% 12% 2% 100%
Whites 16% 4% 58% 16% 6% 100% Source: calculated by the authors on a sample of 1394 workers in the 1999 Migration and Settlement in the Cape Metropolitan Area dataset .
In this context of different job accessibilities and different modes of transportation,
population groups in Cape Town face very different commuting times and commuting costs (see
Table D below, where it can be seen Blacks incur the longest commuting trips).
TABLE D: Commuting times and commuting costs by population group (Cape Town, 1999)
Mean commuting time
(1 way, in minutes)
Median commuting time
(1 way, in minutes)
Mean commuting cost
(2 ways, in Rands)
Median commuting cost
(2 ways, in Rands)
Blacks 39 mn 30 mn R3.57 R3
Coloureds 25 mn 20 mn R3.89 R3
Asians 19 mn 15 mn R3.06 R3
Whites 23 mn 15 mn R6.31 R4
Total 30 mn 25 mn R4.03 R3
Source: calculated by the authors on a sample of 1394 workers in the 1999 Migration and Settlement in the Cape Metropolitan Area dataset .
19
2.3 Differences in labor-market outcomes
Labor-market outcomes vary considerably across population groups in Cape Town. Table E
presents the disparities in terms of unemployment rates and median income. The unemployment
rate for Blacks in Cape Town is close to 38% whereas it is only slightly above 4% for whites.
The median income of a black worker is more than one tenth of that of a white worker.
TABLE E: Unemployment and income by population group (Cape Town, 1996)
Blacks Coloureds Asians Whites Total
Employed 182,633 427,689 13,408 245,481 869,211
Unemployed,
looking for
work
110,791
91,483
1,590
10,522
214,386
Unemployment
rate
37,8%
17,6%
10,6%
4,1%
19,8%
Median
Income (Rands
per annum)
R4,200
R15,000
R24,000
R48,000
R15,000
Source: Space-Time Research, and "A Socio-Economic Profile of the Cape Metropolitan Area" by the Cape Metropolitan Council, based on the Population Census conducted by SA Stats in October 1996
Of course, these differences in labor-market outcomes largely stem from very different
levels of education inherited by history (see Selod and Zenou, 2001 and 2003). We will now
investigate the extent to which these differences can also be attributed to differences in location,
taking into account the role of job accessibility and residential segregation as the theory
suggests.
20
3 Econometric analysis
3.1 Methodological issues
The objective of our work is to investigate the possible causes of unemployment with a
particular focus on spatial factors. In order to do so, we want to estimate unemployment
probabilities at the individual level by taking into account both personal and household
characteristics as well as the role played by location characteristics such as neighborhood
composition or job accessibility.
3.1.1. The endogeneity of location choice
The search for neighborhood effect is complicated by the fact that individuals choose
their locations. Selective migration introduces the possibility that any correlation between
locations and employment outcome might not truly represent a “treatment effect”. The existing
literature offers three ways in circumventing the problem of endogenous location choices:
* The first solution is to focus on residential relocation experiments whic h attempt to
randomly assign individuals to locations with different characteristics (Katz et al, 2001).
* The second way in dealing with the problem is to concentrate on the outcomes of
children or young adults who presumably do not directly choose their place of residence
(O’Regan and Quigley, 1998; Case and Katz, 1991). However, Vigdor (2002) stresses an
important limitation to this line of analysis by showing that selective migration to a city in the
parent generation has a significant impact in the child generation.
* Finally, to obtain unbiased estimates of neighborhood effects, some researchers control
for non-random sorting into neighborhood by modeling the location choice (Ioannides and
Zabel, 2002). As Brock and Durlauf (2001) show, identification of neighborhood effect is
enabled by selection bias correction.
21
These analyses are all very demanding in term of data set availability, requiring for
instance a sample large enough either to select only young labor force participants who live with
their parents or to model neighborhood choice. The 1999 study on the Migration and Settlement
in the Cape Metropolitan Area that we will use provides information on each person’s
relationship with the head of the household. However restricting our sample to children (aged
from 15 to 25) members of the labor force would reduce the sample down to 255 individuals,
which would not allow for any robust econometric estimates. On the other hand, modeling the
location choices in the 25 randomly selected areas that were surveyed would come down to the
same sample size issue: there are not enough observations in each area to run a multinomial
logit. Thus, the econometric analysis presented below does not correct for this endogeneity
since, so far, we have not yet come across a good way of dealing with this issue 6.
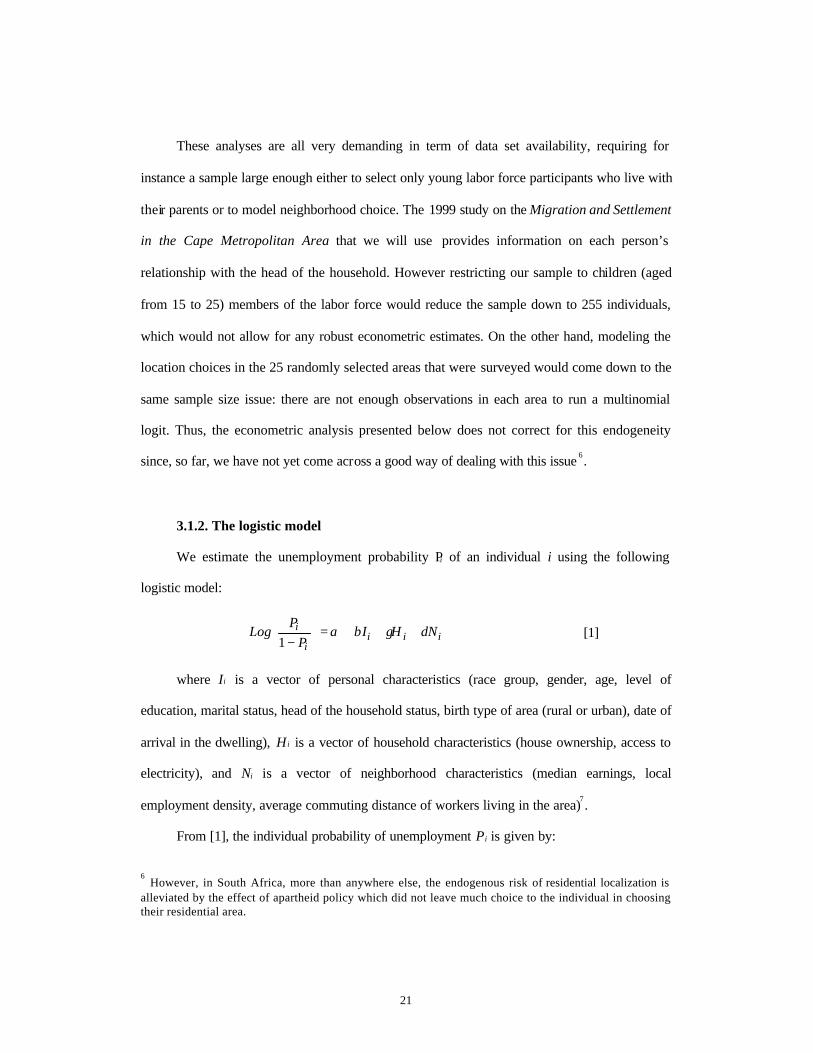
3.1.2. The logistic model
We estimate the unemployment probability Pi of an individual i using the following
logistic model:
iiii
i NHIP
PLog δγβα +++=
−1
[1]
where Ii is a vector of personal characteristics (race group, gender, age, level of
education, marital status, head of the household status, birth type of area (rural or urban), date of
arrival in the dwelling), H i is a vector of household characteristics (house ownership, access to
electricity), and Ni is a vector of neighborhood characteristics (median earnings, local
employment density, average commuting distance of workers living in the area)7.
From [1], the individual probability of unemployment Pi is given by:
6 However, in South Africa, more than anywhere else, the endogenous risk of residential localization is
alleviated by the effect of apartheid policy which did not leave much choice to the individual in choosing their residential area.
22
)(1
)(
iii
iiii NHIe
NHIeP
δγβα
δγβα
++++
+++= [2]
3.2. The dete rminants of unemployment
3.2.1. The data and sample
The data we use are derived from three sources. The 1999 study on the Migration and
Settlement in the Cape Metropolitan Area (carried out jointly by the University of Stellenbosch
and the Cape Metropolitan Council, see Cross and Bekker, 1999) provides much information on
more than 900 households living in 25 randomly selected areas (Enumerator Areas or EAs) in
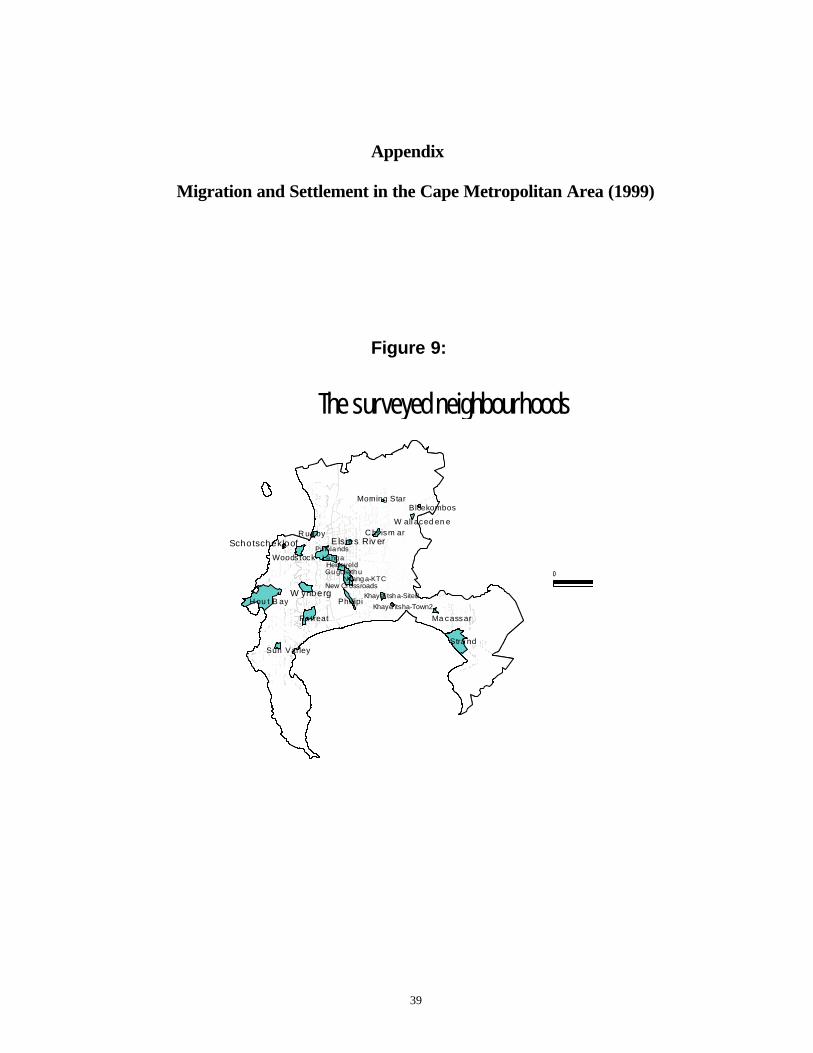
Cape Town (See Figure 9 in the Appendix)8. The data on the social and economic composition
of these EAs come from the 1996 Census. Finally, the Regional Service Council (RSC) Levy
database provides detailed information on job locations which will enable us to compute the
local job density within a defined geographical perimeter. The sample we use is limited to
economically active individuals, between the age of 15 and 65, for whom all attributes are
available, restricting the sample size to 1870 individual observations.
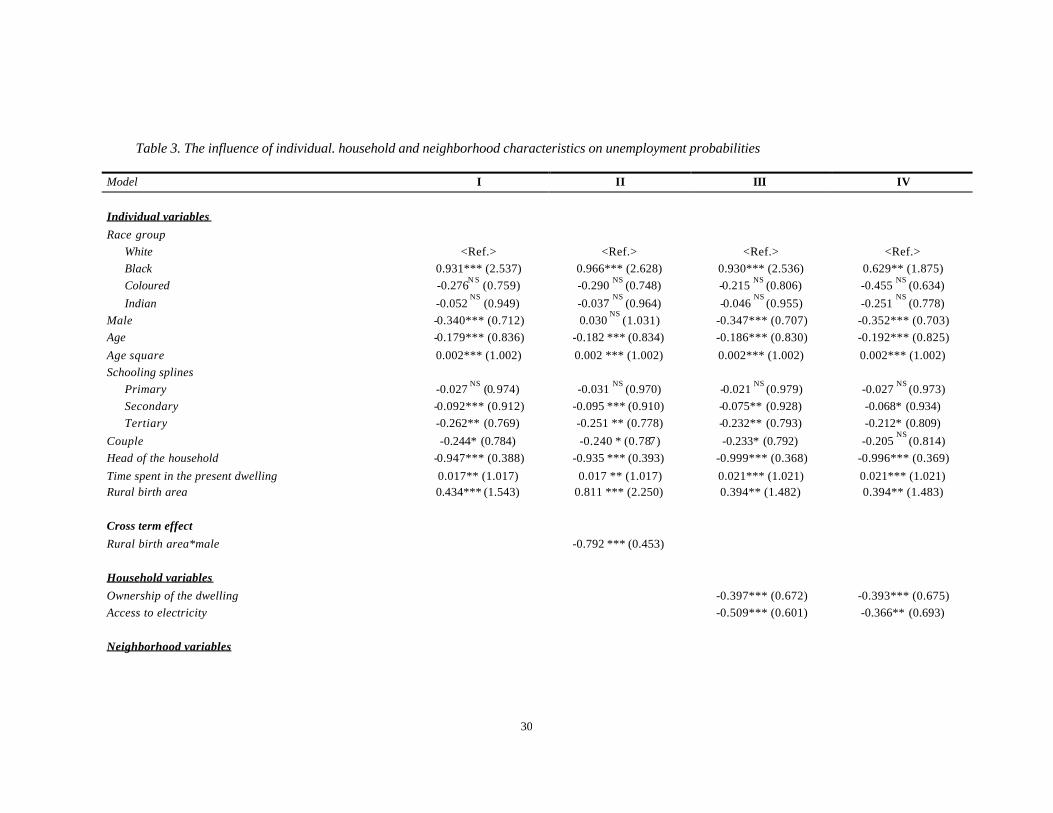
3.2.2. The results
Table 3 displays the results of our logistic regressions, taking into account the different
groups of variables. We present 4 models explaining the probability of unemployment in the
CMA. First, we consider individual characteristics as in a standard labor market analysis (model
I). Model II introduces some cross term effects. Then the household’s characteristics are added
7 Descriptive statistics on variables can be read in Table 1 at the end of the section. Table 2 presents the correlation matrix. 8 An Enumerator Area is the smallest statistical area in South Africa and is the direct subdivision of a suburb.
23
among the independent variables (model III), as well as the neighborhood features (model IV).
Considering household and neighborhood variables significantly increases the fit of the
regression (see the likelihood ratios). Variations in our results are small from one model to the
other so we focus on the model that incorporates the three groups of variables (model IV).
Model I presents the influence of individual variables on the unemployment probability.
First, given South African history, the results confirm some expected thoughts: Blacks have a
higher probability of being unemployed than Whites. Indeed, Rospabé (2002) and Kingdon and
Knight (2001) estimate the incidence of Black-White discrimination in the access to
employment in the whole country. The greater economic integration of Coloureds and Indians is
reflected in the insignificance of the coefficient for these 2 race groups. Being a female
increases the risk of being unemployed. To test how the employer’s hiring choice and worker’s
decision to enter the labor market are affected by the individual’s endowment of human capital,
3 splines of education are introduced9. The incidence of unemployment decreases dramatically
with education. However, primary education does not make individuals less likely to be
unemployed. But an additional year of secondary education decreases the probability of being
unemployed and this effect is reinforced when considering tertiary education. One should note
that these variables only reflect quantity of education and thus, can be poor indicators of the real
level of education especially for Black people who suffered low quality schooling during
Apartheid. Indeed Case and Yogo (1999) find that school quality signif icantly reduces Black
probability of employment. However, Kingdon and Knight (2001) estimate, on “available weak
evidence”, that racial differences in unemployment probability do not seem to be, even partly,
due to differences in educational quality. The influence of age on the probability of
unemployment is significantly negative, with diminishing returns. As Kingdon and Knight
9 These three splines cover primary, secondary and tertiary schooling respectively. The splines allow the effect on unemployment of each of the three schooling levels to vary, while implicitly assuming that the annual effects within each of the three schooling levels are identical. (See Moll (2000) and Rospabé (2002) for the use of similar variables).
24
(2001) note, younger people have a lower chance of getting a job because of their higher degree
of job mobility. According to them, there is also evidence that younger people are more likely to
enter unemployment voluntarily. Being born in a rural area decreases the probability of being
unemployed. This result is tricky to interpret as we do not know when the individual leaves her
birth place to come to an urban area. One could think that recent migrants are more hampered
than older ones in their job search as their labor market network is probably very low. The only
variable available to roughly approximate the time they spent in CMA is the date of arrival in
the dwelling. But crossing this date of arrival with the rural origin does not provide any
significant result. In a somewhat related perspective, two econometric studies (Van Der Berg et
al., 2002, and Posel and Casale, 2003) underline the importance of gender in internal labor
migration in South Africa. To test whether gender matters in the influence of rural origin on
unemployment, we introduce a cross term male / rural origin (model II). Results show that rural
origin disadvantages more females than males in finding a job. We also include among the
independent variables the time spent in the present dwelling to capture the social integration of
individual in the area. The longer time individuals spent in the dwelling, the more likely they are
to be unemployed. We do not have any straightforward interpretation for this finding. We might
think that these individuals have a low housing mobility which impedes them in finding a job.
However, one should also highlight the endogenous na ture of this variable as being unemployed
prevents one to move. Finally, it is found that being married or the head of the family limits the
probability of unemployment. On the supply side, it partly reflects the fact that greater family
responsibilities induce entry into the labor market and lower the reservation wages. On the
demand side, it may also indicate employer’s preferences for workers with higher probabilities
of staying with current employers. Kingdon and Knight (2001) choose to exclude these two
variables from their probit specification on account of their endogenous nature.
Turning to the household variables (model III), housing tenure decreases the probability
of unemployment. This finding is in contradiction with the usual literature dealing with this
25
issue: housing tenure has often been shown to impede labour mobility and migration (and thus
employment) because of higher associated transaction costs compared to renting (Cameron &
Muellbauer, 1998, McCormick, 1997). Results on South Africa displayed by Rospabé (2002)
and Kingdon and Knight (2001) are consistent with this literature when considering Blacks
only. For Whites, home ownership is associated with a lower probability of unemployment.
Indeed, this negative effect can be explained if home ownership is a proxy for household wealth
and is endogenous to unemployment (i.e. unemployment determines the chances of owning
one’s own home). In order to test for these racial differences, we introduce a variable crossing
the race group and ownership. It does not appear to be significant. Indeed, in our sample, 84%
of Blacks are owners of their dwelling. The household’s access to electricity has the same effect
than ownership: it decreases the risk of being unemployed. This variable is also likely to be an
indirect measure of household wealth10. Thus our findings means either that it is easier for an
individual in a wealthier household to find a job or that this variable might be endogenous.
Introducing neighborhood variables in the regression, model IV shows that median
income in the EA decreases the probability of unemployment. This result is consistent with
some elements of theory mentioned in Section 1: a socioeconomic environment of higher
quality facilitates human capital acquisition, provides better social network which may in turn
improve the employability of individuals. We complement model IV by also taking into account
spatial mismatch variables. The effect of local employment density 11 is not significant whereas
the average commuting distance of workers living in the EA plays a positive and significant role
on the unemployment probability. This means that controlling for all other variables, individuals
10
As underlined before, in the sample, 84% of blacks belong to a household who owns her dwelling, whereas 62% of them live in a household who has access to electricity. Taking into account the large number of shacks in Black informal areas, surveyed in the “migration study”, home-ownership, in the case of the Black population, does not seem to be a relevant measure of wealth. 11 We constructed several job density variables depending on the choice of the geographical perimeter: 5, 10 or 15 kilometers. None of these variables were significant. We retain in model IV, the job density within a 10 kilometers perimeter.
26
who reside the furthest away from the jobs are more likely to be unemployed. This upshot is in
accordance with the theory on physical disconnection to jobs 12.
12
In order to test whether this effect could be different between race groups, we ran separate regressions for each race group. In all cases, distance to job is not significant. The most obvious interpretation is that racial residential segregation makes distance to job very homogenous within each race group and thus erases any physical disconnection effect.
27
Table 1. The variables
Variable Description Data base Mean and standard deviation
Dependent variable
Unemployed = 1 if unemployed according to the official definition (excludes dis couraged job seekers)
Migration study 0.276 (0.447)
Individual variables Race group
White = 1 if White Migration study 0.100 (0.300) Black = 1 if Black Migration study 0.483 (0.500) Coloured = 1 if Coloured Migration study 0.028 (0.164) Indian = 1 if Indian Migration study 0.390 (0.488)
Male = 1 if male Migration study 0.542 (0.498) Age = age in years Migration study 34.49 (11.17) Age square = age square Migration study 1314 (857.1)
Schooling splines Primary
7> x7,
7x0 x,
≤≤
where x = years of schooling Migration study 6.479 (1.467)
Secondary
12>x 5,
12x<7 7,-x7x 0,
≤
≤
Migration study 2.618 (2.031)
Tertiary
12 x12,-x21x 0,
>≤
Migration study 0.306 (0.758)
Couple = 1 if married or living together Migration study 0.479 (0.500) Head of the household = 1 if is the head of the household Migration study 0.345 (0.476) Time spent in the present dwelling = number of years spent in the present dwelling Migration study 12.02 (10.86) Rural birth area = 1 if was born in a rural area Migration study 0.398 (0.490)
28
Household variables Ownership of the dwelling = 1 if the household owns the dwelling Migration study 0.750 (0.433)
Access to electricity = 1 if the household has access to electricity Migration study 0.804 (0.397) Neighborhood variables Median income of the EA = monthly income bracket 1996 Census 3.789 (1.189) Average commuting distance of workers living in the EA
= average distance (in kms) between the EA where the individual is living and the EA where he is working
Migration study 8.852 (4.068)
job density = number of jobs / active population (in a perimeter of 10 kms from the suburb where is located the EA)
RSC Levy 0.484 (0.374)
29
Table 2. The correlation matrix
Variable Unem White Black India Colou male Age Age sq
Prim Sec Tert couple hhead dwell rural Own elect Incom Dist Jobs